Table of Contents for
Reverse Engineering Code with IDA Pro
 Reverse Engineering Code with IDA Pro
Published by
Syngress, 2011
Reverse Engineering Code with IDA Pro
Published by
Syngress, 2011
- Copyright
- Visit us at www.syngress.com
- About IOActive
- Contributing Authors
- 1. Introduction
- 2. Assembly and Reverse Engineering Basics
- 3. Portable Executable and Executable and Linking Formats
- 4. Walkthroughs One and Two
- 5. Debugging
- 6. Anti-Reversing
- 7. Walkthrough Four
- 8. Advanced Walkthrough
- 9. IDA Scripting and Plug-ins
Sooner or later you will want to know absolutely everything about an executable file. You may want to know, for instance:
The exact memory address that it is calling
The exact region of memory that it is writing to
What region it’s reading from
Which registers it’s making use of
Debuggers will aid you in reverse-engineering a file for which you don’t have the source code, by disassembling the file in question. This comes in handy when you’re analyzing malware, as you almost never have access to the executable’s original source code. The goal of this section is not to coach you in depth on how to use these debuggers, but simply to show you that they are out there and available for you to use. Debuggers are very powerful tools that take a long time to learn to use to their fullest extent.
The “cream of the crop” in debuggers and the focus of this book is Interactive Disassembler Pro (IDA Pro), available from DataRescue. IDA Pro should be your first choice of debuggers for an enterprise environment. It isn’t really expensive, and is well worth the nominal outlay for the features it offers.
Tip
DataRescue offers a demo version from their Web site at www.datarescue.com/idabase/index.htm. This version can only work with a limited range of file and processor types, is time limited, runs only as a Windows GUI application, and so on.
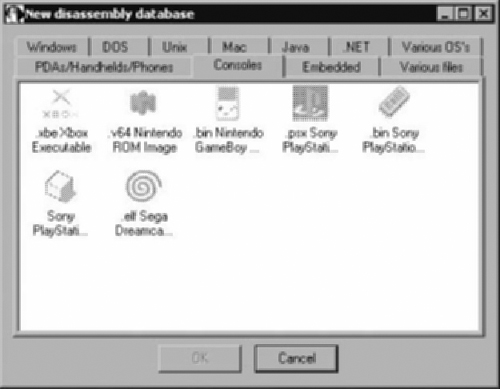
IDA Pro is much more than a simple debugger. It is a programmable, interactive disassembler and debugger. With IDA Pro you can reverse-engineer just about any type of executable or application file in existence. IDA Pro can handle files from console machines such as Xbox, Playstation, Nintendo, to Macintosh computer systems, to PDA platforms, Windows, UNIX, and a whole lot more. Figure 1.1 shows the initial load screen wizard when you first start IDA Pro. Notice all the file types and tabs that will help you select the proper analysis for the file type that you wish to disassemble.
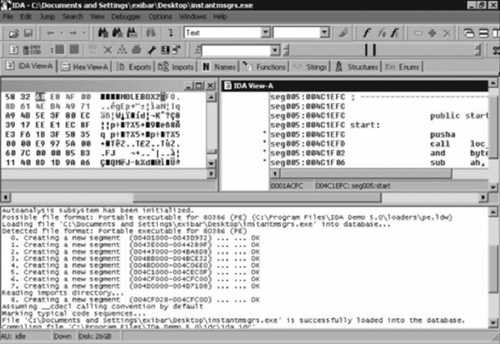
In Figure 1.2, IDA Pro has loaded and is disassembling a WootBot variant with file name instantmsgrs.exe. Part of what we can see from Figure 1.2 is that instanmsgrs.exe was packed using an executable packer called Molebox. You can also plainly see the memory calls that it’s making, and the Windows DLLs that are being called. This type of information can be invaluable when it comes to fighting off a virus or malware outbreak, especially if you need to make a custom cleaner in order to repair your systems.
IDA is one of the most popular debugging tools for Windows. First, IDA Pro is a disassembler, in that it shows the assembly code of a binary (an executable or a dynamic link library [DLL]). It also comes with advanced features that try to make understanding the assembly code as easy as possible. Second, it is also a debugger, in that it allows the user to step through the binary file to determine the actual instructions being executed, and the sequence in which the execution occurs. You’ll learn about all of these features throughout this book. IDA Pro is widely used for malware analysis and software vulnerability research, among other purposes. IDA Pro can be purchased at www.datarescue.com.