Table of Contents for
Graph Algorithms
 Graph Algorithms
Published by
O'Reilly Media, Inc., 2019
Graph Algorithms
Published by
O'Reilly Media, Inc., 2019
- Cover
- nav
- Graph Algorithms
- Graph Algorithms
- Preface
- 1. Introduction
- 2. Graph Theory and Concepts
- 3. Graph Platforms and Processing
- 4. Pathfinding and Graph Search Algorithms
- 5. Centrality Algorithms
- 6. Community Detection Algorithms
- 7. Graph Algorithms in Practice
- 8. Using Graph Algorithms to Enhance Machine Learning
- About the Authors
Chapter 1. Introduction
Today’s most pressing data challenges center around relationships, not just tabulating discrete data. Graph technologies and analytics provide powerful tools for connected data that are used in research, social initiatives, and business solutions such as:
- Modeling dynamic environments from financial markets to IT services.
- Forecasting the spread of epidemics as well as rippling delays and outages.
- Finding predictive features for machine learning to combat financial crimes.
- Uncovering patterns for personalized experiences and recommendations.
As data becomes increasingly interconnected and systems increasingly sophisticated, it’s essential to make use of the rich and evolving relationships within our data.
This chapter provides an introduction to graph analysis and graph algorithms. We’ll start with a brief refresher about the origin of graphs, before introducing graph algorithms and explaining the difference between graph databases and graph processing. We’ll explore the nature of modern data itself, and how the information contained in connections is far more sophisticated than basic statistical methods permit. The chapter will conclude with a look at use cases where graph algorithms can be employed.
What Are Graphs?
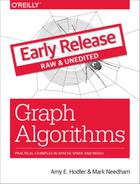
Graphs have a history dating back to 1736 when Leonhard Euler solved the “Seven Bridges of Königsberg” problem. The problem asked whether it was possible to visit all four areas of a city, connected by seven bridges, while only crossing each bridge once. It wasn’t.
With the insight that only the connections themselves were relevant, Euler set the groundwork for graph theory and its mathematics. Figure 1-1 depicts Euler’s progression with one of his original sketches, from the paper ‘Solutio problematis ad geometriam situs pertinentis‘.
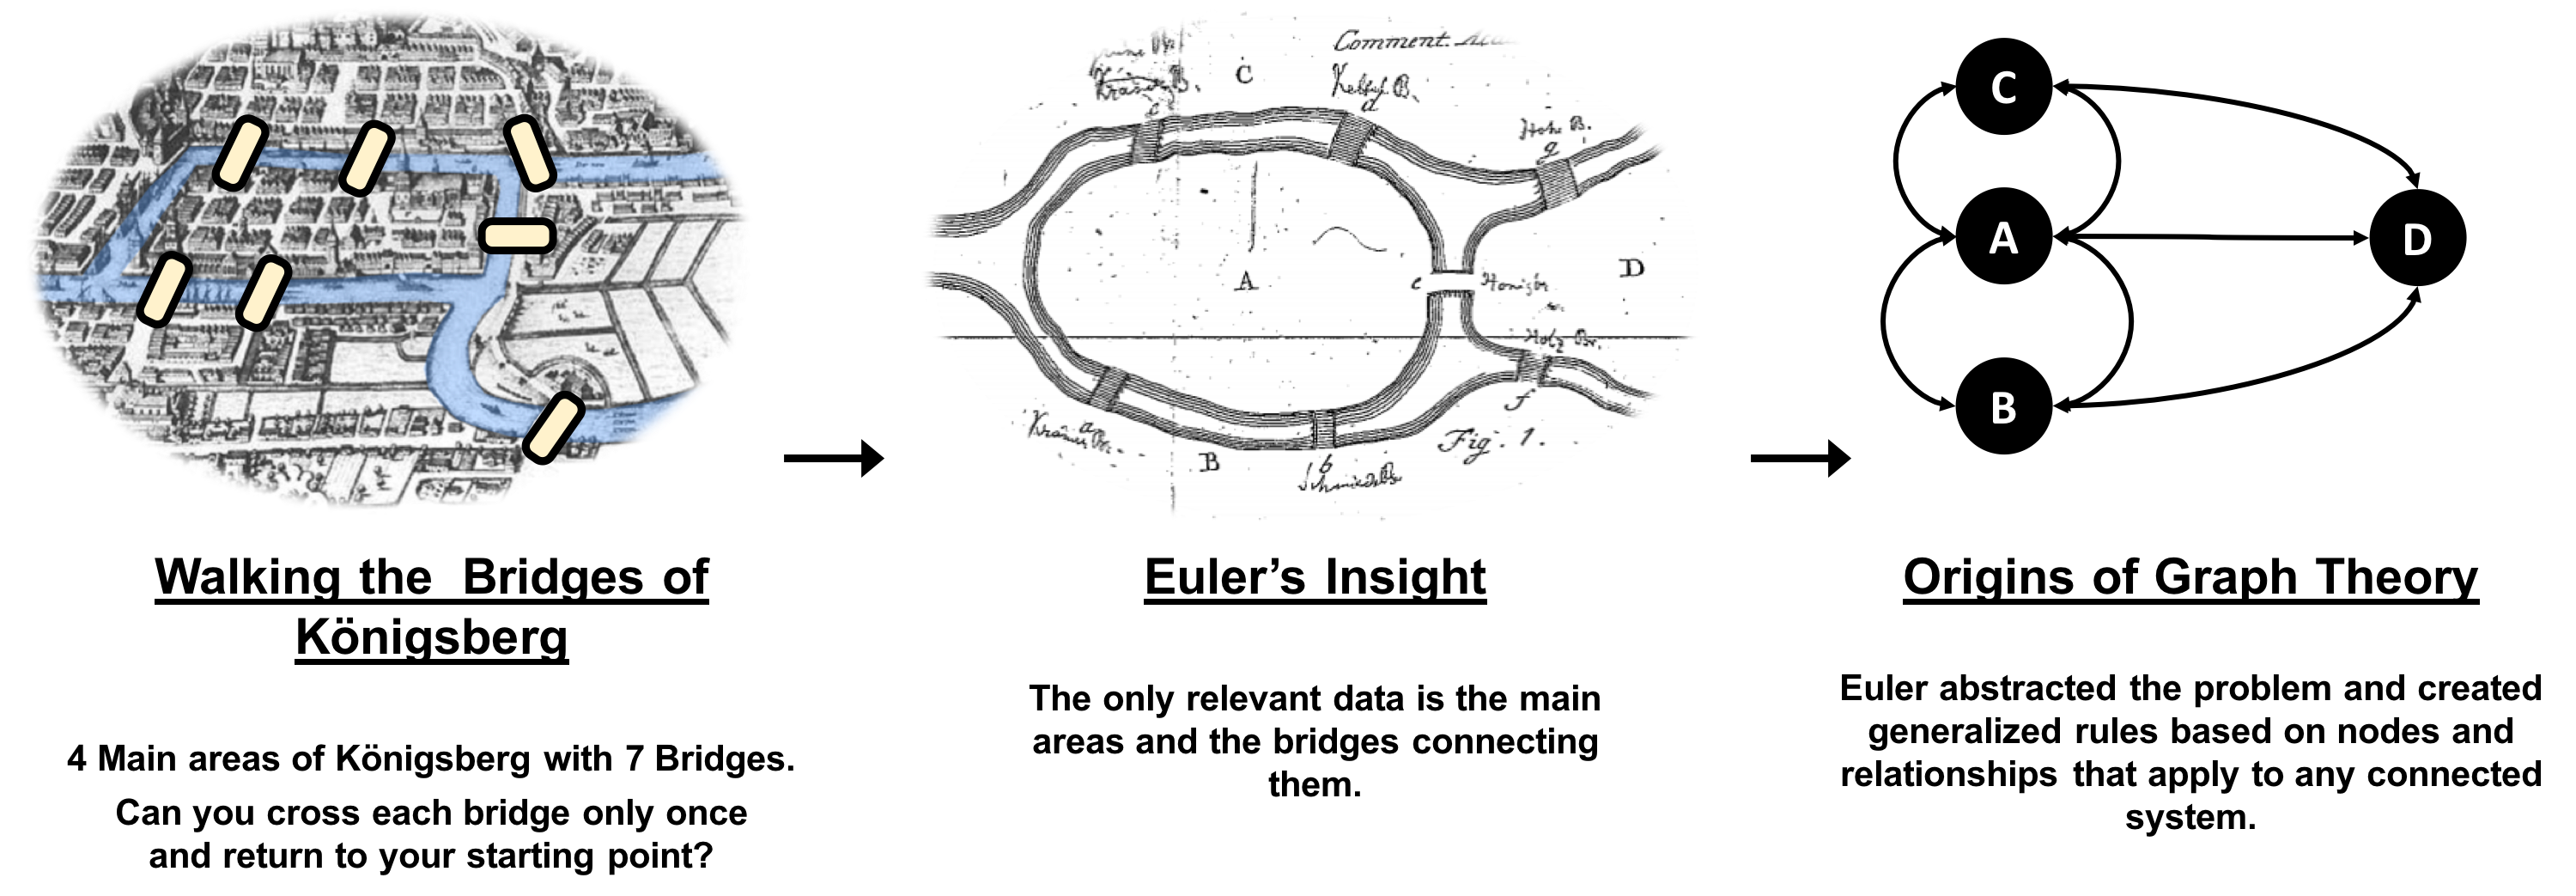
Figure 1-1. Origins of Graph Theory: The city of Königsberg included two large islands connected to each other and the two mainland portions of the city, by seven bridges. The puzzle was to create a walk through the city crossing each bridge once and only once.
While graphs came from mathematics, they are also a pragmatic and high fidelity way of modeling and analyzing data. The objects that make up a graph are called nodes or vertices and the links between them are known as relationships, links, or edges. We use the term node in this book and you can think of nodes as the nouns in sentences. We use the term relationships and think of those as verbs giving context to the nodes. To avoid any confusion, the graphs we talk about in this book have nothing to do with graphing an equation, graphics, or charts as in Figure 1-2.
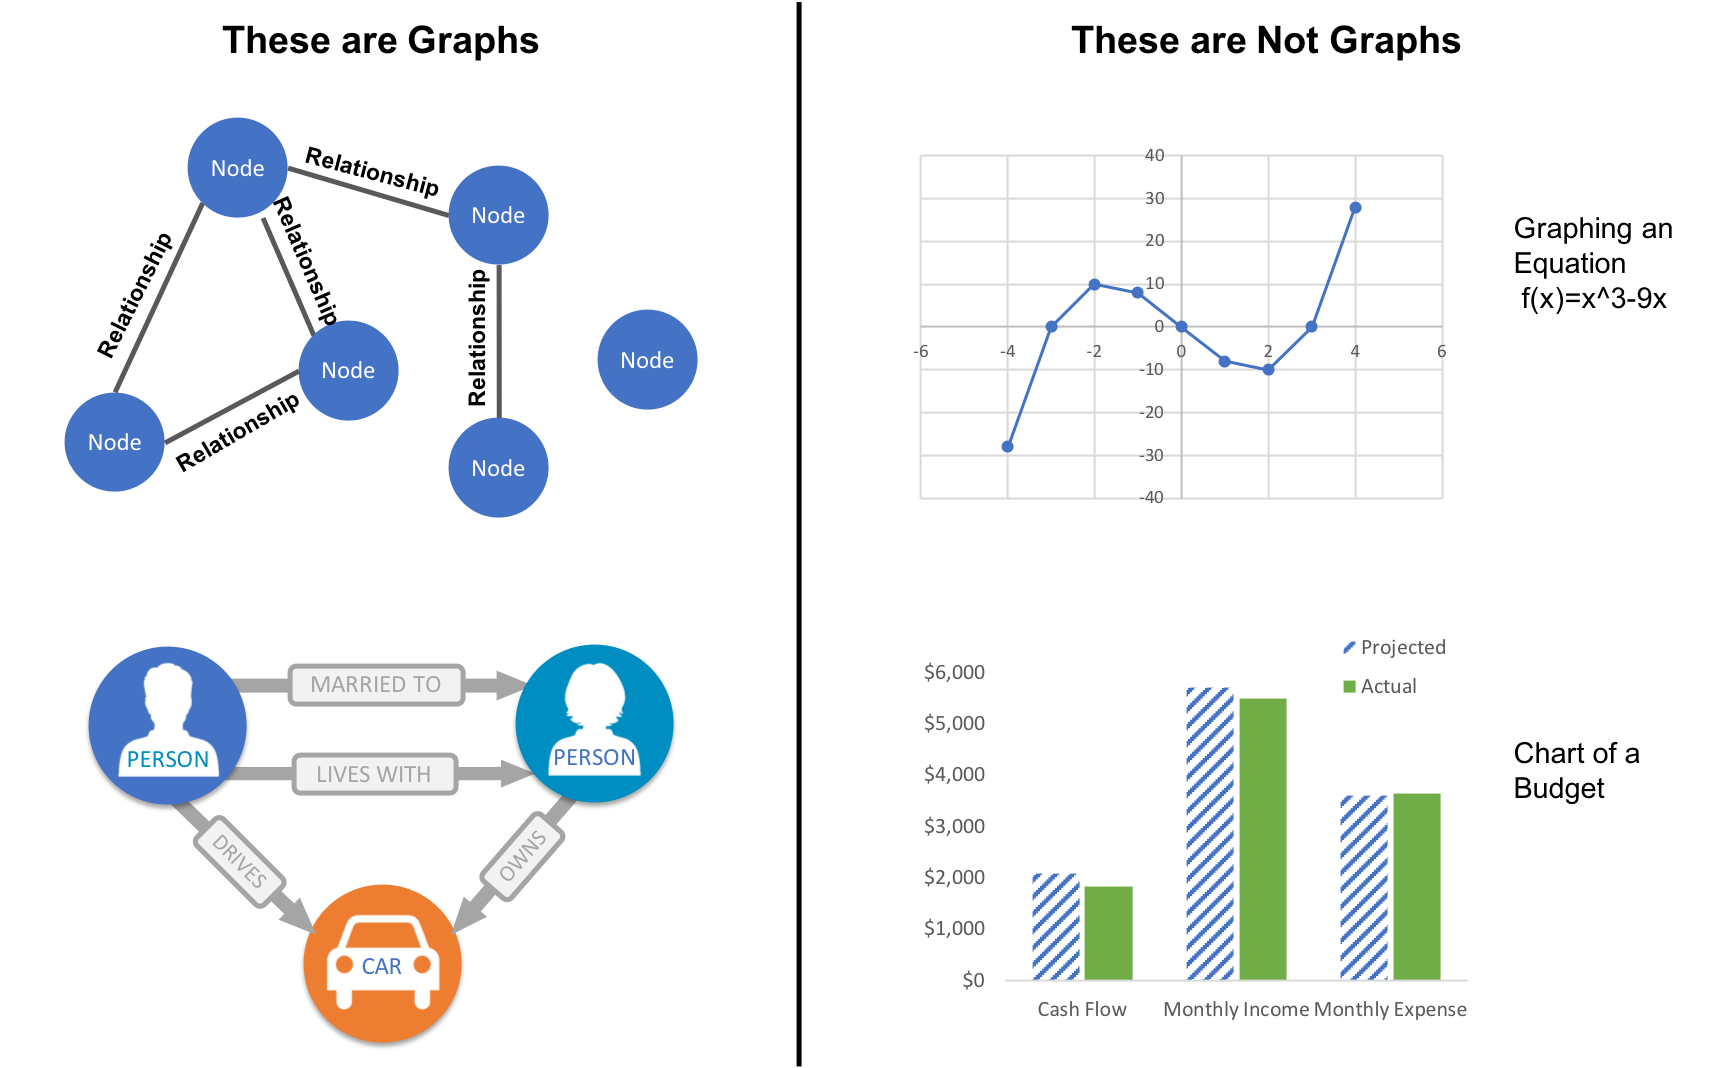
Figure 1-2. A graph is a representation of a network, often illustrated with circles (or dots) to represent entities which we call nodes, and lines to represent relationships.
Looking at the person graph in Figure 1-2, we can easily construct several sentences which describe it. For example, person A lives with person B who owns a car and person A drives a car that person B owns. This modeling approach is compelling because it maps easily to the real world and is very “whiteboard friendly.” This helps align data modeling and algorithmic analysis.
But modeling graphs is only half the story. We might also want to process them to reveal insight that isn’t immediately obvious. This is the domain of graph algorithms.
What Are Graph Analytics and Algorithms?
Graph algorithms are a subset of tools for graph analytics. Graph analytics is something we do–it’s the use of any graph-based approach to analyzing connected data. There are various methods we could use: We might query the graph data, use basic statistics, visually explore the graph, or incorporate graphs into our machine learning tasks. Graph algorithms provide one of the most potent approach to analyzing connected data because their mathematical calculations are specifically built to operate on relationships.
Graph algorithms describe steps to be taken to process a graph to discover its general qualities or specific quantities. Based on the mathematics of graph theory (also known as network science), graph algorithms use the relationships between nodes to infer the organization and dynamics of complex systems. Network scientists use these algorithms to uncover hidden information, test hypotheses, and make predictions about behavior.
For example, we might like to discover neighborhoods in the graph which correspond to congestion in a transport system. Or we might want to score particular nodes that could correspond to overload conditions in a power system. In fact graph algorithms have widespread potential: from preventing fraud and optimizing call routing to predicting the spread of the flu.
In 2010 U.S. air travel systems experienced two serious events involving multiple congested airports. Network scientists were able to use graph algorithms to confirm the events as part of systematic cascading delays and use this information for corrective advice. 1
Figure 1-3 illustrates the highly connected structure of air transportation clusters. Many transportation systems exhibit a concentrated distribution of links with clear hub-and-spoke patterns that influence delays.
Figure 1-3. Air transportation networks illustrate hub-and-spoke structures that evolve over multiple scales. These structures contribute to how travel flows. Image Source: Martin Grandjean
Graphs help to uncover how very small interactions and dynamics lead to global mutations. They tie together the micro- and macro-scales by representing exactly which things are interacting with each other within global structures. These associations are used to forecast behavior and determine missing links. Figure 1-4 shows a food web of grassland species interactions that used graph analysis to evaluate the hierarchical organization and species interactions and then predict missing relationships.2
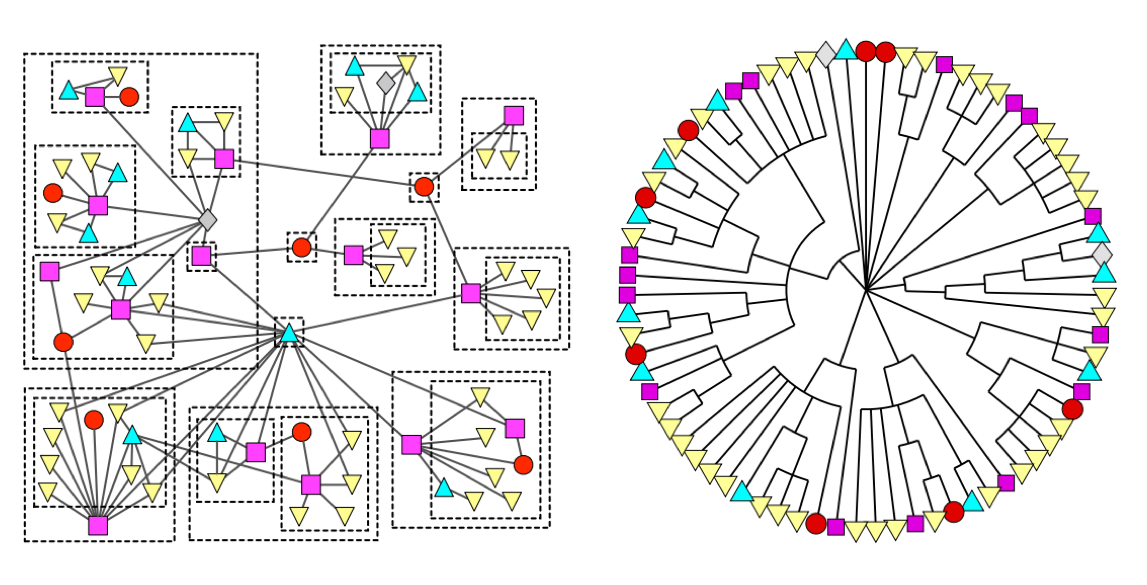
Figure 1-4. This foodweb of grassland species uses graphs to correlate small-scale interactions to larger structure formation. Image from the research paper, "Hierarchical structure and the prediction of missing links in networks"
Graph Databases versus Graph Processing
Graph algorithms provide a rich and varied set of analytical tools for distilling insight from connected data. Typically, graph algorithms are employed to find global patterns and structures. The input to the algorithm is the whole graph and the output can be an enriched graph or some aggregate values such as a score. We categorize such processing as Graph Global and it implies (iteratively) processing a graph’s structure. This approach sheds light on the overall nature of a network through its connections. Organizations tend to use graph algorithms to model systems and predict behavior based on how things disseminate, important components, group identification, and the overall robustness of a system.
Conversely, for most graph queries the input is specific parts of the graph (e.g. a starting node) and the work is usually focused in the surrounding subgraph. We term this Graph Local and it implies (declaratively) querying a graph’s structure (as our colleagues explain in O’Reilly’s Graph Databases book3). There may be some overlap in these definitions: sometimes we can use processing to answer a query and querying to perform processing, but simplistically speaking whole-graph operations are processed by algorithms and subgraph operations are queried in databases.
Traditionally transaction processing and analysis have been siloed. This was an unnatural split based on technology limitations. Our view is that graph analytics drives smarter transactions, which creates new data and opportunities for further analysis. More recently there has been a trend to integrate these silos for real-time decision making.
OLTP and OLAP
Online Transaction Processing (OLTP) operations are typically short activities like booking a ticket, crediting an account, booking a sale and so forth. OLTP implies voluminous low latency query processing and high data integrity. Although OLTP may involve only a smaller number of records per transaction, systems process many transactions concurrently.
Online Analytical Processing (OLAP) facilitates more complex queries and analysis over historical data. These analyses may include multiple data sources, formats, and types. Detecting trends, conducting “what-if” scenarios, making predictions, and uncovering structural patterns are typical OLAP use cases. Compared to OLTP, OLAP systems process fewer but longer-running transactions over many records. OLAP systems are biased towards faster reading without the expectation of transactional updates found in OLTP and batch-oriented operation is common.
Recently, however, the line between OLTP and OLAP started to blur. Modern data-intensive applications now combine real-time transactional operations with analytics. This merging of processing has been spurred by several advances in software such as more scalable transaction management, incremental stream processing, and in lower-cost, large-memory hardware.
Bringing together analytics and transactions enables continual analysis as a natural part of regular operations. As data is gathered–from point-of-sale (POS) machines, from manufacturing systems, or from IoT devices–analytics now supports the ability to make real-time recommendations and decisions while processing. This trend was observed several years ago, and terms to describe this merging include “Transalytics” and Hybrid Transactional and Analytical Processing (HTAP). Figure 1-5 illustrates how read-only replicas can be used to bring together these different types of processing.
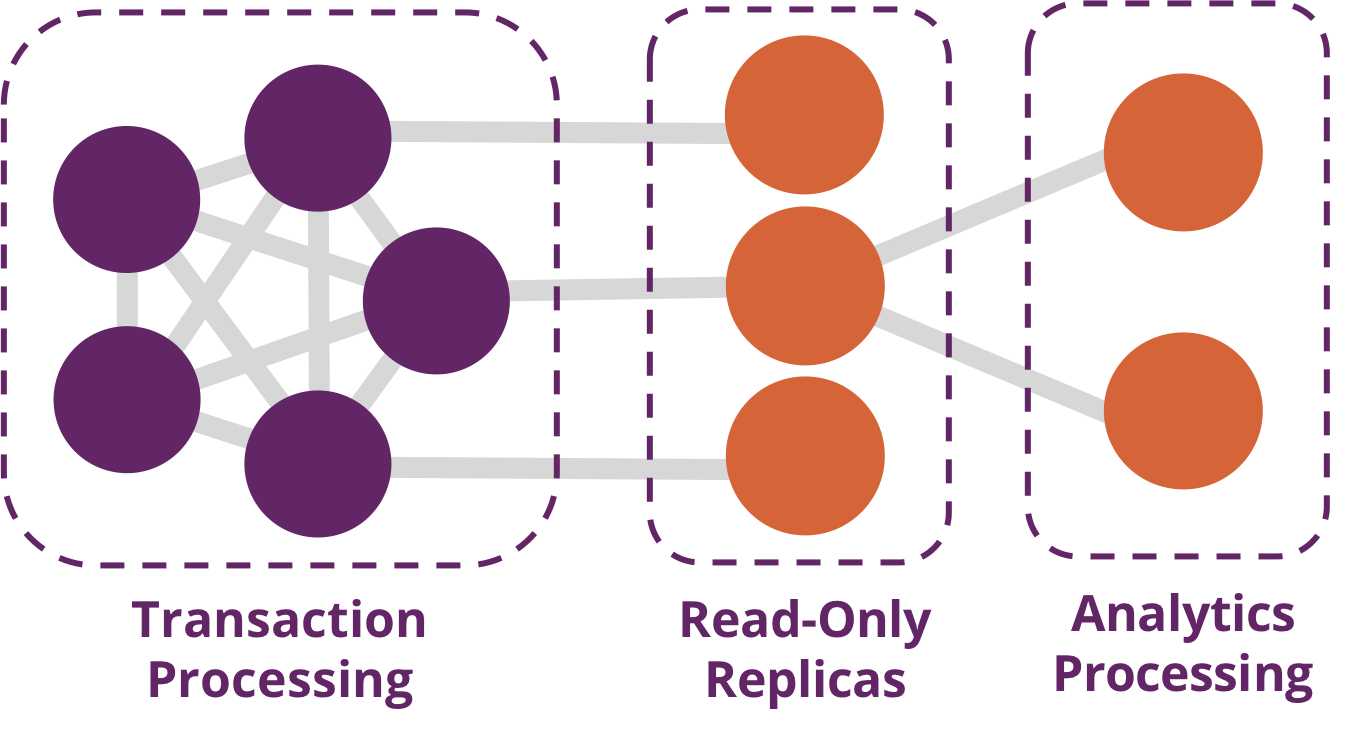
Figure 1-5. A hybrid platform supports the low latency query processing and high data integrity required for transactions while integrating complex analytics over large amounts of data.
“[HTAP] could potentially redefine the way some business processes are executed, as real-time advanced analytics (for example, planning, forecasting and what-if analysis) becomes an integral part of the process itself, rather than a separate activity performed after the fact. This would enable new forms of real-time business-driven decision-making process. Ultimately, HTAP will become a key enabling architecture for intelligent business operations.” –Gartner
OLTP and OLAP become more integrated and support functionality previously offered in only one silo, it’s no longer necessary to use different data products or systems for these workloads–we can simplify our architecture by using the same platform for both. This means our analytical queries can take advantage of real-time data and we can streamline the iterative process of analysis.
Why should I care about graph algorithms?
Graph algorithms are used to help make sense of connected data. We see relationships within real-world systems from protein interactions to social networks, from communication systems to power grids, and from retail experiences to Mars mission planning. Understanding networks and the connections within them offers incredible potential for insight and innovation.
Graph algorithms are uniquely suited to understanding structures and revealing patterns in datasets that are highly connected. Nowhere is the connectivity and interactivity so apparent than in big data. The amount of information that has been brought together, commingled, and dynamically updated is impressive. This is where graph algorithms can help make sense of our volumes of data: for both sophisticated analytics of the graph and to improve artificial intelligence by fuelling our models with structural context.
Scientists that study the growth of networks have noted that connectivity increases over time, but not uniformly. Preferential attachment is one theory on how the dynamics of growth impact structure. This idea, illustrated in Figure 1-6, describes the tendency of a node to link to other nodes that already have a lot of connections.
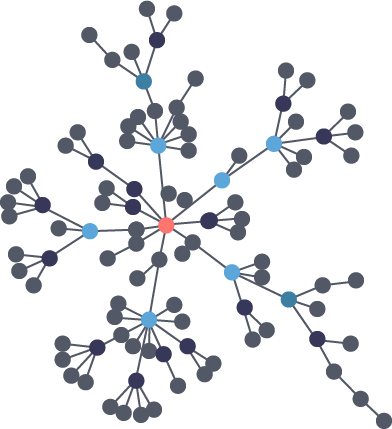
Figure 1-6. Preferential attachment is the phenomenon where the more connected a node is, the more likely it is to receive new links. This leads to uneven concentrations and groups.
Regardless of the underlying causes, many researchers believe that how a network develops is inseparable from their resulting shapes and hierarchies. Highly dense groups and lumpy data networks tend to develop, in effect growing both data size and its complexity. Trying to “average out” the network, in general, won’t work well for investigating relationships. We see this clustering of relationships in most real-world networks today from the internet to social networks such as a gaming community shown in Figure 1-7.
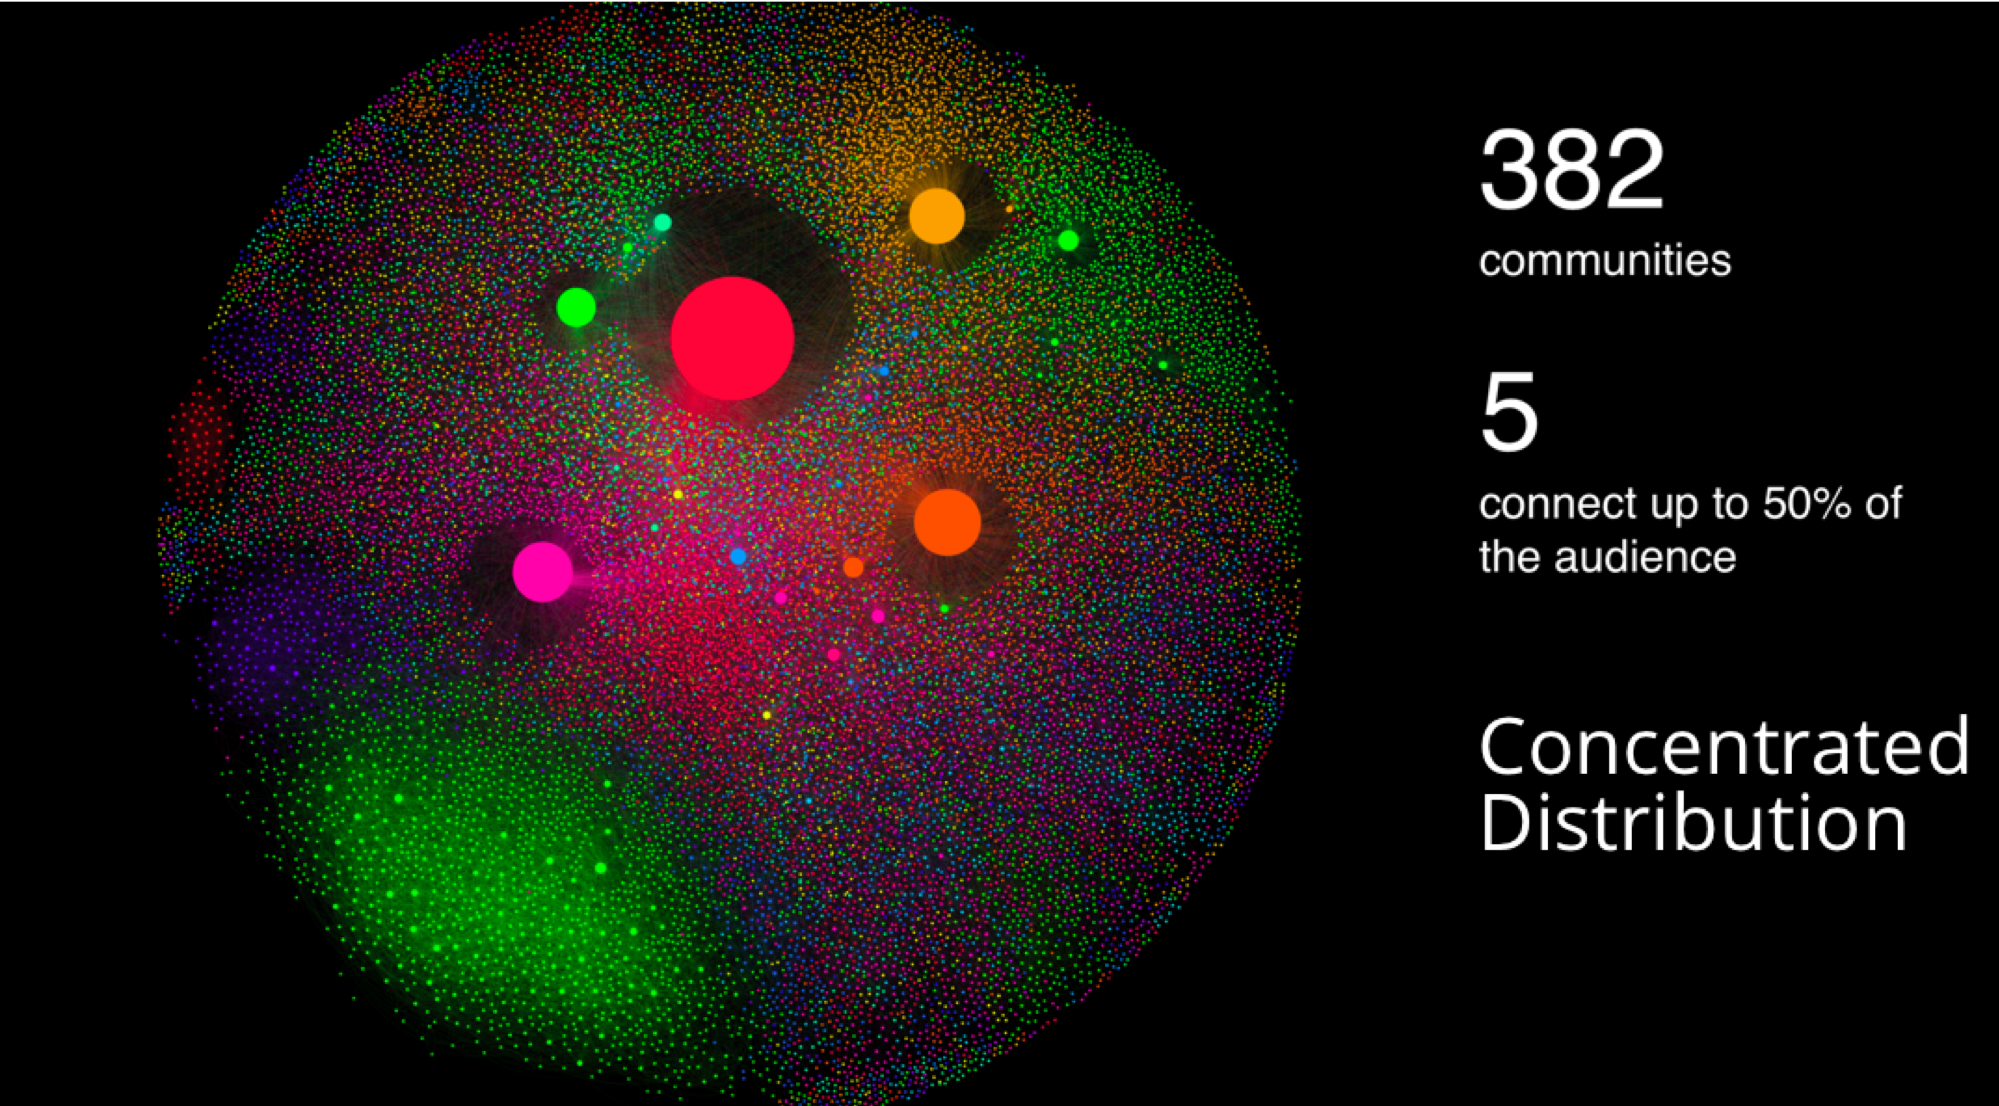
Figure 1-7. This gaming community analysis by Pulsar shows a concentration of connections around just 5 of 382 communities. These groupings are typical in many real-world networks.
This is significantly different than what an average distribution model would predict, where most nodes would have the same number of connections. For instance, if the World Wide Web had an average distribution of connections, all pages would have about the same number of links coming in and going out. Average distribution models assert that most nodes are equally connected but many types of graphs and many real networks exhibit concentrations. The Web, in common with graphs like travel and social networks, has a power-law distribution with few nodes being highly connected and most nodes being modestly connected.
We can readily see in Figure 1-8; how using an average of characteristics for data that is uneven, would lead to incorrect results.
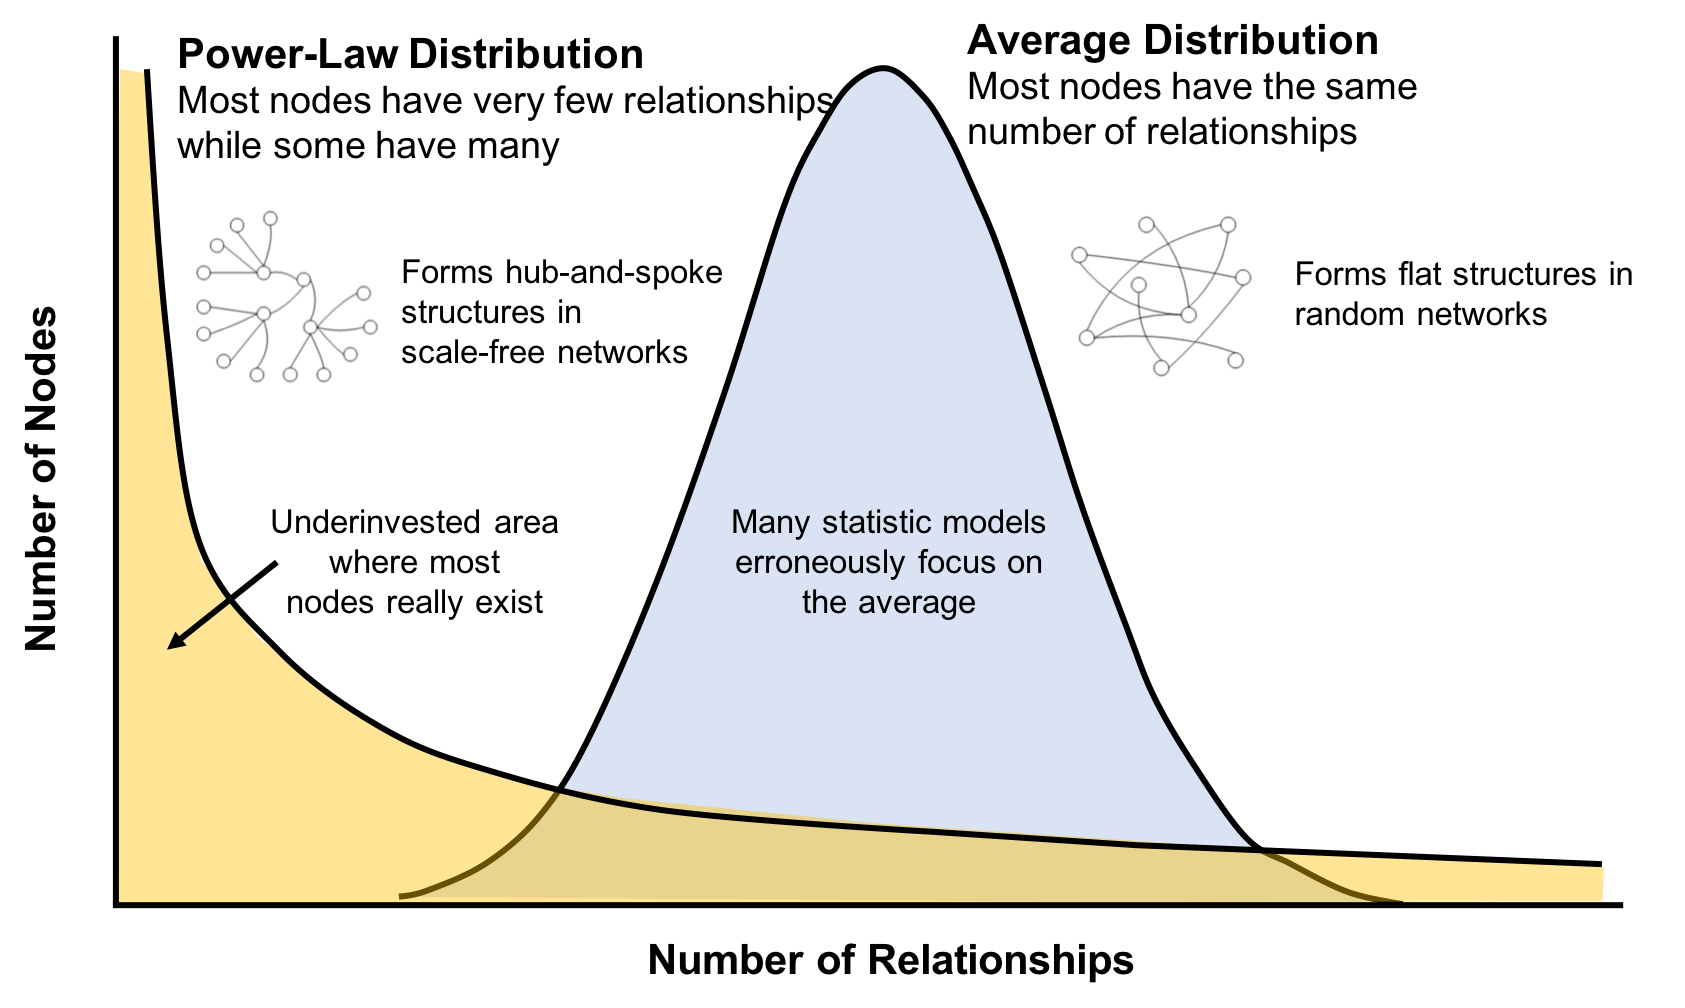
Figure 1-8. Real-world networks have uneven distributions of nodes and relationships represented in the extreme by a power-law distribution. An average distribution assumes most nodes have the same number of relationships and results in a random network.
This is important to recognize as most graph data does not adhere to an average distribution. Network scientists use graph analytics to search for and interpret structures and relationship distributions in real-world data.
There is no network in nature that we know of that would be described by the random network model. —Albert-László Barabási, director, Center for Complex Network Research Northeastern University, and author of numerous network science books
The challenge is that densely yet unevenly connected data is troublesome to analyze with traditional analytical tools. There might be a structure there but it’s hard to find. So, it’s tempting to take an averages approach to messy data but doing so will conceal patterns and ensure our results are not representing any real groups. For instance, if you average the demographic information of all your customers and offer an experience based solely on averages, you’d be guaranteed to miss most communities: communities tend to cluster around related factors like age and occupation or marital status and location.
Furthermore, dynamic behavior, particularly around sudden events and bursts, can’t be seen with a snapshot. To illustrate, if you imagine a social group with increasing relationships, you’d also expect increased communications. This could lead to a tipping point of coordination and a subsequent coalition or, alternatively, subgroup formation and polarization in, for example, elections. Sophisticated methods are required to forecast a network’s evolution over time but we can infer behavior if we understand the structures and interactions within our data. Graph analytics are used to predict group resiliency because of the focus on relationships.
Graph Analytics Use Cases
At the most abstract level, graph analytics is applied to forecast behavior and prescribe action for dynamic groups. Doing this requires understanding the relationships and structure within that group. Graph algorithms accomplish this by examining the overall nature of networks through their connections. With this approach, you can understand the topology of connected systems and model their processes.
There are three general buckets of question that indicate graph analytics and algorithms are warranted, as shown in Figure 1-9.
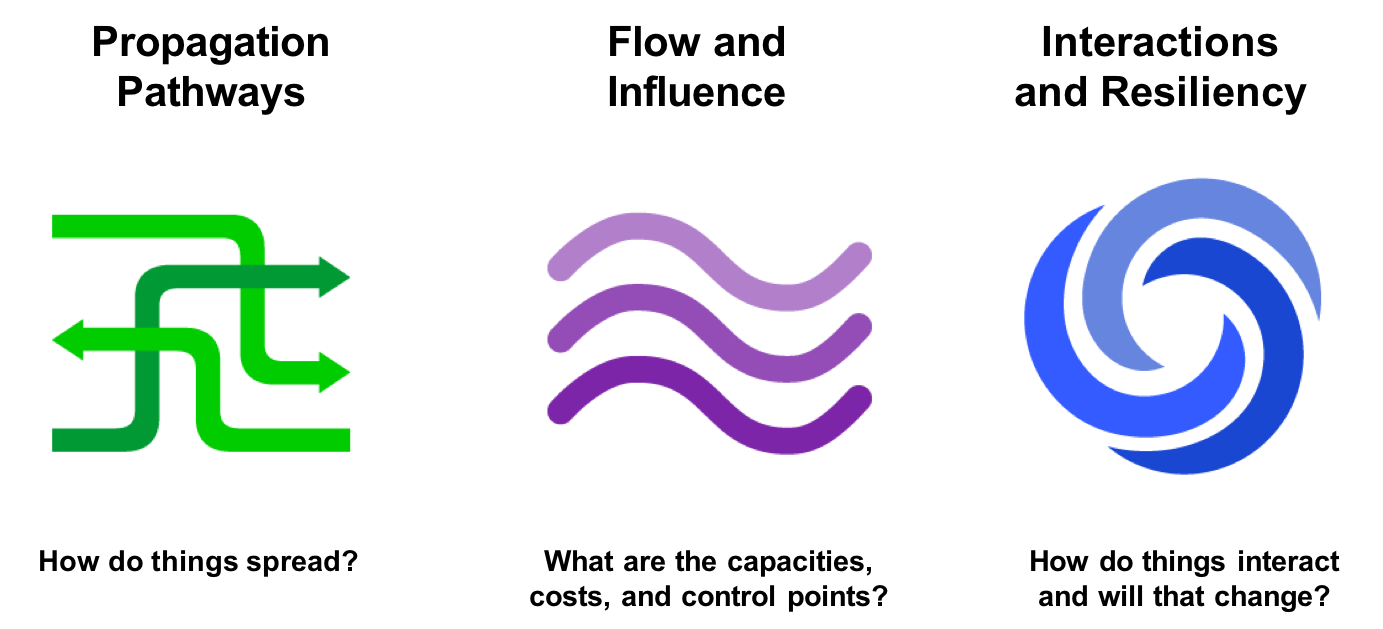
Figure 1-9. Types of Questions Graph Analytics Answer
Below are a few types of challenges where graph algorithms are employed. Are your challenges similar?
- Investigate the route of a disease or a cascading transport failure
- Uncover the most vulnerable, or damaging, components in a network attack
- Identify the least cost or fastest way to route information or resources
- Predict missing links in your data
- Locate direct and indirect influence in a complex system
- Discover unseen hierarchies and dependencies
- Forecast wether groups will merge or break apart
- Find bottlenecks or who has the power to deny/provide more resources
- Reveal communities based on behavior for personalized recommendations
- Reduce false positives in fraud and anomaly detection
Conclusion
In this chapter, we’ve looked at how data today is extremely connected. Analysis of group dynamics and relationships has robust scientific practices, yet those tools are not always commonplace in businesses. As we evaluate advanced analytics techniques, we should consider the nature of our data and whether we need to understand community attributes or predict complex behavior. If our data represents a network, we should avoid the temptation to reduce factors to an average. Instead, we should use tools that match our data and the insights we’re seeking.
In the next chapter, we’ll cover graph concepts and terminology.