Table of Contents for
C in a Nutshell, 2nd Edition
 C in a Nutshell, 2nd Edition
Published by
O'Reilly Media, Inc., 2015
C in a Nutshell, 2nd Edition
Published by
O'Reilly Media, Inc., 2015
- Cover
- nav
- C
- C in a Nutshell, Second Edition
- Preface
- I. Language
- 1. Language Basics
- 2. Types
- 3. Literals
- 4. Type Conversions
- 5. Expressions and Operators
- 6. Statements
- 7. Functions
- 8. Arrays
- 9. Pointers
- 10. Structures, Unions, and Bit-Fields
- 11. Declarations
- 12. Dynamic Memory Management
- 13. Input and Output
- 14. Multithreading
- 15. Preprocessing Directives
- II. Standard Library
- 16. The Standard Headers
- 17. Functions at a Glance
- 18. Standard Library Functions
- III. Basic Tools
- 19. Compiling with GCC
- 20. Using make to Build C Programs
- 21. Debugging C Programs with GDB
- 22. Using an IDE with C
- Index
- About the Authors
- Colophon
Chapter 22. Using an IDE with C
An integrated development environment, or IDE, is a program that provides convenient interaction with the tools used to create programs in C under a unified graphical interface. The integration of the various software tools used in program development can increase your productivity dramatically compared to separate command-line tools. The minimum equipment of an IDE includes an editor, a compiler, a linker, and a debugger. Other tools are often included as well, or can be added, such as a design tool for GUI elements or a version-control system to support collaboration with other developers.
IDEs are available for all common programming languages and platforms. Many IDEs support multiple languages and platforms. For a thorough overview of the characteristics of different IDEs, sorted by programming language, see the Wikipedia page on “Comparison of integrated development environments”.
IDEs for C
One of the first IDEs for C was Turbo C, published by the Borland company in 1987. Although it was a text-based program for a single-tasking operating system, it was a complete IDE capable of producing and debugging PC applications. On Windows systems, the dominant IDE today is Microsoft’s Visual Studio. Other important IDEs for the Windows platform include Open Watcom and Pelles C, both of which include a resource editor for creating graphical user interfaces. The Watcom C/C++ compiler generates native DOS and Windows applications. Pelles C is remarkable in that it contains a C compiler for Windows applications that supports all features of the C11 standard (since late 2012).
Software for OS X is often developed using Apple’s IDE Xcode. For Unix-like systems, including Linux, FreeBSD, Solaris, and OS X, a number of free IDEs are available, such as Kdevelop, for example. Unlike the other IDEs mentioned up to now, Kdevelop does not contain its own compiler but uses an external C compiler such as GCC or Clang. Other free IDEs that function as frontends for external compilers include Eclipse and Code::Blocks, both of which are also available for Windows and support the GNU Compiler Collection (GCC).
Modern IDEs for C and C++ include a source code editor that not only highlights the various elements of C syntax but also provides intelligent text completion and other convenient features, such as the ability to display a function’s call hierarchy; that is, a structured list of the functions that call it and the functions it calls.
For each software product you want to develop, you create a project in the IDE. A project incorporates all the information necessary to build the program, such as the names of the source files and the compiler options. The IDE uses an external or internal make tool, and is able to export an appropriate makefile to build the C program from the command line (see Chapter 20)—or, conversely, to import a makefile to create a corresponding IDE project.
The sections that follow introduce the workflow of C software development with an IDE using Eclipse CDT as a typical example.
The Eclipse IDE for C/C++
Eclipse is descended from the IBM product Visual Age for Java. In 2004, the Eclipse Foundation was created to take over the development of that IDE as free software under the name Eclipse. Since 2006, the foundation has released a new version in the middle of each year with an individual version nickname. Version 4.4 of 2014 is called Luna; version 4.5 of 2015 is named Mars. Eclipse is free, open source software published under the terms of the Eclipse Public License (EPL).
Eclipse uses plug-ins to provide the various capabilities of the IDE. Because a majority of Eclipse users are still Java developers, the most commonly used Eclipse plug-in is JDT, which provides the Java development tools. There are also plug-ins for many other languages, including Fortran, Perl, PHP, and Python, to name just a few. In particular, C development is supported by the Eclipse plug-in CDT (C/C++ Development Tooling), first released in 2006 and continuously developed since then (see http://www.eclipse.org/cdt).
Installing Eclipse CDT
Eclipse itself is a Java program, and requires the Java Runtime Environment (JRE) to run. If the JRE is not yet installed on your system, you can download it from http://java.com. (You may also choose to use another IDE that does not require Java, such as Code::Blocks.) If you intend to use Eclipse to produce Java programs (or if you want to use Eclipse on OS X), you need to install the Java Development Kit (JDK). Both the JRE and the JDK are available at http://www.oracle.com/technetwork/java/javase/downloads.
To develop C programs, you will also need a C compiler. Eclipse CDT is most often used with the GNU Compiler Collection (GCC). If GCC is not yet installed on your system, see “Obtaining and Installing GCC”.
On Windows, Eclipse can use either the Cygwin or the MinGW version of GCC. To ensure that Eclipse on Windows finds the directory with your MinGW (or MinGW64) installation, set the environment variable MINGW_HOME to the directory path. You can set environment variables in the System applet in the Control Panel under “Advanced System Settings”. You may also have to add the directory%MINGW_HOME%\bin to the PATH variable.
Once you have installed Java and the “GCC toolchain,” download and install the “Eclipse IDE for C/C++ Developers” from http://www.eclipse.org/downloads/. This package contains the CDT plug-in. If you also want to use Eclipse for Java development, install the “Eclipse IDE for Java Developers” first, and then start Eclipse and add the CDT plug-in by clicking “Install New Software” in the Help menu. Select “C/C++ Development Tools” in the list of available plug-ins.
Running Eclipse
The first time you start Eclipse, you will be prompted to choose a workspace, which is a directory in which you want Eclipse to save your work. Click OK to use the default directory. If you want to change to a different directory later, you can go to File -> Switch workspace. (This does not move any files from your previous workspace.) After you have chosen a workspace, Eclipse displays a “welcome” window with links to helpful documents about the program. You can go to Help -> Welcome at any time to display this window again. When you close the welcome window, the main Eclipse window shows your workbench.
Perspectives and Views
The workbench window shows your work in one of several possible perspectives. A perspective is a window layout that groups certain commands and views that are appropriate for a given type of project or workflow phase. A view is a pane in the workbench window that displays a given kind of information in an appropriate format. When several views share the same section of the window layout, they are managed by tabs.
The concept of perspectives allows the various plug-ins to provide the appropriate commands and views depending on your current task. You can have several workbench windows open at the same time. (On OS X, you need to add an Eclipse plug-in called the OS X Eclipse Launcher for this capability.)
A small toolbar at the top right in the workbench window allows you to open or close a perspective, or to switch between the currently open perspectives. When you click the Open Perspective icon (see Figure 22-1), Eclipse displays a list of the available perspectives for you to choose from. If the “C/C++” perspective is not already active, open or switch to it.
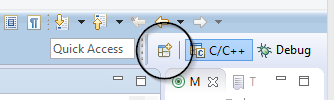
Figure 22-1. The Open Perspective icon
Developing a C Program with Eclipse
For each C program, you must start by creating a project in which Eclipse will save all the information necessary to build the program.
Creating a New C Project
To create a new C project, open the C/C++ perspective and select File -> New -> C Project. In the dialog that appears, enter a name for the project (such as First for your first trial project). Under Project Types, choose the type Executable -> Empty project (or Hello World ANSI C project) and a compiler toolchain, such as Cygwin GCC. Eclipse automatically detects the C/C++ toolchains installed on your system. If you have installed both Cygwin and MinGW on Windows, for example, both are shown for you to choose from. Click on the Next button to open the Select Configuration dialog. Keep the default options to build Release and Debug versions of your program. Click Finish, and your new project will appear in the Project Explorer pane on the left.
To add a new C source file to your project, right-click on the project in the project explorer and select New -> Source File in the context menu. If you prefer to create a new subdirectory first, select New -> Source Folder in the context menu. There are also icons for these options in the default toolbar.
Editing
When you create a new source file, it is automatically opened in the editor pane. To edit a source file that is not yet open, double-click on the filename in the Project Explorer. A useful feature of the IDE’s editor is code completion, which you can activate by pressing Ctrl+Space. Eclipse then displays a list of suggested completions of the word or line you are typing. For example, when you type #include, it lists the most likely header filenames to insert in the line, as shown in Figure 22-2.
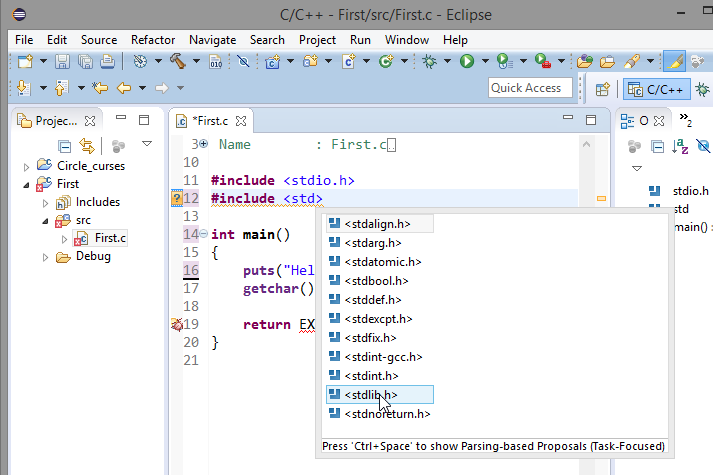
Figure 22-2. Code completion
When the code completion list shows a function name as a suggested completion, it also displays the prototypes and brief descriptions of the possible functions.
Compiling and Running a Program
Right-click on the project and select Build Project in the context menu to compile and link the program. Or you can select Build Project in the Project menu to compile and link the program currently selected in the Project Explorer. (Note that the source file currently displayed in the editor may belong to a different project from that selected in the Project Explorer view!) The command Build All, which you can also invoke by pressing Ctrl+B, performs the Build command for every project open in the Project Explorer, except those that are up to date (i.e., those that have not been edited since they were last built).
If the attempt to build the program produces compiler warnings or error messages, they are summarized in the Problems tab, and the full compiler output is displayed in the Console tab at the bottom of the window. Compiler warnings are highlighted in yellow, errors in red. Furthermore, the Console and Problems tabs are helpfully integrated with the source code view in the editor: the line referred to in each warning or error is flagged in the left margin of the editor with the appropriate color. And you can simply double-click on a highlighted warning in the Console view to jump to the faulty source code line in the editor, where you can correct it. When you can build the program without producing any errors, you can run it.
To run a program, simply select the Run command in the Run menu, or click the Run icon in the toolbar (see Figure 22-3). If you have edited any of the source files or settings since the last build, Eclipse builds the program anew before running it. The program’s output appears in the console view at the bottom of the window. If the program is waiting for keyboard input, click in the console to put the focus there before typing your input.
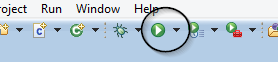
Figure 22-3. The Run icon
Some programs require other information to run, such as command-line arguments or certain environment variable values. You can set such information in the Run Configuration dialog. To open it, select the Run Configurations command in the Run menu, or in the drop-down list attached to the Run icon in the toolbar. Figure 22-4 illustrates a run configuration with the command-line arguments for the sample program in Example 7-6 from Chapter 7.
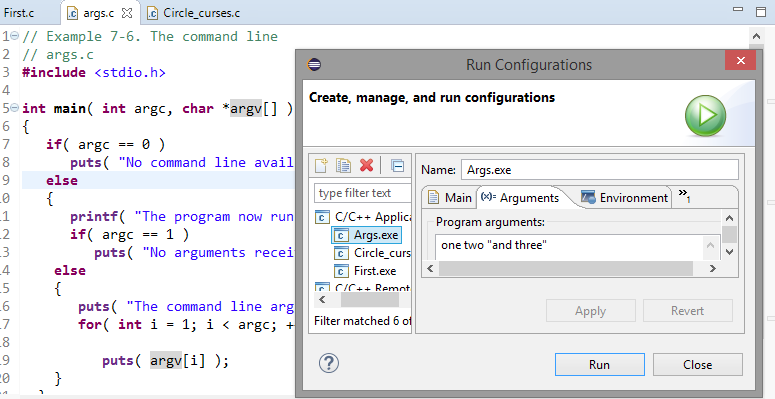
Figure 22-4. Run configuration
The Environment tab in the Run Configurations dialog allows you to define and modify environment variables for the environment in which Eclipse runs your program. This may be necessary for programs that read an environment variable to find certain files, for example. If you are using Cygwin GCC on Windows, and have not added the Cygwin bin directory to the Windows PATH variable, you can simply add it to the Path variable in the Run Configuration. Then your programs will be able to load the runtime library cygwin1.dll. Changes you make to these settings only affect the current project.
Project Properties
All the information necessary to build a C program is stored in a project. In particular, this includes the toolchain to build the program and all the compiler and linker options. You can verify and adjust these settings in the Properties dialog. To open the dialog, right-click on the project and select the command Properties in the context menu. (Or select Properties in the Project menu, or press Alt+Enter.)
To change the command-line options of the compiler or linker, click on C/C++ Build -> Settings in the left pane of the Properties dialog.
-
Then click on the Tool Settings tab and select “… Compiler” in the list of tools. The text fields at the right show the command
gccand all the command-line options with whichgccis invoked to build your program. The items in the list under “… Compiler” are specific categories of compiler options. To set the option for C11, for example, select Dialect in the list, and in the drop-down list “Language standard,” choose the option “ISO C11 (-std=c11).” -
If you expand the node “… Linker” in the list of tools on the Tool Settings page, and then click on Libraries, you can specify the names of libraries to link with your program (such as
ncursesfor the program in Example 19-1), and additional paths to search for libraries.
Debugging a C Program in Eclipse
Having the debugger integrated in the graphical user interface is perhaps the greatest feature of an IDE for efficient software development. Eclipse CDT’s Debug perspective is a graphical frontend for the GDB debugger. Different views offer synchronized views of the program’s source code, values of variables and CPU registers, memory blocks, and console I/O.
The GDB debugger is described in detail in Chapter 21. The program in Example 21-1, containing a logic error in the swap() function, is used in this section as well to illustrate the basic commands used in a debugging session in Eclipse. In this section, we assume that you have created a new project named GDB-Example that contains the source file gdb_example.c, with the content shown in Example 21-1. When you run the program, its console output shows that the contents of the variables are not exchanged. Now you want to find the problem by stepping through the program in a debugging session.
Starting the Debugger
To start debugging the program, select the command Debug in the Run menu, or click on the Debug icon (see Figure 22-5) in the toolbar. Or simply press the function key F11. If you have not built the program since the last modification, Eclipse first builds it again. Then confirm the prompt to change to the Debug perspective by clicking on Yes (unless you already switched to the Debug perspective beforehand). The debugger immediately starts the program and interrupts it at the first line in the main() function.
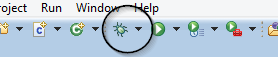
Figure 22-5. The Debug icon
If you want to debug a program started with certain command-line arguments or environment variables, you can enter the desired information in the Debug Configuration. Select the command Debug Configuration; in the Run menu, or in the drop-down list attached to the Debug icon in the toolbar. The contents of the dialog are similar to those of the Run Configurations dialog (see Figure 22-4) with the addition of tabs for GDB options and source code paths.
Setting Breakpoints
Because the error in the sample program has to be in the swap() function, we will set a breakpoint at the line that contains the swap() function call. To set the breakpoint, simply double-click in the left margin next to that line in the editor.
The breakpoint is indicated by a blue disc in the left margin of the source code editor (see Figure 22-6). Double-click again in the margin beside the line to clear the breakpoint.
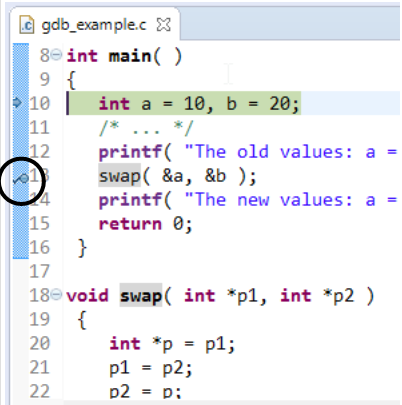
Figure 22-6. A breakpoint in the source code editor
All the breakpoints are shown in the Breakpoints view. Click on the Breakpoints tab in the upper-right pane, or select Show View -> Breakpoints in the Window menu if the tab has been closed. Other views in this pane display the values of variables and registers. Right-click on a breakpoint in the list (or on the blue disc in the left margin of the editor) to open a context menu in which you can deactivate the breakpoint, or select Breakpoint Properties to specify a condition for the breakpoint. See “Conditional breakpoints”.
Controlling Program Execution in the Debugger
To run the program to the next breakpoint (in our example, the breakpoint is before the call to swap()), click on the Resume icon in the toolbar shown in Figure 22-7 (or press F8). The highlighted line always indicates the statement that will be executed next.
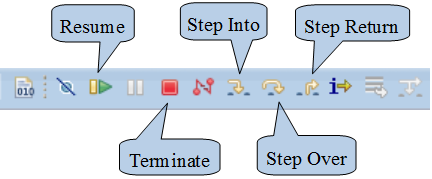
Figure 22-7. The Debug toolbar
Click on Step Into to begin the function call, jumping to the first line in the swap() function. The Variables view, shown in Figure 22-8, now shows the values of the local pointers p1 andp2, and the values of the variables to which they point.
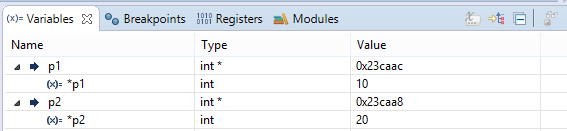
Figure 22-8. The Variables view
In the Debug perspective, the value of a variable is also shown when you hold the mouse pointer over a variable in the source code editor. In the Variables view, you can also change the value of a variable between steps in the program, and without changing the source code. This is practical when you want to test the program’s behavior with a different value only in the current debugging session.
If you click on Step Return, the program runs to the end of the current function, or more exactly, up to the first statement after the function call. But because we want to watch the values of the function’s local variables, we’ll step through the three lines of the swap() function. (Another option would be to set a breakpoint at the end of the function, and examine the values of the variables again there.) In the Variables view, you can see that only the values of the pointers are swapped—not the values of the variables they point to, *p1 and *p2. That was the bug inswap(). For the corrected version, see the end of the section “A Sample Debugging Session”.
Further Information on Eclipse
The most important resources on Eclipse are accessible from the program itself: go to Welcome -> Overview in the Help menu. To make the most efficient use of Eclipse CDT, you should certainly have a look at the C/C++ Development User Guide. The Overview page also contains the link “Workbench basics,” which opens the Workbench User Guide. This document explains the basic concepts of the Eclipse user interface, such as views and perspectives, and explains how to customize the Workbench layout. The Workbench User Guide contains a section on collaborative version control in Eclipse titled “Team Programming with CVS”. An interface to the distributed version control system Git is also integrated in Eclipse, and is described in a separate document: the link Git in the Overview page opens the EGit User Guide.
The complete Eclipse documentation is also available on the Web.
There is also an Eclipse forum where you can discuss questions with the community of Eclipse users and developers.