Table of Contents for
Packet Analysis with Wireshark
 Packet Analysis with Wireshark
Published by
Packt Publishing, 2015
Packet Analysis with Wireshark
Published by
Packt Publishing, 2015
- Cover
- Table of Contents
- Packet Analysis with Wireshark
- Packet Analysis with Wireshark
- Credits
- About the Author
- About the Reviewers
- www.PacktPub.com
- Preface
- What you need for this book
- Who this book is for
- Conventions
- Reader feedback
- Customer support
- 1. Packet Analyzers
- Introducing Wireshark
- Other packet analyzer tools
- Summary
- 2. Capturing Packets
- Troubleshooting
- Wireshark user interface
- Wireshark features
- Tcpdump and snoop
- References
- Summary
- 3. Analyzing the TCP Network
- TCP connection establishment and clearing
- TCP data communication
- TCP close sequence
- Lab exercise
- TCP troubleshooting
- TCP latency issues
- Wireshark TCP sequence analysis
- References
- Summary
- 4. Analyzing SSL/TLS
- The SSL/TLS handshake
- Key exchange
- Decrypting SSL/TLS
- Debugging issues
- Summary
- 5. Analyzing Application Layer Protocols
- BOOTP/DHCP
- DNS
- HTTP
- References
- Summary
- 6. WLAN Capturing
- Analyzing the Wi-Fi networks
- Wi-Fi sniffing products
- Summary
- 7. Security Analysis
- The DOS attack
- Scanning
- ARP duplicate IP detection
- DrDoS
- BitTorrent
- Wireshark protocol hierarchy
- Summary
- Index
Until now we have been troubleshooting connection-related issues. In this section, we will check the latency part. Latency can be on the network, or in application processing on the part of the client or server.
Identifying the source of latency also plays an important role in TCP troubleshooting. Let's see what the common causes of latency are:
- Network slow wire latency can be measured with the
pingutility - Too many running processes eat memory. Check the memory management, work with free, top command to identify CPU and memory use
- Application not started with sufficient memory or cannot serve more requests
- Bad TCP tuning; verify the
/etc/sysctl.cnffile - Network jitter; verify your network and check with the network administrator
- Poor coding; benchmark your code by performing a load test over the network
- Gateway wrongly set; check the gateway, verify the routing table, and verify the gateway
- Higher hop counts; do a traceroute and check the number of hops (the higher the hop count, the more latency increases)
- Slow NIC interface, the interface goes down; check the NIC card and verify its speed
Various network utility tools are available to measure the latency between networks—for example traceroute, tcpping, and ping.
ping: This utility can be used to measure the round trip time (RTT):bash$ ping -c4 google.com PING google.com (216.58.196.110): 56 data bytes 64 bytes from 216.58.196.110: icmp_seq=0 ttl=55 time=226.034 ms 64 bytes from 216.58.196.110: icmp_seq=1 ttl=55 time=207.748 ms 64 bytes from 216.58.196.110: icmp_seq=2 ttl=55 time=222.995 ms 64 bytes from 216.58.196.110: icmp_seq=3 ttl=55 time=162.507 ms --- google.com ping statistics --- 4 packets transmitted, 4 packets received, 0.0% packet loss round-trip min/avg/max/stddev = 162.507/204.821/226.034/25.394 ms
traceroute: This is used to identify the number of HOPS it has taken to reach the destination—the fewer the hops, the lower the latency
Wireshark can be used effectively to identify whether the network is slow or the application is slow. Open the slow_download.pcap file in Wireshark, and investigate the root cause of why the download is slow.
In this example, 5 MB of data is requested from the HTTP server, and it has taken approx. 4.99 minutes to download, as shown:
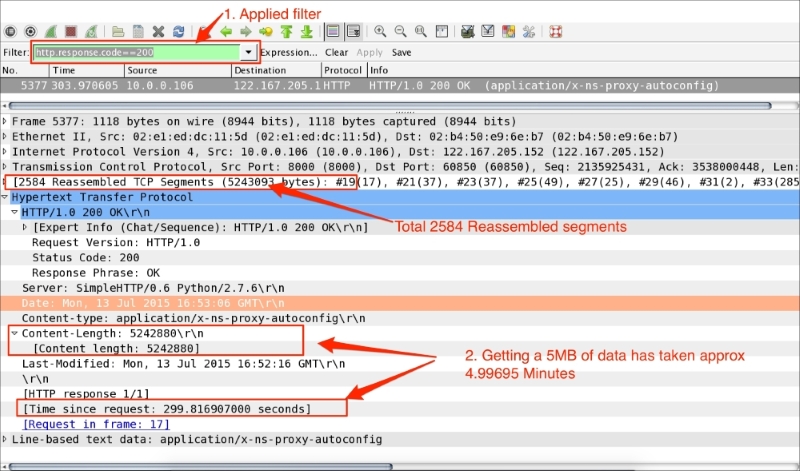
The steps to diagnose this issue are as follows:
- Go to Edit | Preferences | Protocols | HTTP and then enable all HTTP reassemble options.
- Apply the filter
http.response.code==200. - Go to HTTP and set the
http.time == 299.816907000to approximately 4.99 minutes. - Check the size of the file by navigating to
http.content_length_header == "5242880"; this is the size of the content. - Check how many TCP segments have been sent—
tcp.segment.count == 2584—and ask yourself whether so many are needed and whether the number can be reduced. - Verify
window_sizefor the client and server to check what was advertised by the client and what got used. - Add
tcp.window_size_valuein the Wireshark column and sort in ascending order. Note that the entire packet flow from the server (10.0.0.16) to the client (122.167.205.152) has a window size of100. - Verify the
sysctl.conffile in UNIX-flavored systems and check the TCP tuning parameters such asnet.core.rmem_max,net.core.wmem_max,net.ipv4.tcp_rmem, andnet.ipv4.tcp_wmemnet.ipv4.tcp_mem.
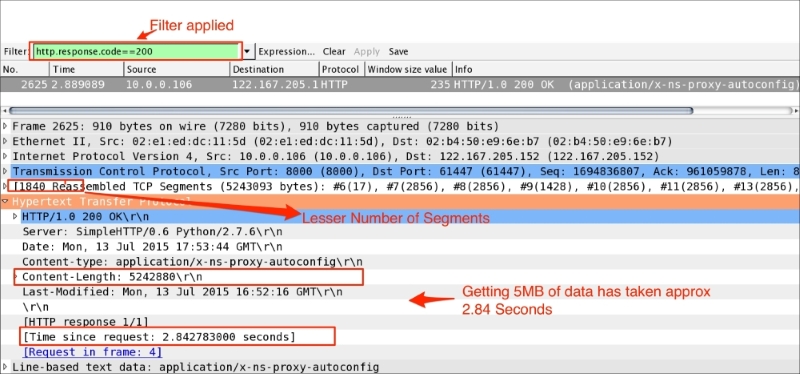
In this scenario, tcp.window_size was reduced in the sysctl.conf file to demonstrate the slow_download behavior and to give an insight into troubleshooting. After fixing Window_Size, the same download is reduced from 299.816907000 to 2.84 seconds. Open the fast_download.pcap file as shown in the following screenshot; the download time is reduced:
In this example, the TCP handshake process will be used to identify wire latency. Open the slow_client_ack.pcap file as shown in the following screenshot:
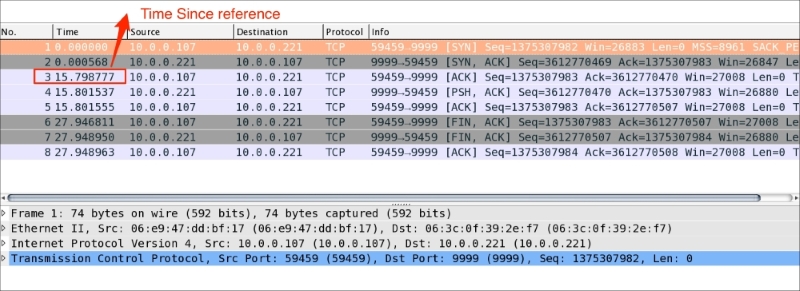
As you can see in the preceding screenshot:
- The first two handshake messages (
SYN,SYN-ACK) sent by the client/server over the wire are exchanged in less time - In the last handshake message,
ACKsent by the client has takenframe.time_relative == 15.798777000seconds and shows an increase in Time Since Reference. This is higher than the first two handshake messages, which confirms a wire latency on this packet - Once the handshake is completed, the operation resumes normally; the Time Since reference for all packets shows a consistent timing