Copyright © 2015 Packt Publishing
All rights reserved. No part of this book may be reproduced, stored in a retrieval system, or transmitted in any form or by any means, without the prior written permission of the publisher, except in the case of brief quotations embedded in critical articles or reviews.
Every effort has been made in the preparation of this book to ensure the accuracy of the information presented. However, the information contained in this book is sold without warranty, either express or implied. Neither the author, nor Packt Publishing, and its dealers and distributors will be held liable for any damages caused or alleged to be caused directly or indirectly by this book.
Packt Publishing has endeavored to provide trademark information about all of the companies and products mentioned in this book by the appropriate use of capitals. However, Packt Publishing cannot guarantee the accuracy of this information.
First published: November 2015
Production reference: 1261115
Published by Packt Publishing Ltd.
Livery Place
35 Livery Street
Birmingham B3 2PB, UK.
ISBN 978-1-78588-781-9
Author
Anish Nath
Reviewers
Michael Downey
Robert Juric
Mikael Kanstrup
Acquisition Editor
Indrajit Das
Content Development Editor
Rohit Singh
Technical Editor
Mrunmayee Patil
Copy Editor
Stephen Copestake
Project Coordinator
Mary Alex
Proofreader
Safis Editing
Indexer
Monica Ajmera Mehta
Production Coordinator
Nilesh Mohite
Cover Work
Nilesh Mohite
Anish Nath is a software engineer who has more than 10 years of experience. He works at CISCO, and at CISCO, he started using Wireshark for the first time. He is thankful to CISCO. He doesn't speak much, but likes to explore new things that he has not tried or not thought of. He also tries his best to be successful at this. Though he fails a lot of time, this gives him more experience, and when success comes, he thanks all of his efforts that had failed him initially.
You can reach him at https://in.linkedin.com/in/anishnath, and his Twitter handle is @anish2good.
Michael Downey is a security analyst with a passion for *nix operating systems and network security monitoring. He is also the cofounder of the Evansville Linux User Group in Indiana, and a contributing member of OpenNSM (http://www.open-nsm.net/). In his free time, he enjoys security research and an occasional game of disc golf.
Robert Juric, while working as a network engineer, has supported government agencies, large corporations, and service providers. From his experience, he learned the value of packet analysis and has come to enjoy the details that it provides.
When not at work, Robert enjoys spending time outdoors with his wife and young son. He occasionally writes articles for his website, robertjuric.com, or can be found on Twitter at @robertj180.
Mikael Kanstrup is a software engineer with a passion for adventure and thrills in life. In his spare time, he spends his time kitesurfing, riding motocross, or just going outdoors with his family and two kids. Mikael has a BSc degree in computer science and years of experience in embedded software development and computer networking. For the past decade, he has been working as a professional software developer in the mobile phone industry.
For support files and downloads related to your book, please visit www.PacktPub.com.
Did you know that Packt offers eBook versions of every book published, with PDF and ePub files available? You can upgrade to the eBook version at www.PacktPub.com and as a print book customer, you are entitled to a discount on the eBook copy. Get in touch with us at <service@packtpub.com> for more details.
At www.PacktPub.com, you can also read a collection of free technical articles, sign up for a range of free newsletters and receive exclusive discounts and offers on Packt books and eBooks.

https://www2.packtpub.com/books/subscription/packtlib
Do you need instant solutions to your IT questions? PacktLib is Packt's online digital book library. Here, you can search, access, and read Packt's entire library of books.
If you have an account with Packt at www.PacktPub.com, you can use this to access PacktLib today and view 9 entirely free books. Simply use your login credentials for immediate access.
I would like to dedicate this book to my 5-year old son, Arjun Nath; grandfather, Sri Rajeshwar Prasad; wife, Manisha Prasad; mother, Indu Sinha; and all my family members (my father, Anil Kumar Sinha; chote papa, Sunil Kumar Sinha; choti mummy, Poonam Sinha; and friends). Without them, this would not have been possible.
The purpose of this book is to identify, learn about, and solve issues related to protocol, network, and security, and see how Wireshark helps to analyze these patterns by allowing its features to troubleshoot effectively. This book has lab exercises and contains packet capture files for offline viewing and analyses. Most of the examples contain production-like scenarios and their solutions and steps to reproduce these solutions.
This book also contains effective capturing methods that can be used directly in production without installing Wireshark.
Wireshark is an awesome tool for troubleshooting and learning, and within the scope of this book, we have taken the best use cases for different types of audiences, such as network administrators, security auditors, protocol learners, and troubleshooters.
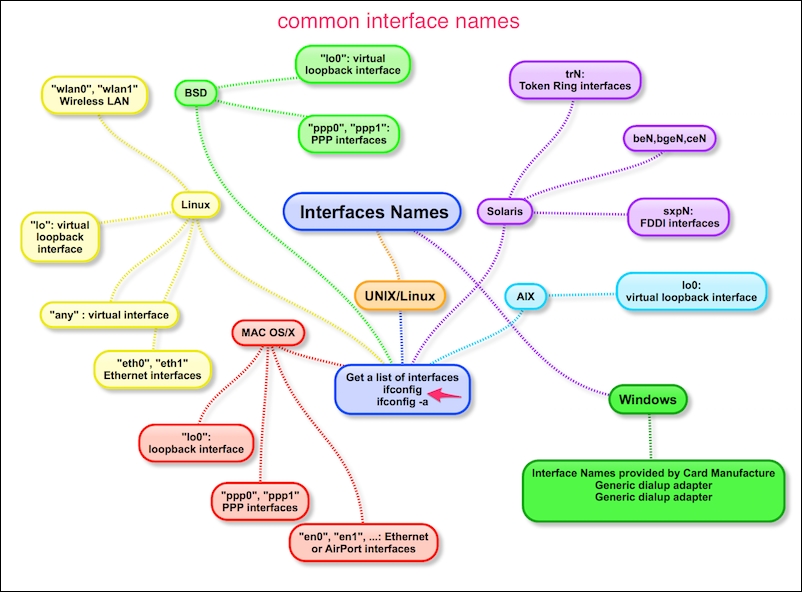
Chapter 1, Packet Analyzers, covers the definition of packet analyzers and their use cases, network interfaces naming conventions, pcap/pcanpng file extensions, and types of network analyzer tools.
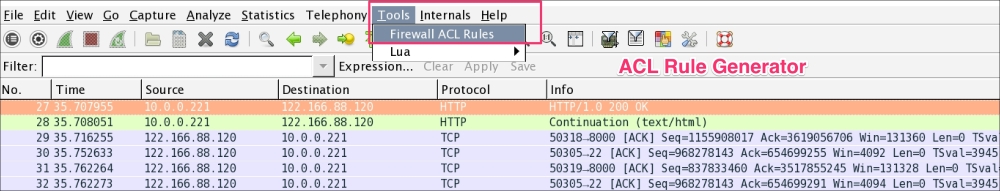
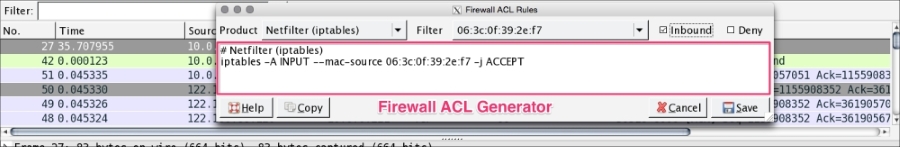
Chapter 2, Capturing Packets, covers how to capture packets using Wireshark, tcpdump, and snoop; how to use Wireshark display filters; and how to use Wireshark's cool features such as Decode-As and protocol preferences. Also, we will cover the TCP stream, exporting images, generating a firewall ACL rule, autocapture setup, and the name resolution feature.
Chapter 3, Analyzing the TCP Network, covers the TCP state machine, TCP connection establishment and closing sequence, practical troubleshooting labs such as (CLOSE_WAIT, TIME_WAIT), how to identify and fix latency issues, and Wireshark TCP sequence analysis flag (zero window, dup-ok, TCP retransmission, and window update) features.
Chapter 4, Analyzing SSL/TLS, covers the TLS/SSL two-way mutual authentication process with Wireshark, SSL/TLS decryption with Wireshark, and the identification of handshake failure with Wireshark.
Chapter 5, Analyzing Application Layer Protocols, covers how to analyze a protocol using the Wireshark display filter, how these protocols work, how to simulate these packets, capture, and display them using tcpdump/Wireshark.
Chapter 6, WLAN Capturing, covers WLAN capture setup and monitor mode, capturing with tcpdump, 802.11 display filters, Layer-2 datagram frames types, Wireshark display filters, and other Wi-Fi Sniffing products available.
Chapter 7, Security Analysis, covers the security aspect with Wireshark and discusses uses cases such as the Heartbleed bug, SYN flood/mitigation, ICMP flood/mitigation, MITM, BitTorrent, and host scanning.
The topics covered in this book require a basic understanding of TCP/IP. The examples used in this book are independent of an operating system. All the examples are executed in a MAC and Linux OS. Windows users can install Cygwin to use a Linux command-line utility. The following executables are used in this book:
In this book, you will find a number of text styles that distinguish between different kinds of information. Here are some examples of these styles and an explanation of their meaning.
Code words in text, database table names, folder names, filenames, file extensions, pathnames, dummy URLs, user input, and Twitter handles are shown as follows: "Start Wireshark by clicking on the Wireshark icon or type Wireshark in the command line."
Any command-line input or output is written as follows:
[bash ~]# cat /proc/sys/net/ipv4/tcp_fin_timeout
60
New terms and important words are shown in bold. Words that you see on the screen, for example, in menus or dialog boxes, appear in the text like this: "Click on Interface List; Wireshark will show a list of available network interfaces in the system."
Feedback from our readers is always welcome. Let us know what you think about this book—what you liked or disliked. Reader feedback is important for us as it helps us develop titles that you will really get the most out of.
To send us general feedback, simply e-mail <feedback@packtpub.com>, and mention the book's title in the subject of your message.
If there is a topic that you have expertise in and you are interested in either writing or contributing to a book, see our author guide at www.packtpub.com/authors.
Now that you are the proud owner of a Packt book, we have a number of things to help you to get the most from your purchase.
You can download the example code files from your account at http://www.packtpub.com for all the Packt Publishing books you have purchased. If you purchased this book elsewhere, you can visit http://www.packtpub.com/support and register to have the files e-mailed directly to you.
Although we have taken every care to ensure the accuracy of our content, mistakes do happen. If you find a mistake in one of our books—maybe a mistake in the text or the code—we would be grateful if you could report this to us. By doing so, you can save other readers from frustration and help us improve subsequent versions of this book. If you find any errata, please report them by visiting http://www.packtpub.com/submit-errata, selecting your book, clicking on the Errata Submission Form link, and entering the details of your errata. Once your errata are verified, your submission will be accepted and the errata will be uploaded to our website or added to any list of existing errata under the Errata section of that title.
To view the previously submitted errata, go to https://www.packtpub.com/books/content/support and enter the name of the book in the search field. The required information will appear under the Errata section.
Piracy of copyrighted material on the Internet is an ongoing problem across all media. At Packt, we take the protection of our copyright and licenses very seriously. If you come across any illegal copies of our works in any form on the Internet, please provide us with the location address or website name immediately so that we can pursue a remedy.
Please contact us at <copyright@packtpub.com> with a link to the suspected pirated material.
We appreciate your help in protecting our authors and our ability to bring you valuable content.
If you have a problem with any aspect of this book, you can contact us at <questions@packtpub.com>, and we will do our best to address the problem.
A packet analyzer is also known as a packet sniffer or a network protocol analyzer. Packet analyzer has the ability to grab the raw packet from the wire, wireless, Bluetooth, VLAN, PPP, and other network types, without getting processed by the application. By doing so it brings the whole science and innovation to this field. In this chapter we will see a few use cases of the packet analyzer by covering the following topics:
More practically, packet analyzers are employed in network security and to analyze raw traffic so as to detect scans and attacks, and for sniffing, network troubleshooting, and many more uses, as shown in the following image:
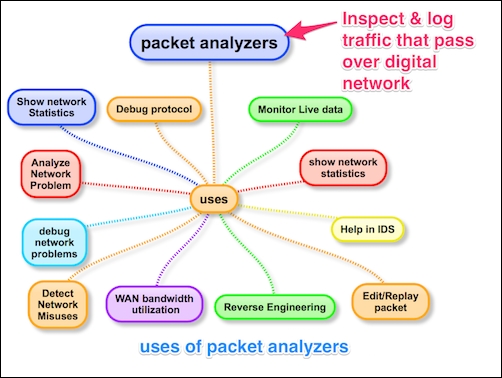
Packet analyzers can be used as follows:
The use is not limited to these bullet point, there are lots of new tools and innovations happening in this area. Find a use case and build your own packet analyzer; the best example is Wireshark.
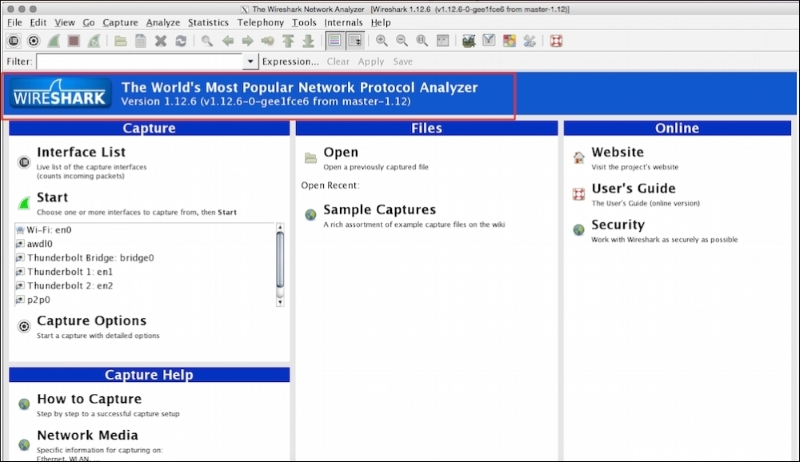
Wireshark is perhaps one of the best open source packet analyzers available today. Wireshark is a powerful packet analyzer tool, with an easy-to-use, rich GUI and a command-line utility with very active community support: http://ask.wireshark.org.
Wireshark uses pcap (libpcap) to capture packets, which means it can capture packets in offline mode—to view the captured packets—and online mode (live traffic) to capture and display the traffic in the Wireshark GUI. Once open, the Wireshark GUI looks like this:
We will see some of the important features that are available in Wireshark in the following figure:
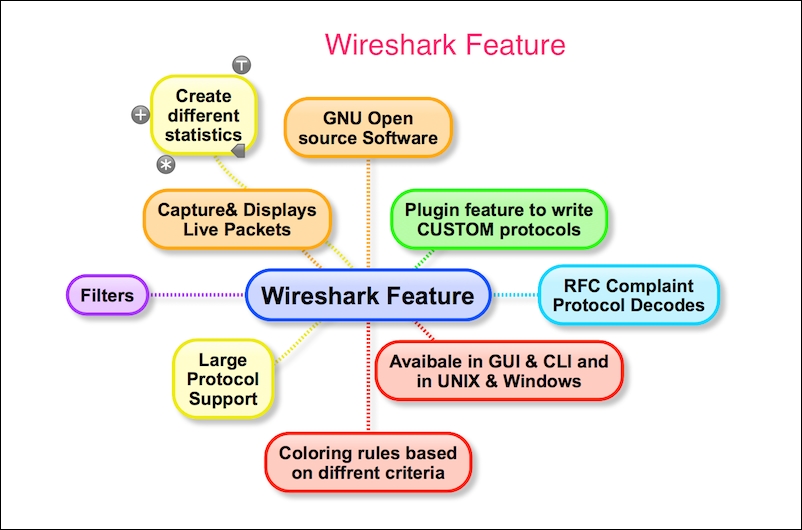
Wireshark has the following cool built-in features, few of them are listed as follows:
The Wireshark installation provides some command-line tools such as
dumpcap and tshark. Wireshark and tshark rely on dumpcap to capture traffic; more advanced functionality is performed by tshark. Also note that dumpcap can be run as its own standalone utility. tshark is a command-line version of Wireshark and can be used in the remote terminal.
The user must be aware of where Wireshark is installed and it should be obliged with your organization policy before start capturing on the TAP (Test Access Point) or Switch Port Analyzer (SPAN) port.
Usually developers install Wireshark on their personal laptop/desktop and capture packets, which goes in-out from the box.
Certain guidelines should be followed to perform this:
WinPCap to be installed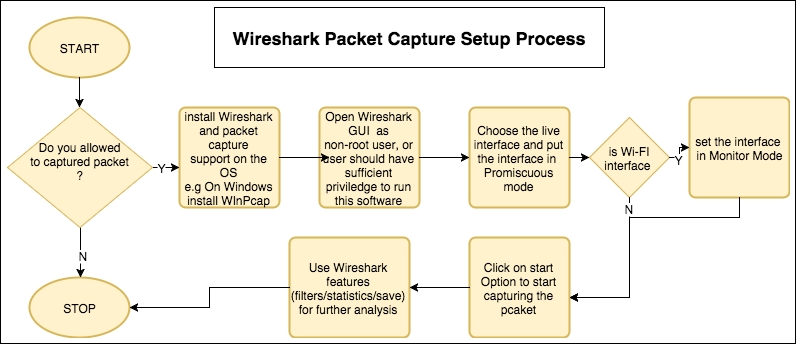
Wireshark is a packet analysis tool to use features such as packet editing/replaying, performing MITM, ARPspoof, IDS, and HTTP proxy, and there are other packet analyzer tools available and can be used as well.
The following is a list (not limited) of notable packet analyzer tools on the market; many others are commercially available. The table lists tools and their features:
|
Tools |
Packet editing |
Packet replay |
ARPspoof/MITM |
Password sniffing |
Intrusion detection |
HTTP debugger |
|---|---|---|---|---|---|---|
|
WireEdit (https://wireedit.com/) |
Y |
N |
N |
N |
N | |
|
Scapy (http://www.secdev.org/) |
Y |
Y |
Y |
N |
Y | |
|
Ettercap (https://ettercap.github.io/ettercap/) |
Y |
N |
Y |
Y |
N |
N |
|
Tcpreplay (http://tcpreplay.synfin.net/) |
N |
Y |
N |
N |
N |
N |
|
Bit-Twist (http://bittwist.sourceforge.net/) |
Y |
N |
N |
N |
N |
N |
|
Cain (http://www.oxid.it/cain.html) |
N |
N |
Y |
Y |
N |
N |
|
Snort (https://www.snort.org/) |
N |
N |
N |
N |
Y |
N |
Wireshark is not available on mobile platforms such as Android, iOS, or Windows. In order to capture mobile traffic the following tools are suggested based on the platform:
|
Platform |
Packet capture tool used |
URL |
|---|---|---|
|
Windows |
Microsoft Network Analyzers |
http://www.microsoft.com/en-in/download/details.aspx?id=19484 |
|
iOS |
Paros | |
|
Android |
Shark for Root | |
|
Kismet Android PCAP |
Various other techniques are used to capture mobile traffic using Wireshark. One such technique is creating a Wi-Fi hotspot on the laptop, allowing the mobile phone to use this Wi-Fi, and sniffing traffic on your Wi-Fi interface using Wireshark.
In this chapter we learned what packet analyzers are and what their use cases are. After a quick introduction to Wireshark, we covered what goes on behind-the-scenes when Wireshark captures packets; Wireshark benefits and important features; the necessary prerequisites before capturing packets; and other packet analyzer tools for packet editing/sniffing/replaying and so on. We also provided a brief overview of mobile packet capturing.
The next chapter will be more specific to Wireshark and its tips and tricks. After that we will explore TCP troubleshooting, then plunge into SSL, and other application protocols such as DHCPv6, DHCP, DNS, and HTTP. We will also analyze Wi-Fi capturing and carry out some security analyses with the help of Wireshark and tcpdump.
In the previous chapter, we learned what packet analyzers are used for. In this chapter we will learn more about the Wireshark GUI features, and see how it helps in capturing and analyzing packets effectively, by covering the following topics:
Start Wireshark by clicking on the Wireshark icon or type Wireshark in the command line. When Wireshark starts it launches the following screen and provides the following ways to capture packets:
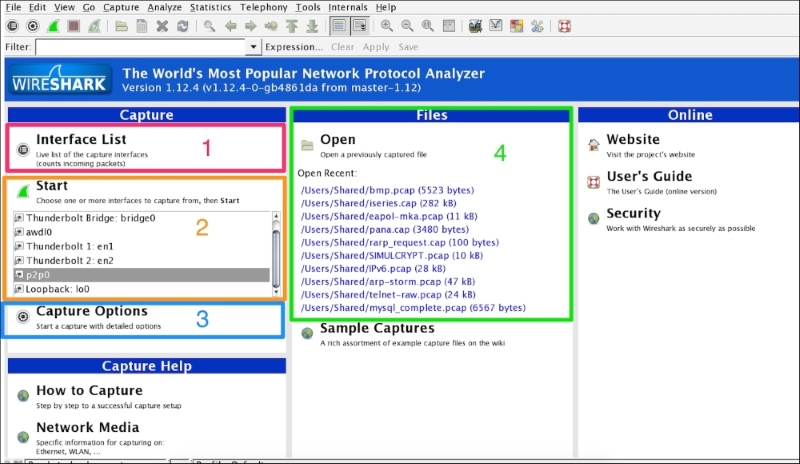
The following table explains the various options that we have on the Start screen:
|
Sr. no. |
Wireshark capture options |
What is this? |
|---|---|---|
|
1 |
Interface List |
Opens up a live list of capture interfaces, and counts the incoming/outgoing packets |
|
2 |
Start |
You can choose an interface from the list and start capturing packets |
|
3 |
Capture Options |
Provides various options for capturing and displaying packets |
|
4 |
Open Recent |
Wireshark displays recently used packets |
We will cover each capturing option in detail one by one.
Click on Interface List; Wireshark will show a list of available network interfaces in the system and which one is active, by showing packets going in and out of the Interface, as shown in the following screenshot:
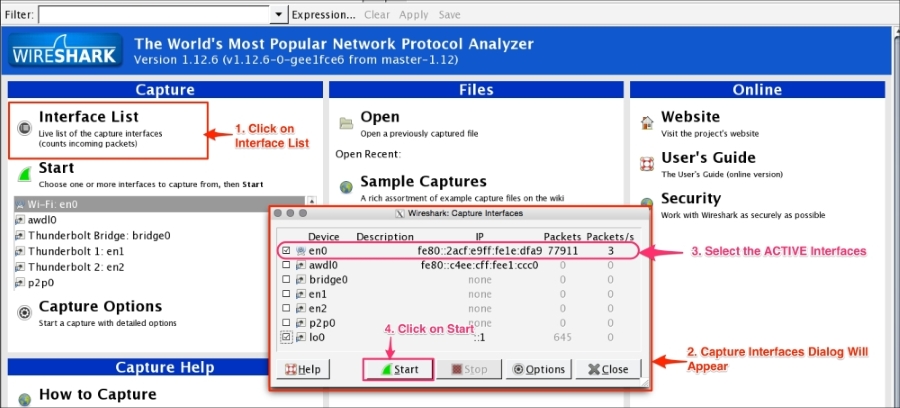
Choose the right (live) interfaces and click on the Start button to start capturing packets. If you want to capture packets on loopback (127.0.0.1), select the interface lo0.
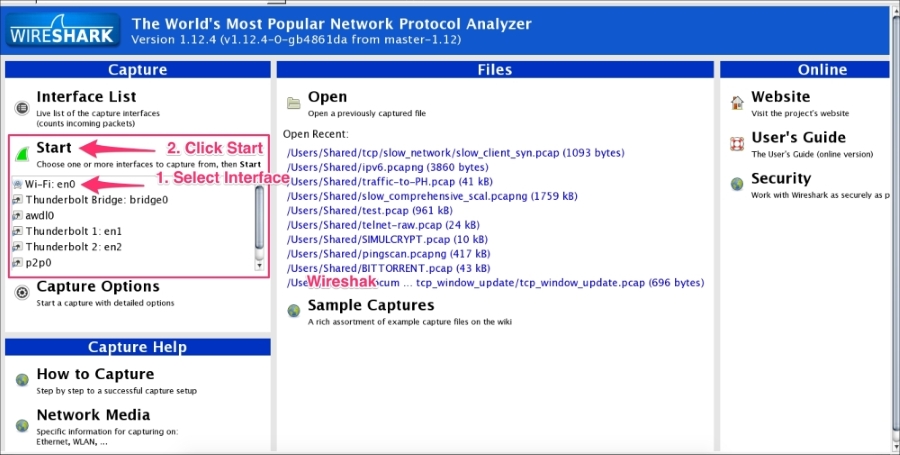
In Start options, users can multiselect or select the interface displayed in the list and then click on Start. This doesn't give you the flexibility to see on which interface the packets are active. Users can configure the capture options by double clicking on the interface or by clicking on Capture Options:
Wireshark provides the flexibility to configure packets that need to be captured with various capture options. To begin, try these basic settings:
28:cf:e9:1e:df:a9 will translate to 192.168.1.101.216.58.220.46 will translate to google.com).443 will translate to https).216.58.196.14 will translate to ns4.google.com) also referred to as reverse DNS lookup.Users can also choose these options by selecting the Wireshark View menu and applying the following settings:
The drawbacks of name resolution are as follows:
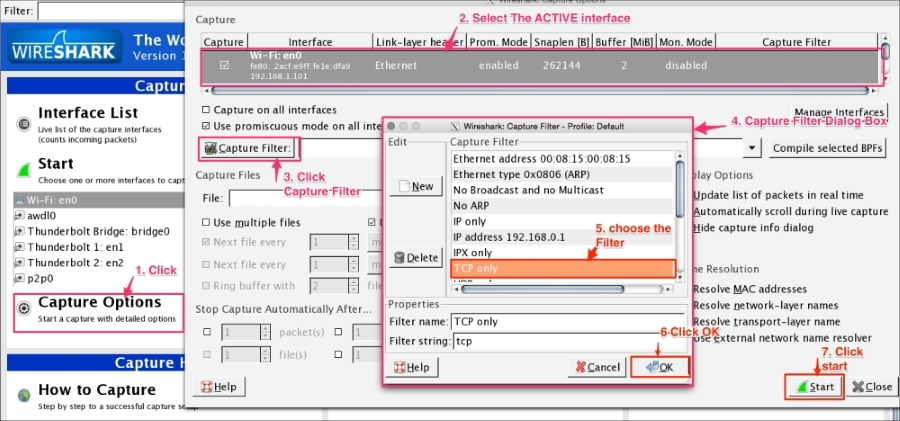
Wireshark provides a range of capture filter options, use these options to decide which packets will save to the disk. These options are useful when capturing packets over a longer period of time. Wireshark uses the Berkeley Packet Filter (BPF) syntax for this purpose, for example tcp src port 22. This option also saves disk space. For example, to capture only TCP packets, follow the given steps:
Users can fine-tune Wireshark to auto-capture files periodically. To do this, click on Capture Options | Capture Files, as shown in the following screenshot:
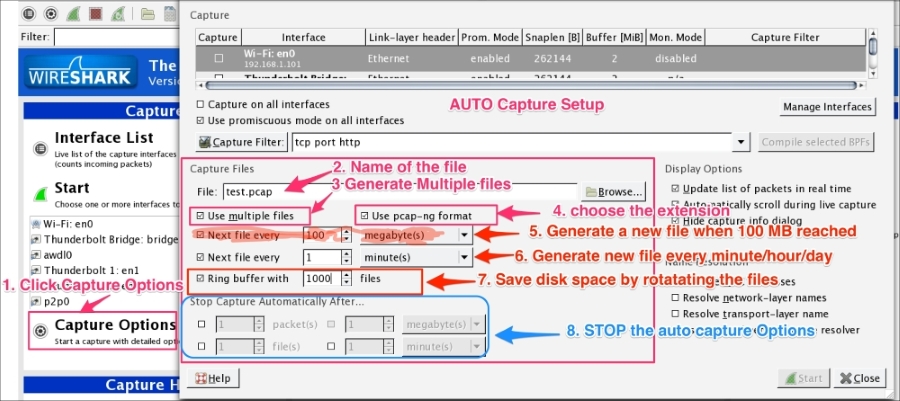
Wireshark will generate files such as test_00001_20150623001728.pcap and test_00002_20150623001818.pcap.
The formats of the multiple generated files are as follows:
test: This is the filename00001: This is the file number20150623001728: This is the date/time stamppcap: This is the file extensionIf a packet doesn't appear in the Wireshark main window, perform the following actions:
If no interface appears on which captures can be performed, do the following:
You can also use the Wireshark community at https://ask.wireshark.org/ if queries aren't resolved.
The Wireshark main window appears when Wireshark starts capturing a packet, or when a .pcap file is open for offline viewing. It looks similar to the following screenshot:
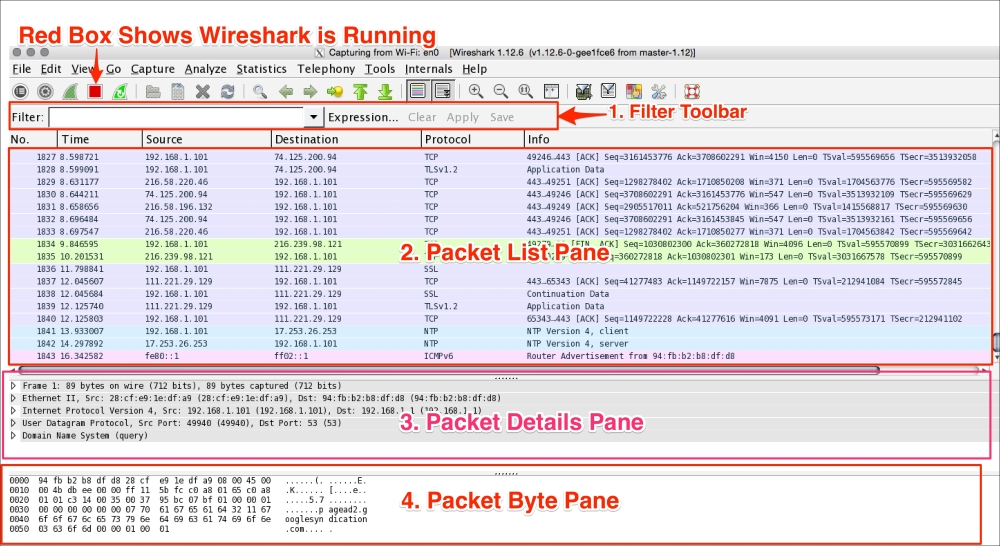
The Wireshark UI interface consists of different panes and provides various options to the user for customizing it. In this chapter, we will cover these panes in detail:
|
Item |
What is it? |
|---|---|
|
The red box |
This shows that Wireshark is running and capturing a packet |
|
1 |
This is the Filter toolbar, used for filtering packets based on the applied filter |
|
2 |
This is the Packet List pane, which displays all captured packets |
|
3 |
This is the Packet Details pane, which shows the selected packet in a verbose form |
|
4 |
This is the Packet Byte pane, which shows the selected packet in a hex dump format |
First, just observe pane 2 in the screen; the displayed packets appear with different colors. This is one of Wireshark's best features; it colors packets according to the set filter and helps you visualize the packet you are looking for.
To manage (view, edit, or create) a coloring rule, go to View | Coloring Rules. Wireshark will display the Coloring Rules dialog box, as shown in the screenshot:
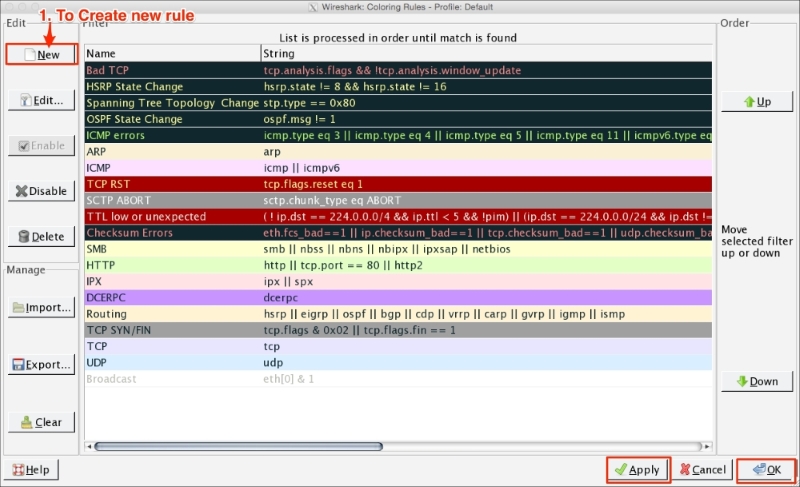
Users can create a new rule by clicking on the New button, choosing the filter name and filter string, and then applying a foreground and background color to it, to customize the packet with a specific color.
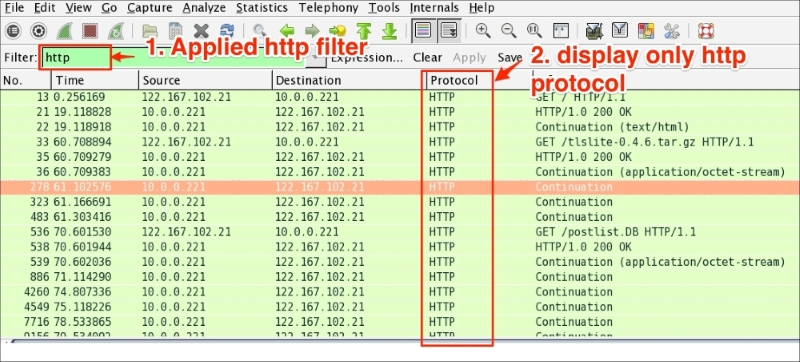
The Wireshark display filter displays packets with its available coloring options. Wireshark display filters are used to change the view of a capture file by providing the full dissection of all packets, which helps analyzing a network tracefile efficiently. For example, if a user is interested in only HTTP packets, the user can set the display filter to http, as shown in the next screenshot.
The steps to apply display filters are as follows:
http_01.pcap file.http protocol in the filter area and click on Apply.Once the filter is applied, the Packet List pane will display only HTTP protocol-related packets:
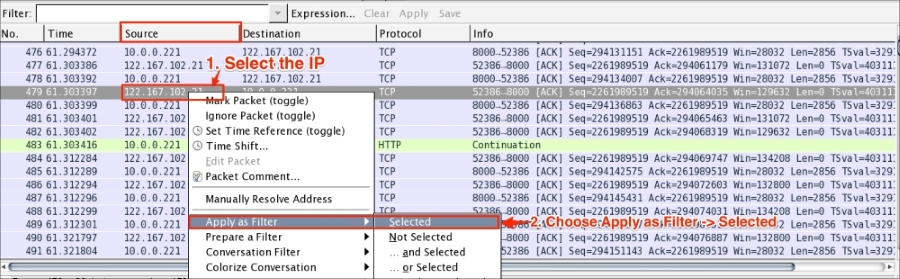
Wireshark display filter can be applied or prepared from the column displayed in the Packet List pane by selecting the column, then right-clicking and going to Apply as Filter | Selected (as shown in the following screenshot) to create the filter from the source IP address 122.167.102.21:
Wireshark provides the flexibility to apply filters from the Details pane; the steps remain the same.
Wireshark also provides the option to clear the filter. To do this click on Clear (available in the Filter toolbar) to display the entire captured packet.
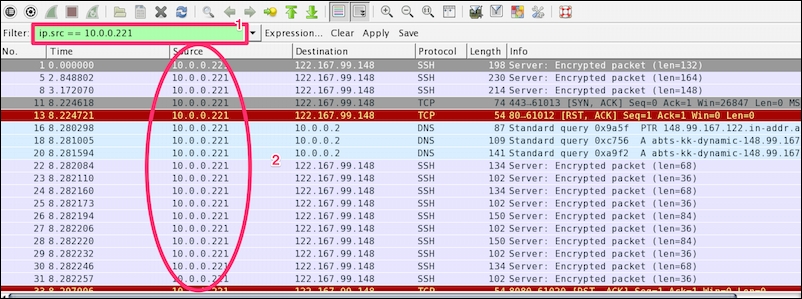
Capturing and displaying packets properly will help you with packet captures. For example, to track a packet exchanged between two hosts: HOSTA (10.0.0.221) and HOSTB (122.167.99.148), open the SampleCapture01.pcap file and apply the filter ip.src == 10.0.0.221 as shown:
Let's see what the highlighted sections depict:
|
Item |
Description |
|---|---|
|
1 |
Apply filter |
|
2 |
The Packet List pane displays the traffic from source to destination. The source shows the constant IP address |
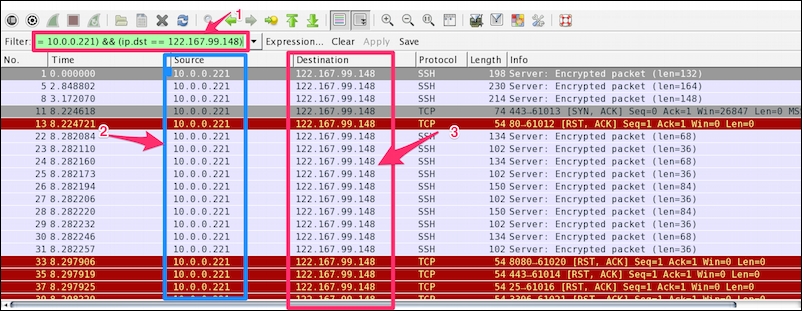
Now modify the filter (ip.src == 10.0.0.221) && (ip.dst == 122.167.99.148) to (ip.src == 10.0.0.221) or (ip.dst == 122.167.99.148). This will give the result shown in the following screenshot:
The highlighted sections in the preceding screenshot are explained as follows:
|
Item |
Description |
|---|---|
|
1 |
Applied filter |
|
2 |
The source IP address ( |
|
3 |
The destination IP address ( |
Again the Packet List pane is not displaying the conversation between the two hosts.
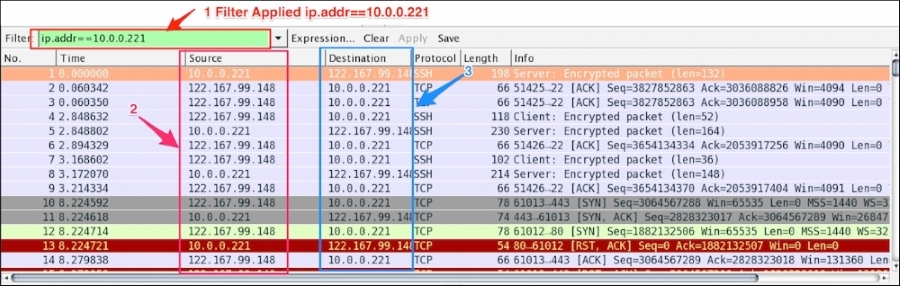
Now modify the filter ip.addr == 122.167.99.148. The ip.addr field will match the IP header for both the source and destination address and display the conversation between the hosts. Remember to choose the destination IP address as shown:
Let's see what the highlighted sections depict:
|
Item |
Description |
|---|---|
|
1 |
Applied filter |
|
2 |
The source IP is not constant; it shows the conversation between the two hosts |
|
3 |
The destination IP is not constant; it shows the conversation between the two hosts |
The same conversation is captured by choosing the destination MAC address using the display filter eth.addr == 06:73:7a:4c:2f:85.
Some common filter examples are as follows:
|
Filter/capture name |
Filter value |
|---|---|
|
Packet on a given port |
|
|
Packet on the source port |
|
|
SYN packet on port |
|
|
The HTTP protocol |
|
|
Based on the HTTP |
|
|
Using |
|
|
Checking the |
|
|
No |
|
|
The MAC address filter |
|
|
Filter out TCP ACK |
|
|
Check only RST and ACK packets |
|
|
Filter all SNMP |
|
|
HTTP or DNS or SSL |
|
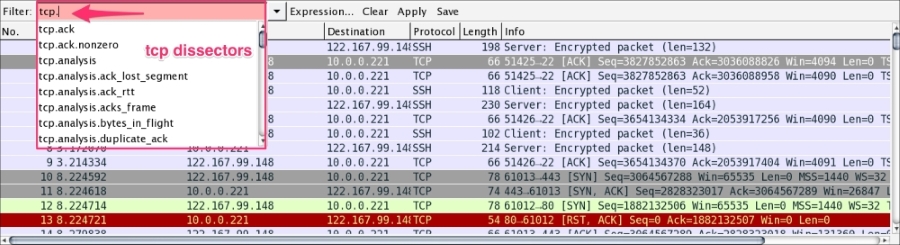
There is no need to memorize the filter; there is an easy way to apply it. The display filter Autocomplete feature lists all dissectors after the first period "." that have been added to the display filter, as shown in the following screenshot:
It's worth checking the following links for a complete display filter reference:
The Packet List pane displays packets from the .pcap (or accepted Wireshark extensions) file or from live capture, as shown:
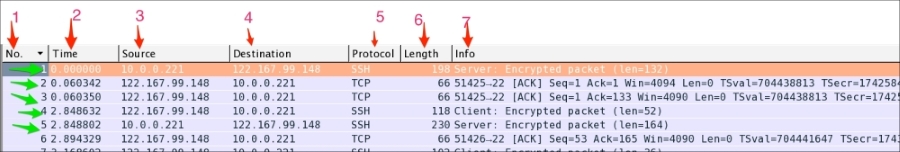
Let's discuss the fields shown:
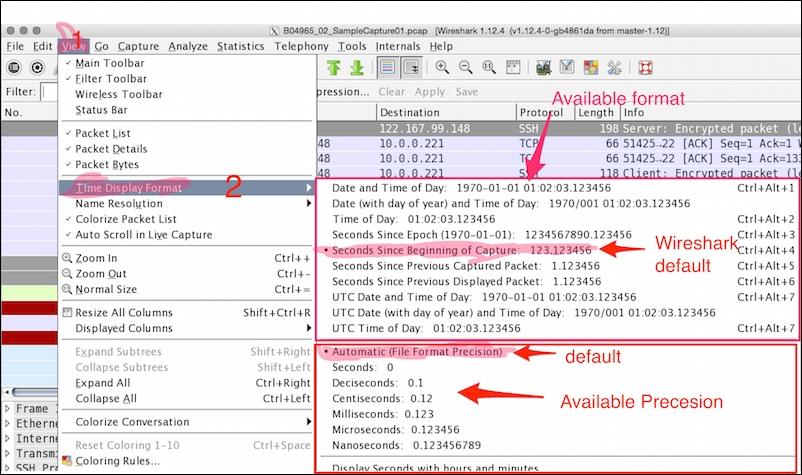
To change the time-stamped information of the packet go to View | Time Display Format to view the available presentation formats, as shown:
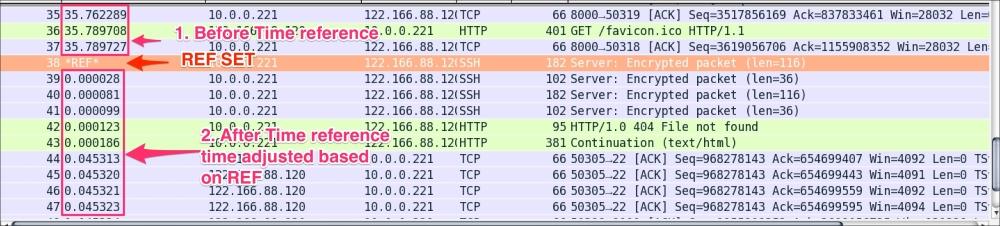
The Wireshark Set Time Reference feature gives you the ability to view the time reference from the selected packet. Open the capture file http.pcap and set the time reference from packet 38. To do this, select packet 38, right-click, and select Set Time Reference (toggle), as shown in the following screenshot:
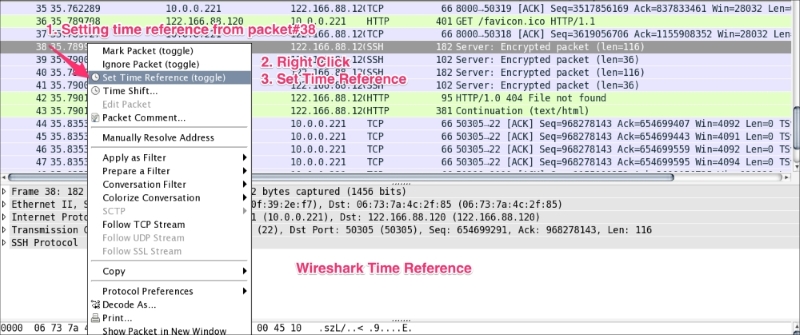
After *REF* is set, it becomes the starting point for all subsequent packet time calculations, as shown in the following screenshot:
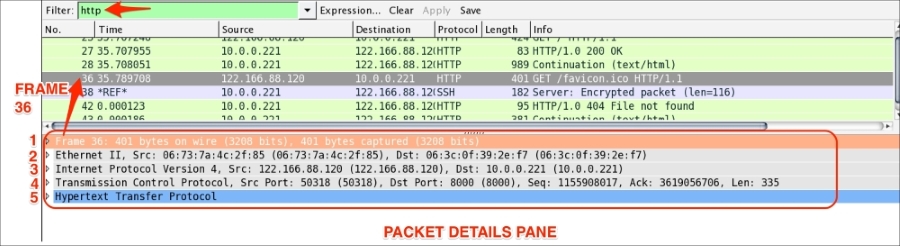
The Packet Details pane will show the currently selected packet in a more detailed form. In the following screenshot, an HTTP packet is selected and its details are shown in the information labeled with numbers 1 to 5. Let's see what these are:
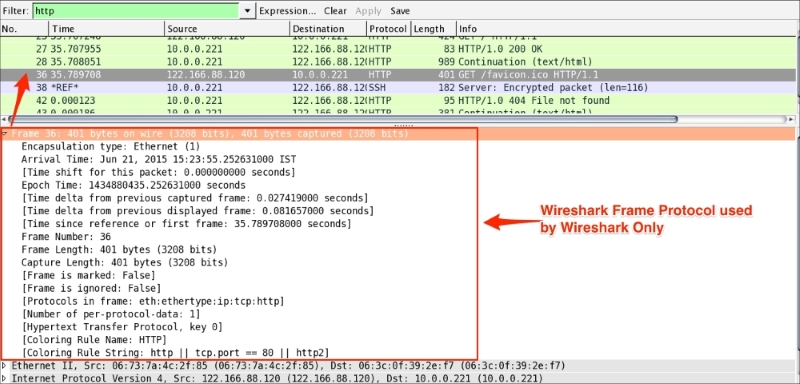
The frame protocol is only used by Wireshark. All the TCP/IP protocols sits on top of this. The frame shows at what time the packet was captured, as shown in the following screenshot:
Ethernet is the link layer protocol in the TCP/IP stack. It sends network packets from the sending host to one (Unicast) or more (Multicast/Broadcast) receiving hosts, as shown:
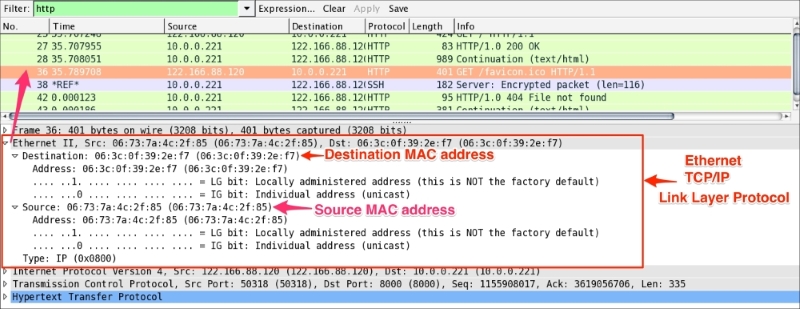
Useful filters in Ethernet are:
eth.dst == 06:3c:0f:39:2e:f7: This shows packets sent to this MAC address onlyeth.dst==ff:ff:ff:ff:ff:ff: This shows broadcast traffic onlyThe packet structure of Ethernet frames is described in the following table:
|
Preamble |
Destination MAC address |
Source MAC address |
Type/length |
User-data |
Frame check sequence (FCS) |
|---|---|---|---|---|---|
|
8 |
6 |
6 |
2 0800 for IPv4 86DD for IPv6 0806 for ARP |
46-1500 |
4 |
The preamble (8 bytes) and FCS (4 bytes) are not part of the frame and Wireshark will not capture this field.
So the total Ethernet header is 14 bytes—6 bytes for the destination address, 6 bytes for the source address, and 2 bytes for the EtherType.
The Internet Protocol information relates to how the IP packet is delivered and whether it has used IPv4 or IPv6 to deliver the datagram packets.
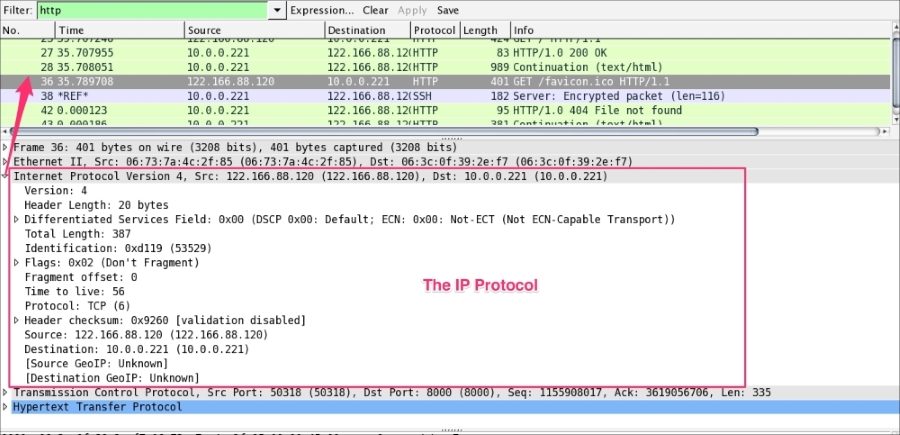
The preceding screenshots show that an IPv4 protocol is used to deliver the datagram packet. Useful display filters in the IP protocol are:
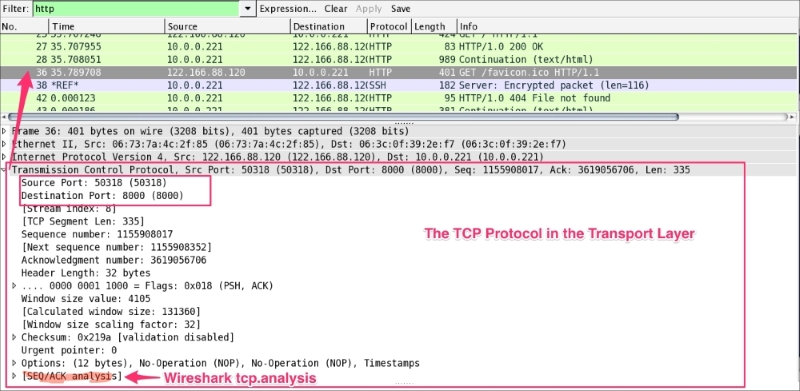
ip.src == 122.166.88.120/24 shows traffic from the subnetip.addr==122.166.88.120 shows traffic to or from the given host122.166.88.120 captures/filters traffic from the hostThe TCP protocol packet contains all TCP-related protocol data. If the communication is over UDP, the TCP will be replaced by the UDP, as shown in the following screenshot. The SEQ/ACK analysis will be done by Wireshark based on the sequence number and expert info will be provided:
The <<APPLICATION-LAYER>> protocol is shown if the packet contains any application protocols. As shown in the following screenshot, the selected packet 36 has HTTP protocol data. Wireshark has the ability to decode the protocol based on the standard port and present this information in the Packet Details pane in a readable (RFC-defined) format.
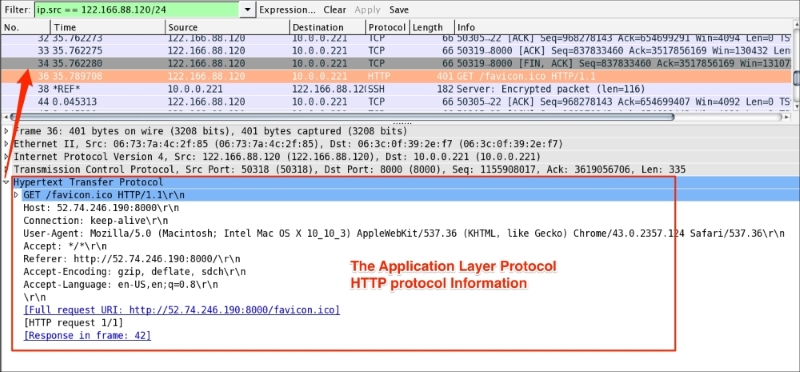
In the coming chapters we will discuss the application-related protocol in greater detail.
Wireshark is loaded with some awesome features. Let's go through a few, though there are more.
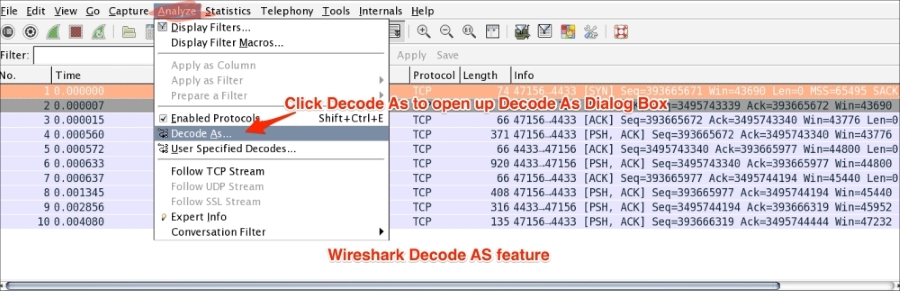
The Decode-As feature allows Wireshark to decode the packet based on the selected protocol. Usually Wireshark will automatically identify and decode incoming packets based on the standard port—for example, port 443 will be decoded as SSL. If the services are running on the non-standard port, for example SSL standard port is 443 and the service is running on 4433, in this case the Decode-As feature can be used to decode this communication using the SSL protocol preference.
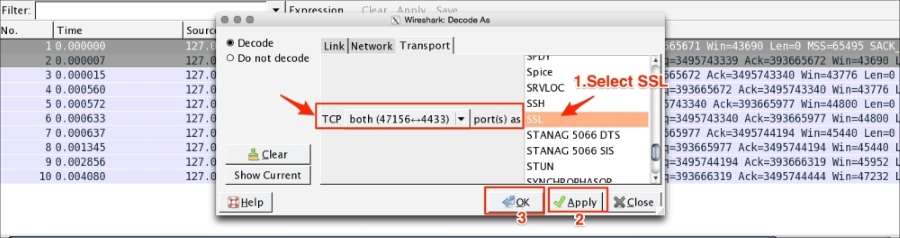
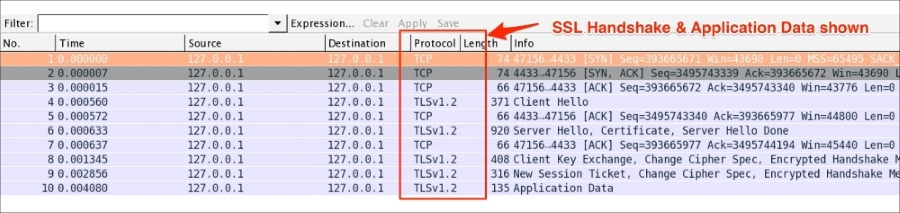
Open the sample https.pcap file from. HTTPS traffic is captured when the file is opened in Wireshark. It doesn't show SSL-related data; instead it just shows all TCP communications:
To decode this traffic as SSL, follow these steps:
The protocol preference feature provides the flexibility for you to customize how the Wireshark display is processed, and how packets are analyzed. You can set protocol preferences by one of the following methods:
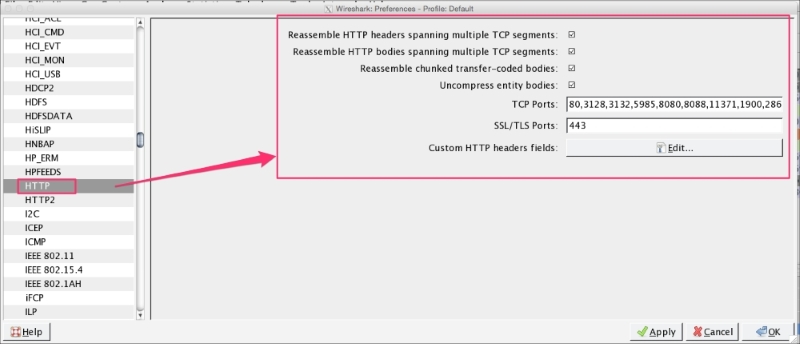
Wireshark supports a large set of protocols and it's preferences, for example HTTP protocol preferences and their meanings as defined in the following table:
|
HTTP protocol preferences |
What does this mean? |
|---|---|
|
Reassemble HTTP headers spanning multiple TCP segments |
HTTP dissector will reassemble the HTTP header if it has been transmitted over more than one TCP segment |
|
Reassemble HTTP bodies spanning multiple TCP segments |
HTTP dissector will reassemble the HTTP body if it has been transmitted over more than one TCP segment |
|
Reassemble chunked transfer-coded bodies |
Reassemble all chunks across the segments and add them to the payload |
|
Decompress entity bodies |
Used for the visualization of compressed data ( |
|
SSL/TLS ports |
Add/remove SSL/TLS ports (default is |
|
Custom HTTP header fields |
Define new header fields |
The following screenshot shows HTTP protocol preferences in Wireshark:
Refer to the example of finding the top HTTP response time in Chapter 05, Analyze the DHCP, DHCPv6, DNS, HTTP Protocols when using protocol preferences.
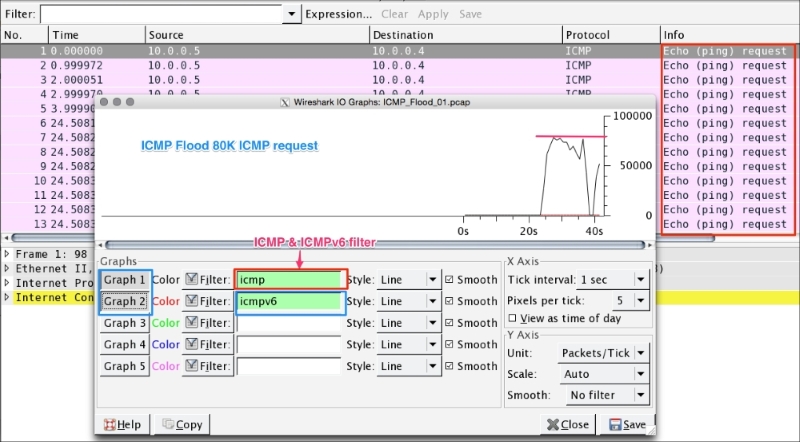
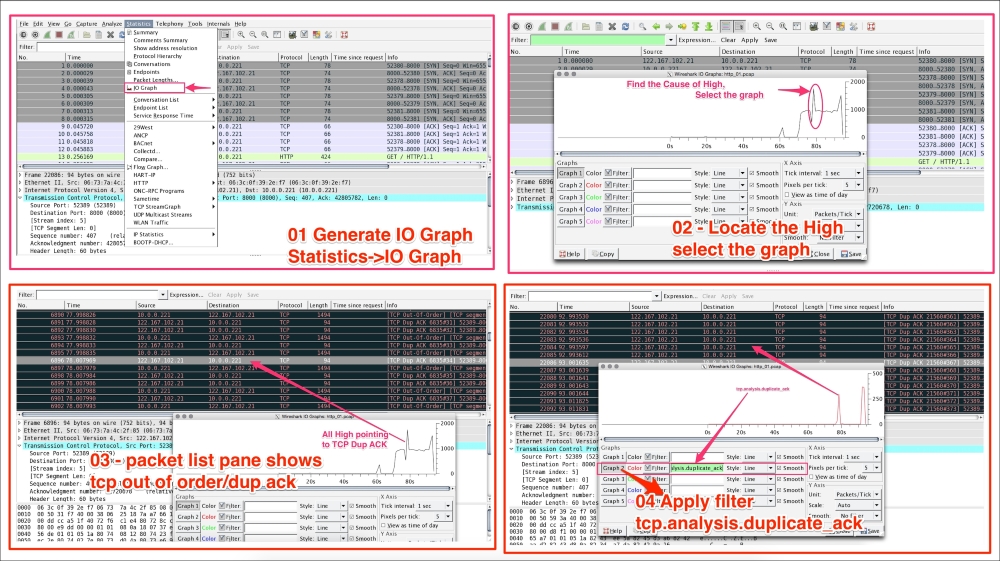
Use the IO graph to check client and server interaction data for a meaningful analysis. The Wireshark IO graph measures throughput (the rate is packet-per-tick), where each tick is one second. In this example we will see how to make use of the IO graph. Open the file http_01.pcap in Wireshark and follow the given steps:
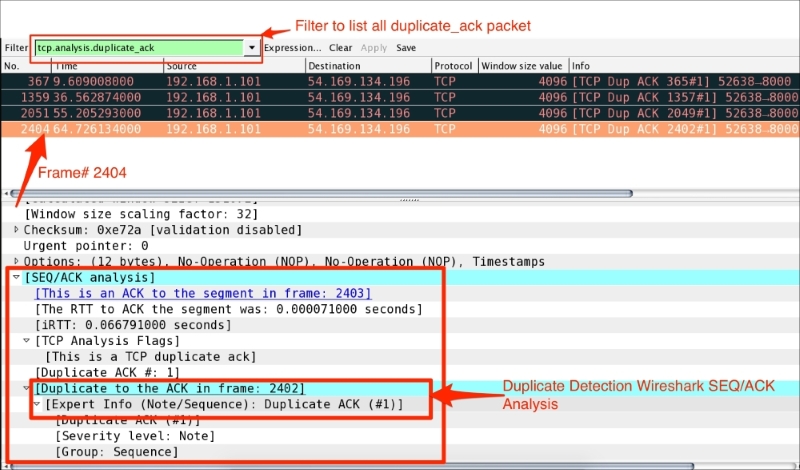
tcp.analysis.duplicate_ack.There are a lot of use cases for IO graphs. Some of them are as follows:
tcp, http, udp, ntp, and ldap.The following screenshots show the results of the preceding steps:
The TCP stream feature allows users to see the data from a TCP stream. Open the file http_01.pcap in Wireshark and follow the TCP stream to get the first HTTP OK, as shown:
In this example we have located the HTTP OK on packet#35 and then right clicked and selected Follow TCP Stream:
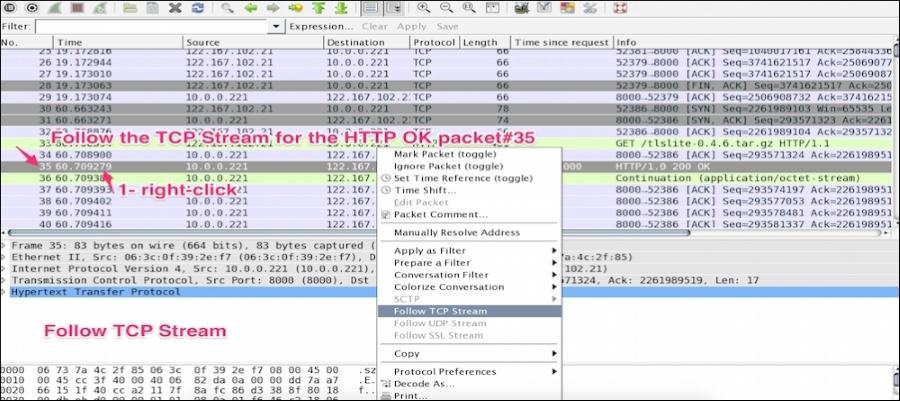
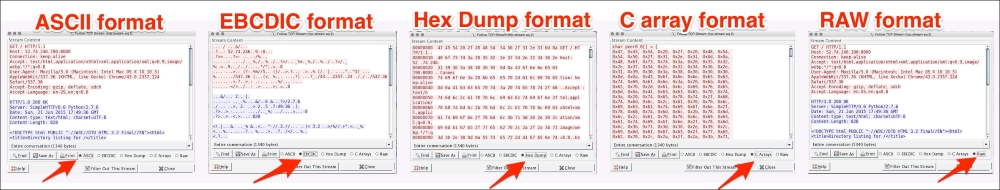
Once the stream is applied, a TCP stream dialog box will open displaying which request is sent and what response is received in this HTTP conversation:
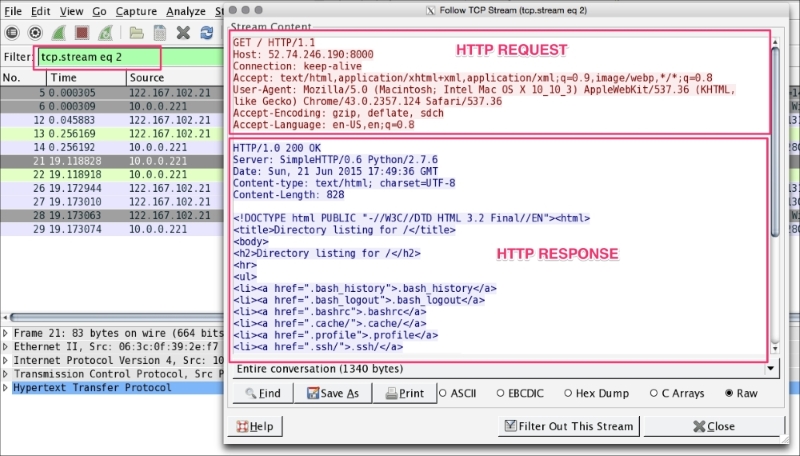
The stream content is available in six formats as shown; the red content in the screenshot is the request, the blue content in the screenshot is the response:
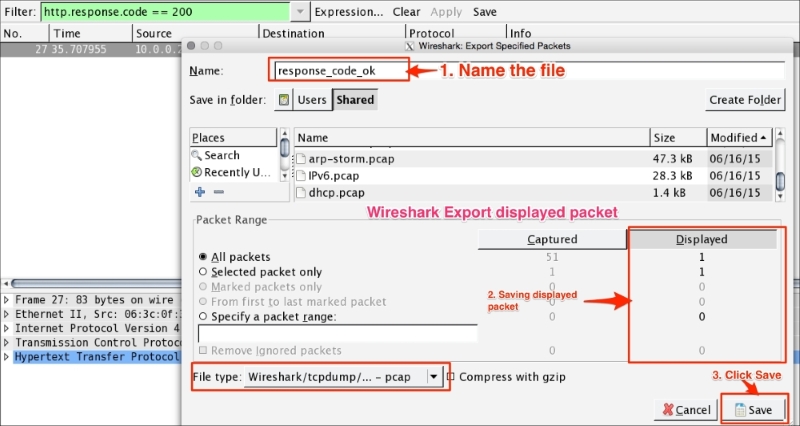
The Export Specified Packets feature allows you to export the filtered packet in different files. For example, open http.pcap in Wireshark and export the HTTP OK packet. The steps for exporting a specified packet are as follows:
http.response.code == 200 in the Filter bar: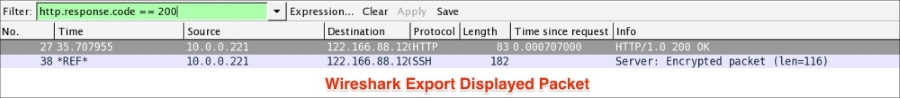
In production environments, packet-capturing tools such as Wireshark are usually not installed. In such scenarios, a default-capturing tool can be used such as tcpdump for (Linux systems) and snoop (the Solaris default); later the captured file can be used in Wireshark for analysis:
For example, the following table shows how to check packets from interfaces:
|
Description |
Solaris |
Linux |
|---|---|---|
|
How to check packets from all interfaces |
|
|
|
How to capture with hostname |
|
|
|
How to write the captured information to a file |
|
|
|
How to capture packets between |
|
|
|
How to capture traffic with verbose output to screen |
|
Very Verbose
|
|
|
| |
|
|
| |
|
How to capture the IPv6 traffic |
|
|
|
How to capture protocols |
|
|
You can also refer to the following links for more information on the topics covered in this chapter:
In this chapter we have learned how to use the Wireshark GUI. Then we explored what capture filters and display filters are, how to set up a capture, keeping performance in mind, and how to make use of other capturing tools such as tcpdump and snoop in production or in remote capturing. Then we learned about a few Wireshark features such as ACL rule generation, IO graph, Decode-As, exporting packets, and protocol preferences.
In the next chapter we will learn the TCP protocol and will discuss its practical use cases with a lab exercise that will help in troubleshooting common network problems (we will also provide the solution).
TCP is intended to be a host-to-host protocol in common use in multiple networks. In this chapter, we will analyze the TCP protocol in detail with lab exercises and examples.
This chapter covers the following topics:
Transmission Control Protocol (TCP) was first defined in RFC 675, and the v4 specification came out in RFC 793. TCP provides:
Each TCP segment has a 20-byte header with optional data values, as shown in the following screenshot displaying a TCP frame in the Wireshark Packet Details pane:
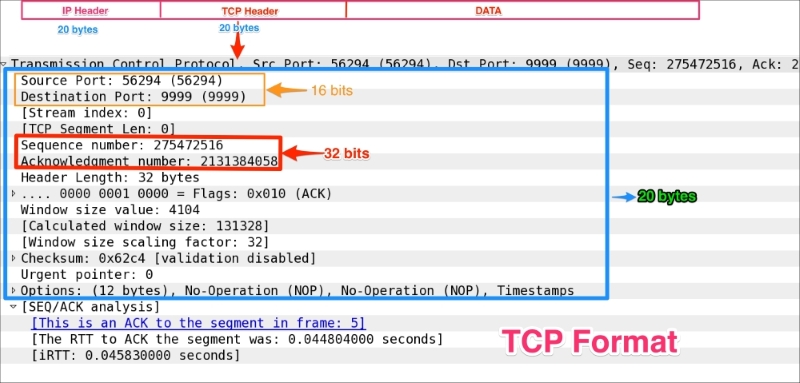
The following table describes the header fields and Wireshark filters along with their descriptions:
A connection progresses through a series of states during its lifetime. The states are:
In this section we will learn how the TCP opens and closes its connections. In order to establish a connection, the three-way handshake procedure is used as described in the following section.
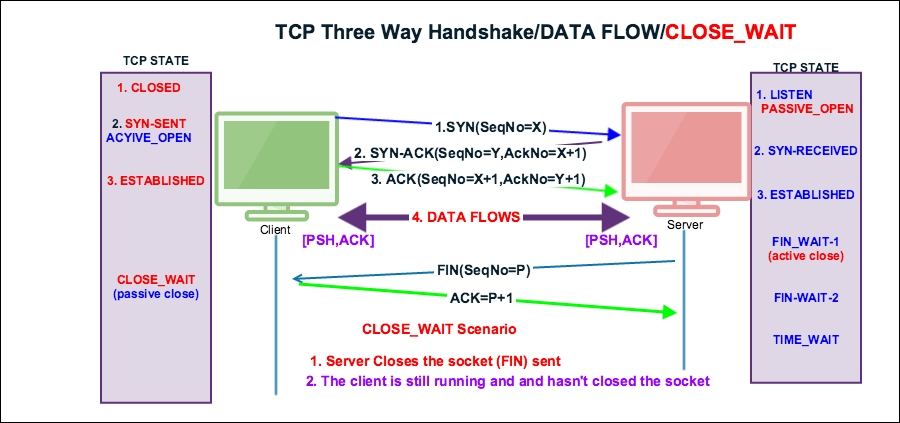
The three-way handshake is a connection establishment procedure from the client socket to the server socket, as shown in the following image:
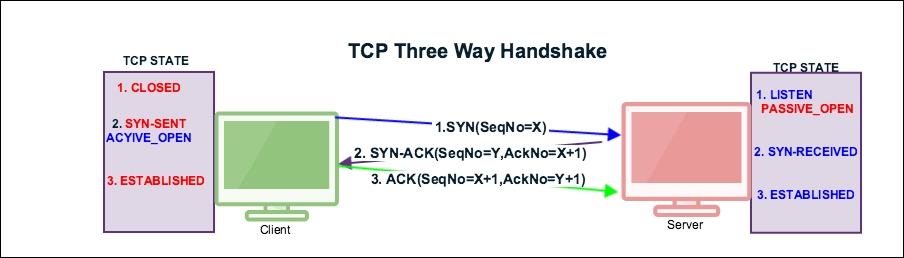
Before the start of the TCP three-way handshake, the client will be in the CLOSED state and the server will be in the LISTEN state as shown:
|
SN |
TCP-A (122.167.84.137) state |
Flow CTL |
TCP-B (10.0.0.221) state | ||
|
From |
To |
From |
To | ||
|
1 |
CLOSED |
CLOSED |
LISTEN | ||
The TCP state machine
To examine a three-way handshake in Wireshark, open the normal-connection.pcap file provided in the book.
The first step of the handshake process is that the socket client will construct a SYN packet and send it to the server. During this process the socket client will perform the following tasks:
tcp.flags.syn is set to 1 and its SYN packet is sent by the client.tcp.seq=3613047129 the initial sequence number (ISN). Wireshark shows, by default, relative sequence numbers; a user can change this setting under: Edit | Preferences | Protocols | TCP | Relative sequence numbers.tcp.ack =0.tcp.window_size is advertised to the server and its value is in the packet tcp.window_size_value == 65535, which tells it that it can transmit up to 65535 bytes of data depending on MSS. For example if MSS is 1440 bytes, the client can transmit 45 segments.tcp.options such as Maximum Segment Size (MSS), No-Operation (NOP), window scale, timestamps, and SACK permitted.tcp.options.sack_perm == 1 in the "selective acknowledgements" processing.tcp.options.timestamp.tsval == 123648340.The following table depicts the state transition of the first handshake message:
|
Sr. No. |
TCP-A (122.167.84.137) state |
Flow CTL |
TCP-B (10.0.0.221) state | ||
|
From |
To |
From |
To | ||
|
1 |
CLOSED |
CLOSED |
LISTEN | ||
|
2 |
CLOSED |
SYN_SENT |
<SEQ=3613047129><CTL=SYN> |
LISTEN | |
TCP state machine changes SYN_SENT
In this process the server responds to the client's SYN:
tcp.flags.syn =1 and tcp.flags.ack=1, confirming that the SYN has been accepted.tcp.seq=2581725269.tcp.ack=3613047130 as the client tcp.seq+1.tcp.window_size_value == 26847 as the server window size.tcp.options and responds to the client.The following table depicts the state transitions of the second handshake message:
|
Sr. No. |
TCP-A (122.167.84.137) state |
Flow CTL |
TCP-B (10.0.0.221) state | ||
|
From |
To |
From |
To | ||
|
1 |
CLOSED |
CLOSED |
LISTEN | ||
|
2 |
CLOSED |
SYN_SENT |
<SEQ=3613047129><CTL=SYN> |
LISTEN | |
|
3 |
SYN_SENT |
<SEQ=2581725269><ACK=3613047130><CTL=SYN,ACK> |
LISTEN |
SYN-RECEIVED | |
TCP state machine changes when SYN-RECEIVED is sent by the server
After successfully exchanging this message, the TCP connection will be established in this connection:
tcp.flags.ack == 1 and sends to the server.tcp.seq=3613047130 is ISN+1 and tcp.ack=2581725270 is SYN_ACK( tcp.seq+1).tcp.window_size_value == 4105.The following table depicts the state transitions of the third handshake message:
|
Sr. No. |
TCP-A (122.167.84.137) state |
Flow CTL |
TCP-B (10.0.0.221) state | ||
|
From |
To |
From |
To | ||
|
1 |
CLOSED |
CLOSED |
LISTEN | ||
|
2 |
CLOSED |
SYN_SENT |
<SEQ=3613047129><CTL=SYN> |
LISTEN | |
|
3 |
SYN_SENT |
<SEQ=2581725269><ACK=3613047130><CTL=SYN,ACK> |
LISTEN |
SYN-RECEIVED | |
|
4 |
SYN_SENT |
ESTABLISHED |
<SEQ=3613047130>><ACK=2581725270><CTL=ACK> |
SYN-RECEIVED |
ESTABLISHED |
TCP state machine when the client sends ACK
Once the three-way connection is established, the data is communicated by exchanging the segments and the PUSH flag is set to indicate that the data flows on a connection as a stream of octets, as shown in the following figure:
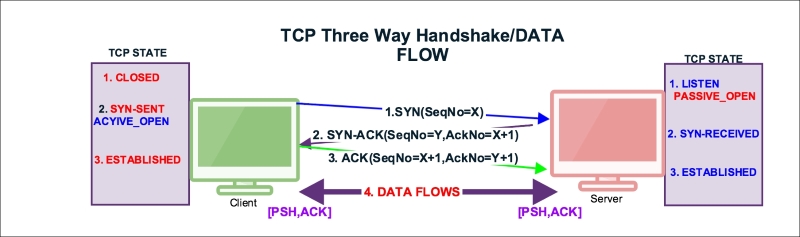
Select packet#4 from the normal-connection.pcap file as shown in the following screenshot; expand the TCP section in the Packet Details pane:
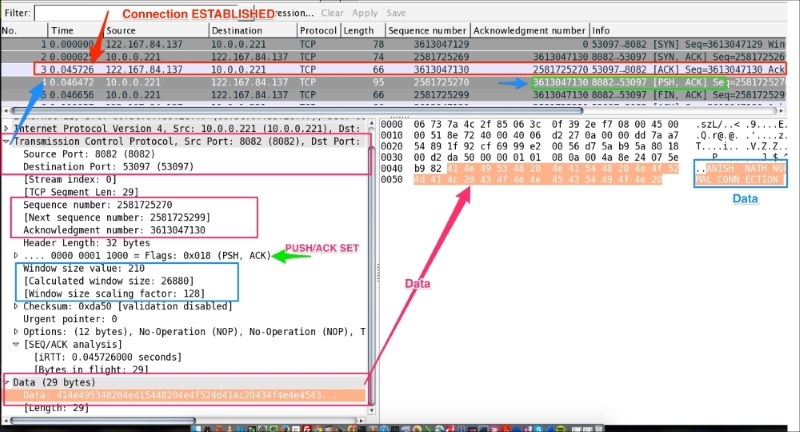
As you can see in the preceding screenshot:
tcp.flags.push = 1.tcp.flags.ack =1.414e495348204e415448204e4f524d414c20434f4e4e4543....(tcp.flags.ack == 1) && (tcp.flags.push == 1); that is, the [PSH,ACK] flag indicates that the host is acknowledging receipt of some previous data and also transmitting some more data.The useful Wireshark display filters are:
data: Displays the packet that contains the data information, for all IPs: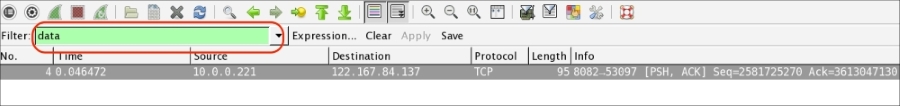
data && ip.addr==10.0.0.221: Displays a list of packets that have data and are exchanged with the given IP addresstcp.flags.push == 1: Displays all PUSH packetstcp.flags.push == 1 && ip.addr==10.0.0.221: Displays PUSH packets between hoststcp.flags == 0x0018: Display all PSH, ACK packetstcp.flags == 0x0011: Displays all FIN, ACK packetstcp.flags == 0x0010: Displays all ACK packetsTCP normal close appears when the client or server decides that all data has been sent to the receiver and we can close the connection. There are three ways a TCP connection is closed:
FIN packet to the serverFIN packet to the client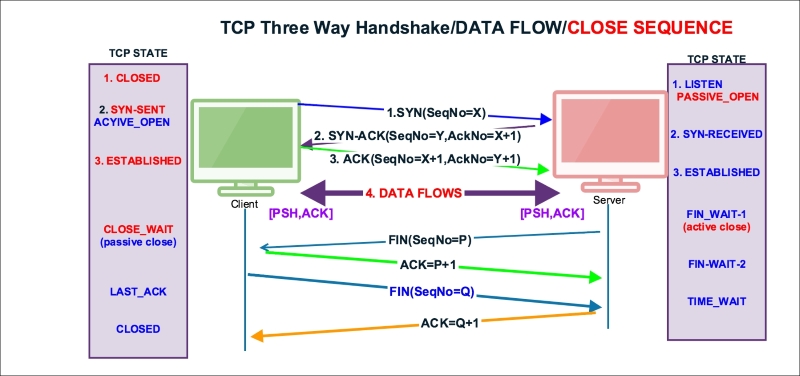
Open the normal-connection.pcap file and select packet #5 in the Packet List pane. Go to the Wireshark Packet Details pane, as shown in the screenshot, and examine the TCP protocol.
In Wireshark add the Sequence number and Acknowledgement number to the column. To add the sequence number and acknowledgement number, choose the TCP header packet, right-click on the field (Sequence number / Acknowledgement number) in the packet details and select Display as Column. Or implement these settings to add a new column:
The server has initiated the FIN packet. When the data transfer is completed, see packet#5 in the following screenshot:
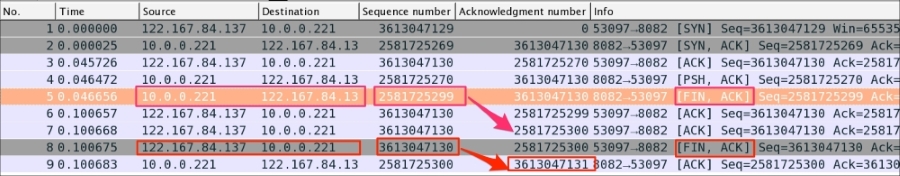
As you can see in the preceding screenshot:
FIN packet to close the connection in packet#5[FIN,ACK] (tcp.flags.fin == 1) && (tcp.flags.ack == 1) and sends it to the clienttcp.seq == 2581725299 is acknowledged in packet#7FIN to close the connection in packet#8[FIN,ACK] (tcp.flags.fin == 1) && (tcp.flags.ack == 1) and sends it to the servertcp.seq == 3613047130 is acknowledged in packet#9The TCP state machine when the server and client close the socket connection, server initiated FIN:
|
Sr. No. |
TCP-A (122.167.84.137) state |
Flow CTL |
TCP-B (10.0.0.221) state | ||
|
From |
To |
From |
To | ||
|
1 |
CLOSED |
CLOSED |
LISTEN | ||
|
2 |
CLOSED |
SYN_SENT |
<SEQ=3613047129><CTL=SYN> |
LISTEN | |
|
3 |
SYN_SENT |
<SEQ=2581725269><ACK=3613047130><CTL=SYN,ACK> |
LISTEN |
SYN-RECEIVED | |
|
4 |
SYN_SENT |
ESTABLISHED |
SEQ=3613047130>><ACK=2581725270><CTL=ACK> |
SYN-RECEIVED |
ESTABLISHED |
|
5 |
ESTABLISHED |
ESTABLISHED |
<SEQ=3613047130>><ACK=2581725270><CTL=PSH,ACK> |
ESTABLISHED |
ESTABLISHED |
|
6 |
ESTABLISHED |
ESTABLISHED |
<SEQ=3613047130>><ACK=2581725299><CTL=ACK> |
ESTABLISHED |
ESTABLISHED |
|
7 |
ESTABLISHED |
ESTABLISHED |
<SEQ=2581725299>><ACK=3613047130><CTL=FIN.ACK> |
ESTABLISED |
FIN_WAIT-1 |
|
8 |
ESTABLISHED |
CLOSE_WAIT |
<SEQ=3613047130>><ACK=2581725300><CTL=ACK> |
FIN_WAIT-1 |
FIN_WAIT-2 |
|
9 |
CLOSE_WAIT |
LAST_ACK |
SEQ=3613047130>><ACK=2581725300><CTL=FIN.ACK> |
FIN_WAIT-2 |
TIME_WAIT |
|
10 |
LAST_ACK |
CLOSED |
TIME_WAIT |
CLOSED | |
Wireshark filters used in this scenario are as follows:
tcp.analysis:SEQ/ACK: Provides links to the segments of the matching sequence/ack numberstcp.connection.fin: Provides expert informationtcp.flags == 0x0011: Displays all the [FIN,ACK] packetsThe steps to capture the normal TCP connection flow (a sample program is provided as part of this book) are as follows:
tcp.port==8082.TCPServer01.java using the javac command:
bash$ ~ javac TCPServer01.java
TCPServer01 using the java command:
bash$ ~ java TCPServer01
8082:bash$ ~ netstat -an | grep 8082 tcp46 0 0 *.8082 *.* LISTEN
Client0301.java using the javac command:
bash$ ~ javac Client0301.java
bash$ ~ java Client0301
In this section we will learn about different network problems that occur and try to analyze and solve them with lab exercises. Let's start with the Reset (RST) packet.
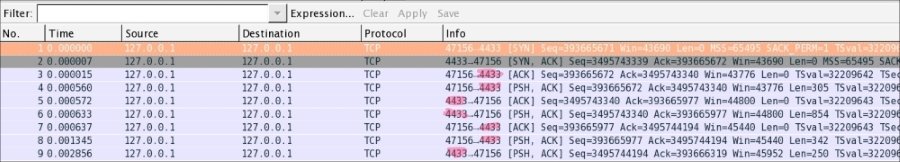
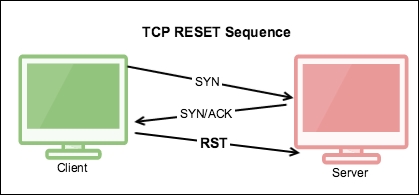
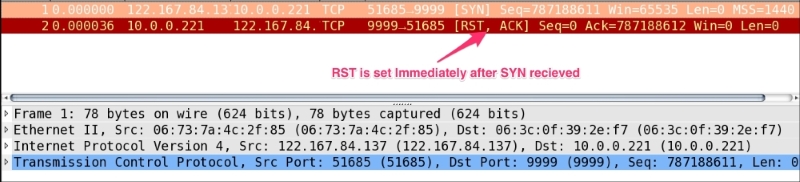
The TCP RST flag resets the connection. It indicates that the receiver should delete the connection. The receiver deletes the connection based on the sequence number and header information. If a connection doesn't exist on the receiver RST is set, and it can come at any time during the TCP connection lifecycle due to abnormal behavior. Let's take one example: a RST packet is sent after receiving SYN/ACK, as shown in the next image.
In this example we will see why RST has been set after SYN-ACK instead of ACK:
Open the RST-01.pcap file in the Wireshark:
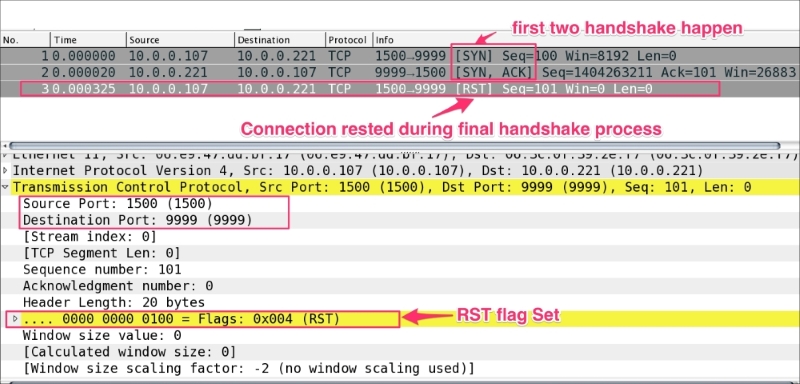
As you can see in the preceding figure:
RST packet should not be seen normallyRST is set after the first two handshakes are complete. A possible explanation could be one of the following:This is the most common use case. Open the RST-02-ServerSocket-CLOSED.pcap file in Wireshark. In this example the server was not started, the client attempted to make a connection, and the connection refused an RST packet:
The steps to generate the RST flag in a generic scenario, when the server is not in the listening state, are as follows:
tcp.port==8082.Client0301.java:
bash$ ~ javac Client0301.java
bash$ ~ java Client0301
RST packet in Wireshark.Often a connection is stuck in the CLOSE_WAIT state. This scenario typically occurs when the receiver is waiting for a connection termination request from the peer.
To demonstrate the
CLOSE_WAIT state, open the close_wait.pcap file in Wireshark:
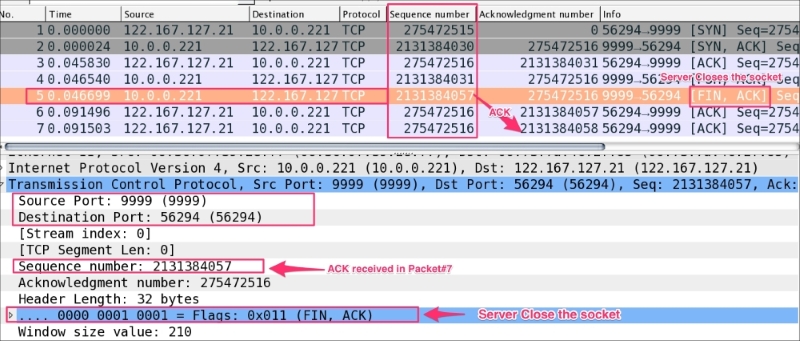
As you can see in the preceding screenshot:
tcp.flags.fin == 1, and set tcp.seq == 2131384057.ACK packet tcp.ack == 2131384058 in packet#7 and didn't close its socket, which remains in the CLOSE_WAIT state.
CLOSE_WAIT means there is something wrong with the application code, and in the high-traffic environment if CLOSE_WAIT keeps increasing, it can make your application process slow and can crash it.
The steps to reproduce CLOSE_WAIT are as follows:
tcp.port==9999.Server0302.java and Client0302.java using the javac command:
bash$ ~ javac Server0302.java Client0302.java
Server0302 using the java command:
bash$ ~ java TCPServer01
9999:bash $ netstat -an | grep 999 tcp46 0 0 *.9999 *.* LISTEN
bash$ ~ java Client0302
CLOSE_WAIT state:bash $ netstat -an | grep CLOSE_WAIT tcp4 0 0 127.0.0.1.56960 127.0.0.1.9999 CLOSE_WAIT
CLOSE_WAIT, a restart is required for the process.FIN packet from both the client and server is required to solve the CLOSE_WAIT problem. Close the client socket and server socket when done with processing the record:
socket.close(); à Initiates the FIN flow
Client0302.java file and close the socket:Socket socket = new Socket(InetAddress.getByName("localhost"), 9999); … socket.close(); … Thread.sleep(Integer.MAX_VALUE);
CLOSE_WAIT will not be visible.The main purpose of the
TIME_WAIT state is to close a connection gracefully, when one of ends sits in LAST_ACK or CLOSING retransmitting FIN and one or more of our ACK are lost.
RFC 1122: "When a connection is closed actively, it MUST linger in TIME-WAIT state for a time 2xMSL (Maximum Segment Lifetime). However, it MAY accept a new SYN from the remote TCP to reopen the connection directly from TIME-WAIT state, if..."
We ignore the conditions because we are in the TIME_WAIT state anyway.
Until now we have been troubleshooting connection-related issues. In this section, we will check the latency part. Latency can be on the network, or in application processing on the part of the client or server.
Identifying the source of latency also plays an important role in TCP troubleshooting. Let's see what the common causes of latency are:
ping utility/etc/sysctl.cnf fileVarious network utility tools are available to measure the latency between networks—for example traceroute, tcpping, and ping.
ping: This utility can be used to measure the round trip time (RTT):bash$ ping -c4 google.com PING google.com (216.58.196.110): 56 data bytes 64 bytes from 216.58.196.110: icmp_seq=0 ttl=55 time=226.034 ms 64 bytes from 216.58.196.110: icmp_seq=1 ttl=55 time=207.748 ms 64 bytes from 216.58.196.110: icmp_seq=2 ttl=55 time=222.995 ms 64 bytes from 216.58.196.110: icmp_seq=3 ttl=55 time=162.507 ms --- google.com ping statistics --- 4 packets transmitted, 4 packets received, 0.0% packet loss round-trip min/avg/max/stddev = 162.507/204.821/226.034/25.394 ms
traceroute: This is used to identify the number of HOPS it has taken to reach the destination—the fewer the hops, the lower the latencyWireshark can be used effectively to identify whether the network is slow or the application is slow. Open the slow_download.pcap file in Wireshark, and investigate the root cause of why the download is slow.
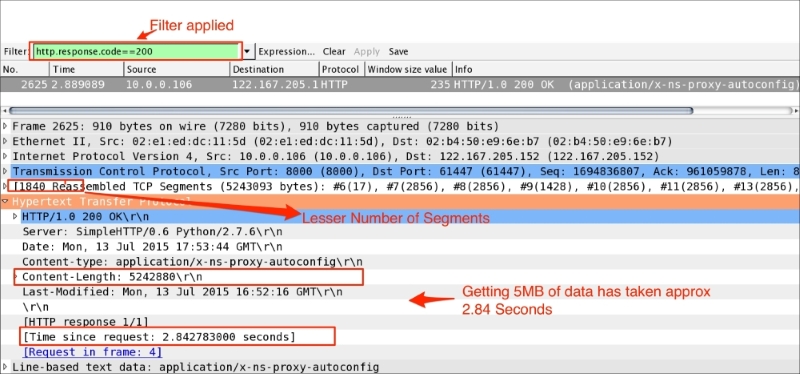
In this example, 5 MB of data is requested from the HTTP server, and it has taken approx. 4.99 minutes to download, as shown:
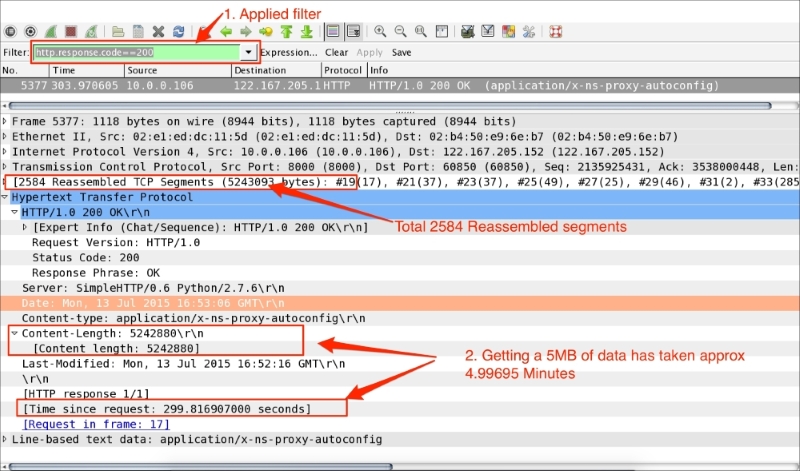
The steps to diagnose this issue are as follows:
http.response.code==200.http.time == 299.816907000 to approximately 4.99 minutes.http.content_length_header == "5242880"; this is the size of the content.tcp.segment.count == 2584—and ask yourself whether so many are needed and whether the number can be reduced.window_size for the client and server to check what was advertised by the client and what got used.tcp.window_size_value in the Wireshark column and sort in ascending order. Note that the entire packet flow from the server (10.0.0.16) to the client (122.167.205.152) has a window size of 100.sysctl.conf file in UNIX-flavored systems and check the TCP tuning parameters such as net.core.rmem_max, net.core.wmem_max, net.ipv4.tcp_rmem, and net.ipv4.tcp_wmemnet.ipv4.tcp_mem.In this scenario, tcp.window_size was reduced in the sysctl.conf file to demonstrate the slow_download behavior and to give an insight into troubleshooting. After fixing Window_Size, the same download is reduced from 299.816907000 to 2.84 seconds. Open the fast_download.pcap file as shown in the following screenshot; the download time is reduced:
In this example, the TCP handshake process will be used to identify wire latency. Open the slow_client_ack.pcap file as shown in the following screenshot:
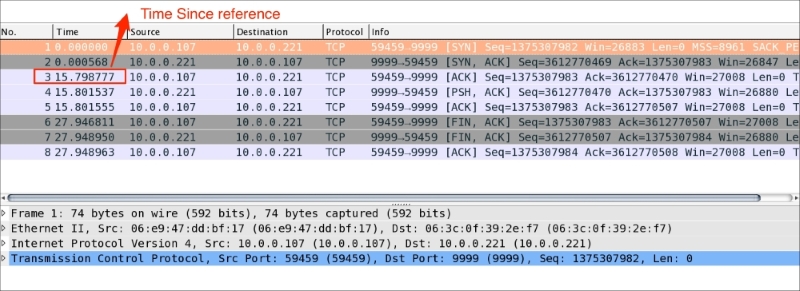
As you can see in the preceding screenshot:
SYN, SYN-ACK) sent by the client/server over the wire are exchanged in less timeACK sent by the client has taken frame.time_relative == 15.798777000 seconds and shows an increase in Time Since Reference. This is higher than the first two handshake messages, which confirms a wire latency on this packetWireshark has a built-in filter, tcp.analysys.flags, that will show you packets that have some kind of expert message from Wireshark; tcp.analysis.flags is shown in the TCP section of the Packet Details pane. Under that, expand SEQ/ACK analysis then expand TCP Analysis Flags. This will tell you exactly what triggered tcp.analysis.flags. A few examples include:
TCP makes the transmission of segments reliable via sequence number and acknowledgement. When TCP transmits a segment containing data, it puts a copy on a retransmission queue and starts a timer; when the acknowledgment for that data is received, the segment is deleted from the queue. If the acknowledgment is not received before the timer runs out, the segment is retransmitted. During TCP retransmission, the sequence number is not changed until the retransmission timeout happens.
Open the example tcp-retransmission.pcapng in Wireshark and add a Sequence number column, as shown in the following screenshot:
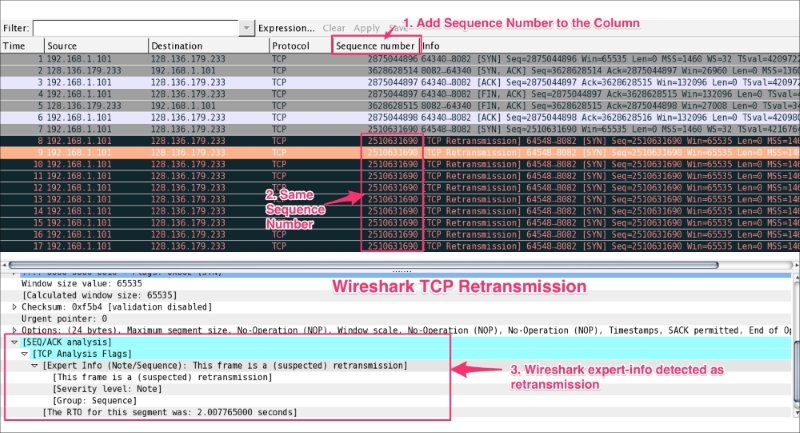
As you can see in the preceding screenshot:
tcp.seq == 1870089183 a lot of TCP retransmission occursFor another example, open the file syn_sent_timeout_SSH.pcapng in Wireshark, and observe the TCP retransmission flow.
The steps to reproduce the TCP retransmission are as follows (this lab is performed in CentOs6 using the telnet and nc command utilities):
[bash ~]# iptables -A OUTPUT -p tcp --dport 8082 -j DROP [bash ~]# iptables save [bash ~]# nc -l 8082
tcp.port==8082.
[bash ~]telnet 128.136.179.233 8082
bash$ netstat -an | grep 8082 tcp4 0 0 192.168.1.101.64658 128.136.179.233.8082 SYN_SENT
In order to solve operation timeouts, verify the ACL configuration; it allows the incoming packet from the source IP.
Open the tcp_zero_window.pcapng file in Wireshark and add tcp.window_size_value to the column.
The TCP window size represents how much data a device can handle from its peer at one time before it is passed to the application process.
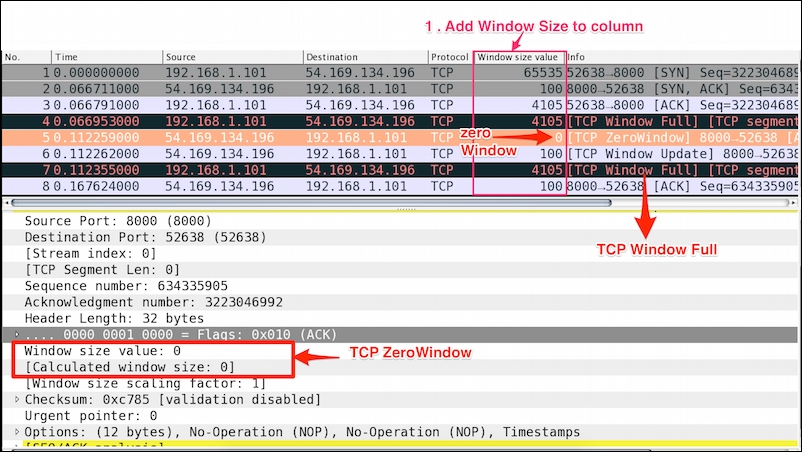
As shown in the preceding screenshot:
window_size to the Wireshark column and look for the packet where tcp.window_size=0.tcp.window_size_value is set to 0 and tcp.window_size == 0.Troubleshoot the ZeroWindow condition:
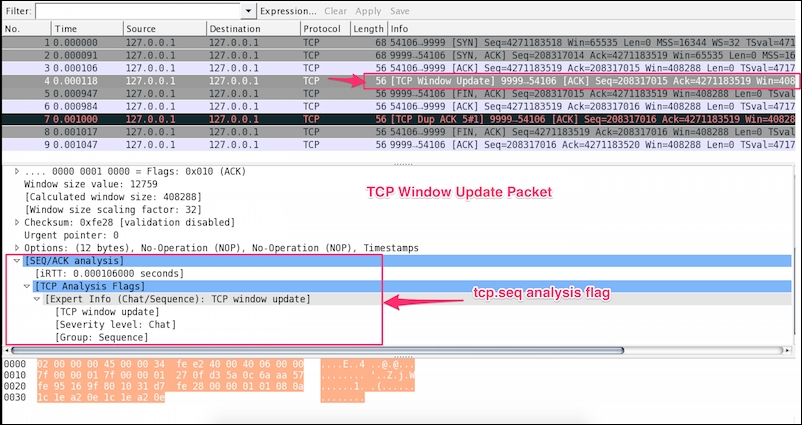
Wireshark marks a packet as Window Update when the window size has changed. A Window Update is an ACK packet, and only expands the window; this is normal TCP behavior.
Open the tcp_window_update.pcap file in Wireshark and observe that a TCP Window Update event is set, as shown:
The following references will be useful while working with TCP/IP not limited:
In this chapter you have learnt how the TCP opens and closes its connection, and how TCP states are maintained during this period. This chapter also covered error patterns seen on networks and how to troubleshoot those scenarios.
In the next chapter we will implement deep-packet inspections of the SSL protocol.
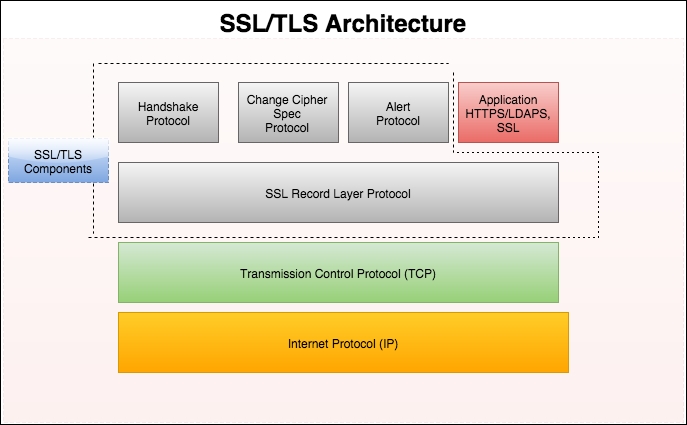
In this chapter we will learn what SSL/TLS is used for, how the entire handshake process happens, and about the common areas where the SSL/TLS handshake fails, by covering the following topics:
Transport Layer Security (TLS) is the new name for Secure Socket Layer (SSL). It provides a secure transport connection between applications with the following benefits:
Knowing the versions is extremely important while debugging handshake issues, as most handshake failures happen in this process.
Netscape developed the original SSL versions and other versions; their RFC numbers are shown in the following table:
|
Protocol |
Year |
RFC |
Deprecated |
|---|---|---|---|
|
SSL 1.0 |
N/A |
N/A |
N/A |
|
SSL 2.0 |
1995 |
NA |
Y RFC 6176 |
|
SSL 3.0 |
1996 |
RFC 6101 |
Y RFC 7568 |
|
TLS 1.0 |
1999 |
RFC 2246 |
N |
|
TLS 1.1 |
2006 |
RFC 4346 |
N |
|
TLS 1.2 |
2008 |
RFC 5246 |
N |
|
TLS 1.3 |
TBD |
DRAFT |
N |
The TLS Handshake Protocol is responsible for the authentication and key exchange necessary to establish or resume a secure session. Handshake Protocol manages the following:
There are ten types of message, as shown in the following table, and their corresponding Wireshark filters. This is a one-byte field in the Handshake Protocol:
|
Type |
Protocol |
Message |
Wireshark content type |
Wireshark filter |
|---|---|---|---|---|
|
0 |
Handshake |
Hello request |
|
|
|
1 |
Client Hello |
| ||
|
2 |
Server Hello |
| ||
|
11 |
Certificate |
| ||
|
12 |
ServerKeyExchange |
| ||
|
13 |
CertificateRequest |
| ||
|
14 |
ServerHelloDone |
| ||
|
15 |
Certificate Verify |
| ||
|
16 |
Client Key Exchange |
| ||
|
20 |
Finished |
| ||
|
ChangeCipherSpec |
| |||
|
Application Data |
| |||
|
Alert Protocol |
|
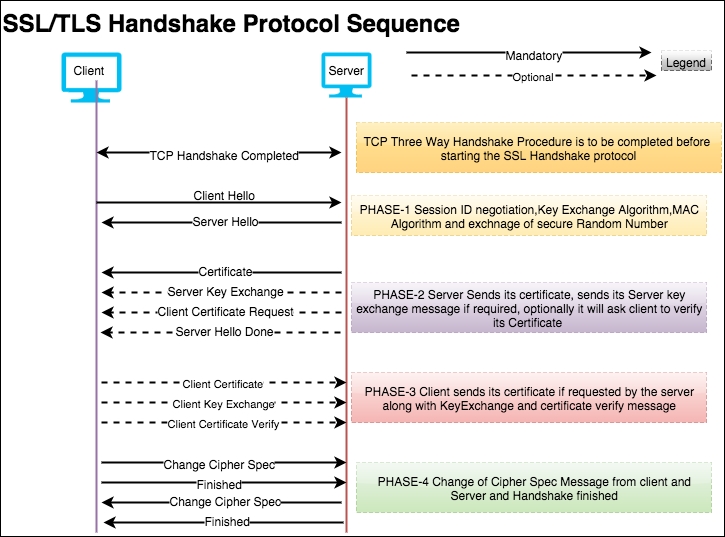
The TLS Handshake Protocol involves the following steps in four phases; the prerequisite is that a TCP connection should be established:
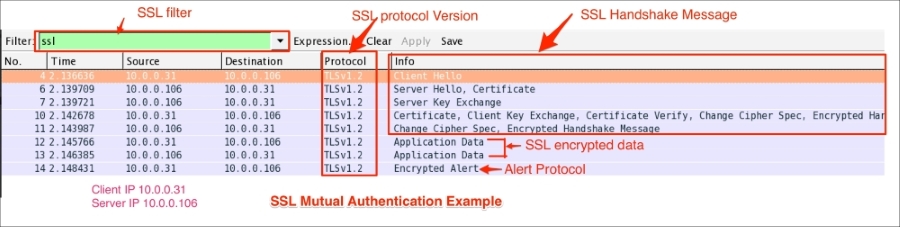
Open the file two-way-handshake.pcap, which is an example demonstrating a SSL mutual authentication procedure:
The TLS handshake starts with the Client Hello message (ssl.handshake.type == 1), as shown in the following screenshot:
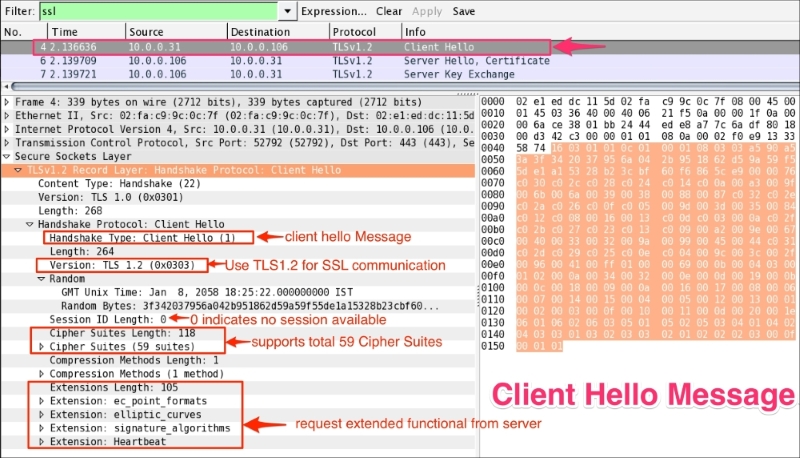
Handshake records are identified as hex byte 0x16=22. The structure of the Client Hello message is as follows:
0x01.0x0303 means it's TLS 1.2; note 0x300 =SSL3.0.0x00 shows the session ID as empty; this means no session is available and generates new security parameters.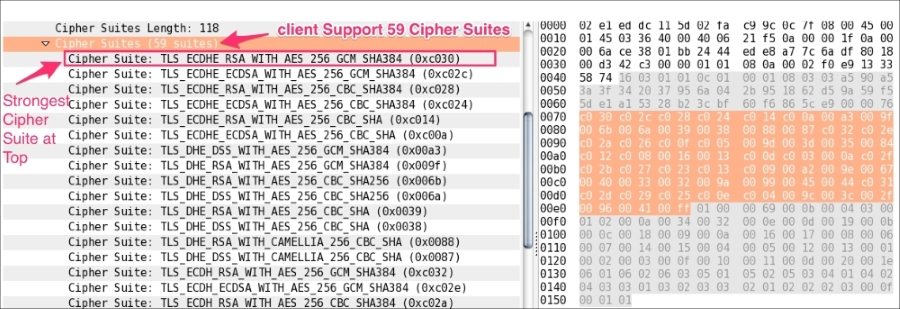
|
Value |
Extension name |
Reference |
|---|---|---|
|
0 |
|
RFC4492 |
|
1 |
|
RFC4492 |
|
3 |
|
RFC 5246 |
|
5 |
|
RFC 6520 |
For a complete list of TLS extensions, visit: http://www.iana.org/assignments/tls-extensiontype-values/tls-extensiontype-values.xhtml.
The server will send the Server Hello message (ssl.handshake.type == 2) in response to the Client Hello, as shown in the following screenshot. The message structure of the Client Hello and Server Hello message is the same, with one difference—the server can select only one cipher suite:
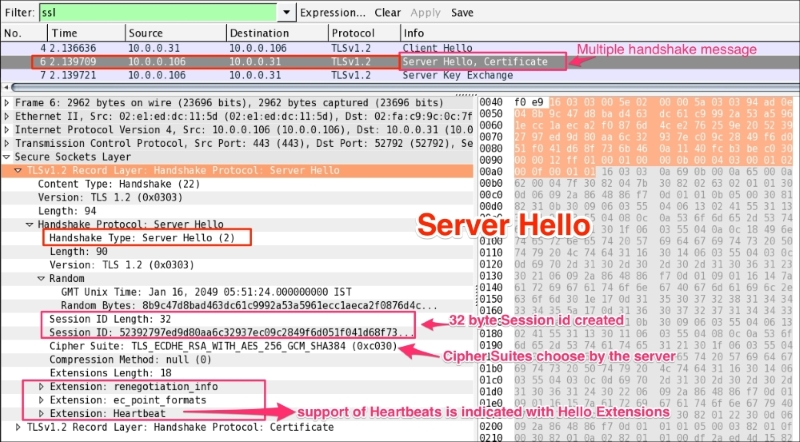
Handshake records are identified as hex byte 0x16=22. The structure of the Server Hello message is:
0x02=2 shows the Server Hello message0x0303 shows TLS 1.2 has been accepted by the server|
Server/client |
SSLv2 |
SSLv3 |
SSLv23 |
TLSv1 |
TLSv1.1 |
TLSv1.2 |
|---|---|---|---|---|---|---|
|
SSLv2 |
Y |
N |
Y |
N |
N |
N |
|
SSLv3 |
N |
Y |
Y |
N |
N |
N |
|
SSLv23 |
N |
Y |
Y |
Y |
Y |
Y |
|
TLSv1 |
N |
N |
Y |
Y |
N |
N |
|
TLSv1.1 |
N |
N |
Y |
N |
Y |
N |
|
TLSv1.2 |
N |
N |
Y |
N |
N |
Y |
The following table shows which SSL version of the client can connect to which SSL version of the server:
Cipher Suite: TLS_ECDHE_RSA_WITH_AES_256_GCM_SHA384 (0xc030), which means use Elliptic curve Diffie-Hellman (ECDHE) key exchange, RSA for authentication, Block cipher Galois/Counter Mode (GCM), AES-256 for encryption, and SHA-384 for digestsAfter the Server Hello message is sent, the server should send a X.509 server certificate (ssl.handshake.type == 11). The certificate configured on the server are signed by the CA or intermediate CA, or can be self-signed based on your deployment:
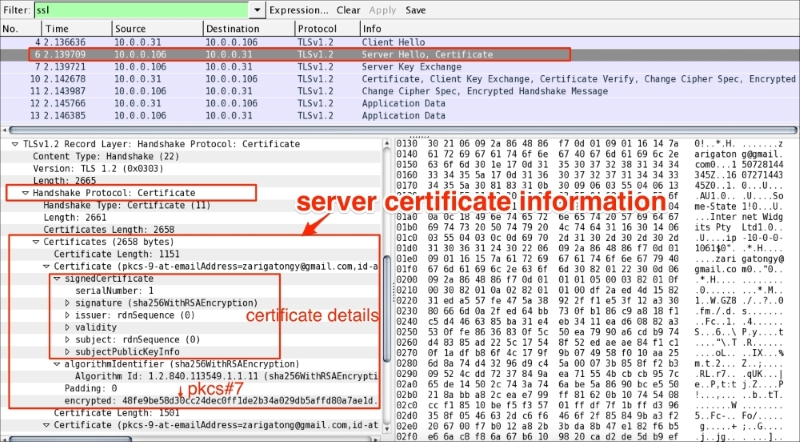
If a SSL/TLS server is configured with the certificate chain then the entire chain will be presented to the client along with the server certificate. The client (a browser or any other SSL/TLS client) can then check the highest certificate in the chain with stored CA certificates; typically, modern Web browsers have the root CA installed from the trusted CA provider.
The given certificate is signed with the relevant signature (sha256WithRSAEncryption); in this case, the hash value itself is concatenated into the OID (Algorithm Id: 1.2.840.113549.1.1.11) representing the signing algorithm. The certificate follows the DER encoding format and when encrypted becomes PKCS#7, the Cryptographic Message Syntax Standard (refer to RFC 2315).
From RFC #5246, the server sends the Server Key Exchange message (ssl.handshake.type == 12) only when the Server Certificate message (if sent) does not contain enough data to allow the client to exchange a premaster secret:
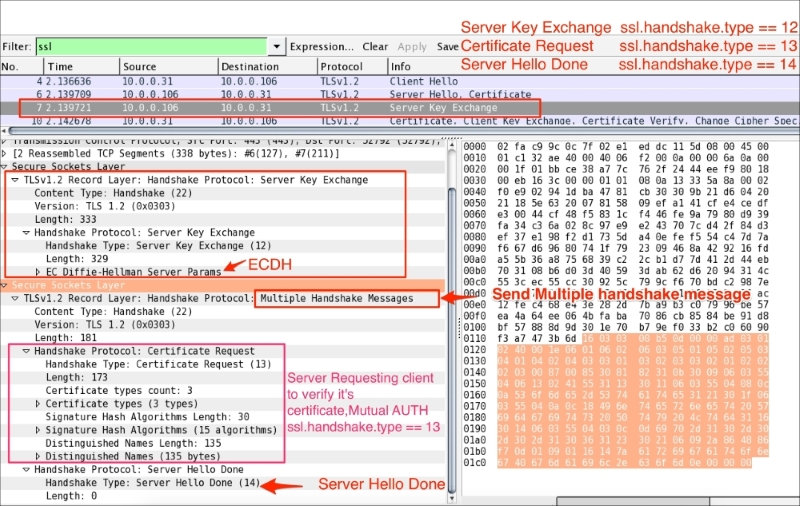
As you can see in the preceding screenshot:
DHE_DSS, DHE_RSA,DH_anonRSA, DH_DSS, DH_RSAThe server can optionally ask client to verify its certificate. To support mutual authentication, the server will send the certificate request message (ssl.handshake.type == 13) to the client and the client must provide its certificate information to the server. If the client fails to provide it, an Alert protocol will be generated and the connection will terminate.
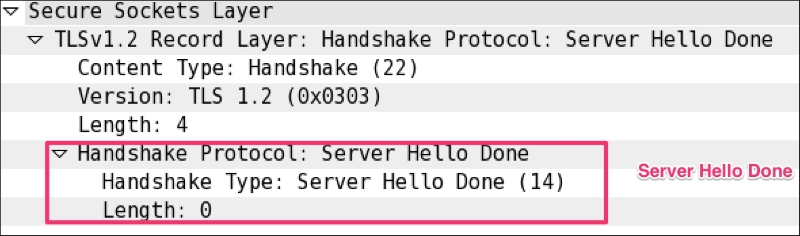
The Server Hello Done message means that the server is done sending messages to support the key exchange, and the client can proceed with its phase of the key exchange:
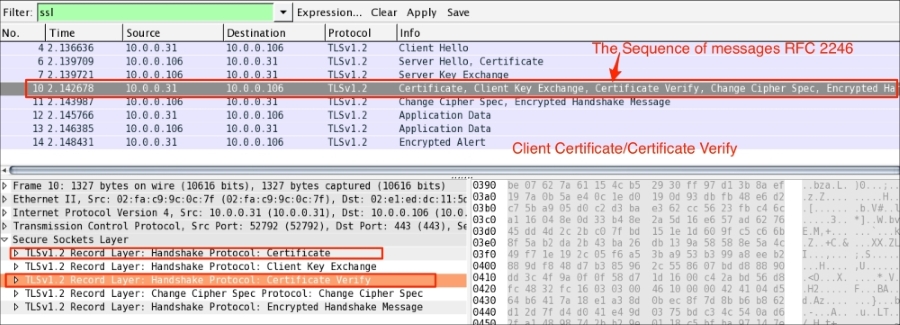
The client will send its certificate (ssl.handshake.type == 11) only in a mutual authentication condition. The server will verify the certificate in its CA chain. If the server fails to verify client_certificate, the server will raise an alert fatal protocol and communication will stop:
In the case of the normal handshake process (one way auth), the Client Key Exchange message is the first message sent by the client after it receives the Server Hello Done message.
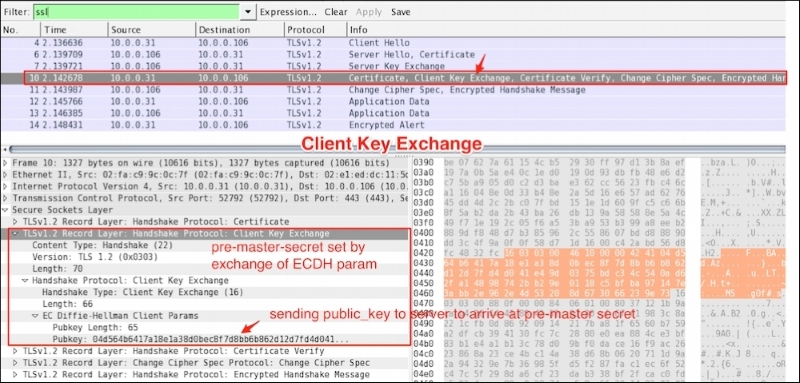
This Client Key Exchange message (ssl.handshake.type == 16) will always be sent by the client. When this message is seen, pre_master_secret is set, either by transmission of the RSA-encrypted secret or by the Diffie-Hellman parameters, depending on the key exchange method chosen. The server uses its private key to decrypt premaster_secret:
The Client Certificate Verify message will be sent after the Client Key Exchange message (ssl.handshake.type == 16) using master_secret generated by pre_master_secret.
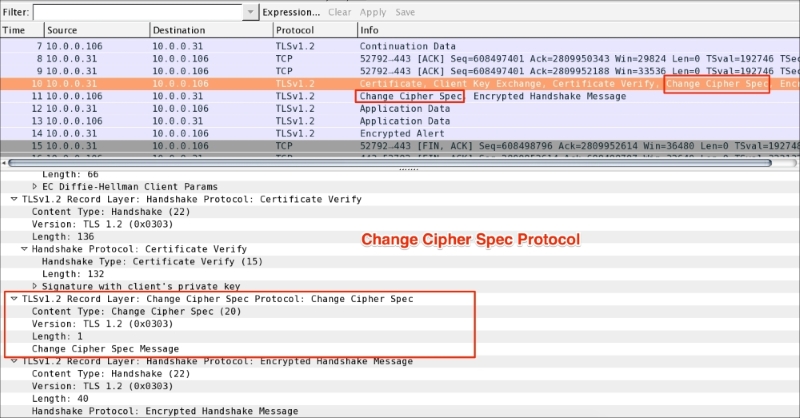
The Change Cipher Spec record type (ssl.record.content_type == 20) is different from the handshake record type (ssl.record.content_type == 22) and it's a part of the Change Cipher Spec protocol. The Change Cipher Spec message is sent by both the client and server only when key_exchange is completed and it indicates to the receiving party that subsequent records will be protected under the newly negotiated Change Cipher Spec and keys (master_secret):
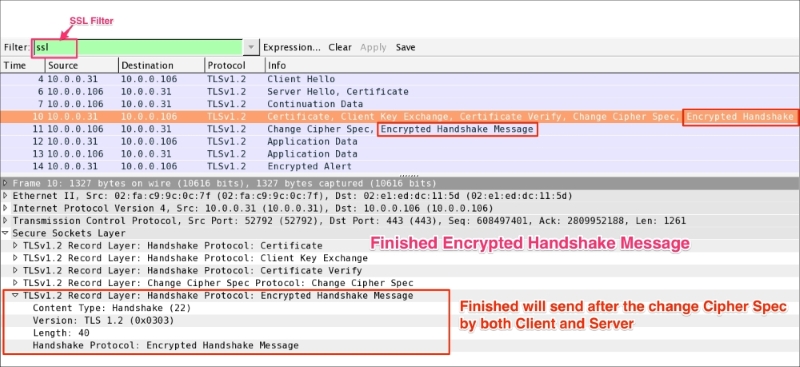
The Finished (ssl.record.content_type == 22) message is encrypted so it will be an encrypted handshake message in Wireshark. This message is sent immediately after a Change Cipher Spec message from both the client and server to verify that the key exchange and authentication processes were successful. This message contain the MD5 hash +SHA hash. When both the client and server have sent the Finished message, the TLS handshake is considered to have finished successfully and now sending and receiving application data over the secure channel can begin:
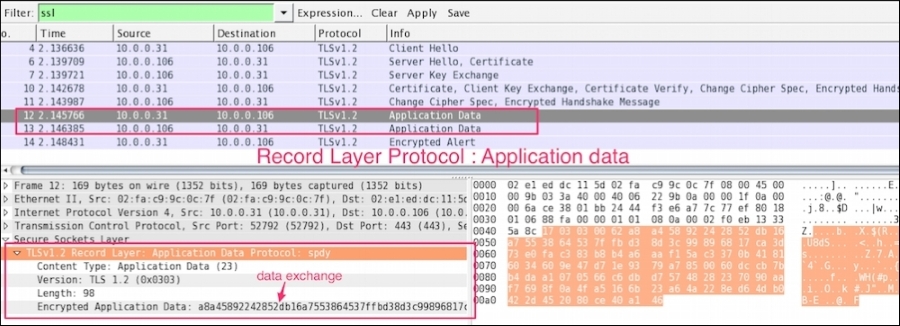
The Application Data message (ssl.record.content_type == 23) is carried by the record layer and fragmented, compressed, and encrypted:
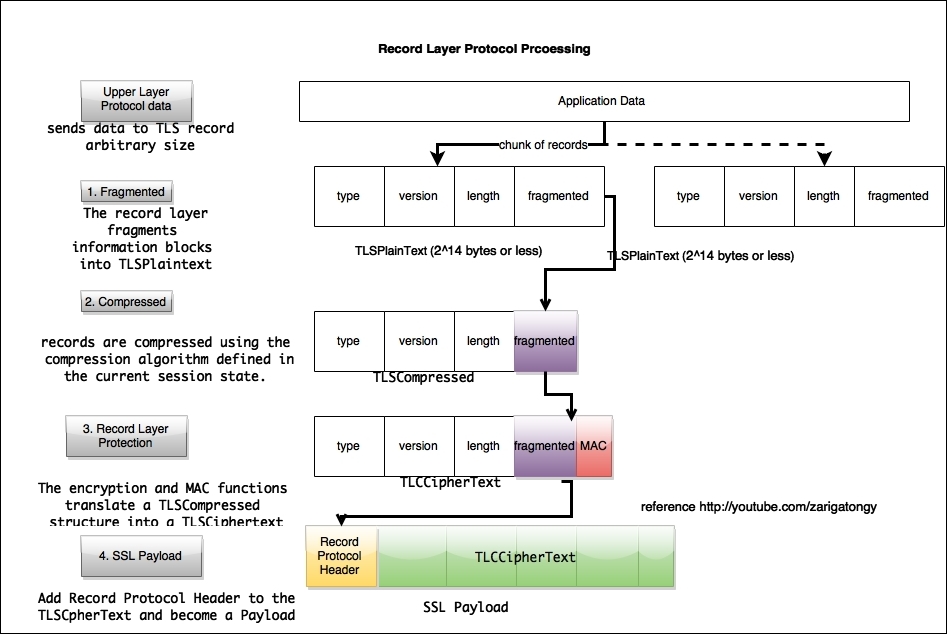
Record layer processing involves the mentioned step as shown in the following screenshot:
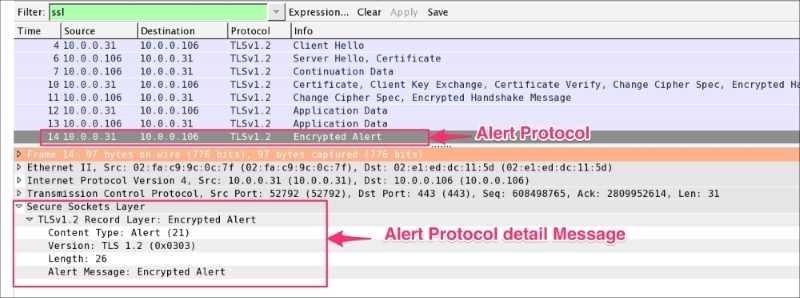
The Alert Protocol (ssl.record.content_type == 21) describes the severity of the message and the alert. Alert messages are encrypted and compressed and support two alert levels: warning and fatal. In the case of fatal alerts, the connection will be terminated.
Alert descriptions are shown in the following table:
As shown in the following screenshot, the Alert Protocol is generated by the server:
In the next section, we will talk about how the SSL/TLS channel can be decrypted; before that, we need to understand what the different keys exchange methods are and what their cipher suites look like. These are the following key exchange methods.
This protocol allows two users to exchange a secret key over an insecure medium without any prior secrets; in this scheme, the example cipher suites will have a naming convention such as:
Cipher suites will have "DH" in their name, not "DHE" or "DH_anon".
You can learn more about Diffie-Hellman at: https://en.wikipedia.org/wiki/Diffie-Hellman_key_exchange.
Elliptic curve Diffie-Hellman is a modified Diffie-Hellman exchange that uses elliptic curve cryptography instead of the traditional RSA-style large primes. Elliptic curve cryptography (ECC) is a public-key cryptosystem just like RSA, Rabin, and El Gamal. Some important points with this algorithm are:
You can learn more about Elliptic Curve Diffie-Hellman at: https://en.wikipedia.org/wiki/Elliptic_curve_Diffie–Hellman.
Note that the Client Hello message exchange process in the Extension elliptic_curves key exchange was offered. The example cipher suites will follow a naming convention such as:
Cipher suites will have "DHE" in their name, not "DH" or "DH_anon".
The server's public key is made available to the client during the Server Key Exchange handshake. The pre_master_secret key is encrypted with the server public RSA key. The example cipher suites in this case will be:
Cipher suites will have "RSA" in their name, not "DH" or "DH_anon" or "DHE".
So far we have learned how the SSL/TLS protocol encrypts traffic and maintains confidentiality. In the next section, we will cover how Wireshark helps to decrypt SSL/TLS traffic.
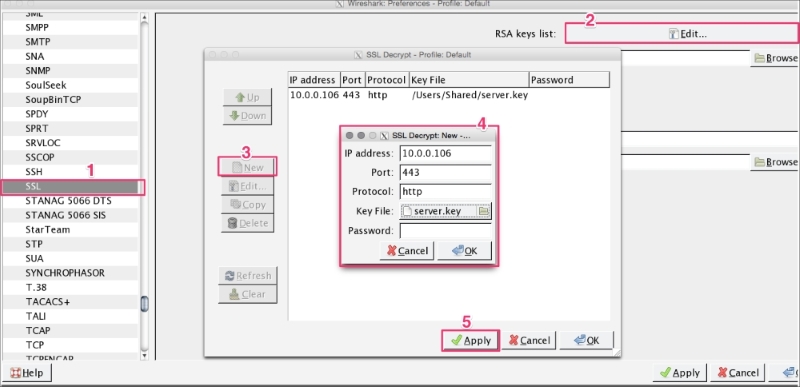
Decryption of TLS traffic depends upon which cipher suite was chosen by the server in the Server Hello message. Open the file decrypt-ssl-01.pcap and look for the cipher selected by the server. In this case the TLS_RSA_WITH_AES_256_CBC_SHA cipher suite was used; since this is RSA, we can decrypt the packet using our private key.
Now go to Edit | Preferences | Protocol | SSL, add the new RSA key, and configure the following properties of the RSA key dialog box:
After applying these settings, the SSL traffic will be decoded into HTTP traffic for that IP, as shown in the following screenshot:
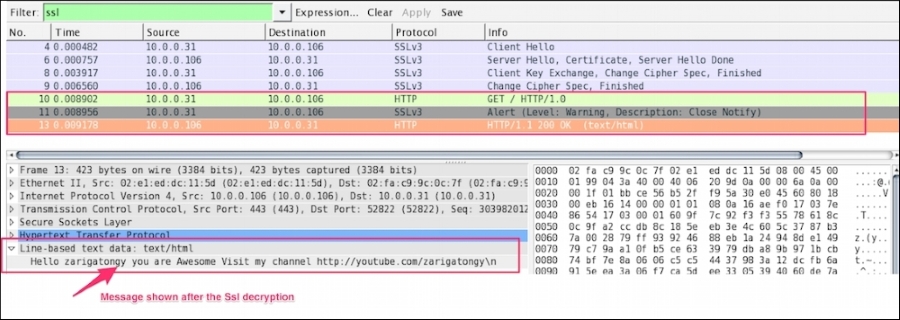
Once the packet is decrypted, the SSL session can be exported by clicking on File | Export SSL Session Keys. A dialog box will open; save this session key in the file (exported-session-keys). The content of the file looks like this:
RSA Session-ID:af458c9c61675238b74f40b2a9547a0a2a394ada458a1b648e0495ed279d5e2e Master-Key:6c970211a77548811267646a759d0d03bbc532d9b6336f2b656cb0c6bbef8f3a262d845b9abed87d26583a9c4bb9b230
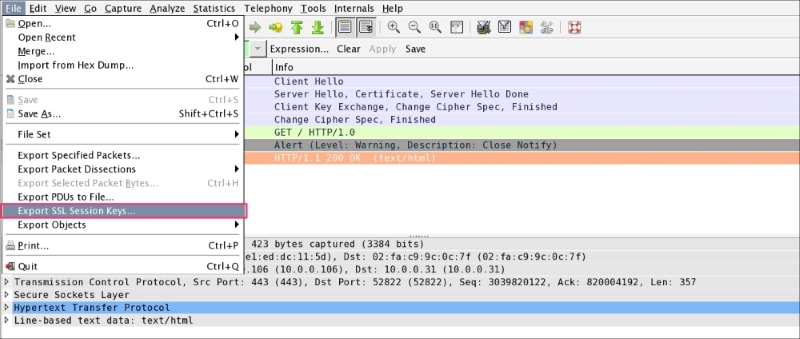
Once the exported-session-keys file is created, use this file to decrypt the SSL/TLS traffic. To do so, go to Edit | Preferences | Protocol | SSL and configure the (Pre)-master-secret log file with the path of the SSL Session Keys. This approach is helpful when the user wants to share the packet without sharing the private keys and still needs to provide the decryption step:
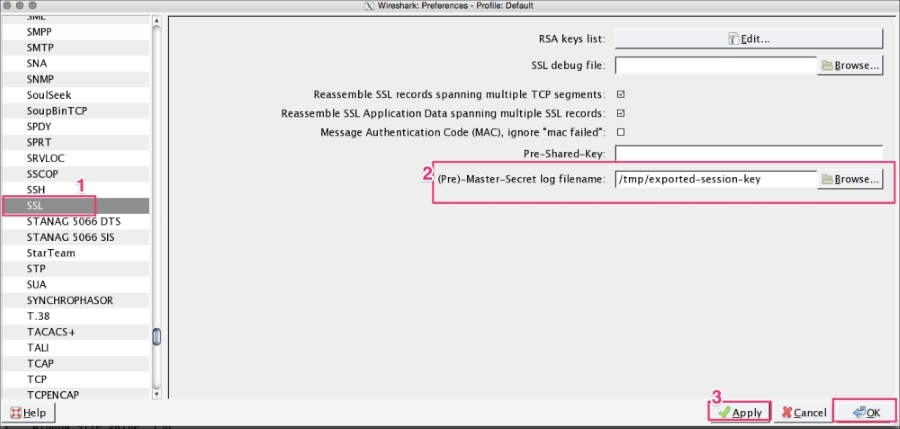
DHE/ECDHE can't be decrypted using this approach even if we have private keys as they are designed to support forward secrecy.
Forward secrecy is supported in the Diffie-Hellman (DHE) and Elliptic curve cryptography Diffie-Hellman (ECDHE) key exchange algorithms. Take the previous scenario; the SSL/TLS communication can be decrypted by knowing the server's private key. If the private key is compromised by poor system hardening or (an internal threat agent), the SSL/TLS communication can be broken. In forward secrecy, the SSL/TLS communication is secure even if we have access to the server's private key.
If the cipher suite's name contains "ECDHE" or "DHE", it means it supports forward secrecy. For example, note this cipher suite name: TLS_ECDHE_RSA_WITH_RC4_128_SHA.
In the section, we will learn how to debug common SSL-related issues:
nmap utility as shown:root@bash :/home/ubuntu# nmap --script ssl-cert,ssl-enum-ciphers -p 443 10.0.0.106 Starting Nmap 6.40 ( http://nmap.org ) at 2015-08-03 16:49 UTC Nmap scan report for ip-10-0-0-106.ap-southeast-1.compute.internal (10.0.0.106) Host is up (0.000067s latency). PORT STATE SERVICE 443/tcp open https | ssl-cert: Subject: commonName=ip-10-0-0-106/organizationName=Internet Widgits Pty Ltd/stateOrProvinceName=Some-State/countryName=AU | Issuer: commonName=ip-10-0-0-106/organizationName=Internet Widgits Pty Ltd/stateOrProvinceName=Some-State/countryName=AU | Public Key type: rsa | Public Key bits: 2048 | Not valid before: 2015-07-28T14:43:45+00:00 | Not valid after: 2016-07-27T14:43:45+00:00 | MD5: 9ba5 0ea9 14b2 0793 7fe6 9329 08ce fab3 |_SHA-1: 1604 27b6 4f1c a838 9a9d db67 3136 88de effb f881 | ssl-enum-ciphers: | TLSv1.2: | ciphers: | TLS_ECDHE_RSA_WITH_AES_256_CBC_SHA - strong | compressors: | NULL |_ least strength: strong
nmap output shows the server supports TLSv1.2 and one cipher suite. If the client connects with other SSL protocols or cipher suites the server doesn't support, the server will return with handshake failure. For example, connecting the same server with TLSv1.1 will return an error:rootbash # curl -k --tlsv1.1 https://10.0.0.106 curl: (35) Unknown SSL protocol error in connection to 10.0.0.106:443
root@bash # curl -k --ciphers EXP-RC2-CBC-MD5 https://10.0.0.106 curl: (35) error:14077410:SSL routines:SSL23_GET_SERVER_HELLO:sslv3 alert handshake failure
unknown_ca error check the following find the hash value from the certificate, private key and CSR file use the following commands:bash $ openssl x509 -noout -modulus -in server.crt | openssl md5 f637e8d51413ff7fa8d609e21cb27244 bash $ openssl rsa -noout -modulus -in server.key | openssl md5 f637e8d51413ff7fa8d609e21cb27244 bash $ openssl req -noout -modulus -in server.csr | openssl f637e8d51413ff7fa8d609e21cb27244
The md5 hash value of csr, cer, and the private key will be the same, if csr is generated with the client private key, though the certificate is generated by using the CA (Intermediate CA) private key.
If the md5 file is the same, then verify that the certificate issued by the CA matches its path:
bash $ openssl verify -verbose -CAfile cacert.pem server.crt bash $ openssl verify -verbose -CAfile cacert.pem client.crt
In this chapter, we have learned how the SSL/TLS Handshake Protocol works and how to analyze it using Wireshark. We have examined sample debugging issues related to handshakes, and learned how to solve them. In the next chapter, we will continue analyzing other application layer protocols with the help of Wireshark.
In the previous chapter, we covered the SSL/TLS application layer protocol in detail. In this chapter, we will continue with other application layer protocols (their basic flows and some generic use cases) and learn how to generate these types of traffic:
The Dynamic Host Configuration Protocol for IPv6 (DHCPv6) is an application layer protocol that provides a DHCPv6 client with IPv6 an address, and other configuration information, that is carried in the DHCPv6 options.
DHCPv6 is both a Stateful Address Autoconfiguration protocol and a Stateless Address Configuration protocol.
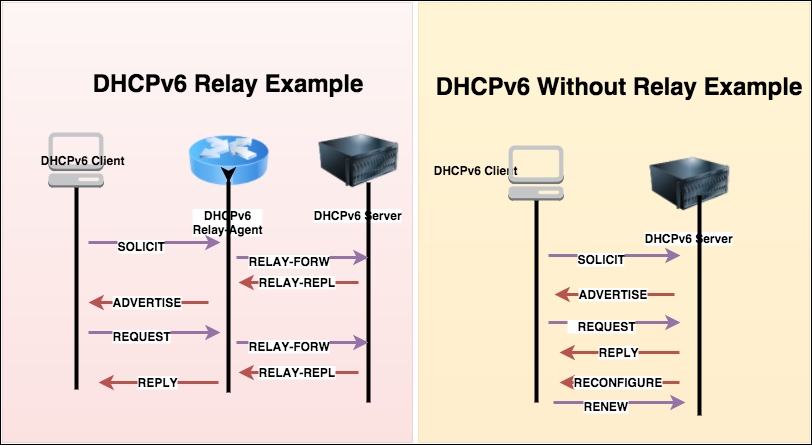
The client and server exchange DHCPv6 message over UDP; the client uses a link-local address, DHCPv6 receives message over the link-scoped multicast address. If the DHCPv6 server is not attached to the same link, then a DHCPv6 relay agent on the client's link will relay messages between the DHCPv6 client and DHCPv6 server, as shown in the following screenshot:
Multicast addresses are used by the DHCPv6 client to send datagrams to a group of DHCPv6 servers:
FF02::1:2 (link local)FF05::1:3 (site local)Servers and relay agents listen for DHCPv6 messages on UDP port 547; clients listen for DHCPv6 messages on UDP port 546. To find the port information, the netstat command can be used:
[root@bash ~]# netstat -an | grep 547 udp 0 0 :::547 :::*
DHCPv6 messages are exchanged over UDP port 546 and 547 and the messages are described in the following table:
DHCPv6 message exchanges happen in order to obtain the IPv6 addresses, configuration (NTP server, DNS server), or RENEW/RELEASE/DECLINE of the IPv6 address, and these message exchanges are categorized in two parts:
The acronym for a four-message exchange is SARR, and it is used to request the assignment of one or more IPv6 addresses. The message flow is as follows:
SOLICITADVERTISEREQUESTREPLYOpen the DHCPv6-Flow-SOLICIT.pcap file in Wireshark, and examine the IP assignment flow as shown:
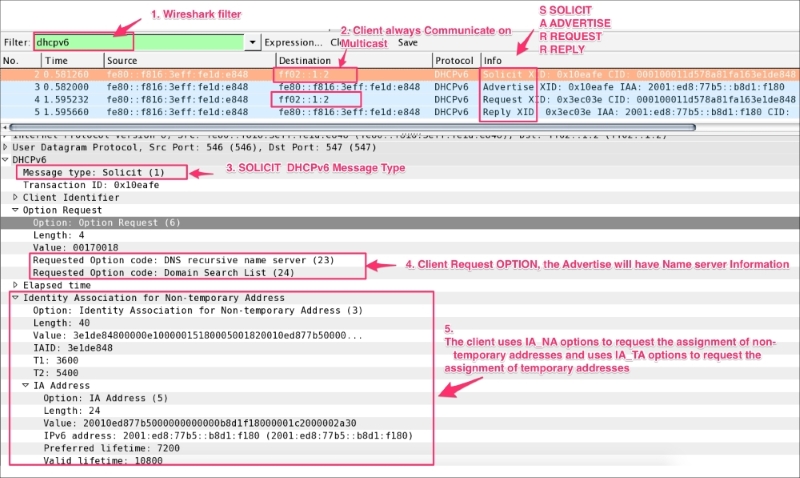
The preceding screenshot shows a SARR flow packet being captured. IPv6 is assigned to the DHCPv6 client, and the message exchanges in detail are:
SOLICIT: The client (fe80::f816:3eff:fe1d:e848) sends a SOLICIT message to locate the servers. Note the destination is multicast ff02::1:2 not the server (destination) IPv6 address:dhcpv6.option.type == 1.dhcpv6.option.type == 6) to the server that is interested in receiving. In this case, the client has requested the name server information.dhcpv6.option.type == 3) and uses IA_TA options to request the assignment of temporary addresses.ADVERTISE: The server (fe80::f816:3eff:fe1d:e848) sends the ADVERTISE (dhcpv6.msgtype == 2) message to the client (fe80::f816:3eff:fe1d:e848). There can be multiple servers that will respond to the client SOLICIT message; the client will choose the DHCPv6 server based on its preference:dhcpv6.option.type == 3) value based on its preferences.dhcpv6.option.type == 2) information. The Server Identifier option is used to carry DUID. The DUID is the DHCP Unique Identifier, the host identifier in IPv6. (In the case of DHCPv4, the host identifier is the MAC address.)dhcpv6.option.type == 23) information as requested in the SOLICIT message.0x10eafe in this case must match with the client SOLICIT transaction ID.REQUEST: In this message the client chooses one of the servers and sends a REQUEST message to the server asking for confirmed assignment of addresses and other configuration information:fe80::f816:3eff:fe1d:e848) constructs the REQUEST packet and sends it to multicast ff02::1:20x3ec03e.(random)REQUEST packet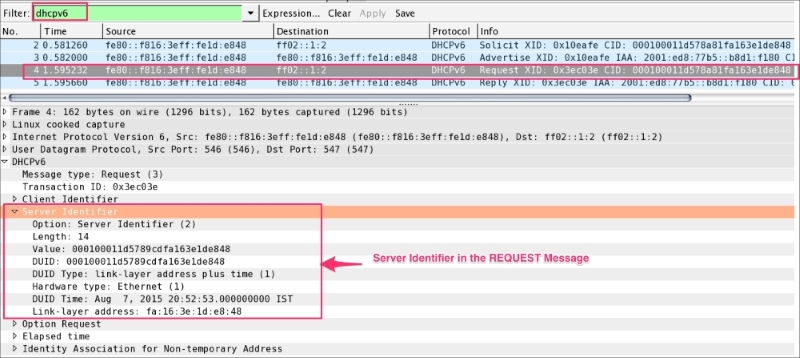
REPLY: In the case of a valid REQUEST message, the server creates the bindings for that client according to the server's policy and configuration information, records the IAs and other information requested by the client, and sends a REPLY message by setting dhcpv6.msgtype == 7:The two-message exchange will be performed between client and server when IP address assignment is not required or when the DHCPv6 client wants to obtain configuration information such as a list of available DNS servers or NTP servers—for example CONFIRM-REPLY and RELEASE-REPLY. Open the sample DHCPv6-Flow-CONFIRM-RELEASE.pcap file in Wireshark, which shows that a two-message exchange was performed:
CONFIRM-REPLY and RELEASE-REPLY: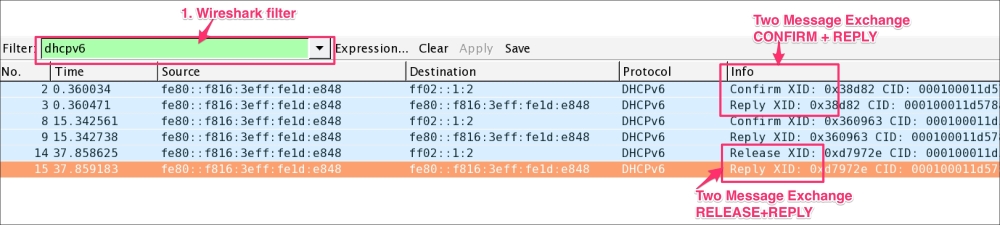
INFOMRATION-REQUEST: The client sends the INFORMATION-REQUEST when the client requests configuration settings (but not addresses)—for example, DNS, NTP. As shown in the following screenshot, open the DHCPv6-Information_request.pcap file in Wireshark: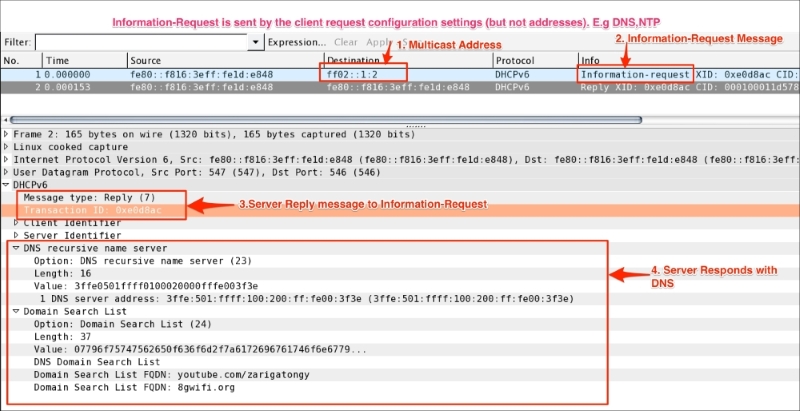
DHCPv6-Rapid-Commit.pcap. Note that rapid commit is not a separate DHCPv6 message and is part of the SOLICIT option: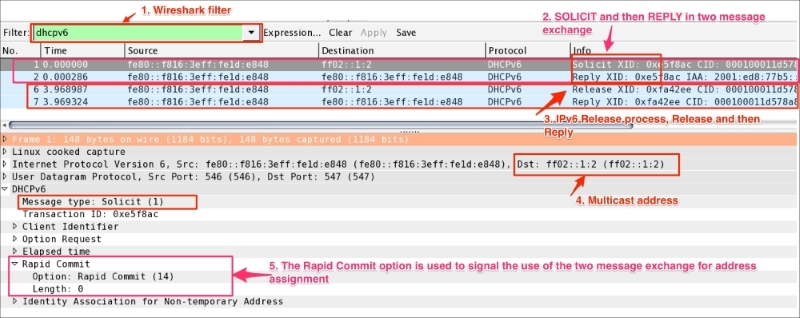
SOLICIT messages that it sends.REPLY message with a rapid commit option, it should process the REPLY immediately (without waiting for additional ADVERTISE or REPLY messages) and use the address and configuration information contained therein.Use dhclient to simulate DHCPv6 traffic over the network. For this, do the following:
tcpdump utility to capture IPv6 traffic:
bash$ tcpdump -i any ip6 -vv -w DHCPv6-FLOW.pcap -s0 &
Make sure the DHCPv6 server is running in your network.
bash$ dhclient -6 eth0
RELEASE message:
bash$ dhclient -6 -r eth0
CONFIRM message:
bash$ dhclient -6 eth0
INFORMATION request:
bash$ dhclient -S -6 eth0
DHCP is an extension of the BOOTP mechanism. In other words, DHCP uses BOOTP as its transport protocol. This behavior allows existing BOOTP clients to interoperate with DHCP servers without requiring any change to the clients' initialization software; the following table shows basic comparisons between these two protocols:
|
BOOTP/DHCP |
BOOTP |
DHCP (Dynamic Host Configuration Protocol) |
|---|---|---|
|
Meaning |
Bootstrap Protocol |
Dynamic Host Configuration Protocol extension of BOOTP |
|
Year |
1985 |
1993 |
|
UDP Server Port |
67 | |
|
UDP Client port |
68 | |
|
Services |
|
|
|
RFC |
RFC951 |
RFC 2131 |
|
Existence |
Superseded by the Dynamic Host Configuration Protocol (DHCP) |
ACTIVE; RFCs keep coming to add more features and support different technical requirements |
Use the bootp filter to display BOOTP/DHCP traffic and use UDP port 67 to capture the BOOT/DHCP traffic only.
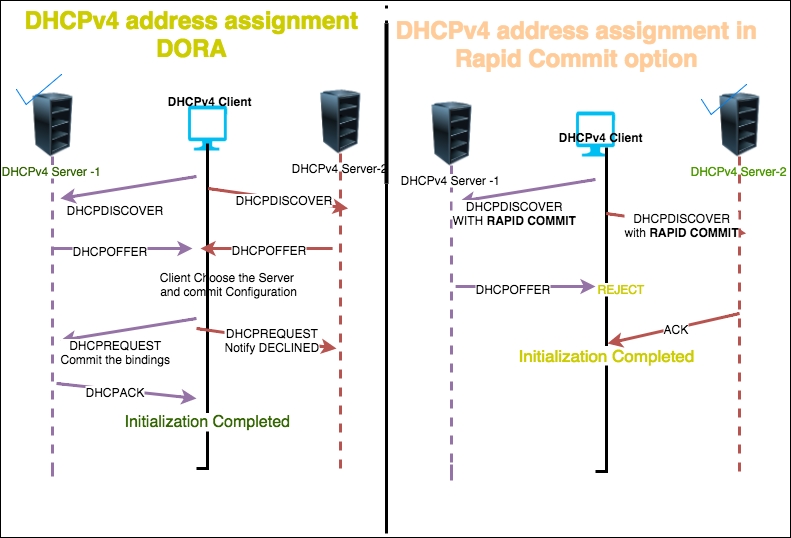
DISCOVER, OFFER, REQUEST, ACK protocol exchanges happen between clients and servers during network address assignment, as shown in the following screenshot. As a mnemonic, refer to this as DORA.
The address assignment can also be done using the Rapid Commit option for DHCPv4. Modeled on DHCPv6, it uses two-message exchanges to quickly configure the DHCPv4 client.
To demonstrate four-message exchange open the DHCPv4.pcap file in the Wireshark, as shown in the following screenshot:
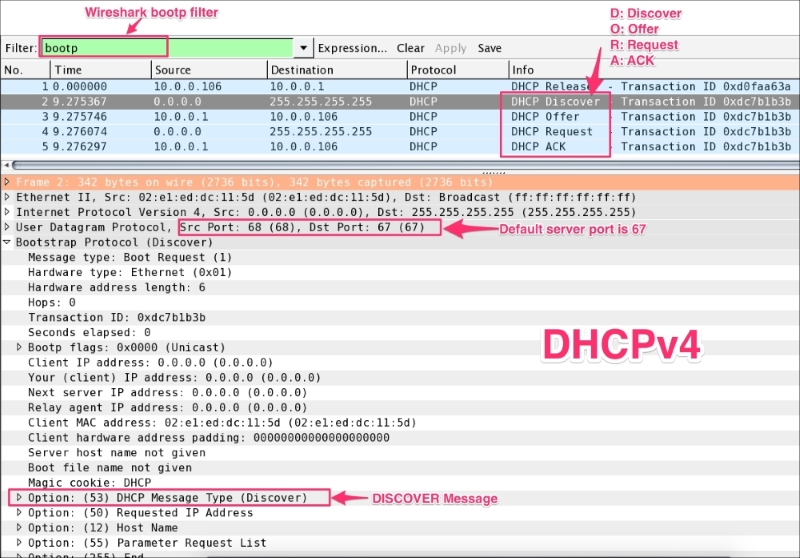
The preceding figure shows a message exchange happening between the DHCPv4 client and DHCPv4 server. This is summarized as follows:
DISCOVER (bootp.option.dhcp == 1):255.255.255.255), a DHCPDISCOVER message, on its local physical subnet and may include the option: (55 that is bootp.option.type) parameter request list; during this time the "yiaddr" field will be (bootp.ip.your == 0.0.0.0)OFFER (bootp.option.dhcp == 2):DHCPOFFER message that includes an available network address in the "yiaddr" (bootp.ip.your == 10.0.0.106) fieldDICOVER phaseDHCPREQUEST (bootp.option.dhcp == 3):255.255.255.255) a DHCPREQUEST message that must include the option 54 DHCP server identifier to indicate which server it has selected, and may include other options specifying the desired configuration valuesDHCPREQUEST message commits the binding for the client to the db storage and responds with an ACKACK (bootp.option.dhcp == 5):bootp.ip.your == 10.0.0.106)DECLINE message to the server and restart the configuration processThe commands to capture DHCPv4 traffic are as follows:
ipconfig /renew and press Enter.ipconfig /release and press Enter.
bash# ifdown eth0:0
bash$ ifup eth0:0
DNS stands for Domain Name System. DNS is used by all machines to translate hostnames into IP addresses. This mechanism is used to translate names to attributes such as addresses (IPv4/IPv6) based on the query type.
DNS has three major components:
This topic will focus on the resolver perspective, where the client sends a query to the server and the server answers the query. There can be multiple answers to the same query.
Wireshark's dns filter is used to display only DNS traffic, and UDP port 53 is used to capture DNS traffic.
The default DNS port is 53, and it uses the UDP protocol. Some DNS systems use the TCP protocol also. TCP is used when the response data size exceeds 512 bytes, or for tasks such as zone transfers.
The following format is used by the DNS system:
|
Field |
Description |
Length |
Wireshark filter |
|---|---|---|---|
|
NAME |
The owner name |
variable |
|
|
TYPE |
Type of Resource Record (RR) in numeric form |
2 |
|
|
CLASS |
Class code |
2 |
|
|
TTL |
Time to live |
4 | |
|
RDLENGTH |
2 | ||
|
RDATA |
Additional RRspecific data |
Variable |
In this chapter, the dig and nslookup network commands are used to query the DNS server. Open the sample DNS-Packet.pcap file, set the display filter to dns.qry.type==28, and examine the query.
In this example, client (192.168.1.101) is asking the name server (8.8.4.4) to resolve ipv6.google.com by setting these parameters in the query section:
ipv6.google.com)IN (Internet))8.8.4.4) responds to the client with multiple answersipv6.google.com is the canonical name that equals ipv6.l.google.comipv6.l.google.com has the AAAA address 2404:6800:4007:805::200e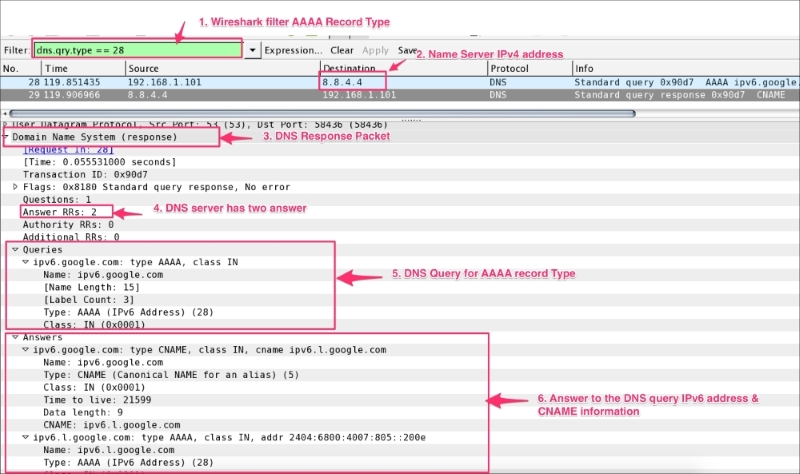
User can use the popular dig or nslookup network utility commands to query different DNS record types. Use a network capture in the background and observe the query and answer section for each command:
bash# nslookup google.com bash# dig google.com bash# dig A +noadditional +noquestion +nocomments +nocmd +nostats google.com. @8.8.4.4
AXFR record type; AXFR is used to transfer zone files from the master to the secondary name server:bash# nslookup -type=axfr google.com 8.8.4.4 bash# dig AXFR +noadditional +noquestion +nocomments +nocmd +nostats +multiline google.com. @8.8.4.4
CNAME record type. CNAME is used to set up the alias:bash# nslookup -type=cname google.com 8.8.4.4 bash# dig CNAME +noadditional +noquestion +nocomments +nocmd +nostats google.com. @8.8.4.4
MX record type; MX is the mail exchange record:bash# nslookup -type=mx google.com 8.8.4.4 bash# dig MX +noadditional +noquestion +nocomments +nocmd +nostats google.com. @8.8.4.4
NS record type; NS is the name server record:bash# nslookup -type=ns google.com 8.8.4.4 bash# dig NS +noadditional +noquestion +nocomments +nocmd +nostats google.com. @8.8.4.4
PTR record type; PTR is the pointer used for reverse DNS lookups:bash# nslookup -type=ptr google.com 8.8.4.4 bash# dig PTR +noadditional +noquestion +nocomments +nocmd +nostats google.com. @8.8.4.4
SOA record type. SOA is used to provide authoritative information such as nameserver and e-mail:bash# nslookup -type=soa google.com 8.8.4.4 bash# dig SOA +noadditional +noquestion +nocomments +nocmd +nostats +multiline google.com. @8.8.4.4
TXT record type; this refers to the text record:bash# nslookup -type=txt google.com 8.8.4.4 bash# dig TXT +noadditional +noquestion +nocomments +nocmd +nostats google.com. @8.8.4.4
AAAA (also referred to as the quad-A record type); this will display the IPv6 address of the given hostname:bash# nslookup -type=aaaa google.com 8.8.4.4 bash# nslookup -type=aaaa ipv6.google.com 8.8.4.4 bash# dig AAAA +noadditional +noquestion +nocomments +nocmd +nostats ipv6.google.com. @8.8.4.4
ANY record type; this returns all record types:bash# nslookup -type=any google.com 8.8.4.4 bash# dig ANY +noadditional +noquestion +nocomments +nocmd +nostats google.com. @8.8.4.4
HTTP is an application layer protocol used in WWW. HTTP enables communications between the HTTP client and HTTP server. Example traffic is shown in the following screenshot. An HTTP GET request is created by the client (browser or cURL), and the HTTP server has responded with the appropriate content type:
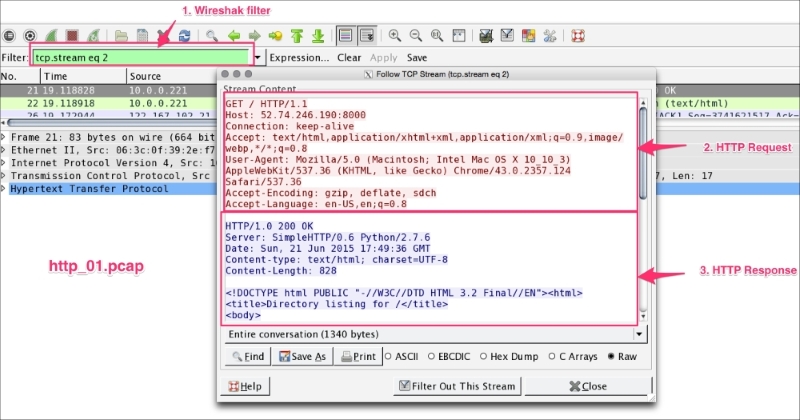
Use http to display HTTP packets only. Use TCP port 80 to filter for HTTP traffic only; port 80 is the default HTTP port.
The following example shows different use cases where Wireshark can help to analyze HTTP packets.
Open the file
http_01.pcap in the Wireshark, and find the top HTTP response time for the request HTTP get:
http filter and add http.time as a column from the http.response.code == 200 HTTP OK packet.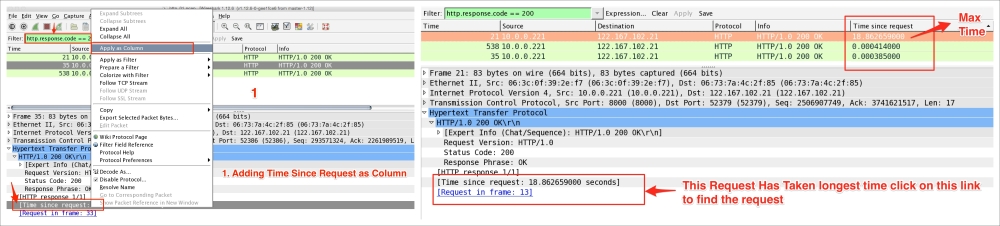
Use Wireshark's http.request.method to display packets for analysis. For example, the following table describes how to apply this filter:
If the form contains sensitive information such as password, Wireshark can easily reveal it as HTTP is an unsecure means of transferring data over the network.
Open the HTTP_FORM_POST.pcap file and filter the traffic to display only the request method POST and locate the password form item, as shown in the following screenshot:
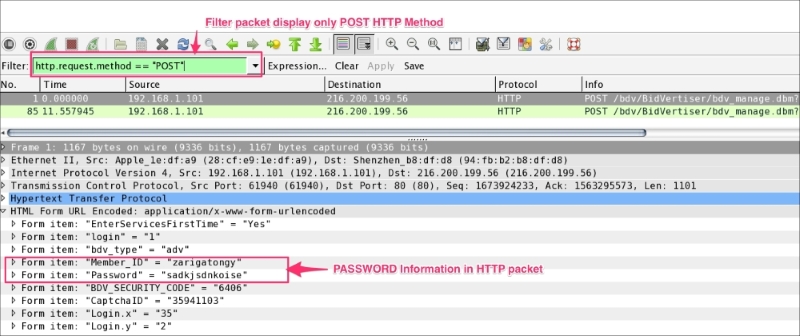
The first line of the HTTP response contains the status code. Use the Wireshark filter http.response.code, to display packets based on the status code. This will be helpful when debugging the HTTP client-server interaction:
|
Type |
Code |
Meaning |
HTTP Wireshark filter |
|---|---|---|---|
|
Informational – 1xx |
100 |
Continue |
|
|
101 |
Switching protocol |
| |
|
Successful – 2xx From: 200 To: 206 |
200 |
OK |
|
|
201 |
Created |
| |
|
Redirection – 3xx From: 300 To: 307 |
300 |
Multiple choices |
|
|
301 |
Moved permanently |
| |
|
Client Error – 4xx From: 400 To: 417 |
400 |
Bad Request |
|
|
401 |
Unauthorized |
| |
|
Server Error – 5xx From—500 To-- 505 |
500 |
Internal Server Error |
|
|
501 |
Not implemented |
|
So far, we have seen packets captured on Ethernet. In this chapter we will learn how to capture WLAN network traffic, and use effective display filters for all the frames, by covering the following topics:
Wireshark depends on the operating system on which it's running (and on the drivers for the wireless adapter) for monitor mode support.
For Linux, the 802.11 wireless toolbar (View | Wireless Toolbar) provides excellent options to enable the monitor mode and set the channel for cfg80211 devices. This even supports multiple network interfaces for multi-channel captures; refer to https://wiki.wireshark.org/CaptureSetup/WLAN for detailed instructions.
The MAC OS has a wireless adapter, and the monitor mode is supported. On Windows, the monitor mode is not supported; you need a commercial adaptor for this, such as the AirPcap USB adapter.
The WLAN (IEEE 802.11) capturing process is slightly different from capturing Ethernet traffic in Wireshark. By default, when we start capturing traffic in a Wi-Fi network, it captures traffic between two endpoints (HOST-A and HOST-B). To capture the Wi-Fi traffic, Wireshark has to run in the monitor mode—RFMON (Radio Frequency Monitor) mode—which allows a computer with a wireless network interface controller (WNIC) to monitor all traffic received from the AP (Access Point), as shown in the screenshot:
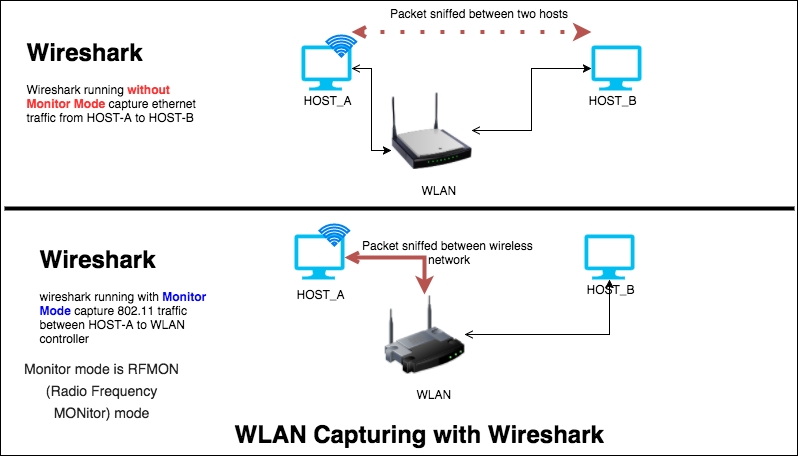
The monitor mode is supported only on IEEE 802.11 Wi-Fi interfaces, and only on some operating systems. To enable the monitor mode in a Wi-Fi interface, perform these steps in Wireshark:
You should see the following screen:
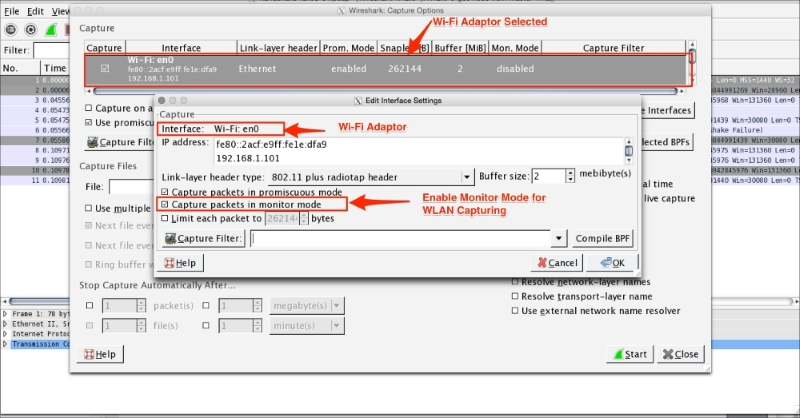
When the monitor mode is on, the adapter captures all the packets transmitted on the channel. These include:
Once the packet capture starts, Wireshark will start displaying the 802.11 protocol packet exchange between source and destination, as shown in the following screenshot (or open the packet capture 802.11.pcap file in Wireshark). Packet capture in the monitor mode will not be associated with any of the access points and the user can see only 802.11 frames, which include non-data (management and beacon) frames, as shown:
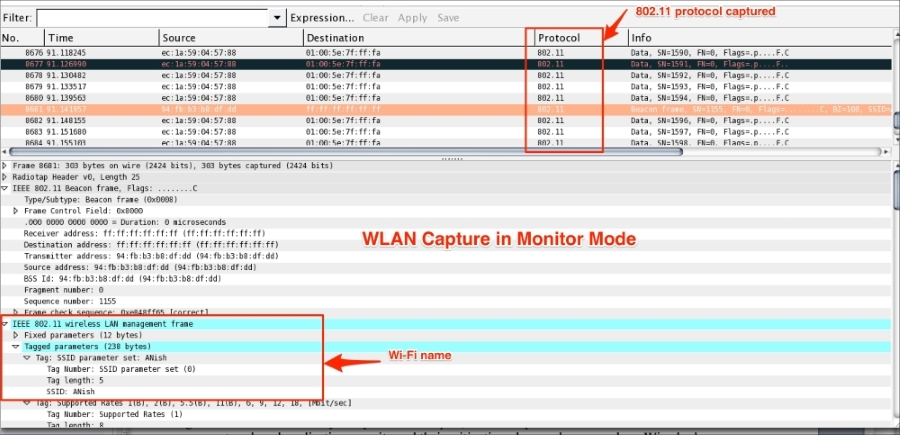
To perform a wireless packet capture using tcpdump, execute the following command. The tcpdump with –I option will turn the monitor mode on:
bash $ tcpdump -I -P -i en0 -w 802.11.pcap
The output obtained is as follows:
tcpdump: WARNING: en0: no IPv4 address assigned tcpdump: listening on en0, link-type IEEE802_11_RADIO (802.11 plus radiotap header), capture size 65535 bytes ^C52 packets captured 52 packets received by filter
When analyzing a Wi-Fi network, it's important to go through the IEEE standard 802.11 as the source of truth as this is one of the most interesting protocols to gain a expertise on.
Wireless networks are different from a wired LAN: here the addressable unit is a station (STA), and the STA is the message destination not the fixed location when the packet is transferred to the STA.
Within the scope of the book, we are dealing with packets captured between the WNIC controller and the access point. The access point (AP) contains one station (STA) and provides access to the distribution. In this book, we will see the how Wireshark has provided display filters for analyzing Wi-Fi frames:
In Layer 2, datagrams are called frames; they show all channel traffic and a count of all the frames received at the measuring STA. There are four types of frame, which are defined in the following table:
|
Frame type |
Value |
Wireshark display filter |
|---|---|---|
|
Management |
0x00 |
|
|
Control |
0x01 |
|
|
Data |
0x02 |
|
|
Extension |
0x03 |
|
Let's take a detailed look at these frames one by one.
Wireshark uses the wlan_mgt display filter to show all the management frames. In line with the IEEE 802.11 standard, the following management frames are defined and their corresponding values, with appropriate Wireshark display filters, are shown in the following table:
|
Name |
Value |
Wireshark display filter |
|---|---|---|
|
association request |
0x00 |
|
|
association response |
0x01 |
|
|
reassociation request |
0x02 |
|
|
reassociation response |
0x03 |
|
|
probe request |
0x04 |
|
|
probe response |
0x05 |
|
|
measurement pilot |
0x06 |
|
|
beacon frame |
0x08 |
|
|
atim |
0x09 |
|
|
disassociation |
0x0a |
|
|
authentication |
0x0b |
|
|
deauthentication |
0x0c |
|
|
action |
0x0d |
|
|
action no ack |
0x0e |
|
For example, by setting wlan.fc.type_subtype == 0x08, in the 802.11.pcap file, the entire beacon frame will be displayed in Wireshark.
A beacon is a small broadcast data packet that shows the characteristics of the wireless network, and provide information such as data rate (max data rate), capabilities (encryption on or off), Access Point MAC address, SSID (wireless network name), RSN information, vendor specific information, Wi-Fi protected setup, and so on, where:
ANish94:FB:B3:B8:DF:DD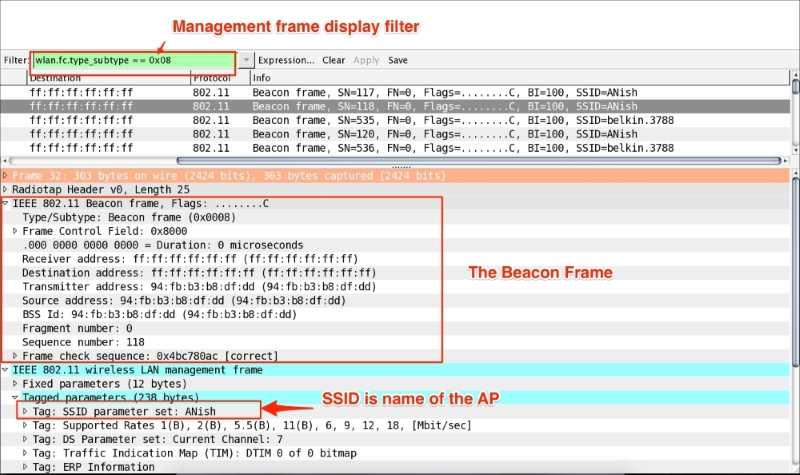
In another example, the
wlan_mgt.ssid == "ANish" display filter will display all management frames whose SSID matches with ANish.
Data frames carry the packets that can contain the payload (such as files, screenshots, and so on). Type values for data frames used in 802.11 and their corresponding Wireshark display filters are shown in the following table:
|
Name |
Value |
Wireshark display filter |
|---|---|---|
|
data |
0x20 |
|
|
data + cf-ack |
0x21 |
|
|
data + cf-poll |
0x22 |
|
|
data + cf-ack + cf-poll |
0x23 |
|
|
null function |
0x24 |
|
|
no data cf-ack |
0x25 |
|
|
no data cf-poll |
0x26 |
|
|
no data cf-ack + cf-poll |
0x27 |
|
|
qos data |
0x28 |
|
|
qos data + cf-ack |
0x29 |
|
|
qos data + cf-poll |
0x2a |
|
|
qos data + cf-ack + cf-poll |
0x2b |
|
|
qos null |
0x2c |
|
|
no data qos cf-poll |
0x2e |
|
|
qos cf-ack + cf-poll |
0x2f |
|
For example, wlan.fc.type_subtype == 0x2A will display all the packets that contain QoS Data + CF-Poll in the packet capture file 802.11.pcap, as shown in the following screenshot:
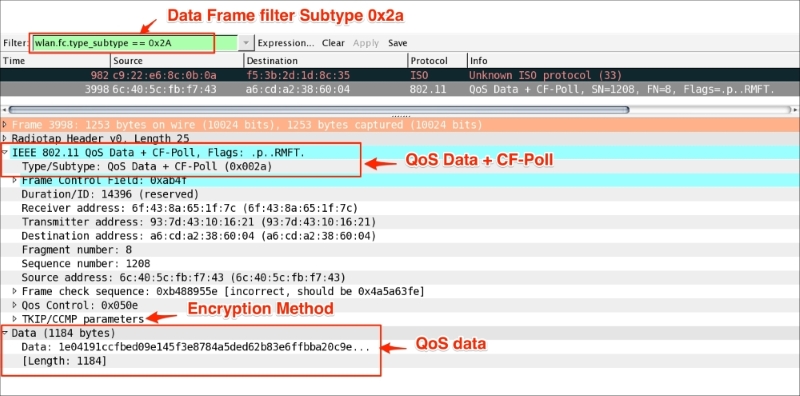
Control frames exchange data frames between stations. Control frame ranges are 0x160 - 0x16A for control frame extensions where type = 1 and subtype = 6. Values for control frames and the corresponding Wireshark display filters are shown in the following table:
|
Name |
Value |
Wireshark display filter |
|---|---|---|
|
vht ndp announcement |
0x15 |
|
|
poll |
0x162 |
|
|
service period request |
0x163 |
|
|
grant |
0x164 |
|
|
dmg clear to send |
0x165 |
|
|
dmg denial to send |
0x166 |
|
|
grant acknowledgment |
0x167 |
|
|
sector sweep |
0x168 |
|
|
sector sweep feedback |
0x169 |
|
|
sector sweep acknowledgment |
0x16a |
|
|
control wrapper |
0x17 |
|
|
block ack request |
0x18 |
|
|
block ack |
0x19 |
|
|
power-save poll |
0x1a |
|
|
request to send |
0x1b |
|
|
clear to send |
0x1c |
|
|
acknowledgement |
0x1d |
|
|
0x1e |
| |
|
0x1f |
|
The AP advertises its capabilities in a Beacon frame; the client (STA) broadcasts itself, using its own probe request frame, on every channel—typically (channel 11). By doing this, it determines which access points are within range.
Probe response frames contain capability information, supported data rates and so on, of the AP after it receives a probe request frame.
The STA sends an authentication frame containing its identity to the AP. With open system authentication (the default), the access point responds with an authentication frame as a response, indicating acceptance (or rejection).
Shared key authentication requires WEP (64-bit or 128-bit) keys, and the same WEP keys on the client and AP should be used. The STA requests a shared key authentication, which returns unencrypted challenge text (128 bytes of randomly generated text) from the AP. The STA encrypts the text and returns the data to AP, the AP response indicating acceptance (or rejection).
The STA sends an association request frame to the AP containing the necessary information and then that the AP will send an Association response frame that includes acceptance (or rejection). If this is accepted, the STA can utilize AP to access other networks:
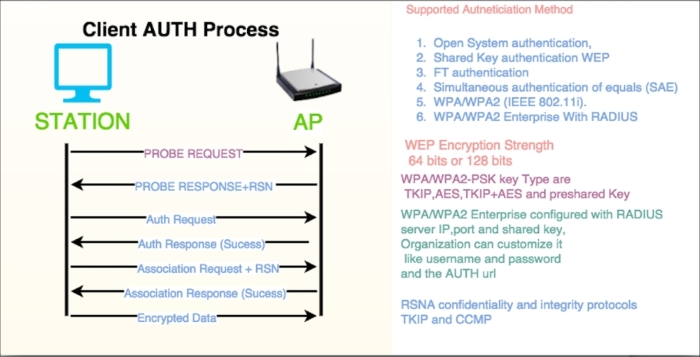
IEEE802.1x is based on Extensible Authentication Protocol (EAP), which is an extension of PPP (Point-to-Point Protocol), also known as "EAP over LAN" or EAPOL.
The IEEE 802.11 Working Group passed the 802.1x standard in 2001 to improve upon the security specified in the original 802.11 standard (IEEE, 2001).
Open the 802.11-AUTH-enabled.pcap file in Wireshark and use the display filter eapol to display all the
eapol messages only, as shown in the following screenshot. In the eapol packets, the session key of the device and the AP are handled.
As shown in the screenshot, all eapol packets are captured as 1 of 4, 2 of 4, 3 of 4, and 4 of 4.
The eapol packets are needed if you are trying to decrypt 802.11 traffic. The Wireshark wiki link https://wiki.wireshark.org/HowToDecrypt802.11 is an excellent source of information on how to decrypt traffic with the help of Wireshark.
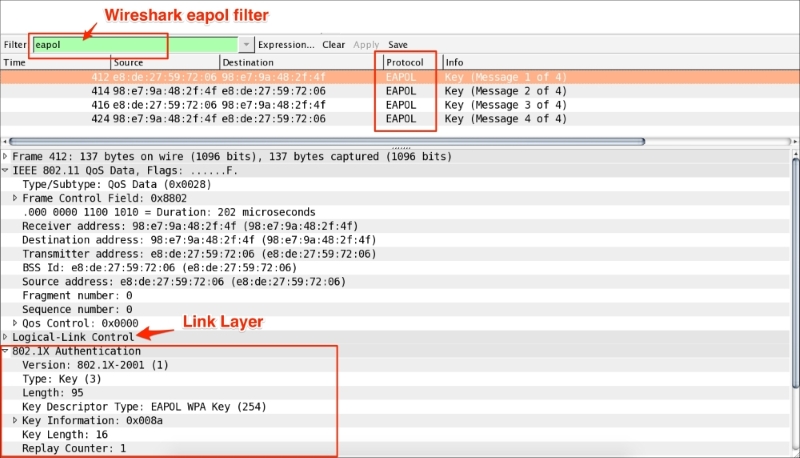
The 802.11 standard specifies a common medium access control (MAC) layer (the data link layer) that supports the operation of 802.11-based wireless LANs. The 802.11 MAC layer uses an 802.11 Physical (PHY) layer, such as 802.11a/b, to perform the tasks of carrier sensing, transmission, and receiving 802.11 frames.
Open the packet capture file 802.11-AUTH-Disabled.pcap in Wireshark and set the display filter to wlan.da==e8:de:27:59:72:06 to view how the data is carried using 802.11 as the transport medium.
The 802.11 QoS data frames shows that the LLC header follows IEEE 802.11; this is what is expected in the monitor mode.
The captured 802.11 looks like an Ethernet packet as the 802.11 adapter will often try to transform data packets into fake Ethernet packets and then supply them to the host.
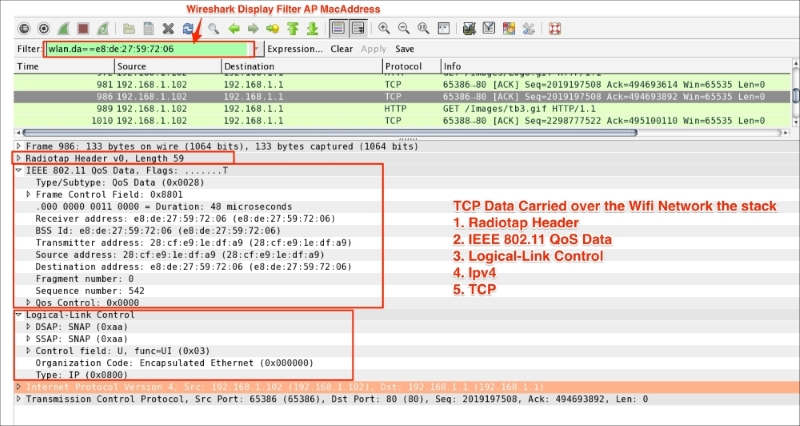
There are other commercial (as well as open source) tools that use a form of Wi-Fi sniffing depending on the operating system and uses cases (such as WEP decryption, advance analytics, and geo location). A few of them are listed as follows:
In this chapter, we have covered Wi-Fi capture setup and discussed exactly what the monitor mode is and its pros and cons. We have also learned how the various display filters are used on the Layer 2 datagram (frames). In the next chapter, we will explore network security and its mitigation plans in greater detail.
In the previous chapters, we learned more about protocols and their analysis techniques. In this chapter, we will learn how Wireshark helps us perform a security analysis and try to cover the security aspects in these area application and network by covering these topics:
The Heartbeat protocol (RFC6520) runs on top of the Record layer protocol (the Record layer protocol is defined in SSL).
The Heartbleed bug (CVE-2014-0160) exists in selected OpenSSL versions (1.0.1 to 1.0.1f) that implement the Heartbeat protocol.
This bug is a serious vulnerability that allows attackers to read larger portions of memory (including private keys and passwords) during Heartbeat response.
The Heartbeat protocol runs on top of the Record layer identified as record type (24) in SSL/TLS. In Wireshark, a display filter ssl.record.content_type == 24 can be used to show the HeartBeat message. Heartbeat messages are Heartbeat Request and HeartBeat Response.
Open the heartbleed.pcap packet capture file in Wireshark and set the display filter to ssl.record.content_type == 24.
Wireshark will display only encrypted heartbeat messages. The first one is the Heartbeat Request message. In this message, the length (ssl.record.length == 112) of the Heartbeat Request is set to 112 bytes, as shown in the screenshot:
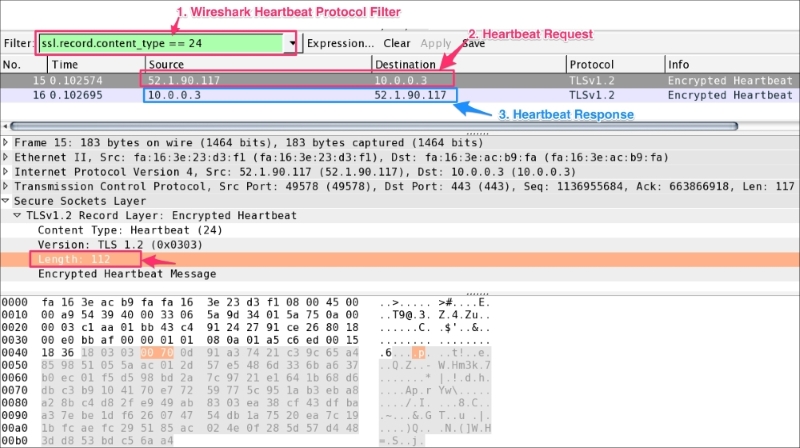
Whenever a Heartbeat Request message is send to the server, the server answers with a corresponding Heartbeat Response message.
In the given packet, the Heartbeat Response length (ssl.record.length == 144) is set to 144, which means the server has returned more data (32-bytes more) than expected. This extra information is known as the heartbleed; this bleed may contain sensitive information such as passwords and private keys:
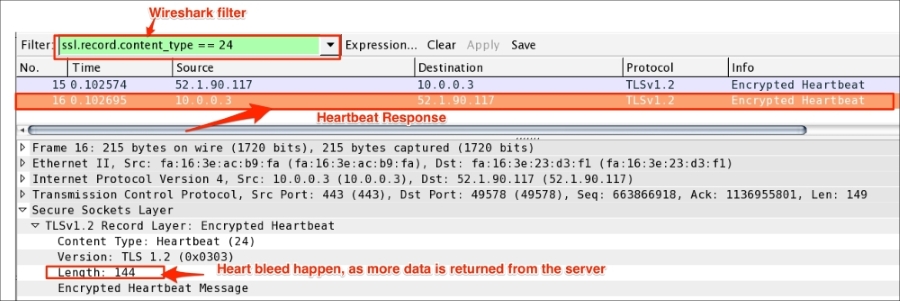
To test the heartbleed, use the following steps:
openssl library:[bash ]# openssl version OpenSSL 1.0.1c 10 May 2012
[bash #]openssl req -sha256 -new -newkey rsa:2048 -nodes -keyout ./server.key -out ./server.csr -subj "/C=PU/ST=Anish/L=Test/O=Security Analysus /OU=Heartbleed/CN=myhost.com" [bash #]openssl x509 -req -days 365 -in server.csr -signkey server.key -out server.pems
[bash ]# openssl s_server -www -cipher AES256-SHA -key ./server.key -cert ./server.pem -accept 443
[bash ]# tcpdump port 443 –s0 –w heartbleed.pcap &
If the SSL/TLS server is reachable through the public network, online filippo can be used. Other tools (such as Heartbeat Detector, which is a shell script) can also be used for this purpose:
This technique is used to attack the host in such a way that the host won't be able to serve any further requests to the user. Finally, the server crashes, resulting in a server unavailable condition.
There are various attack techniques used in this topic. We will cover SYN flood and ICMP flood detection with the help of Wireshark.
We learned about the TCP handshake process in Chapter 3, Analyzing the TCP Network. In this handshake process, a connection is established with SYN, SYN-ACK, and ACK between the client and server.
In the SYN flood attack scenario, what is happening is that:
In all these scenarios, the TCP/IP stack file descriptors are consumed, causing the server to slow down and finally crash.
Open the SYN_FLOOD.pcap packet capture file in Wireshark and perform the following steps:
The IO graph statistics show the following summary:
tcp.flags.fintcp.flags.pushIn real scenarios, this data will be mixed up with actual packet flows, but the analysis technique will remain the same. The moment you see an unexpected growth in SYN packets or a spike in SYN packets, it's a SYN flood from DoS or from the multiple-source DDoS.
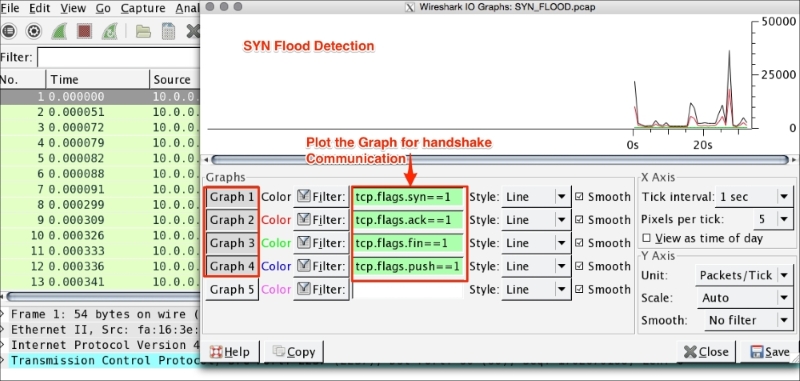
SYN attacks can be mitigated. The following are a few mitigation plans:
/etc/sysctl.conf file and make changes to these entries:#Prevent SYN attack, enable SYNcookies (they will kick-in when the max_syn_backlog reached) net.ipv4.tcp_syncookies = 1 net.ipv4.tcp_syn_retries = 2 net.ipv4.tcp_synack_retries = 2 net.ipv4.tcp_max_syn_backlog = 4096 # Increase the tcp-time-wait buckets pool size to prevent simple DOS attacks net.ipv4.tcp_max_tw_buckets = 1440000
sycltl to apply the changes:
bash#sysctl -p
# Netfilter (iptables) iptables -A INPUT -i eth0 -d 10.0.0.3/32 -j DROP ! Cisco IOS (standard) access-list NUMBER deny host 10.0.0.3 # IPFirewall (ipfw) add deny ip from 10.0.0.3 to any in # Windows Firewall (netsh) add portopening tcp 443 Wireshark DISABLE 10.0.0.3
Internet Control Message Protocol (ICMP) flood is also categorized as a Layer 3 DoS attack or a DDoS attack. It works as follows: an attacker is trying to flood the echo request (ping) packet with a spoofed IP address or the server is flooded with echo requests (ping packets) and not able to process the echo response for each ICMP echo request, resulting in host slowness and denial of service.
Open the ICMP_Flood_01.pcap packet capture file in Wireshark and perform the following steps:
As shown in the screenshot, ICMP flood has the following characteristics:
The following are a few mitigation plans for the ICMP flood attack:
bash# iptables -I INPUT -p icmp --icmp-type 8 -j DROP bash# iptables -A OUTPUT -p icmp -o eth0 -j ACCEPT bash# iptables -A INPUT -p icmp --icmp-type echo-reply -s 0/0 -i eth0 -j ACCEPT bash# iptables -A INPUT -p icmp --icmp-type destination-unreachable -s 0/0 -i eth0 -j ACCEPT bash# iptables -A INPUT -p icmp --icmp-type time-exceeded -s 0/0 -i eth0 -j ACCEPT bash# iptables -A INPUT -p icmp -i eth0 -j DROP bash# ip6tables -I INPUT -p icmpv6 –icmpv6-type 8 -j DROP bash# ip6tables -I INPUT -p icmpv6 -i eth0 -j DROP
sysctl.conf file and adding the following entry in this file:net.ipv4.icmp_echo_ignore_all = 1
sycltl to apply the changes:
bash#sysctl -p
This kind of attack happens on Layer 7 and it is difficult to detect in the sense that it resembles legitimate website traffic. In Analyzing SSL/TLS, we learned about SSL and the handshake process. The attacker can use the handshake against the system to create a DoS/DDoS attack. As handshake involves larger exchange of message between client and the server, for example, in case of one way auth total number of packet exchanges to established a connection is approximate 12 (that is, 3 packets TCP handshake + 9 packets SSL handshake = 12 packets exchanged).
The attacker can flood the SSL connection and make the server busy, to just establish the connection and try to create the DoS/DDoS scenario.
Wireshark can help in identifying from which IP maximum number of packet has arrived. This feature is called Wireshark Conversations, and can be used in any kind of flood scenario (DoS attack).
Open the ICMP_Flood_01.pcap packet capture file in Wireshark and perform the following steps:
Other categories of Layer 7 attacks are HTTP/HTTPS POST flood and HTTP/HTTPS GET flood.
In this section, we will go over the basics of vulnerability scanning and verify what is happening when the host scan is performed with the help of Wireshark.
Host discovery, port scanning, and OS detection are part of vulnerability scanning. During this process, vulnerabilities are identified and addressed with a proper mitigation plan by the security auditor. For example:
Open the host_scan.pcap file in Wireshark; the sample capture shows how the external client is scanning the ports:
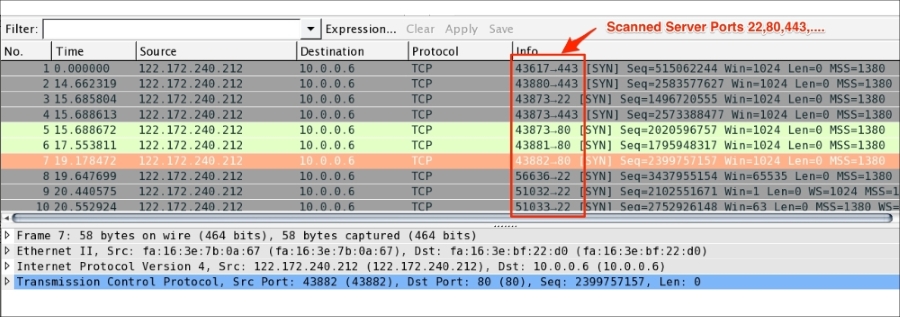
During this process, a SYN packet is sent to the all the ports for common services on each host, such as DNS, LDAP, HTTP and many more. If we get the ACK from the host, the host is considered ACTIVE on that port.
The security auditor or hacker can use network scanner tools to get the port, host, and OS information. For example, the nmap network utility command can be used to scan the active/open ports:
The online nmap tool can be found at https://pentest-tools.com/network-vulnerability-scanning/tcp-port-scanner-online-nmap.
SSL scans are done by different users (for example, security auditors and hackers) to achieve their own objectives:
An example using the nmap command to find available ciphers and the supported protocol version in a given server port 636 LDAP is as shown:
[root@ ~]# nmap --script ssl-cert,ssl-enum-ciphers -p 636 10.10.1.3To find available ciphers and the supported protocol version in a given server port 443 HTTPS [root@ ~]# nmap --script ssl-cert,ssl-enum-ciphers -p 443 10.10.1.3
Wireshark detects duplicate IPs in the ARP protocol. Use the arp.duplicate-address-frame Wireshark filter to display only duplicate IP information frames.
For example, open the ARP_Duplicate_IP.pcap file and apply the arp.duplicate-address-frame filter, as shown in the screenshot:
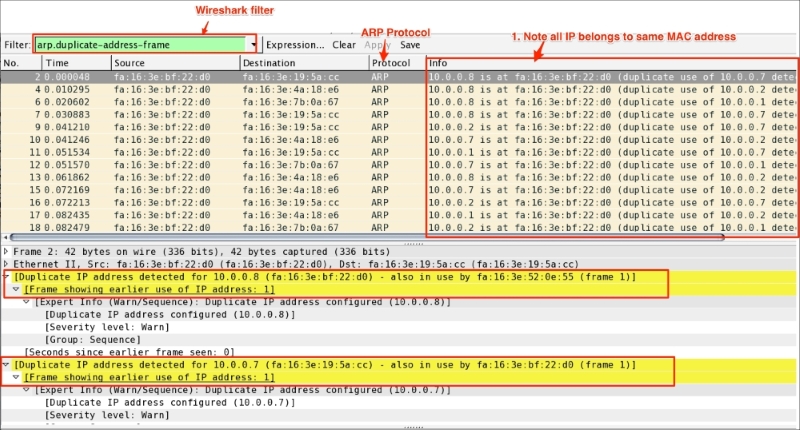
Wireshark is providing the following information in this case:
fa:16:3e:bf:22:d0 and shows as a duplicate of that IP address.Distributed Reflection Denial of Service (DrDoS), also known as UDP-based amplification attacks, uses publically accessible UDP servers and bandwidth amplification factors to overwhelm a system with UDP traffic.
Open the
DrDoS.pcap file. In this packet capture, a SYN packet is sent over a server IP address with the victim's source IP address; note the destination port is HTTP 80 and the source port is NTP port 123, UDP. Now the server will respond with an ACK packet to the source that in this case will be the victim's IP address. If multiple servers were used, the server will flood the victim (target) with ACK packets.
There are UDP protocols (DNS, NTP, and BitTorrent) that are infected by UDP-Based amplification attacks. For more information on this, refer to alert TA14-017A published by US-CERT: https://www.us-cert.gov/ncas/alerts/TA14-017A.
Wireshark supports the BitTorrent protocol. BitTorrent uses the Torrent file to download the content from the P2P network. The content that gets download through these programs is safe (depending on what kind of content is downloaded). Any download can contain Trojans or viruses so (this recommendation goes for any protocol used) be careful, especially when downloading any executable file or from unknown torrent URLs. All downloaded files are subjected to a scan. Open the bittorrent.pcapng file in Wireshark and check from that location that the content is getting downloaded.
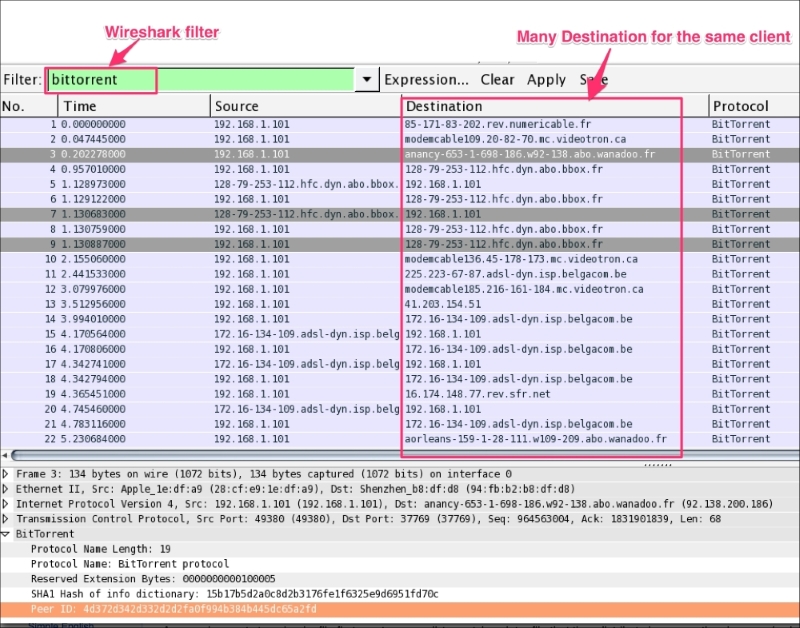
The Wireshark BitTorrent dissector is able to decode the entire download process. To check what the endpoints are from this source, do the following. Click on Statistics | Endpoints; an Endpoint Window will appear:
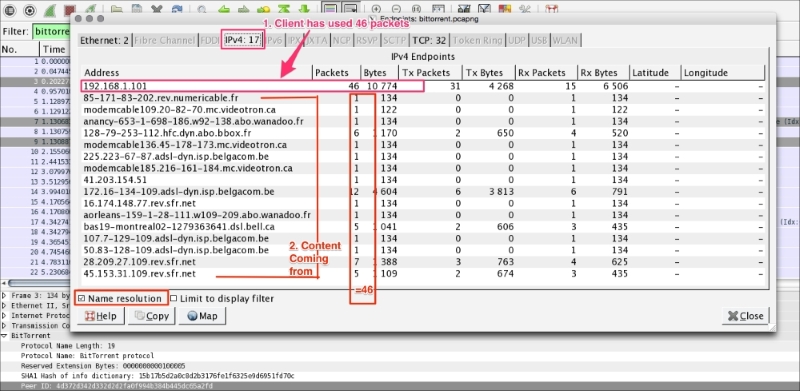
As shown in the screenshot, Wireshark has obtained the following information:
192.168.1.101) has downloaded 10744 bytes and the content is coming from different geographical locations. Since the content was downloaded from various sources, it is always advised to scan it before opening it.Endpoint statistics are a nice Wireshark feature. Endpoints reveal information such as outgoing connections for a given client. In this example, the client is connected to 16 different endpoint locations spread across different geographical locations. For any suspicious traffic, use the filter option directly on the Endpoint window.
This feature is very useful when dealing with what protocols are running on the server. To find this, click on Summary | Protocol Hierarchy in the Wireshark menu. A protocol hierarchy of the captured packets will open, as shown in the screenshot:
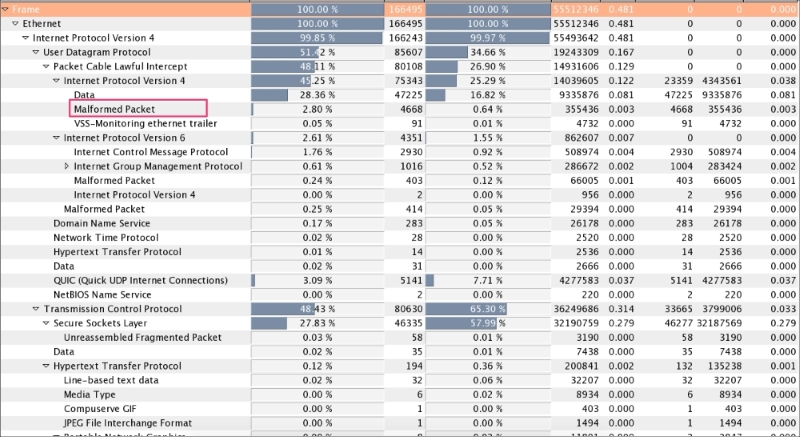
From the security point of view, it will give a high-level glance at all protocols that are happening over the Ethernet system. Network administrators use this information to harden the system configuration; for example, if the administrator found a DCE protocol running in the production system, after seeing this protocol hierarchy he can raise an alarm to stop this service.
Congratulation on completing this chapter and the book. So far, we have seen how Wireshark helps to analyze network protocols such as TCP/IP, DHCPv6, DHCP, and HTTP. We carried out a detailed analysis of the SSL/TLS protocol and WLAN setup capture; then we explored security-related issues and their mitigation plans. We also tried to be as practical as we can, and provided some real-time use case scenarios and their mitigation plans.
In this book, we have also emphasized other effective tools for capturing the packets, such as tcpdump and snoop. You should now be able to go forward and start analyzing other protocols not covered in this book by using it as a reference.
Copyright © 2015 Packt Publishing
All rights reserved. No part of this book may be reproduced, stored in a retrieval system, or transmitted in any form or by any means, without the prior written permission of the publisher, except in the case of brief quotations embedded in critical articles or reviews.
Every effort has been made in the preparation of this book to ensure the accuracy of the information presented. However, the information contained in this book is sold without warranty, either express or implied. Neither the author, nor Packt Publishing, and its dealers and distributors will be held liable for any damages caused or alleged to be caused directly or indirectly by this book.
Packt Publishing has endeavored to provide trademark information about all of the companies and products mentioned in this book by the appropriate use of capitals. However, Packt Publishing cannot guarantee the accuracy of this information.
First published: November 2015
Production reference: 1261115
Published by Packt Publishing Ltd.
Livery Place
35 Livery Street
Birmingham B3 2PB, UK.
ISBN 978-1-78588-781-9
Author
Anish Nath
Reviewers
Michael Downey
Robert Juric
Mikael Kanstrup
Acquisition Editor
Indrajit Das
Content Development Editor
Rohit Singh
Technical Editor
Mrunmayee Patil
Copy Editor
Stephen Copestake
Project Coordinator
Mary Alex
Proofreader
Safis Editing
Indexer
Monica Ajmera Mehta
Production Coordinator
Nilesh Mohite
Cover Work
Nilesh Mohite
Anish Nath is a software engineer who has more than 10 years of experience. He works at CISCO, and at CISCO, he started using Wireshark for the first time. He is thankful to CISCO. He doesn't speak much, but likes to explore new things that he has not tried or not thought of. He also tries his best to be successful at this. Though he fails a lot of time, this gives him more experience, and when success comes, he thanks all of his efforts that had failed him initially.
You can reach him at https://in.linkedin.com/in/anishnath, and his Twitter handle is @anish2good.
Michael Downey is a security analyst with a passion for *nix operating systems and network security monitoring. He is also the cofounder of the Evansville Linux User Group in Indiana, and a contributing member of OpenNSM (http://www.open-nsm.net/). In his free time, he enjoys security research and an occasional game of disc golf.
Robert Juric, while working as a network engineer, has supported government agencies, large corporations, and service providers. From his experience, he learned the value of packet analysis and has come to enjoy the details that it provides.
When not at work, Robert enjoys spending time outdoors with his wife and young son. He occasionally writes articles for his website, robertjuric.com, or can be found on Twitter at @robertj180.
Mikael Kanstrup is a software engineer with a passion for adventure and thrills in life. In his spare time, he spends his time kitesurfing, riding motocross, or just going outdoors with his family and two kids. Mikael has a BSc degree in computer science and years of experience in embedded software development and computer networking. For the past decade, he has been working as a professional software developer in the mobile phone industry.
For support files and downloads related to your book, please visit www.PacktPub.com.
Did you know that Packt offers eBook versions of every book published, with PDF and ePub files available? You can upgrade to the eBook version at www.PacktPub.com and as a print book customer, you are entitled to a discount on the eBook copy. Get in touch with us at <service@packtpub.com> for more details.
At www.PacktPub.com, you can also read a collection of free technical articles, sign up for a range of free newsletters and receive exclusive discounts and offers on Packt books and eBooks.
https://www2.packtpub.com/books/subscription/packtlib
Do you need instant solutions to your IT questions? PacktLib is Packt's online digital book library. Here, you can search, access, and read Packt's entire library of books.
If you have an account with Packt at www.PacktPub.com, you can use this to access PacktLib today and view 9 entirely free books. Simply use your login credentials for immediate access.
I would like to dedicate this book to my 5-year old son, Arjun Nath; grandfather, Sri Rajeshwar Prasad; wife, Manisha Prasad; mother, Indu Sinha; and all my family members (my father, Anil Kumar Sinha; chote papa, Sunil Kumar Sinha; choti mummy, Poonam Sinha; and friends). Without them, this would not have been possible.
The purpose of this book is to identify, learn about, and solve issues related to protocol, network, and security, and see how Wireshark helps to analyze these patterns by allowing its features to troubleshoot effectively. This book has lab exercises and contains packet capture files for offline viewing and analyses. Most of the examples contain production-like scenarios and their solutions and steps to reproduce these solutions.
This book also contains effective capturing methods that can be used directly in production without installing Wireshark.
Wireshark is an awesome tool for troubleshooting and learning, and within the scope of this book, we have taken the best use cases for different types of audiences, such as network administrators, security auditors, protocol learners, and troubleshooters.
Chapter 1, Packet Analyzers, covers the definition of packet analyzers and their use cases, network interfaces naming conventions, pcap/pcanpng file extensions, and types of network analyzer tools.
Chapter 2, Capturing Packets, covers how to capture packets using Wireshark, tcpdump, and snoop; how to use Wireshark display filters; and how to use Wireshark's cool features such as Decode-As and protocol preferences. Also, we will cover the TCP stream, exporting images, generating a firewall ACL rule, autocapture setup, and the name resolution feature.
Chapter 3, Analyzing the TCP Network, covers the TCP state machine, TCP connection establishment and closing sequence, practical troubleshooting labs such as (CLOSE_WAIT, TIME_WAIT), how to identify and fix latency issues, and Wireshark TCP sequence analysis flag (zero window, dup-ok, TCP retransmission, and window update) features.
Chapter 4, Analyzing SSL/TLS, covers the TLS/SSL two-way mutual authentication process with Wireshark, SSL/TLS decryption with Wireshark, and the identification of handshake failure with Wireshark.
Chapter 5, Analyzing Application Layer Protocols, covers how to analyze a protocol using the Wireshark display filter, how these protocols work, how to simulate these packets, capture, and display them using tcpdump/Wireshark.
Chapter 6, WLAN Capturing, covers WLAN capture setup and monitor mode, capturing with tcpdump, 802.11 display filters, Layer-2 datagram frames types, Wireshark display filters, and other Wi-Fi Sniffing products available.
Chapter 7, Security Analysis, covers the security aspect with Wireshark and discusses uses cases such as the Heartbleed bug, SYN flood/mitigation, ICMP flood/mitigation, MITM, BitTorrent, and host scanning.
The topics covered in this book require a basic understanding of TCP/IP. The examples used in this book are independent of an operating system. All the examples are executed in a MAC and Linux OS. Windows users can install Cygwin to use a Linux command-line utility. The following executables are used in this book:
In this book, you will find a number of text styles that distinguish between different kinds of information. Here are some examples of these styles and an explanation of their meaning.
Code words in text, database table names, folder names, filenames, file extensions, pathnames, dummy URLs, user input, and Twitter handles are shown as follows: "Start Wireshark by clicking on the Wireshark icon or type Wireshark in the command line."
Any command-line input or output is written as follows:
[bash ~]# cat /proc/sys/net/ipv4/tcp_fin_timeout
60
New terms and important words are shown in bold. Words that you see on the screen, for example, in menus or dialog boxes, appear in the text like this: "Click on Interface List; Wireshark will show a list of available network interfaces in the system."
Feedback from our readers is always welcome. Let us know what you think about this book—what you liked or disliked. Reader feedback is important for us as it helps us develop titles that you will really get the most out of.
To send us general feedback, simply e-mail <feedback@packtpub.com>, and mention the book's title in the subject of your message.
If there is a topic that you have expertise in and you are interested in either writing or contributing to a book, see our author guide at www.packtpub.com/authors.
Now that you are the proud owner of a Packt book, we have a number of things to help you to get the most from your purchase.
You can download the example code files from your account at http://www.packtpub.com for all the Packt Publishing books you have purchased. If you purchased this book elsewhere, you can visit http://www.packtpub.com/support and register to have the files e-mailed directly to you.
Although we have taken every care to ensure the accuracy of our content, mistakes do happen. If you find a mistake in one of our books—maybe a mistake in the text or the code—we would be grateful if you could report this to us. By doing so, you can save other readers from frustration and help us improve subsequent versions of this book. If you find any errata, please report them by visiting http://www.packtpub.com/submit-errata, selecting your book, clicking on the Errata Submission Form link, and entering the details of your errata. Once your errata are verified, your submission will be accepted and the errata will be uploaded to our website or added to any list of existing errata under the Errata section of that title.
To view the previously submitted errata, go to https://www.packtpub.com/books/content/support and enter the name of the book in the search field. The required information will appear under the Errata section.
Piracy of copyrighted material on the Internet is an ongoing problem across all media. At Packt, we take the protection of our copyright and licenses very seriously. If you come across any illegal copies of our works in any form on the Internet, please provide us with the location address or website name immediately so that we can pursue a remedy.
Please contact us at <copyright@packtpub.com> with a link to the suspected pirated material.
We appreciate your help in protecting our authors and our ability to bring you valuable content.
If you have a problem with any aspect of this book, you can contact us at <questions@packtpub.com>, and we will do our best to address the problem.
A packet analyzer is also known as a packet sniffer or a network protocol analyzer. Packet analyzer has the ability to grab the raw packet from the wire, wireless, Bluetooth, VLAN, PPP, and other network types, without getting processed by the application. By doing so it brings the whole science and innovation to this field. In this chapter we will see a few use cases of the packet analyzer by covering the following topics:
More practically, packet analyzers are employed in network security and to analyze raw traffic so as to detect scans and attacks, and for sniffing, network troubleshooting, and many more uses, as shown in the following image:
Packet analyzers can be used as follows:
The use is not limited to these bullet point, there are lots of new tools and innovations happening in this area. Find a use case and build your own packet analyzer; the best example is Wireshark.
Wireshark is perhaps one of the best open source packet analyzers available today. Wireshark is a powerful packet analyzer tool, with an easy-to-use, rich GUI and a command-line utility with very active community support: http://ask.wireshark.org.
Wireshark uses pcap (libpcap) to capture packets, which means it can capture packets in offline mode—to view the captured packets—and online mode (live traffic) to capture and display the traffic in the Wireshark GUI. Once open, the Wireshark GUI looks like this:
We will see some of the important features that are available in Wireshark in the following figure:
Wireshark has the following cool built-in features, few of them are listed as follows:
The Wireshark installation provides some command-line tools such as
dumpcap and tshark. Wireshark and tshark rely on dumpcap to capture traffic; more advanced functionality is performed by tshark. Also note that dumpcap can be run as its own standalone utility. tshark is a command-line version of Wireshark and can be used in the remote terminal.
The user must be aware of where Wireshark is installed and it should be obliged with your organization policy before start capturing on the TAP (Test Access Point) or Switch Port Analyzer (SPAN) port.
Usually developers install Wireshark on their personal laptop/desktop and capture packets, which goes in-out from the box.
Certain guidelines should be followed to perform this:
WinPCap to be installedWireshark is a packet analysis tool to use features such as packet editing/replaying, performing MITM, ARPspoof, IDS, and HTTP proxy, and there are other packet analyzer tools available and can be used as well.
The following is a list (not limited) of notable packet analyzer tools on the market; many others are commercially available. The table lists tools and their features:
|
Tools |
Packet editing |
Packet replay |
ARPspoof/MITM |
Password sniffing |
Intrusion detection |
HTTP debugger |
|---|---|---|---|---|---|---|
|
WireEdit (https://wireedit.com/) |
Y |
N |
N |
N |
N | |
|
Scapy (http://www.secdev.org/) |
Y |
Y |
Y |
N |
Y | |
|
Ettercap (https://ettercap.github.io/ettercap/) |
Y |
N |
Y |
Y |
N |
N |
|
Tcpreplay (http://tcpreplay.synfin.net/) |
N |
Y |
N |
N |
N |
N |
|
Bit-Twist (http://bittwist.sourceforge.net/) |
Y |
N |
N |
N |
N |
N |
|
Cain (http://www.oxid.it/cain.html) |
N |
N |
Y |
Y |
N |
N |
|
Snort (https://www.snort.org/) |
N |
N |
N |
N |
Y |
N |
Wireshark is not available on mobile platforms such as Android, iOS, or Windows. In order to capture mobile traffic the following tools are suggested based on the platform:
|
Platform |
Packet capture tool used |
URL |
|---|---|---|
|
Windows |
Microsoft Network Analyzers |
http://www.microsoft.com/en-in/download/details.aspx?id=19484 |
|
iOS |
Paros | |
|
Android |
Shark for Root | |
|
Kismet Android PCAP |
Various other techniques are used to capture mobile traffic using Wireshark. One such technique is creating a Wi-Fi hotspot on the laptop, allowing the mobile phone to use this Wi-Fi, and sniffing traffic on your Wi-Fi interface using Wireshark.
In this chapter we learned what packet analyzers are and what their use cases are. After a quick introduction to Wireshark, we covered what goes on behind-the-scenes when Wireshark captures packets; Wireshark benefits and important features; the necessary prerequisites before capturing packets; and other packet analyzer tools for packet editing/sniffing/replaying and so on. We also provided a brief overview of mobile packet capturing.
The next chapter will be more specific to Wireshark and its tips and tricks. After that we will explore TCP troubleshooting, then plunge into SSL, and other application protocols such as DHCPv6, DHCP, DNS, and HTTP. We will also analyze Wi-Fi capturing and carry out some security analyses with the help of Wireshark and tcpdump.
In the previous chapter, we learned what packet analyzers are used for. In this chapter we will learn more about the Wireshark GUI features, and see how it helps in capturing and analyzing packets effectively, by covering the following topics:
Start Wireshark by clicking on the Wireshark icon or type Wireshark in the command line. When Wireshark starts it launches the following screen and provides the following ways to capture packets:
The following table explains the various options that we have on the Start screen:
|
Sr. no. |
Wireshark capture options |
What is this? |
|---|---|---|
|
1 |
Interface List |
Opens up a live list of capture interfaces, and counts the incoming/outgoing packets |
|
2 |
Start |
You can choose an interface from the list and start capturing packets |
|
3 |
Capture Options |
Provides various options for capturing and displaying packets |
|
4 |
Open Recent |
Wireshark displays recently used packets |
We will cover each capturing option in detail one by one.
Click on Interface List; Wireshark will show a list of available network interfaces in the system and which one is active, by showing packets going in and out of the Interface, as shown in the following screenshot:
Choose the right (live) interfaces and click on the Start button to start capturing packets. If you want to capture packets on loopback (127.0.0.1), select the interface lo0.
In Start options, users can multiselect or select the interface displayed in the list and then click on Start. This doesn't give you the flexibility to see on which interface the packets are active. Users can configure the capture options by double clicking on the interface or by clicking on Capture Options:
Wireshark provides the flexibility to configure packets that need to be captured with various capture options. To begin, try these basic settings:
28:cf:e9:1e:df:a9 will translate to 192.168.1.101.216.58.220.46 will translate to google.com).443 will translate to https).216.58.196.14 will translate to ns4.google.com) also referred to as reverse DNS lookup.Users can also choose these options by selecting the Wireshark View menu and applying the following settings:
The drawbacks of name resolution are as follows:
Wireshark provides a range of capture filter options, use these options to decide which packets will save to the disk. These options are useful when capturing packets over a longer period of time. Wireshark uses the Berkeley Packet Filter (BPF) syntax for this purpose, for example tcp src port 22. This option also saves disk space. For example, to capture only TCP packets, follow the given steps:
Users can fine-tune Wireshark to auto-capture files periodically. To do this, click on Capture Options | Capture Files, as shown in the following screenshot:
Wireshark will generate files such as test_00001_20150623001728.pcap and test_00002_20150623001818.pcap.
The formats of the multiple generated files are as follows:
test: This is the filename00001: This is the file number20150623001728: This is the date/time stamppcap: This is the file extensionIf a packet doesn't appear in the Wireshark main window, perform the following actions:
If no interface appears on which captures can be performed, do the following:
You can also use the Wireshark community at https://ask.wireshark.org/ if queries aren't resolved.
The Wireshark main window appears when Wireshark starts capturing a packet, or when a .pcap file is open for offline viewing. It looks similar to the following screenshot:
The Wireshark UI interface consists of different panes and provides various options to the user for customizing it. In this chapter, we will cover these panes in detail:
|
Item |
What is it? |
|---|---|
|
The red box |
This shows that Wireshark is running and capturing a packet |
|
1 |
This is the Filter toolbar, used for filtering packets based on the applied filter |
|
2 |
This is the Packet List pane, which displays all captured packets |
|
3 |
This is the Packet Details pane, which shows the selected packet in a verbose form |
|
4 |
This is the Packet Byte pane, which shows the selected packet in a hex dump format |
First, just observe pane 2 in the screen; the displayed packets appear with different colors. This is one of Wireshark's best features; it colors packets according to the set filter and helps you visualize the packet you are looking for.
To manage (view, edit, or create) a coloring rule, go to View | Coloring Rules. Wireshark will display the Coloring Rules dialog box, as shown in the screenshot:
Users can create a new rule by clicking on the New button, choosing the filter name and filter string, and then applying a foreground and background color to it, to customize the packet with a specific color.
The Wireshark display filter displays packets with its available coloring options. Wireshark display filters are used to change the view of a capture file by providing the full dissection of all packets, which helps analyzing a network tracefile efficiently. For example, if a user is interested in only HTTP packets, the user can set the display filter to http, as shown in the next screenshot.
The steps to apply display filters are as follows:
http_01.pcap file.http protocol in the filter area and click on Apply.Once the filter is applied, the Packet List pane will display only HTTP protocol-related packets:
Wireshark display filter can be applied or prepared from the column displayed in the Packet List pane by selecting the column, then right-clicking and going to Apply as Filter | Selected (as shown in the following screenshot) to create the filter from the source IP address 122.167.102.21:
Wireshark provides the flexibility to apply filters from the Details pane; the steps remain the same.
Wireshark also provides the option to clear the filter. To do this click on Clear (available in the Filter toolbar) to display the entire captured packet.
Capturing and displaying packets properly will help you with packet captures. For example, to track a packet exchanged between two hosts: HOSTA (10.0.0.221) and HOSTB (122.167.99.148), open the SampleCapture01.pcap file and apply the filter ip.src == 10.0.0.221 as shown:
Let's see what the highlighted sections depict:
|
Item |
Description |
|---|---|
|
1 |
Apply filter |
|
2 |
The Packet List pane displays the traffic from source to destination. The source shows the constant IP address |
Now modify the filter (ip.src == 10.0.0.221) && (ip.dst == 122.167.99.148) to (ip.src == 10.0.0.221) or (ip.dst == 122.167.99.148). This will give the result shown in the following screenshot:
The highlighted sections in the preceding screenshot are explained as follows:
|
Item |
Description |
|---|---|
|
1 |
Applied filter |
|
2 |
The source IP address ( |
|
3 |
The destination IP address ( |
Again the Packet List pane is not displaying the conversation between the two hosts.
Now modify the filter ip.addr == 122.167.99.148. The ip.addr field will match the IP header for both the source and destination address and display the conversation between the hosts. Remember to choose the destination IP address as shown:
Let's see what the highlighted sections depict:
|
Item |
Description |
|---|---|
|
1 |
Applied filter |
|
2 |
The source IP is not constant; it shows the conversation between the two hosts |
|
3 |
The destination IP is not constant; it shows the conversation between the two hosts |
The same conversation is captured by choosing the destination MAC address using the display filter eth.addr == 06:73:7a:4c:2f:85.
Some common filter examples are as follows:
|
Filter/capture name |
Filter value |
|---|---|
|
Packet on a given port |
|
|
Packet on the source port |
|
|
SYN packet on port |
|
|
The HTTP protocol |
|
|
Based on the HTTP |
|
|
Using |
|
|
Checking the |
|
|
No |
|
|
The MAC address filter |
|
|
Filter out TCP ACK |
|
|
Check only RST and ACK packets |
|
|
Filter all SNMP |
|
|
HTTP or DNS or SSL |
|
There is no need to memorize the filter; there is an easy way to apply it. The display filter Autocomplete feature lists all dissectors after the first period "." that have been added to the display filter, as shown in the following screenshot:
It's worth checking the following links for a complete display filter reference:
The Packet List pane displays packets from the .pcap (or accepted Wireshark extensions) file or from live capture, as shown:
Let's discuss the fields shown:
To change the time-stamped information of the packet go to View | Time Display Format to view the available presentation formats, as shown:
The Wireshark Set Time Reference feature gives you the ability to view the time reference from the selected packet. Open the capture file http.pcap and set the time reference from packet 38. To do this, select packet 38, right-click, and select Set Time Reference (toggle), as shown in the following screenshot:
After *REF* is set, it becomes the starting point for all subsequent packet time calculations, as shown in the following screenshot:
The Packet Details pane will show the currently selected packet in a more detailed form. In the following screenshot, an HTTP packet is selected and its details are shown in the information labeled with numbers 1 to 5. Let's see what these are:
The frame protocol is only used by Wireshark. All the TCP/IP protocols sits on top of this. The frame shows at what time the packet was captured, as shown in the following screenshot:
Ethernet is the link layer protocol in the TCP/IP stack. It sends network packets from the sending host to one (Unicast) or more (Multicast/Broadcast) receiving hosts, as shown:
Useful filters in Ethernet are:
eth.dst == 06:3c:0f:39:2e:f7: This shows packets sent to this MAC address onlyeth.dst==ff:ff:ff:ff:ff:ff: This shows broadcast traffic onlyThe packet structure of Ethernet frames is described in the following table:
|
Preamble |
Destination MAC address |
Source MAC address |
Type/length |
User-data |
Frame check sequence (FCS) |
|---|---|---|---|---|---|
|
8 |
6 |
6 |
2 0800 for IPv4 86DD for IPv6 0806 for ARP |
46-1500 |
4 |
The preamble (8 bytes) and FCS (4 bytes) are not part of the frame and Wireshark will not capture this field.
So the total Ethernet header is 14 bytes—6 bytes for the destination address, 6 bytes for the source address, and 2 bytes for the EtherType.
The Internet Protocol information relates to how the IP packet is delivered and whether it has used IPv4 or IPv6 to deliver the datagram packets.
The preceding screenshots show that an IPv4 protocol is used to deliver the datagram packet. Useful display filters in the IP protocol are:
ip.src == 122.166.88.120/24 shows traffic from the subnetip.addr==122.166.88.120 shows traffic to or from the given host122.166.88.120 captures/filters traffic from the hostThe TCP protocol packet contains all TCP-related protocol data. If the communication is over UDP, the TCP will be replaced by the UDP, as shown in the following screenshot. The SEQ/ACK analysis will be done by Wireshark based on the sequence number and expert info will be provided:
The <<APPLICATION-LAYER>> protocol is shown if the packet contains any application protocols. As shown in the following screenshot, the selected packet 36 has HTTP protocol data. Wireshark has the ability to decode the protocol based on the standard port and present this information in the Packet Details pane in a readable (RFC-defined) format.
In the coming chapters we will discuss the application-related protocol in greater detail.
Wireshark is loaded with some awesome features. Let's go through a few, though there are more.
The Decode-As feature allows Wireshark to decode the packet based on the selected protocol. Usually Wireshark will automatically identify and decode incoming packets based on the standard port—for example, port 443 will be decoded as SSL. If the services are running on the non-standard port, for example SSL standard port is 443 and the service is running on 4433, in this case the Decode-As feature can be used to decode this communication using the SSL protocol preference.
Open the sample https.pcap file from. HTTPS traffic is captured when the file is opened in Wireshark. It doesn't show SSL-related data; instead it just shows all TCP communications:
To decode this traffic as SSL, follow these steps:
The protocol preference feature provides the flexibility for you to customize how the Wireshark display is processed, and how packets are analyzed. You can set protocol preferences by one of the following methods:
Wireshark supports a large set of protocols and it's preferences, for example HTTP protocol preferences and their meanings as defined in the following table:
|
HTTP protocol preferences |
What does this mean? |
|---|---|
|
Reassemble HTTP headers spanning multiple TCP segments |
HTTP dissector will reassemble the HTTP header if it has been transmitted over more than one TCP segment |
|
Reassemble HTTP bodies spanning multiple TCP segments |
HTTP dissector will reassemble the HTTP body if it has been transmitted over more than one TCP segment |
|
Reassemble chunked transfer-coded bodies |
Reassemble all chunks across the segments and add them to the payload |
|
Decompress entity bodies |
Used for the visualization of compressed data ( |
|
SSL/TLS ports |
Add/remove SSL/TLS ports (default is |
|
Custom HTTP header fields |
Define new header fields |
The following screenshot shows HTTP protocol preferences in Wireshark:
Refer to the example of finding the top HTTP response time in Chapter 05, Analyze the DHCP, DHCPv6, DNS, HTTP Protocols when using protocol preferences.
Use the IO graph to check client and server interaction data for a meaningful analysis. The Wireshark IO graph measures throughput (the rate is packet-per-tick), where each tick is one second. In this example we will see how to make use of the IO graph. Open the file http_01.pcap in Wireshark and follow the given steps:
tcp.analysis.duplicate_ack.There are a lot of use cases for IO graphs. Some of them are as follows:
tcp, http, udp, ntp, and ldap.The following screenshots show the results of the preceding steps:
The TCP stream feature allows users to see the data from a TCP stream. Open the file http_01.pcap in Wireshark and follow the TCP stream to get the first HTTP OK, as shown:
In this example we have located the HTTP OK on packet#35 and then right clicked and selected Follow TCP Stream:
Once the stream is applied, a TCP stream dialog box will open displaying which request is sent and what response is received in this HTTP conversation:
The stream content is available in six formats as shown; the red content in the screenshot is the request, the blue content in the screenshot is the response:
The Export Specified Packets feature allows you to export the filtered packet in different files. For example, open http.pcap in Wireshark and export the HTTP OK packet. The steps for exporting a specified packet are as follows:
http.response.code == 200 in the Filter bar:In production environments, packet-capturing tools such as Wireshark are usually not installed. In such scenarios, a default-capturing tool can be used such as tcpdump for (Linux systems) and snoop (the Solaris default); later the captured file can be used in Wireshark for analysis:
For example, the following table shows how to check packets from interfaces:
|
Description |
Solaris |
Linux |
|---|---|---|
|
How to check packets from all interfaces |
|
|
|
How to capture with hostname |
|
|
|
How to write the captured information to a file |
|
|
|
How to capture packets between |
|
|
|
How to capture traffic with verbose output to screen |
|
Very Verbose
|
|
|
| |
|
|
| |
|
How to capture the IPv6 traffic |
|
|
|
How to capture protocols |
|
|
You can also refer to the following links for more information on the topics covered in this chapter:
In this chapter we have learned how to use the Wireshark GUI. Then we explored what capture filters and display filters are, how to set up a capture, keeping performance in mind, and how to make use of other capturing tools such as tcpdump and snoop in production or in remote capturing. Then we learned about a few Wireshark features such as ACL rule generation, IO graph, Decode-As, exporting packets, and protocol preferences.
In the next chapter we will learn the TCP protocol and will discuss its practical use cases with a lab exercise that will help in troubleshooting common network problems (we will also provide the solution).
TCP is intended to be a host-to-host protocol in common use in multiple networks. In this chapter, we will analyze the TCP protocol in detail with lab exercises and examples.
This chapter covers the following topics:
Transmission Control Protocol (TCP) was first defined in RFC 675, and the v4 specification came out in RFC 793. TCP provides:
Each TCP segment has a 20-byte header with optional data values, as shown in the following screenshot displaying a TCP frame in the Wireshark Packet Details pane:
The following table describes the header fields and Wireshark filters along with their descriptions:
A connection progresses through a series of states during its lifetime. The states are:
In this section we will learn how the TCP opens and closes its connections. In order to establish a connection, the three-way handshake procedure is used as described in the following section.
The three-way handshake is a connection establishment procedure from the client socket to the server socket, as shown in the following image:
Before the start of the TCP three-way handshake, the client will be in the CLOSED state and the server will be in the LISTEN state as shown:
|
SN |
TCP-A (122.167.84.137) state |
Flow CTL |
TCP-B (10.0.0.221) state | ||
|
From |
To |
From |
To | ||
|
1 |
CLOSED |
CLOSED |
LISTEN | ||
The TCP state machine
To examine a three-way handshake in Wireshark, open the normal-connection.pcap file provided in the book.
The first step of the handshake process is that the socket client will construct a SYN packet and send it to the server. During this process the socket client will perform the following tasks:
tcp.flags.syn is set to 1 and its SYN packet is sent by the client.tcp.seq=3613047129 the initial sequence number (ISN). Wireshark shows, by default, relative sequence numbers; a user can change this setting under: Edit | Preferences | Protocols | TCP | Relative sequence numbers.tcp.ack =0.tcp.window_size is advertised to the server and its value is in the packet tcp.window_size_value == 65535, which tells it that it can transmit up to 65535 bytes of data depending on MSS. For example if MSS is 1440 bytes, the client can transmit 45 segments.tcp.options such as Maximum Segment Size (MSS), No-Operation (NOP), window scale, timestamps, and SACK permitted.tcp.options.sack_perm == 1 in the "selective acknowledgements" processing.tcp.options.timestamp.tsval == 123648340.The following table depicts the state transition of the first handshake message:
|
Sr. No. |
TCP-A (122.167.84.137) state |
Flow CTL |
TCP-B (10.0.0.221) state | ||
|
From |
To |
From |
To | ||
|
1 |
CLOSED |
CLOSED |
LISTEN | ||
|
2 |
CLOSED |
SYN_SENT |
<SEQ=3613047129><CTL=SYN> |
LISTEN | |
TCP state machine changes SYN_SENT
In this process the server responds to the client's SYN:
tcp.flags.syn =1 and tcp.flags.ack=1, confirming that the SYN has been accepted.tcp.seq=2581725269.tcp.ack=3613047130 as the client tcp.seq+1.tcp.window_size_value == 26847 as the server window size.tcp.options and responds to the client.The following table depicts the state transitions of the second handshake message:
|
Sr. No. |
TCP-A (122.167.84.137) state |
Flow CTL |
TCP-B (10.0.0.221) state | ||
|
From |
To |
From |
To | ||
|
1 |
CLOSED |
CLOSED |
LISTEN | ||
|
2 |
CLOSED |
SYN_SENT |
<SEQ=3613047129><CTL=SYN> |
LISTEN | |
|
3 |
SYN_SENT |
<SEQ=2581725269><ACK=3613047130><CTL=SYN,ACK> |
LISTEN |
SYN-RECEIVED | |
TCP state machine changes when SYN-RECEIVED is sent by the server
After successfully exchanging this message, the TCP connection will be established in this connection:
tcp.flags.ack == 1 and sends to the server.tcp.seq=3613047130 is ISN+1 and tcp.ack=2581725270 is SYN_ACK( tcp.seq+1).tcp.window_size_value == 4105.The following table depicts the state transitions of the third handshake message:
|
Sr. No. |
TCP-A (122.167.84.137) state |
Flow CTL |
TCP-B (10.0.0.221) state | ||
|
From |
To |
From |
To | ||
|
1 |
CLOSED |
CLOSED |
LISTEN | ||
|
2 |
CLOSED |
SYN_SENT |
<SEQ=3613047129><CTL=SYN> |
LISTEN | |
|
3 |
SYN_SENT |
<SEQ=2581725269><ACK=3613047130><CTL=SYN,ACK> |
LISTEN |
SYN-RECEIVED | |
|
4 |
SYN_SENT |
ESTABLISHED |
<SEQ=3613047130>><ACK=2581725270><CTL=ACK> |
SYN-RECEIVED |
ESTABLISHED |
TCP state machine when the client sends ACK
Once the three-way connection is established, the data is communicated by exchanging the segments and the PUSH flag is set to indicate that the data flows on a connection as a stream of octets, as shown in the following figure:
Select packet#4 from the normal-connection.pcap file as shown in the following screenshot; expand the TCP section in the Packet Details pane:
As you can see in the preceding screenshot:
tcp.flags.push = 1.tcp.flags.ack =1.414e495348204e415448204e4f524d414c20434f4e4e4543....(tcp.flags.ack == 1) && (tcp.flags.push == 1); that is, the [PSH,ACK] flag indicates that the host is acknowledging receipt of some previous data and also transmitting some more data.The useful Wireshark display filters are:
data: Displays the packet that contains the data information, for all IPs:data && ip.addr==10.0.0.221: Displays a list of packets that have data and are exchanged with the given IP addresstcp.flags.push == 1: Displays all PUSH packetstcp.flags.push == 1 && ip.addr==10.0.0.221: Displays PUSH packets between hoststcp.flags == 0x0018: Display all PSH, ACK packetstcp.flags == 0x0011: Displays all FIN, ACK packetstcp.flags == 0x0010: Displays all ACK packetsTCP normal close appears when the client or server decides that all data has been sent to the receiver and we can close the connection. There are three ways a TCP connection is closed:
FIN packet to the serverFIN packet to the clientOpen the normal-connection.pcap file and select packet #5 in the Packet List pane. Go to the Wireshark Packet Details pane, as shown in the screenshot, and examine the TCP protocol.
In Wireshark add the Sequence number and Acknowledgement number to the column. To add the sequence number and acknowledgement number, choose the TCP header packet, right-click on the field (Sequence number / Acknowledgement number) in the packet details and select Display as Column. Or implement these settings to add a new column:
The server has initiated the FIN packet. When the data transfer is completed, see packet#5 in the following screenshot:
As you can see in the preceding screenshot:
FIN packet to close the connection in packet#5[FIN,ACK] (tcp.flags.fin == 1) && (tcp.flags.ack == 1) and sends it to the clienttcp.seq == 2581725299 is acknowledged in packet#7FIN to close the connection in packet#8[FIN,ACK] (tcp.flags.fin == 1) && (tcp.flags.ack == 1) and sends it to the servertcp.seq == 3613047130 is acknowledged in packet#9The TCP state machine when the server and client close the socket connection, server initiated FIN:
|
Sr. No. |
TCP-A (122.167.84.137) state |
Flow CTL |
TCP-B (10.0.0.221) state | ||
|
From |
To |
From |
To | ||
|
1 |
CLOSED |
CLOSED |
LISTEN | ||
|
2 |
CLOSED |
SYN_SENT |
<SEQ=3613047129><CTL=SYN> |
LISTEN | |
|
3 |
SYN_SENT |
<SEQ=2581725269><ACK=3613047130><CTL=SYN,ACK> |
LISTEN |
SYN-RECEIVED | |
|
4 |
SYN_SENT |
ESTABLISHED |
SEQ=3613047130>><ACK=2581725270><CTL=ACK> |
SYN-RECEIVED |
ESTABLISHED |
|
5 |
ESTABLISHED |
ESTABLISHED |
<SEQ=3613047130>><ACK=2581725270><CTL=PSH,ACK> |
ESTABLISHED |
ESTABLISHED |
|
6 |
ESTABLISHED |
ESTABLISHED |
<SEQ=3613047130>><ACK=2581725299><CTL=ACK> |
ESTABLISHED |
ESTABLISHED |
|
7 |
ESTABLISHED |
ESTABLISHED |
<SEQ=2581725299>><ACK=3613047130><CTL=FIN.ACK> |
ESTABLISED |
FIN_WAIT-1 |
|
8 |
ESTABLISHED |
CLOSE_WAIT |
<SEQ=3613047130>><ACK=2581725300><CTL=ACK> |
FIN_WAIT-1 |
FIN_WAIT-2 |
|
9 |
CLOSE_WAIT |
LAST_ACK |
SEQ=3613047130>><ACK=2581725300><CTL=FIN.ACK> |
FIN_WAIT-2 |
TIME_WAIT |
|
10 |
LAST_ACK |
CLOSED |
TIME_WAIT |
CLOSED | |
Wireshark filters used in this scenario are as follows:
tcp.analysis:SEQ/ACK: Provides links to the segments of the matching sequence/ack numberstcp.connection.fin: Provides expert informationtcp.flags == 0x0011: Displays all the [FIN,ACK] packetsThe steps to capture the normal TCP connection flow (a sample program is provided as part of this book) are as follows:
tcp.port==8082.TCPServer01.java using the javac command:
bash$ ~ javac TCPServer01.java
TCPServer01 using the java command:
bash$ ~ java TCPServer01
8082:bash$ ~ netstat -an | grep 8082 tcp46 0 0 *.8082 *.* LISTEN
Client0301.java using the javac command:
bash$ ~ javac Client0301.java
bash$ ~ java Client0301
In this section we will learn about different network problems that occur and try to analyze and solve them with lab exercises. Let's start with the Reset (RST) packet.
The TCP RST flag resets the connection. It indicates that the receiver should delete the connection. The receiver deletes the connection based on the sequence number and header information. If a connection doesn't exist on the receiver RST is set, and it can come at any time during the TCP connection lifecycle due to abnormal behavior. Let's take one example: a RST packet is sent after receiving SYN/ACK, as shown in the next image.
In this example we will see why RST has been set after SYN-ACK instead of ACK:
Open the RST-01.pcap file in the Wireshark:
As you can see in the preceding figure:
RST packet should not be seen normallyRST is set after the first two handshakes are complete. A possible explanation could be one of the following:This is the most common use case. Open the RST-02-ServerSocket-CLOSED.pcap file in Wireshark. In this example the server was not started, the client attempted to make a connection, and the connection refused an RST packet:
The steps to generate the RST flag in a generic scenario, when the server is not in the listening state, are as follows:
tcp.port==8082.Client0301.java:
bash$ ~ javac Client0301.java
bash$ ~ java Client0301
RST packet in Wireshark.Often a connection is stuck in the CLOSE_WAIT state. This scenario typically occurs when the receiver is waiting for a connection termination request from the peer.
To demonstrate the
CLOSE_WAIT state, open the close_wait.pcap file in Wireshark:
As you can see in the preceding screenshot:
tcp.flags.fin == 1, and set tcp.seq == 2131384057.ACK packet tcp.ack == 2131384058 in packet#7 and didn't close its socket, which remains in the CLOSE_WAIT state.
CLOSE_WAIT means there is something wrong with the application code, and in the high-traffic environment if CLOSE_WAIT keeps increasing, it can make your application process slow and can crash it.
The steps to reproduce CLOSE_WAIT are as follows:
tcp.port==9999.Server0302.java and Client0302.java using the javac command:
bash$ ~ javac Server0302.java Client0302.java
Server0302 using the java command:
bash$ ~ java TCPServer01
9999:bash $ netstat -an | grep 999 tcp46 0 0 *.9999 *.* LISTEN
bash$ ~ java Client0302
CLOSE_WAIT state:bash $ netstat -an | grep CLOSE_WAIT tcp4 0 0 127.0.0.1.56960 127.0.0.1.9999 CLOSE_WAIT
CLOSE_WAIT, a restart is required for the process.FIN packet from both the client and server is required to solve the CLOSE_WAIT problem. Close the client socket and server socket when done with processing the record:
socket.close(); à Initiates the FIN flow
Client0302.java file and close the socket:Socket socket = new Socket(InetAddress.getByName("localhost"), 9999); … socket.close(); … Thread.sleep(Integer.MAX_VALUE);
CLOSE_WAIT will not be visible.The main purpose of the
TIME_WAIT state is to close a connection gracefully, when one of ends sits in LAST_ACK or CLOSING retransmitting FIN and one or more of our ACK are lost.
RFC 1122: "When a connection is closed actively, it MUST linger in TIME-WAIT state for a time 2xMSL (Maximum Segment Lifetime). However, it MAY accept a new SYN from the remote TCP to reopen the connection directly from TIME-WAIT state, if..."
We ignore the conditions because we are in the TIME_WAIT state anyway.
Until now we have been troubleshooting connection-related issues. In this section, we will check the latency part. Latency can be on the network, or in application processing on the part of the client or server.
Identifying the source of latency also plays an important role in TCP troubleshooting. Let's see what the common causes of latency are:
ping utility/etc/sysctl.cnf fileVarious network utility tools are available to measure the latency between networks—for example traceroute, tcpping, and ping.
ping: This utility can be used to measure the round trip time (RTT):bash$ ping -c4 google.com PING google.com (216.58.196.110): 56 data bytes 64 bytes from 216.58.196.110: icmp_seq=0 ttl=55 time=226.034 ms 64 bytes from 216.58.196.110: icmp_seq=1 ttl=55 time=207.748 ms 64 bytes from 216.58.196.110: icmp_seq=2 ttl=55 time=222.995 ms 64 bytes from 216.58.196.110: icmp_seq=3 ttl=55 time=162.507 ms --- google.com ping statistics --- 4 packets transmitted, 4 packets received, 0.0% packet loss round-trip min/avg/max/stddev = 162.507/204.821/226.034/25.394 ms
traceroute: This is used to identify the number of HOPS it has taken to reach the destination—the fewer the hops, the lower the latencyWireshark can be used effectively to identify whether the network is slow or the application is slow. Open the slow_download.pcap file in Wireshark, and investigate the root cause of why the download is slow.
In this example, 5 MB of data is requested from the HTTP server, and it has taken approx. 4.99 minutes to download, as shown:
The steps to diagnose this issue are as follows:
http.response.code==200.http.time == 299.816907000 to approximately 4.99 minutes.http.content_length_header == "5242880"; this is the size of the content.tcp.segment.count == 2584—and ask yourself whether so many are needed and whether the number can be reduced.window_size for the client and server to check what was advertised by the client and what got used.tcp.window_size_value in the Wireshark column and sort in ascending order. Note that the entire packet flow from the server (10.0.0.16) to the client (122.167.205.152) has a window size of 100.sysctl.conf file in UNIX-flavored systems and check the TCP tuning parameters such as net.core.rmem_max, net.core.wmem_max, net.ipv4.tcp_rmem, and net.ipv4.tcp_wmemnet.ipv4.tcp_mem.In this scenario, tcp.window_size was reduced in the sysctl.conf file to demonstrate the slow_download behavior and to give an insight into troubleshooting. After fixing Window_Size, the same download is reduced from 299.816907000 to 2.84 seconds. Open the fast_download.pcap file as shown in the following screenshot; the download time is reduced:
In this example, the TCP handshake process will be used to identify wire latency. Open the slow_client_ack.pcap file as shown in the following screenshot:
As you can see in the preceding screenshot:
SYN, SYN-ACK) sent by the client/server over the wire are exchanged in less timeACK sent by the client has taken frame.time_relative == 15.798777000 seconds and shows an increase in Time Since Reference. This is higher than the first two handshake messages, which confirms a wire latency on this packetWireshark has a built-in filter, tcp.analysys.flags, that will show you packets that have some kind of expert message from Wireshark; tcp.analysis.flags is shown in the TCP section of the Packet Details pane. Under that, expand SEQ/ACK analysis then expand TCP Analysis Flags. This will tell you exactly what triggered tcp.analysis.flags. A few examples include:
TCP makes the transmission of segments reliable via sequence number and acknowledgement. When TCP transmits a segment containing data, it puts a copy on a retransmission queue and starts a timer; when the acknowledgment for that data is received, the segment is deleted from the queue. If the acknowledgment is not received before the timer runs out, the segment is retransmitted. During TCP retransmission, the sequence number is not changed until the retransmission timeout happens.
Open the example tcp-retransmission.pcapng in Wireshark and add a Sequence number column, as shown in the following screenshot:
As you can see in the preceding screenshot:
tcp.seq == 1870089183 a lot of TCP retransmission occursFor another example, open the file syn_sent_timeout_SSH.pcapng in Wireshark, and observe the TCP retransmission flow.
The steps to reproduce the TCP retransmission are as follows (this lab is performed in CentOs6 using the telnet and nc command utilities):
[bash ~]# iptables -A OUTPUT -p tcp --dport 8082 -j DROP
[bash ~]# iptables save
[bash ~]# nc -l 8082
tcp.port==8082.
[bash ~]telnet 128.136.179.233 8082
bash$ netstat -an |   grep 8082
tcp4       0      0  192.168.1.101.64658    128.136.179.233.8082   SYN_SENT
In order to solve operation timeouts, verify the ACL configuration; it allows the incoming packet from the source IP.
Open the tcp_zero_window.pcapng file in Wireshark and add tcp.window_size_value to the column.
The TCP window size represents how much data a device can handle from its peer at one time before it is passed to the application process.
As shown in the preceding screenshot:
window_size to the Wireshark column and look for the packet where tcp.window_size=0.tcp.window_size_value is set to 0 and tcp.window_size == 0.Troubleshoot the ZeroWindow condition:
Wireshark marks a packet as Window Update when the window size has changed. A Window Update is an ACK packet, and only expands the window; this is normal TCP behavior.
Open the tcp_window_update.pcap file in Wireshark and observe that a TCP Window Update event is set, as shown:
The following references will be useful while working with TCP/IP not limited:
In this chapter you have learnt how the TCP opens and closes its connection, and how TCP states are maintained during this period. This chapter also covered error patterns seen on networks and how to troubleshoot those scenarios.
In the next chapter we will implement deep-packet inspections of the SSL protocol.
In this chapter we will learn what SSL/TLS is used for, how the entire handshake process happens, and about the common areas where the SSL/TLS handshake fails, by covering the following topics:
Transport Layer Security (TLS) is the new name for Secure Socket Layer (SSL). It provides a secure transport connection between applications with the following benefits:
Knowing the versions is extremely important while debugging handshake issues, as most handshake failures happen in this process.
Netscape developed the original SSL versions and other versions; their RFC numbers are shown in the following table:
|
Protocol |
Year |
RFC |
Deprecated |
|---|---|---|---|
|
SSL 1.0 |
N/A |
N/A |
N/A |
|
SSL 2.0 |
1995 |
NA |
Y RFC 6176 |
|
SSL 3.0 |
1996 |
RFC 6101 |
Y RFC 7568 |
|
TLS 1.0 |
1999 |
RFC 2246 |
N |
|
TLS 1.1 |
2006 |
RFC 4346 |
N |
|
TLS 1.2 |
2008 |
RFC 5246 |
N |
|
TLS 1.3 |
TBD |
DRAFT |
N |
The TLS Handshake Protocol is responsible for the authentication and key exchange necessary to establish or resume a secure session. Handshake Protocol manages the following:
There are ten types of message, as shown in the following table, and their corresponding Wireshark filters. This is a one-byte field in the Handshake Protocol:
|
Type |
Protocol |
Message |
Wireshark content type |
Wireshark filter |
|---|---|---|---|---|
|
0 |
Handshake |
Hello request |
|
|
|
1 |
Client Hello |
| ||
|
2 |
Server Hello |
| ||
|
11 |
Certificate |
| ||
|
12 |
ServerKeyExchange |
| ||
|
13 |
CertificateRequest |
| ||
|
14 |
ServerHelloDone |
| ||
|
15 |
Certificate Verify |
| ||
|
16 |
Client Key Exchange |
| ||
|
20 |
Finished |
| ||
|
ChangeCipherSpec |
| |||
|
Application Data |
| |||
|
Alert Protocol |
|
The TLS Handshake Protocol involves the following steps in four phases; the prerequisite is that a TCP connection should be established:
Open the file two-way-handshake.pcap, which is an example demonstrating a SSL mutual authentication procedure:
The TLS handshake starts with the Client Hello message (ssl.handshake.type == 1), as shown in the following screenshot:
Handshake records are identified as hex byte 0x16=22. The structure of the Client Hello message is as follows:
0x01.0x0303 means it's TLS 1.2; note 0x300 =SSL3.0.0x00 shows the session ID as empty; this means no session is available and generates new security parameters.|
Value |
Extension name |
Reference |
|---|---|---|
|
0 |
|
RFC4492 |
|
1 |
|
RFC4492 |
|
3 |
|
RFC 5246 |
|
5 |
|
RFC 6520 |
For a complete list of TLS extensions, visit: http://www.iana.org/assignments/tls-extensiontype-values/tls-extensiontype-values.xhtml.
The server will send the Server Hello message (ssl.handshake.type == 2) in response to the Client Hello, as shown in the following screenshot. The message structure of the Client Hello and Server Hello message is the same, with one difference—the server can select only one cipher suite:
Handshake records are identified as hex byte 0x16=22. The structure of the Server Hello message is:
0x02=2 shows the Server Hello message0x0303 shows TLS 1.2 has been accepted by the server|
Server/client |
SSLv2 |
SSLv3 |
SSLv23 |
TLSv1 |
TLSv1.1 |
TLSv1.2 |
|---|---|---|---|---|---|---|
|
SSLv2 |
Y |
N |
Y |
N |
N |
N |
|
SSLv3 |
N |
Y |
Y |
N |
N |
N |
|
SSLv23 |
N |
Y |
Y |
Y |
Y |
Y |
|
TLSv1 |
N |
N |
Y |
Y |
N |
N |
|
TLSv1.1 |
N |
N |
Y |
N |
Y |
N |
|
TLSv1.2 |
N |
N |
Y |
N |
N |
Y |
The following table shows which SSL version of the client can connect to which SSL version of the server:
Cipher Suite: TLS_ECDHE_RSA_WITH_AES_256_GCM_SHA384 (0xc030), which means use Elliptic curve Diffie-Hellman (ECDHE) key exchange, RSA for authentication, Block cipher Galois/Counter Mode (GCM), AES-256 for encryption, and SHA-384 for digestsAfter the Server Hello message is sent, the server should send a X.509 server certificate (ssl.handshake.type == 11). The certificate configured on the server are signed by the CA or intermediate CA, or can be self-signed based on your deployment:
If a SSL/TLS server is configured with the certificate chain then the entire chain will be presented to the client along with the server certificate. The client (a browser or any other SSL/TLS client) can then check the highest certificate in the chain with stored CA certificates; typically, modern Web browsers have the root CA installed from the trusted CA provider.
The given certificate is signed with the relevant signature (sha256WithRSAEncryption); in this case, the hash value itself is concatenated into the OID (Algorithm Id: 1.2.840.113549.1.1.11) representing the signing algorithm. The certificate follows the DER encoding format and when encrypted becomes PKCS#7, the Cryptographic Message Syntax Standard (refer to RFC 2315).
From RFC #5246, the server sends the Server Key Exchange message (ssl.handshake.type == 12) only when the Server Certificate message (if sent) does not contain enough data to allow the client to exchange a premaster secret:
As you can see in the preceding screenshot:
DHE_DSS, DHE_RSA,DH_anonRSA, DH_DSS, DH_RSAThe server can optionally ask client to verify its certificate. To support mutual authentication, the server will send the certificate request message (ssl.handshake.type == 13) to the client and the client must provide its certificate information to the server. If the client fails to provide it, an Alert protocol will be generated and the connection will terminate.
The Server Hello Done message means that the server is done sending messages to support the key exchange, and the client can proceed with its phase of the key exchange:
The client will send its certificate (ssl.handshake.type == 11) only in a mutual authentication condition. The server will verify the certificate in its CA chain. If the server fails to verify client_certificate, the server will raise an alert fatal protocol and communication will stop:
In the case of the normal handshake process (one way auth), the Client Key Exchange message is the first message sent by the client after it receives the Server Hello Done message.
This Client Key Exchange message (ssl.handshake.type == 16) will always be sent by the client. When this message is seen, pre_master_secret is set, either by transmission of the RSA-encrypted secret or by the Diffie-Hellman parameters, depending on the key exchange method chosen. The server uses its private key to decrypt premaster_secret:
The Client Certificate Verify message will be sent after the Client Key Exchange message (ssl.handshake.type == 16) using master_secret generated by pre_master_secret.
The Change Cipher Spec record type (ssl.record.content_type == 20) is different from the handshake record type (ssl.record.content_type == 22) and it's a part of the Change Cipher Spec protocol. The Change Cipher Spec message is sent by both the client and server only when key_exchange is completed and it indicates to the receiving party that subsequent records will be protected under the newly negotiated Change Cipher Spec and keys (master_secret):
The Finished (ssl.record.content_type == 22) message is encrypted so it will be an encrypted handshake message in Wireshark. This message is sent immediately after a Change Cipher Spec message from both the client and server to verify that the key exchange and authentication processes were successful. This message contain the MD5 hash +SHA hash. When both the client and server have sent the Finished message, the TLS handshake is considered to have finished successfully and now sending and receiving application data over the secure channel can begin:
The Application Data message (ssl.record.content_type == 23) is carried by the record layer and fragmented, compressed, and encrypted:
Record layer processing involves the mentioned step as shown in the following screenshot:
The Alert Protocol (ssl.record.content_type == 21) describes the severity of the message and the alert. Alert messages are encrypted and compressed and support two alert levels: warning and fatal. In the case of fatal alerts, the connection will be terminated.
Alert descriptions are shown in the following table:
As shown in the following screenshot, the Alert Protocol is generated by the server:
In the next section, we will talk about how the SSL/TLS channel can be decrypted; before that, we need to understand what the different keys exchange methods are and what their cipher suites look like. These are the following key exchange methods.
This protocol allows two users to exchange a secret key over an insecure medium without any prior secrets; in this scheme, the example cipher suites will have a naming convention such as:
Cipher suites will have "DH" in their name, not "DHE" or "DH_anon".
You can learn more about Diffie-Hellman at: https://en.wikipedia.org/wiki/Diffie-Hellman_key_exchange.
Elliptic curve Diffie-Hellman is a modified Diffie-Hellman exchange that uses elliptic curve cryptography instead of the traditional RSA-style large primes. Elliptic curve cryptography (ECC) is a public-key cryptosystem just like RSA, Rabin, and El Gamal. Some important points with this algorithm are:
You can learn more about Elliptic Curve Diffie-Hellman at: https://en.wikipedia.org/wiki/Elliptic_curve_Diffie–Hellman.
Note that the Client Hello message exchange process in the Extension elliptic_curves key exchange was offered. The example cipher suites will follow a naming convention such as:
Cipher suites will have "DHE" in their name, not "DH" or "DH_anon".
The server's public key is made available to the client during the Server Key Exchange handshake. The pre_master_secret key is encrypted with the server public RSA key. The example cipher suites in this case will be:
Cipher suites will have "RSA" in their name, not "DH" or "DH_anon" or "DHE".
So far we have learned how the SSL/TLS protocol encrypts traffic and maintains confidentiality. In the next section, we will cover how Wireshark helps to decrypt SSL/TLS traffic.
Decryption of TLS traffic depends upon which cipher suite was chosen by the server in the Server Hello message. Open the file decrypt-ssl-01.pcap and look for the cipher selected by the server. In this case the TLS_RSA_WITH_AES_256_CBC_SHA cipher suite was used; since this is RSA, we can decrypt the packet using our private key.
Now go to Edit | Preferences | Protocol | SSL, add the new RSA key, and configure the following properties of the RSA key dialog box:
After applying these settings, the SSL traffic will be decoded into HTTP traffic for that IP, as shown in the following screenshot:
Once the packet is decrypted, the SSL session can be exported by clicking on File | Export SSL Session Keys. A dialog box will open; save this session key in the file (exported-session-keys). The content of the file looks like this:
RSA Session-ID:af458c9c61675238b74f40b2a9547a0a2a394ada458a1b648e0495ed279d5e2e Master-Key:6c970211a77548811267646a759d0d03bbc532d9b6336f2b656cb0c6bbef8f3a262d845b9abed87d26583a9c4bb9b230
Once the exported-session-keys file is created, use this file to decrypt the SSL/TLS traffic. To do so, go to Edit | Preferences | Protocol | SSL and configure the (Pre)-master-secret log file with the path of the SSL Session Keys. This approach is helpful when the user wants to share the packet without sharing the private keys and still needs to provide the decryption step:
DHE/ECDHE can't be decrypted using this approach even if we have private keys as they are designed to support forward secrecy.
Forward secrecy is supported in the Diffie-Hellman (DHE) and Elliptic curve cryptography Diffie-Hellman (ECDHE) key exchange algorithms. Take the previous scenario; the SSL/TLS communication can be decrypted by knowing the server's private key. If the private key is compromised by poor system hardening or (an internal threat agent), the SSL/TLS communication can be broken. In forward secrecy, the SSL/TLS communication is secure even if we have access to the server's private key.
If the cipher suite's name contains "ECDHE" or "DHE", it means it supports forward secrecy. For example, note this cipher suite name: TLS_ECDHE_RSA_WITH_RC4_128_SHA.
In the section, we will learn how to debug common SSL-related issues:
nmap utility as shown:root@bash :/home/ubuntu# nmap --script ssl-cert,ssl-enum-ciphers -p 443 10.0.0.106 Starting Nmap 6.40 ( http://nmap.org ) at 2015-08-03 16:49 UTC Nmap scan report for ip-10-0-0-106.ap-southeast-1.compute.internal (10.0.0.106) Host is up (0.000067s latency). PORT STATE SERVICE 443/tcp open https | ssl-cert: Subject: commonName=ip-10-0-0-106/organizationName=Internet Widgits Pty Ltd/stateOrProvinceName=Some-State/countryName=AU | Issuer: commonName=ip-10-0-0-106/organizationName=Internet Widgits Pty Ltd/stateOrProvinceName=Some-State/countryName=AU | Public Key type: rsa | Public Key bits: 2048 | Not valid before: 2015-07-28T14:43:45+00:00 | Not valid after: 2016-07-27T14:43:45+00:00 | MD5: 9ba5 0ea9 14b2 0793 7fe6 9329 08ce fab3 |_SHA-1: 1604 27b6 4f1c a838 9a9d db67 3136 88de effb f881 | ssl-enum-ciphers: | TLSv1.2: | ciphers: | TLS_ECDHE_RSA_WITH_AES_256_CBC_SHA - strong | compressors: | NULL |_ least strength: strong
nmap output shows the server supports TLSv1.2 and one cipher suite. If the client connects with other SSL protocols or cipher suites the server doesn't support, the server will return with handshake failure. For example, connecting the same server with TLSv1.1 will return an error:rootbash # curl -k --tlsv1.1 https://10.0.0.106 curl: (35) Unknown SSL protocol error in connection to 10.0.0.106:443
root@bash # curl -k --ciphers  EXP-RC2-CBC-MD5  https://10.0.0.106
curl: (35) error:14077410:SSL routines:SSL23_GET_SERVER_HELLO:sslv3 alert handshake failure
unknown_ca error check the following find the hash value from the certificate, private key and CSR file use the following commands:bash $ openssl x509 -noout -modulus -in server.crt | openssl md5 f637e8d51413ff7fa8d609e21cb27244 bash $ openssl rsa -noout -modulus -in server.key | openssl md5 f637e8d51413ff7fa8d609e21cb27244 bash $ openssl req -noout -modulus -in server.csr | openssl f637e8d51413ff7fa8d609e21cb27244
The md5 hash value of csr, cer, and the private key will be the same, if csr is generated with the client private key, though the certificate is generated by using the CA (Intermediate CA) private key.
If the md5 file is the same, then verify that the certificate issued by the CA matches its path:
bash $ openssl verify -verbose -CAfile cacert.pem  server.crt
bash $ openssl verify -verbose -CAfile cacert.pem  client.crt
In this chapter, we have learned how the SSL/TLS Handshake Protocol works and how to analyze it using Wireshark. We have examined sample debugging issues related to handshakes, and learned how to solve them. In the next chapter, we will continue analyzing other application layer protocols with the help of Wireshark.
In the previous chapter, we covered the SSL/TLS application layer protocol in detail. In this chapter, we will continue with other application layer protocols (their basic flows and some generic use cases) and learn how to generate these types of traffic:
The Dynamic Host Configuration Protocol for IPv6 (DHCPv6) is an application layer protocol that provides a DHCPv6 client with IPv6 an address, and other configuration information, that is carried in the DHCPv6 options.
DHCPv6 is both a Stateful Address Autoconfiguration protocol and a Stateless Address Configuration protocol.
The client and server exchange DHCPv6 message over UDP; the client uses a link-local address, DHCPv6 receives message over the link-scoped multicast address. If the DHCPv6 server is not attached to the same link, then a DHCPv6 relay agent on the client's link will relay messages between the DHCPv6 client and DHCPv6 server, as shown in the following screenshot:
Multicast addresses are used by the DHCPv6 client to send datagrams to a group of DHCPv6 servers:
FF02::1:2 (link local)FF05::1:3 (site local)Servers and relay agents listen for DHCPv6 messages on UDP port 547; clients listen for DHCPv6 messages on UDP port 546. To find the port information, the netstat command can be used:
[root@bash ~]# netstat -an | grep 547
udp        0      0 :::547                      :::*
DHCPv6 messages are exchanged over UDP port 546 and 547 and the messages are described in the following table:
DHCPv6 message exchanges happen in order to obtain the IPv6 addresses, configuration (NTP server, DNS server), or RENEW/RELEASE/DECLINE of the IPv6 address, and these message exchanges are categorized in two parts:
The acronym for a four-message exchange is SARR, and it is used to request the assignment of one or more IPv6 addresses. The message flow is as follows:
SOLICITADVERTISEREQUESTREPLYOpen the DHCPv6-Flow-SOLICIT.pcap file in Wireshark, and examine the IP assignment flow as shown:
The preceding screenshot shows a SARR flow packet being captured. IPv6 is assigned to the DHCPv6 client, and the message exchanges in detail are:
SOLICIT: The client (fe80::f816:3eff:fe1d:e848) sends a SOLICIT message to locate the servers. Note the destination is multicast ff02::1:2 not the server (destination) IPv6 address:dhcpv6.option.type == 1.dhcpv6.option.type == 6) to the server that is interested in receiving. In this case, the client has requested the name server information.dhcpv6.option.type == 3) and uses IA_TA options to request the assignment of temporary addresses.ADVERTISE: The server (fe80::f816:3eff:fe1d:e848) sends the ADVERTISE (dhcpv6.msgtype == 2) message to the client (fe80::f816:3eff:fe1d:e848). There can be multiple servers that will respond to the client SOLICIT message; the client will choose the DHCPv6 server based on its preference:dhcpv6.option.type == 3) value based on its preferences.dhcpv6.option.type == 2) information. The Server Identifier option is used to carry DUID. The DUID is the DHCP Unique Identifier, the host identifier in IPv6. (In the case of DHCPv4, the host identifier is the MAC address.)dhcpv6.option.type == 23) information as requested in the SOLICIT message.0x10eafe in this case must match with the client SOLICIT transaction ID.REQUEST: In this message the client chooses one of the servers and sends a REQUEST message to the server asking for confirmed assignment of addresses and other configuration information:fe80::f816:3eff:fe1d:e848) constructs the REQUEST packet and sends it to multicast ff02::1:20x3ec03e.(random)REQUEST packetREPLY: In the case of a valid REQUEST message, the server creates the bindings for that client according to the server's policy and configuration information, records the IAs and other information requested by the client, and sends a REPLY message by setting dhcpv6.msgtype == 7:The two-message exchange will be performed between client and server when IP address assignment is not required or when the DHCPv6 client wants to obtain configuration information such as a list of available DNS servers or NTP servers—for example CONFIRM-REPLY and RELEASE-REPLY. Open the sample DHCPv6-Flow-CONFIRM-RELEASE.pcap file in Wireshark, which shows that a two-message exchange was performed:
CONFIRM-REPLY and RELEASE-REPLY:INFOMRATION-REQUEST: The client sends the INFORMATION-REQUEST when the client requests configuration settings (but not addresses)—for example, DNS, NTP. As shown in the following screenshot, open the DHCPv6-Information_request.pcap file in Wireshark:DHCPv6-Rapid-Commit.pcap. Note that rapid commit is not a separate DHCPv6 message and is part of the SOLICIT option:SOLICIT messages that it sends.REPLY message with a rapid commit option, it should process the REPLY immediately (without waiting for additional ADVERTISE or REPLY messages) and use the address and configuration information contained therein.Use dhclient to simulate DHCPv6 traffic over the network. For this, do the following:
tcpdump utility to capture IPv6 traffic:
bash$ tcpdump -i any ip6 -vv -w DHCPv6-FLOW.pcap -s0 &
Make sure the DHCPv6 server is running in your network.
bash$ dhclient -6 eth0
RELEASE message:
bash$ dhclient -6 -r eth0
CONFIRM message:
bash$ dhclient -6 eth0
INFORMATION request:
bash$ dhclient -S -6 eth0
DHCP is an extension of the BOOTP mechanism. In other words, DHCP uses BOOTP as its transport protocol. This behavior allows existing BOOTP clients to interoperate with DHCP servers without requiring any change to the clients' initialization software; the following table shows basic comparisons between these two protocols:
|
BOOTP/DHCP |
BOOTP |
DHCP (Dynamic Host Configuration Protocol) |
|---|---|---|
|
Meaning |
Bootstrap Protocol |
Dynamic Host Configuration Protocol extension of BOOTP |
|
Year |
1985 |
1993 |
|
UDP Server Port |
67 | |
|
UDP Client port |
68 | |
|
Services |
|
|
|
RFC |
RFC951 |
RFC 2131 |
|
Existence |
Superseded by the Dynamic Host Configuration Protocol (DHCP) |
ACTIVE; RFCs keep coming to add more features and support different technical requirements |
Use the bootp filter to display BOOTP/DHCP traffic and use UDP port 67 to capture the BOOT/DHCP traffic only.
DISCOVER, OFFER, REQUEST, ACK protocol exchanges happen between clients and servers during network address assignment, as shown in the following screenshot. As a mnemonic, refer to this as DORA.
The address assignment can also be done using the Rapid Commit option for DHCPv4. Modeled on DHCPv6, it uses two-message exchanges to quickly configure the DHCPv4 client.
To demonstrate four-message exchange open the DHCPv4.pcap file in the Wireshark, as shown in the following screenshot:
The preceding figure shows a message exchange happening between the DHCPv4 client and DHCPv4 server. This is summarized as follows:
DISCOVER (bootp.option.dhcp == 1):255.255.255.255), a DHCPDISCOVER message, on its local physical subnet and may include the option: (55 that is bootp.option.type) parameter request list; during this time the "yiaddr" field will be (bootp.ip.your == 0.0.0.0)OFFER (bootp.option.dhcp == 2):DHCPOFFER message that includes an available network address in the "yiaddr" (bootp.ip.your == 10.0.0.106) fieldDICOVER phaseDHCPREQUEST (bootp.option.dhcp == 3):255.255.255.255) a DHCPREQUEST message that must include the option 54 DHCP server identifier to indicate which server it has selected, and may include other options specifying the desired configuration valuesDHCPREQUEST message commits the binding for the client to the db storage and responds with an ACKACK (bootp.option.dhcp == 5):bootp.ip.your == 10.0.0.106)DECLINE message to the server and restart the configuration processThe commands to capture DHCPv4 traffic are as follows:
ipconfig /renew and press Enter.ipconfig /release and press Enter.
bash# ifdown eth0:0
bash$ ifup eth0:0
DNS stands for Domain Name System. DNS is used by all machines to translate hostnames into IP addresses. This mechanism is used to translate names to attributes such as addresses (IPv4/IPv6) based on the query type.
DNS has three major components:
This topic will focus on the resolver perspective, where the client sends a query to the server and the server answers the query. There can be multiple answers to the same query.
Wireshark's dns filter is used to display only DNS traffic, and UDP port 53 is used to capture DNS traffic.
The default DNS port is 53, and it uses the UDP protocol. Some DNS systems use the TCP protocol also. TCP is used when the response data size exceeds 512 bytes, or for tasks such as zone transfers.
The following format is used by the DNS system:
|
Field |
Description |
Length |
Wireshark filter |
|---|---|---|---|
|
NAME |
The owner name |
variable |
|
|
TYPE |
Type of Resource Record (RR) in numeric form |
2 |
|
|
CLASS |
Class code |
2 |
|
|
TTL |
Time to live |
4 | |
|
RDLENGTH |
2 | ||
|
RDATA |
Additional RRspecific data |
Variable |
In this chapter, the dig and nslookup network commands are used to query the DNS server. Open the sample DNS-Packet.pcap file, set the display filter to dns.qry.type==28, and examine the query.
In this example, client (192.168.1.101) is asking the name server (8.8.4.4) to resolve ipv6.google.com by setting these parameters in the query section:
ipv6.google.com)IN (Internet))8.8.4.4) responds to the client with multiple answersipv6.google.com is the canonical name that equals ipv6.l.google.comipv6.l.google.com has the AAAA address 2404:6800:4007:805::200eUser can use the popular dig or nslookup network utility commands to query different DNS record types. Use a network capture in the background and observe the query and answer section for each command:
bash# nslookup google.com
bash# dig google.com
bash# dig A +noadditional +noquestion +nocomments +nocmd +nostats google.com. @8.8.4.4
AXFR record type; AXFR is used to transfer zone files from the master to the secondary name server:bash# nslookup -type=axfr google.com 8.8.4.4 bash# dig AXFR +noadditional +noquestion +nocomments +nocmd +nostats +multiline google.com. @8.8.4.4
CNAME record type. CNAME is used to set up the alias:bash# nslookup -type=cname google.com 8.8.4.4 bash# dig CNAME +noadditional +noquestion +nocomments +nocmd +nostats google.com. @8.8.4.4
MX record type; MX is the mail exchange record:bash# nslookup -type=mx google.com 8.8.4.4 bash# dig MX +noadditional +noquestion +nocomments +nocmd +nostats google.com. @8.8.4.4
NS record type; NS is the name server record:bash# nslookup -type=ns google.com 8.8.4.4 bash# dig NS +noadditional +noquestion +nocomments +nocmd +nostats google.com. @8.8.4.4
PTR record type; PTR is the pointer used for reverse DNS lookups:bash# nslookup -type=ptr google.com 8.8.4.4 bash# dig PTR +noadditional +noquestion +nocomments +nocmd +nostats google.com. @8.8.4.4
SOA record type. SOA is used to provide authoritative information such as nameserver and e-mail:bash# nslookup -type=soa google.com 8.8.4.4 bash# dig SOA +noadditional +noquestion +nocomments +nocmd +nostats +multiline google.com. @8.8.4.4
TXT record type; this refers to the text record:bash# nslookup -type=txt google.com 8.8.4.4 bash# dig TXT +noadditional +noquestion +nocomments +nocmd +nostats google.com. @8.8.4.4
AAAA (also referred to as the quad-A record type); this will display the IPv6 address of the given hostname:bash# nslookup -type=aaaa google.com 8.8.4.4 bash# nslookup -type=aaaa ipv6.google.com 8.8.4.4 bash# dig AAAA +noadditional +noquestion +nocomments +nocmd +nostats ipv6.google.com. @8.8.4.4
ANY record type; this returns all record types:bash# nslookup -type=any google.com 8.8.4.4 bash# dig ANY +noadditional +noquestion +nocomments +nocmd +nostats google.com. @8.8.4.4
HTTP is an application layer protocol used in WWW. HTTP enables communications between the HTTP client and HTTP server. Example traffic is shown in the following screenshot. An HTTP GET request is created by the client (browser or cURL), and the HTTP server has responded with the appropriate content type:
Use http to display HTTP packets only. Use TCP port 80 to filter for HTTP traffic only; port 80 is the default HTTP port.
The following example shows different use cases where Wireshark can help to analyze HTTP packets.
Open the file
http_01.pcap in the Wireshark, and find the top HTTP response time for the request HTTP get:
http filter and add http.time as a column from the http.response.code == 200 HTTP OK packet.Use Wireshark's http.request.method to display packets for analysis. For example, the following table describes how to apply this filter:
If the form contains sensitive information such as password, Wireshark can easily reveal it as HTTP is an unsecure means of transferring data over the network.
Open the HTTP_FORM_POST.pcap file and filter the traffic to display only the request method POST and locate the password form item, as shown in the following screenshot:
The first line of the HTTP response contains the status code. Use the Wireshark filter http.response.code, to display packets based on the status code. This will be helpful when debugging the HTTP client-server interaction:
|
Type |
Code |
Meaning |
HTTP Wireshark filter |
|---|---|---|---|
|
Informational – 1xx |
100 |
Continue |
|
|
101 |
Switching protocol |
| |
|
Successful – 2xx From: 200 To: 206 |
200 |
OK |
|
|
201 |
Created |
| |
|
Redirection – 3xx From: 300 To: 307 |
300 |
Multiple choices |
|
|
301 |
Moved permanently |
| |
|
Client Error – 4xx From: 400 To: 417 |
400 |
Bad Request |
|
|
401 |
Unauthorized |
| |
|
Server Error – 5xx From—500 To-- 505 |
500 |
Internal Server Error |
|
|
501 |
Not implemented |
|
So far, we have seen packets captured on Ethernet. In this chapter we will learn how to capture WLAN network traffic, and use effective display filters for all the frames, by covering the following topics:
Wireshark depends on the operating system on which it's running (and on the drivers for the wireless adapter) for monitor mode support.
For Linux, the 802.11 wireless toolbar (View | Wireless Toolbar) provides excellent options to enable the monitor mode and set the channel for cfg80211 devices. This even supports multiple network interfaces for multi-channel captures; refer to https://wiki.wireshark.org/CaptureSetup/WLAN for detailed instructions.
The MAC OS has a wireless adapter, and the monitor mode is supported. On Windows, the monitor mode is not supported; you need a commercial adaptor for this, such as the AirPcap USB adapter.
The WLAN (IEEE 802.11) capturing process is slightly different from capturing Ethernet traffic in Wireshark. By default, when we start capturing traffic in a Wi-Fi network, it captures traffic between two endpoints (HOST-A and HOST-B). To capture the Wi-Fi traffic, Wireshark has to run in the monitor mode—RFMON (Radio Frequency Monitor) mode—which allows a computer with a wireless network interface controller (WNIC) to monitor all traffic received from the AP (Access Point), as shown in the screenshot:
The monitor mode is supported only on IEEE 802.11 Wi-Fi interfaces, and only on some operating systems. To enable the monitor mode in a Wi-Fi interface, perform these steps in Wireshark:
You should see the following screen:
When the monitor mode is on, the adapter captures all the packets transmitted on the channel. These include:
Once the packet capture starts, Wireshark will start displaying the 802.11 protocol packet exchange between source and destination, as shown in the following screenshot (or open the packet capture 802.11.pcap file in Wireshark). Packet capture in the monitor mode will not be associated with any of the access points and the user can see only 802.11 frames, which include non-data (management and beacon) frames, as shown:
To perform a wireless packet capture using tcpdump, execute the following command. The tcpdump with –I option will turn the monitor mode on:
bash $ tcpdump -I -P -i en0 -w 802.11.pcap
The output obtained is as follows:
tcpdump: WARNING: en0: no IPv4 address assigned
tcpdump: listening on en0, link-type IEEE802_11_RADIO (802.11 plus radiotap header), capture size 65535 bytes
^C52 packets captured
52 packets received by filter
When analyzing a Wi-Fi network, it's important to go through the IEEE standard 802.11 as the source of truth as this is one of the most interesting protocols to gain a expertise on.
Wireless networks are different from a wired LAN: here the addressable unit is a station (STA), and the STA is the message destination not the fixed location when the packet is transferred to the STA.
Within the scope of the book, we are dealing with packets captured between the WNIC controller and the access point. The access point (AP) contains one station (STA) and provides access to the distribution. In this book, we will see the how Wireshark has provided display filters for analyzing Wi-Fi frames:
In Layer 2, datagrams are called frames; they show all channel traffic and a count of all the frames received at the measuring STA. There are four types of frame, which are defined in the following table:
|
Frame type |
Value |
Wireshark display filter |
|---|---|---|
|
Management |
0x00 |
|
|
Control |
0x01 |
|
|
Data |
0x02 |
|
|
Extension |
0x03 |
|
Let's take a detailed look at these frames one by one.
Wireshark uses the wlan_mgt display filter to show all the management frames. In line with the IEEE 802.11 standard, the following management frames are defined and their corresponding values, with appropriate Wireshark display filters, are shown in the following table:
|
Name |
Value |
Wireshark display filter |
|---|---|---|
|
association request |
0x00 |
|
|
association response |
0x01 |
|
|
reassociation request |
0x02 |
|
|
reassociation response |
0x03 |
|
|
probe request |
0x04 |
|
|
probe response |
0x05 |
|
|
measurement pilot |
0x06 |
|
|
beacon frame |
0x08 |
|
|
atim |
0x09 |
|
|
disassociation |
0x0a |
|
|
authentication |
0x0b |
|
|
deauthentication |
0x0c |
|
|
action |
0x0d |
|
|
action no ack |
0x0e |
|
For example, by setting wlan.fc.type_subtype == 0x08, in the 802.11.pcap file, the entire beacon frame will be displayed in Wireshark.
A beacon is a small broadcast data packet that shows the characteristics of the wireless network, and provide information such as data rate (max data rate), capabilities (encryption on or off), Access Point MAC address, SSID (wireless network name), RSN information, vendor specific information, Wi-Fi protected setup, and so on, where:
ANish94:FB:B3:B8:DF:DDIn another example, the
wlan_mgt.ssid == "ANish" display filter will display all management frames whose SSID matches with ANish.
Data frames carry the packets that can contain the payload (such as files, screenshots, and so on). Type values for data frames used in 802.11 and their corresponding Wireshark display filters are shown in the following table:
|
Name |
Value |
Wireshark display filter |
|---|---|---|
|
data |
0x20 |
|
|
data + cf-ack |
0x21 |
|
|
data + cf-poll |
0x22 |
|
|
data + cf-ack + cf-poll |
0x23 |
|
|
null function |
0x24 |
|
|
no data cf-ack |
0x25 |
|
|
no data cf-poll |
0x26 |
|
|
no data cf-ack + cf-poll |
0x27 |
|
|
qos data |
0x28 |
|
|
qos data + cf-ack |
0x29 |
|
|
qos data + cf-poll |
0x2a |
|
|
qos data + cf-ack + cf-poll |
0x2b |
|
|
qos null |
0x2c |
|
|
no data qos cf-poll |
0x2e |
|
|
qos cf-ack + cf-poll |
0x2f |
|
For example, wlan.fc.type_subtype == 0x2A will display all the packets that contain QoS Data + CF-Poll in the packet capture file 802.11.pcap, as shown in the following screenshot:
Control frames exchange data frames between stations. Control frame ranges are 0x160 - 0x16A for control frame extensions where type = 1 and subtype = 6. Values for control frames and the corresponding Wireshark display filters are shown in the following table:
|
Name |
Value |
Wireshark display filter |
|---|---|---|
|
vht ndp announcement |
0x15 |
|
|
poll |
0x162 |
|
|
service period request |
0x163 |
|
|
grant |
0x164 |
|
|
dmg clear to send |
0x165 |
|
|
dmg denial to send |
0x166 |
|
|
grant acknowledgment |
0x167 |
|
|
sector sweep |
0x168 |
|
|
sector sweep feedback |
0x169 |
|
|
sector sweep acknowledgment |
0x16a |
|
|
control wrapper |
0x17 |
|
|
block ack request |
0x18 |
|
|
block ack |
0x19 |
|
|
power-save poll |
0x1a |
|
|
request to send |
0x1b |
|
|
clear to send |
0x1c |
|
|
acknowledgement |
0x1d |
|
|
0x1e |
| |
|
0x1f |
|
The AP advertises its capabilities in a Beacon frame; the client (STA) broadcasts itself, using its own probe request frame, on every channel—typically (channel 11). By doing this, it determines which access points are within range.
Probe response frames contain capability information, supported data rates and so on, of the AP after it receives a probe request frame.
The STA sends an authentication frame containing its identity to the AP. With open system authentication (the default), the access point responds with an authentication frame as a response, indicating acceptance (or rejection).
Shared key authentication requires WEP (64-bit or 128-bit) keys, and the same WEP keys on the client and AP should be used. The STA requests a shared key authentication, which returns unencrypted challenge text (128 bytes of randomly generated text) from the AP. The STA encrypts the text and returns the data to AP, the AP response indicating acceptance (or rejection).
The STA sends an association request frame to the AP containing the necessary information and then that the AP will send an Association response frame that includes acceptance (or rejection). If this is accepted, the STA can utilize AP to access other networks:
IEEE802.1x is based on Extensible Authentication Protocol (EAP), which is an extension of PPP (Point-to-Point Protocol), also known as "EAP over LAN" or EAPOL.
The IEEE 802.11 Working Group passed the 802.1x standard in 2001 to improve upon the security specified in the original 802.11 standard (IEEE, 2001).
Open the 802.11-AUTH-enabled.pcap file in Wireshark and use the display filter eapol to display all the
eapol messages only, as shown in the following screenshot. In the eapol packets, the session key of the device and the AP are handled.
As shown in the screenshot, all eapol packets are captured as 1 of 4, 2 of 4, 3 of 4, and 4 of 4.
The eapol packets are needed if you are trying to decrypt 802.11 traffic. The Wireshark wiki link https://wiki.wireshark.org/HowToDecrypt802.11 is an excellent source of information on how to decrypt traffic with the help of Wireshark.
The 802.11 standard specifies a common medium access control (MAC) layer (the data link layer) that supports the operation of 802.11-based wireless LANs. The 802.11 MAC layer uses an 802.11 Physical (PHY) layer, such as 802.11a/b, to perform the tasks of carrier sensing, transmission, and receiving 802.11 frames.
Open the packet capture file 802.11-AUTH-Disabled.pcap in Wireshark and set the display filter to wlan.da==e8:de:27:59:72:06 to view how the data is carried using 802.11 as the transport medium.
The 802.11 QoS data frames shows that the LLC header follows IEEE 802.11; this is what is expected in the monitor mode.
The captured 802.11 looks like an Ethernet packet as the 802.11 adapter will often try to transform data packets into fake Ethernet packets and then supply them to the host.
There are other commercial (as well as open source) tools that use a form of Wi-Fi sniffing depending on the operating system and uses cases (such as WEP decryption, advance analytics, and geo location). A few of them are listed as follows:
In this chapter, we have covered Wi-Fi capture setup and discussed exactly what the monitor mode is and its pros and cons. We have also learned how the various display filters are used on the Layer 2 datagram (frames). In the next chapter, we will explore network security and its mitigation plans in greater detail.
In the previous chapters, we learned more about protocols and their analysis techniques. In this chapter, we will learn how Wireshark helps us perform a security analysis and try to cover the security aspects in these area application and network by covering these topics:
The Heartbeat protocol (RFC6520) runs on top of the Record layer protocol (the Record layer protocol is defined in SSL).
The Heartbleed bug (CVE-2014-0160) exists in selected OpenSSL versions (1.0.1 to 1.0.1f) that implement the Heartbeat protocol.
This bug is a serious vulnerability that allows attackers to read larger portions of memory (including private keys and passwords) during Heartbeat response.
The Heartbeat protocol runs on top of the Record layer identified as record type (24) in SSL/TLS. In Wireshark, a display filter ssl.record.content_type == 24 can be used to show the HeartBeat message. Heartbeat messages are Heartbeat Request and HeartBeat Response.
Open the heartbleed.pcap packet capture file in Wireshark and set the display filter to ssl.record.content_type == 24.
Wireshark will display only encrypted heartbeat messages. The first one is the Heartbeat Request message. In this message, the length (ssl.record.length == 112) of the Heartbeat Request is set to 112 bytes, as shown in the screenshot:
Whenever a Heartbeat Request message is send to the server, the server answers with a corresponding Heartbeat Response message.
In the given packet, the Heartbeat Response length (ssl.record.length == 144) is set to 144, which means the server has returned more data (32-bytes more) than expected. This extra information is known as the heartbleed; this bleed may contain sensitive information such as passwords and private keys:
To test the heartbleed, use the following steps:
openssl library:[bash ]# openssl version OpenSSL 1.0.1c 10 May 2012
[bash #]openssl req -sha256 -new -newkey rsa:2048 -nodes -keyout ./server.key -out ./server.csr -subj "/C=PU/ST=Anish/L=Test/O=Security Analysus /OU=Heartbleed/CN=myhost.com"
[bash #]openssl x509 -req -days 365 -in server.csr -signkey server.key -out server.pems
[bash ]# openssl s_server -www -cipher AES256-SHA -key ./server.key -cert ./server.pem -accept 443
[bash ]# tcpdump port 443 –s0 –w heartbleed.pcap &
If the SSL/TLS server is reachable through the public network, online filippo can be used. Other tools (such as Heartbeat Detector, which is a shell script) can also be used for this purpose:
This technique is used to attack the host in such a way that the host won't be able to serve any further requests to the user. Finally, the server crashes, resulting in a server unavailable condition.
There are various attack techniques used in this topic. We will cover SYN flood and ICMP flood detection with the help of Wireshark.
We learned about the TCP handshake process in Chapter 3, Analyzing the TCP Network. In this handshake process, a connection is established with SYN, SYN-ACK, and ACK between the client and server.
In the SYN flood attack scenario, what is happening is that:
In all these scenarios, the TCP/IP stack file descriptors are consumed, causing the server to slow down and finally crash.
Open the SYN_FLOOD.pcap packet capture file in Wireshark and perform the following steps:
The IO graph statistics show the following summary:
tcp.flags.fintcp.flags.pushIn real scenarios, this data will be mixed up with actual packet flows, but the analysis technique will remain the same. The moment you see an unexpected growth in SYN packets or a spike in SYN packets, it's a SYN flood from DoS or from the multiple-source DDoS.
SYN attacks can be mitigated. The following are a few mitigation plans:
/etc/sysctl.conf file and make changes to these entries:#Prevent SYN attack, enable SYNcookies (they will kick-in when the max_syn_backlog reached) net.ipv4.tcp_syncookies = 1 net.ipv4.tcp_syn_retries = 2 net.ipv4.tcp_synack_retries = 2 net.ipv4.tcp_max_syn_backlog = 4096 # Increase the tcp-time-wait buckets pool size to prevent simple DOS attacks net.ipv4.tcp_max_tw_buckets = 1440000
sycltl to apply the changes:
bash#sysctl -p
# Netfilter (iptables)
iptables -A INPUT -i eth0 -d 10.0.0.3/32 -j DROP
! Cisco IOS (standard)
access-list NUMBER deny host 10.0.0.3
# IPFirewall (ipfw)
add deny ip from 10.0.0.3 to any in
# Windows Firewall (netsh)
add portopening tcp 443 Wireshark DISABLE 10.0.0.3
Internet Control Message Protocol (ICMP) flood is also categorized as a Layer 3 DoS attack or a DDoS attack. It works as follows: an attacker is trying to flood the echo request (ping) packet with a spoofed IP address or the server is flooded with echo requests (ping packets) and not able to process the echo response for each ICMP echo request, resulting in host slowness and denial of service.
Open the ICMP_Flood_01.pcap packet capture file in Wireshark and perform the following steps:
As shown in the screenshot, ICMP flood has the following characteristics:
The following are a few mitigation plans for the ICMP flood attack:
bash# iptables -I INPUT -p icmp --icmp-type 8 -j DROP
bash# iptables -A OUTPUT -p icmp -o eth0 -j ACCEPT
bash# iptables -A INPUT -p icmp --icmp-type echo-reply -s 0/0 -i eth0 -j ACCEPT
bash# iptables -A INPUT -p icmp --icmp-type destination-unreachable -s 0/0 -i eth0 -j ACCEPT
bash# iptables -A INPUT -p icmp --icmp-type time-exceeded -s 0/0 -i eth0
-j ACCEPT
bash# iptables -A INPUT -p icmp -i eth0 -j DROP
bash# ip6tables -I INPUT -p icmpv6 –icmpv6-type 8 -j DROP
bash# ip6tables -I INPUT -p icmpv6 -i eth0 -j DROP
sysctl.conf file and adding the following entry in this file:net.ipv4.icmp_echo_ignore_all = 1
sycltl to apply the changes:
bash#sysctl -p
This kind of attack happens on Layer 7 and it is difficult to detect in the sense that it resembles legitimate website traffic. In Analyzing SSL/TLS, we learned about SSL and the handshake process. The attacker can use the handshake against the system to create a DoS/DDoS attack. As handshake involves larger exchange of message between client and the server, for example, in case of one way auth total number of packet exchanges to established a connection is approximate 12 (that is, 3 packets TCP handshake + 9 packets SSL handshake = 12 packets exchanged).
The attacker can flood the SSL connection and make the server busy, to just establish the connection and try to create the DoS/DDoS scenario.
Wireshark can help in identifying from which IP maximum number of packet has arrived. This feature is called Wireshark Conversations, and can be used in any kind of flood scenario (DoS attack).
Open the ICMP_Flood_01.pcap packet capture file in Wireshark and perform the following steps:
Other categories of Layer 7 attacks are HTTP/HTTPS POST flood and HTTP/HTTPS GET flood.
In this section, we will go over the basics of vulnerability scanning and verify what is happening when the host scan is performed with the help of Wireshark.
Host discovery, port scanning, and OS detection are part of vulnerability scanning. During this process, vulnerabilities are identified and addressed with a proper mitigation plan by the security auditor. For example:
Open the host_scan.pcap file in Wireshark; the sample capture shows how the external client is scanning the ports:
During this process, a SYN packet is sent to the all the ports for common services on each host, such as DNS, LDAP, HTTP and many more. If we get the ACK from the host, the host is considered ACTIVE on that port.
The security auditor or hacker can use network scanner tools to get the port, host, and OS information. For example, the nmap network utility command can be used to scan the active/open ports:
The online nmap tool can be found at https://pentest-tools.com/network-vulnerability-scanning/tcp-port-scanner-online-nmap.
SSL scans are done by different users (for example, security auditors and hackers) to achieve their own objectives:
An example using the nmap command to find available ciphers and the supported protocol version in a given server port 636 LDAP is as shown:
[root@ ~]# nmap --script ssl-cert,ssl-enum-ciphers -p 636 10.10.1.3To find available ciphers and the supported protocol version in a given server port 443 HTTPS

[root@ ~]# nmap --script ssl-cert,ssl-enum-ciphers -p 443 10.10.1.3
Wireshark detects duplicate IPs in the ARP protocol. Use the arp.duplicate-address-frame Wireshark filter to display only duplicate IP information frames.
For example, open the ARP_Duplicate_IP.pcap file and apply the arp.duplicate-address-frame filter, as shown in the screenshot:
Wireshark is providing the following information in this case:
fa:16:3e:bf:22:d0 and shows as a duplicate of that IP address.Distributed Reflection Denial of Service (DrDoS), also known as UDP-based amplification attacks, uses publically accessible UDP servers and bandwidth amplification factors to overwhelm a system with UDP traffic.
Open the
DrDoS.pcap file. In this packet capture, a SYN packet is sent over a server IP address with the victim's source IP address; note the destination port is HTTP 80 and the source port is NTP port 123, UDP. Now the server will respond with an ACK packet to the source that in this case will be the victim's IP address. If multiple servers were used, the server will flood the victim (target) with ACK packets.
There are UDP protocols (DNS, NTP, and BitTorrent) that are infected by UDP-Based amplification attacks. For more information on this, refer to alert TA14-017A published by US-CERT: https://www.us-cert.gov/ncas/alerts/TA14-017A.
Wireshark supports the BitTorrent protocol. BitTorrent uses the Torrent file to download the content from the P2P network. The content that gets download through these programs is safe (depending on what kind of content is downloaded). Any download can contain Trojans or viruses so (this recommendation goes for any protocol used) be careful, especially when downloading any executable file or from unknown torrent URLs. All downloaded files are subjected to a scan. Open the bittorrent.pcapng file in Wireshark and check from that location that the content is getting downloaded.
The Wireshark BitTorrent dissector is able to decode the entire download process. To check what the endpoints are from this source, do the following. Click on Statistics | Endpoints; an Endpoint Window will appear:
As shown in the screenshot, Wireshark has obtained the following information:
192.168.1.101) has downloaded 10744 bytes and the content is coming from different geographical locations. Since the content was downloaded from various sources, it is always advised to scan it before opening it.Endpoint statistics are a nice Wireshark feature. Endpoints reveal information such as outgoing connections for a given client. In this example, the client is connected to 16 different endpoint locations spread across different geographical locations. For any suspicious traffic, use the filter option directly on the Endpoint window.
This feature is very useful when dealing with what protocols are running on the server. To find this, click on Summary | Protocol Hierarchy in the Wireshark menu. A protocol hierarchy of the captured packets will open, as shown in the screenshot:
From the security point of view, it will give a high-level glance at all protocols that are happening over the Ethernet system. Network administrators use this information to harden the system configuration; for example, if the administrator found a DCE protocol running in the production system, after seeing this protocol hierarchy he can raise an alarm to stop this service.
Congratulation on completing this chapter and the book. So far, we have seen how Wireshark helps to analyze network protocols such as TCP/IP, DHCPv6, DHCP, and HTTP. We carried out a detailed analysis of the SSL/TLS protocol and WLAN setup capture; then we explored security-related issues and their mitigation plans. We also tried to be as practical as we can, and provided some real-time use case scenarios and their mitigation plans.
In this book, we have also emphasized other effective tools for capturing the packets, such as tcpdump and snoop. You should now be able to go forward and start analyzing other protocols not covered in this book by using it as a reference.