Table of Contents for
Windows Malware Analysis Essentials
 Windows Malware Analysis Essentials
Published by
Packt Publishing, 2015
Windows Malware Analysis Essentials
Published by
Packt Publishing, 2015
- Cover
- Table of Contents
- Windows Malware Analysis Essentials
- Windows Malware Analysis Essentials
- Credits
- About the Author
- Acknowledgments
- About the Reviewer
- www.PacktPub.com
- Preface
- What you need for this book
- Who this book is for
- Conventions
- Reader feedback
- Customer support
- 1. Down the Rabbit Hole
- Signed numbers and complements
- Boolean logic and bit masks
- Breathing in the ephemeral realm
- Sharpening the scalpel
- Performing binary reconnaissance
- Exploring the universe of binaries on PE Explorer
- Getting to know IDA Pro
- Entropy
- Summary
- 2. Dancing with the Dead
- Registers
- The initiation ritual
- Preparing the alter
- Code constructs in x86 disassembly
- Summary
- 3. Performing a Séance Session
- Debriefing – seeing the forest for the trees
- Preparing for D-Day – lab setup
- Whippin' out your arsenal
- Summoning the demon!
- Post infection
- Exorcism and the aftermath – debrief finale!
- Summary
- 4. Traversing Across Parallel Dimensions
- Alice in kernel land – kernel debugging with IDA Pro, Virtual KD, and VMware
- Summary
- 5. Good versus Evil – Ogre Wars
- Encoding/decoding – XOR Deobfuscation
- Malicious Web Script Analysis
- Byte code decompilers
- Document analysis
- Redline – malware memory forensics
- Malware intelligence
- Summary
- Index
Kernel Debugging is an essential day to day activity in many reversing sessions, certainly more so for the Windows platforms as it is a closed source, unlike Linux (open source) where reversing has a different connotation mainly related to hardware protocols and understanding of the system as a whole. Therefore, it is advantageous to have a general idea about how the various APIs in Windows work together, how user mode Ring 3 code can communicate with native APIs in Ring 0 or kernel mode, and how the different APIs mechanisms are abstracted from each other. User mode code does not have a direct interface to the kernel and has to implement it via ntdll.dll as a gateway to ntoskrnl.exe which is the OS kernel in Windows. Many calls to ntdll.dll are done via kernel32.dll which acts yet another upper level abstraction user mode wrapper. The SYSENTER and SYSEXIT assembly mnemonics(opcodes), not a call-return pair though, are independently employed in the API codes to switch from the user mode to the kernel mode and vice versa.
For 64 bit Windows debugging, your best bet is with Windbg (Debugging Tools x64 download). For regular 32-bit kernel debugging, using older OS versions such as Windows XP you can get away with some amount of functionality using SoftIce or the mercurial Syser(site goes offline at times), though Windbg is highly recommended and is the best debugger as of now.
The user mode interface is a SharedUserData!SystemCallStub which is ntdll.KiFastSystemCall;
7C90EB8B >/$ 8BD4           MOV EDX,ESP
7C90EB8D  |. 0F34           SYSENTER
7C90EB8F  |. 90             NOP
7C90EB90  |. 90             NOP
7C90EB91  |. 90             NOP
7C90EB92  |. 90             NOP
7C90EB93  |. 90             NOP
7C90EB94 >\$ C3             RETN
You can search for sequences such as this by opening any application in your favorite debugger in Windows XP SP2 - here done in OllyDbg.
Set the CPU view to point at ntdll.dll via right click View | ntdll.dll. Press Ctrl + F to get the Find Command dialog and type the sequence mov edx,0x7FFE0300.
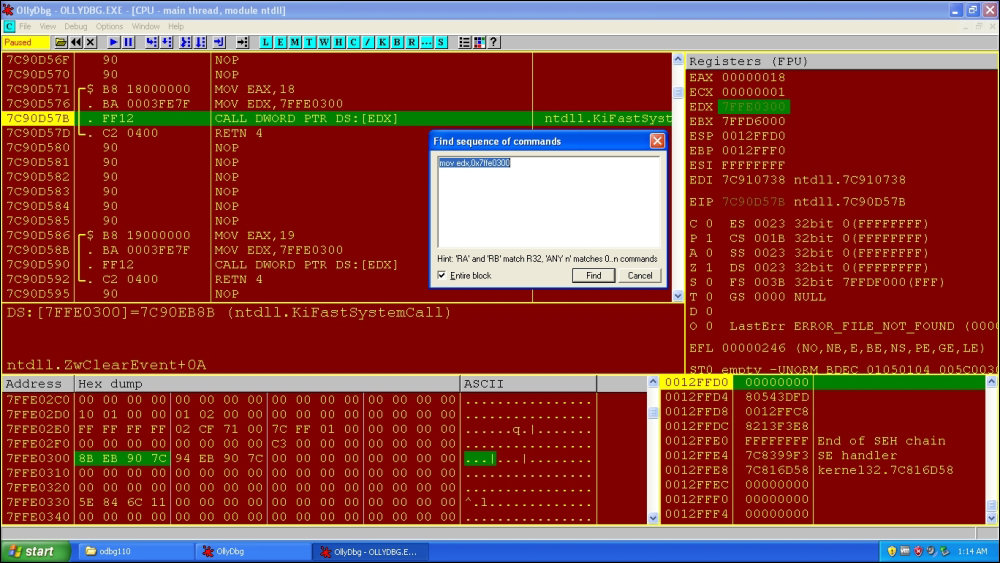
Note how the call to the value at EDX is identified as ntdll.KiFastSystemCall, which is accessed via the SYSENTER sequence stub described earlier, which is the current Intel architecture specific implementation of Ring 3 to Ring 0 and back (AMD implements it as SYSCALL). The values copied to EAX in similar sequences in ntdll are indexes to the syscalls. The next 4 bytes after B8 opcode is always the syscall number in this pattern. ESP is saved to EDX where the parameters are passed from the user stack to the kernel stack prior to the system service routine invocation. Interrupts are disabled and the thread is switched to the kernel mode, where the service routine sets up trap frames to bookmark its user mode return location and then proceeds with the service call, after which the interrupts are enabled and the thread returns to the user mode. Thus, the user mode code can spend significant amount of shared time in the kernel space as well.
You will find that the user mode address ranges from 0x00000000 to 0x7FFFFFFF, with higher address spaces 0x80000000 to 0xFFFFFFFF belonging to the kernel code. If you tried writing a user mode C program to access a pointer with an address in the kernel range, you would get a runtime access violation error message from Windows.
The system call occurs for many exported APIs with the service call number index in eax;
7C90D571 >/$ B8 18000000    MOV EAX,18
7C90D576  |. BA 0003FE7F    MOV EDX,7FFE0300
7C90D57B  |. FF12           CALL DWORD PTR DS:[EDX]   ; call to ntdll.ZwClearEvent+0A
(the 0x0A is the number of bytes from the start of the call i.e. 0xB8)
7C90D57D  \. C2 0400        RETN 4
7C90D580     90             NOP
7C90D581     90             NOP
7C90D582     90             NOP
7C90D583     90             NOP
7C90D584     90             NOP
7C90D585     90             NOP
7C90D586 >/$ B8 19000000    MOV EAX,19
7C90D58B  |. BA 0003FE7F    MOV EDX,7FFE0300
7C90D590  |. FF12           CALL DWORD PTR DS:[EDX]    ; call to ntdll.ZwClose+0A
7C90D592  \. C2 0400        RETN 4
The value dereferenced at address in edx is the SharedUserData!SystemCallStub described before.
The interrupt 0x2E is also seen. It is an older syscall interface, which employs the IDT service routines, which is also slower than the current mechanisms:
7C90EBA5 >/$ 8D5424 08      LEA EDX,DWORD PTR SS:[ESP+8]
7C90EBA9  |. CD 2E          INT 2E
7C90EBAB  \. C3             RETN
In Windows 8 Pro WOW64, which is a mechanism to run 32 bit binaries on 64 bit Windows, we see the following sequence of syscalls in a typical ntdll.dll export inside a debugger:
77000EDC >/$ B8 16000000    MOV EAX,16
77000EE1  |. 64:FF15 C00000>CALL DWORD PTR FS:[C0]  ;call to ntdll.ZwAllocateVirtualMemory+5
77000EE8  \. C2 1800        RETN 18
77000EEB     90             NOP

77000EEC >/$ B8 17000000    MOV EAX,17
77000EF1  |. 64:FF15 C00000>CALL DWORD PTR FS:[C0] ;call to  ntdll.ZwQueryInformationProcess+5
77000EF8  \. C2 1400        RETN 14
77000EFB     90             NOP
The RETN 18 disassembly in the preceding code has 18h as the number of arguments that are passed to this function - ZwAllocateVirtualMemory which if you check in MSDN is 18h/4 =6.
The FS:[C0] leads to (press Ctrl + G and type fs:[0xC0] in OllyDbg);
76F021DC EA 6625F076 3300 JMP FAR 0033:76F02566 ; Far jump
Which is the 64 bit interface to the syscall (33h is one of the two code segments in the WOW64 process, the first one runs at 23h which is for the 32 bit CPU code and 33h is used to switch to 64 bit CPU code). Note the FAR directive and the hardcoded value of 76F02566h.
You can use Dumpbin to further verify the exports and check the opcodes manually, or you can open the View Names context menu option in the Executables Window (Alt + E) for ntdll.dll. in OllyDbg and check if a particular API call starts with the preceding sequences. Most of the ZwXxx and NtXxx prefixed function calls have the signature as mentioned earlier (it depends on the OS version and the service pack). Ideally, this can be left as a short exercise for you to write a script or a program to parse the headers of ntdll.dll, extract the export tables data, search for the opcodes, list out the API calls that have this particular set of interfaces for kernel mode switching, as well as having a comparative list of syscall numbers and their function name and address counterparts. OllyDbg maps out and annotates ntdll syscalls to their API name strings. Once called, SYSENTER uses the following model specific registers, which are CPU specific and can be used for debugging and other control related CPU features:
SYSENTER_CS_MSR [174h]: The CS Selector of the target segment (CS is overwritten)SYSENTER_ESP_MSR [175h]: For the target ESP (ESP is overwritten)SYSENTER_EIP_MSR [176h]: For the target EIP (EIP is overwritten)
rdmsr and wrmsr are complementary commands that work with reading from and writing to the MSR addresses which are passed as the address parameters. You can use them in the kernel mode only as they won't be accessible from the user mode. You can then use the u (unassemble) command to get the disassembly at that particular location, which will be the actual syscall routine. Further commands will be discussed as we progress and you are advised to keep tabs and cross link their uses as you learn about them.
You are encouraged to explore online at: http://www.osronline.com/article.cfm?id=257 and http://www.codeguru.com/cpp/misc/misc/system/article.php/c8223/System-Call-Optimization-with-the-SYSENTER-Instruction.htm
Also, a nice presentation using Windbg to glean more information about rootkits as we proceed with the essential commands one by one, is available at http://www.reconstructer.org/papers/Hunting%20rootkits%20with%20Windbg.pdf. You can also read the book The Rootkit Arsenal: Escape and Evasion in the Dark Corners of the System, Bill Blunden and take the free malware and rootkit courses at http://opensecuritytraining.info/Training.html.
You will have to install the Windows 7 Driver Development Kit and the Windows 7 SDK from the following links (MSDN can become confusing if you have to download a specific ISO file version of an SDK, so you have to spend a little time actually searching for it): http://www.microsoft.com/download/en/details.aspx?id=11800 and http://www.microsoft.com/en-us/download/details.aspx?id=8442.
They are rather large files ~700 MB so you need to set some time aside to download them. You download the ISO files and mount them using the right-click mount option in the Windows 8 versions, or a dedicated 3rd party ISO mounting tool like Daemon Tools.
The theme used in IDA Pro for this chapter is https://github.com/eugeii/ida-consonance. Let us set up IDA Pro and VMWare for kernel or emulated debugging. IDA Pro a la carte provides ten debuggers that can be integrated right out of the box. Let us see which ones we can implement right away.
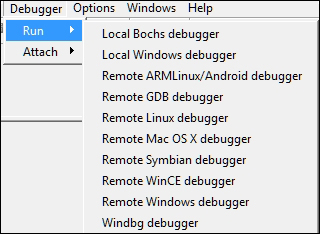
Since we are discussing Windows specific malware, the debuggers listed next are some of the options from the menu:
- Local Bochs debugger
- Local Windows debugger
- Windbg debugger
- Remote Windows debugger
Bochs is an emulator and version 2.4.6 is working with IDA Pro 6.1 at the time of writing this. It is similar to the x86 emulator plugin but more powerful as the entire PC hardware is emulated. However, in order to run Windows XP, Bochs is quite slow.
Local Windows debugger is best used for Win32 debugging of the user mode binaries.
That leaves us with Windbg.
You can setup kernel debugging over serial cable, fire wire or USB (special cable needed), or named pipes using emulated serial ports. Since the other options require you to have a second machine and other accessories, while not providing features such as snapshots and record-replay as well as running multiple guests on the hardware, hence we will use VMware as the virtualization technology with named pipes for kernel debugging.
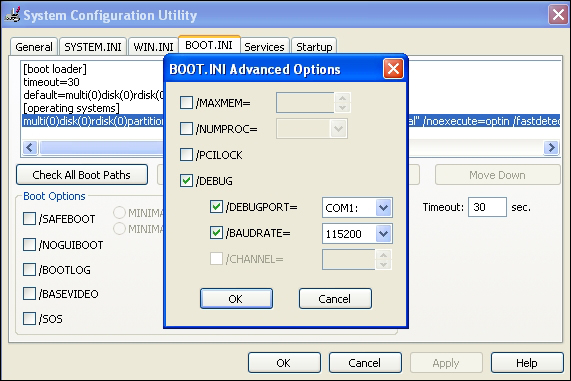
Let us start VMWare with XP SP2 as the guest OS. After booting in you need to change the boot.ini file settings. Press Windows key + R and type msconfig. Set the advanced options as shown in the following image and reboot. Your Windows guest is now primed for kernel debugging. (A caveat for some newbies - check if the serial port in your VM guest settings has a number greater than 1. If so, then you need to change either the COM port in the boot settings or delete an unused serial port such as the floppy disk in your VM guest settings.)
On recent Windows OS versions, you can use the bcdedit switches.
 bcdedit /set debug on
 bcdedit /set debugtype serial
 bcdedit /set debugport 1
 bcdedit /set baudrate 115200
 bcdedit /set {bootmgr} displaybootmenu yes
Additionally, as you will see, the preceding configurations are also done by the VirtualKD during installation when you proceed to install it. You can choose to not install VirtualKD and still perform kernel debugging in IDA Pro, though the speed benefits are recommended.
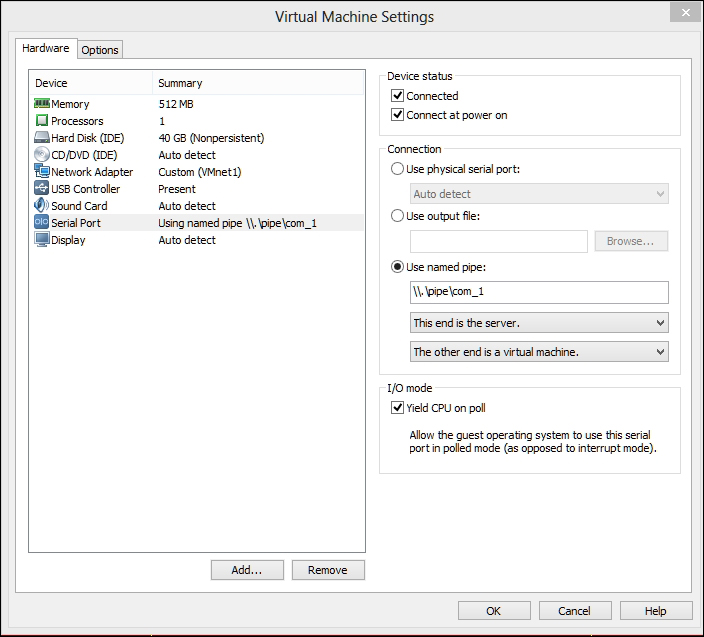
In the VMWare settings, setup the named pipe over serial port as shown next. You can name the pipe anything you want but you have to be consistent about sharing the same pipe name.
You should install the Debugging Tools for Windows (x86), which by now must be installed prior to the next steps so that you get the family of debuggers -cdb, ntsd, kd, and Windbg along with other tools and utilities like gflags.exe which can come in handy.
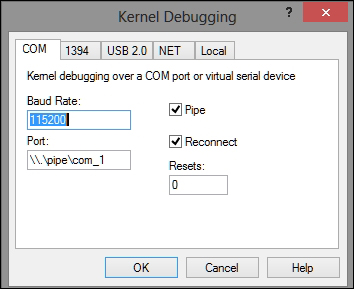
Everything is similar in terms of configuration if you want to use Windbg standalone for this chapter. Press Ctrl + K in Windbg to start kernel debugging and reference the following exhibit for settings:
- Press OK and then navigate to the Debug | Break or press Ctrl + Break to halt the execution in the guest.
The guest will be unresponsive and you can step in the kernel code. If you click into the VM Guest and find that you cannot get out of it, you can always press the combo Ctrl + Alt (while the mouse pointer is in the VM Guest) and then move your mouse away from the guest screen.
You can use Windbg standalone to debug the kernel, however, you also have the option of using IDA Pro as the interface and utilize the awesome graphing features, and disassembly and analysis engine. This is what we will be using for the rest of the concepts discussed in this chapter.
- Execute IDA Pro and navigate to Debugger | Attach | Windbg Debugger.
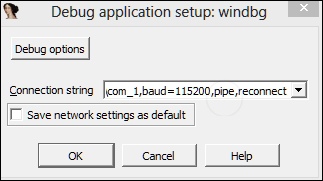
- Type the following string in the Connection string textbox:
com:port=\\.\pipe\com_1,baud=115200,pipe,reconnectThese are the parameters that are reflective of how we configured the VMWare settings and the Windows XP guest installation
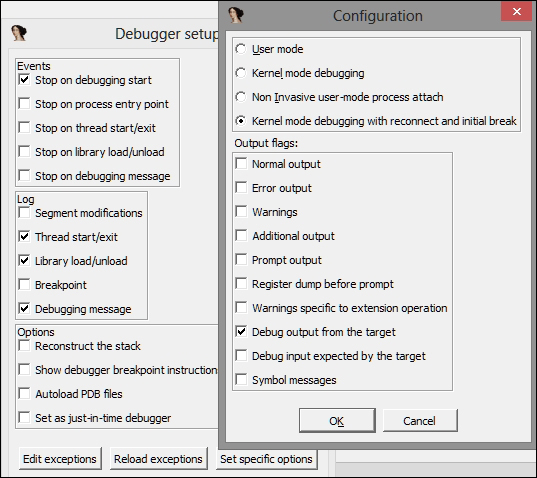
boot.inifile. - Press Debug options | Set specific options and set the following checks in the Configuration dialog box; most notably, the Kernel mode debugging with reconnect and initial break.
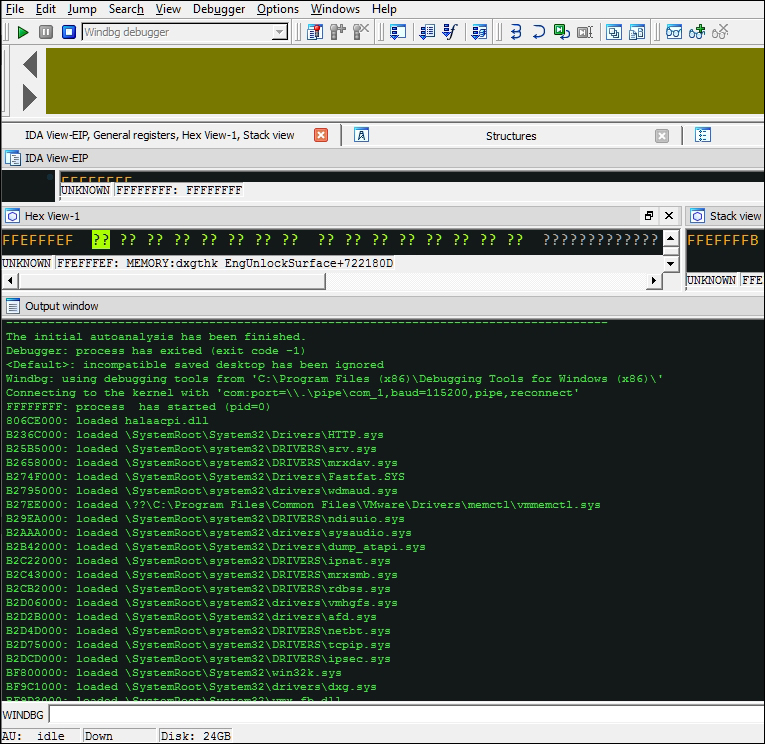
- Click on OK. If everything is set correctly and IDA Pro detects the VMWare guest kernel, you will see the following image:
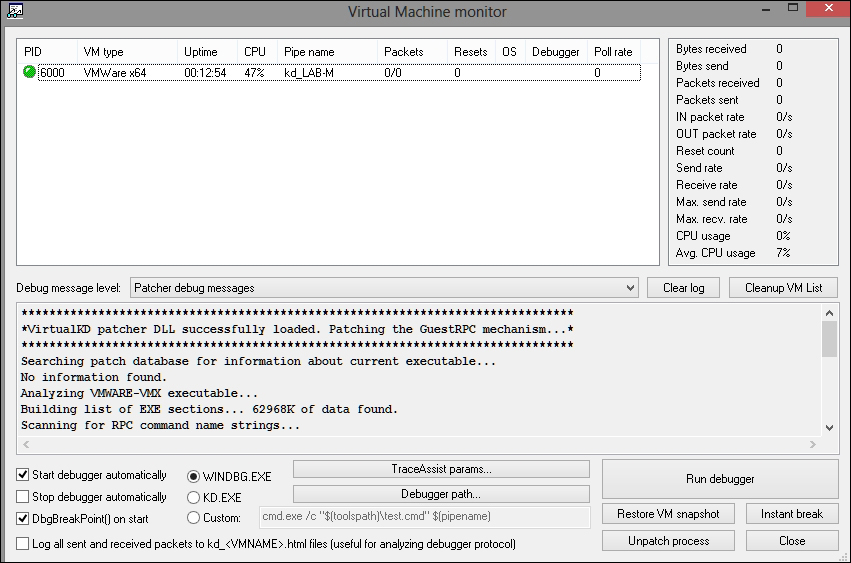
You can also use VirtualKD from http://www.sysprogs.com/ that speeds up kernel debugging. You download the installation file, unzip it, and copy the files in the target folder (vminstall.exe along with contents in the x86 or x64, depending on your guest OS version) to the VM Guest and execute it. It will create a new boot entry for the VirtualKD debugging support and will prompt for a reboot. On reboot, choose the Virtual KD debugging option. Execute vmmon.exe (or vmmon64.exe if your OS is 64 bit) in the host and setup the pipe name displayed in vmmon.exe (shown as kd_<VM Guest name> in the next image) in IDA Pro and Kernel Mode Debugging in debugger setup dialogs as shown earlier. Visit http://www.hexblog.com/?p=123 for information on using IDA Pro with VIrtualKD maintained by HexRays (IDA Pro).
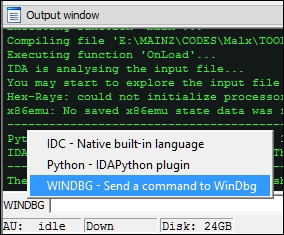
You can choose your command-line type by pressing the button at the bottom left to choose your current command-line environment:
The Output window behaves just like Windbg with the command-line interface and running text output.
If required, you can type the Windbg commands in a separate dialog box at Debugger | WinDbg command, once the IDA Pro is running in the Windbg debugging mode.
One of the first things you can do is set the path to symbols so that Windbg can find them while debugging the kernel. Without symbols, debugging the kernel data structures becomes an even more complicated and tedious task.
Choose a path and folder in your local file system to store the downloaded or installed symbols as they are required by Windbg. The default symbols server provided by Microsoft is available at http://msdl.microsoft.com/download/symbols. To check the current symbols path, use .sympath. For instance, to add your custom path type Windbg command-line textbox (notice the postfix + sign), replace the path with one of your selections:
.sympath+ D:\Symbols.symfix.reload /f
You can also type the following line, combining the previous commands, though .symfix adds the download link automatically without you having to remember it:
.sympath srv*<fully qualified local path>
*http://msdl.microsoft.com/download/symbols
The .reload command deletes all the symbols for the current module and reloads the symbols as they are needed. The /f switch forces the reload.
That was for Windbg. For IDA Pro internally the type library is accessible via Views | Open Subviews | Type libraries (Shift + 11) and press Ins to select types to be imported. All relevant API types that will be useful in kernel debugging, such as mssdk and ntddk from the list, can make the code more readable.
The Debugging Tools for Windows help file is a very comprehensive help file. For more information on any specific command, type:
.hh <command>
Typing .hh on its own in the command line brings up the debugging tools help file which you can peruse at your own time.
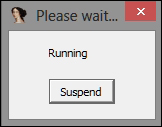
One quirk that you will find as a result of working in IDA Pro is that certain things need to be done via IDA Pro. For example, running the attached process of kernel requires you to press g in Windbg; however, in IDA Pro you have to press the Continue Process button or press F9 to have a new dialog box appear which you can use to suspend the attached process again (instead of pressing Ctrl + Break as in Windbg). You can keep the VM guest running after suspension by choosing Debugger | Detach from process and exiting the debugger.
There are three main kinds of commands in Windbg; some are available only during user mode debugging or kernel-mode debugging. You can navigate to the concerned help manual section from the command-line via .hh Debugger Reference.
The following are the command categories:
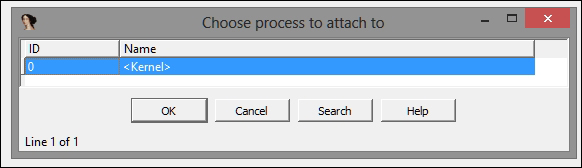
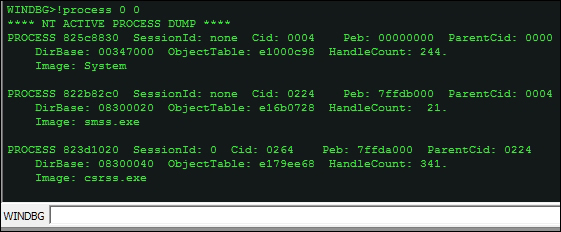
When you break-in the kernel, one of the first things you would want to do is list out the running processes and focus on a particular process. The !process 0 0 command is a very useful extension for this purpose.
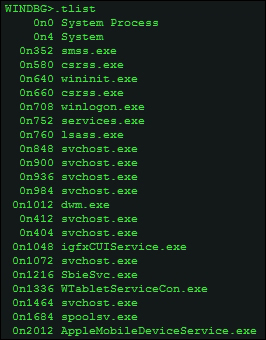
To display the processes on the host machine where you are running IDA Pro, you can also use .tlist (tasklist), a quick task manager-like output, which can be helpful sometimes.
Syntax:
!process <proces> <flags> <imagename>

!process 0 0
Various parameters of interest are available, which themselves can be used as arguments to Windbg commands for further drilling down.
PROCESS:<object address>Cid:<thread ID>Peb:<process environment block>ObjectTable:<ObjectTable address>HandleCountImageName
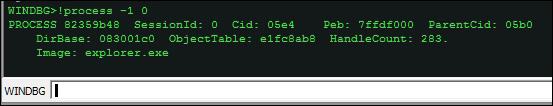
To check the current process context –a user mode debugger on a single process by attaching to it or creating a new one with a debug flag and thus getting into the process; it thus runs with a singular process context. A kernel debugger, on the other hand, has full system access, and hence it is mandatory that you check what context (user mode process) the debugger is in.
!process -1 0
- To break-invasive into a specific process, perform the following:
.process /i <PROCESS object address> - Then press Run (F9) in IDA Pro (type
gin Windbg) so that the debugger breaks in the subsequent run. - Thereafter, you need to reload the symbols:
.reload /user - Now you can check the current process context and confirm it is the one you had specified by !process -1 0.
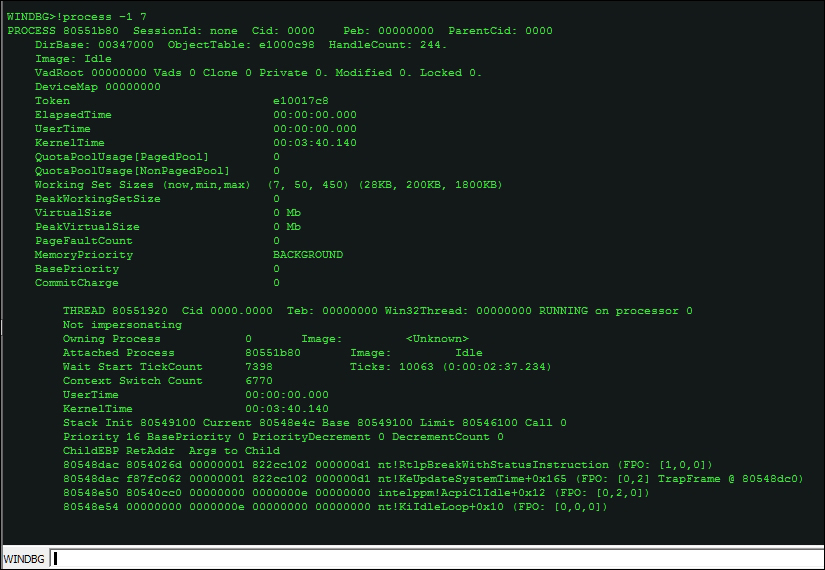
- To check the process parameters in more detail:
!process 0 7 <imagename>, in the following exhibit we employ verbose output on the current process context-System,
In this example, 7 is the level of detail and gives the most verbose output.
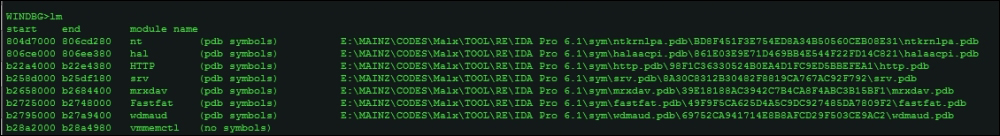
To enumerate the list of loaded modules, type lm.
Once you have the list of processes running and modules loaded, you will be interested to look into specific processes and investigate them in user space. As discussed, when running an executable from Windbg (Open Executable), the debugger runs in the loaded executable's context. In kernel debugging, it is not so and hence you have to specify which process you would like to be the current process context.
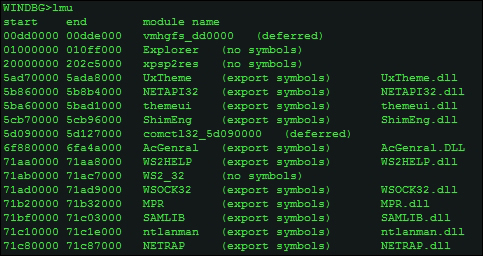
The command lmu will display the loaded modules in the current process context.
Other useful versions of lm include:
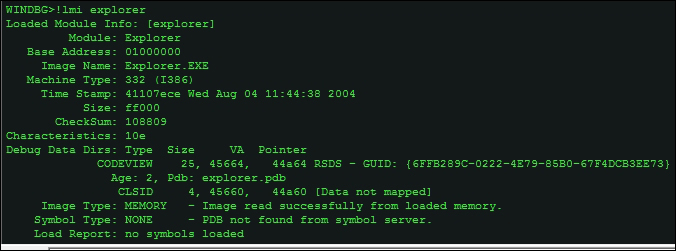
lmvm <module name without extension>

!lmi <module name without extension>
You can inspect data types such as the PEB (Process Environment Block), which is similar to a manifest for the process object and contains a lot of bookkeeping information that can be very helpful in malware analysis.
dt nt!_PEB <address of Peb obtained from .process -1 0, after context switch>
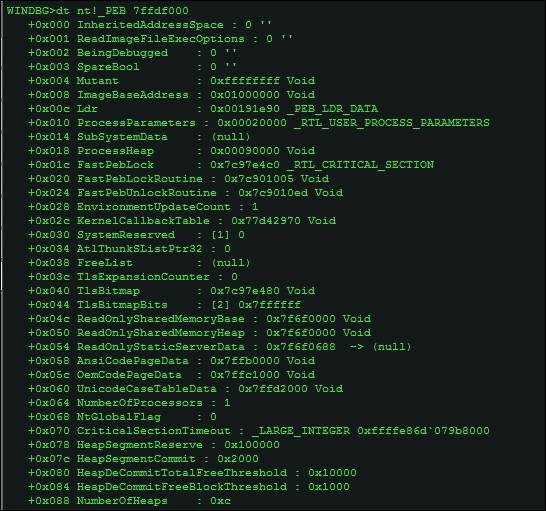
You can inspect the Windows data structures (data types) on their own, as well as superimpose the data structure definitions gathered and deciphered from symbol files to the relevant addresses obtained from other commands, as in the previous image, thus making the output more readable.
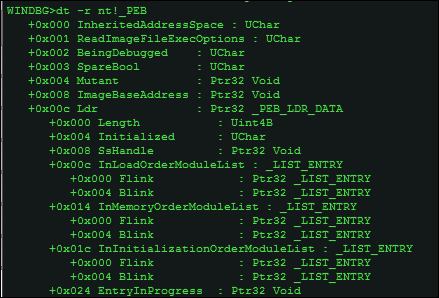
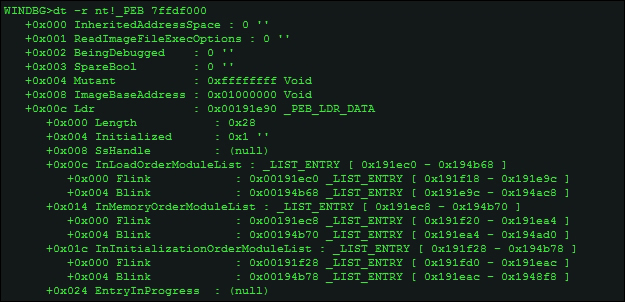
You can use - r for recursive output to get a more detailed listing of the PEB sub-structures such as InMemoryOrderModuleList linked lists and other parts of the PEB structure used for malware functionality and exploits shellcode.
dt -r nt!_PEB
To get to the TEB directly, you can use the !teb command.
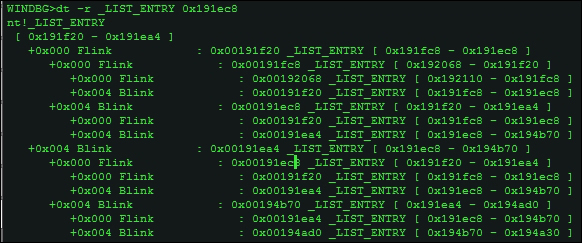
For instance, let's check the _LIST_ENTRY data type by probing into the PEB once again.
Let's examine the InMemoryOrderModuleList chain,
dt -r _LIST_ENTRY 0x191ec8
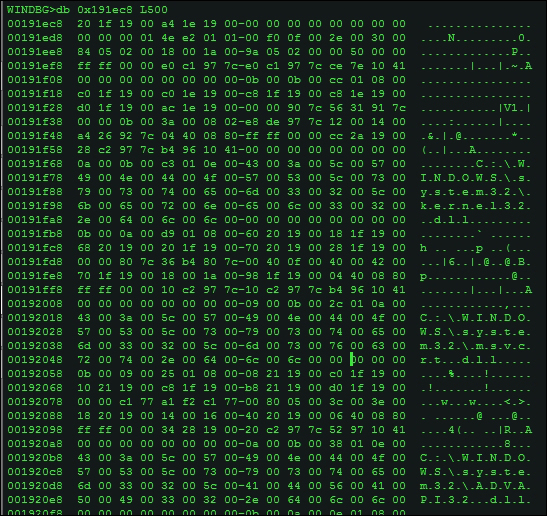
Let's then display a hex editor-like view of the first 500h bytes and you try to identify and mark the Flink and Blink pointers, as well as get a listing of the unicode strings of the loaded dlls, in the exhibit excerpt you can see that kernel32.dll, msvcrt.dll, and advapi32.dll are loaded in memory. Like db (display byte), you also have da and du to display ASCII and Unicode strings, and dd to display dwords. The counterpart to the d* series of commands are the e* commands (enter/edit values), for memory based editing with a very similar syntax. The following extract is from .hh ed typed in the command line:
|
|
This enters data in the same format as the most recent |
|
|
ASCII string (not NULL-terminated). |
|
|
Byte values. |
|
|
Double-word values (4 bytes). |
|
|
NULL-terminated ASCII string. |
|
|
NULL-terminated Unicode string. |
Another similar command of interest is WriteMemory which is analogous to WriteProcessMemory() Win32 API and writes the to debugee process memory. The signature is:
ULONG WriteMemory (ULONG_PTR offset, LPCVOID lpbuffer, ULONG cb, PULONG lpcbBytesWritten);
The .writemem command writes a section of the memory to a file which can be helpful for in-memory dumping during debugging sessions.
.writemem FileName Range
Moving on,
db 0x191ec8 L500
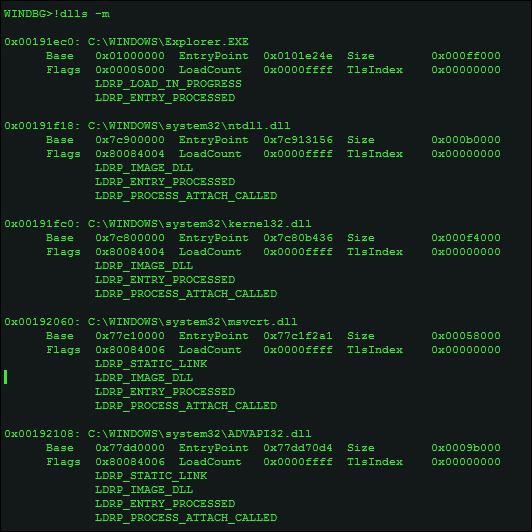
To verify the order of the dll strings that you see in the preceding hex dump, you can use the !dlls –m extension command.
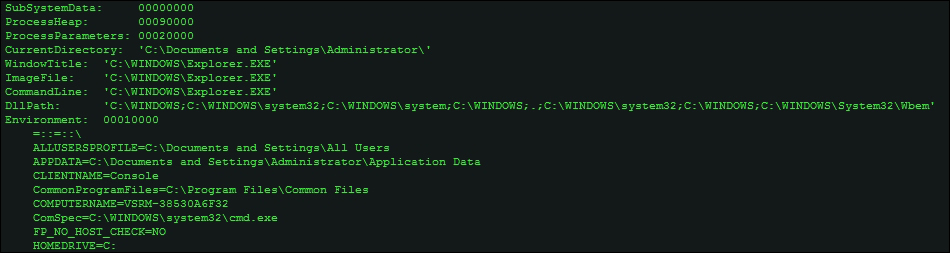
Alternatively, you can simply type !peb (remember extension commands, read the reference for in-depth descriptions of each such command as they come using .hh <command name>) in the current process context to get a listing of the Peb.
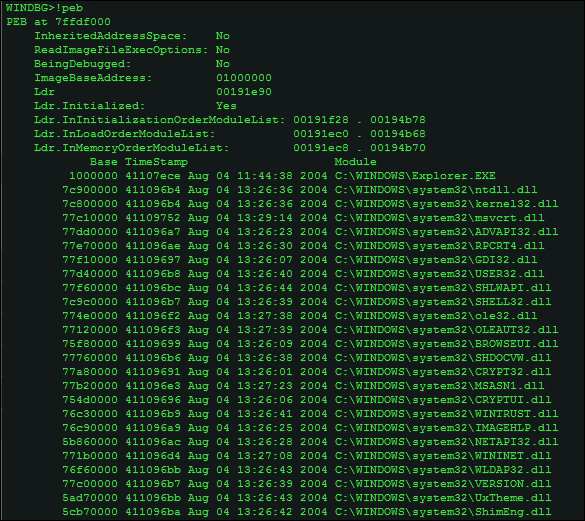
as well as other information like environment strings and command-line,
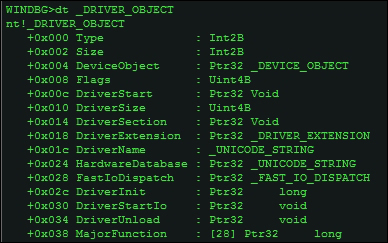
Some of the other commands to explore kernel data structures such as _DRIVER_OBJECT for device drivers and the Interrupt Descriptor Table (IDT) and model specific registers among others, which you are encouraged to explore are:
The _DRIVER_OBJECT data structure (use dt -r _DRIVER_OBJECT to get a recursive listing). In the next image, DriverInit located at 0x2C is the address of the entry point of the driver. The MajorFunction array consists of 28 IRP (I/O Request Packets) handlers. IoLoadDriver is the function that can be broken into to get to the OEP of the driver, normally during unpacking for the same (you can just let the malware run and break on the specified APIs, and then dump it for static analysis with IDA Pro), especially if the driver is loaded using services or APIs like ZwLoadDriver, stepping into which the sequence of call dword ptr [edi+2Ch] is visible, where edi contains the base address of the _DRIVER_OBJECT structure.
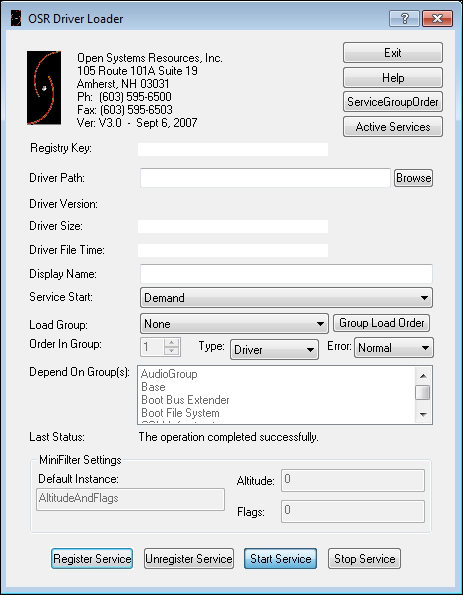
Regarding driver analysis for loading them, OSR Driver Loader is a great tool used to simplify the loading process. http://www.osronline.com/article.cfm?article=157
DLoad at http://www.codeproject.com/Articles/43461/Driver-Loader-DLoad-from-Scratch is an open source tool that provides the following features, along with three different ways of loading a driver:
- Load driver with
ZwSetSystemInformation - Load driver with
NtLoadDriver - Load driver with Service Control Manager
- Unload driver
- Delete driver file
- Delete driver registry entries
- Usage of Thread Injection technique
- Injection with
RtlCreateUserThread - Injection with
CreateRemoteThread - Injection with
NtCreateThreadEx LOADModeUNLOADMode- Reboot System
- Shutdown System
- Any combination of the preceding functions
If you want to examine the PE headers of a particular image, use the lmu command to list the process module list and their addresses. and then use !dh <virtual address>, in the following exhibit taken for Explorer.exe.
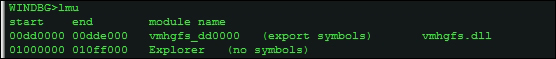
You can also use lmv m <module name without extension>.
The PE Headers listed in the following exhibit, alternatively you can also use the image name as in this example- !dh explorer.exe (or the image name of the current process context).
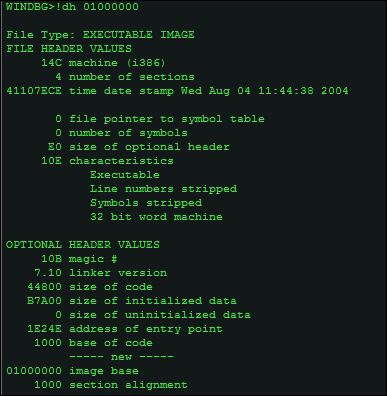
From the preceding details you can get the OEP = (address of entry point + image base), and you can use Windbg as a calculator using the ? expression calculator.
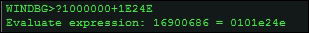
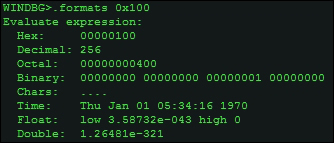
To convert between bases of the values you obtain or to compare values to aid in your analyses, you can use the .format meta command.
Hereon, you can use the u set of commands.
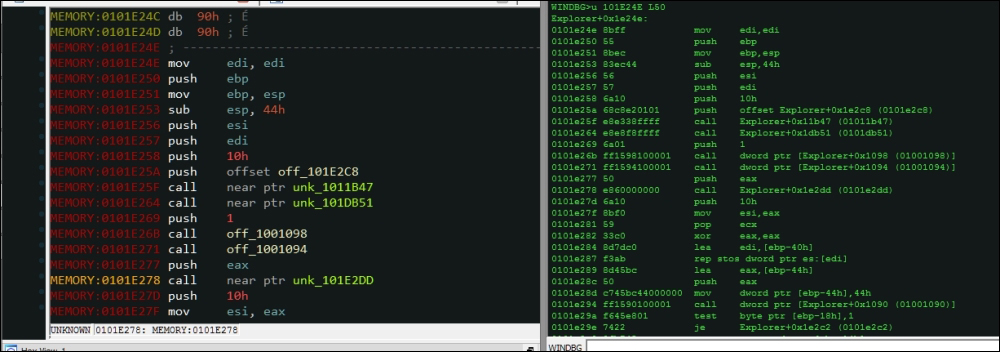
The command u stands for unassemble and takes the address as the main parameter, at the following exhibit the disassembly in IDA Pro and the other in the Output window of Windbg plugin in IDA Pro. You can annotate and label the disassembly and use faster navigation, visualization, graphs and charts, and run other operations and plugins as regular assembly listing.
u 101E24E L50
The L parameter sets the number of lines to display. Remember that the values are in hexadecimal.
Using . (dot) as a parameter passes the EIP value to u or uf (unassemble function), and thus disassembles from the address of the instruction to be executed next or the current function. You can also use ub to disassemble backwards from the given address, which can be useful to find the set of instructions which led to the current instruction address.
The a (assemble) command assembles the instruction mnemonics and puts the resulting instruction codes into memory.
a [Address]
or current EIP value if the address is left blank.
Stepping in the code and stepping over the function calls is done using:
t(F11): To step in the code (trace)p(F10): To step over the function callspct: To step till a call instruction or ret instruction is encountered (something like what you would use in OllyDbg Ctrl + F9, Execute till Return)
Reading the value of registers is an important feature and this can be done using the r command. Additional parameters such as register names can be passed to query that specific one for instance r eip which gives the value at eip.
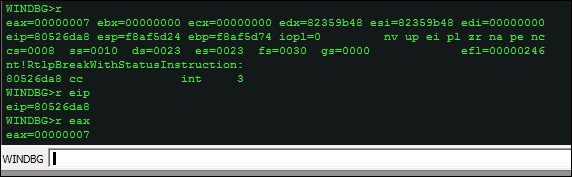
Walking the stack and getting the stack frames is also an important feature which can be done using the k commands, which do a stack backtrace.
The outputs of k, kv, kb, and kn are comparable, with additional information being the main differentiator.
The excerpts are in text dump so that you can analyze the listings in more detail on a page, try to see the difference in the output (do you see additional parameters?), and then read the descriptions from the reference manual for detail.
WINDBG>k
ChildEBP RetAddr
f8af5d20 8065f017 nt!RtlpBreakWithStatusInstruction
f8af5d74 80533dd0 nt!ExpDebuggerWorker+0x91
f8af5dac 805c4a28 nt!ExpWorkerThread+0x100
f8af5ddc 80540fa2 nt!PspSystemThreadStartup+0x34
00000000 00000000 nt!KiThreadStartup+0x16


WINDBG>kv
ChildEBP RetAddr Args to Child
f8af5d20 8065f017 00000007 8055a140 8055a1fc nt!RtlpBreakWithStatusInstruction (FPO: [1,0,0])
f8af5d74 80533dd0 00000000 00000000 825c63c8 nt!ExpDebuggerWorker+0x91 (FPO: [Non-Fpo])
f8af5dac 805c4a28 00000000 00000000 00000000 nt!ExpWorkerThread+0x100 (FPO: [Non-Fpo])
f8af5ddc 80540fa2 80533cd0 00000001 00000000 nt!PspSystemThreadStartup+0x34 (FPO: [Non-Fpo])
00000000 00000000 00000000 00000000 00000000 nt!KiThreadStartup+0x16


WINDBG>kb
ChildEBP RetAddr Args to Child
f8af5d20 8065f017 00000007 8055a140 8055a1fc nt!RtlpBreakWithStatusInstruction
f8af5d74 80533dd0 00000000 00000000 825c63c8 nt!ExpDebuggerWorker+0x91
f8af5dac 805c4a28 00000000 00000000 00000000 nt!ExpWorkerThread+0x100
f8af5ddc 80540fa2 80533cd0 00000001 00000000 nt!PspSystemThreadStartup+0x34
00000000 00000000 00000000 00000000 00000000 nt!KiThreadStartup+0x16


WINDBG>kn
# ChildEBP RetAddr
00 f8af5d20 8065f017 nt!RtlpBreakWithStatusInstruction
01 f8af5d74 80533dd0 nt!ExpDebuggerWorker+0x91
02 f8af5dac 805c4a28 nt!ExpWorkerThread+0x100
03 f8af5ddc 80540fa2 nt!PspSystemThreadStartup+0x34
04 00000000 00000000 nt!KiThreadStartup+0x16
You would want to place breakpoints as you analyze the code. The breakpoint command you can use is:
bp <address>
bp is implemented as a software breakpoint.
Break-on-access is a versatile mechanism that employs hardware breakpoints provided by the CPU and can be used to bypass software breakpoint checks and perform memory range based breakpoints.
ba <memory access modes-e/r/w> <size-1,2 or 4 bytes> <address>
where e, r, and w are the modes of trigger - on execution, read or write of the memory address or range.
Hardware breakpoints are implemented through debug registers. The IA-32 CPU has eight debug registers with DR0, DR1, DR2, and DR3 used to store the memory address of the breakpoints. You thus have only 4 such breakpoints in a typical debugging session. DR4 and DR5 are not used and kept for reserved use. DR6 is used as a status register to monitor the event type and DR7 monitors the breakpoint conditions, that is execution of an instruction, data write, data read and write but no execution.
Memory breakpoints are set using memory page permission - guard page, which results in a one shot exception (STATUS_GUARD_PAGE_VIOLATION) and subsequent return to normal status.
To list the set breakpoints, you use bl. To clear a breakpoint, you use bc <bp number> (the bp number can be obtained using bl). To disable a breakpoint, use the bd <breakpoint number> command.
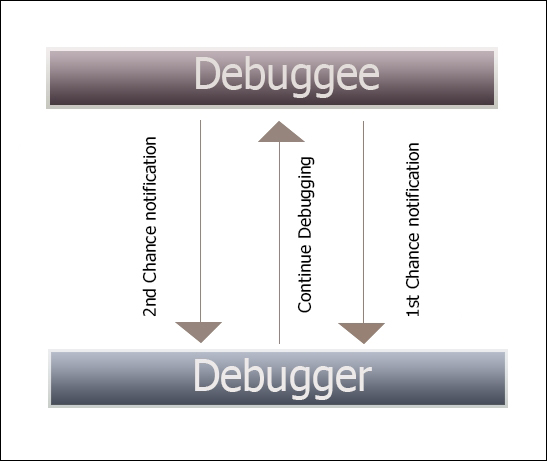
The debugger handles the exceptions in the user mode via SEH (Structured Exception Handling) mechanism. SEH are of two primary types - hardware exceptions (processor interrupts) and software exceptions (RaiseException Win32 API). When exceptions occur, the debugger is notified via the debug events by the OS exception handling code in the user mode module ntdll.dll.
The debugger is given two chances to handle the exception. The debugger monitors the first chance notification and provides a choice to pass the exception back to the debuggee to handle. At the second chance notification, the debugger halts and breaks in the code.
Single stepping through the code is enabled via the trap flag (TF) Int 1 CPU instruction in the EFLAGS register, and software breakpoints are implemented by the debugger using Int 3 (0xCC opcode) instruction which is written to the process memory using WriteProcessMemory and ReadProcessMemory API calls to manage them transparently from the debugee.
The debugger runs in an infinite loop, waiting and processing the debug events, which are OS implementation specific. Once the process handle of the debugee is obtained using CreateProcess or OpenProcess, WaitForDebugEvent monitors the debug events passed in a system object and filters them using event codes in a switch case like filter. Thereafter, ContinueDebugEvent proceeds to resume the debugger operation.
Following are the basic debugger functions used by implementing a few essential Win32 APIs provided by Windows:
OpenProcessHANDLE WINAPI OpenProcess( _In_ DWORD dwDesiredAccess, _In_ BOOL bInheritHandle, _In_ DWORD dwProcessId );
CreateProcessBOOL WINAPI CreateProcess( _In_opt_ LPCTSTR lpApplicationName, _Inout_opt_ LPTSTR lpCommandLine, _In_opt_ LPSECURITY_ATTRIBUTES lpProcessAttributes, _In_opt_ LPSECURITY_ATTRIBUTES lpThreadAttributes, _In_ BOOL bInheritHandles, _In_ DWORD dwCreationFlags, _In_opt_ LPVOID lpEnvironment, _In_opt_ LPCTSTR lpCurrentDirectory, _In_ LPSTARTUPINFO lpStartupInfo, _Out_ LPPROCESS_INFORMATION lpProcessInformation );
DebugActiveProcessBOOL WINAPI DebugActiveProcess( _In_ DWORD dwProcessId );
DebugActiveProcessStopBOOL WINAPI DebugActiveProcessStop( _In_ DWORD dwProcessId );
DebugBreakProcessBOOL WINAPI DebugBreakProcess( _In_ HANDLE Process );
WaitforDebugEventBOOL WINAPI WaitForDebugEvent( _Out_ LPDEBUG_EVENT lpDebugEvent, _In_ DWORD dwMilliseconds );
ContinueDebugEventBOOL WINAPI ContinueDebugEvent( _In_ DWORD dwProcessId, _In_ DWORD dwThreadId, _In_ DWORD dwContinueStatus );
WriteProcessMemoryBOOL WINAPI WriteProcessMemory( _In_ HANDLE hProcess, _In_ LPVOID lpBaseAddress, _In_ LPCVOID lpBuffer, _In_ SIZE_T nSize, _Out_ SIZE_T *lpNumberOfBytesWritten );
ReadProcessMemoryBOOL WINAPI ReadProcessMemory( _In_ HANDLE hProcess, _In_ LPCVOID lpBaseAddress, _Out_ LPVOID lpBuffer, _In_ SIZE_T nSize, _Out_ SIZE_T *lpNumberOfBytesRead );
To examine symbol information and find out API names and other information, you can use the x command. In the following excerpt, we search for all kernel APIs (symbols) containing the Zw prefix. The * wildcard character means that it searches for names that contain Zw anywhere in the name string.
x nt!*Zw*
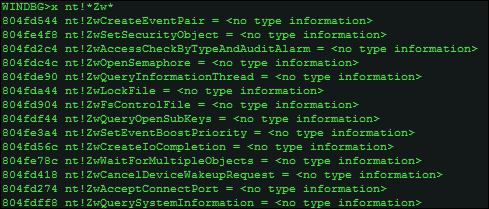
In the kernel mode, you can set a system wide breakpoint at bp nt!ZwCreateFile and all calls to this API, regardless of the process, will break at this API.
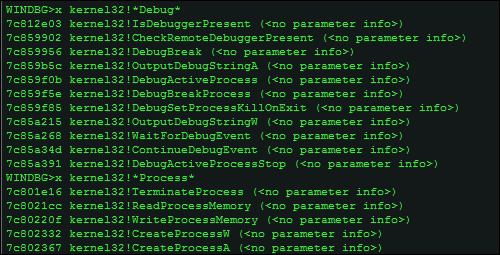
You can search for "Debug" and "Process" related APIs in kernel32.dll, which exports them as shown in the next image.
Examine symbols or x, which also takes the * wildcard character that can be used for symbol searching.
As an exercise, do lookup the following commands in the help system and try to understand how they might work:
!pool: This is for showing memory pools.exr: This is for showing exception information.frame: This is for showing stack frames
You can use Winobj from Sysinternals to learn more about the objects available in your current subsystem.
ObjectTypes lists the kernel objects and their types and many of them exposed to user mode via handles. Many of the objects are undocumented and others are only accessible from the kernel mode.
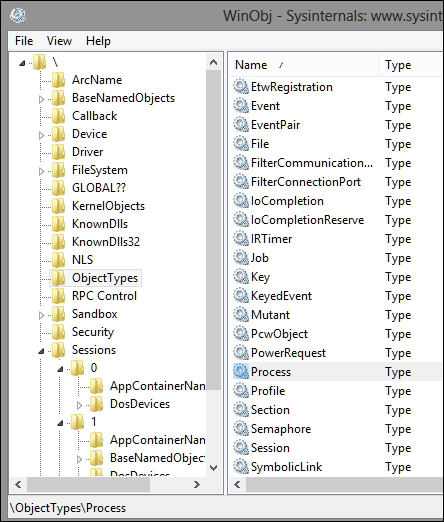
Note the process and mutant (mutex) object types. The job object is also important as are groups processes. Semaphores are similar to mutants (used as a synchronization mechanism – for instance, a process can check if another process instance of the same file image is created) with a count. SymbolicLinks are used throughout the system. For instance, the drive names (C:\) are exposed as symbolic links.

You will find that many Windows APIs reveal or work on many of these objects – OpenProcess and CreateProcess work expose the process objects, CreateThread and OpenThread expose the thread objects, CreateMutexA and OpenMutex expose the mutants, and CreateSemaphore and OpenSemaphore expose the semaphore objects. You must have noticed a kind of pattern – Create*** and Open*** prefixed APIs might just work on a particular object and you can get the name of the type from the postfix string! Double check it with WinObj and Windbg.
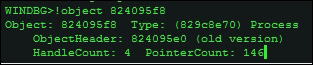
In IDA Pro/Windbg, set the current process to explorer.exe, use .process -1 0 to record the process object address, and type !object 824095f8, replacing the EPROCESS address in the kernel space of the process with the one in your system.
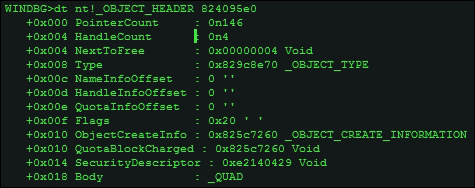
You can then examine the object header using the display type or the dt command, as shown next:
dt nt!_OBJECT_HEADER 824095e0
You can then probe further and look into the object type, taking the address as a parameter:
dt nt!_OBJECT_TYPE 829c8e70
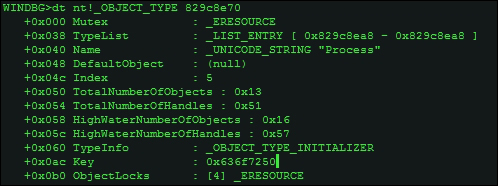
Name field as UNICODE_STRING "Process". An interesting thing to note is that the TotalNumberOfObjects field is 0x13 at the time of running the command. Converting it to decimal using .formats 13 or ? 13, you can deduce that the total number of process objects or processes running in the system is 19.
At this point, some excellent references to this introductory primer to kernel based debugging merit mention, as this is a more involved topic that must be explored in more depth. The first obvious choice for many is to study C:\Program Files (x86)\Debugging Tools for Windows (x86)\kernel_debugging_tutorial.doc, installed along with the DDK packages, along with the reference help file debugger.chm accessible through the .hh command. The following are some other worthy references:
- Inside Windows Debugging, Tarik Soulami, Microsoft Press US
- Windows Internals, Mark Russinovich, Dreamtech Press
- Gray Hat Python, Justin Seitz, O'Reilly
- Practical Reverse Engineering, Bruce Dang, John Wiley & Sons
- http://www.osronline.com/
These are excellent resources for more in-depth excursion into debugging internals and the kernel land.