Table of Contents for
Windows Malware Analysis Essentials
 Windows Malware Analysis Essentials
Published by
Packt Publishing, 2015
Windows Malware Analysis Essentials
Published by
Packt Publishing, 2015
- Cover
- Table of Contents
- Windows Malware Analysis Essentials
- Windows Malware Analysis Essentials
- Credits
- About the Author
- Acknowledgments
- About the Reviewer
- www.PacktPub.com
- Preface
- What you need for this book
- Who this book is for
- Conventions
- Reader feedback
- Customer support
- 1. Down the Rabbit Hole
- Signed numbers and complements
- Boolean logic and bit masks
- Breathing in the ephemeral realm
- Sharpening the scalpel
- Performing binary reconnaissance
- Exploring the universe of binaries on PE Explorer
- Getting to know IDA Pro
- Entropy
- Summary
- 2. Dancing with the Dead
- Registers
- The initiation ritual
- Preparing the alter
- Code constructs in x86 disassembly
- Summary
- 3. Performing a Séance Session
- Debriefing – seeing the forest for the trees
- Preparing for D-Day – lab setup
- Whippin' out your arsenal
- Summoning the demon!
- Post infection
- Exorcism and the aftermath – debrief finale!
- Summary
- 4. Traversing Across Parallel Dimensions
- Alice in kernel land – kernel debugging with IDA Pro, Virtual KD, and VMware
- Summary
- 5. Good versus Evil – Ogre Wars
- Encoding/decoding – XOR Deobfuscation
- Malicious Web Script Analysis
- Byte code decompilers
- Document analysis
- Redline – malware memory forensics
- Malware intelligence
- Summary
- Index
Let us go about the steps to performing full analysis.
Most of the time, you will need more information from the binary sample itself, or if you work with a memory dump, you will need to extract the binary executable or build it from there, so either way you will need to canvas the PE format and its dimensions and look for obvious and not so obvious signs of maliciousness. This information can be utilized for signature creation and other detection rules and will often be precursors and addendums to Indicators of Compromises (IOCs).
The particulars that can help in identification and cataloging of malware databases include hashes, packer/compression/armoring employed and their nomenclature and markers, section names, section virtual, and raw sizes and address, import and export tables, other compiled data directory structures such as TLS/debug directory/base relocation tables among others, section hashes, entropy(s), and overlays, among others. You must be on the lookout for anomalies.
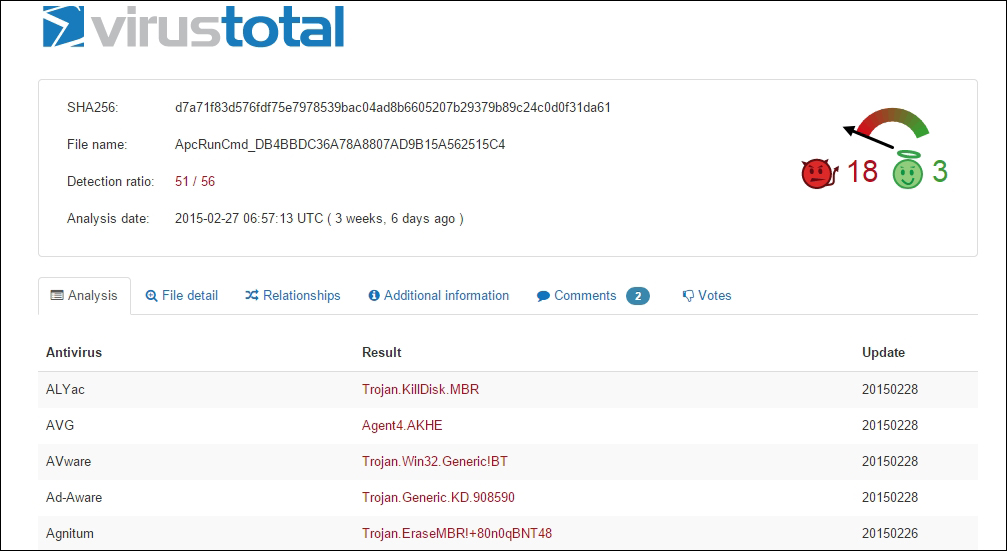
You can also utilize https://www.virustotal.com/ and similar services to gather detection information from other sandbox and antimalware vendors.
Let's collate the available information as the header (sample shown in the following part, how you arrange text and graphics in a report depends on the house rules of your employer or upto your own artistic license) of the report using FileAlyzer and https://www.virustotal.com/:
Malware Name – Dark Seoul
CRC-32: Cyclic redundancy check, 32 bit: 68AE9795
MD5: Message-Digest algorithm 5: DB4BBDC36A78A8807AD9B15A562515C4
SHA-1: US Secure Hash Algorithm 1: 309AF225AC59E1D2FFAADA11E09F5715BCE16C1E
SSDeep: 192:0v5uXGwnkGjGlCdhAtNvIQszEtTmhVYWY02noM1qtT57MkJRVtyycpc7numoZ9:E5uXGw/ClCTEZ3WNDMEN5yycpcrumoZ
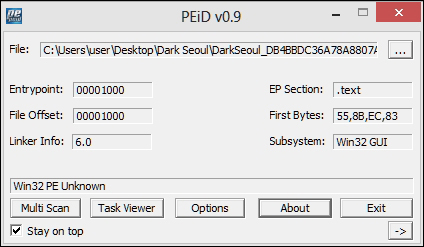
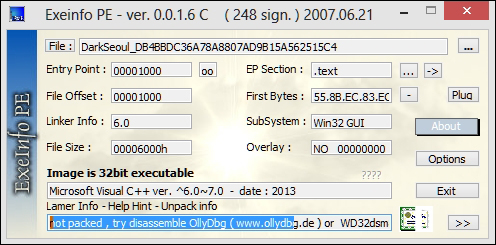
Drag and drop the binary sample in PEiD and Exeinfo. You will observe that the file is not packed. PEiD, while being excellent, is not supported anymore, hence a double-check with Exeinfo, which is still being actively maintained.
Exeinfo offers an eerily similar interface and feature set to PEiD. In the following exhibit, we get more information about the compiler that the malware is compiled with. There are additional deeper features such as entropy analyses, crypto analysis, and overlay information, for instance, that are comparable in both of the tools, and it is wise to explore them as you investigate and search for things of interest. You are advised not to use the generic unpacking options here as the malware may execute its payloads unhindered, which will stall your session. Feel free to experiment and play with the additional features.
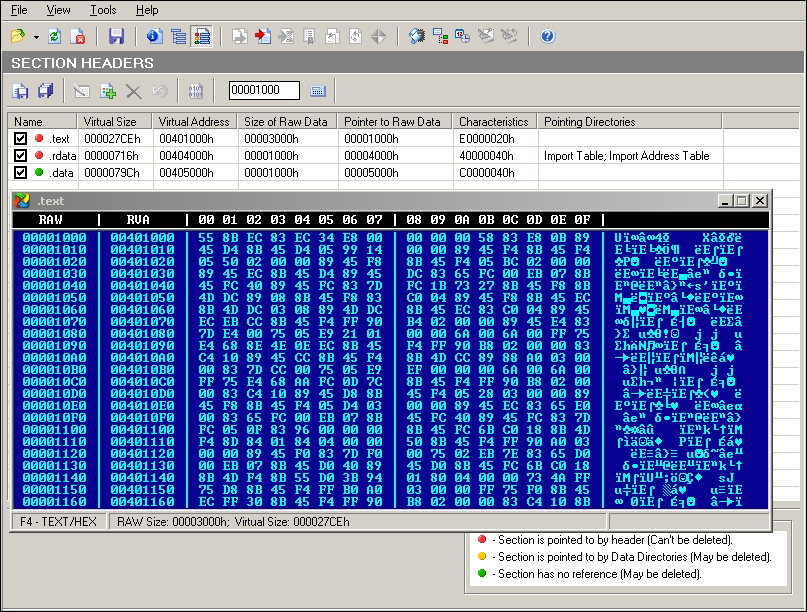
Open the malware sample in PEExplorer. Observe relatively normal PE file features. What is normal? You have to read the specification and analyze a lot of files, both visually and analytically, and the duo of benign and malicious to establish a strong sense of what can be possibly malicious binary files. Malformed and corrupted PE files, as well as overly obfuscated and packed binaries, are dead giveaways—their section names and values are usually way off. This malware has three sections with normal compiler names. VA and raw values are also in range and look valid prima facie. Section .rdata contains the import tables.
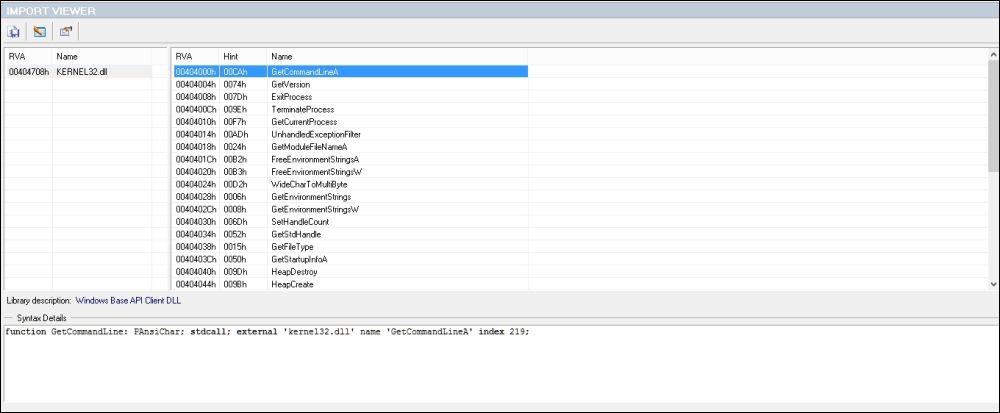
We see that the malware sample imports only one system dll—Kernel32.dll with the listed import functions. Keeping a track of the number of satellite binary modules and their imported and exported functions gives an indication of possible malware functionality or at least what it appears to be as in this case, though this can be very misleading as there are a myriad of ways that modules can be loaded when the malware is running.
A good feature in PEExplorer is the Syntax Details pane, as shown in the following screenshot, and can be helpful for getting an overview of each Win32/Native API function in Windows if so required:
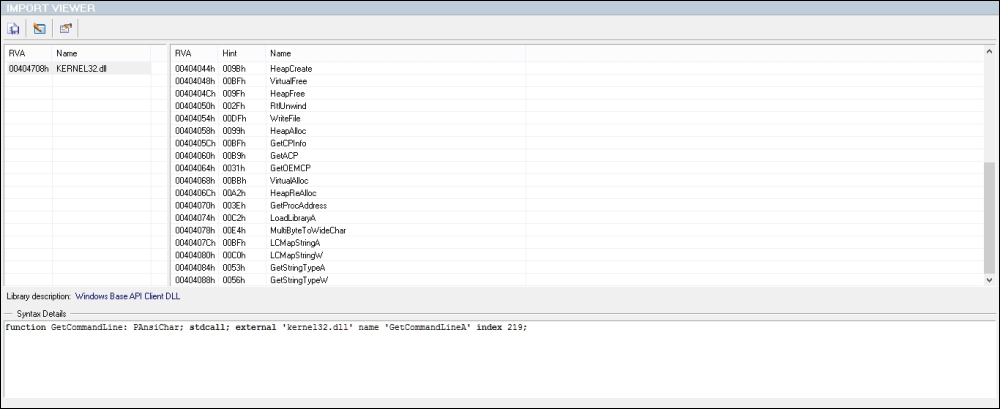
Continuing the imports list:
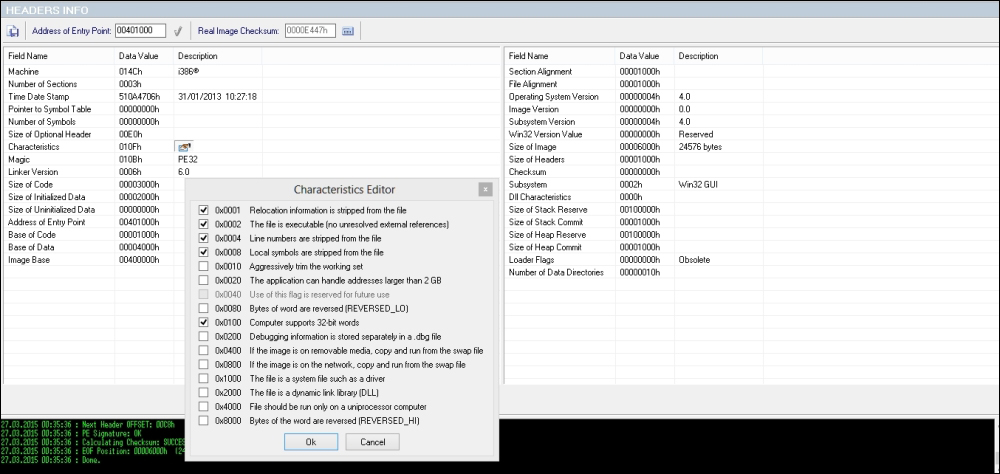
The PE headers hold a wealth of information relevant to the PE format of the malware binary and the following exhibit displays the tabular format of the exploded header, as well as the characteristics bit field's flag values that are set. This is essential to ascertain whether the file is a dll or an executable among other parameters. Time stamp and checksum values as well as the subsystem field can be noted down. Other important fields are Size Of Image, Address of Entry Point, and Image Base. If you check, they all line up to be part of a valid and well-formed PE binary.
You can see that the malware binary is a Windows GUI program (or so the malware wants you to believe), which has a valid machine signature, 0x014C and magic value, 0x010B. But if you look at the imports, there is no GDI32.dll or USER32.dll in place. So, this might be an indication of a subversive infection where the analyst never sees any Windows form of any kind, or if it does, the dll modules are loaded dynamically. Additionally, the resources section is totally absent, without even version strings, which, in a regular executable GUI file, would be particularly odd and hence raises suspicion.
Strings can be a finicky thing to extract with some tools, and in this particular example, PEExplorer did not extract all of the strings properly. Both ASCII and UNICODE strings are extracted and are shown in the following exhibit. Many a time, malware writers will abstain from leaving hardcoded IP addresses, passwords, or keys in a binary and generate/decrypt them at runtime, and those strings can be obtained only by detailed debugging sessions or packet captures, which can then be further analyzed. The moral of the story is do not ever rely on only one tool when it comes to reverse engineering as every tool has its own pros and cons (and know the cons, more importantly!). Paying due diligence will help you sharpen your analysis focus and save time and prevent headaches later on.
At this point, you can use either IDA Pro with Bochs debugger, Windbg debugger, or even the local Win32 debugger and start intelligently tracing through. Using Bochs debugger has the advantage of emulating the hardware, so you will not have to explicitly use a virtual machine unless you suspect that the malware might run outside the Bochs (pun intended). Also, a lot of boot code and MBR-related debugging is best done with this very useful emulator. However, you will use OllyDbg for this session and you are encouraged to try out similar results with the above configurations.
Using BSA Buster Sandbox Analyzer a priori to the manual runtime analysis should give an overall idea and a few pointers to IOCs. In general, it is a good idea to run a malware a couple of times in a monitored environment so that the runtime trace can provide an immediate profile of the overall functionality of the malware. The config file Sanboxie.ini accessed through Configure | Edit Configuration needs to be edited to add the following lines (change the path of the BSA directory as required). BSA itself is a portable application that extracts to a folder and can be run directly.
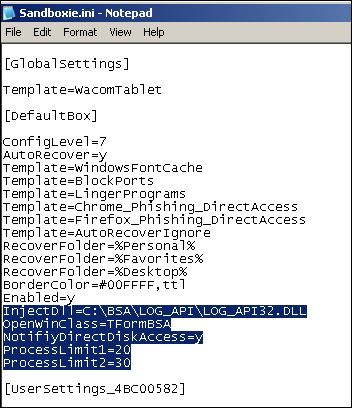
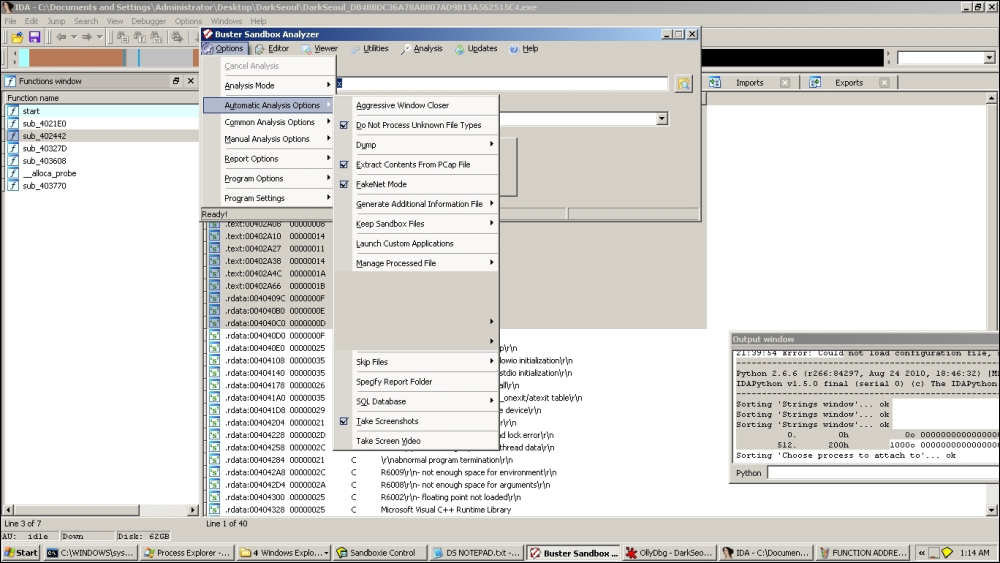
You can set up BSA in FakeNet mode just in case there is some network activity and set it up to capture packets and take screenshots, as well as record API calls and registry interactions. Additionally, all payloads and dropped files are saved in Sandboxie's drive. All the API calls of parent and child processes that run in Sandboxie will be recorded with parameters. Since Sandboxie is in user mode and does not allow kernel level interaction for security reasons, the details are limited to user mode information for this particular run. You can execute the malware inside Sandboxie's default box and wait for BSA to complete analysis. BSA integrates static analysis tools for executable analysis and fingerprinting including a basic disassembler, memory explorer, pcap explorer, FakeNet mode, android malware analyzer, internal malware threat analyzer, online URL analyzer, screenshots, registry monitoring, and a comprehensive list of online analyzers sample/hash submission.
Overall, you get the impression that it is a very capable pocket-sized malware sandbox that does enough for someone looking to have a rapid overview without the installation overhead, especially if the user mode malware is your primary focus. In fact, a very quick malware lab can be constructed just using OllyDbg or IDA Pro and BSA with Sandboxie containing both OllyDbg/IDA Pro and the malware running inside Sandboxie, with API logging and Fakenet mode enabled, though you would prefer not to deploy it likewise for destructive malware samples and it could be better to use Cuckoo sandbox or your own virtual machine installation.
Report generated with Buster Sandbox Analyzer 1.88
[ General information ]
   * File name: C:\Documents and Settings\Administrator\Desktop\DarkSeoul\DarkSeoul_DB4BBDC36A78A8807AD9B15A562515C4.exe

[ Changes to filesystem ]
   * No changes

[ Changes to registry ]
   * Modifies value "NukeOnDelete=00000001" in key HKEY_LOCAL_MACHINE\software\microsoft\Windows\CurrentVersion\Explorer\BitBucket
old value empty
   * Creates value "DontShowUI=00000001" in key HKEY_LOCAL_MACHINE\software\microsoft\Windows\Windows Error Reporting
   * Creates Registry key HKEY_LOCAL_MACHINE\software\microsoft\Windows\Windows Error Reporting\LocalDumps
   * Creates value "(Default)=31" in key HKEY_CURRENT_USER\software\SandboxAutoExec

[ Network services ]
   * No changes

[ Process/window/string information ]
   * Gets computer name.
   * Creates process "null, taskkill /F /IM pasvc.exe, null".
   * Injects code into process "C:\WINDOWS\system32\taskkill.exe".
   * Creates process "null, taskkill /F /IM clisvc.exe, null".
   * Creates process "null, shutdown -r -t 0, null".
   * Enables privilege SeDebugPrivilege.
   * Injects code into process "C:\WINDOWS\system32\shutdown.exe".
   * Enumerates running processes.
   * Enables privilege SeShutdownPrivilege.
   * Enables privilege SeRemoteShutdownPrivilege.
   * Enables process privileges.
   * Ends Windows session.
A detailed system API call list, as shown in the following extract, is also generated, which is part of the individual reports in the BSA reports folder:
CreateProcess(null, taskkill /F /IM clisvc.exe, null) [c:\documents and settings\administrator\desktop\darkseoul\darkseoul_db4bbdc36a78a8807ad9b15a562515c4.exe]
GetModuleHandle(winlogon.EXE) [c:\documents and settings\administrator\desktop\darkseoul\darkseoul_db4bbdc36a78a8807ad9b15a562515c4.exe]
OpenProcessToken(C:\Documents and Settings\Administrator\Desktop\DarkSeoul\DarkSeoul_DB4BBDC36A78A8807AD9B15A562515C4.exe, TOKEN_DUPLICATE, TOKEN_QUERY, TOKEN_READ) [c:\documents and settings\administrator\desktop\darkseoul\darkseoul_db4bbdc36a78a8807ad9b15a562515c4.exe]
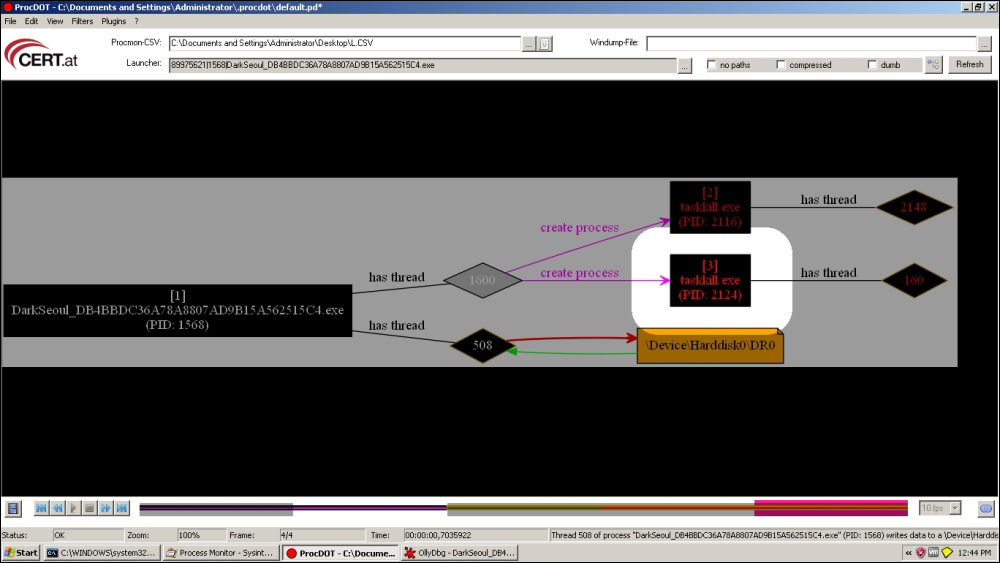
ProcDot is a post-execution interactive visual analysis utility that can be implemented at this point as a separate analysis session (VMWare snapshot revert) so that you avail of a visual flow graph and timeline (much like malware forensic tools) of many of the key events in the execution trace of the malware such as Windows messages, new threads, new processes, registry access, filesystem access, and so on and so forth. For this, you have to have had installed Windump and WinPcap (or simply install Wireshark for the pcap file) a priori along with Procmon (Sysinternals Process Monitor) with the Procmon logs exported as .csv (not native .pml format) along with Graphviz as the dependencies required for this particular tool.
A few simple config parameters need to be set, such as unckecking the Show Resolved Network Addresses (Ctrl + N) in Procmon options, and you need to manually input the full path of the dependencies. Thereafter, you execute the malware and hopefully capture the Procmon logs and pcap dumps as expected and then you feed the files to ProcDOT. ProcDOT makes a correlation between these two data sources and uses Graphviz to churn out the chart graphics. It can be a very handy tool given the right circumstances, and especially for the analysis report executive summary section, and you are encouraged to try it out.
You can use sandboxes such as Cuckoo and its online service malwr.com. The report offers a very detailed runtime trace as well as other static fingerprinting data, such as the one we have already extracted. But, the locations in the code are not too well demarcated as API calls drill down to their native equivalents. So, while the call parameters and payloads are monitored, you still have to get a one-to-one binary runtime address to feature translation, in order to get a very precise malware report and ascertain which function is responsible for doing what. A multitude of modules are dynamically loaded and we see that certain payloads are activated with certain parameters passed to certain function calls and in sequence. You will sift through this data and add the indicators of compromise to your final report. So, we have some evidence of malicious activity at this juncture. Now how do we pinpoint it? For that, we move on to manual analysis.
Open the malware in OllyDbg using Ctrl + O or just drag and drop. You break in the module entrypoint of the main executable. In the CPU window, right-click and navigate to Search for | All Referenced text strings. You will see a very basic set of strings and not the ones you expected from your strings extraction activity earlier, and some of it is not detected by OllyDbg. This is because of the OllyDbg disassembly engine getting confused as to the regions of code and regions of data. You can reach their presumed code addresses and covert back to string data by selecting the region manually and choosing from the Analysis context menu to treat the data as ASCII text in the next analysis. Thereafter, you remove the analysis and reanalyze the code to get the similar depiction in the disassembly window as well. Experiment with the other options to see what you get.
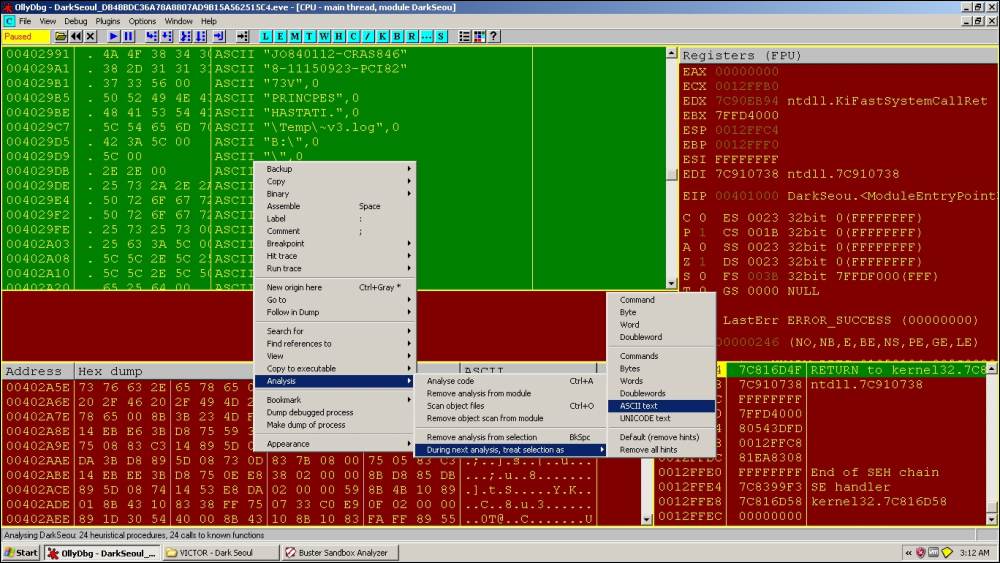
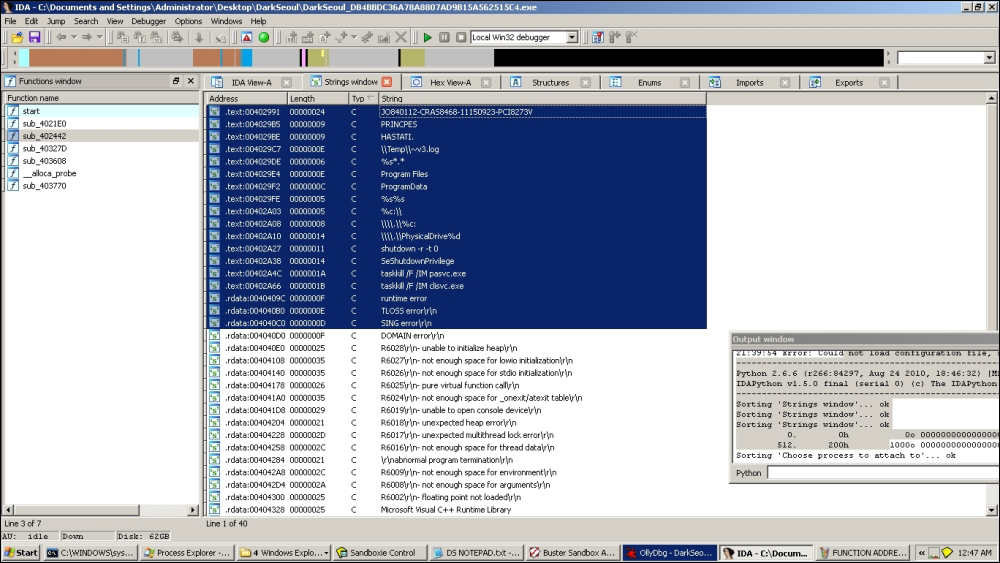
Try to find the dump of strings, as shown in the following text dump, from the strings list (double-click on any line), click on the memory dump view below the CPU disassembly view, and use the mouse to scroll up or down. You can also press Ctrl + G and type a hexadecimal address and transport there right away.
[Text Dump]
00402987  00 00 00 00 00 00 00 00 00 00 4A 4F 38 34 30 31  ..........JO8401
00402997  31 32 2D 43 52 41 53 38 34 36 38 2D 31 31 31 35  12-CRAS8468-1115
004029A7  30 39 32 33 2D 50 43 49 38 32 37 33 56 00 50 52  0923-PCI8273V.PR
004029B7  49 4E 43 50 45 53 00 48 41 53 54 41 54 49 2E 00  INCPES.HASTATI..
004029C7  5C 54 65 6D 70 5C 7E 76 33 2E 6C 6F 67 00 42 3A  \Temp\~v3.log.B:
004029D7  5C 00 5C 00 2E 2E 00 25 73 2A 2E 2A 00 50 72 6F  \.\....%s*.*.Pro
004029E7  67 72 61 6D 20 46 69 6C 65 73 00 50 72 6F 67 72  gram Files.Progr
004029F7  61 6D 44 61 74 61 00 25 73 25 73 00 25 63 3A 5C  amData.%s%s.%c:\
00402A07  00 5C 5C 2E 5C 25 63 3A 00 5C 5C 2E 5C 50 68 79  .\\.\%c:.\\.\Phy
00402A17  73 69 63 61 6C 44 72 69 76 65 25 64 00 25 73 00  sicalDrive%d.%s.
00402A27  73 68 75 74 64 6F 77 6E 20 2D 72 20 2D 74 20 30  shutdown -r -t 0
00402A37  00 53 65 53 68 75 74 64 6F 77 6E 50 72 69 76 69  .SeShutdownPrivi
00402A47  6C 65 67 65 00 74 61 73 6B 6B 69 6C 6C 20 2F 46  lege.taskkill /F
00402A57  20 2F 49 4D 20 70 61 73 76 63 2E 65 78 65 00 74   /IM pasvc.exe.t
00402A67  61 73 6B 6B 69 6C 6C 20 2F 46 20 2F 49 4D 20 63  askkill /F /IM c
00402A77  6C 69 73 76 63 2E 65 78 65 00 8B 3B 23 4D F8 23  lisvc.exe..;#M.#
00402A87  FE 0B CF 75 05 83 C3 14 EB E6 3B D8 75 59 3B 5D  ...u......;.uY;]
You can immediately see some strings that reference service image names and the taskkill command in Windows. We also see a shutdown-related string that might hint at the behavior of this malware. We also see strings referring to the physical drive, as well as temp files and what looks ostensibly like a privilege escalation parameter to a Win32 API function—SeShutdownPrivilege(). Speaking of privileges, the SeDebugPrivilege is required in Windows to perform process hollowing or process injection. This particular privilege allows a process to open other processes and read/write their memory. When you see this privilege passed/set with the API AdjustTokenPrivileges, it should be a red flag for suspicious activity. We also see some format strings that are very likely to be used in string-related functions to build dynamically changing strings to enumerate various parameters or loop values. You can read more about the concept at http://blogs.msdn.com/b/oldnewthing/archive/2008/03/14/8080140.aspx and the privilege constants at https://msdn.microsoft.com/en-us/library/windows/desktop/bb530716(v=vs.85).aspx.
Open up the memory window and study the memory layout of the executable. Press Ctrl + E to open the executable names window to see the list of loaded executables. You will notice how this will look different when more dlls are loaded as we move on. Press Ctrl + M to understand the memory layout of the process space.
A simple thing to do at this point is to set the debugger event options as in the following exhibit:
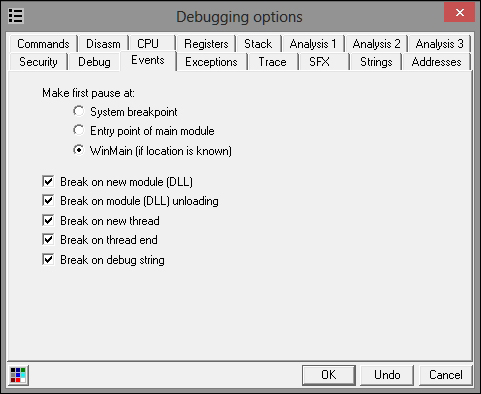
This will ensure that the debugger will break on the events listed previously, for example when a new module is loaded or unloaded, or if a new thread is created. If you detect TLS callbacks (a mechanism for threads to have their own storage space, which can be invoked or called if callbacks are registered, even before the main function executes), then you can set the system to the breakpoint option. This is normally detected in the data directories data structure in the PE file headers and if there is mention of it by the static analysis tools, then it is absent.
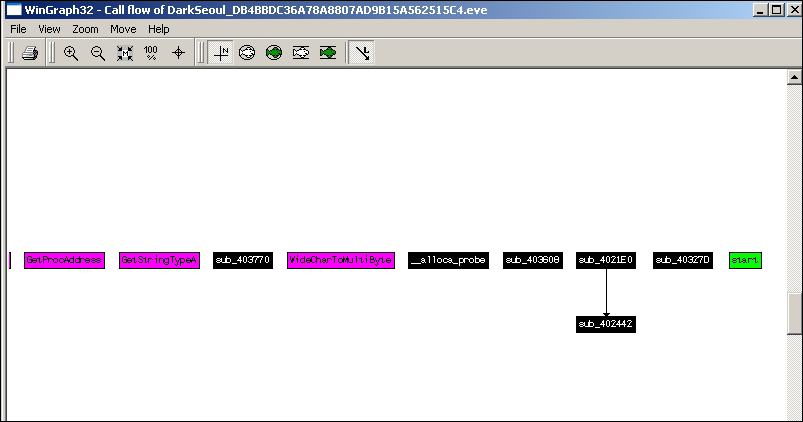
You should also have an overview of the disassembly to look for regions of interest. Open up the sample in IDA Pro and check the chart references and the WinGraph32 chart. You will see that the charts are a dead-end. The references lead nowhere (not without some work on your part) and the imports are not being utilized for anything overtly malicious. Large sections of unrelated code are visible and many regions or green-colored (default) data boundaries exist, which could be encrypted data or code recognized as data.
Demarcate the function boundaries and what IDA Pro's FLIRT technology already recognizes. Set down to isolate these undetected regions in OllyDbg as an overview. Mix and match tools and repeat techniques. There is no silver bullet when it comes to malware analysis, and your "favorite gun" might be the very weapon that gets jammed in the heat of the battle. The less dependent you are, the more resourceful you will be. You want the results to be consistent all across.
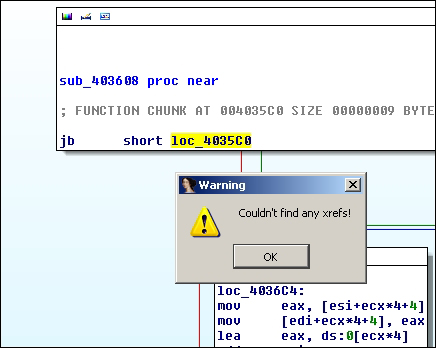
Non-resolving cross-references in the following exhibit from IDA Pro (View | Graphs | Xrefs from).
Back to OllyDbg, go over the executable code to get an overview of the length and the kinds of code regions you will be analyzing. Try to get an overall feel of the disassembly—is it overtly complex with lots of XOR, SHL, SUB and MUL, nested loops, and with lots of dynamic register-based function calls and lots of indirect addressing or switch tables and virtual functions? Or, is it a more direct fare with expected disassembly? Try to visually pattern match the disassembly code you have seen from your experience and try to build a catalog of such patterns that will aid you in speedier analysis. Demarcate high entropy regions and suspicious looking code (IDA Pro View-A and the Hex View A really help with the color schemes, try it), and comment your way inside the debugger furiously (use the ; (semicolon) in both OllyDbg and IDA Pro) or use an external text editor prior to compiling notes and screen snapshots for your report.
Thereafter, start executing the sample inside the debugger and try to selectively engage and test all the concepts you have been imbibing till now. Use a combination of educated single stepping (F7) and stepping over (F8), as well as setting breakpoints (F2), conditional breakpoints (Shift + F2), and conditional expressions (Shift + F4) as you go along. Understand the different types of breakpoints at your disposal (hardware/software/memory/conditional) and use F9 or Debug | Run when you feel you will hit a breakpoint you set or you can F4 hit-and-run your way as you select addresses with your mouse LMB and break at that position (careful, if the instruction is not in the execution path, it will never hit and the malware will execute), skipping long and repetitive code section this way. You can always return to user-code by pressing Alt + F9 or execute till the return prologue of the called function calls by pressing Ctrl + F9. Keep an eye on the function call boundaries (prologue and epilogue of even seemingly unreachable ones), and loop conditionals and the addresses they branch to when true or false. Watch out for function call parameters on the call stack and the register values used to store, calculate, or compare data types. Check the handles used by the debugee to identify system resources in use. Check the Windows pane to check the window classes and callbacks that are registered especially with GUI-based executables. The call trace window gives a breadcrumb trail of the prior function calls when a breakpoint is reached and this can help you in backtracing where the originating call actually took place.
Make use of OS API function call breakpoints. Win32 APIs such as VirtualAllocExA() and VirtualProtect() for memory allocation as well as LoadLibraryExA() (and variants such as LoadLibraryExW, LoadLibraryExA, and so on), GetModuleHandle(), and GetProcAddress() for system API function invocation are sequences that always occur in tandem. For VB5/6 applications, the MSVBM60.dll function call is the same as LoadLibrary/GetProcAddress.
Each function is like a musical note and the series of notes play a particular melody of music. Thus, API profiling is a very strong pattern-based identification technique. If you can locate expected sequence of API calls, you can quickly isolate that region as doing something specific like loading checksums of system API function names, for example, from the _EPROCESS kernel mode process data structure. Certain API calls are used for registry access and privilege escalation; make note of any single calls such as this and always read it in the context of which parameters are passed to the function and what is it trying to achieve. Another tip is to keep MSDN at hand via installation disk or the Internet (preferably in another VM guest or the host machine only) so that any and all API calls that need to be verified and referenced for the constant values, return values, parameters, and function purpose can be done so. It is a great learning tool even for any analysis session. There are also a host of other published books that provide resources such as undocumented APIs for the NT kernel, the NTFS filesystem, driver development (WDK/DDK), and Windows internals with new ones releasing every now and then. Look for changes in the memory dump areas as the colors change (toggle for both ASCII and UNICODE as they can be lost in one representation to the other in the hex to text dump), check the memory window in OllyDbg to see new allocated regions and their contents while using Ctrl + B to search for hex strings, and so on and so forth.
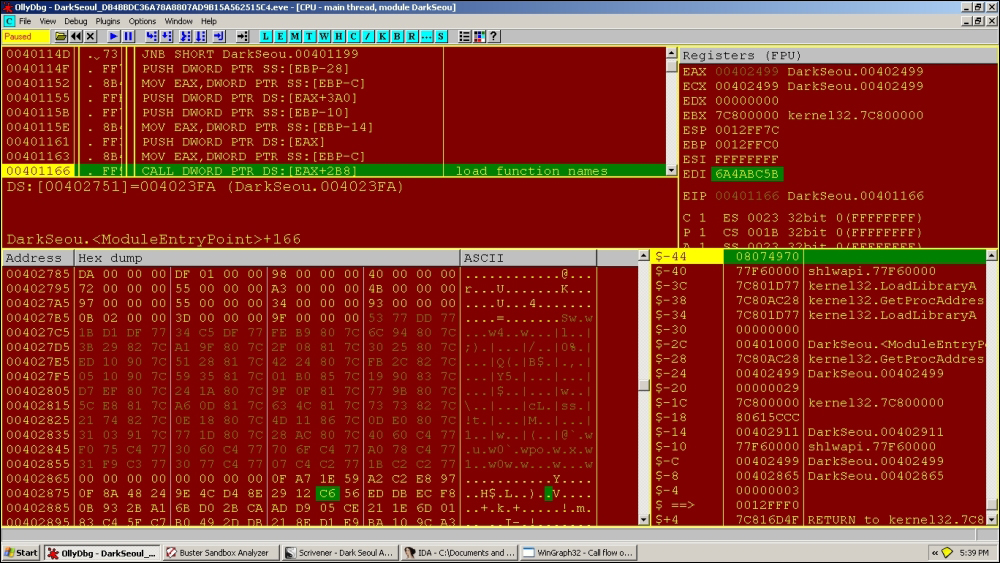
Moving on, at first glance and preliminary investigation, the malware has no armoring and just one imported dll. No high entropy regions or encrypted strings either. You could do a preliminary check that if you set breakpoints on string addresses from the strings window in OllyDbg or the API breakpoints in the obtained names list in OllyDbg, you will not break on any of them and the executable just runs and bypasses all such measures. So, if there is malicious code, what is it referring it to? What is the obfuscation method being employed? To have some fun, you could set breakpoints at many of the unreachable code regions that look like functions and hope that the breakpoints are hit, after which you can backtrace using the call stack and do that repeatedly till you get one of the originating calls, that would be in a register value, from which you can construct a flowchart of all such breakpoint hits. Experimentation is all good; however, we will do no such thing and we will employ a rather elegant way of resolving this predicament. We will capture the function pointer tables in its entirety so that right at the outset we have the whole map as to where the branching locations are and we can then set breakpoints based on the information and start naming the functions as per their payloads and features. Moving on, very shortly you will reach the following code.
Here, we see a function address table being built that is referenced for the payloads and dll searching later on.
Many of these addresses are not referenced by any code, and this table is used to access unreachable regions. You will remember that addresses in groups of dwords or words are read as little-endian; hence, from the following exhibit at 0x004026F5, the value is 0x40129E and so on for the rest and also for other data structures like import and export tables:
[Text Dump]
004026E5  00 00 00 00 00 10 40 00 AD 11 40 00 BC 11 40 00  ......@...@...@.
004026F5  9E 12 40 00 E6 12 40 00 2D 13 40 00 D4 14 40 00  ..@...@.-.@...@.
00402705  5C 15 40 00 E4 15 40 00 FE 15 40 00 5A 19 40 00  \.@...@...@.Z.@.
00402715  43 1A 40 00 B9 1A 40 00 93 1B 40 00 72 1D 40 00  C.@...@...@.r.@.
00402725  0A 1E 40 00 4A 1E 40 00 BC 1E 40 00 11 1F 40 00  ..@.J.@...@...@.
00402735  B4 1F 40 00 FF 1F 40 00 96 20 40 00 EB 20 40 00  ..@...@.. @.. @.
00402745  1F 21 40 00 B2 21 40 00 BD 23 40 00 FA 23 40 00  .!@..!@..#@..#@.
00402755  AD 01 00 00 0F 00 00 00 E2 00 00 00 48 00 00 00  ............H...
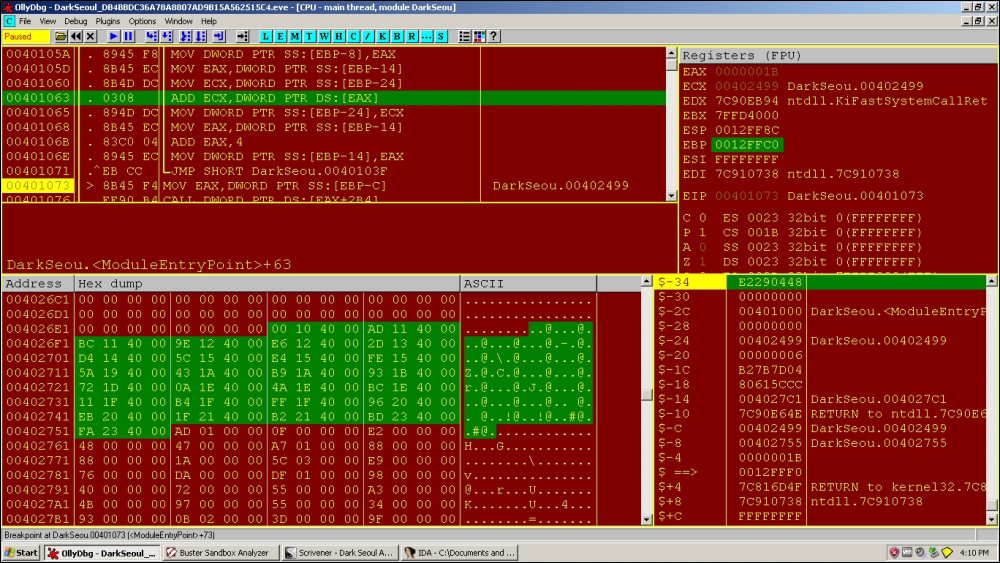
Note the following function that builds the preceding table:
0040103F  |> 8B45 FC  /MOV EAX,DWORD PTR SS:[EBP-4]
00401042  |. 40       |INC EAX
00401043  |. 8945 FC  |MOV DWORD PTR SS:[EBP-4],EAX
00401046  |> 837D FC > CMP DWORD PTR SS:[EBP-4],1B
0040104A  |. 73 27    |JNB SHORT DarkSeou.00401073
0040104C  |. 8B45 F8  |MOV EAX,DWORD PTR SS:[EBP-8]
0040104F  |. 8B4D DC  |MOV ECX,DWORD PTR SS:[EBP-24]
00401052  |. 8908     |MOV DWORD PTR DS:[EAX],ECX
00401054  |. 8B45 F8  |MOV EAX,DWORD PTR SS:[EBP-8]
00401057  |. 83C0 04  |ADD EAX,4
0040105A  |. 8945 F8  |MOV DWORD PTR SS:[EBP-8],EAX
0040105D  |. 8B45 EC  |MOV EAX,DWORD PTR SS:[EBP-14]
00401060  |. 8B4D DC  |MOV ECX,DWORD PTR SS:[EBP-24]
00401063  |. 0308     |ADD ECX,DWORD PTR DS:[EAX]
00401065  |. 894D DC  |MOV DWORD PTR SS:[EBP-24],ECX
00401068  |. 8B45 EC  |MOV EAX,DWORD PTR SS:[EBP-14]
0040106B  |. 83C0 04  |ADD EAX,4
0040106E  |. 8945 EC  |MOV DWORD PTR SS:[EBP-14],EAX
00401071  |.^EB CC    \JMP SHORT DarkSeou.0040103F
00401073  |> 8B45 F4  MOV EAX,DWORD PTR SS:[EBP-C]             ;  DarkSeou.00402499
You will see in subsequent analysis that registers are loaded with the base address at stack segment [EBP-C]:
0x402499
This in future code sequences is taken as the base of the function table in various registers such as ESI and an offset into the table, which is added as a static offset to this particular value for instance:
CALL DWORD PTR DS:[ESI+3B8]
All the payload-related functions are loaded in this way; so keep an eye open for indirect addressed calls like this—this is an obfuscation method as none of the code regions are directly referenced in code.
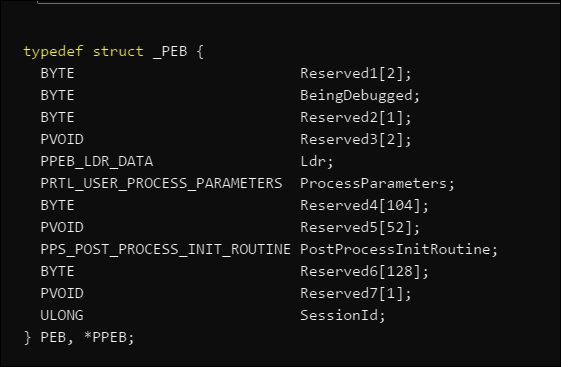
Here, we see a well-known technique for traversing PEB data structure to search for system dlls and checking for hardcoded checksums as in the following code sequence:
From MSDN, visit http://msdn.microsoft.com/enus/library/windows/desktop/aa813706%28v=vs.85%29.aspx.
The PEB data structure is organized as in the following exhibit, and we are interested in the PPEB_LDR_DATA structure, which contains information about loaded modules in the process:
004023BD   . 56     PUSH ESI          ;start of PEB TRAVERSAL FUNCTION
004023BE   . FC     CLD
004023BF   . 33D2   XOR EDX,EDX       ; EDX == 0
004023C1   . 64:8B5>MOV EDX,DWORD PTR FS:[EDX+30] ; PEB
004023C5   . 8B52 0>MOV EDX,DWORD PTR DS:[EDX+C] ;pointer to PEB_LDR_DATA
004023C8   . 8B52 1>MOV EDX,DWORD PTR DS:[EDX+14];InMemoryOrderModuleList
004023CB   > 8B72 2>MOV ESI,DWORD PTR DS:[EDX+28];Malware ImagePath (Unicode)
004023CE   . 33C0   XOR EAX,EAX
004023D0   . B8 180>MOV EAX,18
004023D5   . 50     PUSH EAX
004023D6   . 59     POP ECX
004023D7   . 33FF   XOR EDI,EDI
004023D9   > 33C0   XOR EAX,EAX
004023DB   . AC     LODS BYTE PTR DS:[ESI]
004023DC   . 3C 61  CMP AL,61
004023DE   . 7C 02  JL SHORT DarkSeou.004023E2
004023E0   . 2C 20  SUB AL,20
004023E2   > C1CF 0>ROR EDI,0D
004023E5   . 03F8   ADD EDI,EAX
004023E7   .^E2 F0  LOOPD SHORT DarkSeou.004023D9

004023E9   . 81FF 5>CMP EDI,6A4ABC5B

;kernel32.dll 7C800000 is loaded and the checksum is calculated from the name

004023EF   . 8B5A 1>MOV EBX,DWORD PTR DS:[EDX+10]
004023F2   . 8B12   MOV EDX,DWORD PTR DS:[EDX]
004023F4   .^75 D5  JNZ SHORT DarkSeou.004023CB
004023F6   . 8BC3   MOV EAX,EBX
004023F8   . 5E     POP ESI
004023F9   . C3     RETN
Looking at the following exhibit, we see that the instruction at 0x402434 from the call at 0x4023FA is used to dynamically compare the function hash values loaded in EDI and SS:[ESP+1C]. Setting a conditional breakpoint (Shift + F2) in OllyDBG at 0x402434 using condition EDI == [ESP+1C] to break at every hash value that is successfully computed. Logging of the conditional expression can be done in the Condition Expression dialog box to always; however, in OllyDbg 1.10, this seems to not work as expected and thus you can set it to Never and press F9 (run) to capture the breakpoint hit at every press without stepping in the code. Thus, you can compile a list of function hashes for every function name string constructed in the binary.
The hash calculation and checking function is as follows:
0040241B   > E3 70          JECXZ SHORT DarkSeou.0040248D
0040241D   . 49             DEC ECX
0040241E   . 8B348B         MOV ESI,DWORD PTR DS:[EBX+ECX*4]
00402421   . 03F5           ADD ESI,EBP
00402423   . 33FF           XOR EDI,EDI
00402425   . FC             CLD
00402426   > 33C0           XOR EAX,EAX
00402428   . AC             LODS BYTE PTR DS:[ESI]
00402429   . 3AC4           CMP AL,AH
0040242B   . 74 07          JE SHORT DarkSeou.00402434
0040242D   . C1CF 0D        ROR EDI,0D
00402430   . 03F8           ADD EDI,EAX
00402432   .^EB F2          JMP SHORT DarkSeou.00402426
00402434 >> 3B7C24 1C      CMP EDI,DWORD PTR SS:[ESP+1C]
You will get the following list if you capture the function text and hash (base is hexadecimal) at each breakpoint hit:
ECOE4E8E  LoadLibraryExA
7C0DFCAA  GetProcessAffinityMask
591EA70F  OpenSCManagerA
97E8C2A2  LookupPrivilegeValueW
24488A0F  AllocateAndInitializeSid
8ED44C9E  OpenFileMappingW
56C61229  CreateFileMappingW
F8ECDBED  GetWindowsDirectory
A12B930B  InitializeCriticalSectionAndSpinCount
CA2BD06B  CreateTimerQueue
CE05D9AD  WaitForSingleObjectEx
016D1E21  LoadLibraryA
C75FC483  GetVersionExW
DB2D49B0  SleepEx
E9D18E21  GetDriveTypeW
A39C10BA  EnumCalenderInfoA
63D6C065  FindFirstFileExA
83D32647  RemoveDirectoryW
A5E1AC97  FindNextFileW
23545978  FindCloseChangeNotification
7C0017A5  CreateFileMappingA
E80A791F  WriteFileEx
0FFD97FB  CloseProfileUserMapping
C2FFB025  DeleteFileW
76DA08AC  SetFilePointerEx
B8E579C1  GetSystemDirectoryW
3BF42C83  GetDiskFreeSpaceExA
00CB2210  GetDiskFreeSpaceExW
10FA6516  ReadFileEx
0E8AFE98  WriteConsoleA
7B8F17E6  GetCurrentProcessId
75DA1966  GetLinguistLangSize
670F596E  strchr
5D2E6D6B  mktime
67875973  strcspn
5D866970  memmove
672F5BA8  strncat
D7733C1E  sqrt
676F596A  strcoll
5B7E2B9A  mblen
CF281CE5  freopen
08074970  PathFileExistsW
89DABEF5  FillRect
We see that a lot of API names are referenced for their loading address from their dlls that can be used maliciously.
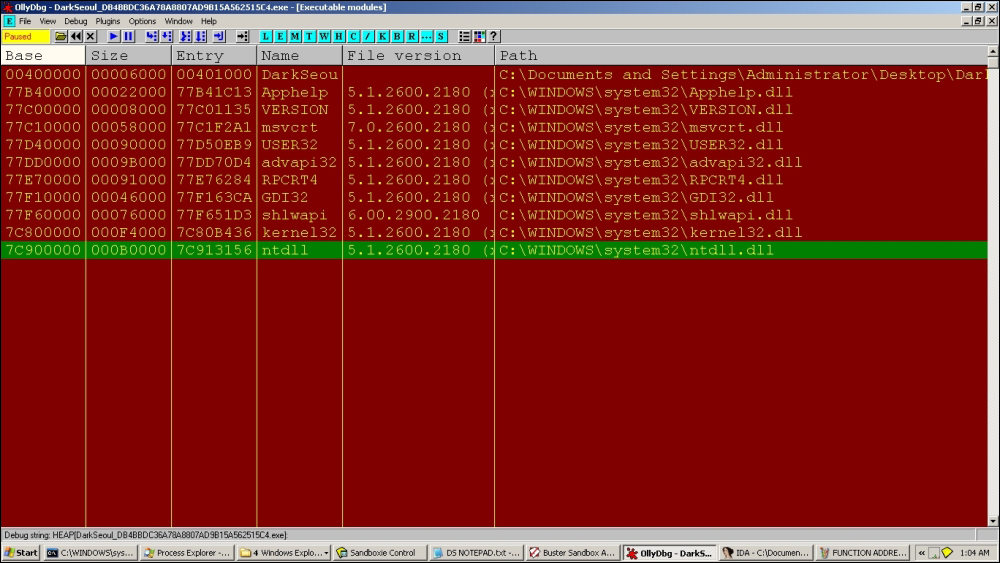
At this point, we can see that the following dlls are loaded during execution:
The first function import value of LoadLibraryA(), 0x7C801D77, is looked up and stored in the following table—it is an in-memory import table built by the malware:
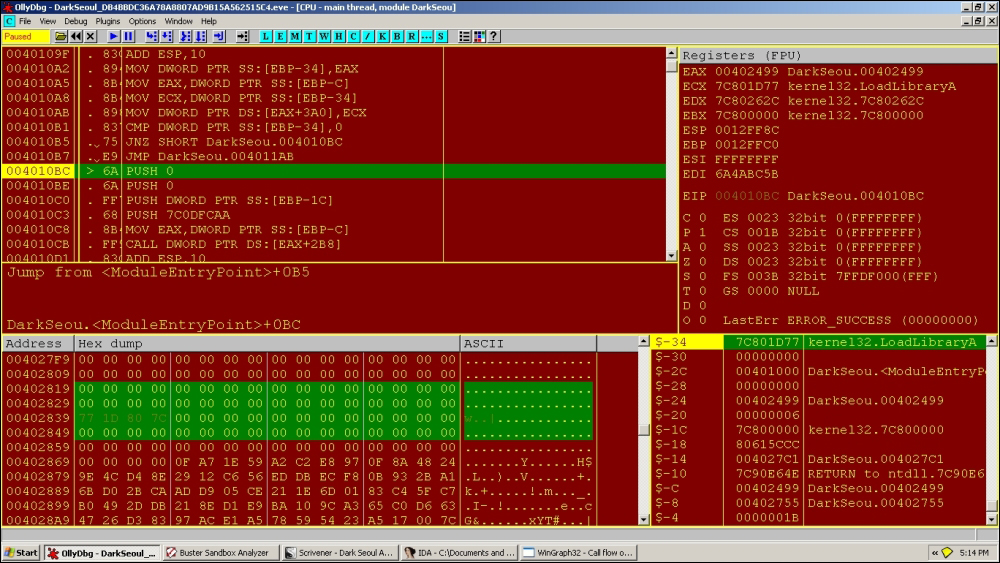
We see a sequence of API functions such as GetProcessAffinityMask() and OpenSCManagerA() as the next function names in the hashed list and so on serially.
Finally, when the imports address list is built-in memory, we can see it at:
Other dlls and function names are invoked after LoadLibraryExA() and GetProcAddress() are repeatedly called over the hash list function names. Once loaded, the exports of each dll are parsed using the PE header offsets (MZ | e_Ifanew | PE header | optional header | data directory | exports).
Import the address table built after function call:
[Text Dump]

004027C0  00 53 77 DD 77 1B D1 DF 77 34 C5 DF 77 FE B9 80  .Sw.w...w4..w...
004027D0  7C 6C 94 80 7C 3B 29 82 7C A1 9F 80 7C 2F 08 81  |l..|;).|...|/..
004027E0  7C 30 25 80 7C ED 10 90 7C 51 28 81 7C 42 24 80  |0%.|...|Q(.|B$.
004027F0  7C FB 2C 82 7C 05 10 90 7C 59 35 81 7C 01 B0 85  |.,.|...|Y5.|...
00402800  7C 19 90 83 7C DO EVE 80 7C 24 1A 80 7C 9F 0F 81  |...|...|$..|...
00402810  7C 77 FB 80 7C 5C EEL 81 7C A 0D 81 7C 63 CO 81  |w..|\..|...|call
00402820  7C 73 73 82 7C 21 74 82 7C BE 18 80 7C 4D 11 86  |ss.|!t.|...|M..
00402830  7C 0D B0 80 7C 31 03 91 7C 77 1D 80 7C 28 AC 80  |...|1..|w..|(..
00402840  7C 40 60 C4 77 F0 75 C4 77 30 60 C4 77 70 6F C4  |@`.w.u.w0`.wpo.
00402850  77 A0 78 C4 77 31 F9 C3 77 30 77 C4 77 07 C4 C2  w.x.w1..w0w.w...
00402860  77 1B C2 C2 77 57 6F FA 77 6D 9E D8 77 0F A7 1E  w...wWo.wm..w...
00402870  59 A2 C2 E8 97 0F 8A 48 24 9E 4C D4 8E 29 12 C6  Y......H$.L..)..
00402880  56 ED DB EC F8 0B 93 2B A1 6B D0 2B CA AD D9 05  V......+.k.+....
00402890  CE 21 1E 6D 01 83 C4 5F C7 B0 49 2D DB 21 8E D1  .!.m..._..I-.!..
004028A0  E9 BA 10 9C A3 65 C0 D6 63 47 26 D3 83 97 AC E1  .....e..cG&.....
004028B0  A5 78 59 54 23 A5 17 00 7C 1F 79 0A E8 FB 97 FD  .xYT#...|.y.....
004028C0  0F 25 B0 FF C2 AC 08 DA 76 C1 79 E5 B8 83 2C F4  .%......v.y...,.
004028D0  3B 10 22 CB 00 16 65 FA 10 98 FE 8A 0E E6 17 8F  ;."...e.........
004028E0  7B 66 19 DA 75 8E 4E 0E EC AA FC 0D 7C 6E 59 0F  {f..u.N.....|nY.
004028F0  67 6B 6D 2E 5D 73 59 87 67 70 69 86 5D A8 5B 2F  gkm.]sY.gpi.].[/
00402900  67 1E 3C 73 D7 6A 59 6F 67 9A 2B 7E 5B E5 1C 28  g.<s.jYog.+~[..(
00402910  CF 70 49 07 08 F5 BE DA 89 03 00 00 00 61 64 76  .pI..........adv
00402920  61 70 69 33 32 2E 64 6C 6C 00 00 00 00 00 00 00  api32.dll.......
00402930  00 1D 00 00 00 6B 65 72 6E 65 6C 33 32 2E 64 6C  .....kernel32.dl
00402940  6C 00 00 00 00 00 00 00 00 09 00 00 00 6D 73 76  l............msv
00402950  63 72 74 2E 64 6C 6C 00 00 00 00 00 00 00 00 00  crt.dll.........
00402960  00 01 00 00 00 73 68 6C 77 61 70 69 2E 64 6C 6C  .....shlwapi.dll
00402970  00 00 00 00 00 00 00 00 00 01 00 00 00 75 73 65  .............use
00402980  72 33 32 2E 64 6C 6C 00 00 00 00 00 00 00        r32.dll.......
After the loading sequence of all dlls, you can list out all intermodular calls in the main executable, which turns out to be deceiving (with only kernel32.dll being referenced inside OllyDbg) as most of the payload function calls are made using the internal table identified before:
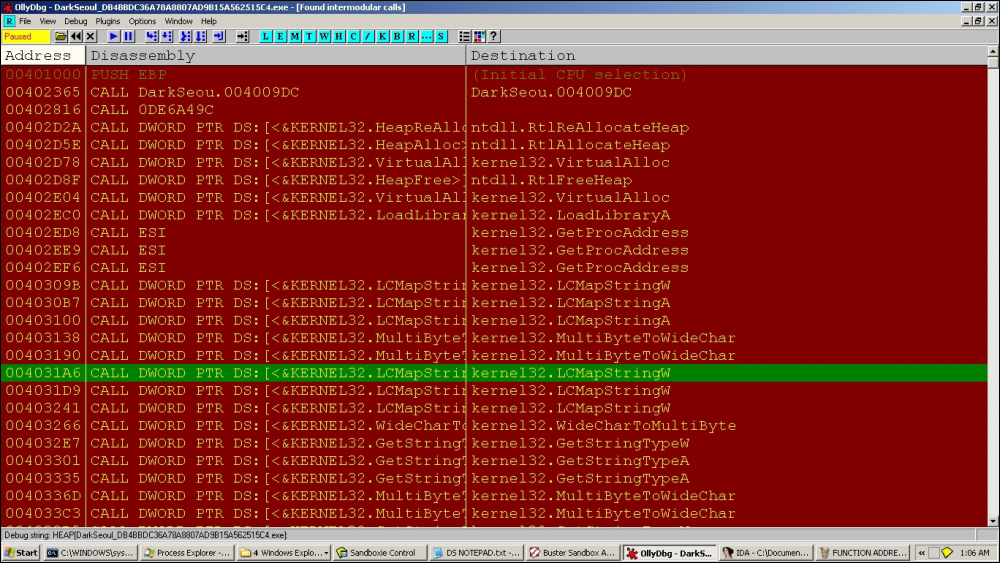
Next, we follow up with some artifacts of this malware as it begins to build and execute its main payloads.
; call to 0x4011AD

004011A4  |. FF9>CALL DWORD PTR DS:[EAX+254]


;which calls

004011B1 50  PUSH EAX
004011B2   . FF9>CALL DWORD PTR DS:[EAX+258]
004011B8   . 59  POP ECX


;Through call at 0x4011BC; task for the reader, what do you think it does?
004011D5  |. 6A >PUSH 4
004011D7  |. FF9>CALL DWORD PTR DS:[ESI+334]   ;kernel32.OpenFileMappingA
004011DD  |. 85C>TEST EAX,EAX
004011DF  |. 0F8>JNZ DarkSeou.00401299
004011E5  |. 57  PUSH EDI
This calls OpenFileMappingA with parameters:
0012FE50   004011DD  /CALL to OpenFileMappingA from DarkSeou.004011D7
0012FE54   00000004  |Access = FILE_MAP_READ
0012FE58   00000000  |InheritHandle = FALSE
0012FE5C   00402991  \MappingName = "JO840112-CRAS8468-11150923-PCI8273V"
We have already seen the string hardcoded in the binary.
Next:
004011EC  |. 6A >PUSH -1
004011EE  |. FF9>CALL DWORD PTR DS:[ESI+338]              ;
kernel32.CreateFileMappingA
004011F4  |. 68 >PUSH 103
With parameters:
0012FE44   004011F4  /CALL to CreateFileMappingA from DarkSeou.004011EE
0012FE48   FFFFFFFF  |hFile = FFFFFFFF
0012FE4C   00000000  |pSecurity = NULL
0012FE50   00000004  |Protection = PAGE_READWRITE
0012FE54   00000000  |MaximumSizeHigh = 0
0012FE58   00000010  |MaximumSizeLow = 10
0012FE5C   00402991  \MapName = "JO840112-CRAS8468-11150923-PCI8273V"
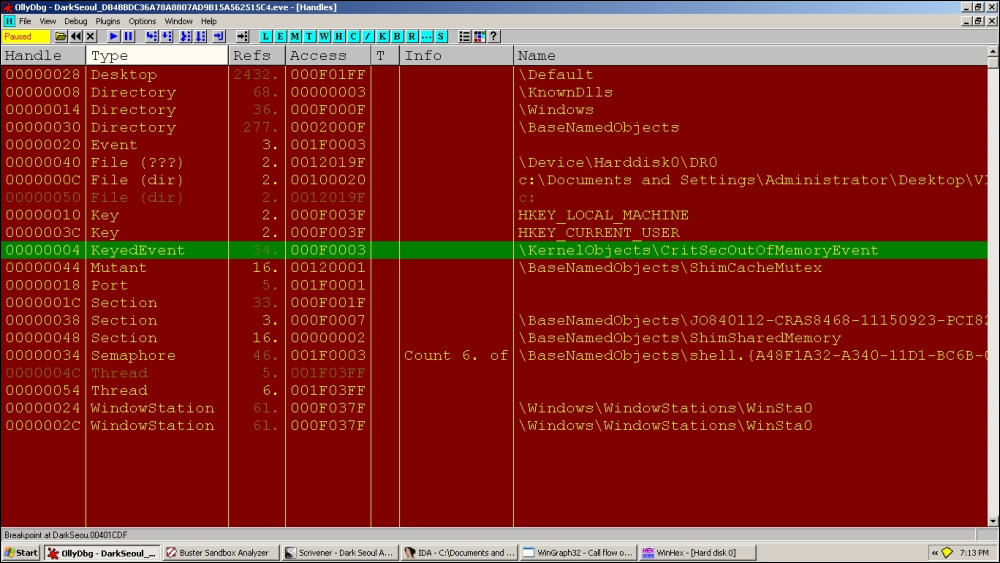
In OllyDbg Handles View, we see the new section object created:
Handles, item 10
 Handle=00000038
 Type=Section
 Refs=   3.
 Access=000F0007 WRITE_OWNER|WRITE_DAC|READ_CONTROL|DELETE|QUERY_STATE|MODIFY_STATE|4
 Name=\BaseNamedObjects\JO840112-CRAS8468-11150923-PCI8273V
Section objects are used to map a memory section as a file mapping object for data sharing a view of the file, especially between processes.
Consult MSDN as and when required to get an idea of what the API calls are built to do, and develop context around it as well as obtain the finer points that might point toward incriminating evidence. In the following exhibit, the excerpt you are looking at is the CreateFileMapping function definition at MSDN:
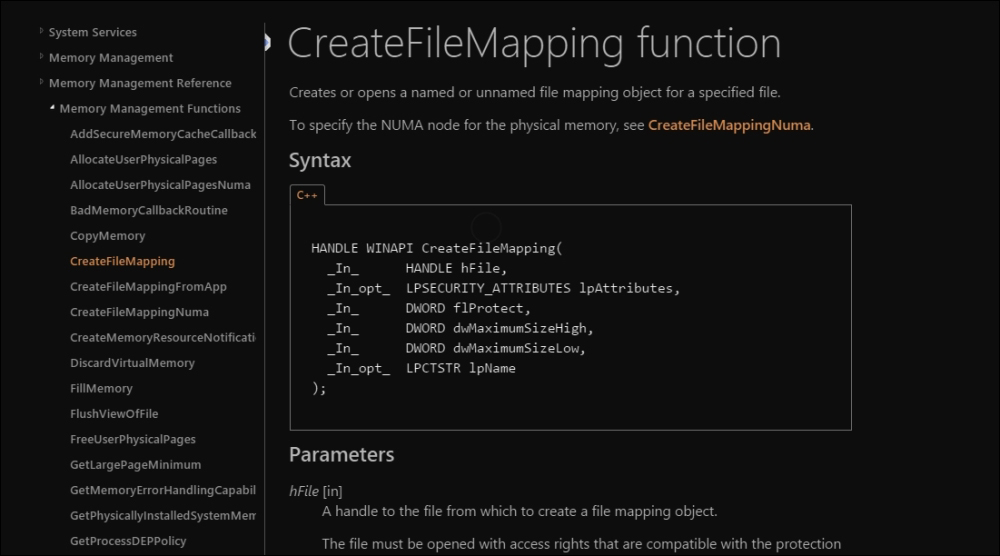
For this particular variant, the purposes are not revealed as post-preparation of this object and its utility is never accessed throughout the code. Hence, this could either be a marker of some sort of a template code for future variants.
;Call to msvcrt.strcatto build the path string

With parameters;

0012FE58   0012FE6C  ASCII"C:\WINDOWS"
0012FE5C   004029C7  ASCII"\Temp\~v3.log"


0040121C  |. 8D8>LEA EAX,DWORD PTR SS:[EBP-10C]
00401222  |. 50  PUSH EAX
00401223  |. FF9>CALL DWORD PTR DS:[ESI+3CC]   ;shlwapi.PathFileExistsA
This checks for the full path and proceed toward exiting if the log file is found.
If it is not found, the following function is called taking ESI=internal function pointer table base address+ offset into the table reach.
A service is a Windows program that runs without a user interface or interaction and is normally used for tasks that run in the background. They are controlled programmatically using Win32 APIs such as OpenScManager, CreateService, and StartService among others and are managed by the Service Control Manager component of the Windows OS. The user can interact with basic service controls using the net command.
The interesting sequence is a regularly seen pre-payload where popular antivirus product services are terminated using the Windows taskkill command. For the sake of analogy, some malware also call User32.EndTask to achieve a similar effect as it closes the target window forcibly:
004021B2   . 56  PUSH ESI                                 ;  DarkSeou.00402499
004021B3   . 8B7>MOV ESI,DWORD PTR SS:[ESP+8]
004021B7   . 57  PUSH EDI
004021B8   . 6A >PUSH 0
004021BA   . 8D8>LEA EAX,DWORD PTR DS:[ESI+5B3]
004021C0   . 8DB>LEA EDI,DWORD PTR DS:[ESI+394]
004021C6   . 50  PUSH EAX
004021C7   . FF1>CALL DWORD PTR DS:[EDI]
004021C9   . 6A >PUSH 0
004021CB   . 81C>ADD ESI,5CD
004021D1   .56  PUSH ESI
004021D2   . FF1>CALL DWORD PTR DS:[EDI]
004021D4   .5F  POP EDI
004021D5   .5E  POP ESI
004021D6   .C3  RETN
0x402499 is as usual taken as the base at ESI and from there the two familiar strings are referenced; this kind of consistency is maintained throughout and makes our work easier, but always be on the lookout for changes during execution.
Next:
004021B8   . 6A >PUSH 0
004021BA   . 8D8>LEA EAX,DWORD PTR DS:[ESI+5B3]
004021C0   . 8DB>LEA EDI,DWORD PTR DS:[ESI+394]
004021C6   . 50  PUSH EAX
Register view:
EAX 00402A4C ASCII "taskkill /F /IM pasvc.exe"
ECX 0012FE1C
EDX 7C90EB94 ntdll.KiFastSystemCallRet
EBX 00000000
ESP 0012FE48
EBP 0012FF78
ESI 00402499 DarkSeou.00402499
EDI 0040282D DarkSeou.0040282D
Next:
004021C6   . 50  PUSH EAX
004021C7   . FF1>CALL DWORD PTR DS:[EDI]                  ;
kernel32.WinExec
004021C9   . 6A >PUSH 0
The WinExec() function is called to execute this command.
Next:
004021D1   .56  PUSH ESI                                 ;
DarkSeou.00402A66
004021D2   . FF1>CALL DWORD PTR DS:[EDI]
004021D4   .5F  POP EDI

ESI=00402A66 (DarkSeou.00402A66), ASCII "taskkill /F /IM clisvc.exe"
These are service names of AhnLab and Hauri antivirus services that are effectively shut down (/F forces the process to end, /IM passes the target image name) using the preceding commands, which is a self-defense measure so that the malware can continue running uninhibited.
Next we reach the CreateThread API call. In the following sequences, read the stack views, register values, and the parameters that are passed, confirm the API function signatures and expected values from MSDN, and form your theory of what it is doing at this point. What are the particular handle values referring to?
Stack view:
0012FE44   0040127A  /CALL to CreateThread from DarkSeou.00401274
0012FE48   00000000  |pSecurity = NULL
0012FE4C   00000000  |StackSize = 0
0012FE50   00401AB9  |ThreadFunction = DarkSeou.00401AB9
0012FE54   00402499  |pThreadParm = DarkSeou.00402499
0012FE58   00000000  |CreationFlags = 0
0012FE5C   0012FF80  \pThreadId = 0012FF80
0012FE60   6A4ABC5B
0012FE64   FFFFFFFF
Next, in the new thread (there are a total of 2 threads in the running process):
00401AC8   . 56  PUSH ESI
00401AC9   . FF9>CALL DWORD PTR DS:[ESI+288]              ;
DarkSeou.00401D72
;
The preceding call address is responsible for drive traversal and infection.
Physical drive number Processing:
00401D72  /. 55  PUSH EBP
00401D73  |. 8BE>MOV EBP,ESP
00401D75  |. 81E>SUB ESP,108
00401D7B  |. 53  PUSH EBX
00401D7C  |. 56  PUSH ESI
00401D7D  |. 8B7>MOV ESI,DWORD PTR SS:[EBP+8]
00401D80  |. 57  PUSH EDI
00401D81  |. 33F>XOR EDI,EDI
00401D83  |. 897>MOV DWORD PTR SS:[EBP-4],EDI
00401D86  |. 8D9>LEA EBX,DWORD PTR DS:[ESI+577]
00401D8C  |> 56  /PUSH ESI
00401D8D  |. FF9>|CALL DWORD PTR DS:[ESI+28C]
00401D93  |. C70>|MOV DWORD PTR SS:[ESP],104
At this address:
00401D86  |. 8D9>LEA EBX,DWORD PTR DS:[ESI+577]
00401D8C  |> 56  /PUSH ESI

Resulting Address=00402A10, (ASCII "\\.\PhysicalDrive%d")
The preceding string is pushed as a parameter to:
00401D8D  |. FF9>|CALL DWORD PTR DS:[ESI+28C]             ;  DarkSeou.00401E0A
00401D93  |. C70>|MOV DWORD PTR SS:[ESP],104
Next, calls to memset():
009EFCD4   00401E32  /CALL to memset from DarkSeou.00401E2C
009EFCD8   00402609  |s = DarkSeou.00402609
009EFCDC   00000000  |c = 00
009EFCE0   00000010  \n = 10 (16.)
009EFCE4   00000000
Yet another:
009EFCC8   00401E3C  /CALL to memset from DarkSeou.00401E36
009EFCCC   00402649  |s = DarkSeou.00402649
009EFCD0   00000000  |c = 00
009EFCD4   00000010  \n = 10 (16.)
009EFCD8   00402609  DarkSeou.00402609
Next:
00401DB9  |. 83C>|ADD ESP,18
00401DBC  |. 57  |PUSH EDI
00401DBD  |. 57  |PUSH EDI
00401DBE  |. 6A >|PUSH 3
00401DC0  |. 57  |PUSH EDI
00401DC1  |. 6A >|PUSH 3
00401DC3  |. 68 >|PUSH C0000000
00401DC8  |. 8D8>|LEA EAX,DWORD PTR SS:[EBP-108]
00401DCE  |. 50  |PUSH EAX
00401DCF  |. FF9>|CALL DWORD PTR DS:[ESI+370]          ;kernel32.CreateFileA
00401DD5  |. 894>|MOV DWORD PTR DS:[ESI+40],EAX
With parameters:
009EFCDC   00401DD5  /CALL to CreateFileA from DarkSeou.00401DCF
009EFCE0   009EFD08  |FileName = "\\.\PhysicalDrive0"
009EFCE4   C0000000  |Access = GENERIC_READ|GENERIC_WRITE
009EFCE8   00000003  |ShareMode = FILE_SHARE_READ|FILE_SHARE_WRITE
009EFCEC   00000000  |pSecurity = NULL
009EFCF0   00000003  |Mode = OPEN_EXISTING
009EFCF4   00000000  |Attributes = 0
009EFCF8   00000000  \hTemplateFile = NULL
009EFCFC   00140000
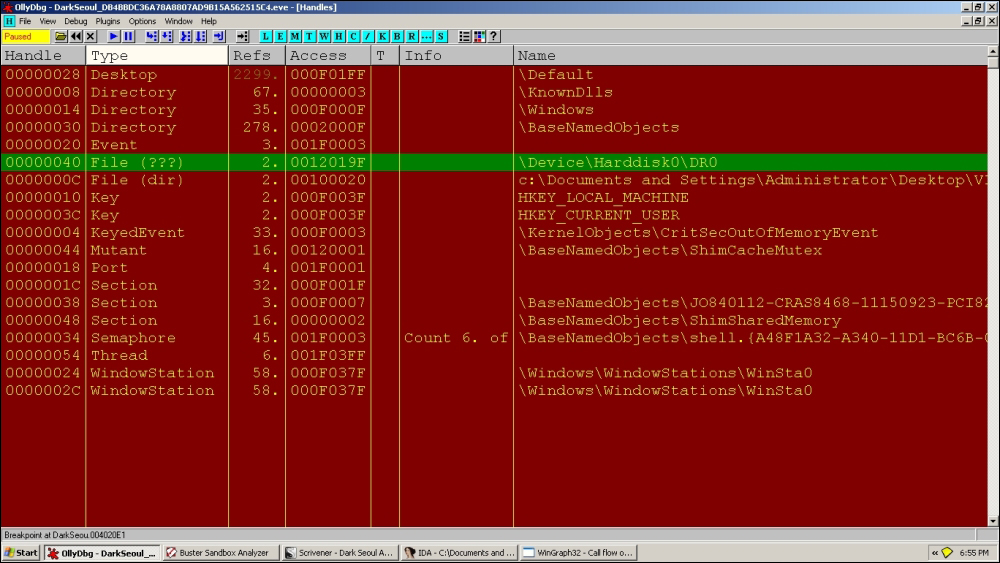
With the following in the handles table:
Handles, item 5
 Handle=00000040
 Type=File (???)
 Refs=   2.
 Access=0012019F SYNCHRONIZE|READ_CONTROL|READ_DATA|WRITE_DATA|APPEND_DATA|READ_EA|WRITE_EA|READ_ATTRIBUTES|WRITE_ATTRIBUTES
 Name=\Device\Harddisk0\DR0
00401DD5  |. 894>|MOV DWORD PTR DS:[ESI+40],EAX
00401DD8  |. 83F>|CMP EAX,-1
00401DDB  |. 74 >|JE SHORT DarkSeou.00401DF9
00401DDD  |. 56  |PUSH ESI
00401DDE  |. FF9>|CALL DWORD PTR DS:[ESI+290]             ;  DarkSeou.00401E4A
Checks for valid handle to file object (drive) and calls 401E4A:
Next:
00401EDF  |. FF77 >PUSH DWORD PTR DS:[EDI+40]
00401EE2  |. FF97 >CALL DWORD PTR DS:[EDI+380]       ;kernel32.SetFilePointer
With parameters:
009EFAB0   00401EE8  /CALL to SetFilePointer from DarkSeou.00401EE2
009EFAB4   00000040  |hFile = 00000040 (window)
009EFAB8   00000000  |OffsetLo = 0
009EFABC   009EFADC  |pOffsetHi = 009EFADC
009EFAC0   00000000  \Origin = FILE_BEGIN
MBR reading code:
00401EF2  |. 8D45 >LEA EAX,DWORD PTR SS:[EBP-4]
00401EF5  |. 50    PUSH EAX
00401EF6  |. 68 00>PUSH 200
00401EFB  |. FF75 >PUSH DWORD PTR SS:[EBP+10]
00401EFE  |. FF77 >PUSH DWORD PTR DS:[EDI+40]
00401F01  |. FF97 >CALL DWORD PTR DS:[EDI+390]              ;
kernel32.ReadFile

009EFAAC   00401F07  /CALL to ReadFile from DarkSeou.00401F01
009EFAB0   00000040  |hFile = 00000040 (window)
009EFAB4   009EFAF0  |Buffer = 009EFAF0
009EFAB8   00000200  |BytesToRead = 200 (512.)
009EFABC   009EFACC  |pBytesRead = 009EFACC
009EFAC0   00000000  \pOverlapped = NULL
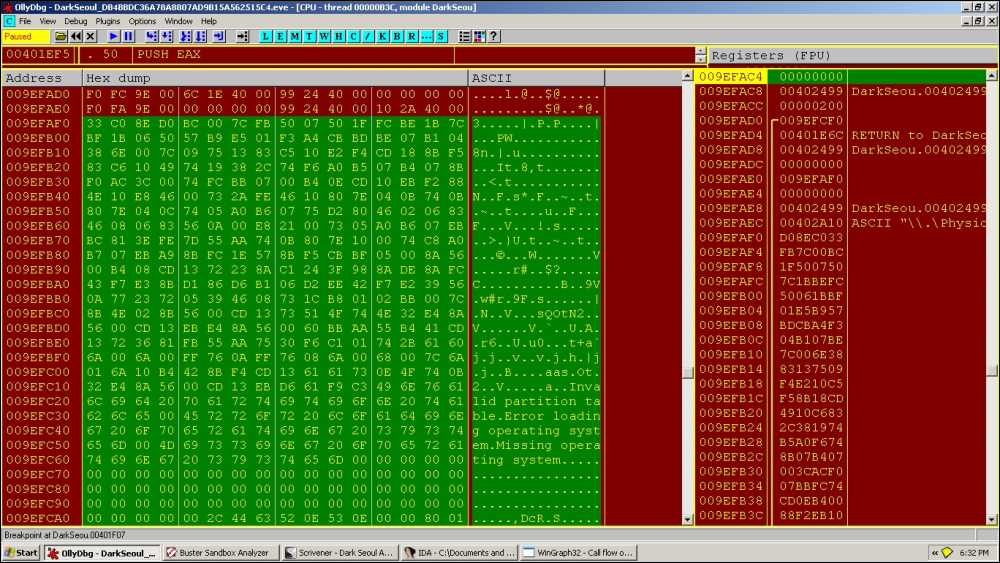
The MBR is read from the disk. Exactly 512 bytes are read and the return value is 1 from ReadFile().
The end marker of 0x55AA for MBRs is not shown in the exhibit as it is right after the displayed dump.
Next:
00401E5F  |. 50    PUSH EAX
00401E60  |. 33DB  XOR EBX,EBX
00401E62  |. 53    PUSH EBX
00401E63  |. 56    PUSH ESI
00401E64  |. 891E  MOV DWORD PTR DS:[ESI],EBX
00401E66  |. FF96 >CALL DWORD PTR DS:[ESI+294]
00401E6C  |. 83C4 >ADD ESP,0C
009EFAD4   00401EA8  /CALL to memcpy from DarkSeou.00401EA2
009EFAD8   00402609  |dest = DarkSeou.00402609
009EFADC   009EFCAE  |src = 009EFCAE
009EFAE0   00000010  \n = 10 (16.)
16 bytes are copied.
00402609 80 01 01 00 07 FE F8 FF 38 00 00 00 80 BD 7F 0A ........8.......
The preceding hex bytes could be a marker, though you are encouraged to analyze this part on your own.
Next:
00401DE9  |. 56    |PUSH ESI
00401DEA  |. FF96 >|CALL DWORD PTR DS:[ESI+29C]             ;
DarkSeou.00401FB4
Next:
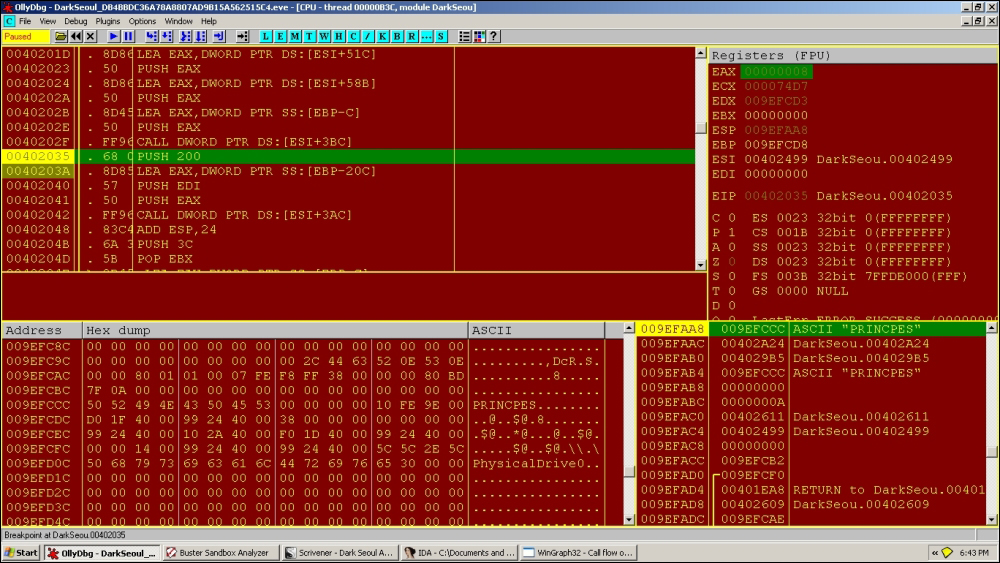
0040202E  |. 50    PUSH EAX
0040202F  |. FF96 >CALL DWORD PTR DS:[ESI+3BC]
00402035  |. 68 00>PUSH 200
0040203A  |. 8D85 >LEA EAX,DWORD PTR SS:[EBP-20C]
Parameters:
009EFAA4   00402035  /CALL to sprintf from DarkSeou.0040202F
009EFAA8   009EFCCC  |s = 009EFCCC
009EFAAC   00402A24  |format = "%s"
009EFAB0   004029B5  \<%s> = "PRINCPES"
First instance of PRINCPES is written at:
Next, a call to memset with stack parameters:
009EFA98   00402048  /CALL to memset from DarkSeou.00402042
009EFA9C   009EFACC  |s = 009EFACC
009EFAA0   00000000  |c = 00
009EFAA4   00000200  \n = 200 (512.)
0x200 or 512 in decimal is a significant number for our analysis as the MBR size is 512 bytes for Windows XP. On execution, in recent OS versions, the MBR size varies to 1023, which is upto the reader to further research and document.
Moving to:
0040204E  |> 8D45 >/LEA EAX,DWORD PTR SS:[EBP-C]
00402051  |. 50    |PUSH EAX
00402052  |. FF96 >|CALL DWORD PTR DS:[ESI+3B8]
00402058  |. 50    |PUSH EAX
00402059  |. 8D45 >|LEA EAX,DWORD PTR SS:[EBP-C]
0040205C  |. 50    |PUSH EAX
0040205D  |. 8D843>|LEA EAX,DWORD PTR SS:[EBP+EDI-20C]
00402064  |. 50    |PUSH EAX
00402065  |. FF96 >|CALL DWORD PTR DS:[ESI+3B4]             ;
msvcrt.memcpy
0040206B  |. 8D45 >|LEA EAX,DWORD PTR SS:[EBP-C]
The following code copies the string:
0040204E  |> 8D45 >/LEA EAX,DWORD PTR SS:[EBP-C]
00402051  |. 50    |PUSH EAX
00402052  |. FF96 >|CALL DWORD PTR DS:[ESI+3B8]
00402058  |. 50    |PUSH EAX
00402059  |. 8D45 >|LEA EAX,DWORD PTR SS:[EBP-C]
0040205C  |. 50    |PUSH EAX
0040205D  |. 8D843>|LEA EAX,DWORD PTR SS:[EBP+EDI-20C]
00402064  |. 50    |PUSH EAX
00402065  |. FF96 >|CALL DWORD PTR DS:[ESI+3B4]
0040206B  |. 8D45 >|LEA EAX,DWORD PTR SS:[EBP-C]
0040206E  |. 50    |PUSH EAX
0040206F  |. FF96 >|CALL DWORD PTR DS:[ESI+3B8]
00402075  |. 83C4 >|ADD ESP,14
00402078  |. 03F8  |ADD EDI,EAX
0040207A  |. 4B    |DEC EBX
0040207B  |.^75 D1 \JNZ SHORT DarkSeou.0040204E
As:
009EFACC   50 52 49 4E 43 50 45 53 50 52 49 4E 43 50 45 53  PRINCPESPRINCPES
009EFADC   50 52 49 4E 43 50 45 53 50 52 49 4E 43 50 45 53  PRINCPESPRINCPES
009EFAEC   50 52 49 4E 43 50 45 53 50 52 49 4E 43 50 45 53  PRINCPESPRINCPES
009EFAFC   50 52 49 4E 43 50 45 53 50 52 49 4E 43 50 45 53  PRINCPESPRINCPES
009EFB0C   50 52 49 4E 43 50 45 53 50 52 49 4E 43 50 45 53  PRINCPESPRINCPES
009EFB1C   50 52 49 4E 43 50 45 53 50 52 49 4E 43 50 45 53  PRINCPESPRINCPES
009EFB2C   50 52 49 4E 43 50 45 53 50 52 49 4E 43 50 45 53  PRINCPESPRINCPES
009EFB3C   50 52 49 4E 43 50 45 53 50 52 49 4E 43 50 45 53  PRINCPESPRINCPES
009EFB4C   50 52 49 4E 43 50 45 53 50 52 49 4E 43 50 45 53  PRINCPESPRINCPES
009EFB5C   50 52 49 4E 43 50 45 53 50 52 49 4E 43 50 45 53  PRINCPESPRINCPES
009EFB6C   50 52 49 4E 43 50 45 53 50 52 49 4E 43 50 45 53  PRINCPESPRINCPES
009EFB7C   50 52 49 4E 43 50 45 53 50 52 49 4E 43 50 45 53  PRINCPESPRINCPES
009EFB8C   50 52 49 4E 43 50 45 53 50 52 49 4E 43 50 45 53  PRINCPESPRINCPES
009EFB9C   50 52 49 4E 43 50 45 53 50 52 49 4E 43 50 45 53  PRINCPESPRINCPES
009EFBAC   50 52 49 4E 43 50 45 53 50 52 49 4E 43 50 45 53  PRINCPESPRINCPES
009EFBBC   50 52 49 4E 43 50 45 53 50 52 49 4E 43 50 45 53  PRINCPESPRINCPES
009EFBCC   50 52 49 4E 43 50 45 53 50 52 49 4E 43 50 45 53  PRINCPESPRINCPES
009EFBDC   50 52 49 4E 43 50 45 53 50 52 49 4E 43 50 45 53  PRINCPESPRINCPES
009EFBEC   50 52 49 4E 43 50 45 53 50 52 49 4E 43 50 45 53  PRINCPESPRINCPES
009EFBFC   50 52 49 4E 43 50 45 53 50 52 49 4E 43 50 45 53  PRINCPESPRINCPES
009EFC0C   50 52 49 4E 43 50 45 53 50 52 49 4E 43 50 45 53  PRINCPESPRINCPES
009EFC1C   50 52 49 4E 43 50 45 53 50 52 49 4E 43 50 45 53  PRINCPESPRINCPES
009EFC2C   50 52 49 4E 43 50 45 53 50 52 49 4E 43 50 45 53  PRINCPESPRINCPES
009EFC3C   50 52 49 4E 43 50 45 53 50 52 49 4E 43 50 45 53  PRINCPESPRINCPES
009EFC4C   50 52 49 4E 43 50 45 53 50 52 49 4E 43 50 45 53  PRINCPESPRINCPES
009EFC5C   50 52 49 4E 43 50 45 53 50 52 49 4E 43 50 45 53  PRINCPESPRINCPES
009EFC6C   50 52 49 4E 43 50 45 53 50 52 49 4E 43 50 45 53  PRINCPESPRINCPES
009EFC7C   50 52 49 4E 43 50 45 53 50 52 49 4E 43 50 45 53  PRINCPESPRINCPES
009EFC8C   50 52 49 4E 43 50 45 53 50 52 49 4E 43 50 45 53  PRINCPESPRINCPES
009EFC9C   50 52 49 4E 43 50 45 53 50 52 49 4E 43 50 45 53  PRINCPESPRINCPES
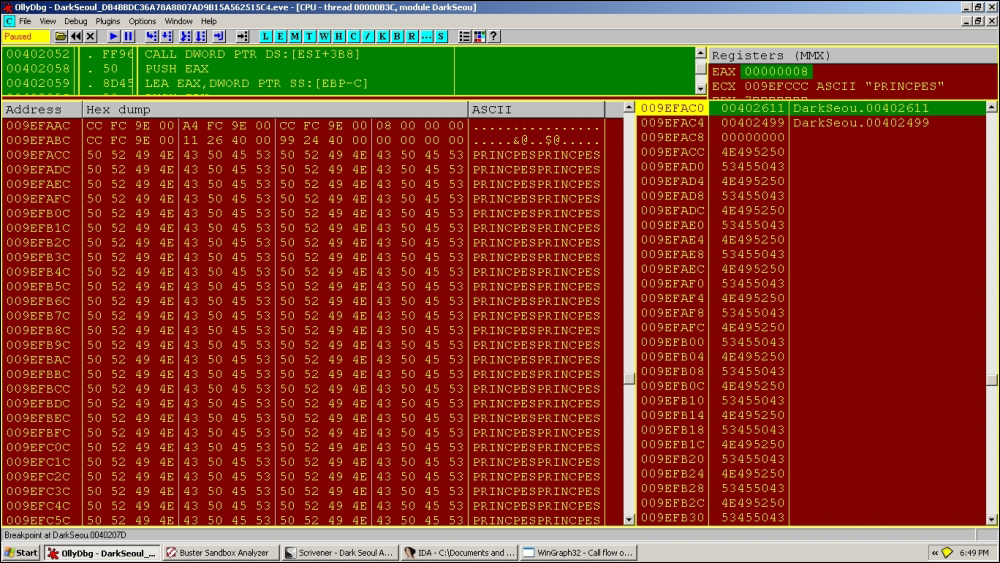
Thus, at this point, we see how the new MBR is being built before being dumped in the real OS MBR in the coming call sequences.
Next:
00402083  |. 50    PUSH EAX
00402084  |. FF75 >PUSH DWORD PTR SS:[EBP+C]
00402087  |. 56    PUSH ESI
00402088  |. FF96 >CALL DWORD PTR DS:[ESI+2A4];
DarkSeou.00402096
Through:
004020B4  |. 50    PUSH EAX
004020B5  |. C1E6 >SHL ESI,9
004020B8  |. 56    PUSH ESI
004020B9  |. FF77 >PUSH DWORD PTR DS:[EDI+40]
004020BC  |. FF97 >CALL DWORD PTR DS:[EDI+380];
kernel32.SetFilePointer
009EFA8C   004020C2  /CALL to SetFilePointer from DarkSeou.004020BC
009EFA90   00000040  |hFile = 00000040 (window)
009EFA94   00007000  |OffsetLo = 7000 (28672.)
009EFA98   009EFAB8  |pOffsetHi = 009EFAB8
009EFA9C   00000000  \Origin = FILE_BEGIN
Note that, EAX=7000 at this point. This is significant as this is the offset of the logical volume boot record for the C:\ drive in the VM XP installation in our setup.
Payload code region:
004020CA  |> 6A 00 PUSH 0
004020CC  |. 8D45 >LEA EAX,DWORD PTR SS:[EBP-4]
004020CF  |. 50    PUSH EAX
004020D0  |. 68 00>PUSH 200
004020D5  |. FF75 >PUSH DWORD PTR SS:[EBP+10]
004020D8  |. FF77 >PUSH DWORD PTR DS:[EDI+40]
004020DB  |. FF97 >CALL DWORD PTR DS:[EDI+374];
kernel32.WriteFile
With parameters:
009EFA88   004020E1  /CALL to WriteFile from DarkSeou.004020DB
009EFA8C   00000040  |hFile = 00000040 (window)
009EFA90   009EFACC  |Buffer = 009EFACC
009EFA94   00000200  |nBytesToWrite = 200 (512.)
009EFA98   009EFAA8  |pBytesWritten = 009EFAA8
009EFA9C   00000000  \pOverlapped = NULL
Note that other techniques for MBR overwriting exist, for instance successive multiple calls to DeviceIoControlFile can perform the same write operation to a disk entity.
Memory dump view (right-click on the stack 'Buffer' argument value and choose Follow in dump to get the memory view displaying from that address. Very useful in quick and dirty discovery and potential memory carving (binary copy and paste) of executables and interesting binary patterns as well as strings in memory):
009EFACC   50 52 49 4E 43 50 45 53 50 52 49 4E 43 50 45 53  PRINCPESPRINCPES
009EFADC   50 52 49 4E 43 50 45 53 50 52 49 4E 43 50 45 53  PRINCPESPRINCPES
009EFAEC   50 52 49 4E 43 50 45 53 50 52 49 4E 43 50 45 53  PRINCPESPRINCPES
009EFAFC   50 52 49 4E 43 50 45 53 50 52 49 4E 43 50 45 53  PRINCPESPRINCPES
009EFB0C   50 52 49 4E 43 50 45 53 50 52 49 4E 43 50 45 53  PRINCPESPRINCPES
009EFB1C   50 52 49 4E 43 50 45 53 50 52 49 4E 43 50 45 53  PRINCPESPRINCPES
009EFB2C   50 52 49 4E 43 50 45 53 50 52 49 4E 43 50 45 53  PRINCPESPRINCPES
009EFB3C   50 52 49 4E 43 50 45 53 50 52 49 4E 43 50 45 53  PRINCPESPRINCPES
…
Handle table as following exhibit at the current stage in execution; always keep checking your current status:
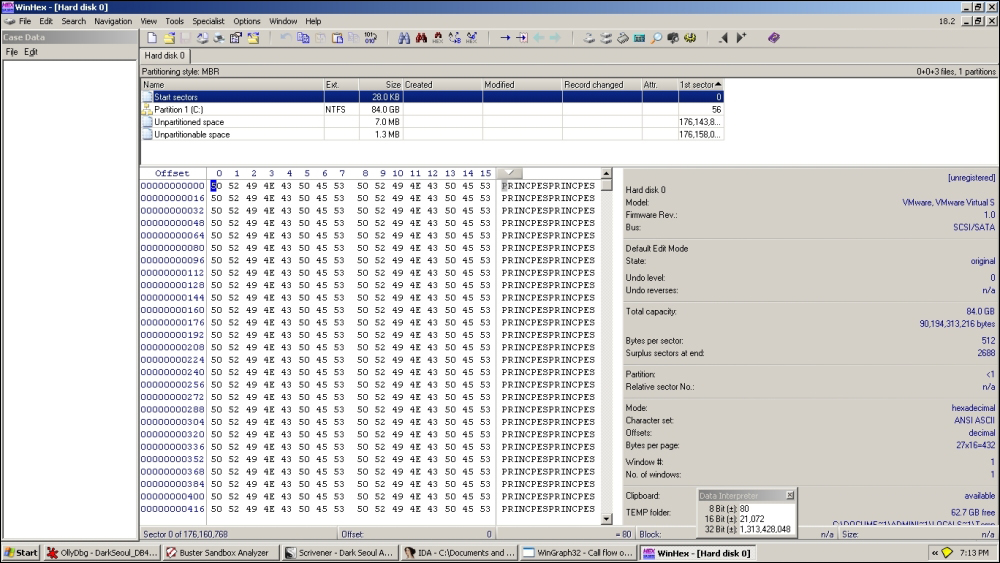
You can use WinHex to verify the partition record overwrites.
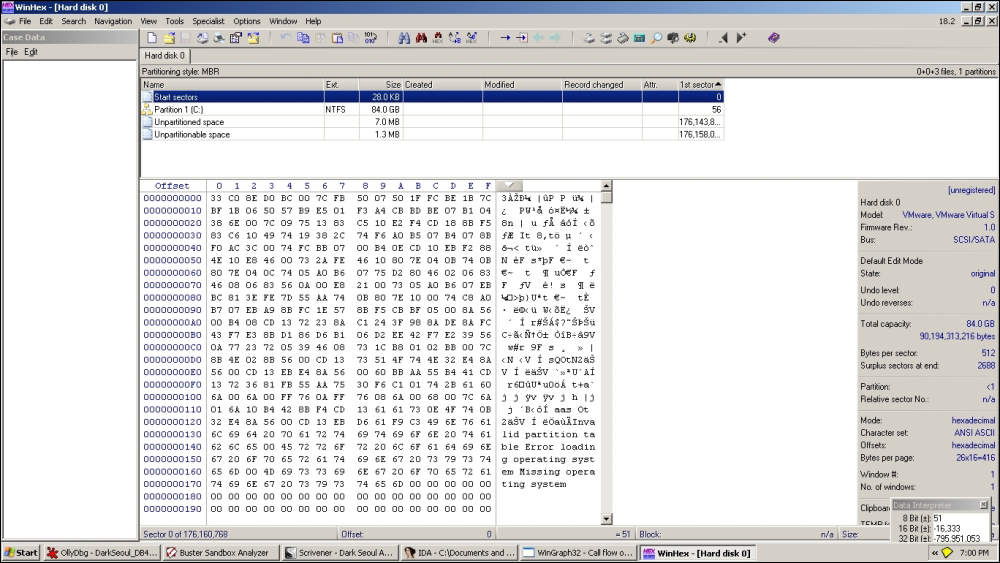
Start sectors are not yet infected in the preceding exhibit.

C:\ VBR (Volume Boot Record) is overwritten.
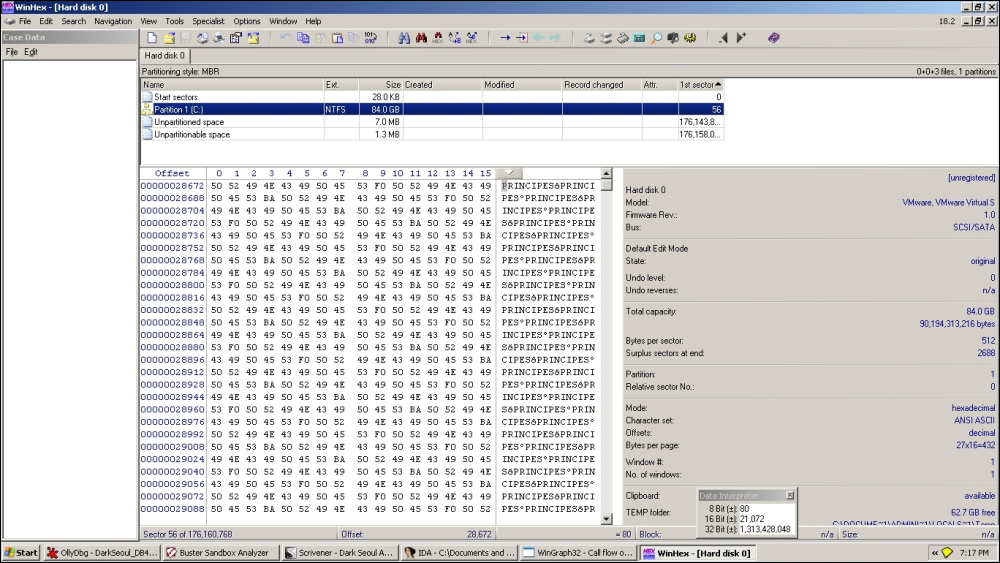
In the next infection cycle, start sectors are also infected, as shown in the following screenshot:
Thereafter, it enumerates drives and reaches:
00401CC2  |> C740 >/MOV DWORD PTR DS:[EAX-1],4E495250
00401CC9  |. C740 >|MOV DWORD PTR DS:[EAX+3],45504943
00401CD0  |. C640 >|MOV BYTE PTR DS:[EAX+7],53
00401CD4  |. 83C0 >|ADD EAX,0A
00401CD7  |. 8D140>|LEA EDX,DWORD PTR DS:[ECX+EAX]
00401CDA  |. 3B55 >|CMP EDX,DWORD PTR SS:[EBP+8]
00401CDD  |.^72 E3 \JB SHORT DarkSeou.00401CC2
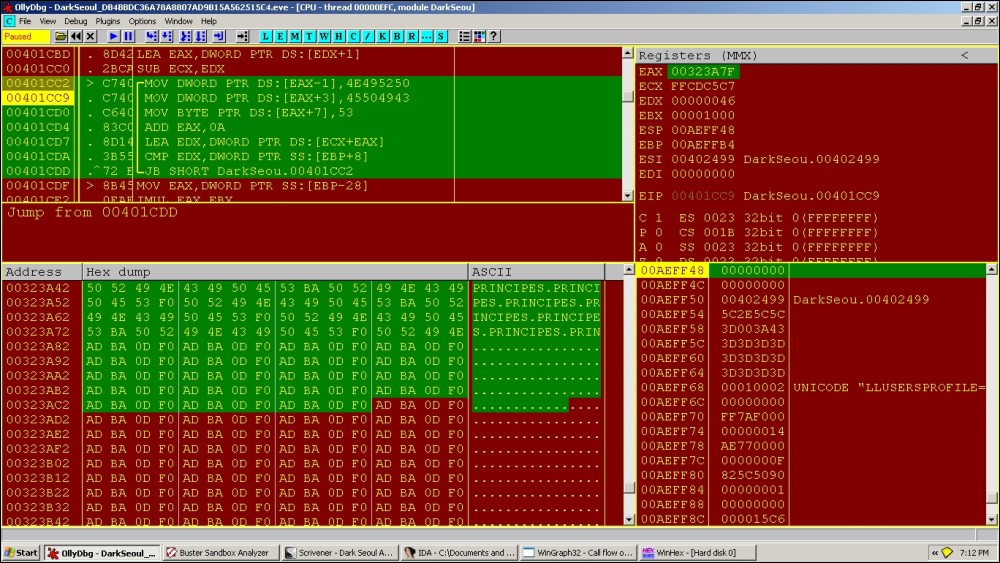
Notice in the preceding exhibit how the string values are hex-coded in the binary instructions as immediate constants and loaded in EAX address offsets; they are derived from the ASCII codes in hex from the string PRINCIPES.PRINCIPES as 0x4E495250 and 0x45504943.
New handles are visible at this point:
Repeating the analysis process as we have seen until now, a new sequence is being developed:
00323A22   AB ABABABABAB 00 00 00 00 00 00 00 00 43 00  ..............C.
00323A32   03 01 6B 07 18 00 50 52 49 4E 43 49 50 45 53 F0  ..k...PRINCIPES.
00323A42   50 52 49 4E 43 49 50 45 53 BA 50 52 49 4E 43 49  PRINCIPES.PRINCI
00323A52   50 45 53 F0 50 52 49 4E 43 49 50 45 53 BA 50 52  PES.PRINCIPES.PR
00323A62   49 4E 43 49 50 45 53 F0 50 52 49 4E 43 49 50 45  INCIPES.PRINCIPE
00323A72   53 BA 50 52 49 4E 43 49 50 45 53 F0 50 52 49 4E  S.PRINCIPES.PRIN
00323A82   43 49 50 45 53 BA 50 52 49 4E 43 49 50 45 53 F0  CIPES.PRINCIPES.
00323A92   50 52 49 4E 43 49 50 45 53 BA 50 52 49 4E 43 49  PRINCIPES.PRINCI
00323AA2   50 45 53 F0 50 52 49 4E 43 49 50 45 53 BA 50 52  PES.PRINCIPES.PR
00323AB2   49 4E 43 49 50 45 53 F0 50 52 49 4E 43 49 50 45  INCIPES.PRINCIPE
00323AC2   53 BA 50 52 49 4E 43 49 50 45 53 F0 50 52 49 4E  S.PRINCIPES.PRIN
00323AD2   43 49 50 45 53 BA 50 52 49 4E 43 49 50 45 53 F0  CIPES.PRINCIPES.
00323AE2   50 52 49 4E 43 49 50 45 53 BA 50 52 49 4E 43 49  PRINCIPES.PRINCI
00323AF2   50 45 53 F0 50 52 49 4E 43 49 50 45 53 BA 50 52  PES.PRINCIPES.PR
00323B02   49 4E 43 49 50 45 53 F0 50 52 49 4E 43 49 50 45  INCIPES.PRINCIPE
00323B12   53 BA 50 52 49 4E 43 49 50 45 53 F0 50 52 49 4E  S.PRINCIPES.PRIN
00323B22   43 49 50 45 53 BA 50 52 49 4E 43 49 50 45 53 F0  CIPES.PRINCIPES.
00323B32   50 52 49 4E 43 49 50 45 53 BA 50 52 49 4E 43 49  PRINCIPES.PRINCI
00323B42   50 45 53 F0 50 52 49 4E 43 49 50 45 53 BA 50 52  PES.PRINCIPES.PR
00323B52   49 4E 43 49 50 45 53 F0 50 52 49 4E 43 49 50 45  INCIPES.PRINCIPE
00323B62   53 BA 50 52 49 4E 43 49 50 45 53 F0 50 52 49 4E  S.PRINCIPES.PRIN
00323B72   43 49 50 45 53 BA 50 52 49 4E 43 49 50 45 53 F0  CIPES.PRINCIPES.
00323B82   50 52 49 4E 43 49 50 45 53 BA 50 52 49 4E 43 49  PRINCIPES.PRINCI
00323B92   50 45 53 F0 50 52 49 4E 43 49 50 45 53 BA 50 52  PES.PRINCIPES.PR
00323BA2   49 4E 43 49 50 45 53 F0 50 52 49 4E 43 49 50 45  INCIPES.PRINCIPE
00323BB2   53 BA 50 52 49 4E 43 49 50 45 53 F0 50 52 49 4E  S.PRINCIPES.PRIN
00323BC2   43 49 50 45 53 BA 50 52 49 4E 43 49 50 45 53 F0  CIPES.PRINCIPES.
00323BD2   50 52 49 4E 43 49 50 45 53 BA 50 52 49 4E 43 49  PRINCIPES.PRINCI
00323BE2   50 45 53 F0 50 52 49 4E 43 49 50 45 53 BA 50 52  PES.PRINCIPES.PR
00323BF2   49 4E 43 49 50 45 53 F0 50 52 49 4E 43 49 50 45  INCIPES.PRINCIPE
00323C02   53 BA 50 52 49 4E 43 49 50 45 53 F0 50 52 49 4E  S.PRINCIPES.PRIN
00323C12   43 49 50 45 53 BA 50 52 49 4E 43 49 50 45 53 F0  CIPES.PRINCIPES.
00323C22   50 52 49 4E 43 49 50 45 53 BA 50 52 49 4E 43 49  PRINCIPES.PRINCI
00323C32   50 45 53 F0 50 52 49 4E 43 49 50 45 53 AB 00 00  PES.PRINCIPES...
00323C42   00 00 00 00 00 00 77 00 43 00 EE 14 EE 00 30 05  ......w.C.....0.
There is an extra I in the words now.
The infection on handle 50h, which is drive C:\, means that the VBR overwrite changes to:
The writefile() call happens at:
00401D1D  |> 57    |/PUSH EDI
00401D1E  |. 8D45 >||LEA EAX,DWORD PTR SS:[EBP-30]
00401D21  |. 50    ||PUSH EAX
00401D22  |. FF75 >||PUSH DWORD PTR SS:[EBP+8]
00401D25  |. 897D >||MOV DWORD PTR SS:[EBP-30],EDI
00401D28  |. FF75 >||PUSH DWORD PTR SS:[EBP-10]
00401D2B  |. FF75 >||PUSH DWORD PTR SS:[EBP-14]
00401D2E  |. FF96 >||CALL DWORD PTR DS:[ESI+374]   ; writefile
00401D34  |. FF4D >||DEC DWORD PTR SS:[EBP-24]
00401D37  |.^75 E4 |\JNZ SHORT DarkSeou.00401D1D
It keeps on repeating the infection for a set number of cycles depending on the number of available drives (it enumerates all available drives of the first 10 physical drives, as seen previously, and logical drives B:\ to Z:\) and success of infection procedures.