Table of Contents for
Defensive Security Handbook, 1st Edition
 Defensive Security Handbook, 1st Edition
Published by
O'Reilly Media, Inc., 2017
Defensive Security Handbook, 1st Edition
Published by
O'Reilly Media, Inc., 2017
- nav
- Cover
- Defensive Security Handbook
- Defensive Security Handbook
- Foreword
- Introduction
- 1. Creating a Security Program
- 2. Asset Management and Documentation
- 3. Policies
- 4. Standards and Procedures
- 5. User Education
- 6. Incident Response
- 7. Disaster Recovery
- 8. Industry Compliance Standards and Frameworks
- 9. Physical Security
- 10. Microsoft Windows Infrastructure
- 11. Unix Application Servers
- 12. Endpoints
- 13. Password Management and Multifactor Authentication
- 14. Network Infrastructure
- 15. Segmentation
- 16. Vulnerability Management
- 17. Development
- 18. Purple Teaming
- 19. IDS and IPS
- 20. Logging and Monitoring
- 21. The Extra Mile
- A. User Education Templates
- Index
- About the Authors
- Colophon
Chapter 20. Logging and Monitoring
Most operating systems and applications produce some kind of log. Many people consider logs to be a historical record that can be used to retrospectively debug issues such as why an email wasn’t delivered, why a web server isn’t running, or how long a server had been complaining about a failing disk before it exploded and somebody actually looked at the logs. Logs can, however, be used much more proactively from a security perspective, and they can be used to provide not only retrospective insights, but much more proactive views into the environment.
The same can be said of other types of monitoring, too. Companies generally have a better handle on monitoring than logging. Telemetry data such as disk, memory, CPU, and network interface usage can be used for capacity planning and to provide pre-emptive information regarding potential issues. This sort of data can be used to provide additional insight into potential events that are happening within the environment.
In this chapter, you will learn what to log, where to log it, and what to do with those logs to gain the best advantage you can from the information that you already have.
What to Log
What to log can be a contentious issue. There are often perceived to be two schools of thought on this:
- Everything
-
This generally stems from the point of view that what is required is not known until it is needed, thus storing everything and searching and filtering later is adopted. This does indeed provide access to all the possible data that may be required, but also provides more of a challenge when it comes to storage, indexing, and in some cases transmitting the data. If a commercial solution is used, licensing may also depend on volume.
- Only what you need
-
Rather unsurprisingly this is the polar opposite to everything. Technology resources are way less utilized in this scenario, but there is a risk that something will be missed. When beginning with a new system of log collection and correlation, it is best to start slowly with what is needed and then build upon it.
In reality the answer to what to log is probably driven mostly by costs. If this is the case, it is best to consume logs more aggressively from high-value systems, high-risk systems, and those facing external networks, and make savings in areas that are of lesser importance from a security perspective.
Where to Log
Operating systems tend to have some kind of log repository. On Windows this is the Event Viewer and on Unix platforms this is typically the /var/log/ directory arriving either via the filesystem directly or via syslog. The common feature between these methods is that the logs are stored on the host from which they originated. In the case of a compromise this leaves the logs exposed, as the evidence that you wish to examine is being protected by the very host that you can no longer trust.
The solution to this problem is to collect and aggregate logs at a central location. This provides two key benefits:
- Logs are no longer stored on the host that created them. In the event of a compromise, hardware failure, or rogue member of staff, the logs are still intact, and if properly configured, in a state whereby they cannot be tampered with.
- Aggregated logs provide better data for analysis than looking at discrete logfiles individually. But we’ll come back to this.
In the past, centralized log aggregation may have simply been a Unix host with a large amount of storage running syslogd and collecting the logs for the environment to its own /var/log/ directory. However, now we have Security Information & Event Management (SIEM) platforms that perform this role and much more.
Security Information and Event Management
A SIEM not only collects logs, it takes those logs and other security-related documentation and correlates them for analysis. This correlation activity allows more intelligent security-related alerts, trends, and reports to be created. Correlation logic should be the backbone of every SIEM solution and is much more effective when used over a range of log sources. For example, an organization can correlate various security events like unusual port activities on routers and firewalls, suspicious DNS activity, signature matches from a web application firewall and IDS/IPS, and threats recognized from antivirus or endpoint solutions to detect a potential threat.
SIEMs can be set up in one of several different configurations; software installed on a local server, a hardware appliance, a virtual appliance, or a cloud-based service. Many times a SIEM is put in place and expected to just automatically work to detect all possible malicious activity in an enterprise. While many do come preconfigured with a certain amount of alerts, dashboards, and reports, they still need to be customized. When a SIEM is added to any environment, it must be trained on what exactly to look for. Every environment is completely unique and as such, to have a properly configured and tuned SIEM it must be tailor-fit to the environment. Additionally, not only will this be one of the most customized pieces of a security architecture, it will also require a significant amount of time. As the network changes, new software is added, new threats are realized, or new behavior is seen, the SIEM must continue to be updated and tuned.
Designing the SIEM
Before a SIEM is implemented it is best to not only have an overall knowledge of what should and should not happen on the network, but also what the major pain points of the organization are that it will attempt to address. Steps prior to implementation include:
-
Define the coverage scope. Many organizations put a SIEM in place to cover a compliance requirement. This compliance may drive which sections of the network are initially focused on. Other areas maybe be left out of the scope altogether, such as a segmented guest network.
-
Establish threat scenarios/use cases. Use cases are when risk and threat scenarios are played out step by step and tied to different levels of an overall attack. It is possible to tie these levels of attack to the Intrusion Kill Chain, as mentioned in Chapter 1. When this approach is used, individual detection and alerting configuration can be used to counteract an attack at each level of the kill chain.
-
Define the priority of threats. During design and as a possible step in the creation of an overall risk profile, different threats should be prioritized. A match on a PCI data alert won’t be something to be categorized as critical if there is no PCI data present on the network. Walk through the threats that have been identified and alerts that come standard with the SIEM to prioritize what makes sense for the specific network it will be placed on.
-
Perform a proof of concept. Just because there are active rules and alerts on a SIEM doesn’t necessarily mean they will capture what you think they will. These proofs of concept will not only help strengthen internal security, but it will also build the purple team skillset. If there is an alert created for detecting port scans, don’t only attempt to trigger it but also attempt to get around it triggering to assist in finding potential gaps in the alert.
Log Analysis
Once logs are stored in some sort of central repository, it is time to start performing analysis. The ideal situation is one whereby logs are monitored and analyzed in near real time and raise alerts for events, or combinations of events, that are worthy of further investigation.
Depending on the software or service that is selected, it may be difficult to jump directly to this stage. Many higher-end SIEMs come preconfigured with at least a default set of alert rules, some of which are integrated with threat intelligence feeds; other times there may be a period of running ad-hoc queries in order to see what works and what doesn’t. Once the rules are tuned to an acceptable level of false positives and false negatives, they can be moved to real-time alerting.
Warning
The aim of log analysis is not to produce an exhaustive list of all events. If that were the case, people would be employed to just tail logs all day.
If too many alerts are generated they will be lost in the noise or simply ignored by analysts due to alert fatigue. Keep alerts to only those that should be acted upon, and keep the alerts useful and actionable.
Logging and Alerting Examples
Creating alerts based on logs can be a very useful way of discovering unusual activity within your environment. Of course, context is key and tailoring alerts to your specific environment will yield the best results. This section details some generic examples to illustrate the sorts of alerts that can be easily generated via log analysis.
Authentication Systems
Authentication systems are an obvious starting point for analysis as usage of user credentials is typically well understood. By analyzing the contents of authentication logs within the context of the environment, there are several tests that can yield immediate results:
- Users logging into systems at unusual hours
-
If users typically only connect during office hours, alerts on activity between 7pm and 7am, for example, are likely to be suitably few and suitably relevant for investigation.
- Repeated login failures
-
Repeated login failures above a set threshold could be a sign of a brute force attack, misconfigured clients, or simply a user who cannot remember his password.
- Users logging in from unusual or multiple locations
-
Most users have a predictable number of IP addresses that they may connect from. Most users also log in from one geographic location at a time. If a user is seen logging in from her normal office IP address, and five minutes later logging in from somewhere that is five time zones away, something might be wrong.
- Insecure authentication
-
Certain types of authentication are inherently insecure, such as logins over HTTP or telnet that are transmitted in cleartext over the network. Alerting on cleartext authentication can assist in removing it completely from your environment.
- Default accounts
-
As mentioned in previous chapters, default accounts should be only used when necessary, as they are considered shared accounts. Alerting on the use of these accounts when not approved can point to activity of an unknown origin.
- Domain admin group changes
-
Changes to the domain admin group in AD should be a rare occasion. While a malicious addition is normally well into the later stages of an attack, it is still vital information to alert on.
Application Logs
Most server applications generate logs of one type or another. This includes services such as email servers, web servers, and other (probably) internet-facing services. These logs can provide useful insight into adversaries performing attacks against these hosts or performing reconnaissance. For example:
- Too many 4XX responses from a web server can indicate failed attempts at exploitation. 4XX codes are failed responses such as “not found,” “access denied,” and as such are a common byproduct of people attempting, and failing, to call vulnerable scripts. Searching for a high frequency of 4XX errors may indicate an attack or scan in progress.
- Too many hits on one specific URL on a web server could indicate that something is being brute forced or enumerated. Of course, repeated calls to the same URL could be normal depending on the website setup, and so applying the context of the environment is required in order to determine if this is applicable.
- Connects and disconnects with no transaction on multiple types of servers can be an indication that someone is probing the network. This can be caused by simple port scanning, scraping protocol banners, probing TLS stacks, and other types of reconnaissance.
- New services, processes, and ports should not be an unplanned configuration change, especially on servers. Identifying a baseline per host as well as unwanted or unapproved services, processes, and ports can be useful for detecting malicious program installations or activity.
Proxy and Firewall Logs
Firewalls, proxies, and other systems that provide per-connection logging can be very useful indeed, particularly in discovering unexpected outbound traffic and other anomalies that could indicate a threat from an insider or an intrusion that is already in progress:
- Outbound connections to unexpected services can be an indicator of data exfiltration, lateral movement, or a member of staff who hasn’t read the acceptable use guide properly. Again, context is necessary, but connections to cloud-based file storage, instant messaging platforms, email services, and other systems can often be identified by hostnames and IP addresses. If these connections are not expected, they are probably worthy of further investigation.
- Matching IP addresses or hostnames on blacklists is a little contentious, because blacklists are generally not complete, or up-to-date. However, seeing connections to know command and control (C&C) infrastructure is used as the server side of malware and ransomware. There are publicly available lists for known C&C servers that can be used for blocking at the firewall for both egress and ingress as well as SIEM alerting.
- Connections of unexpected length or bandwidth can be an indicator that something unusual is happening. For example, running an sshd on port 443 can fool many proxies and firewalls; however, an average HTTPS session does not last for six hours, and even a site that is left open for long periods typically uses multiple smaller connections. The ssh connection to a nonstandard port would quite possibly appear to be long in duration, and low bandwidth.
Log Aggregation
Log aggregation is useful for purposes other than centralized management of logs. Logs that span multiple hosts, even if only one type of log, provide a much richer context from which it is possible to derive security events.
If, for example, an analyst reviews the failed logins for a single host in isolation and sees a single failed login for a user, it will most likely not raise any alarms. This can easily be written off as a mistyped password or a user accidentally connecting to the wrong host. Consider, however, if this query were run against the authentication logs for an entire server estate and it is then observed that the same single user made a single failed login to each of 350 hosts in 2 minutes. Given this broader context it becomes apparent that this is not merely a typo, but part of something that should be investigated. There are similar examples that can be drawn for almost every log type.
Use Case Analysis
With multiple log types across the entire enterprise collected into a single repository, new areas for analysis become possible. Use cases, otherwise known as threat models, should be built around the major risks previously identified using this analysis. Some of the more common areas to focus on are access control, perimeter defenses, intrusion detection, malware, application defenses, and resource integrity. Creating and tuning use cases will never be a finished project because the threat landscape is ever changing. There are always new threats to model, and new indicators to monitor for. For example:
- Brute-force attack
-
It is incredibly trivial to install and run password brute-forcing and cracking software. Correlating logs for detection of this requires both success and failure audits to be captured. As users may legitimately enter wrong passwords, it is important to test both methods to see the difference of the logging.
- Data exfiltration
-
Data exfiltration by an inside threat can be one of the more difficult and highly advanced attacks to detect. Start by logging which resource is being accessed by whom and when, identifying critical resources and users, develop a baseline to identify threshold limits, and monitor user activity during and after business hours. It is next to impossible to alert on all data exfiltration; the key is identifying what constitutes the highest risk. More than likely the recipe to Coca-Cola isn’t sitting in a text file on a shared drive.
- Impossible or unlikely user movements
-
These can be detected. For example, if the log repository contains logs from proximity card readers for doors or elevators, this can be correlated against authentication data to highlight users who have logged in remotely, within a short period of time of having swiped a card within a physical office location.
- Ransomware
-
Ransomware is not only one of the more common struggles in enterprises today, but is extremely fast moving, making worthwhile detection that much more difficult. Advanced file auditing is a necessary component if the behavior of ransomware is to be detected. Figure 20-1 shows an example of a spike of file audit activity before a ransomware attack and during the encryption of files.
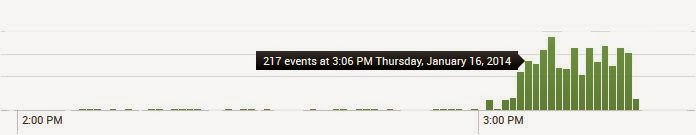
Figure 20-1. Spike in advanced file audits could point to a possible ransomware infection (Source)
Conclusion
Logs can be one of the most powerful detection tools in an environment. However, as powerful as they can be, they also can take a substantial amount of time and capital to make significant use of. With a solid, steady design planned around relevant risks, log correlation and a SIEM can greatly decrease the time it takes to detect and mitigate security issues in an environment.