Table of Contents for
JavaScript Web Applications
 JavaScript Web Applications
Published by
O'Reilly Media, Inc., 2011
JavaScript Web Applications
Published by
O'Reilly Media, Inc., 2011
- Cover
- JavaScript Web Applications
- JavaScript Web Applications
- Preface
- 1. MVC and Classes
- 2. Events and Observing
- 3. Models and Data
- 4. Controllers and State
- 5. Views and Templating
- 6. Dependency Management
- 7. Working with Files
- 8. The Real-Time Web
- 9. Testing and Debugging
- 10. Deploying
- 11. The Spine Library
- 12. The Backbone Library
- 13. EmberJS
- A. jQuery Primer
- B. CSS Extensions
- C. CSS3 Reference
- Index
- About the Author
- Colophon
- Copyright
Chapter 9. Testing and Debugging
All developers test, to some degree or another, when they’re programming. Even just running the code manually is a form of testing. However, what we’re going to cover here is automated testing in JavaScript—i.e., writing specific assertions that run automatically. Automated testing won’t eliminate bugs from your code, but it is a measure to effectively reduce the number of defects and to prevent older bugs from creeping back into the codebase. There are lots of great resources out there justifying and explaining different types of testing. So, rather than creating an inferior rehash of those, this chapter will focus on the specifics of testing in JavaScript as opposed to other languages.
Testing in JavaScript isn’t really ingrained into the culture, so many JavaScript developers don’t write any tests for their code. I think the main reason is that automated JavaScript testing is difficult—it doesn’t scale. Let’s take jQuery for example. The library has hundreds of unit tests and about 10 different test suites to simulate the various environments it’s expected to run in. Each test has to be run once in every suite. Now, take a look at the browsers jQuery supports:
Safari: 3.2, 4, 5, nightly
Chrome: 8, 9, 10, 11
Internet Explorer: 6, 7, 8, 9
Firefox: 2, 3, 3.5, 3.6, nightly
Opera: 9.6, 10, 11
So, that’s 5 browsers with about 20 versions among them, and each suite needs to be run on every browser version. You can see how the amount of tests that have to be run is expanding exponentially, and I haven’t even gotten to platforms yet! It just doesn’t scale.
Obviously, jQuery is a special case, an example designed to highlight the problem. You probably won’t need to support half as many browsers as jQuery does, and you are not likely to have as many suites. However, you will have to choose which browsers your application will support, and then test for them.
Before we go any further, it’s worth looking at the browser landscape, as this ultimately dictates the limitations imposed upon web developers. The landscape changes so quickly that this analysis is likely to be out of date by the time you read this. The general trends, though, should remain the same.
Browser adoption rates really depend on how you measure them. They change markedly between countries and continents, usually depending on how Internet-savvy the population is. For example, here are the Statcounter.com results for Europe in early 2011:
Safari: 4%
Chrome: 15%
IE: 36%
Firefox: 37%
Opera: 2%
The general trend is that IE usage is decreasing, while Firefox and Chrome usage is increasing. Older browsers like IE6 are now relics of the past, with a percentage share of a few points. Unless you’re developing for corporate or government clients with a lot of legacy users, you shouldn’t have to worry about supporting these ancient browsers.
As they say, “There are three kinds of lies: lies, damned lies, and statistics.” This applies doubly to browser stats. The stats for my blog, for example, show IE usage of about 5%, which is way below the national average. In other words, the traffic you’ll see is greatly affected by your specific audience. If your site caters to a technical, early-adopter crowd, you’ll get a high percentage of Firefox and Chrome users, whereas more mainstream sites will get visitors that better reflect the national average. When choosing which browsers your site needs to support, you should consider your specific audience rather than browser penetrations as a whole. However, as a rule of thumb, I generally test in the following browsers:
IE 8, 9
Firefox 3.6
Safari 5
Chrome 11
If you don’t have stats for your existing services that show you which browsers your audience is using, you’ll have to make an educated guess based on your target audience. Once you’ve chosen which browsers you’re supporting, the next step is writing automated tests and making sure they pass in every supported browser.
Unit Testing
Manual testing is like integration testing, making sure that your application works from a high level. Unit testing is much more low level, ensuring that particular pieces of code behind the scenes are performing as expected. Unit testing is much more likely to reveal cross-browser issues, but it allows you to resolve them quickly, because you need to examine only small sections of code.
The other advantage to unit testing is that it paves the way for automation. We’ll cover this in more detail later in this chapter, but unit tests make it possible to set up a continuous integration server, running the application’s tests every time the code is committed. This is much quicker than running through your whole application manually, and making sure that changes to one piece of code aren’t having any side effects elsewhere in the application.
There are lots of JavaScript libraries out there for unit testing, each with pros and cons. We’re going to cover the most popular ones, but the general principles should apply to any you choose to use.
Assertions
Assertions are at the heart of testing; they determine which tests pass or fail. Assertions are statements that indicate the expected result of your code. If the assertion is incorrect, the test fails, and you know that something has gone wrong.
For example, here’s the simple assert() function we’ve been using for the examples throughout this
book:
var assert = function(value, msg) {
  if ( !value )
    throw(msg || (value + " does not equal true"));
};
This takes a value and an optional message. If the value doesn’t
evaluate to true, the assertion
fails:
// Assertion fails
assert( false );
assert( "" );
assert( 0 );
JavaScript automatically type-converts undefined, 0, and null
to false during a Boolean check. In
other words, the assert works for a
null check, too:
// If the statement is null, the assertion fails
assert( User.first() );
Type conversion will really affect your testing, so it’s worth checking out some of the weird and wonderful ways JavaScript behaves when converting types.
Assert libraries aren’t just limited to checking for the truth. Most
libraries include a whole array of matchers, from comparing primitive
objects to checking that a number is greater than another. They all
include at least an assertEqual()
function, which lets you compare two values:
var assertEqual = function(val1, val2, msg) {
  if (val1 !== val2)
    throw(msg || (val1 + " does not equal " + val2));
};

// Assertion passes
assertEqual("one", "one");
All the testing libraries we’re going to cover consist of a set of assertions, with slightly differing APIs for defining them.
QUnit
QUnit is one of the most popular and well-maintained libraries, originally developed to test jQuery. So, how do you set up a QUnit testing environment? The first step is to download the project files locally, and then create a static test runner page:
<!DOCTYPE html>
<html>
<head>
    <title>QUnit Test Suite</title>
    <link rel="stylesheet" href="qunit/qunit.css" type="text/css" media="screen">
</head>
<body>
    <div id="qunit"></div>
    <script src="qunit/qunit.js"></script>
    <!-- include tests here... -->
</body>
</html>
To create assertions, you should put them into a test case. For example, let’s create a test suite for that ORM we built in Chapter 3:
test("load()", function(){
  var Asset = Model.setup();

  var a = Asset.init();
  a.load({
    local: true,
    name: "test.pdf"
  });

  ok(a.local, "Load sets properties");
  equal(a.name, "test.pdf", "load() sets properties (2)");

  var b = Asset.init({
    name: "test2.pdf"
  });

  equal(b.name, "test2.pdf", "Calls load() on instantiation");
});
We are defining a new case by calling test() and giving it the name of the test and
the test callback (where the magic happens). Inside the callback we’ve
got various assertions: ok() asserts
that its first argument resolves to true, and equal() compares its two arguments. All the
assertions take a last string argument, which is the name of the
assertion, letting us easily see what passes and fails.
Let’s add that test to the page and give it a refresh, as shown in Figure 9-1.
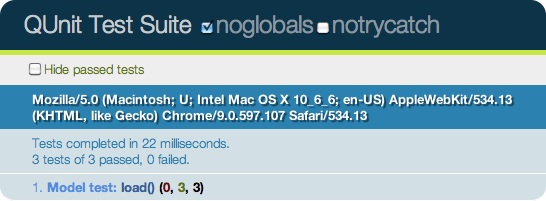
That’s pretty powerful! At a glance, we can see which tests have passed and failed—all it takes is a page refresh. We can now begin to test every browser our application supports, making sure our unit tests pass in all of them.
Tests are separated by the module() function, which takes a name and options. Let’s clean up the first
example by passing a setup option to
module(), containing a callback that
will be executed for every test that runs in the module. In this case,
all our tests will need an Asset
model, so we’ll create that in the setup:
module("Model test", {
  setup: function(){
    this.Asset = Model.setup();
  }
});

test("load()", function(){
  var a = this.Asset.init();
  a.load({
    local: true,
    name: "test.pdf"
  });

  ok(a.local, "Load sets properties");
  equal(a.name, "test.pdf", "load() sets properties (2)");

  var b = this.Asset.init({
    name: "test2.pdf"
  });

  equal(b.name, "test2.pdf", "Calls load() on instantiation");
});
That’s a bit cleaner, and it will be useful when adding further
tests. module() also takes a teardown option, which is a callback that will be executed after every
test in the module. Let’s add another test to our suite:
test("attributes()", function(){
  this.Asset.attributes = ["name"];

  var a = this.Asset.init();
  a.name = "test.pdf";
  a.id   = 1;

  equal(a.attributes(), {
    name: "test.pdf",
    id: 1
  });
});
If you try this out, you’ll see that the test has failed, like the page shown in Figure 9-2.
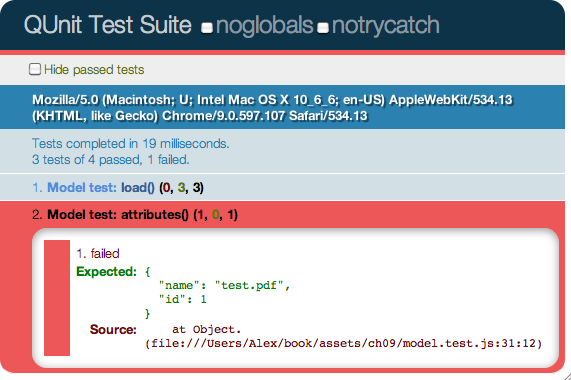
This is because the equal()
function uses the == comparison
operator, which will fail for objects and arrays. Instead, we need to
use the deepEqual()
function, which does a deep comparison, and our test suite will
pass again:
test("attributes()", function(){
  this.Asset.attributes = ["name"];

  var a = this.Asset.init();
  a.name = "test.pdf";
  a.id   = 1;

  deepEqual(a.attributes(), {
    name: "test.pdf",
    id: 1
  });
});
QUnit includes a couple of other assertion types, such as notEqual() and
raises(). For full examples of their
usage, see assets/ch09/qunit/model.test.js or the
QUnit
docs.
Jasmine
Jasmine is another popular testing library (and my personal favorite). Rather than unit tests, Jasmine has specs that describe the behavior of specific objects inside your application. In practice, they’re similar to unit tests, just with a different terminology.
Jasmine’s advantage is that it doesn’t require any other libraries, or even a DOM. This means it can run in any JavaScript environment, such as on the server side with Node.js.
As with QUnit, we need to set up a static HTML page that will load all the specs, run them, and display the result:
<!DOCTYPE HTML PUBLIC "-//W3C//DTD HTML 4.01 Transitional//EN"
  "http://www.w3.org/TR/html4/loose.dtd">
<html>
<head>
  <title>Jasmine Test Runner</title>
  <link rel="stylesheet" type="text/css" href="lib/jasmine.css">
  <script type="text/javascript" src="lib/jasmine.js"></script>
  <script type="text/javascript" src="lib/jasmine-html.js"></script>

  <!-- include source files here... -->
  <!-- include spec files here... -->
</head>
<body>

  <script type="text/javascript">
    jasmine.getEnv().addReporter(new jasmine.TrivialReporter());
    jasmine.getEnv().execute();
  </script>

</body>
</html>
Let’s take a look at writing some Jasmine specs. We’ll test some more of the ORM library from Chapter 3:
describe("Model", function(){
  var Asset;

  beforeEach(function(){
    Asset = Model.setup();
    Asset.attributes = ["name"];
  });

  it("can create records", function(){
    var asset = Asset.create({name: "test.pdf"});
    expect(Asset.first()).toEqual(asset);
  });

  it("can update records", function(){
    var asset = Asset.create({name: "test.pdf"});

    expect(Asset.first().name).toEqual("test.pdf");

    asset.name = "wem.pdf";
    asset.save();

    expect(Asset.first().name).toEqual("wem.pdf");
  });

  it("can destroy records", function(){
    var asset = Asset.create({name: "test.pdf"});

    expect(Asset.first()).toEqual(asset);

    asset.destroy();

    expect(Asset.first()).toBeFalsy();
  });
});
Specs are grouped into suites using the describe() function, which takes the name of
the spec and an
anonymous function. In the example above, we’re using the beforeEach() function as a setup utility to be run before every function.
Jasmine also includes a teardown function, afterEach(), which is called after every spec is run. We’re defining
the variable Asset outside the
beforeEach() function, so it’s local to the suite and can be accessed inside
each spec.
A spec begins with the it()
function, which gets passed the name of the spec and the anonymous
function containing the assertions. Assertions are created by passing
the relevant value to the expect() function, and then calling a matcher, such as one of the following:
expect(x).toEqual(y)Compares objects or primitives x and y, and passes if they are equivalent
expect(x).toBe(y)Compares objects or primitives x and y, and passes if they are the same object
expect(x).toMatch(pattern)Compares x to string or regular expression pattern, and passes if they match
expect(x).toBeNull()Passes if x is null
expect(x).toBeTruthy()Passes if x evaluates to true
expect(x).toBeFalsy()Passes if x evaluates to false
expect(x).toContain(y)Passes if array or string x contains y
expect(fn).toThrow(e)Passes if function
fnthrows exception e when executed
Jasmine includes lots of other matchers, and it even lets you write your own custom ones.
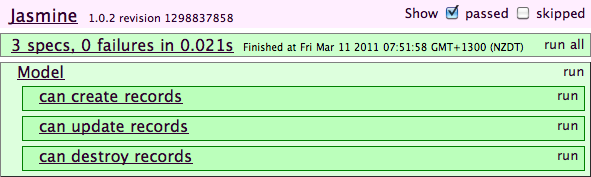
Figure 9-3 shows an overview of running the Jasmine Test Runner using the example specs above.
Drivers
Although by using a testing library we now have a degree of automation, there’s still the problem of running your tests in lots of different browsers. It’s not exactly productive having developers refresh the tests in five different browsers before every commit. Drivers were developed to solve exactly this problem. They’re daemons that integrate with various browsers, running your JavaScript tests automatically and notifying you when they fail.
It can be quite a lot of work implementing a driver setup on every developer’s machine, so most companies have a single continuous integration server, which will use a post-commit hook to run all the JavaScript tests automatically, making sure they all pass successfully.
Watir, pronounced “water,” is a Ruby driver library that integrates with Chrome, Firefox, Safari, and Internet Explorer (dependent on the platform). After installation, you can give Watir some Ruby commands to drive the browser, clicking links and filling in forms the same as a person would. During this process, you can run a few test cases and assert that things are working as expected:
# FireWatir drives Firefox
require "firewatir"

browser = Watir::Browser.new
browser.goto("http://bit.ly/watir-example")

browser.text_field(:name => "entry.0.single").set "Watir"
browser.button(:name => "logon").click
Due to limitations on which browsers can be installed on which operating systems, if you’re testing with Internet Explorer, your continuous integration server will have to run a version of Windows. Likewise, to test in Safari, you’ll also need a server running Mac OS X.
Another very popular browser-driving tool is Selenium. The library provides a domain scripting language (DSL) to write tests in a number of programming languages, such as C#, Java, Groovy, Perl, PHP, Python, and Ruby. Selenium can run locally; typically, it runs in the background on a continuous integration server, keeping out of your way as you commit code, but notifying you when tests fail. Selenium’s strengths lie in the number of languages it supports, as well as the Selenium IDE, a Firefox plug-in that records and plays back actions inside the browser, greatly simplifying authoring tests.
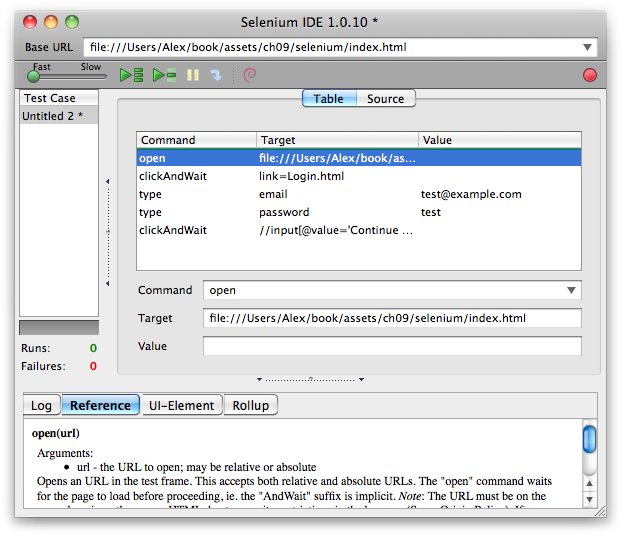
In Figure 9-4, we’re using the Selenium IDE tool to record clicking on a link, filling in a form, and finally submitting it. Once a session has been recorded, you can play it back using the green play button. The tool will emulate our recorded actions, navigating to and completing the test form.
We can then export the recorded Test Case to a variety of formats, as shown in Figure 9-5.
For example, here’s the exported Test Case as a Ruby Test::Unit case. As you can see, Selenium’s IDE has conveniently generated all the relevant driver methods, greatly reducing the amount of work needed to test the page:
class SeleniumTest < Test::Unit::TestCase
  def setup
    @selenium = Selenium::Client::Driver.new \
      :host => "localhost",
      :port => 4444,
      :browser => "*chrome",
      :url => "http://example.com/index.html",
      :timeout_in_second => 60

    @selenium.start_new_browser_session
  end

  def test_selenium
    @selenium.open "http://example.com/index.html"
    @selenium.click "link=Login.html"
    @selenium.wait_for_page_to_load "30000"
    @selenium.type "email", "test@example.com"
    @selenium.type "password", "test"
    @selenium.click "//input[@value='Continue →']"
    @selenium.wait_for_page_to_load "30000"
  end
end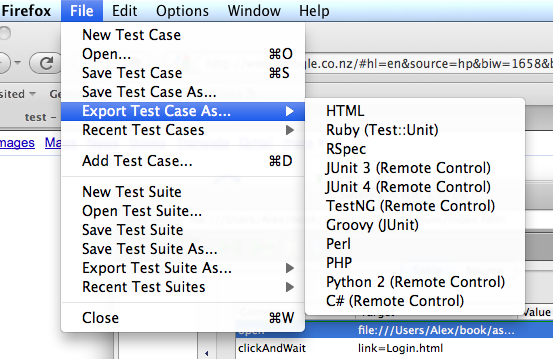
We can now make assertions on the @selenium object, such as ensuring that a
particular bit of text is present:
def test_selenium
  # ...
  assert @selenium.is_text_present("elvis")
end
For more information about Selenium, visit the website and watch the introduction screencast.
Headless Testing
With the development of server-side JavaScript implementations such as Node.js and Rhino comes the possibility of running your tests outside the browser in a headless environment via the command line. This has the advantage of speed and ease of setup, as it does away with the multitude of browsers and the continuous integration environment. The disadvantage, of course, is that the tests aren’t being run in a real-world environment.
This might not be as big a problem as it sounds, as you’ll find that most of the JavaScript you write is application logic and not browser-dependent. In addition, libraries like jQuery have taken care of a lot of browser incompatibilities when it comes to the DOM and event management. For smaller applications, as long as you have a staging environment when deploying and some high-level cross-browser integration tests (whether manual or automated), you should be fine.
Envjs is a library originally developed by John Resig, creator of the jQuery JavaScript framework. It offers an implementation of the browser and DOM APIs on top of Rhino, Mozilla’s Java implementation of JavaScript. You can use the env.js library together with Rhino to run JavaScript tests on the command line.
Zombie
Zombie.js is a headless library designed to take advantage of the incredible performance and asynchronous nature of Node.js. Speed is a key feature: the less time you spend waiting for tests to complete, the more time you get to build new features and fix bugs.
Applications that use a lot of client-side JavaScript spend much of their time loading, parsing, and evaluating that JavaScript. Here, the sheer performance of Google’s V8 JavaScript engine helps your tests run faster.
Although your test suite and client-side JavaScript both run on the same engine, Zombie uses another feature of V8—contexts—which keeps them separated so they do not mix the same global variables/state. It’s similar to the way Chrome opens each tab in its own process.
Another benefit of contexts is being able to run multiple tests in
parallel, each using its own Browser
object. One test might be checking the DOM content while another test is
waiting for a page request to come back, cutting down the time it takes
to complete the entire test suite. You’ll need to use an asynchronous
test framework, such as the excellent Vows.js, and pay attention to which tests must run in parallel
and which must run in sequence.
Zombie.js provides a Browser
object that works much like a real web browser: it maintains state
between pages (cookies, history, web storage) and provides access to the
current window (and through it the loaded document). In addition, it
provides you with methods for manipulating the current window, acting
like a user (visiting pages, filling forms, clicking prompts, etc.) and
inspecting the window contents (using XPath or CSS selectors).
For example, to fill in the username and password, submit a form and then test the contents of the title element:
// Fill email, password, and submit form.
browser.
  fill("email", "zombie@underworld.dead").
  fill("password", "eat-the-living").
  pressButton("Sign Me Up!", function(err, browser) {
   // Form submitted, new page loaded.
   assert.equal(browser.text("title"), "Welcome to Brains Depot");
  });
This example is incomplete. Obviously, you’ll need to require the
Zombie.js library, create a new Browser, and load the page before you can
interact with it. You also want to take care of that err
argument.
Just like a web browser, Zombie.js is asynchronous in nature: your code doesn’t block waiting for a page to load, an event to fire, or a timer to timeout. Instead, you can either register listeners for events such as loaded and error, or pass a callback.
By convention, when you pass Zombie a callback, it will use it one
of two ways. If the action was successful, it will pass null and some
other value, most often a reference to the Browser object. If the action failed, it will
pass a reference to the Error object.
So, make sure to check the first argument to determine whether your
request completed successfully, and whether there’s anything interesting
in the remaining arguments.
This convention is common to Node.js and many libraries written for it, including the aforementioned Vows.js test framework. Vows.js also uses callbacks, which it expects to be called with one argument that is error or null; if that argument is null, a second argument is passed along to the test case.
Here, for example, is a test case that uses Zombie.js and Vows.js. It visits a web page and looks for elements with the class brains (expecting to find none):
var zombie  = require("zombie");

vows.describe("Zombie lunch").addBatch({
  "visiting home page": {
    topic: function() {
      var browser = new zombie.Browser;
      browser.cookies("localhost").update("session_id=5678");
      browser.visit("http://localhost:3003/", this.callback);
    },
    "should find no brains": function(browser) {
      assert.isEmpty(browser.css(".brains"));
    }
  }
});
There are many other things you can do with Zombie.js. For example, you can save the browser state (cookies, history, web storage, etc.) after running one test and use that state to run other tests (to start each test from the state of “new session and user logged in”).
You can also fire DOM events—e.g., to simulate a mouse click—or respond to confirmation prompts and alerts. You can view the history of requests and responses, similar to the Resources tab in WebKit’s Web Inspector. Although Zombie runs on Node.js, it can make HTTP requests to any web server, so you can certainly use it to test your Ruby or Python application.
Ichabod
The imaginatively named Ichabod library is another alternative for running tests headlessly, and it is a great solution if you’re after simplicity and speed.
The advantage to Ichabod is that, rather than an emulation of the DOM and parser engine, it uses WebKit—the browser engine behind Safari and Chrome. However, Ichabod works only on OS X, as it requires MacRuby and the OS X WebView APIs.
Installation is pretty straightforward. First, install MacRuby, either off the project’s site or with rvm. Then, install the Ichabod gem:
$ macgem install ichabod
Ichabod currently supports running Jasmine or QUnit tests,
although additional libraries will be supported soon. Simply pass the
test’s endpoint to the ichabod
executable:
$ ichabod --jasmine http://path/to/jasmine/specs.html
$ ichabod --qunit http://path/to/qunit/tests.html
The tests don’t have to be hosted—you can also pass a local path:
$ ichabod --jasmine ./tests/index.html
    ...
    Finished in 0.393 seconds
    1 test, 5 assertions, 0 failures
Ichabod will load up all your tests and run them in a GUI-less version of WebKit, straight from the command line.
Distributed Testing
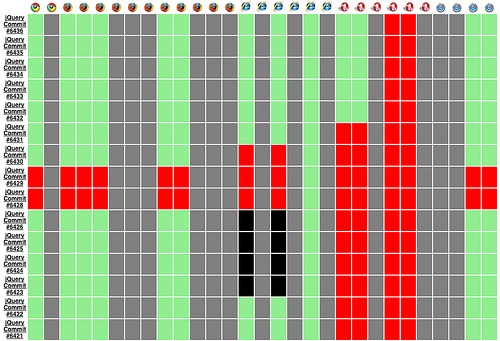
One solution to cross-browser testing is outsourcing the problem to a dedicated cluster of browsers. This is exactly the approach of TestSwarm:
The primary goal of TestSwarm is to take the complicated, and time-consuming, process of running JavaScript test suites in multiple browsers and to grossly simplify it. It achieves this goal by providing all the tools necessary for creating a continuous integration workflow for your JavaScript project.
Rather than using plug-ins and extensions to integrate with browsers at a low level, TestSwarm takes the reverse approach. Browsers open up the TestSwarm endpoint, and automatically process tests pushed toward them. They can be located on any machine or operating system—all it takes to add a new browser is to navigate to the TestSwarm endpoint inside it.
This simple approach takes a lot of the pain and hassle out of running a continuous integration server. All that’s involved is ensuring a decent number of browsers are connected to the swarm. Indeed, this is something you could outsource if you have an active community, achieving probably the most realistic testbed you could hope for, as shown in Figure 9-6.
The alternative is to use a company like Sauce Labs to manage and run all those browsers in the cloud. Simply upload any Selenium tests and their service will do the rest, running the tests on different browsers and platforms, making sure they all pass.
Providing Support
However many tests you write for your application, the likelihood is that there will always be bugs. The best thing to do is to accept this fact and prepare for users to come across bugs and errors. Provide an easy way for users to submit bug reports and set up a ticketing system to manage support requests.
Inspectors
JavaScript development and debugging has come a long way
from the alert() calls of the past.
Most of the major browsers now include powerful element inspectors and
debuggers, which simplifies and improves web development dramatically.
We’re going to cover the two main inspectors next, but the general
concepts should transfer over to any inspector you choose to use.
Web Inspector
Web Inspector is available on both the Safari and Google Chrome browsers. The inspector’s interface differs slightly between the two browsers, but the functionality is fairly consistent.
In Safari, you have to enable it explicitly by checking the advanced preference, “Show Develop menu in menu bar,” as shown in Figure 9-7.
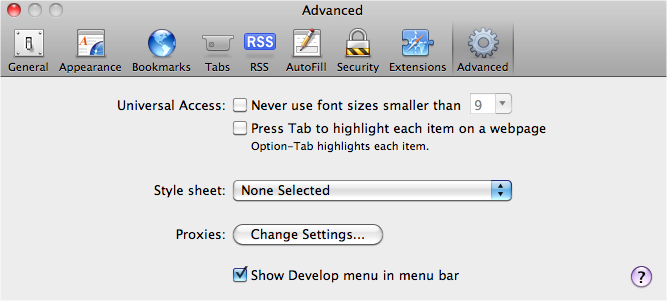
Chrome has a developer toolbar under the View toolbar, which you can use to enable the inspector. The alternative in both browsers is to right-click on an element and select “inspect”.
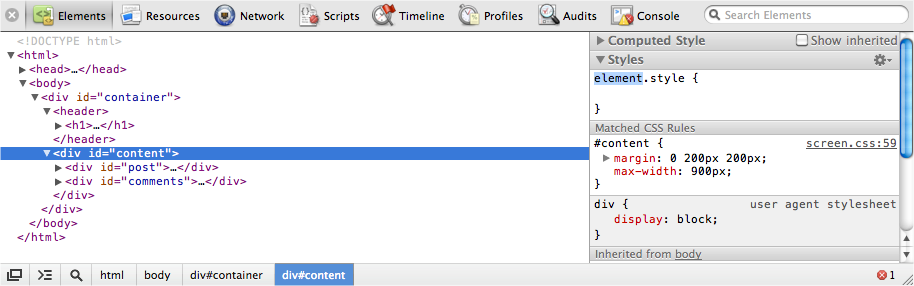
Web Inspector, shown in Figure 9-8, is an incredibly useful tool, letting you inspect HTML elements, edit styles, debug JavaScript, and more. If it isn’t the case already, the inspector should be part of your day-to-day JavaScript development.
We’re going to cover more of its features in detail, but here’s a basic overview of Web Inspector’s components:
- Elements
Inspect HTML elements, edit styles
- Resources
Page resources and assets
- Network
HTTP requests
- Scripts
JavaScript files and debugger
- Timeline
Detailed view of browser rendering
- Audits
Code and memory auditor
- Console
Execute JavaScript and see logging
Firebug
Firefox doesn’t include a JavaScript inspector natively, but it has an excellent add-on to do the job: Firebug. See Figure 9-9.
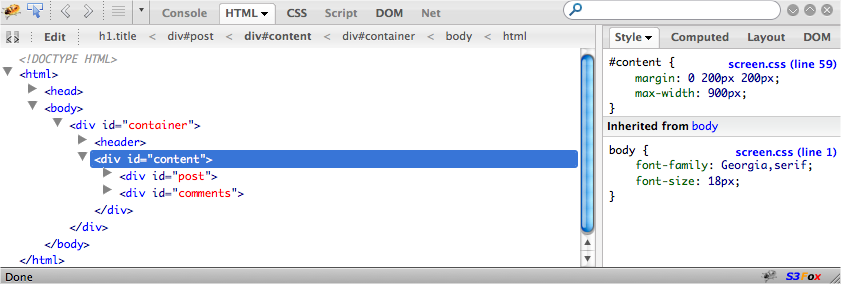
You’ll see that although the various components to Firebug have different names to their counterparts in Web Inspector, their functionality is very similar:
- Console
Execute JavaScript and see logging
- HTML
Inspect elements, edit styles
- CSS
See and edit the page’s CSS
- Script
JavaScript files and debugger
- DOM
Global variable inspection
- Net
HTTP requests
Firebug’s team has developed a Firefox-independent version, Firebug Lite. It has the vast majority of features from Firebug, as well as the same look and feel, and it’s compatible with all major browsers. Firebug Lite is especially useful for debugging Internet Explorer (it’s rather superior to IE’s built-in tools). Firebug Lite doesn’t require any installation, and it can be added to a web page using a simple script tag:
<script type="text/javascript" src="https://getfirebug.com/firebug-lite.js"></script>
Alternatively, you can install the bookmarklet from the Firebug Lite website.
The Console
The console lets you easily execute JavaScript and examine
the pages’ global variables. One of the major advantages to the console is
that you can log directly to it, using the console.log() function. The call is asynchronous, can take multiple arguments, and
inspects those arguments, rather than converting them to strings:
console.log("test");
console.log(1, 2, {3: "three"});
There are additional types of logging.
You can use console.warn() and console.error() to elevate the logging level, giving an early indication that something might
be going wrong:
console.warn("a diabolical warning");
console.error("something broke!");

try {
  // Raises something
} catch(e) {
  console.error("App error!", e);
}
It’s also possible to namespace log calls by using a proxy function:
var App = {trace: true};
App.log = function(){
  if (!this.trace) return;
  if (typeof console == "undefined") return;
  var slice = Array.prototype.slice;
  var args  = slice.call(arguments, 0);
  args.unshift("(App)");
  console.log.apply(console, args);
};
The App.log() function prepends the string "App"
to its arguments and then passes the call onto console.log().
Keep in mind that when using the console for logging, the variable
console may not be defined. In browsers
that don’t have support for the console—such as Internet Explorer or
Firefox without Firebug—the console
object won’t be defined, causing errors if you try to use it. This is a
good reason for using a proxy function like App.log() when logging inside your
application.
You can output the scripts’ current stack trace to the console using
console.trace(). This is especially useful if you’re trying to work out how
a function is being called because it traces the stack back through the
program:
// Log stack trace
console.trace();
The application’s errors will also appear in the console and, unless the browser’s JIT compiler has optimized the function call, the console will show a full stack trace.
Console Helpers
The console also includes a number of shortcuts and helper
functions to save some typing. For example, the $0 to $4
variables contain the current and previous three selected nodes in Web
Inspector or Firebug. Believe me, this is extremely useful when you want
to access and manipulate elements:
// $0 is the currently selected element
$0.style.color = "green";

// Or, using jQuery
jQuery($0).css({background: "black"});
The $() function returns the element with the specified ID. It’s
essentially a shortcut to document.getElementById(). jQuery, Prototype,
or a similar library that already uses $ will override this:
$("user").addEventListener("click", function(){ /* ... */});The $$() function returns the array of elements that match the given CSS
selector. This is similar to document.querySelectorAll(). Again, if you use
Prototype or MooTools, those libraries will override this:
// Select elements with a class of .users
var users = $$(".users");
users.forEach(function(){ /* ... */ });
The $x() function returns the array of elements that matches the given XPath
expression:
// Select all forms
var checkboxes = $x("/html/body//form");
The clear() function clears the console:
clear();
dir() prints an interactive listing of all the object’s
properties:
dir({one: 1});inspect() takes an element, database, or storage area as an
argument, and automatically jumps to the appropriate panel to display
the relevant information:
inspect($("user"));keys() returns an array containing the names of all the object’s
properties:
// Returns ["two"]
keys({two: 2});
values() returns an array containing the values of all the
object’s properties—i.e., the opposite of keys():
// Returns [2]
values({two: 2});
Using the Debugger
The JavaScript debugger is one of the best-kept secrets in JavaScript development. It’s a full-featured debugger that allows you to place breakpoints, watch expressions, examine variables, and work out exactly what’s going on.
Placing a breakpoint is easy—just add the debugger statement inside the script at the
point you want the debugger to pause execution:
var test = function(){
  // ...
  debugger
};
Alternatively, you can go to the Scripts panel in the inspector, select the relevant script, and click on the line number where you want to place the breakpoint. Figure 9-10 shows an example.
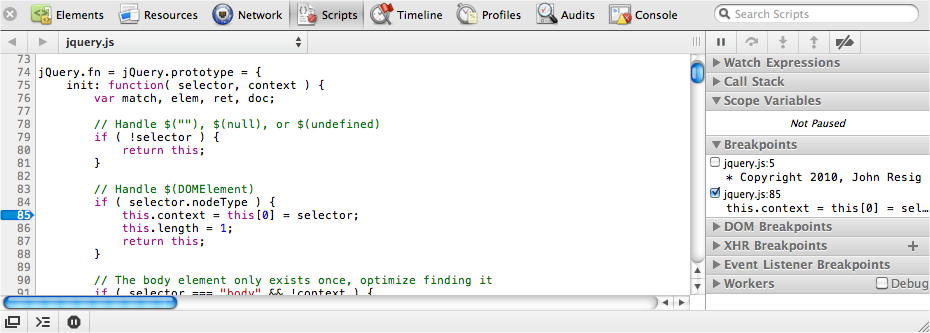
The latter approach is probably preferable because you don’t want to
risk getting any debugger statements in
production code. When the JavaScript execution reaches the breakpoint,
it’s paused, letting you examine the current scope, as shown in Figure 9-11.
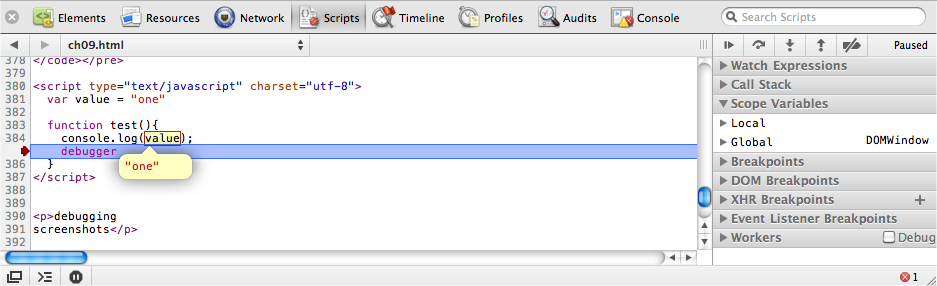
On the right of the inspector’s Scripts panel, you can see the full call stack, the local and global variables, and other relevant debugging information. You can hover the mouse over any variable to see its current value. The console is even scoped to the breakpoint, allowing you to manipulate variables and call other functions.
You can continue code execution, step into or over the next function call, and navigate up the current stack using the Debugger toolbar on the right. The Debugger toolbar icons are specific to the browser, but you can determine each button’s function by hovering the mouse over it, which displays a yellow information bubble.
It’s important to remember that breakpoints remain between page
reloads. If you want to remove a breakpoint, simply toggle its line
number, or uncheck it in the breakpoint list. The JavaScript debugger is a
wonderful alternative to console.log(),
as it helps you work out exactly what’s happening inside your
application.
Analyzing Network Requests
As shown in Figure 9-12, the inspector’s network section shows all the HTTP requests the page is making, how long they took, and when they completed.
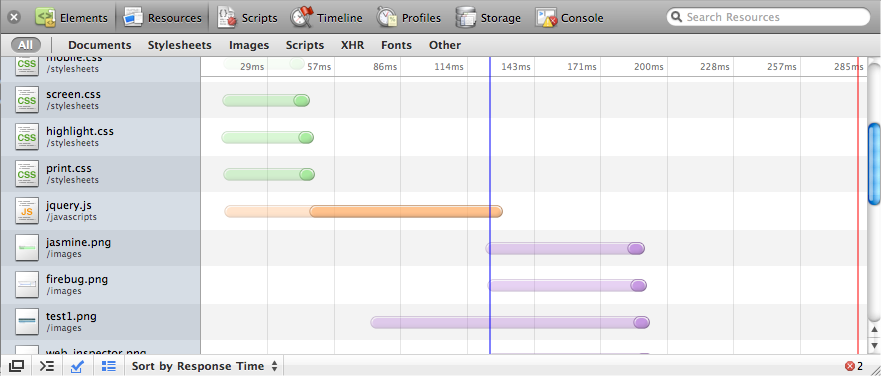
You can see the initial request’s latency, which is a slightly transparent color. Then, when data starts getting received, the timeline’s color goes opaque. In the example above, jQuery’s file size is much bigger than the stylesheets’, so although the initial request latency is similar, the script takes longer to download.
If you’re not using the async or
defer option with your scripts (see
Chapter 10), you’ll notice that JavaScript files are
downloaded sequentially rather than in parallel. Scripts are requested
only after the previous referenced script has been fully downloaded and
executed. All other resources are downloaded in parallel.
The lines in the network timeline indicate the pages’ load status. The blue line appears at the time the document’s DOMContentLoaded event was fired or, in other words, when the DOM is ready. The red line appears once the window’s load event is triggered, when all the page’s images have been fully downloaded and the page has finished loading.
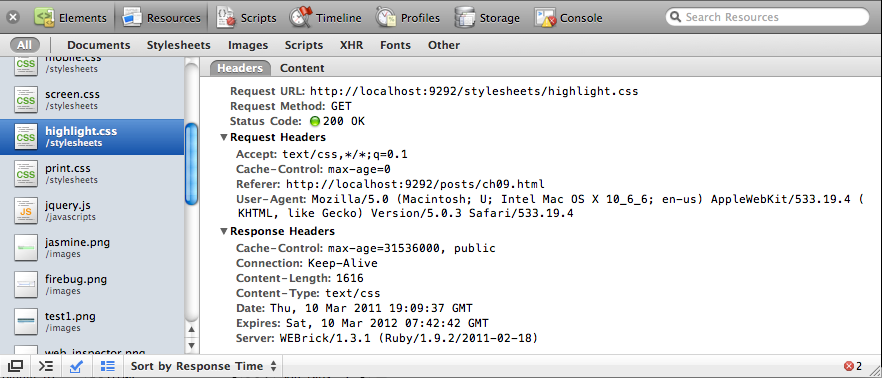
The network section also shows the full request and response headers for every request, which is especially useful for making sure any caching is being applied correctly. See Figure 9-13.
Profile and Timing
When you’re building large JavaScript apps, you need to keep an eye on performance, especially if you’ve got mobile clients. Both Web Inspector and Firebug include profiling and timing utilities that can help keep things ticking smoothly.
Profiling code is simple—just surround any code you want to profile
with console.profile() and console.profileEnd():
console.profile();
// ...
console.profileEnd();
As soon as profileEnd() is
called, a profile will be created, listing all the functions (and the time taken in each one) that were
called between the two statements. See Figure 9-14 for an
illustration.
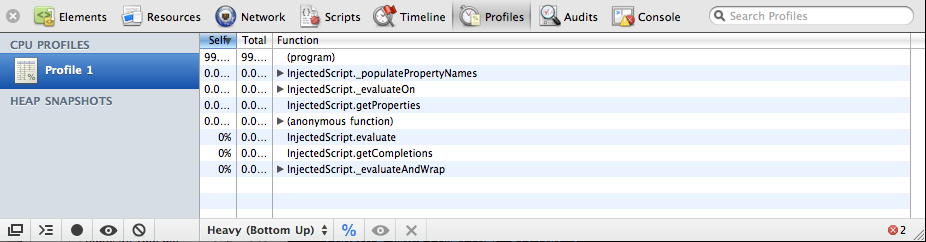
Alternatively, you can use the record feature of the inspector’s profiler, which is equivalent to wrapping code with the profile console statements. By seeing which functions are being called and which functions are taking longer to complete, you can discover and optimize bottlenecks in your code.
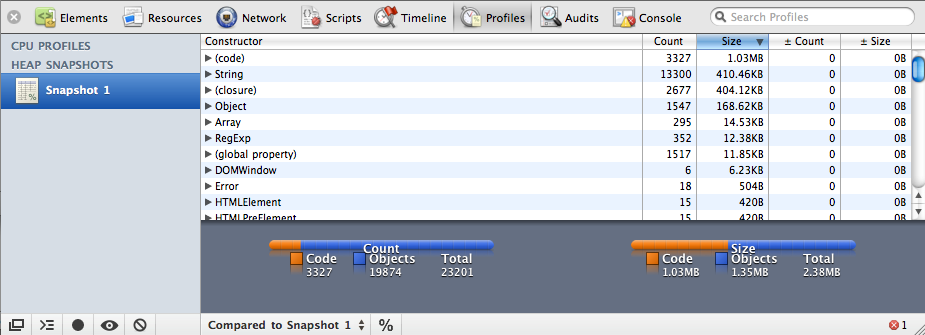
The profiler also allows you to take a snapshot of the page’s current heap, as illustrated in Figure 9-15. This will show you how many objects have been allocated and the amount of memory the page is using. This is a great way of finding memory leaks because you can see whether any objects are being unwittingly stored, and are subsequently unable to be garbage collected.
The console also lets you time how long it takes to execute some
code. The API is similar to the profiler—simply wrap the code with
console.time(name) and console.timeEnd(name). Unless you manage to fit everything on one line, you won’t
be able to time code from inside the JavaScript console accurately;
instead, you will have to add the timing statements directly into your
scripts:
console.time("timeName");
// ...
console.timeEnd("timeName");
When timeEnd() is called, the time taken between the two timing statements
is sent to the console’s log in milliseconds. Using the console’s timing
API, you could potentially incorporate benchmarking into your
application’s tests, ensuring that additional code wasn’t significantly
hurting the application’s existing performance.