Table of Contents for
Squid: The Definitive Guide
 Squid: The Definitive Guide
Published by
O'Reilly Media, Inc., 2004
Squid: The Definitive Guide
Published by
O'Reilly Media, Inc., 2004
- Cover
- Squid: The Definitive Guide
- Squid: The Definitive Guide
- Dedication
- Preface
- 1. Introduction
- 2. Getting Squid
- 3. Compiling and Installing
- 4. Configuration Guide for the Eager
- 5. Running Squid
- 6. All About Access Controls
- 7. Disk Cache Basics
- 8. Advanced Disk Cache Topics
- 9. Interception Caching
- 10. Talking to Other Squids
- 11. Redirectors
- 12. Authentication Helpers
- 13. Log Files
- 14. Monitoring Squid
- 15. Server Accelerator Mode
- 16. Debugging and Troubleshooting
- A. Config File Reference
- http_port
- https_port
- ssl_unclean_shutdown
- icp_port
- htcp_port
- mcast_groups
- udp_incoming_address
- udp_outgoing_address
- cache_peer
- cache_peer_domain
- neighbor_type_domain
- icp_query_timeout
- maximum_icp_query_timeout
- mcast_icp_query_timeout
- dead_peer_timeout
- hierarchy_stoplist
- no_cache
- cache_access_log
- cache_log
- cache_store_log
- cache_swap_log
- emulate_httpd_log
- log_ip_on_direct
- cache_dir
- cache_mem
- cache_swap_low
- cache_swap_high
- maximum_object_size
- minimum_object_size
- maximum_object_size_in_memory
- cache_replacement_policy
- memory_replacement_policy
- store_dir_select_algorithm
- mime_table
- ipcache_size
- ipcache_low
- ipcache_high
- fqdncache_size
- log_mime_hdrs
- useragent_log
- referer_log
- pid_filename
- debug_options
- log_fqdn
- client_netmask
- ftp_user
- ftp_list_width
- ftp_passive
- ftp_sanitycheck
- cache_dns_program
- dns_children
- dns_retransmit_interval
- dns_timeout
- dns_defnames
- dns_nameservers
- hosts_file
- diskd_program
- unlinkd_program
- pinger_program
- redirect_program
- redirect_children
- redirect_rewrites_host_header
- redirector_access
- redirector_bypass
- auth_param
- authenticate_ttl
- authenticate_cache_garbage_interval
- authenticate_ip_ttl
- external_acl_type
- wais_relay_host
- wais_relay_port
- request_header_max_size
- request_body_max_size
- refresh_pattern
- quick_abort_min
- quick_abort_max
- quick_abort_pct
- negative_ttl
- positive_dns_ttl
- negative_dns_ttl
- range_offset_limit
- connect_timeout
- peer_connect_timeout
- read_timeout
- request_timeout
- persistent_request_timeout
- client_lifetime
- half_closed_clients
- pconn_timeout
- ident_timeout
- shutdown_lifetime
- acl
- http_access
- http_reply_access
- icp_access
- miss_access
- cache_peer_access
- ident_lookup_access
- tcp_outgoing_tos
- tcp_outgoing_address
- reply_body_max_size
- cache_mgr
- cache_effective_user
- cache_effective_group
- visible_hostname
- unique_hostname
- hostname_aliases
- announce_period
- announce_host
- announce_file
- announce_port
- httpd_accel_host
- httpd_accel_port
- httpd_accel_single_host
- httpd_accel_with_proxy
- httpd_accel_uses_host_header
- dns_testnames
- logfile_rotate
- append_domain
- tcp_recv_bufsize
- err_html_text
- deny_info
- memory_pools
- memory_pools_limit
- forwarded_for
- log_icp_queries
- icp_hit_stale
- minimum_direct_hops
- minimum_direct_rtt
- cachemgr_passwd
- store_avg_object_size
- store_objects_per_bucket
- client_db
- netdb_low
- netdb_high
- netdb_ping_period
- query_icmp
- test_reachability
- buffered_logs
- reload_into_ims
- always_direct
- never_direct
- header_access
- header_replace
- icon_directory
- error_directory
- maximum_single_addr_tries
- snmp_port
- snmp_access
- snmp_incoming_address
- snmp_outgoing_address
- as_whois_server
- wccp_router
- wccp_version
- wccp_incoming_address
- wccp_outgoing_address
- delay_pools
- delay_class
- delay_access
- delay_parameters
- delay_initial_bucket_level
- incoming_icp_average
- incoming_http_average
- incoming_dns_average
- min_icp_poll_cnt
- min_dns_poll_cnt
- min_http_poll_cnt
- max_open_disk_fds
- offline_mode
- uri_whitespace
- broken_posts
- mcast_miss_addr
- mcast_miss_ttl
- mcast_miss_port
- mcast_miss_encode_key
- nonhierarchical_direct
- prefer_direct
- strip_query_terms
- coredump_dir
- ignore_unknown_nameservers
- digest_generation
- digest_bits_per_entry
- digest_rebuild_period
- digest_rewrite_period
- digest_swapout_chunk_size
- digest_rebuild_chunk_percentage
- chroot
- client_persistent_connections
- server_persistent_connections
- pipeline_prefetch
- extension_methods
- request_entities
- high_response_time_warning
- high_page_fault_warning
- high_memory_warning
- ie_refresh
- vary_ignore_expire
- sleep_after_fork
- B. The Memory Cache
- C. Delay Pools
- D. Filesystem Performance Benchmarks
- E. Squid on Windows
- F. Configuring Squid Clients
- About the Author
- Colophon
- Copyright
Chapter 14. Monitoring Squid
How can you tell if Squid is performing well? Does Squid have enough memory, bandwidth, and disk space? When the Internet seems slow, is it Squid’s fault or a problem somewhere else? Is the operating system giving enough resources to Squid? Is someone trying to abuse or hack into my proxy? You can find the answers to these, and many more, questions in this chapter. Squid provides information about itself in three different ways: cache.log messages, the cache manager, and an SNMP MIB.
Squid writes various messages to cache.log as it runs. Most of these are abnormal events of one sort or another. Unfortunately, Squid isn’t always smart enough to differentiate serious problems from those that can be safely ignored. Even so, cache.log is a good place to start when investigating a Squid problem.
The cache manager and SNMP interfaces allow you to query Squid for a variety of data. The cache manager, which has its own shortcomings, probably provides the most information in current versions of Squid. It has a TCP socket-based interface and tries to generate output suitable for both human and computer processing. The bulk of this chapter is devoted to explaining all the information available from the cache manager.
Squid supports SNMP as well. Unfortunately, the data available through SNMP is only a subset of the cache-manager information. Additionally, the Squid MIB has not evolved much over the years; it’s essentially unchanged since its first incarnation. I’ll explain how to make Squid process SNMP queries and describe all objects in the current MIB.
cache.log Warnings
This is one of the first places you should look whenever you perceive a problem with Squid. During normal operation, you’ll find various warnings and informational messages that may or may not indicate a problem. I covered the mechanics of cache.log back in Section 13.1. Here, I’ll go over a few of the warning messages you might see in your log file.
The high_response_time_warning directive makes Squid print a warning whenever the median response time exceeds a threshold. The value is in milliseconds and is disabled by default. If you add this line to squid.conf:
high_response_time_warning 1500
Squid will print the following warning if the median response time, measured over a 1-minute interval, exceeds 1.5 seconds:
2003/09/29 03:17:31| WARNING: Median response time is 2309 milliseconds
Before setting this directive, you should have a good idea of Squid’s normal response time levels. If you set it too low, you’ll get false alarms. In this particular example, it means that half of your user’s requests take more than 2.3 second to complete. High response times may be caused by local problems, such as running out of file descriptors, or by remote problems, such as a severely congested Internet link.
The high_page_fault_warning directive is similar. It causes Squid to emit a warning if the number of page faults per minute exceeds a given value. A high page-fault rate usually indicates that the Squid process can’t fit entirely in memory and must be swapped out to disk. This swapping severely impacts Squid’s performance, so you should remedy the situation as soon as possible, as I’ll discuss in Section 16.1.8.
Squid uses the Unix getrusage( ) function to
get page fault counts. On some operating systems (e.g.,
Solaris), the page fault counter represents something besides swapping.
Therefore, the high_page_fault_warning may cause
false alarms on those systems.
The high_memory_warning directive is also similar to the previously mentioned warnings. In this case, it checks the size of the Squid process; if it exceeds the threshold, you get the warning in cache.log. On some operating systems, the process size can only grow and never shrink. Therefore, you’ll constantly get this warning until Squid shuts down.
Process size information comes from either the mallinfo( ), mstats( ), or sbrk( ) functions. If these are unavailable
on your operating system, the high_memory_warning
warning won’t work.
Squid has a number of other hardcoded warnings you may see in cache.log:
DNS lookup for 'neighbor.host.name'
          failed!
This occurs whenever Squid fails to look up the IP address for a cache neighbor. Squid refreshes the neighbor addresses every hour or so. As long as the neighbor’s address is unknown, Squid doesn’t send any traffic there.
Detected DEAD Sibling:
          neighbor.host.name/3128/3130
Squid logs this message when it believes it can’t communicate with a neighbor cache. This happens, for example, when too many consecutive ICP queries go unacknowledged. See Section 10.3.2 for more information.
95% of replies from
          'neighbor.host.name' are UDP_DENIED
This message indicates that a neighbor cache is refusing to answer Squid’s queries. It probably means that you are sending queries to the neighbor without their permission. If they are using address-based access controls, and you have recently changed your address, they won’t know about the change. Squid refuses to send any more queries to the neighbor after detecting this condition.
Probable misconfigured neighbor at
          192.168.121.5
This occurs when you have an unauthorized cache client sending you ICP or HTCP queries. The best thing to do in this case is try to find out the person or organization responsible for the given address. Ask why they are querying your cache.
Forwarding loop detected for:Recall that a forwarding loop occurs when a single request flows through Squid a second time. The request’s
Viaheader contains a list of all proxies that have seen the request. If Squid detects its own name in theVialist, it emits the forwarding loop warning and sends the request directly to the origin server. See Section 10.2 for an explanation of forwarding loops.Closing client 192.168.121.5 connection due to lifetime timeoutThe client_lifetime directive places an upper limit on the duration for a single HTTP request. Squid warns you when such a request is terminated because it may indicate someone is abusing your cache with very long-lived connections, for example, by downloading infinitely long objects.
As you can see, cache.log provides only notification of abnormal events. For periodic monitoring, you need something else. The cache manager is perhaps the best choice, even though its interface is less than perfect.
The Cache Manager
The Cache Manager is an interface to Squid for receiving information about various
components. It is accessed via normal HTTP requests with a special
protocol name: cache_object. A full
cache manager URL looks like
cache_object://cache.host.name/info. Squid provides
two easy ways to access the cache manager information: the command-line
squidclient program[1] or the cachemgr.cgi CGI
program.
The squidclient utility is a simple HTTP client, with a few special features for use with Squid. For example, you can use a shortcut to request the cache manager pages. Rather than typing a long URL like this:
% squidclient cache_object://cache.host.name/info
you can use this shorter version:
% squidclient mgr:info
squidclient is a convenient way to quickly see some of the cache manager pages. It’s also useful when you need to save the cache manager output to disk for later analysis. However, some pages, such as the memory utilization table, are difficult to read in a terminal window. They are really designed to be formatted as an HTML page and viewed with your web browser. In that case, you may want to use cachemgr.cgi.
To use cachemgr.cgi, you must have an HTTP server that can execute the program. You can use an existing server or install one alongside Squid if you prefer. Keep in mind that the cache manager has only weak security (cleartext passwords). If the HTTP server is on a different host, you need to add its IP address to a cache manager access list (see Section 14.2.2). You may also want to add access controls to the HTTP server so that others can’t access cachemgr.cgi.
If you use Apache, I recommend making a special cgi-bin directory so you can protect cachemgr.cgi with access controls. For example, create a new directory, and copy the binary to it:
# mkdir /usr/local/apache/squid-cgi
# cp /usr/local/squid/libexec/cachemgr.cgi /usr/local/apache/squid-cgi
# chmod 755 /usr/local/apache/squid-cgi/cachemgr.cgi
Now, add a ScriptAlias line to Apache’s httpd.conf:
ScriptAlias /squid-cgi/ "/usr/local/apache/squid-cgi/"
Finally, create an .htaccess file in the squid-cgi directory that contains access controls. To allow requests from only one IP address, use something like this:
Allow from 192.168.4.2
Deny from all
Once cachemgr.cgi is installed, simply enter the appropriate URL into your web browser. For example:
http://www.server.name/squid-cgi/cachemgr.cgi
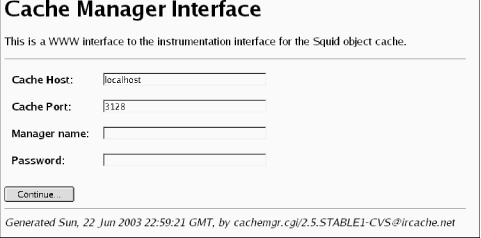
If the CGI program is working, you should see a page with four
fields. See Figure 14-1 for an
example. The Cache Host field contains the name of
the host on which Squid is running—localhost by
default. You can set it with the
—enable-cachemgr-hostname option when running ./configure. Similarly, Cache
Port contains the TCP port number to which Squid listens for
requests. It’s 3128 by default and can be changed with the
—enable-cachemgr-port option. The Manager
name and Password fields are for access
to protected pages, which I’ll talk about shortly.
After clicking on the Continue... button, you should see a list of all cache manager pages currently available. The following section describes the various pages, some of which are available only when you enable certain features at compile time.
Cache Manager Pages
This section describes the cache manager pages, in the same order in which they appear in the menu. Each section title has both the page name (for use with squidclient), followed by its description. Descriptions that contain an asterisk indicate pages that are disabled by default, unless you configure a password for them. Table 14-1 shows the table of contents and the section number for each page.
Short name | Description |
leaks | Memory Leak Tracking |
mem | Memory Utilization |
cbdata | Callback Data Registry Contents |
events | Event Queue |
squidaio_counts | Async IO Function Counters |
diskd | DISKD Stats |
config | Current Squid Configuration* |
comm_incoming | comm_incoming( ) Stats |
ipcache | IP Cache Stats and Contents |
fqdncache | FQDN Cache Stats and Contents |
idns | Internal DNS Statistics |
dns | Dnsserver Statistics |
redirector | URL Redirector Stats |
basicauthenticator | Basic User Authenticator Stats |
digestauthenticator | Digest User Authenticator Stats |
ntlmauthenticator | NTLM User Authenticator Stats |
external_acl | External ACL Stats |
http_headers | HTTP Header Statistics |
via_headers | Via Request Headers |
forw_headers | X-Forwarded-For Request Headers |
menu | This Cache Manager Menu |
shutdown | Shut Down the Squid Process* |
offline_toggle | Toggle offline_mode Setting* |
info | General Runtime Information |
filedescriptors | Process File Descriptor Allocation |
objects | All Cache Objects |
vm_objects | In-Memory and In-Transit Objects |
openfd_objects | Objects with Swapout Files Open |
io | Server-Side Network read( ) Size Histograms |
counters | Traffic and Resource Counters |
peer_select | Peer Selection Algorithms |
digest_stats | Cache Digest and ICP Blob |
5min | 5 Minute Average of Counters |
60min | 60 Minute Average of Counters |
utilization | Cache Utilization |
histograms | Full Histogram Counts |
active_requests | Client-Side Active Requests |
store_digest | Store Digest |
storedir | Store Directory Stats |
store_check_cachable_stats | storeCheckCachable( ) Stats |
store_io | Store IO Interface Stats |
pconn | Persistent Connection Utilization Histograms |
refresh | Refresh Algorithm Statistics |
delay | Delay Pool Levels |
forward | Request Forwarding Statistics |
client_list | Cache Client List |
netdb | Network Measurement Database |
asndb | AS Number Database |
carp | CARP Information |
server_list | Peer Cache Statistics |
non_peers | List of Unknown Sites Sending ICP Messages |
leaks: Memory Leak Tracking
This page is available only with the ./configure
—enable-leakfinder option and is intended for
developers trying to track down memory leaks. The page shows each
memory pointer being tracked and where and when it was most recently
referenced. See the Squid Programmer’s Guide (http://www.squid-cache.org/Doc/Prog-Guide/)
for more information about Squid’s leak-finder feature.
mem: Memory Utilization
The memory utilization page shows a large table of numbers. Each row corresponds
to a different pool of memory. The pools have names like acl_list and MemObject. Much of this information is of
interest to developers only. However, a few columns are worth
mentioning here.
Tip
It is important to keep in mind that this table doesn’t represent all the memory allocated by Squid. Some memory allocations aren’t tracked and don’t appear in the table. Thus, the Total row may be much less than Squid’s actual memory usage.
The impact column shows
each pool’s contribution to the total amount of memory allocated.
Usually, the StoreEntry, MD5 digest, and LRU policy node pools take up most of the
memory.
If you are a developer, you can use this page to look for
memory leaks. The column labeled high (hrs) shows the amount of time elapsed
since the pool reached its maximum size. A small value in this
column may indicate that memory for that pool isn’t being freed
correctly.
You can also use this page to find out if certain features,
such as netdb, the
ipcache, and client_db
consume too much memory. For example, the ClientInfo pool is associated with the
client_db feature. The memory utilization page
shows you how much memory you can save if you disable
client_db in squid.conf.
cbdata: Callback Data Registry Contents
The Callback Data Registry is an internal Squid programming feature for managing memory pointers. Currently, this cache manager page doesn’t provide much useful information, apart from the number of active cbdata pointers being tracked. In earlier Squid versions, the cbdata feature was implemented differently and this page provided some information to developers debugging their code.
events: Event Queue
Squid maintains an event queue for a number of tasks that must occur separately from user requests. Perhaps the most important of these is the periodic task that maintains the disk cache size. Every second or so, this task runs and looks for cache files to remove. On this page, you can see all tasks currently scheduled for execution. Most likely, you’ll not find this very interesting unless you are hacking the source code.
squidaio_counts: Async IO Function Counters
This page is available only with the ./configure
—enable-storeio=aufs option. It shows counters for
the number of open, close, read, write, stat, and unlink requests
received. For example:
ASYNC IO Counters:
Operation       # Requests
open             15318822
close            15318813
cancel           15318813
write                   0
read             19237139
stat                    0
unlink            2484325
check_callback  311678364
queue                   0
The cancel counter is
normally equal to the close
counter. This is because the close function always calls the cancel
function to ensure that any pending I/O operations are
ignored.
The write counter is zero
because this version of Squid performs writes synchronously, even
for aufs.
The check_callback counter
shows how many times the main Squid process has checked the done
queue for completed operations.
The queue value indicates
the current length of the request queue. Normally, the queue length
should be less than the number of threads × 5. If you repeatedly
observe a queue length larger than this, you may be pushing Squid
too hard. Adding more threads may help, but only to a certain
point.
diskd: DISKD Stats
This page is available only with the ./configure
—enable-storeio=diskd option. It provides various
statistics relating to the diskd storage
scheme.
The sent_count and recv_count lines are counters for the
number of I/O requests sent between Squid and the group of
diskd processes. The two numbers should be very
close to each other and could possibly be equal. The difference
indicates how many requests are currently outstanding.
The max_away value
indicates the largest number of outstanding requests. Similarly, the
max_shmuse counter indicates the
maximum number of shared memory blocks in use at once. These two
values are reset (to zero) each time you request this page. Thus, if
you wait longer between requests for this page, these maximum
counters are likely to be larger.
The open_fail_queue_len
counter indicates the number of times that the
diskd code decided to return failure in
response to a request to open a file because the message queue
exceeded its configured limit. In other words, this is the number of
times a diskd queue reached the Q1 limit.
Similarly, block_queue_len shows
how many times the Q2 limit has been reached. See the descriptions
of Q1 and Q2 in Section
8.5.1.
The diskd page also shows how many
requests Squid sent to the diskd processes for
each of the six I/O operations: open, create, close, unlink, read,
and write. It also shows how many times each operation succeeded or
failed. Note, these counters are incremented only for requests sent.
The open_fail_queue_len check
occurs earlier, and in that case, Squid doesn’t send a request to a
diskd process.
config: Current Squid Configuration*
This option dumps Squid’s current configuration in the squid.conf format. Thus, if you ever
accidentally remove the configuration file, you can recover it from
the running Squid process. By saving the output to a file, you can
also compare (e.g., with the diff
command) the running configuration to the saved configuration. Note,
however, that comments and blank lines aren’t preserved.
This option reveals potentially sensitive information, so it’s available only with a password. You must add a cache manager password for the config option with the cachemgr_passwd directive. See Section 14.2.2 for specifics. Additionally, these cache manager passwords aren’t displayed in this output.
comm_incoming: comm_incoming( ) Stats
This page provides low-level network I/O information to developers and Squid
wizards. The loop that checks for activity on file descriptors is
called comm_poll( ). Over the
years, this function has become increasingly complicated in order to
improve Squid’s performance. One of those performance improvements
relates to how often Squid checks certain network sockets relative
to the others.
For example, the incoming HTTP socket is where Squid accepts new client connections. This socket tends to be busier than a normal data socket because each new connection comes through the incoming socket. To provide good performance, Squid makes an extra effort to check the incoming socket more frequently than the others.
At the top of the comm_incoming page, you’ll see three
incoming interval numbers: one each for ICP, DNS, and HTTP. The
interval is the number of normal I/O events that Squid handles
before checking the incoming socket again. For example, if incoming_dns_interval is set to 140, Squid
checks the incoming DNS socket after 140 I/Os on normal connections.
Unless your Squid is very busy, you’ll probably see 256 for all
incoming intervals.
The page also contains three histograms that show how many
events occur for each incoming function call. Normally, the majority
of the histogram counts occur in the low values. In other words,
functions such as comm_select_http_incoming( ) usually handle between one and
four events.
ipcache: IP Cache Stats and Contents
The IP cache contains cached results of hostname-to-address lookups. This cache manager page displays quite a lot of information. At the top of this page you’ll see a handful of statistics like these:
IPcache Entries: 10034
IPcache Requests: 1066445
IPcache Hits: 817880
IPcache Negative Hits: 6846
IPcache Misses: 200497
In this example, you can see that the IP cache contains slightly more than 10,000 entries (hostnames). Since Squid was started, there have been 1,066,445 name-to-address requests, 817,880 of which were cache hits. This is a cache hit ratio of 77%. An IP cache negative hit occurs when Squid receives a subsequent request for a hostname that it recently failed to resolve. Rather than retry the DNS lookup immediately, Squid assumes it will fail again and returns an error message to the user.
Following these brief statistics, you’ll see a long list of the IP cache contents. For each hostname in the cache, Squid prints six fields:
The hostname itself
Flags:
Nfor negatively cached entries andHif the addresses came from the local hosts file, rather than the DNSThe number of seconds since the hostname was last requested or used
The number of seconds until the cached entry expires
The number of IP addresses known for the host, and, in parentheses, the number of BAD addresses
A list of IP addresses and whether each is OK or BAD
Here is a short sample (formatted to fit the page):
 Hostname                        Flg lstref    TTL  N
 ads.x10.com                              9    110  1( 0)   63.211.210.20-OK
 us.rd.yahoo.com                        640   -340  4( 0) 216.136.232.150-OK
                                                          216.136.232.147-OK
                                                          216.136.232.149-OK
                                                          216.136.232.148-OK
 www.movielodge.com                    7143  -2161  1( 0)   66.250.223.36-OK
 shell.windows.com                    10865  -7447  2( 1)   207.46.226.48-BAD
                                                           207.46.248.237-OK
 www.surf3.net                       126810 -40415  1( 0)   212.74.112.95-OK
The list is sorted by the time since last reference. Recently referenced names are at the top of the list, and unused (about to be removed) names are at the bottom.
IP addresses are marked OK by default. An address is marked BAD when Squid receives an error or timeout during a TCP connection attempt. Subsequent IP cache requests don’t return BAD addresses. If all the host’s addresses become BAD, Squid resets them all back to OK.
fqdncache: FQDN Cache Stats and Contents
The FQDN cache is similar to the IP cache, except that it stores address-to-hostname lookups. Another difference is that the FQDN cache doesn’t mark hostnames as OK or BAD.
Your FQDN cache may be empty, unless you enable the log_fqdn directive, use domain-based ACLs (such as srcdomain, dstdomain, srcdom_regex, and dstdom_regex), or use a redirector.
idns: Internal DNS Statistics
Squid contains an internal DNS client implementation, which is enabled by default.
Disabling internal DNS with the
—disable-internal-dns option also disables this
page. Here is some sample output:
Internal DNS Statistics:

The Queue:
                       DELAY SINCE
  ID   SIZE SENDS FIRST SEND LAST SEND
------ ---- ----- ---------- ---------
001876   44     1      0.010     0.010
001875   44     1      0.010     0.010

Nameservers:
IP ADDRESS      # QUERIES # REPLIES
--------------- --------- ---------
192.168.19.124       4889      4844
192.168.19.190         91        51
192.168.10.2           73        39

Rcode Matrix:
RCODE ATTEMPT1 ATTEMPT2 ATTEMPT3
    0     6149        4        2
    1        0        0        0
    2       38       34       32
    3        0        0        0
    4        0        0        0
    5        0        0        0
The Internal DNS page contains three tables. First, you’ll see the queue of unanswered queries. Unfortunately, you can’t see the contents of the query (the hostname or IP address). Instead, Squid prints the ID, size, number of transmissions, and elapsed times for each query. You should see relatively few queries in the queue. If you see a lot relative to your total traffic rate, make sure your DNS servers are functioning properly.
The second table (Nameservers) shows how many queries have
been sent to, and replies received from, each DNS server. Squid
always queries the first server in the list first. Second (and
third, etc.) servers are queried only when the previous server times
out for a given query. If you see zero replies from the first
address, make sure a server is actually running at that
address.
Finally, you’ll see a table of DNS response codes versus
number of attempts. The cell for response code 0 and ATTEMPT1 should have the highest count.
Response code 0 indicates
success, while others are different types of errors (see RFC 1035
for their descriptions). You may see some smaller numbers for
response code 0 in the columns
for ATTEMPT2 and ATTEMPT3. This shows the cases when
retransmitting a query, after initially receiving an error, resulted
in a successful reply. Note that Squid retries only response code 2
(server failure) errors.
dns: Dnsserver Statistics
This cache manager page is available only when you use the
—disable-internal-dns option. In this case, Squid
uses a number of external dnsserver processes to perform DNS
lookups. The dnsserver program is
one of a number of helper processes Squid can use. The other types
of helpers are redirectors, authenticators, and external ACLs. All
Squid’s helpers have cache manager pages that display the same
statistics. For example:
Dnsserver Statistics:
number running: 5 of 5
requests sent: 3001
replies received: 3001
queue length: 0
avg service time: 23.10 msec

      #      FD     PID  # Requests     Flags      Time  Offset Request
      1       6   20110         128     AB        0.293       0 www.nlanr.net
      2       7   20111          45     A         0.000       0 (none)
      3       8   20112           4     A         0.000       0 (none)
      4       9   20113           0     A         0.000       0 (none)
      5      10   20114           0     A         0.000       0 (none)
The number running line shows how many helper
processes are running and how many should be running. The
dns_children directive specifies how many
dnsserver processes to use. The
two numbers should match, but they may not if a helper process dies
unexpectedly or if some processes could not be started. Recall that
when you reconfigure a running Squid instance, all the helpers are
killed and restarted. See the discussion in Appendix A.
The requests sent and
replies received values display
the number of requests sent to (and responses received from) the
helpers since Squid started. The difference between these two, if
any, should correspond to the number of outstanding requests.
The queue length line shows
how many requests are queued, waiting for one of the helpers to
become free. The queue length should usually be zero. If not, you
should add more helpers to reduce delays for your users.
The avg service time line
shows the running average service time for all helpers. Your
particular value may depend on numerous factors, such as your
network bandwidth and processing power.
The next section displays a table of statistics for the
running dnsserver processes. The
FD column shows the file
descriptor for the socket between Squid and each dnsserver process. Similarly, the PID column shows each helper’s process ID
number.
The # Requests column shows
how many requests have been sent to each helper. These numbers are
zeroed each time you reconfigure Squid, so they many not add up to
the total number of requests sent, as shown earlier. Note that Squid
always chooses the first idle helper in the list, so the first
process should receive the largest number of requests. The last few
processes may not receive any requests at all.
The Flags column shows a
few flags describing the state of the helper process. You should
normally see A (for Alive) in
each column. Occasionally, when the helper process is handling a
request, you’ll see B (for
Busy).
The Time column displays
the amount of time elapsed (in seconds) for the current, or last,
request. Offset shows how many
bytes of the response message Squid has read on the socket. This is
almost always zero. Finally, the Request column shows the request that was
sent to the helper process. In this case, it is either a hostname or
an IP address.
redirector: URL Redirector Stats
The Redirector Stats page is available only if you are using a redirector (see Chapter 11). The format of this page is identical to Dnsserver Statistics, described earlier.
basicauthenticator: Basic User Authenticator Stats
This page is available only w ith the ./configure
—enable-auth=basic option and when you define a
Basic authenticator with the auth_param basic
program directive. The format of this page is identical
to Dnsserver Statistics, described
earlier.
digestauthenticator: Digest User Authenticator Stats
This page is available only with the ./configure
—enable-auth=digest option and when you define a
Digest authenticator with the auth_param digest
program directive. The format of this page is identical
to Dnsserver Statistics, described
earlier.
ntlmauthenticator: NTLM User Authenticator Stats
This page is available only with the ./configure
—enable-auth=ntlm option and when you define a NTLM
authenticator with then auth_param ntlm program
directive. The format of this page is similar to Dnsserver
Statistics, described earlier, with a few
additions.
The table of helper processes includes an extra column:
# Deferred Requests. NTLM
requires “stateful” helpers because the helper processes themselves
generate the challenges. Squid receives a challenge from a helper,
sends that challenge to a user, and receives a response. Squid must
send the user’s challenge response back to the same helper for
validation. For this protocol to work, Squid must defer some
messages to be sent to a helper until the helper is ready to accept
them.
These helpers also have two new flags: R (reserved or deferred) and P (placeholder). The R flag is set when the helper has at least
one deferred request waiting. The P flag is set when Squid is waiting for
the NTLM helper to generate a new challenge token.
external_acl: External ACL Stats
This page displays helper statistics for your external ACLs. If you don’t have any external_acl_type lines in squid.conf, this page will be empty. Otherwise, Squid displays the statistics for each external ACL. The format is the same as for the Dnsserver Statistics.
http_headers: HTTP Header Statistics
This page displays a number of tables containing statistics about HTTP headers. It contains up to four sections: HTCP reply stats (if HTCP is enabled), HTTP request stats, HTTP reply stats, and a final section called HTTP Fields Stats. The HTCP reply statistics refer to HTCP replies received by your cache. The HTTP request section refers to HTTP requests either sent or received by your cache. Similarly, the HTTP reply section refers to replies either sent or received by Squid.
The first three sections have the same format. Each section contains three tables: Field type distribution, Cache-control directives distribution, and Number of fields per header distribution.
The Field type distribution table shows the number of times
that each header value occurs and the percentage of cases in which
it occurs. For example, in Table 14-2 you can see that
the Accept header occurs in 98%
of HTTP requests.
ID | Name | Count | #/header |
0 | | 1416268 | 0.98 |
1 | | 322077 | 0.22 |
2 | | 709715 | 0.49 |
3 | | 1334736 | 0.92 |
... | ... | ... | ... |
Unfortunately, these (and the following) statistics are tricky
because they don’t correspond one-to-one for client requests. For
example, Squid may report 1,416,268 Accept headers in requests but only
800,542 client requests. This happens because Squid creates more
than one HTTP header data structure for each request. In the case of
HTTP replies, it seems that Squid may create up to four separate
header structures, depending on the circumstances.
The Cache-Control
directives distribution is similar, but applies only to the values
of the Cache-Control header.
Table 14-3 shows some of
the possible field values.
ID | Name | Count | #/cc_field |
0 | | 6866 | 0.02 |
1 | | 69783 | 0.24 |
2 | | 78252 | 0.27 |
3 | | 9878 | 0.03 |
4 | | 168 | 0.00 |
5 | | 10983 | 0.04 |
6 | | 2480 | 0.01 |
7 | | 165034 | 0.56 |
8 | | 4995 | 0.02 |
9 | | 0 | 0.00 |
10 | | 0 | 0.00 |
11 | | 9149 | 0.03 |
The Number of fields per header distribution table shows how many headers
occur in each request or reply. Usually, you should see something
like a normal distribution with a peak around 10-13 headers per
request or response.
Finally, this page ends with a table labeled Http Fields Stats (replies and requests). For each header, this table
shows three values: #alive,
%err, and %repeat.
The #alive column shows how
many instances of this header are currently stored in memory. HTTP
headers are kept in memory for both active requests/responses and
for completed objects stored in the memory cache.
The %err column shows the
percentage of times Squid encountered an error while parsing this
header. Common errors include incorrect date formats for Date, Expires, Last-Modified, and similar headers. The
value -1 indicates no
errors.
The %repeat column
indicates the number of times that a particular header is repeated
in a single request or response. These aren’t errors because HTTP
allows headers to be repeated.
via_headers: Via Request Headers
This page is available only with the ./configure
—enable-forw-via-db option. The information in this
page is intended to help cache administrators understand where
client requests come from. When enabled, Squid counts the number of
times each unique Via header
occurs in client requests.
The Via header contains a
list of downstream proxies that have forwarded the request so far.
When a proxy forwards a request, it should append its hostname and
other identifying information to the Via header. With the information in this
database, you can, in theory, reconstruct the hierarchy of proxies
forwarding requests through yours.
Squid prints the Via
database entries in a random order. The output may look something
like this:
   4 1.0 proxy.firekitten.org:3128 (squid/2.5.STABLE1)
   1 1.0 xnsproxy.dyndns.org:3128 (squid/2.5.PRE3-20020125)
1751 1.0 nt04.rmtcc.cc.oh.us:3128 (Squid/2.4.STABLE6),
         1.0 tasksmart.rmtcc.cc.oh.us:3128 (Squid/2.4.STABLE7)
 137 1.0 reg3.bdg.telco.co.id:8080 (Squid/2.2.STABLE5),
         1.0 c1.telco.co.id:8080 (Squid/2.4.STABLE6),
         1.0 cache2.telco.co.id:8080 (Squid/2.4.STABLE1)
  53 1.0 IS_GW_312:3128 (Squid/2.4.STABLE6)
  60 1.0 proxy.kiltron.net:3128 (Squid/2.4.STABLE7)
 815 1.1 DORM
In this example, Squid received 1751 requests that previously
passed through two other proxies (nt04 and
tasksmart). Note that only proxies add a
Via header. Requests from
user-agents usually don’t have the header and, therefore, aren’t
counted in this database.
As you can see, the Via
headers reveal some semiprivate information, such as hostnames, port
numbers, and software versions. Please take care to respect the
privacy of your users if you enable this feature.
The Via database is stored
entirely in memory and is lost if Squid restarts. The database is
cleared whenever you rotate the log files (see Section 13.7).
forw_headers: X-Forwarded-For Request Headers
This page is available only with the ./configure
—enable-forw-via-db option. It is similar to the
via_headers page, except that it displays the
accumulation of X-Forwarded-For
headers.
X-Forwarded-For is a
nonstandard HTTP header that originated with the Squid project. Its
value is a list of client IP addresses. In other words, when Squid
receives and forwards a request, it appends the client’s IP address
to this header. It is similar to Via because the header grows each time a
proxy passes the request on towards the origin server.
The forw_headers output is similar to
via_headers. Each line begins with an integer,
followed by a header value. The integer indicates how many times
that particular X-Forwarded-For
value was received. For example:
  1 10.37.1.56, 10.1.83.8
  3 10.3.33.77, 10.1.83.8
569 116.120.203.54
 21 10.65.18.200, 10.1.83.120
 31 116.120.204.6
  5 10.1.92.7, 10.1.83.120
  1 10.3.65.122, 10.3.1.201, 10.1.83.8
  2 10.73.73.51, 10.1.83.120
  1 10.1.68.141, 10.1.83.8
  3 10.1.92.7, 10.1.83.122
As with via_headers, this database is also stored in memory and is lost if Squid exits. The database is cleared each time you rotate Squid’s log files.
menu: This Cache Manager Menu
This page simply displays a listing of the other cache manager pages. You can use it if you forget the name of a page or if you want to know if certain optional pages are available. When using cachemgr.cgi, each item in the menu is a clickable link.
shutdown: Shut Down the Squid Process*
This is one of the few cache manager functions that doesn’t simply display some information. Rather, this “page” allows you to shut down Squid remotely. To allow shutdown via the cache manager, you must assign it a password with the cachemgr_passwd (see Section 14.2.2) directive in squid.conf. Without a password, the shutdown operation is disabled (but you can still use squid -k shutdown).
Because the cache manager has very weak security—passwords are sent in cleartext—I don’t recommend enabling this operation.
offline_toggle: Toggle offline_mode Setting*
This is another function that allows you to control Squid, rather than simply receive information. It also requires a password (see Section 14.2.2) in order to become active.
Each time you request this page, Squid toggles the offline_mode setting. Squid reports the new setting on your screen and in cache.log.
info: General Runtime Information
This page provides a lot of basic information about the way that Squid is operating. It is a good starting point for using the cache manager and for tracking down performance problems.
At the top, you’ll see the release version (e.g., Version 2.5.STABLE4) and two timestamps: the starting and current times. For example:
Squid Object Cache: Version 2.5.STABLE4
Start Time:     Mon, 22 Sep 2003 03:10:37 GMT
Current Time:   Mon, 13 Oct 2003 10:25:16 GMT
Following that, you’ll see seven different sections. The first
section, Connection information, displays a few statistics
about the number and rate of connections, and the number of cache
clients:
Connection information for squid:
        Number of clients accessing cache:      386
        Number of HTTP requests received:       12997469
        Number of ICP messages received:        16302149
        Number of ICP messages sent:    16310714
        Number of queued ICP replies:   0
        Request failure ratio:   0.00
        Average HTTP requests per minute since start:   423.7
        Average ICP messages per minute since start:    1063.2
        Select loop called: 400027445 times, 4.601 ms avg
Number of clients accessing cacheHere, “client” actually means IP address. Squid assumes that each client has a unique IP address.
Number of HTTP requests
              received
The total number of HTTP requests since Squid was started.
Number of ICP messages
              received
The total number of ICP messages received since Squid was started. Note, received messages includes both queries and responses. These values don’t include HTCP messages, however.
Number of ICP messages
              sent
The total number of ICP messages sent since Squid was started. Note, received messages includes both queries and responses. Doesn’t include HTCP messages. Most likely, your sent and received counts will be about the same.
Number of queued ICP
              replies
ICP messages are sent over UDP. The
sendto( )system call rarely fails, but if it does, Squid queues the ICP message for retransmission. This counter shows how many times an ICP message was queued for retransmission. Most likely, you’ll see0here.Request failure ratioThe failure ratio is a moving average ratio between the number of failed and successful requests. In this context, a failed request is caused by either a DNS error, TCP connection error, or network read error. When this ratio exceeds 1.0—meaning Squid returns more errors than successful responses— Squid goes into hit-only mode. In this mode, Squid returns
ICP_MISS_NOFETCHinstead ofICP_MISS. Thus, your neighbor caches that use ICP won’t forward cache misses to you until the problem goes away.Average HTTP requests per minute since startThis value is simply the number of HTTP requests divided by the amount of time Squid has been running. This average doesn’t reflect short-term variations in load. To get a better instantaneous load measurement, use the 5min or 60min page.
Average ICP messages per minute
              since start
The number of ICP queries received by Squid divided by the amount of time that it has been running.
Select loop
              called
This number is probably meaningful only to Squid developers. It represents the number of times the
select( )(orpoll( )) function has been called and the average time between calls. During normal operation, the time between calls should be in the 1-100 millisecond range.
The Cache information section displays hit ratio and
cache size statistics:
Cache information for squid:
        Request Hit Ratios:     5min: 22.6%, 60min: 25.8%
        Byte Hit Ratios:        5min: 24.6%, 60min: 38.7%
        Request Memory Hit Ratios:      5min: 0.7%, 60min: 1.4%
        Request Disk Hit Ratios:        5min: 6.0%, 60min: 12.4%
        Storage Swap size:      41457489 KB
        Storage Mem size:       10180 KB
        Mean Object Size:       14.43 KB
        Requests given to unlinkd:      0
Request Hit RatiosHere, and on subsequent lines, you’ll see two hit ratio numbers: one for the last five minutes, and one for the last hour. These values are simply the percentage of HTTP requests that result in a cache hit. Here, hits include cases in which Squid validates a cached response and receives a 304 (Not Modified) reply.
Byte Hit RatiosSquid calculates byte hit ratio by comparing the number of bytes received from origin servers (or neighbors) to the number of bytes sent to clients. When received bytes are less than sent bytes, the byte hit ratio is positive. However, it is possible to see a negative byte hit ratio. This might occur, for example, if you have a lot of clients that abort their request before receiving the entire response.
Request Memory Hit
              Ratios
These values represent the percentage of all cache hits that were served from memory. Or, more accurately, the percentage of all hits (not requests!) logged as
TCP_MEM_HIT.Request Disk Hit RatiosSimilarly, these values represent the percentage of “plain” cache hits served from disk. In particular, these values are the percentage of all hits logged as
TCP_HIT. You’ll see that the memory and disk hit percentages don’t add up to 100%. This is because the other cases (such asTCP_IMS_HIT, etc.) aren’t included in either disk or memory hits.Storage Swap sizeThe amount of data currently cached on disk. It is always expressed in kilobytes. To compensate for space wasted in partial blocks at the end of files, Squid rounds up file sizes to the nearest filesystem block size.
Storage Mem sizeThe amount of data currently cached in memory. It is always expressed in kilobytes and is always a multiple of Squid’s memory page size: 4 KB.
Mean Object SizeSimply the storage swap size divided by the number of cached objects. You should set the configuration directive store_avg_object_size close to the actual value reported here. Squid uses the configured value for a number of internal estimates.
Requests given to
              unlinkd
The unlinkd process handles file deletion external to Squid (depending on your configuration). This value simply shows how many files Squid has asked unlinkd to remove. It is zero when unlinkd isn’t used.
The Median Service Times section displays the median of
various service time (or response time) distributions. You’ll see a
value for the last five minutes and for the last hour. All values
are in seconds. Squid uses the median, rather than the mean, because
these distributions often have heavy tails that can significantly
skew the mean value. The output looks like this:
Median Service Times (seconds)  5 min    60 min:
        HTTP Requests (All):   0.19742  0.15048
        Cache Misses:          0.22004  0.17711
        Cache Hits:            0.05951  0.04047
        Near Hits:             0.37825  0.14252
        Not-Modified Replies:  0.01309  0.01387
        DNS Lookups:           0.05078  0.03223
        ICP Queries:           0.00000  0.07487
HTTP Requests (All)These are the median response times for all HTTP requests taken together. For an HTTP request, the timer starts as soon as Squid receives the request and ends when Squid writes the last byte of the response. Thus, this time also includes DNS lookups (if any), and ICP queries to upstream neighbors (if you have them) for cache misses.
Cache MissesThis line shows the response time for cache misses only. Unless your cache hit ratio is close to 50%, the cache miss response time is close to (but a little larger than) the overall response time.
Cache HitsThe cache hit response time includes only requests logged as
TCP_HIT,TCP_MEM_HIT, andTCP_OFFLINE_HIT. These are unvalidated cache hits served directly from Squid, without any communication to the origin server. Thus, your cache hit response time should be significantly less than the miss time. You should keep track of this value over time; if it climbs too high, your disk filesystem may be a performance bottleneck.Near HitsA near hit is a validated cache hit. It corresponds to
TCP_REFRESH_HITin access.log. For these, Squid contacts the origin server (or parent cache), which adds some latency to the response time. The server’s response is a small 304 (Not Modified) message. Thus, the near hit response time is typically in between cache hits and cache misses.Not-Modified RepliesThis line shows the response times for requests logged as
TCP_IMS_HIT. This occurs when the client sends a conditional (a.k.a. validation) request, and Squid serves a response without contacting the origin server. The name “not-modified” is somewhat misleading for this category because the status code received by the client isn’t necessarily 304. For example, the client may send an If-modified-since request, and Squid has a fresh, cached response with a more recent modification time. Squid knows that its response is fresh and that the client’s copy is stale. In this case, the client receives a 200 (OK) reply with the new object data.DNS LookupsThe DNS service time shows how long it takes, on average, to query the DNS. This includes both name-to-address and address-to-name lookups. It doesn’t include IP- and FQDN-cache hits, however. DNS queries can be a significant source of latency. If you experience performance problems with Squid, be sure to check this value. If you see a high median service time (i.e., around five seconds), make sure your primary DNS server (usually listed in /etc/resolv.conf) is up and running.
ICP QueriesThe ICP query time represents the elapsed time between an ICP query and response that causes Squid to select the corresponding neighbor as the next hop. Thus, it includes only requests logged as
PARENT_HIT,SIBLING_HIT,FIRST_PARENT_MISS, andCLOSEST_PARENT_MISS. This value may not be a good estimate of the overall ICP response time because ICP query/response transactions that don’t result in Squid selecting a neighbor are ignored. Due to a bug in Squid Versions 2.5.STABLE1 and earlier, ICP response time statistics aren’t collected, and these values always appear as0.
The Resource usage section includes a few statistics
relating to CPU and memory usage:
Resource usage for squid:
        UP Time:        1840478.681 seconds
        CPU Time:       70571.874 seconds
        CPU Usage:      3.83%
        CPU Usage, 5 minute avg:        1.33%
        CPU Usage, 60 minute avg:       4.41%
        Process Data Segment Size via sbrk( ): 342739 KB
        Maximum Resident Size: 345612 KB
        Page faults with physical i/o: 65375
UP TimeThis line simply shows the amount of time this Squid process has been running. It is expressed in seconds.
CPU TimeThe amount of CPU time used by Squid, also in seconds. This value comes from the
getrusage( )system call, which might not be available on all operating systems.CPU UsageThis section has three CPU Usage lines. The first is the CPU Time value divided by the UP Time value. It is a long-term average CPU usage measurement. The next two lines show the CPU usage for the last five minutes and the last hour.
Process Data Segment Size via
              sbrk( )
This line offers an estimate of Squid’s process size.
sbrk( )is a low-level system call used by the memory allocation library (malloc( )). Thesbrk( )technique provides only an estimate, which usually differs from values reported by programs such as ps and top. When thesbrk( )value is greater than theMaximum Resident Size(discussed next), the Squid process is probably page faulting, and performance may be degrading.Maximum Resident SizeThis is another estimate of memory usage and process size. The maximum resident set size (RSS) value comes from the
getrusage( )system call. Although the definition of RSS may vary between operating systems, you can think of it as the maximum amount of physical memory used by the process at any one time. Squid’s process size may be larger than the RSS, in which case some parts of the process are actually swapped to disk.Page faults with physical i/oThis value also comes from
getrusage( ). A page fault occurs when the operating system must read a page of the process’s memory from disk. This usually happens when the Squid process becomes too large to fit entirely in memory, or when the system has other programs competing for memory. Squid’s performance suffers significantly when page faults occur. You probably won’t notice any problems as long as the page-faults rate is an order of magnitude lower than the HTTP request rate.
You’ll see a section called Memory
usage for squid via mstats( ) if your system has the
mstats( ) function. In particular,
you’ll have this function if the GNU malloc library (libgnumalloc.a) is installed. Squid
reports two statistics from mstats( ):
Memory usage for squid via mstats( ):
Total space in arena: 415116 KB
Total free: 129649 KB 31%Total space in arenaThis represents the total amount of memory allocated to the process. It may be similar to the value reported by
sbrk( ). Note that this value only increases over time.Total freeThis represents the amount of memory allocated to the process but not currently in use by Squid. For example, if Squid frees up some memory, it goes into this category. Squid can later reuse that memory, perhaps for a different data structure, without increasing the process size. This value fluctuates up and down over time.
The Memory accounted for section contains a few tidbits about
Squid’s internal memory management techniques:
Memory accounted for:
        Total accounted:       228155 KB
        memPoolAlloc calls: 2282058666
        memPoolFree calls: 2273301305
Total accountedSquid keeps track of some, but not nearly all, of the memory allocated to it. This value represents the total size of all data structures accounted for. Unfortunately, it is typically only about two-thirds of the actual memory usage. Squid uses a significant amount of memory in ways that make it difficult to track properly.
memPoolAlloc
              calls
memPoolAlloc( )is the function through which Squid allocates many fixed-size data structures. This line shows how many times that function has been called.memPoolFree callsmemPoolFree( )is the companion function through which Squid frees memory allocated withmemPoolAlloc( ). In a steady-state condition, the two values should increase at the same rate and their difference should be roughly constant over time. If not, the code may contain a bug that frees pooled memory back to themalloclibrary.
The File descriptor usage section shows how many file
descriptors are available to Squid and how many are in use:
File descriptor usage for squid:
        Maximum number of file descriptors:   7372
        Largest file desc currently in use:    151
        Number of file desc currently in use:  105
        Files queued for open:                   0
        Available number of file descriptors: 7267
        Reserved number of file descriptors:   100
        Store Disk files open:                   0
Maximum number of file descriptorsThis is the limit on open file descriptors for the squid process. This should be the same value reported by ./configure when you compiled Squid. If you don’t see at least 1024 here, you should probably go back and recompile Squid after reading Section 3.3.1.
Largest file desc currently in
              use
This is the highest file descriptor currently open. Its value isn’t particularly important but should be within 15-20% of the next line (number currently in use). This value is more useful for developers because it corresponds to the first argument of the
select( )system call.Number of file desc currently in useThe number of currently open descriptors is an important performance metric. In general, Squid’s performance decreases as the number of open descriptors increases. The kernel must work harder to scan the larger set of descriptors for activity. Meanwhile, each file descriptor waits longer (on average) to be serviced.
Files queued for
              open
This value will always be zero, unless you are using the aufs storage scheme (see Section 8.4). It shows how many file-open requests have been dispatched to the thread processes but have not yet returned. aufs is the only storage scheme in which disk file descriptors are opened asynchronously.[2]
Available number of file
              descriptors
The number of available descriptors is the maximum, minus the number currently open and the number queued for open. It represents the amount of breathing room Squid has to handle more load. When the available number gets close to the reserved number (next line), Squid stops accepting new connections so that existing transactions continue receiving service.
Reserved number of file
              descriptors
The number of reserved file descriptors starts out at the lesser of 100 or 25% of the maximum. Squid refuses new client connections if the number of available (free) descriptors reaches this limit. It is increased if Squid encounters an error while trying to create a new TCP socket. In this case, you’ll see a message in cache.log:
Reserved FD adjusted from 100 to 150 due to failures
Store Disk files
              open
This counter shows the number of disk files currently open for reading or writing. It is always zero if you are using the diskd storage scheme because disk files are opened by the diskd processes, rather than Squid itself. If you use the max_open_disk_fds directive in squid.conf, Squid stops opening more cache files for reading or writing when it reaches that limit. If your filesystem is a bottleneck, this is a simple way to sacrifice a few cache hits for stable performance.
The Internal Data
Structures section gives a quick overview of how many
objects are in the cache and how many are on disk or in memory. You
can find more detail about Squid’s data structure allocations in the
mem page (see Section 14.2.1.2). This
section has a few stats:
Internal Data Structures:
2873586 StoreEntries
1336 StoreEntries with MemObjects
1302 Hot Object Cache Items
2873375 on-disk objectsStoreEntriesThis represents the number of objects cached by Squid. Each object in the cache uses one
StoreEntrystructure.StoreEntries with MemObjectsMemObjectis the data structure used for objects currently being requested and for objects stored in the memory cache.Hot Object Cache ItemsThe
HotObjectCacheis another name for the memory cache (see Appendix B). These objects are stored entirely in memory (as well as on disk). This number should always be less than the number of entries withMemObjects.on-disk objectsThis counter shows how many objects are currently stored on disk. The counter is incremented when the entire object has been successfully written. Thus, this number isn’t necessarily equal to the number of
StoreEntriesminus the number ofHotObjects.
filedescriptors: Process File Descriptor Allocation
This page displays a table of all file descriptors currently opened by Squid. It looks like this:
File Type   Tout Nread  * Nwrite * Remote Address    Description
---- ------ ---- -------- -------- ----------------- ------------------------------
   3 File      0       0        0                    /usr/local/squid/logs/cache.log
   6 File      0       0  2083739                    /usr/local/squid/logs/access.log
  12 Pipe      0       0        0                    unlinkd -> squid
  13 File      0       0  2485913                    /usr/local/squid/logs/store.log
  15 Pipe      0       0        0                    squid -> unlinkd
  16 Socket   24  220853*    1924  65.200.216.110.80 http://downloads.mp3.com/
  18 Pipe      0       0        0                    squid -> diskd
  19 Socket  179     476*    1747  202.59.16.30.4171 http://ads.vesperexchange.com/
  21 Pipe      0       0        0                    squid -> diskd
  22 Socket   20  158783*     998  210.222.20.8.80   http://home.hanmir.com/a
  24 Pipe      0       0        0                    squid -> diskd
  25 Socket    1       0        0* 210.222.20.8.80   http://home.hanmir.com/b
  26 Socket    0 9048307* 1578290  .0                DNS Socket
  27 Pipe      0       0        0                    squid -> diskd
  28 Socket    0       0        0* 66.28.234.77.80   http://updates.hotbar.com/
  29 Socket    0       0*       0  .0                HTTP Socket
  30 Pipe      0       0        0                    squid -> diskd
  31 Socket    0      93     1126  127.0.0.1.3434    ncsa_auth #1
  32 Socket    0       3       31  127.0.0.1.3438    ncsa_auth #3
  33 Socket    0       0        0  127.0.0.1.3440    ncsa_auth #4
  34 Socket  164    8835* 1070222* 212.47.19.52.2201 http://www.eyyubyaqubov.com/
  35 Socket  177    6137*  249899* 212.47.19.25.3044 http://files10.rarlab.com/
  36 Socket    0       0        0  127.0.0.1.3442    ncsa_auth #5
  37 Socket    7  158783*     774  210.222.20.8.80   http://home.hanmir.com/c
  38 Socket  166    1000*  148415* 202.17.13.8.5787  http://home.hanmir.com/d
The table has seven columns:
FileThis is simply the file descriptor number. The list always starts with 3 because descriptors 0, 1, and 2 are reserved for stdin, stdout, and stderr. Any other gaps in the list represent closed descriptors.
TypeThe type field contains one of the following values: File, Pipe, or Socket. The File type is used both for files storing cached responses and for log files, such as cache.log and access.log. The Pipe type represents kernel pipes used for interprocess communication. The Socket type is also occasionally used for interprocess communication, but it’s mostly used for HTTP (and FTP) connections to clients and servers.
ToutThis is the general-purpose timeout value for the descriptor. It is expressed in minutes. Files and Pipes usually don’t have a timeout, so this value is zero. For Sockets, however, if this number of minutes go by without any activity on the descriptor, Squid calls a timeout function.
NreadThis is where Squid reports the number of bytes read from the descriptor. An asterisk (*) after the number means Squid has a function (a read handler) registered to read additional data, if there is some available.
NwriteThis column shows the number of bytes written to the descriptor. Again, the asterisk (*) indicates that a write handler is present for the descriptor. You can usually tell if a given socket is connected to a client or to a server by comparing the number of bytes read and written. Because requests are normally smaller than responses, a server connection has a higher
Nreadcount thanNwrite. The opposite is true for client connections.Remote AddressFor Sockets, this field shows the remote TCP address of the connection. The format is similar to what you would find in netstat -n output: an IP address followed by the TCP port number.
DescriptionThe description field indicates the descriptor’s use. For Files, you’ll see a pathname; for Pipes, a description to what the pipe is connected; and for Sockets, a URI, or at least the first part of it. A description such as
web.icq.comidleconnectionindicates an idle persistent connection to an origin server. Similarly,Waitingfornextrequestis an idle client-side persistent connection.
By default, the File Descriptor page isn’t password-protected. However, you may want to give it a password because it contains some sensitive and, perhaps, personally identifiable information.
objects: All Cache Objects
Requesting this page results in a list of all objects in the cache. Be careful with this page because it can be extremely long. Furthermore, it contains low-level information that is probably useful only to developers.
For each cached object, Squid prints a sequence of lines, most of which look like this:
KEY FF1F6736BCC167A4C3F93275A126C5F5
        STORE_OK      NOT_IN_MEMORY SWAPOUT_DONE PING_NONE
        CACHABLE,DISPATCHED,VALIDATED
        LV:1020824321 LU:1020824671 LM:1020821288 EX:-1
        0 locks, 0 clients, 1 refs
        Swap Dir 0, File 0X010AEE
The first line shows the cache key—a 128-bit MD5 checksum of the URI. The same MD5 checksum appears in store.log and in the metadata at the beginning of each response cached on disk.
The second line shows four state variables of the StoreEntry data structure:
store_status, mem_status,
swap_status, and
ping_status. Refer to the Squid source code if
you’d like more information about them.
The third line is a list of the StoreEntry flags that are set. Search the
source code for e->flags for more
information.
The fourth line shows the values of four timestamps: last-validation, last-use, last-modification, and expiration. The last-modification and expiration timestamps are taken from the origin server’s HTTP response. The others are maintained by Squid.
The fifth line shows a few counters: locks, clients, and
references. An entry with locks can’t be removed. The clients counter shows how many clients are
currently receiving data for this object. The refs counter shows how many times the
object has been requested.
The sixth line shows the object’s index to the on-disk storage. Each object has a 7-bit swap directory index and a 25-bit file number. Each storage scheme has a function to map these numbers into pathnames.
vm_objects: In-Memory and In-Transit Objects
This page is similar to All Cache Objects, except that it displays only objects that have a
MemObject data structure. In
other words, objects that are currently being requested or are
stored in the memory cache. These objects are displayed like
this:
KEY 5107D49BA7F9C6BA9559E006D6DDC4B2
        GET http://www.rpgplanet.com/ac2hq/cartography/dynamic/LinvakMassif.jpg
        STORE_PENDING NOT_IN_MEMORY SWAPOUT_WRITING PING_DONE
        CACHABLE,DISPATCHED,VALIDATED
        LV:1043286120 LU:1043286122 LM:1036015230 EX:-1
        4 locks, 1 clients, 1 refs
        Swap Dir 1, File 00X31BD9
        inmem_lo: 184784
        inmem_hi: 229840
        swapout: 229376 bytes queued
        swapout: 229509 bytes written
        Client #0, 1533a1018
                copy_offset: 217552
                seen_offset: 217552
                copy_size: 4096
                flags:
As you can see, many of the lines are the same. However, the in-memory objects have a few additional lines. Directly following the cache key (MD5 checksum), Squid prints the request method and URI.
The inmem_lo and inmem_hi lines are byte offsets of the
HTTP reply. They indicate the section of object data currently in
memory. In most cases, the difference between these two should be
less than the value of the
maximum_object_size_in_memory directive.
The swapout: bytes queued line shows the offset for how many
bytes have been given to the storage layer for writing. For objects
in the SWAPOUT_DONE state, this
value is the same as the object size. If the state is SWAPOUT_WRITING, Squid also shows the
bytes written line, which
indicates how many bytes have been successfully stored on
disk.
If one or more clients are currently receiving the response,
you’ll see a section for each of them (Client #0 in this example). For each
client, Squid reports another pair of offset values. The first,
copy_offset, is the starting
point for the last time the client-side asked for data from the
storage system. The second, seen_offset, is the point at which the
response data has been sent to the client. Note that copy_offset is always greater than or
equal to seen_offset. The
copy_size indicates the maximum
amount of data the client can receive from the storage
system.
openfd_objects: Objects with Swapout Files Open
The format of this page is the same as for In-Memory and In-Transit Objects. The
objects reported on this page should all be in the SWAPOUT_WRITING state. The page is
primarily useful to developers when trying to track down
file-descriptor leaks.
io: Server-Side Network read( ) Size Histograms
This page displays a histogram for each of the following four server-side protocols:
HTTP, FTP, Gopher, and WAIS. The histograms show how many bytes each
read( ) call received. The information
is primarily useful to developers for tuning buffer sizes and other
aspects of the source code.
The bins of the histogram are logarithmic to accommodate the large scale of read sizes. Here is an example:
HTTP I/O
number of reads: 9016088
Read Histogram:
    1-    1:      3082  0%
    2-    2:       583  0%
    3-    4:       905  0%
    5-    8:      2666  0%
    9-   16:     16690  0%
   17-   32:     88046  1%
   33-   64:     19712  0%
   65-  128:    116655  1%
  129-  256:    749259  8%
  257-  512:    633075  7%
  513- 1024:    903145 10%
 1025- 2048:   3664862 41%
 2049- 4096:   1643747 18%
 4097- 8192:    789796  9%
 8193-16384:     99476  1%
16385-32768:     30059  0%
In this case, you can see that the bin for 1025-2048 bytes is the most popular. When reading from an HTTP server, Squid got between 1025 and 2048 bytes per read 41% of the time.
counters: Traffic and Resource Counters
Squid maintains a data structure of counters. Actually, it is an array of counters. Squid shifts the array every 60 seconds and calculates 1-, 5-, and 60-minute averages from this array. This page is simply a dump of the current counter values in a format more suitable for computer processing than for reading by humans. The counters are as follows:
sample_timeThe sample time is actually the time of the last shift, rather than the current time. The sample time is always within 60 seconds of the current time.
client_http.requestsThe number of HTTP requests received from clients.
client_http.hitsThe number of cache hits in response to client requests. A hit is any transaction logged with one of the
TCP_HITcodes in access.log.client_http.errorsThe number of client transactions that resulted in an error.
client_http.kbytes_inThe amount of traffic (in kilobytes) received from clients in their requests. This is measured at the HTTP layer and doesn’t include TCP, IP, and other packet headers.
client_http.kbytes_outThe amount of traffic (in kilobytes) sent to clients in responses. Also measured at the HTTP layer.
client_http.hit_kbytes_outThe amount of traffic sent to clients in responses that are cache hits. Keep in mind that some cache hits are 304 (Not Modified) responses.
server.all.requestsThe number of requests forwarded to origin servers (or neighbor caches) for all server-side protocols (HTTP, FTP, Gopher, etc.).
server.all.errorsThe number of server-side requests (all protocols) that resulted in some kind of error.
server.all.kbytes_inThe amount of traffic (in kilobytes) read from the server-side for all protocols.
server.all.kbytes_outThe amount of traffic written to origin servers and/or neighbor caches for server-side requests.
server.http.requestsThe number of server-side requests to HTTP servers, including neighbor caches.
server.http.errorsThe number of server-side HTTP requests that resulted in an error.
server.http.kbytes_inThe amount of traffic read from HTTP origin servers and neighbor caches.
server.http.kbytes_outThe amount of traffic written to HTTP origin servers and neighbor caches.
server.ftp.requestsThe number of requests sent to FTP servers.
server.ftp.errorsThe number of requests sent to FTP servers that resulted in an error.
server.ftp.kbytes_inThe amount of traffic read from FTP servers, including control channel traffic.
server.ftp.kbytes_outThe amount of traffic written to FTP servers, including control channel traffic.
server.other.requestsThe number of “other” server-side requests. Currently, the other protocols are Gopher, WAIS, and SSL.
server.other.errorsThe number of Gopher, WAIS, and SSL requests that resulted in an error.
server.other.kbytes_inThe amount of traffic read from Gopher, WAIS, and SSL servers.
server.other.kbytes_outThe amount of traffic written to Gopher, WAIS, and SSL servers.
icp.pkts_sentThe number of ICP messages sent to neighbors. This includes both queries and replies but doesn’t include HTCP messages.
icp.pkts_recvThe number of ICP messages received from neighbors, including both queries and replies.
icp.queries_sentThe number of ICP queries sent to neighbors.
icp.replies_sentThe number of ICP replies sent to neighbors.
icp.queries_recvThe number of ICP queries received from neighbors.
icp.replies_recvThe number of ICP replies received from neighbors.
icp.query_timeoutsThe number of times that Squid timed out waiting for ICP replies to arrive.
icp.replies_queuedThe number of times Squid queued an ICP message after the initial attempt to send failed. See Section 14.2.1.24.
icp.kbytes_sentThe amount of traffic sent in all ICP messages, including both queries and replies.
icp.kbytes_recvThe amount of traffic received in all ICP messages, including both queries and replies.
icp.q_kbytes_sentThe amount of traffic sent to neighbors in ICP queries.
icp.r_kbytes_sentThe amount of traffic sent to neighbors in ICP replies.
icp.q_kbytes_recvThe amount of traffic received from neighbors in ICP queries.
icp.r_kbytes_recvThe amount of traffic received from neighbors in ICP replies.
icp.times_usedThe number of times ICP resulted in the selection of a neighbor as the next-hop for a cache miss.
cd.times_usedThe number of times Cache Digests resulted in the selection of a neighbor as the next-hop for a cache miss.
cd.msgs_sentThe number of Cache Digest messages sent to neighbors.
cd.msgs_recvThe number of Cache Digest messages received from neighbors.
cd.memoryThe amount of memory (in kilobytes) used by enabling the Cache Digests’ feature.
cd.local_memoryThe amount of memory (in kilobytes) used to store Squid’s own Cache Digest.
cd.kbytes_sentThe amount of traffic sent to neighbors in Cache Digest messages.
cd.kbytes_recvThe amount of traffic received from neighbors in Cache Digest messages.
unlink.requestsThe number of unlink requests given to the (optional) unlinkd process.
page_faultsThe number of (major) page faults as reported by
getrusage( ).select_loopsThe number of times Squid called
select( )orpoll( )in the main I/O loop.cpu_timeThe amount of CPU time (in seconds) accumulated, as reported by
getrusage( ).wall_timeThe amount of human time (in seconds) elapsed since Squid was started.
swap.outsThe number of objects (swap files) saved to disk.
swap.insThe number of objects (swap files) read from disk.
swap.files_cleanedThe number of orphaned cache files removed by the periodic cleanup procedure.
aborted_requestsThe number of server-side HTTP requests aborted due to client-side aborts.
peer_select: Peer Selection Algorithms
This page contains a lot of low-level detail about cache digests that I won’t discuss. Most of the numbers are meaningful only to the developers that originally wrote the Cache Digest implementation.
However, at the end of this page is a little table that
compares Algorithm usage:
Algorithm usage:
Cache Digest:      27 ( 24%)
Icp:               84 ( 76%)
Total:            111 (100%)
In this example, you can see that Squid sent 111 requests to one of its neighbors: 27 are due to Cache Digests and 84 are due to ICP. In this context, ICP also includes HTCP.
digest_stats: Cache Digest and ICP Blob
This page is actually just a concatenation of the following other cache manager pages:
Traffic and Resource Counters
5 Minute Average of Counters
Full Histogram Counts
Peer Selection Algorithms
Store Digest
Its only purpose is to enable developers to take a snapshot of a number of statistics with a single request.
5min: 5 Minute Average of Counters
This page shows a five-minute average of the data in the Traffic and Resource Counters page. In addition to the counters mentioned in Section 14.2.1.30, this page also contains the following values:
client_http.all_median_svc_timeThe median service (response) time for all client requests from the last five minutes.
client_http.miss_median_svc_timeThe median service time for cache misses from the last five minutes.
client_http.nm_median_svc_timeThe five-minute median service time for requests logged as
TCP_IMS_HIT. See “Not-Modified Replies” in Section 14.2.1.24.client_http.nh_median_svc_timeThe five-minute median service time for Near Hits (
TCP_REFRESH_HITrequests).client_http.hit_median_svc_timeThe five-minute median service time for unvalidated cache hits.
icp.query_median_svc_timeThe five-minute median service time for ICP queries sent by Squid (how long it takes for the neighbors to reply to our queries).
icp.reply_median_svc_timeThe five-minute median service time for ICP queries received by Squid (how long it takes Squid to reply to its neighbor’s queries). ICP processing normally occurs faster than the process clock is updated, so this value is always zero.
dns.median_svc_timeThe five-minute median service time for DNS queries.
select_fdsThe mean rate at which the main I/O loop scans file descriptors with
select( )orpoll( ). Note: a low number doesn’t necessarily indicate poor performance. It may just be that Squid often has no work to do.average_select_fd_periodThe mean number of seconds required to scan a file descriptor in the main I/O loop.
median_select_fdsThe five-minute median number of ready file descriptors each time Squid calls
select( )orpoll( )(the median of theselect( )/poll( )return value). Unfortunately, this value is almost always zero because Squid’s functions for calculating the median don’t work very well with theselect_fdshistogram, in which 0 and 1 are the most common values.syscalls.selectsThe five-minute mean rate of calls to
select( )/poll( ). If Squid is usingpoll( )on your system, the variable is called syscalls.polls. This value may be a little larger than select_loops, because the latter only includes calls in the main I/O loop.syscalls.disk.opensThe five-minute mean rate of
open( )calls for disk files.syscalls.disk.closesThe five-minute mean rate of
close( )calls for disk files.syscalls.disk.readsThe five-minute mean rate of
read( )calls for disk files.syscalls.disk.writesThe five-minute mean rate of
write( )calls for disk files.syscalls.disk.seeksThe five-minute mean rate of
seek( )calls for disk files. Probably zero unless you are using aufs, which always callsseek( )before reading.syscalls.disk.unlinksThe five-minute mean rate of
unlink( )(or, in some cases,truncate( )) calls for disk files.syscalls.sock.acceptsThe five-minute mean rate of
accept( )calls for network sockets.syscalls.sock.socketsThe five- minute mean rate of
socket( )calls for network sockets.syscalls.sock.connectsThe five-minute mean rate of
connect( )calls for network sockets.syscalls.sock.bindsThe five-minute mean rate of
bind( )calls for network sockets.syscalls.sock.closesThe five-minute mean rate of
close( )calls for network sockets.syscalls.sock.readsThe five-minute mean rate of
read( )calls for network sockets.syscalls.sock.writesThe five-minute mean rate of
write( )calls for network sockets.syscalls.sock.recvfromsThe five-minute mean rate of
recvfrom( )calls for network sockets. Used for UDP-based protocols, such as DNS, ICP, HTCP, and some interprocess communication.syscalls.sock.sendtosThe five-minute mean rate of
sendto( )calls for network sockets. Used for UDP-based protocols, such as DNS, ICP, HTCP, and some interprocess communication.
60min: 60 Minute Average of Counters
This page shows a 60-minute average of the data in the Traffic and Resource Counters page. The descriptions are identical to those for the 5 Minute Average of Counters page, except the measurements are taken over one hour.
utilization: Cache Utilization
This page displays averages of the counters (see Traffic and Resource Counters and 5 Minute Average of Counters) over various time spans. The same values are reported for 5-minute, 15-minute, 1-hour, 8-hour, 1-day, and 3-day intervals.
This page, with a poorly chosen name, exists primarily so that developers can take a quick snapshot of statistics for testing purposes.
histograms: Full Histogram Counts
This page displays the current histogram values (since Squid was started) for a number of measurements:
client_http.all_svc_timeclient_http.miss_svc_timeclient_http.nm_svc_timeclient_http.nh_svc_timeclient_http.hit_svc_timeicp.query_svc_timeicp.reply_svc_timedns.svc_timeselect_fds_hist
These are the same measurements described in Section 14.2.1.33, except that here Squid gives the full histogram, instead of the mean or median.
Depending on the type of histogram, you may see two or three columns. The first column is the bin number and lower bound on the bin value. The second column is the number of counts for that bin. The optional third column is the number of counts divided by the “size” of the bin. The last column is probably only interesting for log-based histograms, in which the bin size isn’t constant.
active_requests: Client-Side Active Requests
This page shows a list of currently active client-side requests. The list is sorted starting with the most recent, and ending with the oldest requests. The information given here is primarily useful to developers. A typical entry looks like this:
Connection: 0x84ecd10
        FD 132, read 1273, wrote 12182
        FD desc: http://www.squid-cache.org/Doc/FAQ/FAQ.html
        in: buf 0xa063000, offset 0, size 4096
        peer: 206.168.0.9:1058
        me: 192.43.244.42:3128
        nrequests: 3
        defer: n 0, until 0
uri http://www.squid-cache.org/Doc/FAQ/FAQ.html
log_type TCP_MISS
out.offset 0, out.size 0
req_sz 392
entry 0x960c680/3B49762ABF444D80B6465552F6CFAD4C
old_entry 0x0/N/A
start 1066036250.669955 (2.240814 seconds ago)ConnectionThe internal memory address of the connection structure.
FDThe file descriptor for the TCP connection, followed by the number of bytes read and written.
FD descA short description of the socket, usually a URI. This is the same as in Section 14.2.1.25.
inThe internal memory location of the input buffer, the offset at which Squid will place data after the next
read( )call, and the size of the input buffer.peerThe remote socket address of the TCP connection. You can correlate this value with what you see in netstat -n output.
meThe local socket address of the TCP connection.
nrequestsThe number of HTTP requests received on this connection. A value greater than 1 indicates persistent connection reuse.
deferIndicates whether Squid is postponing reads on the socket.
uriThe URI from the client’s request. Unlike
FD desc, this one isn’t truncated.log_typeThe cache status code that appears in access.log when this transaction is complete.
out.offsetThe offset, relative to the start of the HTTP reply message, in which the client side has requested data from the storage system.
out.sizeThe number of response bytes written to the client.
req_szThe size of the client’s HTTP request. Note, for persistent connections, this refers only to the current request.
entryThe memory address and MD5 hash of the corresponding
StoreEntrystructure.old_entryFor validation requests, this is the memory address and MD5 hash of the cached response
StoreEntry.startThe time at which Squid began processing this request.
store_digest: Store Digest
This page is available only with the ./configure
—enable-cache-digests option. It displays a few
statistics about Squid’s own cache digest. It looks like
this:
store digest: size: 620307 bytes
         entries: count: 324806 capacity: 992490 util: 33%
         deletion attempts: 0
         bits: per entry: 5 on: 1141065 capacity: 4962456 util: 23%
         bit-seq: count: 1757902 avg.len: 2.82
         added: 324806 rejected: 611203 ( 65.30 %) del-ed: 0
collisions: on add: 0.08 % on rej: 0.07 %sizeThe number of bytes that the digest occupies in memory.
entries countThe number of cached objects entered into the digest.
entries capacityThe target capacity for the digest. Note, this isn’t a hard limit, but rather an estimate for optimally sizing the digest.
entries utilThe percentage of entries added compared to the capacity.
deletion
              attempts
Squid doesn’t currently support deletion of cache digest entries, so this is always zero.
bits per entryThe number of bits that each item turns on. The same as the digest_bits_per_entry value from squid.conf.
bits onThe number of bits that have been turned on so far.
bits capacityThe total number of bits in the digest. Equal to the digest size multiplied by eight.
bit-seq countThe number of same-bit sequences in the digest. For example, the pattern 110100011111 has 5 sequences of 1s and 0s.
bit-seq avg.lenThe mean length of same-bit sequences.
addedThe number of entries added to the digest since it was created.
rejectedThe number of entries not added to the digest. An entry may not be added because it isn’t cachable, is too large, stale, or about to become stale, etc.
del-edSquid doesn’t currently support deletion of cache digest entries, so this is always zero.
collisions on
              add
This is the percentage of additions that didn’t turn on any new bits. Recall that Bloom filters have the property that two or more entries may turn on the same bit.
collisions on
              rej
This is the percentage of rejected additions that wouldn’t have turned on any new bits.
storedir: Store Directory Stats
This page displays some statistics from the storage system. First, you’ll see a few global values. For example:
Store Directory Statistics:
Store Entries          : 2873564
Maximum Swap Size      : 46080000 KB
Current Store Swap Size: 41461672 KB
Current Capacity       : 90% used, 10% free
Store EntriesThe number of
StoreEntryobjects. Most, but not necessarily all, of these are for on-disk objects.Maximum Swap SizeThe sum of all cache_dir sizes.
Current Store Swap
              Size
The total amount of cached data currently stored on disk. Note that Squid rounds response sizes (e.g., 1722 bytes) up to the nearest multiple filesystem block size (e.g., 2048 bytes) when incrementing and decrementing this value.
Current CapacityThe percentage of the maximum disk space currently in use. The percentage in use should normally stay below the cache_swap_high value.
Next, you’ll see a section for each cache_dir. It looks something like this:
Store Directory #1 (diskd): /cache1
FS Block Size 1024 Bytes
First level subdirectories: 16
Second level subdirectories: 64
Maximum Size: 15360000 KB
Current Size: 13823996 KB
Percent Used: 90.00%
Filemap bits in use: 958439 of 2097152 (46%)
Filesystem Space in use: 14030485/17370434 KB (81%)
Filesystem Inodes in use: 959440/4340990 (22%)
Flags: SELECTED
Pending operations: 0
Removal policy: lru
LRU reference age: 23.63 days
Store Directory
              #
The directory number, type, and pathname.
FS Block SizeThe filesystem block size, determined by the
statfs( )orstatvfs( )system calls. If these functions aren’t available or return an error, the block size defaults to 2048 bytes.
The next few lines are actually storage scheme-dependent. For the most part, ufs, aufs, and diskd are very similar and all report the same statistics.
First level
              subdirectories
The number of first-level subdirectories you told Squid to use on the cache_dir line.
Second level
              subdirectories
The number of second-level subdirectories you told Squid to use on the cache_dir line.
Maximum SizeThe maximum allowed size for this cache directory.
Current SizeThe amount of disk space currently in use.
Percent UsedThe percentage of cache_dir space currently in use.
Filemap bits in
              use
Squid uses a bitmap to keep track of file numbers that are allocated and free. This line shows the number and percentage of bits in use. The filemap grows automatically as needed, so don’t worry if it shows up as 99% full.
Filesystem Space in
              use
These numbers come from the
statfs( )/statvfs( )system calls. These should be the same values as you’d see from the df command. Squid doesn’t use these numbers, other than to report them here for your information. Note that these values may be larger thanCurrentSize, especially if the partition is used for more than Squid’s cache.Filesystem Inodes in useThese numbers also come from
statfs( )/statvfs( ). They are present to remind you that running out of inodes is just as bad as running out of free space. Unfortunately, if you run out of inodes, you’ll probably be forced to newfs the partition.FlagsPossible values include
SELECTEDandREAD-ONLY. TheSELECTEDflag means that this particular cache_dir was most recently selected by the cache directory selection algorithm (see Section 7.4). TheREAD-ONLYflag means that the cache directory has been markedread-onlyin the configuration file (see Section 7.1.5).Pending operationsThis line appears only for diskd cache directories. It shows the number of I/O requests dispatched to the diskd process that have not yet been acknowledged.
That’s the end of the scheme-specific data. The remaining lines are specific to the cache_dir replacement algorithm:
Removal policyPossible values include
lru(the default) orheap. Note that forheap, you won’t see the algorithm name (LFU, GDSF, or LRU).LRU reference ageIf the removal policy is
lru, you’ll also see this line. It shows the age of the oldest object in the LRU list.
store_check_cachable_stats: storeCheckCachable( ) Stats
This page displays a table of counters from the storeCheckCachable( ) function. It is called for
most responses, just before Squid attempts to open a disk file for
writing.
Tip
Squid knows that some responses can’t be cached, based
entirely on the request. These responses aren’t included in the
storeCheckCachable( )
statistics.
The table includes the following lines:
no.not_entry_cachableThe
ENTRY_CACHABLEflag was cleared for some reason.no.release_requestThe
RELEASE_REQUESTflag was set while reading the response. This may be due to an error (such as receiving a partial response) or to the rules of the transfer protocol.In some versions of Squid, this counter is always zero because the
storeReleaseRequest( )function always clears theENTRY_CACHABLEbit, causing such objects to be counted asno.not_entry_cachableinstead.no.wrong_content_lengthThe actual content length doesn’t match the
Content-Lengthheader value.
In some versions of Squid, this counter is always zero because
storeReleaseRequest( ) is always called if the
response size doesn’t match the expected content length.
no.negative_cachedThe
ENTRY_NEGCACHEDflag was set. See the description forTCP_NEGATIVE_HITin Section 13.2.1.no.too_bigThe response body was larger than the maximum_object_size value.
no.too_smallThe response body was smaller than the minimum_object_size value.
no.private_keyThe response has a private cache key, indicating that it can’t be shared with other users.
no.too_many_open_filesThe Squid process was low on free file descriptors.
no.too_many_open_fdsSquid had more than max_open_disk_fds opened at one time.
yes.defaultThe response was cachable because it did not meet any of the preceding criteria.
store_io: Store IO Interface Stats
This short table contains four lines related to allocating disk storage for a new response. For example:
Store IO Interface Stats
create.calls 2825670
create.select_fail 0
create.create_fail 0
create.success 2825670
create.callsThe number of calls to the function that creates a new disk file.
create.select_failThe number of times that the create operation failed because the cache_dir selection algorithm did not select a cache directory. The default selection algorithm,
least-load, fails if it thinks all cache directories are too busy.create.create_failThe number of times that the create operation failed at the storage layer. This may happen if the
open( )call returns an error or if the storage system (e.g., diskd) elects to not open a disk file for some reason (e.g., overload condition).create.successThe number of times the create operation succeeded.
pconn: Persistent Connection Utilization Histograms
This page displays two histograms. The first is for client-side persistent connection usage. For example:
Client-side persistent connection counts:

        req/
        conn      count
        ----  ---------
           0      74292
           1   14362705
           2    3545955
           3    2068486
           4    1411423
           5    1030023
           6     778722
           7     603649
           8     474592
           9     376154
          10     301396
On the left is the number of requests per connection. On the right is the number of times a client connection had that many requests. Most likely, you’ll see that one request/connection has the highest count and that the counts decrease as the number of requests/connection increases.
The second table has the same information, but for server-side HTTP connections. You should see the same sort of pattern here, with one request/connection having the highest count.
refresh: Refresh Algorithm Statistics
The refresh page shows a few tables relating to the freshness of cached objects. Internally, Squid keeps track of the way different modules use the refresh functions. The first table shows how many calls each module has made. The really interesting data is contained in the remaining tables, however.
The HTTP histogram shows the breakdown of freshness
checks for client HTTP requests. For example:
HTTP histogram:
Count   %Total  Category
     0    0.00  Fresh: request max-stale wildcard
     0    0.00  Fresh: request max-stale value
173984    9.76  Fresh: expires time not reached
462757   25.97  Fresh: refresh_pattern last-mod factor percentage
    42    0.00  Fresh: refresh_pattern min value
     0    0.00  Fresh: refresh_pattern override expires
     0    0.00  Fresh: refresh_pattern override lastmod
  5521    0.31  Stale: response has must-revalidate
     0    0.00  Stale: changed reload into IMS
     0    0.00  Stale: request has no-cache directive
470912   26.43  Stale: age exceeds request max-age value
455073   25.54  Stale: expires time reached
 65612    3.68  Stale: refresh_pattern max age rule
144706    8.12  Stale: refresh_pattern last-mod factor percentage
  3274    0.18  Stale: by default
1781881 100.00  TOTAL
Note, the rules aren’t necessarily evaluated in the order in which they appear in the table. Here’s what each line means:
Fresh: request max-stale
              wildcard
Squid considers the cached response fresh because the request includes a
max-staledirective without any value. For example:GET /blah... HTTP/1.1 Cache-control: max-stale
According to RFC 2616: “If no value is assigned to
max-stale, then the client is willing to accept a stale response of any age.”Fresh: request max-stale valueSquid considers the cached response fresh because the request includes a
max-staledirective with a particular value, which is larger than the amount of time since the object expired.Fresh: expires time not reachedSquid considers the cached response fresh because its expiration time has not yet been reached.
Fresh: refresh_pattern last-mod
              factor percentage
Squid considers the cached response fresh because it matches one of the
refresh_patternrules and has a last-modified factor (LM-factor) value that’s less than that specified by the rule. See Section 7.7.Fresh: refresh_pattern min valueSquid considers the cached response fresh because it matches one of the
refresh_patternrules and its age is less than theminvalue specified by the rule. See Section 7.7.Fresh: refresh_pattern override expiresSquid considers the cached response fresh because it matched one of the
refresh_patternrules with theoverride-expireoption. This option causes Squid to give precedence to therefresh_patternminimum value over the object’s expiration time. Note: using theoverride-expireoption is a violation of RFC 2616.Fresh: refresh_pattern override lastmodSquid considers the cached response fresh because it matched one of the
refresh_patternrules with theoverride-lastmodoption. This option causes Squid to give precedence to therefresh_patternminimum value over the LM-factor value. Note: using theoverride-lastmodoption is a violation of RFC 2616.Stale: response has must-revalidateSquid considers the cached response stale because it contains a
Cache-Control:must-revalidatedirective.Stale: changed reload into IMSSquid considers the cached response stale because it matches one of the
refresh_patternrules with thereload-into-imsoption. With this option, Squid turns a request withCache-Control:no-cache(or similar) into a cache validation. Note: using thereload-into-imsoption is a violation of RFC 2616.Stale: request has no-cache directiveSquid considers the cached response stale because the request contains a
Cache-Control:no-cachedirective.Stale: age exceeds request max-age valueSquid considers the cached response stale because the request has a
max-agedirective, which is less than the response’s age.Stale: expires time reachedSquid considers the cached response stale because its expiration time has been reached.
Stale: refresh_pattern max age
              rule
Squid considers the cached response stale because it matches one of the refresh_pattern rules, and its age is greater than the
maxvalue specified by the rule.Stale: refresh_pattern last-mod factor percentageSquid considers the cached response stale because it matches one of the refresh_pattern rules, and its LM-factor value is greater than the factor specified by the rule.
Stale: by
              default
Squid considers the cached response stale by default, because it didn’t meet any of the other criteria.
Following the HTTP histogram, you’ll see the same data for
ICP, HTCP, Cache Digests, and On Store.
The On Store table represents freshness checks
for responses that are coming into Squid’s cache (i.e., cachable
misses). Note, however, that Squid does store stale responses (as
long as they have a cache validator). Don’t be alarmed if you see
some stale responses in the On
Store histogram.
delay: Delay Pool Levels
This page displays the Delay Pool statistics. Squid has three classes of pools (1, 2, 3) and three types of buckets (aggregate, individual, and network). A class 1 pool has only an aggregate bucket, a class 2 pool has both aggregate and individual, and a class 3 pool has all three.
An aggregate bucket looks like this:
Aggregate:
        Max: 16384
        Restore: 4096
        Current: 6144
The values are all in bytes. Max is the size of the bucket, which is
the number of bytes the bucket can hold. Restore is the number of bytes added to
the bucket each second. Current
is the number of bytes currently in the bucket. If nobody uses the
bytes, the bucket fills until it reaches the maximum size.
An individual bucket is almost the same:
Individual:
        Max: 20000
        Restore: 5000
        Current: 1:18760 9:4475 14:20000
The only difference is that the Current line displays a number of
different values, one for each host number. The host
number is defined as the last octet of an IPv4 address.
In this example, the host numbers are 1, 9, and 14. In a class 2
delay pool, the host numbers from different networks share the same
bucket. For example, 192.168.0.1 and 192.168.44.1 both share the
bucket for host number 1. In a class 3 pool, however, each network
number (third octet) has its own array of individual buckets. Thus,
for a class 3 pool, the individual buckets appear this way:
Individual:
        Max: 20000
        Rate: 5000
        Current [Network 0]: 1:12000
        Current [Network 44]: 1:17000
A network bucket (for class 3 pools only) is similar as well:
Network:
        Max: 30000
        Rate: 15000
        Current: 0:3912 7:30000
In this case, the Current
line shows the current level for each network number (third octet).
See Appendix C for more
information about Delay Pools.
forward: Request Forwarding Statistics
The table on this page shows how many attempts were made to forward each request, with their results. Upon receiving some status codes, Squid gives up immediately. For others, however, Squid keeps trying. Each row of the table is a different HTTP status code (200, 401, 404, etc.). Each column is the number of forwarding attempts. The value in each cell is how many requests were forwarded that many times, resulting in the corresponding status code. This information helps developers understand whether or not it makes sense to retry a request after receiving certain types of responses. Here is an example:
Status  try#1   try#2   try#3   try#4   try#5   try#6   try#7   try#8   try#9  try#10
  0      1       0       0       0       0       0       0        0       0      0
200     3970083 111015  51185   29002   18242   12097   8191    6080    4490   6140
201     57      0       0       0       0       0       0       0       0      0
202     162     0       0       0       0       0       0       0       0      0
204     1321    11      0       0       0       0       0       0       0      0
206     624288  453     25      9       4       3       0       1       0      0
207     147     0       0       0       0       0       0       0       0      0
300     23      0       0       0       0       0       0       0       0      0
301     23500   25      2       0       0       0       1       0       0      0
302     339332  3806    153     26      6       4       2       3       0      1
303     101     1       0       0       0       0       0       0       0      0
304     772831  3510    125     21      7       8       8       5       3      2
307     7       0       0       0       0       0       0       0       0      0
400     529     1       0       0       0       0       0       0       0      0
401     1559    0       0       0       0       0       0       0       0      0
403     5098    30      1       1       0       0       0       0       0      0
404     100800  216     25      6       7       1       2       4       1      5
405     1       0       0       0       0       0       0       0       0      0
...
A value of 29,002 in the cell under try#4 and in the row for status 200 means that there were 29,002 times
when Squid finally got a successful response after 4 forwarding attempts. If you look at the
table, you may see some unknown status codes. Squid keeps track of
all status codes up to 600, even those it doesn’t know about. See
Table 13-1 for the list
of codes that Squid does know about.
client_list: Cache Client List
The cache client list shows a handful of statistics for each client IP address accessing Squid, which looks like this:
Address: 206.168.0.9
Name: 206.168.0.9
Currently established connections: 0
    ICP Requests 59000
        UDP_HIT                 1609   3%
        UDP_MISS               57388  97%
        UDP_INVALID                3   0%
    HTTP Requests 11281
        TCP_HIT                  656   6%
        TCP_MISS                3464  31%
        TCP_REFRESH_HIT         4477  40%
        TCP_REFRESH_MISS         767   7%
        TCP_CLIENT_REFRESH_M     397   4%
        TCP_IMS_HIT             1082  10%
        TCP_SWAPFAIL_MISS          7   0%
        TCP_NEGATIVE_HIT          13   0%
        TCP_MEM_HIT              418   4%
The Address line,
obviously, shows the client’s IP address. Name is the same, unless you have
log_fqdn enabled, and the DNS reports a name
for the address. The Currently
established connections line shows how many HTTP
connections are currently open between the client and Squid.
If the client has sent any ICP queries, you’ll see a breakdown of the results here. In this example, only 3% of this client’s ICP queries were hits. Note, this page doesn’t currently include HTCP result statistics. Finally, you’ll see a breakdown of HTTP request result codes.
The client database consumes a fair amount of memory, especially if you have a large number of client IP addresses accessing Squid. You can disable the database entirely, thus conserving memory, with the client_db directive. Also note that there is no way to clear the counters or to remove entries while Squid is running.
netdb: Network Measurement Database
This page is available only with the ./configure
—enable-icmp option (see Section 10.5). On this page
you’ll find quite a lot of IP addresses, hostnames, packet counters,
and RTT values. It looks something like this:
Network DB Statistics:
Network          recv/sent     RTT  Hops Hostnames
165.123.34.0        7/   7    12.7   8.6 onlinebooks.library.upenn.edu
                                         www.library.upenn.edu
                                         digital.library.upenn.edu
    rtp.us.ircache.net        17.0  11.0
    sj.us.ircache.net         71.0  17.3
209.202.204.0       4/   4    12.8  10.0 adbuyer3.lycos.com
    rtp.us.ircache.net        20.6  15.0
    sj.us.ircache.net         77.6  15.0
63.151.139.0       17/  17    12.8   9.0 www.originlab.com
    sj.us.ircache.net         80.0  12.0
209.68.20.0        23/  23    12.8  11.7 www6.tomshardware.com www.guestbook.nu
    rtp.us.ircache.net        34.9  15.1
    sj.us.ircache.net         73.9  14.7
Each /24 network is listed, in order of increasing round-trip
time. You can see how many ICMP pings have been sent and received,
the average RTT, and the estimated router hop-count. The Hostnames field shows the hostnames that
resolve to addresses within the /24 network. If Squid has ICMP
measurements from its neighbors for the network, those are printed
as well. In this example, the local cache is closer to all the
networks than its neighbors (rtp.us.ircache.net and
sj.us.ircache.net).
asndb: AS Number Database
Although this page is always available, it contains interesting data only if you are using one of the Autonomous System (AS) ACLs, such as src_as or dst_as.
When you use an AS-based ACL, Squid queries the Routing Arbiter database (whois.ra.net) to discover the IP networks associated with the AS number. The results of those queries are displayed on this page. The output looks like this:
         Address       AS Numbers
   128.98.0.0/16       7
   146.80.0.0/16       7
   192.5.28.0/24       7
   192.5.29.0/24       7
   192.5.30.0/24       7
192.107.178.0/24       7
192.135.183.0/24       5637
 194.61.177.0/24       7
 194.61.180.0/24       7
 194.61.183.0/24       7
 194.83.162.0/24       7
carp: CARP Information
This page is available only with the ./configure —enable-carp
option and if you have some CARP parents configured. Squid displays
a table of all CARP parents, which looks like this:
          Hostname       Hash Multiplier     Factor     Actual
bo1.us.ircache.net   f142425b   0.894427   0.400000   0.527950
bo2.us.ircache.net   12180f04   1.118034   0.600000   0.472050
Hash is the neighbor’s hash
value from the CARP algorithm. Multiplier is another value used by the
algorithm. Factor is taken from
the carp-load-factor option on
the cache_dir line in squid.conf. Actual is the actual distribution of
requests among the CARP parents. Ideally, it should match the
Factor value.
server_list: Peer Cache Statistics
This page displays various counters and statistics for your neighbor caches. For example:
Sibling    : pa.us.ircache.net/3128/4827
Flags      : htcp
Address[0] : 192.6.19.203
Status     : Up
AVG RTT    : 14 msec
OPEN CONNS : 19
LAST QUERY :        4 seconds ago
LAST REPLY :        4 seconds ago
PINGS SENT :     9119
PINGS ACKED:     9115 100%
FETCHES    :      109   1%
IGNORED    :     9114 100%
Histogram of PINGS ACKED:
        Misses      9114 100%
        Hits           1   0%
keep-alive ratio: 100%TypeThe first line shows the neighbor type (parent, sibling, or multicast group), followed by the hostname and port numbers. The first port number is for HTTP requests, while the second is for ICP or HTCP.
FlagsHere you’ll see any of the cache_peer options that you may have specified, such as
no-query,closest-only, and more. See Section 10.3.1 for the complete list.Address[ ]This line displays the IP address(es) associated with the hostname. The number in brackets is the number of addresses. Squid stores up to 10 addresses for each neighbor.
StatusThe status line indicates whether Squid thinks the neighbor is
UporDown. See Section 10.3.2.AVG RTTThis is the running average RTT for ICP/HTCP queries to the neighbor.
OPEN CONNSThis is the number of HTTP connections currently open to the neighbor.
LAST QUERYThis indicates the amount of time since Squid last sent an ICP/HTCP query to the neighbor.
LAST REPLYThis indicates the amount of time since Squid last received an ICP/HTCP reply from the neighbor.
PINGS SENTThe number of ICP/HTCP queries sent to the neighbor.
PINGS ACKEDThe number of ICP/HTCP replies received back from the neighbor.
FETCHESThe number of HTTP requests sent to the neighbor. The percentage is based on the
PINGSACKEDnumber. Unfortunately, theFETCHESnumber counts requests forwarded for any reason (ICP, HTCP, Cache Digests, default parent, etc.). Thus, the percentage doesn’t always make sense and may be higher than 100%.IGNOREDThe number of ICP/HTCP replies ignored. The most common reason that Squid ignores an ICP/HTCP reply is that it is too late.
Histogram of PINGS
              ACKED
Here you’ll see a breakdown of ICP/HTCP results. For ICP neighbors, Squid prints the ICP status codes (
ICP_HIT,ICP_MISS, etc.). For HTCP neighbors, the only categories areHitsandMisses.keep-alive ratioThis shows the percentage of times that Squid wanted an HTTP connection to be persistent, and the neighbor agreed. Note, this doesn’t indicate anything about whether the connection was actually reused, only that both sides agreed that it could be.
Cache Manager Access Controls
The cache manager interface provides a lot of information. Much of it is sensitive and should be kept private. For example, the Cache Client List reveals the IP addresses of users, the Process Filedescriptor Allocation page shows URIs currently being requested, and the Current Squid Configuration displays the values from squid.conf, including passwords and access control rules. To keep unwanted visitors from browsing the cache manager pages, you must carefully configure access to it.
http_access
All cache manager requests use the pseudo-protocol scheme cache_object. The best way to protect the
cache manager is restrict the IP addresses allowed to make cache_object requests. The default
squid.conf contains these
lines:
acl Manager proto cache_object
acl Localhost src 127.0.0.1/255.255.255.255
http_access allow Manager Localhost
http_access deny Manager
Thus, cache manager requests from the local host (127.0.0.1) are allowed, but all others are denied. If you have additional trusted hosts, you may want to add them to the access rules also. Make sure these lines are at the top of your http_access rules.
cachemgr_passwd
You may also want to modify the default cachemgr_passwd settings. Some of the cache manager pages require a password, so you won’t be able to view those until you add one. For example, if you want to use the Current Squid Configuration page, you must assign it a password:
cachemgr_passwd JeckCy config
You can have a number of different passwords, but each action may have only one password. You may want to use a different password for less sensitive pages:
cachemgr_passwd byDroth filedescriptors client_list netdb
To disable a cache manager action, use disable as the password:
cachemgr_passwd disable netdb
To enable the sensitive actions without requiring a password,
use none:
cachemgr_passwd none offline_toggle
If you want to give the same password to all actions, use the
keyword all:
cachemgr_passwd Knoujush all
When using the command-line cache manager interface (e.g., squidclient), put an @ sign and the password after the action name. For example:
squidclient mgr:objects@byDroth | less
Note that cache manager passwords aren’t printed when you request the Current Squid Configuration page (see Section 14.2.1.7).
cachemgr.cgi
If you use cachemgr.cgi,
the IP address of your HTTP server must be able to
make cache manager requests to Squid. This opens up a back-door
security hole. Anyone who can execute the CGI program on your server
will be able to view the cache manager pages. The passwords
described earlier can help, but you may also want to install access
controls on your HTTP server so that only certain people can execute
cachemgr.cgi.
The main cachemgr.cgi page
has a form with Username and
Password fields. The username is purely
informational. If you have multiple administrators in your
organization, each person can enter their own name for auditing
purposes.
If you leave the password field blank, the password-protected
pages are disabled. Entering a password activates links for those
pages. cachemgr.cgi is stateless,
so the password must be included as a URI parameter in links.
Furthermore, the password encoding scheme isn’t very sophisticated
and trivial to break. Because many applications (such as Squid!) log
the URIs of HTTP requests, your cache-manager password may be logged
or even observed by an untrusted third party. If you really want to
keep your cache manager passwords secret, never use them with
cachemgr.cgi or from any remote
system.
Reasons to Dislike the Cache Manager
The cache manager interface leaves much to be desired. It has a very unpolished feel. Novice administrators will probably find it difficult to use and understand. One of the first problems you might notice is that the menu (or table of contents) is unorganized. There is no logical order or grouping. The first items in the list provide low-level information primarily meant for developers. Currently, the order is determined by the initialization sequence in the source code.
The output is often ugly. The cachemgr.cgi program renders very
bland-looking HTML pages. There are no icons or graphics of any kind.
Furthermore, many of the pages are simply presented as unformatted
text. cachemgr.cgi doesn’t do much
more than format tab-delimited lines as HTML tables and put <A> tags around some URIs. Some of the
cache manager pages are structured so that the output can be easily
parsed by computer programs, rather than humans.
By today’s standards, the cache manager has very weak security. You are essentially forced to use address-based controls and cleartext passwords. If you allow cache manager requests only from localhost, and your system security is good, you’ll be relatively safe.
Squid-RRD
I personally use the cache manager to populate a number of RRDTool databases (http://www.rrdtool.com/). RRDTool is nice package for storing and displaying time-series data. It allows you to archive data at different time scales (e.g., days, weeks, months, years) in a database that doesn’t grow in size over time.
I use a Perl script that runs every five minutes from cron. It issues cache manager requests for a number of pages and extracts the values that I am interested in. These values are stored in the RRD files.
RRDTool also generates nice-looking graphs, from either a CGI script or standalone program. I use the CGI program and check the graphs at least daily. See Figure 14-2 for some samples from one of my own Squid boxes.
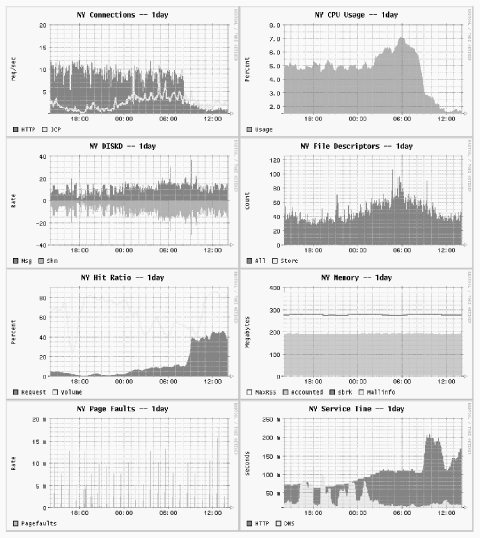
You can find my scripts and instructions for integrating the cache manager and RRDTool at http://www.squid-cache.org/~wessels/squid-rrd/.
Using SNMP
Squid has a built-in SNMP agent that you can query with various SNMP client tools. It allows you to collect a few basic statistics from Squid. Unfortunately, the Squid MIB has not evolved much since its initial implementation. Many of the parameters that you’d like to monitor aren’t available through the SNMP MIB. Perhaps this will be rectified in a future version.
To enable SNMP in Squid, use the —enable-snmp
option when running ./configure and
recompile if necessary. Squid uses UDP port 3401 for SNMP by default.
You can use a different port by setting the
snmp_port directive.
Use the snmp_access access list and snmp_community ACL type to define an access policy for the SNMP agent. For example:
acl Snmppublic snmp_community public
acl Adminhost src 192.168.1.1
snmp_access allow Adminhost Snmppublic
In this case, Squid accepts SNMP requests from 192.168.1.1 with
the community name set to public.
Using snmpwalk and snmpget
The NET-SNMP package (http://net-snmp.sourceforge.net/) provides a good implementation of the snmpwalk and snmpget command-line tools for Unix. The former walks through an SNMP MIB tree, displaying every value, while the latter prints the value for a single MIB object.
After installing NET-SNMP, copy the Squid MIB file to the directory where the utilities can find it. By default, this is the /usr/local/share/snmp/mibs directory:
# cp squid-2.5.STABLE4/src/mib.txt /usr/local/share/snmp/mibs/SQUID-MIB.txt
# chmod 644 /usr/local/share/snmp/mibs/SQUID-MIB.txt
You should then be able to use the snmpget command. Note that Squid is an SNMPv1 agent:
% snmpget -v 1 -c public -m SQUID-MIB localhost:3401 cacheDnsSvcTime.5
SQUID-MIB::cacheDnsSvcTime.5 = INTEGER: 44
If you want to see the entire Squid MIB tree, use snmpwalk. The -Cc option
tells snmpwalk to ignore
nonincreasing OIDs:
% snmpwalk -v 1 -c public -m SQUID-MIB -Cc localhost:3401 squid | less
If you can’t get the Squid MIB installed so that snmpwalk sees it, you can use the numeric OID value instead:
% snmpwalk -v 1 -c public -m SQUID-MIB -Cc localhost:3401 .1.3.6.1.4.1.3495.1 | less
The Squid MIB
In this section, I provide a brief description for each OID in the Squid MIB, which lives in the global MIB tree under iso.org.dod.internet.private.enterprises.nlanr.squid, or .1.3.6.1.4.1.3495.1. The full MIB names, such as cachePerf.cacheProtoStats.cacheMedianSvcTable.cacheMedianSvcEntry.cacheHttpMissSvcTime.60, take up too much space on the page. Instead, I’ll just use the last nonnumeric component of the OID name, which is unique.
cacheSysVMsizeThe amount of memory (in kilobytes) currently used to store in-memory objects. For example:
SQUID-MIB::cacheSysVMsize = INTEGER: 10224
cacheSysStorageThe amount of disk space (in kilobytes) currently used to store on-disk objects. For example:
SQUID-MIB::cacheSysStorage = INTEGER: 19347723
cacheUptimeThe amount of time (number of seconds) since Squid was started.
SQUID-MIB::cacheUptime = Timeticks: (33239630) 3 days, 20:19:56.30
cacheAdminThe email address, or name, of the cache administrator. For example:
SQUID-MIB::cacheAdmin = STRING: wessels@bo2.us.ircache.net
cacheSoftwareThe name of the application. For example:
SQUID-MIB::cacheSoftware = STRING: squid
cacheVersionIdThe application’s version identification. For example:
SQUID-MIB::cacheVersionId = STRING: "2.5.STABLE4"
cacheLoggingFacilityThe current debugging levels, from the debug_options directive. For example:
SQUID-MIB::cacheLoggingFacility = STRING: ALL,1
cacheMemMaxSizeThe value of the cache_mem directive, in megabytes. For example:
SQUID-MIB::cacheMemMaxSize = INTEGER: 10
cacheSwapMaxSizeThe total amount of disk storage, in megabytes, taken from the sum of all cache_dir lines. For example:
SQUID-MIB::cacheSwapMaxSize = INTEGER: 21000
cacheSwapHighWMThe high watermark percentage for disk storage, taken from the cache_swap_high directive. For example:
SQUID-MIB::cacheSwapHighWM = INTEGER: 95
cacheSwapLowWMThe low watermark percentage for disk storage, taken from the cache_swap_low directive. For example:
SQUID-MIB::cacheSwapLowWM = INTEGER: 90
cacheSysPageFaultsThe number of page faults for the Squid process since it was started. (See “Page faults with physical i/o” in Section 14.2.1.24.) For example:
SQUID-MIB::cacheSysPageFaults = Counter32: 9
cacheSysNumReadsThe number of times this process called
read( )on HTTP sockets connected to origin servers and neighbor caches. For example:SQUID-MIB::cacheSysNumReads = Counter32: 15941979
cacheMemUsageThe amount of memory allocated by the memory pooling routines. Not the same as the total memory used by Squid. (See “Total accounted” in Section 14.2.1.24.) For example:
SQUID-MIB::cacheMemUsage = INTEGER: 143709
cacheCpuTimeThe amount of CPU time, in seconds, accumulated by the Squid process. For example:
SQUID-MIB::cacheCpuTime = INTEGER: 79313
cacheCpuUsageThe mean CPU utilization, as a percentage, since Squid was started. Unfortunately, since this value is an integer, any graphs that you make will be “quantized.” For example:
SQUID-MIB::cacheCpuUsage = INTEGER: 23
cacheMaxResSizeThe maximum resident set size, in kilobytes, for the Squid process. (See “Maximum Resident Size” in Section 14.2.1.24.) For example:
SQUID-MIB::cacheMaxResSize = INTEGER: 219128
cacheNumObjCountThe total number of objects currently in the cache. For example:
SQUID-MIB::cacheNumObjCount = Counter32: 1717181
cacheCurrentLRUExpirationCurrent versions of Squid don’t have a global LRU expiration age value, so this is always reported as zero. For example:
SQUID-MIB::cacheCurrentLRUExpiration = Timeticks: (0) 0:00:00.00
cacheCurrentUnlinkRequestsThe number of files given to the external unlinkd process for removal. Note that Squid doesn’t use unlinkd with the diskd and aufs storage schemes. For example:
SQUID-MIB::cacheCurrentUnlinkRequests = Counter32: 0
cacheCurrentUnusedFDescrCntThe current number of available (unused) file descriptors. For example:
SQUID-MIB::cacheCurrentUnusedFDescrCnt = Gauge32: 7253
cacheCurrentResFileDescrCntThe number of reserved file descriptors. (See “Reserved number of file descriptors” in Section 14.2.1.24.) For example:
SQUID-MIB::cacheCurrentResFileDescrCnt = Gauge32: 100
cacheProtoClientHttpRequestsThe total number of HTTP requests received from cache clients. For example:
SQUID-MIB::cacheProtoClientHttpRequests = Counter32: 7277019
cacheHttpHitsThe number of client requests that were cache hits. For example:
SQUID-MIB::cacheHttpHits = Counter32: 2526484
cacheHttpErrorsThe number of client requests that resulted in an error. For example:
SQUID-MIB::cacheHttpErrors = Counter32: 0
cacheHttpInKbThe amount of network traffic, in kilobytes, read from cache clients. For example:
SQUID-MIB::cacheHttpInKb = Counter32: 4231883
cacheHttpOutKbThe amount of network traffic, in kilobytes, written to cache clients. For example:
SQUID-MIB::cacheHttpOutKb = Counter32: 56894945
cacheIcpPktsSentThe number of ICP messages (both queries and replies) sent to neighbors. For example:
SQUID-MIB::cacheIcpPktsSent = Counter32: 5296120
cacheIcpPktsRecvThe number of ICP messages (both queries and replies) received from neighbors. For example:
SQUID-MIB::cacheIcpPktsRecv = Counter32: 5271238
cacheIcpKbSentThe amount of network traffic, in kilobytes, used for ICP messages sent to neighbors, not including UDP and IP headers. For example:
SQUID-MIB::cacheIcpKbSent = Counter32: 428112
cacheIcpKbRecvThe amount of network traffic, in kilobytes, used for ICP messages received from neighbors, not including UDP and IP headers. For example:
SQUID-MIB::cacheIcpKbRecv = Counter32: 447762
cacheServerRequestsThe number of requests forwarded to origin servers and neighbor caches. For example:
SQUID-MIB::cacheServerRequests = INTEGER: 5338305
cacheServerErrorsThe number of errors received from origin servers and neighbor caches. Currently unimplemented and always reported as zero. For example:
SQUID-MIB::cacheServerErrors = INTEGER: 0
cacheServerInKbThe amount of network traffic, in kilobytes, read from origin servers and neighbor caches. For example:
SQUID-MIB::cacheServerInKb = Counter32: 49196559
cacheServerOutKbThe amount of network traffic, in kilobytes, written to origin servers and neighbor caches. For example:
SQUID-MIB::cacheServerOutKb = Counter32: 3404717
cacheCurrentSwapSizeThe amount of disk space, in kilobytes, currently in use by Squid. Compare to
cacheSysStorage. For example:SQUID-MIB::cacheCurrentSwapSize = Counter32: 19347723
cacheClientsThe number of clients that sent HTTP requests to Squid since it was started. For example:
SQUID-MIB::cacheClients = Counter32: 498
cacheMedianTime.XThese OIDs report the time intervals, in minutes, over which median values are computed for subsequent OIDs. The value is the same as the last number of the OID. For example:
SQUID-MIB::cacheMedianTime.1 = INTEGER: 1
cacheHttpAllSvcTime.XThe 1-, 5-, and 60-minute median service time values, in milliseconds, for all client HTTP requests. For example:
SQUID-MIB::cacheHttpAllSvcTime.1 = INTEGER: 78
cacheHttpMissSvcTime.XThe 1-, 5-, and 60-minute median service time values for cache misses. For example:
SQUID-MIB::cacheHttpMissSvcTime.1 = INTEGER: 114
SQUID-MIB::cacheHttpMissSvcTime.5 = INTEGER: 87
SQUID-MIB::cacheHttpMissSvcTime.60 = INTEGER: 74
cacheHttpNmSvcTime.XThe 1-, 5-, and 60-minute median service time values for requests logged as
TCP_IMS_HIT. (See “Not-Modified Replies” in Section 14.2.1.24.) For example:SQUID-MIB::cacheHttpNmSvcTime.1 = INTEGER: 12 SQUID-MIB::cacheHttpNmSvcTime.5 = INTEGER: 34 SQUID-MIB::cacheHttpNmSvcTime.60 = INTEGER: 32
cacheHttpHitSvcTime.XThe 1-, 5-, and 60-minute median service time values for cache hits, logged as
TCP_HIT. For example:SQUID-MIB::cacheHttpHitSvcTime.1 = INTEGER: 45 SQUID-MIB::cacheHttpHitSvcTime.5 = INTEGER: 45 SQUID-MIB::cacheHttpHitSvcTime.60 = INTEGER: 40
cacheIcpQuerySvcTime.XThe 1-, 5-, and 60-minute service time values for ICP queries sent by Squid (the time elapsed between sending your query and receiving a neighbor’s reply). For example:
SQUID-MIB::cacheIcpQuerySvcTime.1 = INTEGER: 0
SQUID-MIB::cacheIcpQuerySvcTime.5 = INTEGER: 0
SQUID-MIB::cacheIcpQuerySvcTime.60 = INTEGER: 3563
cacheIcpReplySvcTime.XThe 1-, 5-, and 60-minute median service time values for ICP queries received by Squid. In current implementations, these are always zero because processing occurs faster than the process clock is updated. For example:
SQUID-MIB::cacheIcpReplySvcTime.1 = INTEGER: 0
SQUID-MIB::cacheIcpReplySvcTime.5 = INTEGER: 0
SQUID-MIB::cacheIcpReplySvcTime.60 = INTEGER: 0
cacheDnsSvcTime.XThe 1-, 5-, and 60-minute median service time values for Squid’s DNS queries. For example:
SQUID-MIB::cacheDnsSvcTime.1 = INTEGER: 40
SQUID-MIB::cacheDnsSvcTime.5 = INTEGER: 42
SQUID-MIB::cacheDnsSvcTime.60 = INTEGER: 42
cacheRequestHitRatio.XSquid’s cache hit ratio (percentage) over the last 1, 5, and 60 minutes. For example:
SQUID-MIB::cacheRequestHitRatio.1 = INTEGER: 16
SQUID-MIB::cacheRequestHitRatio.5 = INTEGER: 18
SQUID-MIB::cacheRequestHitRatio.60 = INTEGER: 22
cacheRequestByteRatio.XSquid’s byte hit ratio (percentage) over the last 1, 5, and 60 minutes. For example:
SQUID-MIB::cacheRequestByteRatio.1 = INTEGER: 73
SQUID-MIB::cacheRequestByteRatio.5 = INTEGER: 43
SQUID-MIB::cacheRequestByteRatio.60 = INTEGER: 34
cacheIpEntriesThe number of entries in Squid’s IP (name-to-address) cache. For example:
SQUID-MIB::cacheIpEntries = Gauge32: 10033
cacheIpRequestsThe number of requests received by Squid’s IP cache. For example:
SQUID-MIB::cacheIpRequests = Counter32: 8195627
cacheIpHitsThe number of lookups that were hits in the IP cache. For example:
SQUID-MIB::cacheIpHits = Counter32: 6040658
If the ratio of hits to requests is less than 60-75%, you may want to increase the size of your IP cache.
cacheIpPendingHitsAlways zero in the current implementation. For example:
SQUID-MIB::cacheIpPendingHits = Gauge32: 0
Older versions of Squid had the notion of IP cache hits for outstanding queries.
cacheIpNegativeHitsThe number of lookups that were negative hits in the IP cache. Certain failed queries may be negatively cached for an amount of time determined by the negative_dns_ttl directive. For example:
SQUID-MIB::cacheIpNegativeHits = Counter32: 49433
cacheIpMissesThe number of IP cache misses. For example:
SQUID-MIB::cacheIpMisses = Counter32: 1807438
cacheBlockingGetHostByNameAlways zero in the current implementation. For example:
SQUID-MIB::cacheBlockingGetHostByName = Counter32: 0
Older versions occasionally called the
gethostbyname( )function if the IP cache couldn’t provide an answer.cacheAttemptReleaseLckEntriesAlways zero in the current implementation. Older versions would, in some cases, want to release locked IP cache entries. For example:
SQUID-MIB::cacheAttemptReleaseLckEntries = Counter32: 0
cacheFqdnEntriesThe number of entries in the FQDN (address-to-name) cache. For example:
SQUID-MIB::cacheFqdnEntries = Gauge32: 1
cacheFqdnRequestsThe number of requests to the FQDN cache. For example:
SQUID-MIB::cacheFqdnRequests = Counter32: 0
cacheFqdnHitsThe number of FQDN cache requests satisfied as hits. For example:
SQUID-MIB::cacheFqdnHits = Counter32: 0
cacheFqdnPendingHitsAlways zero in the current implementation. For example:
SQUID-MIB::cacheFqdnPendingHits = Gauge32: 0
cacheFqdnNegativeHitsThe number of FQDN requests satisfied as negative cache hits. For example:
SQUID-MIB::cacheFqdnNegativeHits = Counter32: 0
cacheFqdnMissesThe number of FQDN cache misses. For example:
SQUID-MIB::cacheFqdnMisses = Counter32: 0
cacheBlockingGetHostByAddrAlways zero in the current implementation. For example:
SQUID-MIB::cacheBlockingGetHostByAddr = Counter32: 0
cacheDnsRequestsThe number of DNS queries made by Squid. This counter is reset each time you reconfigure the running Squid process. For example:
SQUID-MIB::cacheDnsRequests = Counter32: 3262
cacheDnsRepliesThe number of DNS replies received by Squid. This counter is reset each time you reconfigure the running Squid process. For example:
SQUID-MIB::cacheDnsReplies = Counter32: 2440
cacheDnsNumberServersWhen using internal DNS (the default), this OID reports the number of nameservers that Squid knows about. For external DNS, it reports the number of (running) dnsserver helper processes. For example:
SQUID-MIB::cacheDnsNumberServers = Counter32: 2
cachePeerName.A.B.C.DThis, and the next group of OIDs, come from the list of neighbor caches. (See Section 14.2.1.50.) These OIDs are indexed by the IPv4 address of the peer. This particular OID returns the neighbor cache’s hostname. For example:
SQUID-MIB::cachePeerName.192.203.230.19 = STRING: sv.us.ircache.net
cachePeerAddr.A.B.C.DThis is the IP address of the peer, which, of course, you already know from the OID itself. For example:
SQUID-MIB::cachePeerAddr.192.203.230.19 = IpAddress: 192.203.230.19
cachePeerPortHttp.A.B.C.DThis is the neighbor cache’s HTTP port number. For example:
SQUID-MIB::cachePeerPortHttp.192.203.230.19 = INTEGER: 3128
cachePeerPortIcp.A.B.C.DThis is the neighbor cache’s ICP or HTCP port number. For example:
SQUID-MIB::cachePeerPortIcp.192.203.230.19 = INTEGER: 3130
cachePeerType.A.B.C.DThe type of the neighbor: 1 for sibling, 2 for parent, and 3 for multicast. For example:
SQUID-MIB::cachePeerType.192.203.230.19 = INTEGER: 1
cachePeerState.A.B.C.DThe state of the peer: 1 for up, 0 for down. (See Section 10.3.2.) For example:
SQUID-MIB::cachePeerState.192.203.230.19 = INTEGER: 1
cachePeerPingsSent.A.B.C.DThe number of ICP/HTCP queries sent to the neighbor. For example:
SQUID-MIB::cachePeerPingsSent.192.203.230.19 = Counter32: 924
cachePeerPingsAcked.A.B.C.DThe number of ICP/HTCP queries received from the neighbor. For example:
SQUID-MIB::cachePeerPingsAcked.192.203.230.19 = Counter32: 901
cachePeerFetches.A.B.C.DThe number of HTTP requests sent to the neighbor. (See the discussion about
FETCHESin Section 14.2.1.50.) For example:SQUID-MIB::cachePeerFetches.192.203.230.19 = Counter32: 34
cachePeerRtt.A.B.C.DThe average round-trip time for ICP/HTCP queries to this peer. For example:
SQUID-MIB::cachePeerRtt.192.203.230.19 = INTEGER: 26
cachePeerIgnored.A.B.C.DThe number of ICP/HTCP replies that Squid ignored. (See the discussion about IGNORED in Section 14.2.1.50.) For example:
SQUID-MIB::cachePeerIgnored.192.203.230.19 = Counter32: 201
cachePeerKeepAlSent.A.B.C.DThe number of HTTP requests sent to the neighbor with a request to keep the connection open. For example:
SQUID-MIB::cachePeerKeepAlSent.192.203.230.19 = Counter32: 34
cachePeerKeepAlRecv.A.B.C.DThe number of HTTP replies received from the neighbor with a request to keep the connection open. For example:
SQUID-MIB::cachePeerKeepAlRecv.192.203.230.19 = Counter32: 34
cacheClientAddr.A.B.C.DThe
cacheClientAddrOIDs come from the same database as the Cache Client List (see Section 14.2.1.46). This particular OID’s value is the IPv4 address, just like the last four octets of the OID itself. For example:SQUID-MIB::cacheClientAddr.206.168.0.9 = IpAddress: 206.168.0.9
cacheClientHttpRequests.A.B.C.DThe number of HTTP requests received from this client. For example:
SQUID-MIB::cacheClientHttpRequests.206.168.0.9 = Counter32: 108281
cacheClientHttpKb.A.B.C.DThe amount of traffic, in kilobytes, sent to this client. For example:
SQUID-MIB::cacheClientHttpKb.206.168.0.9 = Counter32: 921447
cacheClientHttpHits.A.B.C.DThe number of cache hits sent to this client. For example:
SQUID-MIB::cacheClientHttpHits.206.168.0.9 = Counter32: 32365
cacheClientHTTPHitKb.A.B.C.DThe amount of traffic, in kilobytes, sent to this client for cache hits. For example:
SQUID-MIB::cacheClientHTTPHitKb.206.168.0.9 = Counter32: 141638
cacheClientIcpRequests.A.B.C.DThe number of ICP (but not HTCP ) queries received from this client. For example:
SQUID-MIB::cacheClientIcpRequests.206.168.0.9 = Counter32: 79120
cacheClientIcpKb.A.B.C.DThe amount of traffic, in kilobytes, received from this client in ICP queries. For example:
SQUID-MIB::cacheClientIcpKb.206.168.0.9 = Counter32: 5986
cacheClientIcpHits.A.B.C.DThe number of
ICP_HITreplies sent to this client. For example:SQUID-MIB::cacheClientIcpHits.206.168.0.9 = Counter32: 21897
cacheClientIcpHitKb.A.B.C.DThe amount of traffic, in kilobytes, sent to this client for
ICP_HITmessages. A somewhat silly measurement becauseICP_HITandICP_MISSmessages have the same size. However, old versions of Squid used the now-obsoleteICP_HIT_OBJopcode, which included the object content. For example:SQUID-MIB::cacheClientIcpHitKb.206.168.0.9 = Counter32: 1679
Exercises
Write a shell script that uses squidclient to collect and save the total number of HTTP requests and the five-minute median overall response time.
Write a shell script to periodically retrieve and archive the running configuration. It should also compare the current and most recent configurations and email you the changes, if any.
Download, compile, and install the NET-SNMP package. Use snmpwalk to view Squid’s entire MIB tree.
Create and deploy a simple redirector (Chapter 11) that sleeps for 250 milliseconds on each request. Watch the cache manager’s
redirectorpage as Squid runs.