Table of Contents for
Squid: The Definitive Guide
 Squid: The Definitive Guide
Published by
O'Reilly Media, Inc., 2004
Squid: The Definitive Guide
Published by
O'Reilly Media, Inc., 2004
- Cover
- Squid: The Definitive Guide
- Squid: The Definitive Guide
- Dedication
- Preface
- 1. Introduction
- 2. Getting Squid
- 3. Compiling and Installing
- 4. Configuration Guide for the Eager
- 5. Running Squid
- 6. All About Access Controls
- 7. Disk Cache Basics
- 8. Advanced Disk Cache Topics
- 9. Interception Caching
- 10. Talking to Other Squids
- 11. Redirectors
- 12. Authentication Helpers
- 13. Log Files
- 14. Monitoring Squid
- 15. Server Accelerator Mode
- 16. Debugging and Troubleshooting
- A. Config File Reference
- http_port
- https_port
- ssl_unclean_shutdown
- icp_port
- htcp_port
- mcast_groups
- udp_incoming_address
- udp_outgoing_address
- cache_peer
- cache_peer_domain
- neighbor_type_domain
- icp_query_timeout
- maximum_icp_query_timeout
- mcast_icp_query_timeout
- dead_peer_timeout
- hierarchy_stoplist
- no_cache
- cache_access_log
- cache_log
- cache_store_log
- cache_swap_log
- emulate_httpd_log
- log_ip_on_direct
- cache_dir
- cache_mem
- cache_swap_low
- cache_swap_high
- maximum_object_size
- minimum_object_size
- maximum_object_size_in_memory
- cache_replacement_policy
- memory_replacement_policy
- store_dir_select_algorithm
- mime_table
- ipcache_size
- ipcache_low
- ipcache_high
- fqdncache_size
- log_mime_hdrs
- useragent_log
- referer_log
- pid_filename
- debug_options
- log_fqdn
- client_netmask
- ftp_user
- ftp_list_width
- ftp_passive
- ftp_sanitycheck
- cache_dns_program
- dns_children
- dns_retransmit_interval
- dns_timeout
- dns_defnames
- dns_nameservers
- hosts_file
- diskd_program
- unlinkd_program
- pinger_program
- redirect_program
- redirect_children
- redirect_rewrites_host_header
- redirector_access
- redirector_bypass
- auth_param
- authenticate_ttl
- authenticate_cache_garbage_interval
- authenticate_ip_ttl
- external_acl_type
- wais_relay_host
- wais_relay_port
- request_header_max_size
- request_body_max_size
- refresh_pattern
- quick_abort_min
- quick_abort_max
- quick_abort_pct
- negative_ttl
- positive_dns_ttl
- negative_dns_ttl
- range_offset_limit
- connect_timeout
- peer_connect_timeout
- read_timeout
- request_timeout
- persistent_request_timeout
- client_lifetime
- half_closed_clients
- pconn_timeout
- ident_timeout
- shutdown_lifetime
- acl
- http_access
- http_reply_access
- icp_access
- miss_access
- cache_peer_access
- ident_lookup_access
- tcp_outgoing_tos
- tcp_outgoing_address
- reply_body_max_size
- cache_mgr
- cache_effective_user
- cache_effective_group
- visible_hostname
- unique_hostname
- hostname_aliases
- announce_period
- announce_host
- announce_file
- announce_port
- httpd_accel_host
- httpd_accel_port
- httpd_accel_single_host
- httpd_accel_with_proxy
- httpd_accel_uses_host_header
- dns_testnames
- logfile_rotate
- append_domain
- tcp_recv_bufsize
- err_html_text
- deny_info
- memory_pools
- memory_pools_limit
- forwarded_for
- log_icp_queries
- icp_hit_stale
- minimum_direct_hops
- minimum_direct_rtt
- cachemgr_passwd
- store_avg_object_size
- store_objects_per_bucket
- client_db
- netdb_low
- netdb_high
- netdb_ping_period
- query_icmp
- test_reachability
- buffered_logs
- reload_into_ims
- always_direct
- never_direct
- header_access
- header_replace
- icon_directory
- error_directory
- maximum_single_addr_tries
- snmp_port
- snmp_access
- snmp_incoming_address
- snmp_outgoing_address
- as_whois_server
- wccp_router
- wccp_version
- wccp_incoming_address
- wccp_outgoing_address
- delay_pools
- delay_class
- delay_access
- delay_parameters
- delay_initial_bucket_level
- incoming_icp_average
- incoming_http_average
- incoming_dns_average
- min_icp_poll_cnt
- min_dns_poll_cnt
- min_http_poll_cnt
- max_open_disk_fds
- offline_mode
- uri_whitespace
- broken_posts
- mcast_miss_addr
- mcast_miss_ttl
- mcast_miss_port
- mcast_miss_encode_key
- nonhierarchical_direct
- prefer_direct
- strip_query_terms
- coredump_dir
- ignore_unknown_nameservers
- digest_generation
- digest_bits_per_entry
- digest_rebuild_period
- digest_rewrite_period
- digest_swapout_chunk_size
- digest_rebuild_chunk_percentage
- chroot
- client_persistent_connections
- server_persistent_connections
- pipeline_prefetch
- extension_methods
- request_entities
- high_response_time_warning
- high_page_fault_warning
- high_memory_warning
- ie_refresh
- vary_ignore_expire
- sleep_after_fork
- B. The Memory Cache
- C. Delay Pools
- D. Filesystem Performance Benchmarks
- E. Squid on Windows
- F. Configuring Squid Clients
- About the Author
- Colophon
- Copyright
Appendix D. Filesystem Performance Benchmarks
You have a myriad of choices to make when installing and configuring Squid, especially when it comes to the way Squid stores files on disk. Back in Chapter 8, I talked about the various filesystems and storage schemes. Here, I’ll provide some hard data on their relative performance.
These tests were done with Web Polygraph, a freely available, high-performance tool for benchmarking HTTP intermediaries (http://www.web-polygraph.org/). Over the course of many months, I ran approximately 40 different tests on 5 different operating systems.
The Benchmark Environment
The primary purpose of these benchmarks is to provide a number of measurements that allow you to compare different Squid configurations and features. In order to produce comparable results, I’ve taken care to minimize any differences between systems being tested.
Hardware for Squid
I used five identical computer systems—one for each of the following operating systems: FreeBSD, Linux, NetBSD, OpenBSD, and Solaris. The boxes are IBM Netfinity servers with one 500-MHz PIII CPU, 1 GB of RAM, an Intel fast-Ethernet NIC, and three 8-GB disk SCSI drives. I realize that these aren’t particularly powerful machines by today’s standards, but they are good enough for these tests. Anyway, it is more important that they be identical than powerful.
The requirement to use identical hardware means that I can’t generate comparable results for other hardware platforms, such as Sun, Digital/Compaq/HP, and others.
Squid Version and Configuration
Except for the coss tests, all results are from Squid Version 2.5.STABLE2. The coss results are from a patched version of 2.5.STABLE3. Those patches have been committed to the source tree for inclusion into 2.5.STABLE4.
Unless otherwise specified, I used only the
—enable-storeio option when running ./configure before compiling Squid. For
example:
% ./configure --enable-storeio=diskd,ufs,null,coss
In all cases, Squid is configured to use 7500 MB of each 8.2-GB disk. This is a total cache size of 21.5 GB. Additionally, access.log and store.log have been disabled in the configuration file. Here is a sample squid.conf file:
visible_hostname linux-squid.bench.tst
acl All src 0/0
http_access allow All

cache_dir aufs /cache0 7500 16 256
cache_dir aufs /cache1 7500 16 256
cache_dir aufs /cache2 7500 16 256

cache_effective_user nobody
cache_effective_group nobody
cache_access_log /dev/null
cache_store_log none
logfile_rotate 0
Web Polygraph Workload
All the tests in this appendix use the same Polygraph workload file.[1] Meeting this requirement was, perhaps, the hardest part of running these tests. Normally, the desired throughput is a configuration parameter in a Polygraph workload. However, because the sustainable throughput is different for each configuration, my colleague Alex Rousskov and I developed a workload that can be used for all tests.[2] We call this the “peak finder” workload because it finds the peak throughput for a device under test.
The name “peak finder” is somewhat misleading because, at least in Squid’s case, sustainable throughput decreases over time. The workload is designed to periodically adjust the offered load (throughput) subject to response time requirements. If the measured response time is below a given threshold, Polygraph increases the load. If response time is above the threshold, it decreases the load. Thus, at any point in time during the test, we know the maximum throughput that still satisfies the response time requirements.
In order to reach a steady-state condition, the test runs until the cache has been filled twice. Polygraph knows the total cache size (21.5 GB) and keeps track of the amount of fill traffic pulled into the cache. These are responses that are cachable but not cache hits. The test duration, then, depends on the sustainable throughput. When the throughput is low, the test takes longer to complete. Some of these tests took more than 10 days to run.
General Comments
I show, for each test, how the sustainable throughput varies over time. The y-axis shows the throughput (responses per second). The x-axis is the ratio of fill-traffic volume to cache size. Because each test takes a different amount of time, this is a nice way to normalize all the results. The test is over when the cache has been filled twice.
In most traces, you’ll see that sustainable throughput decreases over time. At the beginning of the test, the throughput is very high. Here, the disks are empty, and Squid doesn’t need to replace old objects. The throughput for a full cache is usually worse than for an empty cache. This is a common characteristic of proxy benchmarks and emphasizes the importance of reaching steady-state conditions. Don’t be fooled by impressive results from short tests.
The Throughput, Response Time, and Hit Ratio values given in the summary tables are taken from the last 25% of the test. Here, between 1.5 and 2.0 on the x-axis, the throughput is more or less stable and flat. I report the mean of the throughput, response time, and hit ratio values in this range from the trace data.
Throughput is the most interesting metric in these tests. It is given in responses per second. The rows in each summary table are sorted by throughput.
The response time numbers are less interesting because they are all about the same. I decided to report them to show that, indeed, the results stay within the response time window defined by the workload. The target response time is around 1.5 seconds, but the actual response time varies depending on the particular test.
The response hit ratio values are also not particularly interesting. The ideal hit ratio for this workload is about 58%. Due to an as-yet unresolved Polygraph bug, however, the hit ratio decreases slightly as the test progresses.
Keep in mind that these results are meant to demonstrate the relative performance of different options, rather than the absolute values. You’ll get different numbers if you repeat the tests on different hardware.
Linux
Linux is obviously a popular choice for Squid. It supports a wide variety of filesystems and storage schemes. These results come from Linux kernel Version 2.4.19 (released August 2, 2002) with SGI’s XFS patches Version 1.2.0 (released Feb 11, 2003) and ReiserFS Version 3.6.25.
The kernel’s file descriptor limit is set to 8192. I used this command to configure Squid before compiling:
% ./configure --enable-storeio=diskd,ufs,aufs,null,coss --with-aufs-threads=32
The Linux results are summarized in Table D-1, and Figure D-1 shows the traces. You can see that coss is the best performer, with aufs coming in second and diskd third. As I’m writing this, coss is an experimental feature and not necessarily suitable for a production system. In the long run, you’ll probably be better off with aufs.
Storage scheme | Filesystem | Mount options | Throughput (xact/sec) | Response time (sec) | Hit ratio (%) |
coss | 326.3 | 1.59 | 53.9 | ||
aufs(1) | ext2fs | | 168.5 | 1.45 | 56.3 |
diskd(1) | ext2fs | | 149.4 | 1.53 | 56.1 |
aufs(2) | ext2fs | 110.0 | 1.46 | 55.6 | |
ufs(1) | ext2fs | 54.9 | 1.52 | 55.6 | |
ufs(2) | ext3fs | 48.4 | 1.49 | 56.8 | |
ufs(3) | xfs | 40.7 | 1.54 | 55.3 | |
ufs(4) | reiserfs | | 29.7 | 1.55 | 55.0 |
ufs(5) | reiserfs | 21.4 | 1.55 | 55.1 |
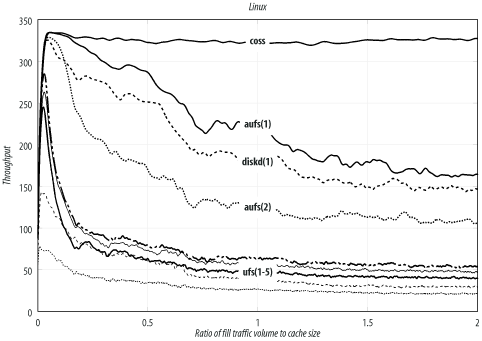
Note that the noatime option
gives a significant boost in performance to aufs.
The throughput jumps from 110 to 168 transactions per second with the
addition of this mount option. Linux
also has an async option, but it is enabled by default.
I did not run any tests with async disabled.
Of the many filesystem choices, ext2fs seems to give the best performance. ext3fs (ext2 plus journaling) is only slightly lower, followed by xfs, and reiserfs.
FreeBSD
FreeBSD is another popular Squid platform, and my personal favorite. Table D-2 and Figure D-2 summarize the results for FreeBSD. Again, coss exhibits the highest throughput, followed by diskd. The aufs storage scheme doesn’t currently run on FreeBSD. These results come from FreeBSD Version 4.8-STABLE (released April 3, 2003). I built a kernel with the following noteworthy options:
options         MSGMNB=16384
options         MSGMNI=41
options         MSGSEG=2049
options         MSGSSZ=64
options         MSGTQL=512
options         SHMSEG=16
options         SHMMNI=32
options         SHMMAX=2097152
options         SHMALL=4096
options         MAXFILES=8192
options         NMBCLUSTERS=32768
options         VFS_AIO
Storage scheme | Filesystem | Mount options | Throughput | Response time | Hit ratio |
coss | 330.7 | 1.58 | 54.5 | ||
diskd(1) | UFS | | 129.0 | 1.58 | 54.1 |
diskd(2) | UFS | 77.4 | 1.47 | 56.2 | |
ufs(1) | UFS | | 38.0 | 1.49 | 56.8 |
ufs(2) | UFS | | 31.1 | 1.54 | 55.0 |
ufs(3) | UFS | | 30.2 | 1.51 | 55.9 |
ufs(4) | UFS | | 29.9 | 1.51 | 55.7 |
ufs(5) | UFS | 24.4 | 1.50 | 56.4 |
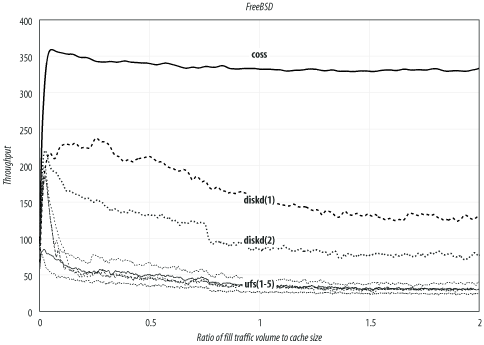
Enabling the async, noatime, and softupdate [3] options boosts the standard ufs
performance from 24 to 38 transactions per second. However, using one of
the other storage schemes increases the sustainable throughput even
more.
FreeBSD’s diskd performance (129/sec) isn’t quite as good as on Linux (169/sec), perhaps because the underlying filesystem (ext2fs) is better.
Note that the trace for coss is relatively flat. Its performance doesn’t change much over time. Furthermore, both FreeBSD and Linux report similar throughput numbers: 326/sec and 331/sec. This leads me to believe that the disk system isn’t a bottleneck in these tests. In fact, the test with no disk cache (see Section D.8) achieves essentially the same throughput (332/sec).
OpenBSD
The results in this section are from OpenBSD Version 3.3 (released May 1, 2003). I built a kernel with the following notable configuration options:
option          MSGMNB=8192
option          MSGMNI=40
option          MSGSEG=512
option          MSGSSZ=64
option          MSGTQL=2048
option          SHMSEG=16
option          SHMMNI=32
option          SHMMAX=2048
option          SHMALL=4096
option          NMBCLUSTERS=32768
option          MAXFILES=8192
Table D-3 and Figure D-3 summarize the OpenBSD
results. The choices for OpenBSD are similar to those for FreeBSD.
Unfortunately, however, coss doesn’t run on
OpenBSD, which lacks the aio_read( ) and aio_write( ) functions.
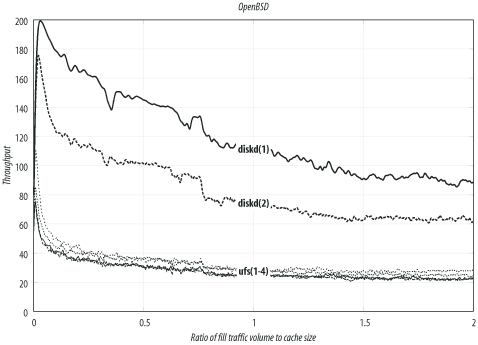
In general, the OpenBSD results are slightly worse than FreeBSD. This isn’t too surprising, given that the OpenBSD project emphasizes security and perhaps spends less time on filesystem performance.
One odd result is that using the async option (alone) caused a slight decrease
in performance for the ufs storage scheme.
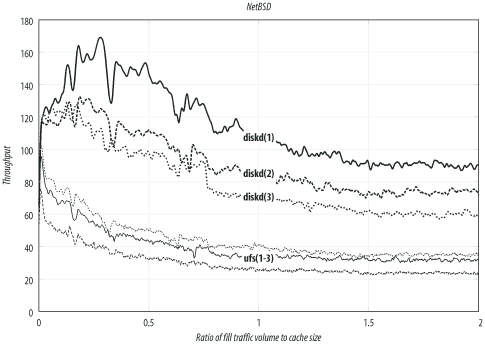
NetBSD
These results come from NetBSD Version 1.6.1 (released April 21, 2003). Table D-4 and Figure D-4 summarize the NetBSD results. NetBSD actually performs almost the same as OpenBSD. The best configuration yields about 90 transactions per second. Unfortunately, NetBSD doesn’t support coss or aufs. I built a custom kernel with these options:
options         NMBCLUSTERS=32768
options         MAXFILES=8192
options         MSGSSZ=64
options         MSGSEG=512
options         MSGMNB=8192
options         MSGMNI=40
options         MSGTQL=2048
Storage scheme | Filesystem | Mount options | Throughput | Response time | Hit ratio |
diskd(1) | UFS | | 90.3 | 1.49 | 57.2 |
diskd(2) | UFS | | 73.5 | 1.51 | 55.8 |
diskd(3) | UFS | 60.1 | 1.48 | 55.9 | |
ufs(1) | UFS | | 34.9 | 1.51 | 56.2 |
ufs(2) | UFS | | 31.7 | 1.52 | 55.5 |
ufs(3) | UFS | 23.6 | 1.53 | 55.4 |
Solaris
These results come from Solaris Version 8 for Intel (released February 2002). Solaris 9 was available when I started these tests, but Sun no longer makes it freely available. I tweaked the kernel by adding these lines to /etc/system:
set rlim_fd_max = 8192
set msgsys:msginfo_msgmax=8192
set msgsys:msginfo_msgmnb=8192
set msgsys:msginfo_msgmni=40
set msgsys:msginfo_msgssz=64
set msgsys:msginfo_msgtql=2048
set shmsys:shminfo_shmmax=2097152
set shmsys:shminfo_shmmni=32
set shmsys:shminfo_shmseg=16
Table D-5 and Figure D-5 summarize the Solaris results. This is the only other operating system, in addition to Linux, in which the aufs storage scheme works well. Interestingly, both aufs and diskd have about the same performance on Solaris, although the actual numbers are much lower than on Linux.
Storage scheme | Filesystem | Mount options | Throughput | Response time | Hit ratio |
diskd(1) | UFS | | 56.3 | 1.53 | 55.7 |
aufs(1) | UFS | | 53.6 | 1.49 | 56.6 |
diskd(2) | UFS | 37.9 | 1.53 | 55.5 | |
aufs(2) | UFS | 37.4 | 1.49 | 56.4 | |
coss | 32.4 | 1.47 | 54.6 | ||
ufs(1) | UFS | | 24.0 | 1.53 | 55.6 |
ufs(2) | UFS | 19.0 | 1.50 | 56.3 |
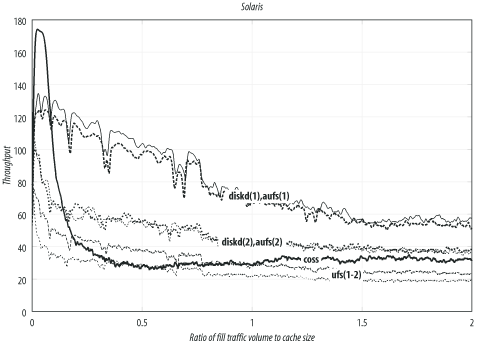
Solaris also supports coss, but at nowhere near the rates for Linux and FreeBSD. For some unknown reason, coss on Solaris is limited to 32 transactions per second.
Number of Disk Spindles
In this section, I compare Squid’s performance for different number of disk drives (spindles). These tests are from the Linux system with the aufs storage scheme and ext2fs filesystems.
Table D-6 and Figure D-6 summarize the results. The test with no disk drives has the best throughput, but the worst response time and hit ratio. Note that Squid does serve a few cache hits from memory, so the hit ratio isn’t zero.
#Disks | Throughput | Response time | Hit ratio |
0 | 332.1 | 2.99 | 0.4 |
3 | 109.6 | 1.44 | 56.2 |
2 | 85.3 | 1.49 | 53.9 |
1 | 66.0 | 1.50 | 53.5 |
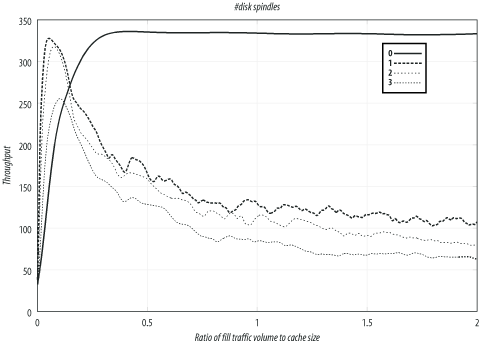
The primary purpose of these tests is to show that Squid’s performance doesn’t increase in proportion to the number of disk drives. Excluding other factors, you may be able to get better performance from three systems with one disk drive each, rather than a single system with three drives.
[1] Except for the number-of-spindles tests, in which the cache size depends on the number of disks in use.
[2] You can download this workload at http://squidbook.org/extras/pf2-pm4.pg.txt.
[3] On FreeBSD, softupdates aren’t a mount option, but must be set with the tunefs command.