Table of Contents for
Docker: Up & Running, 2nd Edition
 Docker: Up & Running, 2nd Edition
Published by
O'Reilly Media, Inc., 2018
Docker: Up & Running, 2nd Edition
Published by
O'Reilly Media, Inc., 2018
- Cover
- nav
- Docker: Up & Running
- Docker: Up and Running
- Dedication
- Foreword
- Preface
- 1. Introduction
- 2. The Docker Landscape
- 3. Installing Docker
- 4. Working with Docker Images
- 5. Working with Docker Containers
- 6. Exploring Docker
- 7. Debugging Containers
- 8. Exploring Docker Compose
- 9. The Path to Production Containers
- 10. Docker at Scale
- 11. Advanced Topics
- 12. Container Platform Design
- 13. Conclusion
- Index
- About the Authors
- Colophon
Chapter 10. Docker at Scale
One of Docker’s major strengths is its ability to abstract away the underlying hardware and operating system so that your application is not constrained to any particular host or environment. It facilitates scaling a stateless application not just horizontally within your data center, but also across cloud providers without many of the traditional barriers you would encounter. True to the shipping container metaphor, a container on one cloud looks like a container on another.
Many organizations find turnkey cloud deployments of Docker appealing because they can gain many of the immediate benefits of a scalable container-based platform without needing to completely build something in-house. Even though this is true, the barrier is actually pretty low for building your own platform in the cloud or in your own data center, and we’ll cover some options for doing that shortly.
The major public cloud providers have all worked to support Linux containers natively in their offerings. Some of the biggest efforts to implement Docker containers in the public cloud include:
Even cloud providers running on non-Linux operating systems like SmartOS and Windows are actively supporting the Docker ecosystem:
-
Azure Container Service (Azure supports both Windows and Linux operating systems)
It’s trivial to install Docker on a Linux instance in one of the public clouds. But getting Docker onto the server is usually just one step in the creation of a full production environment. You could do this completely on your own, or you could avail yourself of the many tools available from the major cloud providers, Docker, Inc., and the Docker community. Much of the tooling will work equally well in either a public cloud or your own data center.
A first step using built-in tooling might be to leverage Docker Engine’s Swarm mode to deploy containers easily across a large pool of Docker hosts. If you want to start with something even simpler, you could also try some of the deployment-oriented community tools like Ansible’s Docker tooling, New Relic’s Centurion, or Spotify’s Helios to quickly facilitate multihost container deployment without all the complexity of a full-blown scheduler.
In the realm of schedulers and more complex tooling systems, we are spoiled for choice with systems that replicate much of the functionality you would get from a public cloud provider, including Kubernetes, DC/OS Community Edition, and a standard Mesos cluster, as we discussed in the last chapter. Even if you run in a public cloud, there are some compelling reasons for why you might choose to run your own Docker environment rather than use one of the off-the-shelf offerings.
In this chapter, we’ll cover some options for running Docker at scale, first going through some of the simpler tools like Centurion and Docker Swarm mode, and then diving into some more advanced tools like Kubernetes and Amazon Elastic Container Service (ECS) with Fargate. All of these examples should give you a view of how you can leverage Docker to provide an incredibly flexible platform for your application workloads.
Centurion
Centurion is one of many tools that enables repeatable deployment of applications to a group of hosts. While most scheduler platforms treat the cluster as a single machine, you instead tell Centurion about each individual host that you want it to know about. Its focus is on simplifying and guaranteeing the repeatability of zero-down-time deployments with containers. Centurion does not do much more than manage your container deployment in a reliable manner, and this makes it very easy to get started with. It assumes that a load balancer sits in front of your application instances. Centurion is an easy first step in moving from traditional deployments to a Docker workflow and is a great option for people who aren’t ready for, or simply don’t need, the features of Swarm, Kubernetes, or Mesos.
Note
We could equally be covering Spotify’s Helios here, but we believe that Centurion is the simplest of these tools to get up and running. We encourage you to see if there are tools that are a better fit for your deployment needs, but this section should give you a taste of what you might achieve as a first step.
Let’s look at deploying a simple application with Centurion. Here you’ll deploy the public adejonge/helloworld container as your web application. It won’t do much more than serve up a welcome page that you can see in a browser. You could easily switch in your custom application. The only requirement is that it be deployed to a registry.
Before you can deploy, you have to satisfy the dependencies for the tool and get it installed. Centurion depends on the Docker command-line tool and requires that you have Ruby 2.0 or higher, so you’ll want to make sure you have a system with these installed. Centurion is known to run well on Linux or macOS. It can conceivably run on Windows, but this is untested by the package maintainers. Ruby runtime packages are available via yum, dnf, apk, and apt-get on all popular Linux distributions. Generally, any distribution with a kernel new enough to run Docker will ship with packages that meet this requirement. On recent macOS versions, you will already have the right version of Ruby. If you are on an older release, you can install a recent Ruby with Homebrew—which we installed in Chapter 3. Most Linux distributions that are capable of running Docker also ship with a modern enough Ruby to run Centurion. You can check to see if you have Ruby installed, and if you have a version new enough, like this:
$ ruby -v

ruby 2.4.2p198 (2017-09-14 revision 59899) [x86_64-darwin17]
Here, we have Ruby 2.4.2, which is plenty recent. Once you have Ruby running, install Centurion with the Ruby package manager:
$ gem install centurion

Fetching: trollop-2.1.2.gem (100%)
Successfully installed trollop-2.1.2
...
Parsing documentation for centurion-1.9.0
Installing ri documentation for centurion-1.9.0
Done installing documentation for trollop, excon, logger-colors,
  net-ssh, net-scp, sshkit, centurion after 5 seconds
7 gems installed
You can now invoke centurion from the command line to make sure it’s available:
$ centurion --help

Options:
  -p, --project=<s>          project (blog, forums...)
  -e, --environment=<s>      environment (production, staging...)
  -a, --action=<s>           action (deploy, list...) (default: list)
  -i, --image=<s>            image (yourco/project...)
  -t, --tag=<s>              tag (latest...)
  -h, --hosts=<s>            hosts, comma separated
  -d, --docker-path=<s>      path to docker executable (default: docker)
  -n, --no-pull              Skip the pull_image step
  --registry-user=<s>        user for registry auth
  --registry-password=<s>    password for registry auth
  -o, --override-env=<s>     override environment variables, comma separated
  -l, --help                 Show this message
There are a lot of options there, but right now you’re just making sure that it’s installed and working. If Centurion is not yet available and you get an error, then you can add it to your path like so:
$ gempath=`gem environment | grep '\- INSTALLATION DIRECTORY' | awk '{print $4}'`
$ export PATH=$gempath/bin:$PATH
You should now be able to invoke centurion --help and see the output of the help.
To begin with, you’ll just make a directory in which you’ll store the Centurion configuration. If this were your own custom application, this might be the application’s directory, or it might be a directory in which you store all the deployment configs for all of your applications. We encourage the latter for larger installations because it facilitates conversations between teams about the deployment configuration, and helps promote good patterns between teams. Since you’re just going to deploy the public adejonge/helloworld container, let’s create a temporary directory to house the configs. Then you’ll change directories into it and tell Centurion to scaffold a basic config for you with the centurionize tool:
$ cd /tmp
$ mkdir helloworld
$ cd helloworld
$ gem install bundle

...
Done installing documentation for bundler, bundle after 4 seconds
2 gems installed

$ centurionize -p helloworld

Creating /tmp/helloworld/config/centurion
Writing example config to /tmp/helloworld/config/centurion/helloworld.rake
Writing new Gemfile to /Users/skane/tmp/helloworld/Gemfile
Adding Centurion to the Gemfile

Remember to run `bundle install` before running Centurion

Done!
We can ignore the Gemfile for now and just open the config it generated for us in config/centurion/helloworld.rake. You might take a look at it to see what it put in place in order to get an idea of what Centurion can do. The scaffolded config contains examples of how to use many of Centurion’s features. We’ll just edit it down to the basics we care about:
namespace:environmentdodesc'Development environment'task:developmentdoset_current_environment(:development)set:image,'adejonge/helloworld'env_varsMY_ENV_VAR:'something important'host_port8080,container_port:8080host'192.168.2.10'host'192.168.2.25'endend
Note
It is important that you edit the host lines to match the hostnames or IP addresses for your Docker servers; otherwise, it won’t deploy anything! In theory, you can get Centurion working with Docker Community Edition for Mac and Windows, but at the moment, it is not straightforward or recommended.
There are two ways to use this. As is, it will require that you have Docker’s API open over the network so that Centurion can connect. Unless you’ve already got that secured, you probably want to use it over SSH instead. If you have a user who can use the Docker command locally on your servers, you can make Centurion SSH into your hosts to deploy your containers instead of requiring an exposed port. To enable this feature, simply, add something like this to the task in your Rakefile.
# Add on the line after 'set_current_environment(:development)'ssh_user=ENV['USER']puts"[Info] Will SSH using:#{ssh_user}"set:ssh,trueset:ssh_user,ssh_userset:ssh_log_level,Logger::WARN
If you are going to use SSH, you’ll want to add the required private keys to a local SSH agent so that you avoid any password prompts.
Centurion supports multiple environments in the same config. Here you’re just going to deploy to development. You could add as many environments as you like. The default file also uses a pattern where common configurations among environments are put into a common section that is called by each environment. For demonstration purposes, we’ve cut this config down to a bare minimum.
You now have a config that will let you deploy the adejonge/helloworld image from the public registry to two hosts, while setting the environment variable MY_ENV_VAR and mapping port 8080 inside the container to port 8080 of the server. Centurion supports any number of environment variables, hosts, ports, or volume mounts. The idea is to store a repeatable configuration for your application that can be stamped out onto as many Docker hosts as needed.
Centurion supports a rolling deployment model out of the box for web applications. It will cycle through a set of hosts, taking one container down at a time to help ensure that your application stays available throughout the deployment. It uses a defined health-check endpoint on a container to enable rolling deployments, health-checking each container as it comes up and not moving on to the next host until it has been successful. By default, this endpoint is set to “/” and that’s good enough for our simple welcome page application. Nearly all of this is configurable, but we’ll keep it simple for this demonstration. Once you’re more familiar with the tool, you should go back to the README to read about all of the other options.
You’re now ready to deploy this to your development environment. You are going to tell Centurion to use the helloworld project, use the development environment, and do a web application zero-downtime deployment with rolling_deploy. Centurion will initiate a docker pull on the hosts in parallel; then, on each host in turn, it will create a new container, tear down the old one, and start up the new one. We’ll cut down the very verbose output to get a clearer idea of the process:
$ centurion -p helloworld -e development -a rolling_deploy

...
I, [... #22324]  INFO -- : Fetching image adejonge/helloworld:latest IN PARALLEL
I, [... #22324]  INFO -- : Using CLI to pull
I, [... #22324]  INFO -- : Using CLI to pull
latest: Pulling from adejonge/helloworld
...
I, [... #22324]  INFO -- : ----- Connecting to Docker on 192.168.2.10 -----
...
I, [... #22324]  INFO -- : ----- Connecting to Docker on 192.168.2.10 -----
I, [... #22324]  INFO -- : Image sha256:4 found on 192.168.2.10
...
I, [... #22324]  INFO -- : ----- Connecting to Docker on 192.168.2.10 -----
I, [... #22324]  INFO -- : Looking for containers listening on port 8080
I, [... #22324]  INFO -- : Stopping container(s): []
I, [... #22324]  INFO -- : Creating new container for adejonge/helloworld:latest
I, [... #22324]  INFO -- : Starting new container 965f0947
I, [... #22324]  INFO -- : Inspecting new container 965f0947:
...
I, [... #22324]  INFO -- : Waiting for the port to come up
I, [... #22324]  INFO -- : Found container up for 0 seconds
I, [... #22324]  INFO -- : Container is up!
...
I, [... #22324]  INFO -- : ----- Connecting to Docker on 192.168.2.20 -----
I, [... #22324]  INFO -- : Service name helloworld
Here you can see Centurion pulling the requested image; verifying that it pulled properly; and then connecting to the hosts to stop the old container, create a new one, start it up, and then continuously health-check it until it reports back that it is healthy. At the very end, it cleans up the old containers so that they don’t hang around forever.
Now your application is up and running on both of your servers. You can connect to it with a web browser by hitting the IP address of either server on port 8080.
http://192.168.2.20:8080/
If everything is working correctly, you should see the simple message Hello World from Go in minimal Docker container in your web browser.
In real production, you’ll want a load balancer configured to sit in front of these hosts and redirect your clients to either of the instances. There is nothing dynamic to the Centurion setup, but it gets your application deployed with all the basic benefits of Docker for a minimal investment of time.
That’s all there is to a very basic setup. This class of tooling is very easy to get started with and will get you to a production infrastructure quickly. But growing your Docker deployment to a vast scale will likely involve a distributed scheduler or one of the cloud provider’s container platforms.
In that vein, let’s take a look at Docker’s Swarm tooling and see how this built-in Docker cluster mode can bridge the gap between simple tools like Centurion and the more full-featured robust platforms like Kubernetes and Amazon Elastic Container Service.
Docker Swarm Mode
After building the container runtime in the form of the Docker engine, the engineers at Docker turned to the problems of orchestrating a fleet of individual Docker hosts and effectively packing those hosts full of containers. The first tool that evolved from this work was called Docker Swarm. As we explained early on, and rather confusingly, there are now two things called “Swarm,” both of which come from Docker, Inc.
The original standalone Docker Swarm is officially Docker Swarm, but there is a second “Swarm,” which is more specifically called Swarm mode. This is actually built into the Docker Engine. The built-in Swarm mode is a lot more capable than the original Docker Swarm and is intended to replace it entirely. Swarm mode has the major advantage of not requiring you to install anything separately. You already have this on your Docker box! This is the Docker Swarm we’ll focus on here. Hopefully now that you know there are two different Docker Swarms, you won’t get confused by contradictory information on the internet.
The idea behind Docker Swarm is to present a single interface to the docker client tool, but have that interface be backed by a whole cluster rather than a single Docker daemon. Swarm is primarily aimed at managing clustered computing resources via the Docker tools. It has grown a lot since its first release and now contains several scheduler plug-ins with different strategies for assigning containers to hosts, and with basic service discovery built in. But it remains only one building block of a more complex solution. Docker has also added native support for deploying containers to Kubernetes into some Docker clients,1 which means that for some situations it is possible to start with a simpler solution like Swarm and then graduate to Kubernetes without needing to change as many of the tools that users rely on.
Swarm clusters can contain one or more managers that act as the central management hub for your Docker cluster. It is best to set up an odd number of managers. Only one manager will act as the cluster leader at a time. As you add more nodes to Swarm, you are merging them into a single, cohesive cluster that can be easily controlled with the Docker tooling.
Let’s get a Swarm cluster up and running. To start, you will need three or more Linux servers that can talk to each other over the network. Each of these servers should be running recent releases of Docker Community Edition from the official Docker software repositories.
Tip
Refer to Chapter 3 for details on installing the docker-ce packages on Linux.
For this example, we will use three Ubuntu servers running docker-ce. The very first thing you’ll need to do is ssh to the server that you want to use as the Swarm manager and then run the swarm init command using the IP address for your Swarm manager.
$ ssh 172.17.4.1
...

ubuntu@172.17.4.1:$ sudo docker swarm init --advertise-addr 172.17.4.1

Swarm initialized: current node (hypysglii5syybd2zew6ovuwq) is now a manager.

To add a worker to this swarm, run the following command:

    docker swarm join --token SWMTKN-1-14......a4o55z01zq 172.17.4.1:2377

To add a manager to this swarm, run 'docker swarm join-token manager' and follow
the instructions.
Warning
In many of this chapter’s examples, it’s important that you use the correct IP addresses for your manager and worker nodes.
This step will initialize the Swarm manager and give you the token that is required for nodes that want to join the cluster. Make note of this token somewhere safe, like a password manager. Don’t worry too much if you lose this token; you can always get it again by running the following command on the manager:
sudo docker swarm join-token --quiet worker
You can inspect your progress so far by running your local docker client pointed at the new manager node’s IP address.
$ docker -H 172.17.4.1 info

...
Swarm: active
 NodeID: usjngewgh5syybd2ws6ovqwe
 Is Manager: true
 ClusterID: k2ujqs3vf8l1f31qx5fh2pouh
 Managers: 1
 Nodes: 1
 Orchestration:
  Task History Retention Limit: 5
 Raft:
  Snapshot Interval: 10000
  Number of Old Snapshots to Retain: 0
  Heartbeat Tick: 1
  Election Tick: 3
 Dispatcher:
  Heartbeat Period: 5 seconds
 CA Configuration:
  Expiry Duration: 3 months
  Force Rotate: 0
 Autolock Managers: false
 Root Rotation In Progress: false
 Node Address: 172.17.4.1
 Manager Addresses:
  172.17.4.1:2377
...
You can also list all of the nodes that are currently in the cluster with the following command:
$ docker -H 172.17.4.1 node ls

ID         HOSTNAME       STATUS  AVAILABILITY  MANAGER STATUS
hyp...  *  ip-172-17-4-1  Ready   Active        Leader
At this point, you can add the two additional servers as workers to the Swarm cluster. This is what you’d do in production if you were going to scale up, and Swarm makes this pretty easy.
$ ssh 172.17.4.2 \
    "sudo docker swarm join --token SWMTKN-1-14......a4o55z01zq 172.17.4.1:2377"

This node joined a swarm as a worker.

$ ssh 172.17.4.3 \
    "sudo docker swarm join --token SWMTKN-1-14......a4o55z01zq 172.17.4.1:2377"

This node joined a swarm as a worker.
If you rerun docker node ls you should now see that you have a total of three nodes in your cluster, and only one of them is marked as the Leader.
$ docker -H 172.17.4.1 node ls

ID         HOSTNAME       STATUS  AVAILABILITY  MANAGER STATUS
hyp... *   ip-172-17-4-1  Ready   Active        Leader
qwe...     ip-172-17-4-2  Ready   Active
poi...     ip-172-17-4-3  Ready   Active
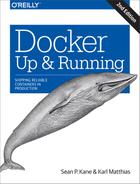
This is all that’s required to get a Swarm cluster up and running in Swarm mode (Figure 10-1)!
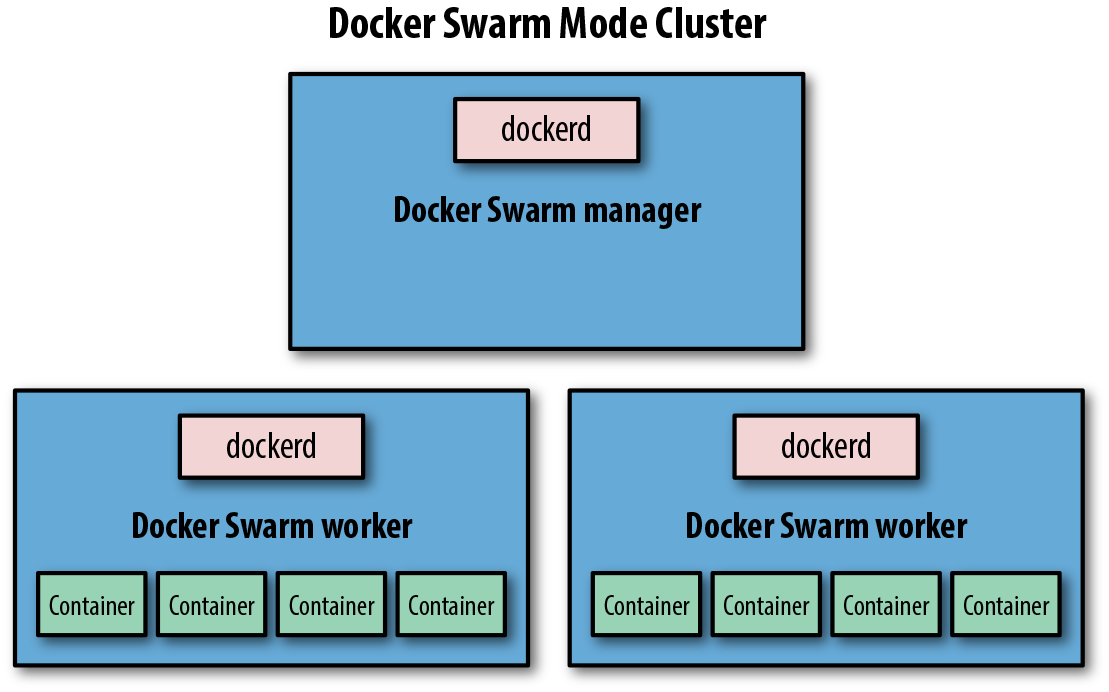
Figure 10-1. Simple Docker Swarm Mode cluster
The next thing you should do is create a default network for your services to use. Again, it’s pretty simple to do that:
$ docker -H 172.17.4.1 network create --driver=overlay default-net

ckwh5ph4ksthvx6843ytrl5ik
Up to this point, we’ve just been getting the underlying pieces running, and so far we haven’t deployed any real business logic. So let’s launch your first service into the cluster. You can do that with a command like this:
$ docker -H 172.17.4.1 service create --detach=true --name quantum \
    --replicas 2 --publish published=80,target=8080 --network default-net \
    spkane/quantum-game:latest

tiwtsbf270mh83032kuhwv07c
The service we’re launching with starts containers that host the Quantum web game. This is a browser-based puzzle game that uses real quantum mechanics. We hope that this is a more interesting example than another Hello World!
Warning
Although we’re using the latest tag in many of these examples, it is important that you don’t use this tag in production. It is convenient for the book, since we can easily push out updates to the code, but this tag floats and cannot be pinned to a specific release over a long period of time. That means if you use latest, then your deployments are not repeatable! It can also easily lead to a situation where you don’t have the same version of an application running on all the servers.
Let’s now see where those containers ended up, by running docker service ps against the service name you created:
$ docker -H 172.17.4.1 service ps quantum

ID   NAME      IMAGE      NODE          DESIRED STATE CURRENT STATE          ...
v... quantum.1 spkane/... ip-172-17-4-2 Running       Running 56 seconds ago
u... quantum.2 spkane/... ip-172-17-4-3 Running       Running 56 seconds ago
Swarm mode uses a routing mesh between the nodes to automatically route traffic to a container that can serve the request. When you specify a published port in the docker service create command, the mesh makes it possible to hit this port on any of your three nodes and will route you to the web application. Notice that we said any of the three nodes even though you only have two instances running. Traditionally, you would have had to also set up a separate reverse proxy layer to accomplish this, but its batteries are included with Swarm mode.
To prove it, you can test the service now by pointing a web browser to the IP address of any of your nodes.
http://172.17.4.1/
If everything is working as expected, you the splash screen for “The Quantum Game” will greet you, quickly followed by the puzzle board.
Here we only have one instance running, but you would probably have a number of instances in a real-world scenario. To get a list of all the services, we can use service ls:
$ docker -H 172.17.4.1 service ls

ID     NAME     MODE        REPLICAS  IMAGE                       PORTS
tn...  quantum  replicated  2/2       spkane/quantum-game:latest  *:80->8080/tcp
This gives us a summary view with the most commonly needed information, but sometimes that’s not enough. Docker maintains a lot of other metatadata about services, just like it does for containers. Mimicking the Docker CLI, we can get detailed information about a service with service inspect:
$ docker -H 172.17.4.1 service inspect --pretty quantum

ID:		tn5075th07tuncwqa4po4a514
Name:		quantum
Service Mode:	Replicated
 Replicas:	2
Placement:
UpdateConfig:
 Parallelism:	1
 On failure:	pause
 Monitoring Period: 5s
 Max failure ratio: 0
 Update order:      stop-first
RollbackConfig:
 Parallelism:	1
 On failure:	pause
 Monitoring Period: 5s
 Max failure ratio: 0
 Rollback order:    stop-first
ContainerSpec:
 Image:		spkane/quantum-game:latest@sha256:257286d3126622397f...
Resources:
Networks: default-net
Endpoint Mode:	vip
Ports:
 PublishedPort = 80
  Protocol = tcp
  TargetPort = 8080
  PublishMode = ingress
There is a lot of info here, so let’s point out some of the more important things. First we can see that this is a replicated service with two replicas, just like we saw in the service ls command. We can also see that Docker is health-checking the service at five-second intervals. Running an update to the service will use the stop-first method, which means it will take our service first to N−1 and then spin up a new instance to take us back to N. You might want to always run in N+1 mode so that you are never down a node during updates in production. You can change that with the --update-order=start-first option to the service update command. It will exhibit the same behavior in a rollback scenario, and we can likewise change that with --rollback-order=start-first.
In a real-world scenario, we need to be able to not only launch our service but also to scale it up and down. It would be a shame if we had to redeploy it to do that, not to mention it could introduce any number of issues. Luckily, Swarm makes it easy to scale our services with a single command. To double the number of instances you have running from two to four, you can simply run this:
$ docker -H 172.17.4.1 service scale --detach=false quantum=4

quantum scaled to 4
overall progress: 4 out of 4 tasks
1/4: running   [==================================================>]
2/4: running   [==================================================>]
3/4: running   [==================================================>]
4/4: running   [==================================================>]
verify: Service converged
Note
We used --detach=false in the previous command so that it was easier to see what was happening.
We can now use service ps to show us that Swarm did what we asked. This is the same command we ran earlier, but now we should have more copies running! But wait, didn’t we ask for more copies than we have nodes?
$ docker -H 172.17.4.1 service ps quantum

ID   NAME      IMAGE      NODE          DESIRED STATE CURRENT STATE          ...
v... quantum.1 spkane/... ip-172-17-4-2 Running       Running 56 seconds ago
u... quantum.2 spkane/... ip-172-17-4-3 Running       Running 56 seconds ago
e... quantum.3 spkane/... ip-172-17-4-1 Running       Running 2 minutes ago
q... quantum.4 spkane/... ip-172-17-4-1 Running       Running 2 minutes ago
You’ll notice that you have two services running on the same host. Did you expect that? This may not be ideal for host resiliency, but by default Swarm will prioritize ensuring that you have the number of instances that you requested over spreading individual containers across hosts when possible. If you don’t have enough nodes, you will get multiple copies on each node. In a real-world scenario, you need to think carefully about placement and scaling. You might not be able to get away with running multiple copies on the same host in the event that you lose a whole node. Would your application still serve users at that reduced scale?
When you need to deploy a new release of your software, you will want to use the docker service update command. There are a lot of options to this command, but here’s one example:
$ docker -H 172.17.4.1 service update --update-delay 10s \
    --update-failure-action rollback --update-monitor 5s \
    --update-order start-first --update-parallelism 1 \
    --detach=false \
    --image spkane/quantum-game:latest-plus quantum

quantum
overall progress: 4 out of 4 tasks
1/4: running   [==================================================>]
2/4: running   [==================================================>]
3/4: running   [==================================================>]
4/4: running   [==================================================>]
verify: Service converged
Running this command will cause Swarm to update your service one container at a time, pausing in between each update. Great, but what if something were to go wrong? We might need to deploy a previous release to get back to working order. You could now roll back to the previous version with the service rollback command, which we discussed in passing a little bit earlier:
$ docker -H 172.17.4.1 service rollback quantum

quantum
rollback: manually requested rollback
overall progress: rolling back update: 4 out of 4 tasks
1/4: running   [>                                                  ]
2/4: running   [>                                                  ]
3/4: running   [>                                                  ]
4/4: running   [>                                                  ]
verify: Service converged
That’s about as nice a rollback mechanism as you could ask for. You don’t have to keep track of the previous version; Docker does that for you. All you need to do is tell it to roll back and it pulls the previous metadata out of its internal storage and performs the rollback. Note that just like during deployment, it can health-check your nodes to make sure the rollback is working successfully.
So, what happens if one of your servers is experiencing an issue and you need to take it offline? In this case, you can easily drain all the services off of a single node by using the --availability option to the docker node update command.
Let’s take a look at the nodes that you have in the cluster again:
 docker -H 172.17.4.1 node ls

ID         HOSTNAME       STATUS  AVAILABILITY  MANAGER STATUS
hyp... *   ip-172-17-4-1  Ready   Active        Leader
qwe...     ip-172-17-4-2  Ready   Active
poi...     ip-172-17-4-3  Ready   Active
Let’s also check where our containers are currently running:
$ docker -H 172.17.4.1 service ps -f "desired-state=running" quantum

ID   NAME      IMAGE      NODE          DESIRED STATE CURRENT STATE         ...
f... quantum.1 spkane/... ip-172-17-4-1 Running       Running 6 minutes ago
7... quantum.2 spkane/... ip-172-17-4-1 Running       Running 6 minutes ago
r... quantum.3 spkane/... ip-172-17-4-2 Running       Running 6 minutes ago
6... quantum.4 spkane/... ip-172-17-4-3 Running       Running 6 minutes ago
Tip
In the previous command, we used a filter so that the output showed only the currently running processes. By default, Docker will also show you the previous containers that were running in a tree format, so that you can see things like updates and rollbacks in the output.
If you have determined that the server at 172.17.4.3 is in need of downtime, you could drain the tasks of that node and move them to another host by modifying the availability state to drain in Swarm:
$ docker -H 172.17.4.1 node update --availability drain ip-172-17-4-3

ip-172-17-4-3
If we inspect the node, we can see that the availability is now set to drain.
$ docker -H 172.17.4.1 node inspect --pretty ip-172-17-4-3

ID:			l9j10ijs5e4843iwghjsplqae
Hostname:              	ip-172-17-4-3
Joined at:             	2018-03-11 18:57:17.663732624 +0000 utc
Status:
 State:			Ready
 Availability:         	Drain
 Address:		172.17.4.3
Platform:
 Operating System:	linux
 Architecture:		x86_64
Resources:
 CPUs:			2
 Memory:		7.797GiB
Plugins:
 Log:		awslogs, fluentd, gcplogs, gelf, journald, json-file, ...
 Network:		bridge, host, macvlan, null, overlay
 Volume:		local
Engine Version:		17.12.1-ce
TLS Info:
 TrustRoot:
...

 Issuer Subject:	...
 Issuer Public Key:	...
You might be wondering what effect that has on the service. We told one of the nodes to stop running copies of the service, and they either have to go away or migrate somewhere else. What did it do? We can look at the details of our service again and see that all the running containers on that host have been moved to a different node.
$ docker -H 172.17.4.1 service ps -f "desired-state=running" quantum

ID   NAME      IMAGE      NODE          DESIRED STATE CURRENT STATE         ...
f... quantum.1 spkane/... ip-172-17-4-1 Running       Running 19 minutes ago
7... quantum.2 spkane/... ip-172-17-4-1 Running       Running 19 minutes ago
r... quantum.3 spkane/... ip-172-17-4-2 Running       Running 19 minutes ago
4... quantum.4 spkane/... ip-172-17-4-2 Running       Running 5 minutes ago
At this point, it is safe to bring down the node and do whatever work is required to make it healthy again. When you are ready to add the node back into the Swarm cluster, you can do so by running:
$ docker -H 172.17.4.1 node update --availability active ip-172-17-4-3

ip-172-17-4-3
We’ll spare you from reinspecting the node at the moment, but you can always rerun the node inspect command if you want to see what this looks like.
Warning
When you add a node back to the cluster, containers will not automatically balance! However, a new deploy or update should result in the containers being evenly spread across the nodes.
Once you are done, you can remove your service with the following command:
$ docker -H 172.17.4.1 service rm quantum

quantum
and then verify that it is indeed completely gone:
$ docker -H 172.17.4.1 service ps quantum

no such service: quantum
That’s all for now! At this point, you can safely tear down all of the servers that were a part of your Swarm cluster if you no longer need them.
That was kind of a whirlwind tour, but covers the basics of using Swarm mode in Docker Engine and should help get you started building your own Docker cluster for deployment.
Amazon ECS and Fargate
One of the most popular cloud providers is Amazon via their AWS offering. Support for running containers natively has existed in Elastic Beanstalk since mid-2014. But that service assigns only a single container to an Amazon instance, which means that it’s not ideal for short-lived or lightweight containers. EC2 itself is a great platform for hosting your own Docker environment, though, and because Docker is powerful, you don’t necessarily need much on top of your instances to make this a productive environment to work in. But Amazon has spent a lot of engineering time building a service that treats containers as first-class citizens: the Elastic Container Service (ECS). In the last few years they have built upon this support with products like the ECS for Kubernetes (EKS) and, more recently, Fargate.
Note
Fargate is simply a marketing label Amazon uses for the new feature of ECS that makes it possible for AWS to automatically manage all the nodes in your container cluster so that you can focus on deploying your service.
The Elastic Container Service is a set of tools that coordinates several AWS components. With ECS, you have a choice of whether or not you will run the Fargate tooling on top. If you do, then you don’t need to handle as much of the work. If you don’t, then in addition to the cluster nodes to handle your workload you will also need to add one or more EC2 instances to the cluster running Docker and Amazon’s special ECS agent. If you run Fargate, then the cluster is automatically managed for you. In either case, you spin up the cluster and then push your containers into it.
The Amazon ECS agent we just mentioned works with the ECS service to coordinate your cluster and schedule containers to your hosts. You will only be directly exposed to this when you manage a traditional non-Fargate ECS cluster.
Core AWS Setup
The rest of this section assumes that you have access to an AWS account and some familiarity with the service. You can learn about pricing and create a new account at aws.amazon.com/free/. Amazon offers a free service tier, which may be enough for you to experiment with if you don’t already have a paid account. After you have your AWS account set up, you will need at least one administrative user, a key pair, a virtual private cloud (VPC), and a default security group in your environment. If you do not already have these set up, follow the directions in the Amazon documentation.
IAM Role Setup
AWS’s Identity and Access Management (IAM) roles are used to control what actions a user can take within your cloud environment. We need to make sure we can grant access to the right actions before moving on with the Elastic Container Service.
To work with the ECS, you need to create a role called ecsInstanceRole that has the AmazonEC2ContainerServiceforEC2Role managed role attached to it. The easiest way to do this is by logging into the AWS console and then navigating to Identity and Access Management.
Tip
Check to ensure that you don’t already have the proper role. If it already exists, then you should double-check that it is set up properly, as these directions have changed a bit over the years.
-
In the left sidebar, click Roles.
-
Then, click the “Create role” button.
-
Under AWS Service, select Elastic Container Service.
-
Under “Select your use case,” select Elastic Container Service.
-
Click Next: Permissions.
-
Click Next: Review.
-
In Role Name, type:
ecsInstanceRole. -
Click “Create role.”
If you are interested in storing container configuration in an S3 object storage bucket, take a look at the Amazon ECS Container Agent Configuration documentation.
AWS CLI Setup
Amazon supplies command-line tools that make it easy to work with their API-driven infrastructure. You will need to install a very recent version of the AWS command-line interface (CLI) tools. Amazon has detailed documentation that covers installation of their tools, but the basic steps are as follows.
Installation
Here we’ll cover installation on a few different OSes. You can feel free to skip to the one you care about. If you’re curious or just like installation instructions, by all means read them all!
- macOS
-
In Chapter 3, we discussed installing Homebrew. If you previously did this, you can install the AWS CLI using the following commands:
$ brew update
$ brew install awscli
- Windows
-
Amazon provides a standard MSI installer for Windows, which can be downloaded from Amazon S3 for your architecture:
- Other
-
The Amazon CLI tools are written in Python. So on most platforms, you can install the tools with the Python
pippackage manager by running the following from a shell:$ pip install awscli --upgrade --user
Some platforms won’t have pip installed by default. In that case, you can use the easy_install package manager, like this:
$ easy_install awscli
Configuration
Quickly verify that your AWS CLI version is at least 1.7.0 with the following command:
$ aws --version

aws-cli/1.14.50 Python/3.6.4 Darwin/17.3.0 botocore/1.9.3
To configure the AWS CLI tool, ensure that you have access to your AWS access key ID and AWS secret access key, and then run the configure command. You will be prompted for your authentication information and some preferred defaults:
$ aws configure

AWS Access Key ID [None]: EXAMPLEEXAMPLEEXAMPLE
AWS Secret Access Key [None]: ExaMPleKEy/7EXAMPL3/EXaMPLeEXAMPLEKEY
Default region name [None]: us-east-1
Default output format [None]: json
At this point, it’s a really good idea to test that the CLI tools are working correctly before proceeding. We can easily do that by running the following command to list the IAM users in your account:
$ aws iam list-users
Assuming everything went according to plan and you chose JSON as your default output format, you should get something like this:
{"Users":[{"Path":"/","UserName":"administrator","UserId":"ExmaPL3ExmaPL3ExmaPL3Ex","Arn":"arn:aws:iam::936262807352:user/myuser","CreateDate":"2017-12-14T19:33:23Z"}]}
Container Instances
The first thing you need to do after installing the required tools is to create at least a single cluster that your Docker hosts will register with when they are brought online.
Note
The default cluster name is imaginatively named “default.” If you keep this name, you do not need to specify --cluster-name in many of the commands that follow.
The first thing you need to do is create a cluster in the container service. You will then launch your tasks in the cluster once it’s up and running. For these examples, you should start by creating a cluster called fargate-testing:
$ aws ecs create-cluster --cluster-name fargate-testing
{"cluster":{"clusterArn":"arn:aws:ecs:us-east-1:1...2:cluster/fargate-testing","clusterName":"fargate-testing","status":"ACTIVE","registeredContainerInstancesCount":0,"runningTasksCount":0,"pendingTasksCount":0,"activeServicesCount":0}}
Before AWS Fargate was released, you were required to create AWS EC2 instances running docker and the ecs-agent and add them into your cluster. You can still use this approach if you want (EC2 launch type), but Fargate makes it much easier to run a dynamic cluster that can scale fluidly with your workload.
Tasks
Now that our container cluster is set up, we need to start putting it to work. To do this, we need to create at least one task definition. The Amazon Elastic Container Service defines the term task definition as a list of containers grouped together.
To create your first task definition, open up your favorite editor, copy in the following JSON, and then save it as webgame-task.json in your current directory, as shown here:
{"containerDefinitions":[{"name":"web-game","image":"spkane/quantum-game","cpu":0,"portMappings":[{"containerPort":8080,"hostPort":8080,"protocol":"tcp"}],"essential":true,"environment":[],"mountPoints":[],"volumesFrom":[]}],"family":"fargate-game","networkMode":"awsvpc","volumes":[],"placementConstraints":[],"requiresCompatibilities":["FARGATE"],"cpu":"256","memory":"512"}
Tip
You can also check out these files and a few others by running:
git clone \
    https://github.com/bluewhalebook/\
docker-up-and-running-2nd-edition.git
The URL above has been continued on the following line so that it fits in the margins. You may find that you need to re-assemble the URL and remove the backslashes for the command to work properly.
In this task definition, we are saying that we want to create a task family called fargate-game running a single container called web-game that is based on the Quantum web game. This Docker image launches a browser-based puzzle game that uses real quantum mechanics.
Tip
Fargate limits some of the options that you can set in this configuration, including networkMode and the cpu and memory settings. You can find more out about the options in the task definition from the official AWS documentation.
In this task definition, we define some constraints on memory and CPU usage for the container, in addition to telling Amazon whether this container is essential to the task. The essential flag is useful when you have multiple containers defined in a task, and not all of them are required for the task to be successful. If essential is true and the container fails to start, then all the containers defined in the task will be killed and the task will be marked as failed. We can also use the task definition to define almost all of the typical variables and settings that would be included in a Dockerfile or on the docker run command line.
To upload this task definition to Amazon, you will need to run a command similar to what is shown here:
$ aws ecs register-task-definition --cli-input-json file://./webgame-task.json
{"taskDefinition":{"taskDefinitionArn":"arn:aws:ecs:...:task-definition/fargate-game:1","containerDefinitions":[{"name":"web-game","image":"spkane/quantum-game","cpu":0,"portMappings":[{"containerPort":8080,"hostPort":8080,"protocol":"tcp"}],"essential":true,"environment":[],"mountPoints":[],"volumesFrom":[]}],"family":"fargate-game","networkMode":"awsvpc","revision":2,"volumes":[],"status":"ACTIVE","requiresAttributes":[{"name":"com.amazonaws.ecs.capability.docker-remote-api.1.18"},{"name":"ecs.capability.task-eni"}],"placementConstraints":[],"compatibilities":["EC2","FARGATE"],"requiresCompatibilities":["FARGATE"],"cpu":"256","memory":"512"}}
We can then list all of our task definitions by running the following:
$ aws ecs list-task-definitions
{"taskDefinitionArns":["arn:aws:ecs:us-east-1:012345678912:task-definition/fargate-game:1",]}
Now you are ready to create your first task in your cluster. You do so by running a command like the one shown next. The count argument in the command allows you to define how many copies of this task you want deployed into your cluster. For this job, one is enough.
You will need to modify the following command to reference a valid subnet ID and security-group ID from your AWS VPC. You should be able to find these in the AWS console or by using the AWS CLI commands aws ec2 describe-subnets and aws ec2 describe-security-groups. You can also tell AWS to assign your tasks a public IP address by using a network configuration similar to this:
awsvpcConfiguration={subnets=[subnet-abcd1234],securityGroups=[sg-abcd1234],assignPublicIp=ENABLED}.
$ aws ecs create-service --cluster fargate-testing --service-name \
    fargate-game-service --task-definition fargate-game:1 --desired-count 1 \
    --launch-type "FARGATE" --network-configuration \
    "awsvpcConfiguration={subnets=[subnet-abcd1234],\
    securityGroups=[sg-abcd1234]}"
{"service":{"serviceArn":"arn:aws:ecs:...:service/fargate-game-service","serviceName":"fargate-game-service","clusterArn":"arn:aws:ecs:...:cluster/fargate-testing","loadBalancers":[],"status":"ACTIVE","desiredCount":1,"runningCount":0,"pendingCount":0,"launchType":"FARGATE","platformVersion":"LATEST","taskDefinition":"arn:aws:ecs:...:task-definition/fargate-game:1","deploymentConfiguration":{"maximumPercent":200,"minimumHealthyPercent":100},"deployments":[{...}],"roleArn":"arn:...role/ecs.amazonaws.com/AWSServiceRoleForECS","events":[],"createdAt":1520727776.555,"placementConstraints":[],"placementStrategy":[],"networkConfiguration":{"awsvpcConfiguration":{"subnets":["subnet-abcd1234"],"securityGroups":["sg-abcd1234"],"assignPublicIp":"DISABLED"}}}}
Tip
Fargate and the awsvpc network require that you have a service linked role for ECS. In the preceding output, you should see a line that ends like this:
"role/aws-service-role/ecs.amazonaws.com/AWSServiceRoleForECS"
Most of the time this will be autogenerated for you, but you can create it manually using the following command:
aws iam create-service-linked-role \
  --aws-service-name ecs.amazonaws.com
You can now list all of the services in your cluster with the following command:
$ aws ecs list-services --cluster fargate-testing
{"serviceArns":["arn:aws:ecs:us-east-1:012345678912:service/fargate-game-service"]}
To retrieve all the details about your service, run:
$ aws ecs describe-services --cluster fargate-testing \
    --services fargate-game-service
{"services":[{..."deployments":[{"id":"ecs-svc/9223370516126999252","status":"PRIMARY","taskDefinition":"arn:...:task-definition/fargate-game:1","desiredCount":1,"pendingCount":1,"runningCount":0,"createdAt":1520727776.555,"updatedAt":1520727776.555,"launchType":"FARGATE","platformVersion":"1.0.0","networkConfiguration":{"awsvpcConfiguration":{"subnets":["subnet-abcd1234"],"securityGroups":["sg-abcd1234"],"assignPublicIp":"DISABLED"}}}],"roleArn":"...role/ecs.amazonaws.com/AWSServiceRoleForECS","events":[{"id":"2781cc1c-bdae-46f3-a767-f53013cc3801","createdAt":1520727990.202,"message":"(...game-service) has reached a steady state."}],...}],"failures":[]}
This output will tell you a lot about all the tasks in your service. In this case we have a single task, which we can see has “reached a steady state.”
Note
The task-definition value is a name followed by a number (fargate-game:1). The number is the revision. If you edit your task and reregister it with the aws ecs register-task-definition command, you will get a new revision, which means that you will want to reference that new revision in various commands like aws ecs update-service. If you don’t change that number, you will continue to launch containers using the older JSON. This versioning makes it very easy to roll back changes and test new revisions without impacting all future instances.
If you want to see what individual tasks are running in your cluster, you can run the following:
$ aws ecs list-tasks --cluster fargate-testing
{"taskArns":["arn:aws:ecs:...:task/2781cc1c-bdae-46f3-a767-f53013cc3801"]}
Since you only have a single task in your cluster at the moment, this list is very small. You will also notice that the task ID matches the ID for the task that is listed in “a steady state” in your service.
To get more details about the individual task, you can run the following command after substituting the task ID with the correct one from your cluster:
$ aws ecs describe-tasks --cluster fargate-testing \
  --task 2781cc1c-bdae-46f3-a767-f53013cc3801
{"tasks":[{"taskArn":"arn:aws:...:task/2781cc1c-bdae-46f3-a767-f53013cc3801","clusterArn":"arn:aws:ecs:...:cluster/fargate-testing","taskDefinitionArn":"arn:aws:...:task-definition/fargate-game:1","overrides":{"containerOverrides":[{"name":"web-game"}]},"lastStatus":"RUNNING","desiredStatus":"RUNNING","cpu":"256","memory":"512","containers":[{..."name":"web-game","lastStatus":"RUNNING","networkBindings":[],"networkInterfaces":[{"attachmentId":"a0d40aec-...-0c4086ed10d7","privateIpv4Address":"10.11.6.240"}]}],"startedBy":"ecs-svc/9223370516124771373","version":4,"connectivity":"CONNECTED",..."group":"service:fargate-game-service","launchType":"FARGATE","platformVersion":"1.0.0","attachments":[{"id":"a0d40aec-3469-4eb0-8bd3-0c4086ed10d7","type":"ElasticNetworkInterface","status":"ATTACHED","details":[{"name":"subnetId","value":"subnet-abcd1234"},{"name":"networkInterfaceId","value":"eni-abcd1234"},{"name":"macAddress","value":"0f:c7:7d:ac:d1:ff"},{"name":"privateIPv4Address","value":"10.4.0.100"}]}]}],"failures":[]}
If you notice that the lastStatus key is displaying a value of PENDING, this most likely means that your service is still starting up. You can describe the task again to ensure that it has completed transitioning into a RUNNING state. After verifying that the lastStatus key is set to RUNNING, you should be able to test your container.
Testing the Task
You will need a modern web browser installed on your system to connect to the container and test the web game.
In the previous output, you’ll notice that the privateIPv4Address for the example task was listed as 10.4.0.100. Yours will be different, and you may also have a publicIPv4Address if you configured your service for that.
Ensure that you are connected to a network that can reach either the public or private IP address of your host, then launch your web browser and navigate to port 8080 on that IP address.
In the example, this URL would look like:
http://10.4.0.100:8080/
If everything is working as expected, you should be greeted by the splash screen for “The Quantum Game,” which will then be quickly followed by the puzzle board.
The official version of the game can be found at http://quantumgame.io.
Note
We completely understand if you get distracted at this point and stop reading for a few hours while trying to solve some puzzles and learn a little bit of quantum mechanics at the same time. The book won’t notice! Put it down, play the puzzles, pick it back up later.
Stopping the Task
Right, so we have a running task. Now let’s take a look at stopping it. To do that, you need to know the task ID. One way to obtain this is by relisting all the tasks running in your cluster.
$ aws ecs list-tasks --cluster fargate-testing
{"taskArns":["arn:aws:ecs:...:task/2781cc1c-bdae-46f3-a767-f53013cc3801"]}
You can also obtain it from the service information:
$ aws ecs describe-services --cluster fargate-testing \
    --services fargate-game-service
{...{"id":"a63e7114-9592-417c-96cf-559b82096cbc","createdAt":1520730006.052,"message":"(service fargate-game-service) has started 1..."}...}
Finally, we can stop the task by running the following command with the correct task ID:
$ aws ecs stop-task --cluster fargate-testing \
    --task 2781cc1c-bdae-46f3-a767-f53013cc3801
{..."lastStatus":"RUNNING","desiredStatus":"STOPPED",...}
If you describe the task again using the same task ID, you should now see that the lastStatus key is set to STOPPED:
$ aws ecs describe-tasks --cluster fargate-testing \
    --task 2781cc1c-bdae-46f3-a767-f53013cc3801
{..."lastStatus":"STOPPED","desiredStatus":"STOPPED",...}
And finally, listing all the tasks in our cluster should return an empty set:
$ aws ecs list-tasks --cluster fargate-testing
{"taskArns":[]}
At this point, you can start creating more complicated tasks that tie multiple containers together and rely on the ECS and Fargate tooling to spin up hosts and deploy the tasks into your cluster as needed.
Kubernetes
Now let’s take some time to look at Kubernetes. Since its release to the public during DockerCon 2014, Kubernetes has grown rapidly and is now probably the most widely adopted of the container platforms. It is not the most mature product today—that distinction goes to Mesos, which first launched in 2009 before containers were in widespread use—but Kubernetes has a great mix of functionality and a very strong community that includes many early Docker adopters. This mix has helped significantly increase its popularity over the years. At DockerCon EU 2017, Docker, Inc. announced that Kubernetes support will be coming to the Docker Engine tooling itself. Supported Docker clients can mix deployments between Swarm and Kubernetes from the same tooling, which makes Kubernetes even more attractive as a large-scale platform for Docker deployments.
But Docker’s Kubernetes implementation is only the latest in a large string of releases. Like Linux itself, Kubernetes is available in a number of distributions, both free and commercial. There are currently a few dozen that are available and supported to varying degrees. Its widespread adoption means Kubernetes now has some pretty nice tooling for running it locally, including a whole distribution that can be controlled and installed locally with a single binary: Minikube. That’s the distribution we’ll use to do a quick runthrough of a Kubernetes cluster. Most of the concepts you’ll learn while working with Minikube can be applied to any Kubernetes implementation, so it’s a great place to start.
What Is Minikube?
Minikube is a whole distribution of Kubernetes for a single instance. It runs on a virtual machine on your own computer and allows you to use all the same tooling against the cluster that you would use in a production system. In scope, it’s a little bit like Docker Compose: it will let you stand up a whole stack locally. It goes one step further than Compose, though, in that it actually has all the production APIs. As a result, if you run Kubernetes in production, you can have an environment on your desktop that is reasonably close in fucntion, if not in scale, to what you are running in production.
Minikube is fairly unique in that all of the distribution is controlled from a single binary you download and run locally. It will autodetect which virtual machine (VM) manager you have locally and will set up and run a VM with all of the necessary tooling on it. That means getting started with it is pretty simple.
So let’s install it!
Installing Minikube
Most of the installation is the same across all platforms because once you have the tools installed, they will be your gateway to the VM running your Kubernetes installation. Just skip to the section that applies to your operating system. Once you have the tool up and running, you can follow the shared documentation.
We need two tools to use Minikube effectively: minikube and kubectl. For the purposes of our simple installation, we’re going to leverage the fact that both of these commands are static binaries with no outside dependencies, which makes them easy to install.
Note
There are a number of other ways to install Minikube. We’re going to show you what we think is the simplest path on each platform. If you have strong preferences about how to do this, you should feel free to do so. On Windows, for example, you might prefer to use the Chocolatey package manager, or the Snap package system on Linux.
macOS
Just as in Chapter 3, you will need to have Homebrew installed on your system. If you don’t, go back to Chapter 3 and make sure you have it set up. Once you do, it’s trivial to install the minikube client:
$ brew cask install minikube
This will cause Hombrew to install a new cask, and then look there for the tooling to download Minikube. It will look something like this depending, on your configuration:
==> Auto-updated Homebrew!
...
==> Updated Formulae
...
==> Satisfying dependencies
All Formula dependencies satisfied.
==> Downloading https://storage.googleapis.com/minikube/.../minikube-darwin-amd64
######################################################################## 100.0%
==> Verifying checksum for Cask minikube
==> Installing Cask minikube
==> Linking Binary 'minikube-darwin-amd64' to '/usr/local/bin/minikube'.
That’s it! Let’s test to make sure it’s in your path:
$ which minikube
/usr/local/bin/minikube
If you don’t get a response, you will need to make sure you have /usr/local/bin in your PATH environment variable. Assuming that passes, you now have the minikube tool installed.
Now you just need to get kubectl installed, and you can do that with brew as well. Generally, the version of Kubernetes in Homebrew will match the current release of Minikube, so using brew install should help prevent mismatches:
$ brew install kubernetes-cli
==> Downloading https://.../kubernetes-cli-1.9.3.high_sierra.bottle.tar.gz
Already downloaded: /.../kubernetes-cli-1.9.3.high_sierra.bottle.tar.gz
==> Pouring kubernetes-cli-1.9.3.high_sierra.bottle.tar.gz
==> Caveats
Bash completion has been installed to:
  /usr/local/etc/bash_completion.d

zsh completions have been installed to:
  /usr/local/share/zsh/site-functions
==> Summary
  /usr/local/Cellar/kubernetes-cli/1.9.3: 172 files, 65.4MB
We’ll test that the same way we tested minikube:
$ which kubectl
/usr/local/bin/kubectl
We’re good to go!
Windows
As with installing Docker on Windows, you’ll need to have Hyper-V or another supported virtualization platform installed in order to run the Kubernetes virtual machine. But there is no additional tooling needed on Windows. You’ll simply download the binary and put it in a place you have in your PATH so that you can execute it on the command line. As of this writing, the URL is hosted on googleapis, which is usually very reliable about maintaining APIs. You’ll want to rename that file to minikube.exe once you’ve downloaded it; otherwise, you’ll be doing a lot more typing than you probably want!
You then need to get the latest Kubernetes CLI tool, kubectl, in order to actually control your distribution. Unfortunately, there is not a /latest path for downloading that. So, to make sure you have the latest version, you need to get the latest version from the website and then plug it into a URL like this:
https://storage.googleapis.com/kubernetes-release/release/<VERSION>/bin/windows/amd64/kubectl.exe.
Once you’ve downloaded that, you again need to make sure it’s somewhere accessible from your PATH to make the rest of our exploration easier.
Linux
You can actually run Minikube on the Linux box itself. We don’t recommend doing that at first, because it’s harder to clean up afterward if you are just experimenting. So we need to have a version of Linux that has either KVM (Linux’s Kernel-based Virtual Machine) or VirtualBox. Because minikube is just a single binary, once you have it installed, there is no need to install any additional packages. And, because minikube is a statically linked binary, it should pretty much work on any distribution you want to run it on. Huzzah! We could be cool and do the installation all in a one-liner, but then if something goes wrong you might find it hard to understand the error. So let’s do it in a few steps. Note that at the time of this writing the binary is hosted on googleapis, which usually maintains very stable URLs. So, here we go:
# Download the file, save as 'minikube'
$ curl -Lo minikube \
    https://storage.googleapis.com/minikube/releases/latest/minikube-linux-amd64

# Make it executable
$ chmod +x minikube

# Move it to /usr/local/bin
$ sudo mv minikube /usr/local/bin/
You’ll need to make sure that /usr/local/bin is in your path. Now that we have minikube we also need to fetch kubectl, which we can do like this:
# Get the latest version number
$ KUBE_VERSION=$(curl -s \
    https://storage.googleapis.com/kubernetes-release/release/stable.txt)

# Fetch the executable
$ curl -LO \
    https://storage.googleapis.com/kubernetes-release/\
release/$(KUBE_VERSION)/bin/linux/amd64/kubectl

# Make it executable
$ chmod +x kubectl

# Move it to /usr/local/bin
$ sudo mv kubectl /usr/local/bin/
Note
One of the URLs in the previous example has been continued on the following line so that it fits in the margins. You may find that you need to re-assemble the URL and remove the back slashes for the command to work properly in your environment.
Running Kubernetes
Now that we have the minikube tool, we can use it to bootstrap our Kubernetes cluster. This is normally pretty straightforward. You usually don’t need to do any configuration beforehand. You can simply run:
$ minikube start
Starting local Kubernetes v1.9.0 cluster...
Starting VM...
Downloading Minikube ISO
 142.22 MB / 142.22 MB [============================================] 100.00% 0s
Getting VM IP address...
Moving files into cluster...
Downloading localkube binary
 162.41 MB / 162.41 MB [============================================] 100.00% 0s
 0 B / 65 B [----------------------------------------------------------]   0.00%
 65 B / 65 B [======================================================] 100.00% 0s
Setting up certs...
Connecting to cluster...
Setting up kubeconfig...
Starting cluster components...
Kubectl is now configured to use the cluster.
Loading cached images from config file.
So what did we just do? Minikube packs a lot into that one command. We installed a virtual machine that has a properly configured version of Docker on it. It then runs all of the necessary components of Kubernetes inside Docker containers on the host.
We can look at those containers to see what we got:
$ minikube ssh
                         _             _
            _         _ ( )           ( )
  ___ ___  (_)  ___  (_)| |/')  _   _ | |_      __
/' _ ` _ `\| |/' _ `\| || , <  ( ) ( )| '_`\  /'__`\
| ( ) ( ) || || ( ) || || |\`\ | (_) || |_) )(  ___/
(_) (_) (_)(_)(_) (_)(_)(_) (_)`\___/'(_,__/'`\____)

$
On your Kubernetes cluster you probably won’t be SSHing into the command line that often. But we want to see what’s installed and get a handle on the fact that when we run minikube, we’re controlling a virtual machine. Let’s take a look at what is running on the Docker instance on our Kubernetes cluster:
$ docker ps
CONTAINER ID   IMAGE                               COMMAND                  ...
6039cd53ec91   gcr.io/k8s.../storage-provisioner   "/storage-provisioner"   ...
a28e64d209f7   fed89e8b4248                        "/sidecar --v=2 --..."   ...
e84b6d75105b   459944ce8cc4                        "/dnsmasq-nanny -v..."   ...
539530cbe6e7   512cd7425a73                        "/kube-dns --domai..."   ...
e73d514c68bf   e94d2f21bc0c                        "/dashboard --inse..."   ...
21e4b12c144f   gcr.io/google_.../pause-amd64:3.0   "/pause"                 ...
696ac03d09f5   gcr.io/google_.../pause-amd64:3.0   "/pause"                 ...
47282c695e9e   gcr.io/google_.../pause-amd64:3.0   "/pause"                 ...
92b1a4d2cd0c   d166ffa9201a                        "/opt/kube-addons.sh"    ...
97bab4a81ea8   gcr.io/google_.../pause-amd64:3.0   "/pause"                 ...
We won’t dive too much into what each components is. But by now you should hopefully see how the mechanism works. Also, it’s pretty easy to upgrade the components since they are just containers, are versioned, and can be pulled from Google’s container repository.
Minikube commands
In the interest of space and time, we won’t go through all of the commands for minikube. We encourage you to run it without any options, take a look at the output, and play around with what’s available. That being said, let’s take a quick look at some of the most interesting commands. We’ll cover a few more later in the course of installing an application stack, but here’s a quick survey.
To see what was going on inside the VM, earlier we used minikube ssh, which is great for debugging or inspecting containers directly. Without logging into the Minikube VM over SSH, we can always check on the cluster status using another minikube command:
$ minikube status
minikube: Running
cluster: Running
kubectl: Correctly Configured: pointing to minikube-vm at 192.168.99.100
This shows us that everything is looking good, and also gives us the IP address of our virtual machine. For scripting purposes you can also retrieve just the IP address by calling minikube ip. At any time in the future, you can check your version of minikube by running minikube update-check and using the same mechanism you used to install it on your OS to upgrade it. Critically, the minikube status command also shows us that kubectl is installed and working properly.
We started the Kubernetes cluster with minikube start. As you might expect, following the style of Docker CLI arguments, minikube stop will stop all the Kubernetes components and the virtual machine and leave your system in a clean state.
Kubernetes Dashboard
Now that we have Minikube up and running, we don’t just have the command-line tools to interact with, we actually have a whole UI installed that we can connect to. We reach it via the minikube dashboard command. Go ahead and run that—it should launch your web browser, pointed to the correct IP address and port of the Kubernetes dashboard! There is a lot of stuff on the dashboard and we’re not able to cover it all, but you should feel free to click around and explore. Many of the terms on the left will be familiar to you at this point, and some will be totally foreign. If you don’t have a computer in front of you, Figure 10-2 shows a screenshot of what an empty Minikube installation looks like from the dashboard.
Figure 10-2. Kubernetes dashboard
If you explore the Nodes link on the lefthand menu, you should see a single node in the cluster, named minikube. This is the virtual machine we started, and the dashboard, like the other components, is hosted in one of the containers we saw when we SSH’d into the host earlier. We’ll take another look at the dashboard when we’ve actually deployed something into our cluster.
Note
Kubernetes exposes almost everything that you see on the dashboard with the kubectl command as well, which makes it very scriptable with shell scripts.
While clicking around, you may notice that Kubernetes itself shows up as a component inside the system, just like your applications will.
Kubernetes Containers and Pods
Now that we have a Kubernetes cluster up and running and you’ve seen how easy that is to do locally, we need to pause to talk about a concept that Kubernetes adds on top of the container abstraction. Kubernetes came out of the experiences that Google had running their own massive platform. They encountered most of the situations you might see in a production platform and had to work out concepts to make it easier to understand and solve the kinds of problems you run into when managing a large installation. In doing so, they created a complex set of new abstractions. Kubernetes embraces many of these and thus has a whole vocabulary unto itself. We won’t try to get into all of these, but it’s important to understand the most central of these new abstractions—a concept that sits a layer above the container and is known as a pod.
In Kubernetes parlance, a pod is one or more containers sharing the same cgroups and namespaces. You can also isolate the containers themselves from each other inside the same pod using cgroups and namespaces. The idea is that you may have applications that need to be deployed together all the time and that the abstraction your scheduler needs to work with is the group of applications, not just a single container. All of the containers in the pod can talk to each other on localhost, which eliminates any need to discover each other. So why not just deploy a big container with all the applications inside it? The advantage of a pod over a supercontainer is that you can still resource-limit the individual application separately, and leverage the large library of public Docker containers to construct your application.
Additionally, Kubernetes administrators often leverage the pod abstraction to have a container run on pod startup to make sure things are configured properly for the others, to maintain a shared resource, or to announce the application to others, for example. This allows you to make finer-grained containers than you might if you have to group things into the same container. Another nice part of the pod abstraction is the ability to share mounted volumes.
Pods have a lifespan much like a Docker container. They are essentially ephemeral and can be moved between hosts according to the lifecycle of the application or the host it runs on. Containers in a pod even share the same IP address when facing the outside world, which means they look like a single entity from the network level. Just as you would run only one instance of an application per container, you generally run one instance of that container per pod. The easiest way to think about pods is that they are a group of Docker containers that work tegether as if they were one container, for most purposes. If you need only one container, then you still get a pod deployed by Kubernetes, but that pod contains only one container. The nice thing about this is that there really is only one abstraction as far as the Kubernetes scheduler is concerned: the pod. Containers are managed by some of the runtime pieces that construct the pod and also by the configuration that you use to define them.
One critical difference between a pod and a container is that you don’t construct pods in a build step. They are a runtime abstraction that lives only inside Kubernetes. So you build your Docker containers and send them to a registry, then define and deploy your pods using Kubernetes. In reality you don’t usually directly describe a pod, either; the tools generate it for you through the concept of a deployment. But the pod is the unit of execution and scheduling in a Kubernetes cluster. There is a lot more to it, but that’s the basic concept and it’s probably easiest to understand with a simple example. The pod abstraction is more complicated than thinking of your system in terms of individual containers, but it can be pretty powerful.
Let’s Deploy Something
When actually working with pods in Kubernetes, we usually manage them through the abstraction of a deployment. A deployment is just a pod definition with some health monitoring and replication. It contains the definition of the pod and a little metadata about it. So let’s look at a basic deployment and get it running.
The simplest thing we can deploy on Kubernetes is a pod that contains just one container. The Minikube project ships a sample application called echoserver that we can use to explore the basics of deployment on Kubernetes. We’ll call our deployment hello-minikube just like the Minikube documentation does.
We’ve used the minikube command, but to get things done on Kubernetes itself, we now need to leverage the kubectl command we installed earlier.
$ kubectl run hello-minikube --image=k8s.gcr.io/echoserver:1.4 --port=8080
deployment "hello-minikube" created
To see what that did for us, we can use the kubectl get command to list what’s now in our cluster. We’ll trim this down to the most interesting parts:
$ kubectl get all
NAME                    DESIRED   CURRENT   UP-TO-DATE   AVAILABLE   AGE
deploy/hello-minikube   1         1         1            1           2m

NAME                         DESIRED   CURRENT   READY     AGE
rs/hello-minikube-c6c6764d   1         1         1         2m

NAME                               READY     STATUS    RESTARTS   AGE
po/hello-minikube-c6c6764d-cjcb4   1/1       Running   0          2m
With that one command, Kubernetes created a deployment, a replica set to manage scaling, and a pod. We ran this a couple minutes after running the first command so our pod is in the READY state. If yours isn’t, just wait and run the command a couple more times until you see it become READY. The bottom entry is a running service that represents Kubernetes itself. But where is our service? We can’t get to it yet. It’s essentially in the same state a Docker container would be if you didn’t tell it to expose any ports. So we need to tell Kubernetes to do that for us:
$ kubectl expose deployment hello-minikube --type=NodePort
service "hello-minikube" exposed
This has now created a service we can reach and interact with. A service is a wrapper for one or more deployments of an application and can tell us how to contact the application. In this case, we get a NodePort, which works a lot like EXPOSE would for a container on Docker itself, but this time for the whole deployment. Let’s get Kubernetes to tell us how to get to it:
$ kubectl get svc
NAME             TYPE        CLUSTER-IP       EXTERNAL-IP   PORT(S)          AGE
hello-minikube   NodePort    10.101.150.217   <none>        8080:30616/TCP   3s
kubernetes       ClusterIP   10.96.0.1        <none>        443/TCP          4d
You might think you could now connect to http://10.101.150.217:8080 to get to our service. But those addresses are not reachable from your host system because of the virtual machine in which Minikube is running. So we need to get minikube to tell us where to find the service:
$ minikube service hello-minikube --url
http://192.168.99.100:30616
The nice thing about this command, like many of the other Kubernetes commands, is that it is scriptable and command-line-friendly. If we want to open it with curl on the command line, we can just include the minikube command call in our request:
$ curl $(minikube service hello-minikube --url)
CLIENT VALUES:
client_address=172.17.0.1
command=GET
real path=/
query=nil
request_version=1.1
request_uri=http://192.168.99.100:8080/

SERVER VALUES:
server_version=nginx: 1.10.0 - lua: 10001

HEADERS RECEIVED:
accept=*/*
host=192.168.99.100:30616
user-agent=curl/7.54.0
BODY:
-no body in request-
This uses nginx to grab some information from the request and play it back to us. Not the world’s most exciting application, admittedly, but you can see that we get back our own address, visible inside the Minikube virtual machine, and the request we passed with curl.
This is really the simplest use case. We didn’t really configure or define anything and relied on Kubernetes to do the right thing using its defaults. Next we’ll take a look at something more complicated. But first, let’s shut down our new service and deployment. It takes two commands to do that: one to remove the service and the other to delete it.
$ kubectl delete service hello-minikube
service "hello-minikube" deleted
$ kubectl delete deployment hello-minikube
deployment "hello-minikube" deleted
$ kubectl get all
NAME                               READY     STATUS        RESTARTS   AGE

NAME             TYPE        CLUSTER-IP   EXTERNAL-IP   PORT(S)   AGE
svc/kubernetes   ClusterIP   10.96.0.1    <none>        443/TCP   4d
Deploying a Realistic Stack
Let’s now deploy something that looks more like a production stack. We’ll deploy an application that can fetch PDF documents from an S3 bucket, cache them on disk locally, and rasterize individual pages to PNG images on request, using the cached document. To run this application, we’ll want to write our cache files somewhere other than inside the container. We want to have them go somewhere a little more permanent and stable. And this time we want to make things repeatable, so that we’re not deploying our application through a series of CLI commands that we need to remember and hopefully get right each time. Kubernetes, much like Docker Compose, lets us define our stack in one or more YAML files that contain all of the definitions we care about in one place. This is what you want in a production environment and is similar to what you’ve seen for the other production tools.
The service we’ll now create will be called lazyraster (as in, “rasterize on demand”), and so each time you see that in the YAML definition, you’ll know we’re referring to our application. Our persistent volume will be called cache-data. Again, Kubernetes has a huge vocabulary that we can’t entirely address here, but to make it clear what we’re looking at we need to introduce two more concepts: PersistentVolume and PersistentVolumeClaim. A PersistentVolume is a physical resource that we provision inside the cluster. Kubernetes has support for many kinds of volumes, from local storage on a node to EBS volumes on AWS and similar on other cloud providers. It also supports NFS and other more modern network filesystems. A PersistentVolume stores data whose lifecycle is independent from our application or deployments. This lets us store data that persists between application deployments. For our cache, that’s what we’ll use. A PersistentVolumeClaim is a link between the physical resource of the PersistentVolume and the application that needs to consume it. We can set a policy on the claim that allows either a single read/write claim or many read claims. For our application we just want a single read/write claim to our cache-data PersistentVolume.
Tip
If you want more detail about some of the concepts we’ve talked about here, the Kubernetes project maintains a glossary of all the terms involved in operating Kubernetes. This can be really helpful. Each entry in the glossary is also linked to much more in-depth detail on other pages.
So let’s take a look at that big YAML file, which we’ll call lazyraster-service.yaml when it’s all pasted together. We’ll break it into sections so we can explain each part more easily. You can either pass each of these to kubectl separately or join them together into a single file, separated by ---, and pass them all at once, as we’ll do next. But it’s a lot easier to reason about the definitions separately.
Tip
You can also check out these files and a few others by running:
git clone \
    https://github.com/bluewhalebook/\
docker-up-and-running-2nd-edition.git
The URL above has been continued on the following line so that it fits in the margins. You may find that you need to re-assemble the URL and remove the back slashes for the command to work properly.
Service Definition
apiVersion:v1kind:Servicemetadata:name:lazyrasterlabels:app:lazyrasterspec:type:NodePortports:-port:8000targetPort:8000protocol:TCPselector:app:lazyraster
The first section defines our Service. The second and third sections, which we’ll see in a moment, respectively define our PersistentVolumeClaim and then our actual Deployment. We’ve told Kubernetes that our service will be called lazyraster and that it will be exposed on port 8000 which maps to the actual 8000 in our container. We’ve exposed that with the NodePort mechanism, which simply makes sure that our application is exposed on the same port on each host, much like the -p flag to Docker itself. This is helpful with minikube since we’ll run only one instance, and the NodePort type makes it easy for us to access it from our own computer just like we did earlier. As with many part of Kubernetes, there are a number of options other than NodePort, and you can probably find a mechanism that’s ideal for your production environment. NodePort is good for minikube, but it might work well for more statically configured load balancers as well.
So, back to our Service definition. The Service is going to be connected to the Deployment via the selector, which we apply in the spec section. Kubernetes widely uses labels as a way to reason about similar components and to tie them together. Labels are key/value pairs that are arbitrarily defined and which can then be queried to identify pieces of your system. Here the selector tells Kubernetes to look for Deployments with the label app: lazyraster. Notice that we also apply the same label to the Service itself. That’s helpful if we want to identify all the components together later, but it’s the selector section that actually ties the Deployment to our Service. Great, we have a Service, but it doesn’t do anything yet. We need more definitions to make Kuberenetes do what we want.
PersistentVolumeClaim Definition
apiVersion:v1kind:PersistentVolumeClaimmetadata:name:cache-data-claimlabels:app:lazyrasterspec:accessModes:-ReadWriteOnceresources:requests:storage:100Mi
The next section defines our PersistentVolumeClaim and likewise the PersistentVolume that backs it. A PersistentVolumeClaim is a way to name a volume and claim that you have a token to access that particular volume in a particular way. Notice, though, that we didn’t actually define the PersistentVolume here. That’s because Kubernetes is doing that work for us using what it calls Dynamic Volume Provisioning. In our case the use is pretty simple: we want a read/write claim to a volume and we’ll let Kubernetes put that in a volume container for us. But you can imagine a scenario where an application is going be to deployed into a cloud provider and where dynamic provisioning would really come into its own. In that scenario, we really don’t want to have to make separate calls to have our volume created in the cloud for us. We want Kubernetes to handle that. That’s what Dynamic Volume Provisioning is all about. Here it will just create a container for us to hold our persistent data, and mount it into our pod when we stake our claim. We don’t do a lot in this section except name it, ask for 100 MB of data, and tell Kubernetes it’s a read/write mount-once-only volume.
Deployment Definition
apiVersion:apps/v1kind:Deploymentmetadata:name:lazyrasterlabels:app:lazyrasterspec:selector:matchLabels:app:lazyrasterstrategy:type:RollingUpdatetemplate:metadata:labels:app:lazyrasterspec:containers:-image:relistan/lazyraster:demoname:lazyrasterenv:-name:RASTER_RING_TYPEvalue:memberlist-name:RASTER_BASE_DIRvalue:/dataports:-containerPort:8000name:lazyrastervolumeMounts:-name:cache-datamountPath:/datavolumes:-name:cache-datapersistentVolumeClaim:claimName:cache-data-claim
The Deployment actually creates the pods for us and uses the Docker container for our application. We define some metadata about the application, including its name and a label, just like we did for the other definitions. We also apply another selector here to find the other resources we’re tied to. In the strategy section, we say we want to have a RollingUpdate, which is a strategy that causes our pods to be cycled through one-by-one during deployment. We could also pick Recreate, which would simply destroy all existing pods and then create new ones afterward.
In the template section, we define how to actually stamp out copies of this deployment. The container definition includes the Docker image name, the ports to map, volumes to mount, and some environment variables that the lazyraster application needs. The very last part of the spec asks to have our PersistentVolumeClaim named cache-data-claim.
And that’s it for the application definition. Now let’s stand it up!
Note
There are many more options and a rich set of directives you can specify here to tell Kubernetes how to handle your application. We’ve walked through a couple of simple options, but we encourage you to explore the Kubernetes documentation to learn more.
Deploying the Application
Before we continue, let’s see what’s in our Kubernetes cluster, using the kubectl command:
$ kubectl get all
NAME             TYPE        CLUSTER-IP   EXTERNAL-IP   PORT(S)   AGE
svc/kubernetes   ClusterIP   10.96.0.1    <none>        443/TCP   14d
We have only one thing defined at the moment, a service called svc/kubernetes. A naming convention used widely in Kubernetes is to preface the type of object with the two- or three-letter abbreviation for it. Here, svc means it’s a Service. So let’s go ahead and get our service, deployment, and volume into the cluster!
$ kubectl create -f lazyraster-service.yaml
service "lazyraster" created
persistentvolumeclaim "cache-data-claim" created
deployment "lazyraster" created
That output looks like what we expected: we got a service, a persistent volume claim, and a deployment. So let’s see what’s in the cluster now:
$ kubectl get all
NAME                DESIRED   CURRENT   UP-TO-DATE   AVAILABLE   AGE
deploy/lazyraster   1         1         1            1           33s

NAME                       DESIRED   CURRENT   READY     AGE
rs/lazyraster-6b8dd8cb66   1         1         1         33s

NAME                DESIRED   CURRENT   UP-TO-DATE   AVAILABLE   AGE
deploy/lazyraster   1         1         1            1           33s

NAME                       DESIRED   CURRENT   READY     AGE
rs/lazyraster-6b8dd8cb66   1         1         1         33s

NAME                             READY     STATUS    RESTARTS   AGE
po/lazyraster-6b8dd8cb66-mfzsr   1/1       Running   0          33s

NAME             TYPE        CLUSTER-IP      EXTERNAL-IP   PORT(S)          AGE
svc/kubernetes   ClusterIP   10.96.0.1       <none>        443/TCP          14d
svc/lazyraster   NodePort    10.100.32.231   <none>        8000:32185/TCP   33s
You can see that a bunch more happened behind the scenes. And also, where is our volume or persistent volume claim? We have to ask for that separately:
$ kubectl get pvc
NAME       STATUS  VOLUME        CAPACITY  ACCESS MODES  STORAGECLASS  AGE
cache-...  Bound   pvc-b0582...  100Mi     RWO           standard      2m
Tip
kubectl get all does nothing of the sort. It would be more aptly named get all-the-most-common-resources, but there are a number of other resources you can fetch. The Kubernetes project hosts a handy cheat sheet to make this more discoverable.
So what about that rs and po that appeared in the get all output? Those are a ReplicaSet and Pod, respectively. A ReplicaSet is a piece of Kubernetes that is responsible for making sure that our application is running the right number of instances all the time and that they are healthy. We don’t normally have to worry about what happens inside the ReplicaSet because the Deployment we created manages one of them for us. You can actually manage the ReplicaSet yourself if need be, but most of the time you won’t need to or want to.
We didn’t tell kubectl any specific number of instances, so we got one. And we can see that both the desired and current states match. We’ll take a look at that in a moment. But first, let’s connect to our application and see what we’ve got.
$ minikube service --url lazyraster
http://192.168.99.100:32185
You will probably get a different IP address and port back. That’s totally fine! This is very dynamic stuff. And that’s why we use the minikube command to manage it for us. So grab the address that came back, open your web browser, and paste it into the URL bar like this: http://<192.168.99.100:32185>/documents/docker-up-and-running-public/sample.pdf?page=1. You’ll need to substitute the IP and port into the URL to make it work for you.
You’ll need to be connected to the internet because the lazyraster application is going to go out to the internet, fetch a PDF from a public S3 bucket, and then render in the first page from the document as a PNG in a process called rasterization. If everything worked, you should see a copy of the front cover of this book! This particular PDF has two pages, so feel free to try changing the argument to ?page=2. If you do that, you may notice it renders much faster than the first page. That’s because the application is using our persistent volume to cache the data. You can also specify width=2048, or ask for a JPEG instead of a PNG with ?imageType=image/jpeg. You could rasterize the front page as a very large JPEG like this:
If you have a public S3 bucket with other PDFs in it, you can simply substitute the bucket name for docker-up-and-running-public in the URL to hit your own bucket instead. If you want to play with the application some more, check out its repo on GitHub.
Scaling Up
In real life you don’t just deploy applications, you operate them as well. One of the huge advantages of scheduled workloads is the ability to scale them up and down at will, within the resource constraints available to the system. In our case we only have the one Minikube node, but we can still scale up our service to better handle load and provide more reliability during deployments. Kubernetes, as you might imagine, allows scaling up and down quite easily. For our service we will need only one command to do it. Then we’ll take another look at the kubectl output and also at the Kubernetes dashboard we introduced earlier so we can prove that the service scaled.
In Kubernetes the thing we will scale is not the Service, it’s the Deployment. Here’s what that looks like:
$ kubectl scale --replicas=2 deploy/lazyraster
deployment "lazyraster" scaled
Great, that did something! But what did we get?
$ kubectl get deploy/lazyraster
NAME         DESIRED   CURRENT   UP-TO-DATE   AVAILABLE   AGE
lazyraster   2         2         2            2           12d
We now have two instances of our application running. Let’s see what we got in the logs:
$ kubectl logs deploy/lazyraster
Found 2 pods, using pod/lazyraster-6b8dd8cb66-mfzsr
Trying to clear existing Lazyraster cached files (if any) in the background...
Launching Lazyraster service...
time="..." level=info msg="Settings -----------------------"
time="..." level=info msg="  * BaseDir: /data"
time="..." level=info msg="  * HttpPort: 8000"
time="..." level=info msg="  * AdvertiseHttpPort: 8000"
...
time="..." level=info msg=--------------------------------------------------
time="..." level=info msg="No New Relic license found, not starting an agent"
time="..." level=warning msg="Ring manager was nil in delegate!"
time="..." ... msg="No URL signing secret passed...running in insecure mode!"
time="..." level=info msg="Listening on tcp://:6379"
time="..." ... msg="Using anonymous credentials since no AWS env vars found"
We asked for logs for the deployment, but Kubernetes tells us there are two running so it picked one, the most recent in this case. We can see our new replica starting up. If we want to specify a particular instance to look at, we can ask for the logs for that pod with something like kubectl logs po/lazyraster-6b8dd8cb66-rqmfx, using the output from kubectl get po to find the pod in question.
We now have a couple of copies of our application running. What does that look like on the Kubernetes dashboard? Let’s navigate there with minikube dashboard. Once we’re there, we’ll click on the layraster Deployment and should see a screen that looks like Figure 10-3.
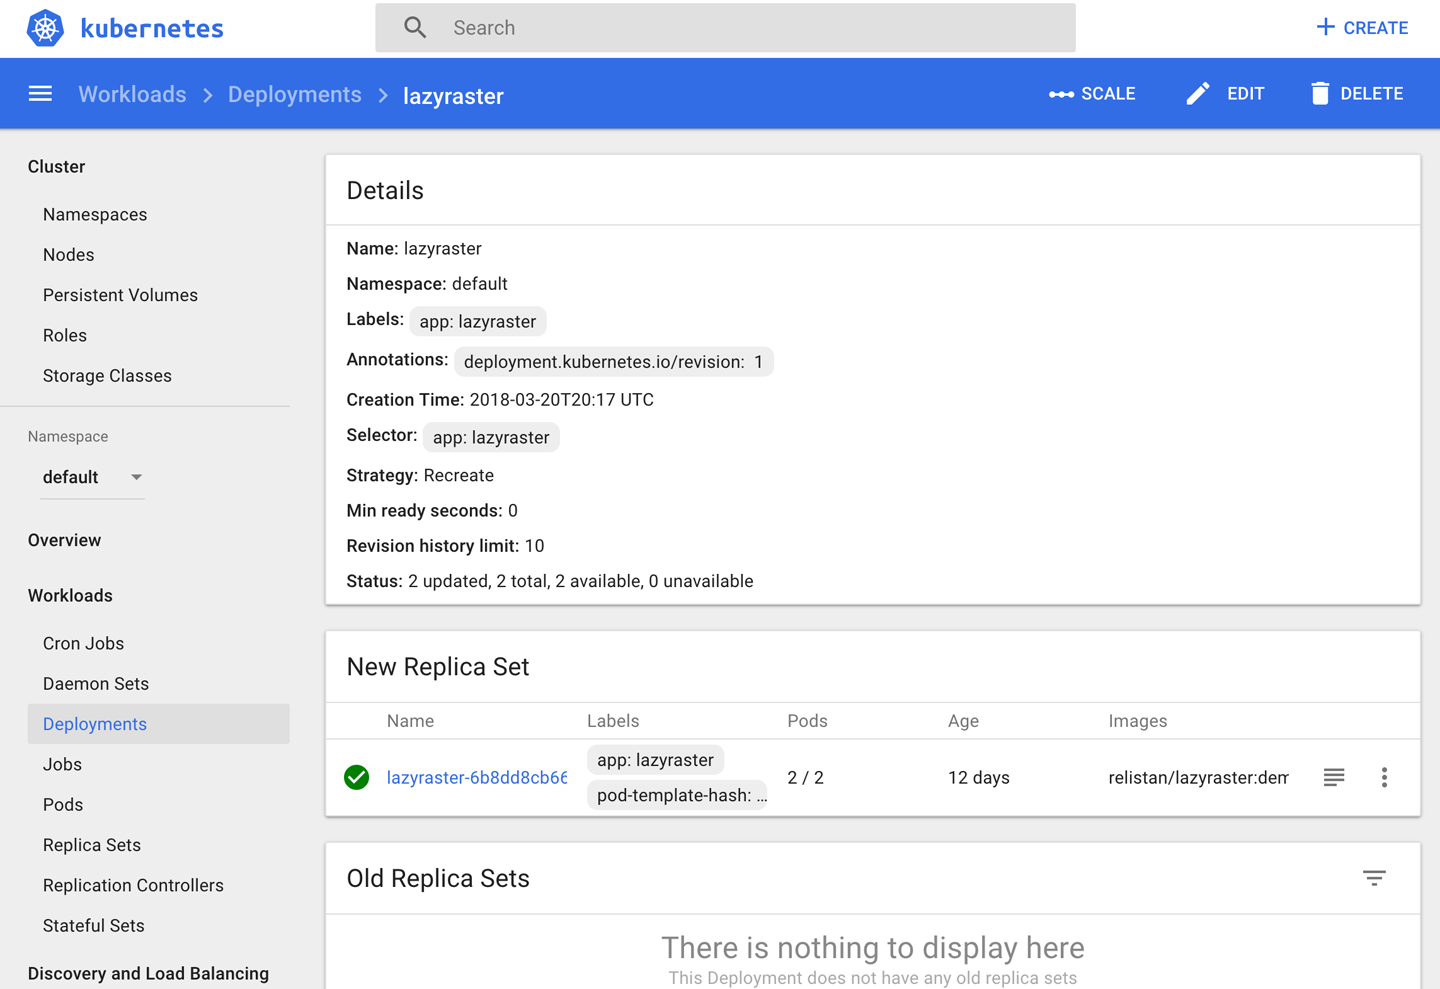
Figure 10-3. Lazyraster service dashboard
We encourage you to click around some more in the Kubernetes dashboard to see what else is presented. With the concepts you’ve picked up here, there should be a lot that is clearer now and you can probably figure out some more on your own. Likewise, kubectl has a lot of other options available as well, many of which you’ll need in a real production system. The cheat sheet we linked earlier is a real lifesaver here!
kubectl API
We haven’t shown you an API yet and, as we’ve discussed with Docker, it can be really useful to have a simple API to interact with for scripting and operational needs. You could write programs to talk to the individual components yourself. But for most cases, you can use kubectl as a nice proxy to Kubernetes, and it presents a clean API that is accessible with curl and JSON command-line tools. Here’s an example of what you can do:
$ kubectl proxy
Starting to serve on 127.0.0.1:8001
We’ve now got kubectl itself serving up a web API on the local system! You’ll need to read more about what’s possible, but let’s get it to show us the individual instances of the lazyraster application. We can do that by opening the following URL in a browser, or with curl: http://localhost:8001/api/v1/namespaces/default/endpoints/lazyraster.
There is a lot of output here, but the part we care about is the subsets section:
{..."subsets":[{"addresses":[{"targetRef":{"resourceVersion":"291386","kind":"Pod","namespace":"default","uid":"b05b79e4-2c7b-11e8-915a-0800274dbc88","name":"lazyraster-6b8dd8cb66-mfzsr"},"nodeName":"minikube","ip":"172.17.0.2"},{"ip":"172.17.0.5","nodeName":"minikube","targetRef":{"resourceVersion":"291702","kind":"Pod","uid":"de00121d-36aa-11e8-b37c-0800274dbc88","namespace":"default","name":"lazyraster-6b8dd8cb66-rqmfx"}}],"ports":[{"protocol":"TCP","port":8000}]}]}
What’s interesting here is that we can see that both instances are running on the Minikube host, and that they have different IP addresses. If we were building a cloud-native application that needed to know where the other instances of the application were running, this would be a good way to do that. We could, in fact, run a copy of kubectl proxy in our pod and talk to it directly. We would normally use something like the hyperkube container to do that. If you are interested further, you can explore the documentation some more.
Tip
Kubernetes is a really big system, with great community involvement. There is a big overlap with the Docker ecosystem, but it has also developed a number of components of its own. There is increasing integration between Docker itself and Kubernetes. We’ve just shown you the tip of the iceberg with Minikube, but if you are interested there are many other commercial and free distributions to explore.
Wrap-Up
Well, in this chapter we’ve certainly presented you with a lot of options! It’s unlikely that you’ll ever need to use all of these, since many of them overlap. However, each one has its own perspective on exactly what a production system should look like and what problems are the most important to solve. After exploring all of these tools, you should have a pretty good idea of the wide range of options that you can choose from to build your own production Docker environment.
Underlying all of these tools is the Docker bedrock: its highly portable container format and its ability to abstract away so much of the underlying Linux system makes it easy to move your applications fluidly between your data center and as many cloud providers as you want, or to build your own approximation of a cloud system on your own premises. Now you just have to choose which approach will work best for you and your organization and then implement it.
In the meantime, let’s jump into the next chapter and explore some of the most technical topics in the Docker ecosystem, including security, networking, and storage.
1 At the time of writing, the supported clients included Docker Community Edition for Mac and Windows and Docker Enterprise Edition (EE) for Linux.