Table of Contents for
Docker: Up & Running, 2nd Edition
 Docker: Up & Running, 2nd Edition
Published by
O'Reilly Media, Inc., 2018
Docker: Up & Running, 2nd Edition
Published by
O'Reilly Media, Inc., 2018
- Cover
- nav
- Docker: Up & Running
- Docker: Up and Running
- Dedication
- Foreword
- Preface
- 1. Introduction
- 2. The Docker Landscape
- 3. Installing Docker
- 4. Working with Docker Images
- 5. Working with Docker Containers
- 6. Exploring Docker
- 7. Debugging Containers
- 8. Exploring Docker Compose
- 9. The Path to Production Containers
- 10. Docker at Scale
- 11. Advanced Topics
- 12. Container Platform Design
- 13. Conclusion
- Index
- About the Authors
- Colophon
Chapter 6. Exploring Docker
Now that you have some experience working with containers and images, we can explore some of Docker’s other capabilities. In this chapter, we’ll continue to use the docker command-line tool to talk to the running dockerd server that you’ve configured, while visiting some of the other fundamental commands.
Docker provides commands to do a number of additional things easily:
-
Printing the Docker version
-
Viewing the server information
-
Downloading image updates
-
Inspecting containers
-
Entering a running container
-
Returning a result
-
Viewing logs
-
Monitoring statistics
-
And much more…
Let’s take a look at these and some of the additional community tooling that augments Docker’s native capabilities.
Printing the Docker Version
If you completed the last chapter, you have a working Docker daemon on a Linux server or virtual machine, and you’ve started a base container to make sure it’s all working. If you haven’t set that up already and you want to try out the steps in the rest of the book, you’ll want to follow the installation steps in Chapter 3 before you move on with this section.
The absolute simplest thing you can do with Docker is print the versions of the various components. It might not sound like much, but this is a useful tool to have because the server and API are often not backward compatible with older clients. Knowing how to show the version will help you troubleshoot certain types of connection issues. Sometimes, for example, the Docker client will give you a cryptic message about mismatched API versions and it’s nice to be able to translate that into Docker versions so you know which component to change. Note that this command actually talks to the remote Docker server. If you can’t connect to the server for any reason, the client will complain. If you find that you have a connectivity problem, you should probably revisit the steps in the last chapter.
Note
You can always directly log in to the Docker server and run docker commands from a shell on the server if you are troubleshooting issues or simply do not want to use the docker client to connect to a remote system. On most Docker servers, this will require either root privileges or membership in the docker group in order to connect to the Unix domain socket that Docker is listening on.
Since we just installed all of the Docker components at the same time, when we run docker version, we should see that all of our versions match:
$ docker version
Client:
 Version:      17.09.1-ce
 API version:  1.32
 Go version:   go1.8.3
 Git commit:   19e2cf6
 Built:        Thu Dec  7 22:24:23 2017
 OS/Arch:      linux/amd64

Server:
 Version:      17.09.1-ce
 API version:  1.32 (minimum version 1.12)
 Go version:   go1.8.3
 Git commit:   19e2cf6
 Built:        Thu Dec  7 22:23:00 2017
 OS/Arch:      linux/amd64
 Experimental: false
Notice how we have different sections representing the client and server. In this case we have a matching client and server since we just installed them together. But it’s important to note that this won’t always be the case. Hopefully, in your production system you can manage to keep the same version running on most systems. But it’s not uncommon for development environments and build systems to have slightly different versions.
Another important point is that different versions of the command-line tools might use the same Docker API version. Even when they do, sometimes the Docker CLI tool won’t let you talk to a remote server that doesn’t exactly match. Usually the command-line tool requires an exact match. But other API clients and libraries will usually work across a large number of Docker versions, depending on which API version they require. In the Server section, we can see that it’s telling us that the current API version is 1.32 and the minimum API it will serve is 1.12. This is useful information when you’re working with third-party clients. Now you know how to verify this information.
Server Information
We can also find out a lot about the Docker server via the Docker client. Later we’ll talk more about what all of this means, but you can find out which filesystem backend the Docker server is running, which kernel version it is on, which operating system it is running on, which plug-ins are installed, which runtime is being used, and how many containers and images are currently stored there. docker info will present you with something something similar to this, which has been shortened for brevity:
$ docker info
Containers: 43
...
Images: 53
Server Version: 17.09.1-ce
Storage Driver: overlay2
...
Plugins:
 Volume: local
 Network: bridge host macvlan null overlay
 Log: awslogs fluentd gcplogs gelf journald json-file logentries splunk syslog
Runtimes: cc-runtime runc
Default Runtime: runc
...
Kernel Version: 4.4.0-104-generic
Operating System: Ubuntu 16.04.3 LTS
Docker Root Dir: /var/lib/docker
...
Depending on how your Docker daemon is set up, this might look somewhat different. Don’t be concerned about that; this is just to give you an example. Here we can see that our server is an Ubuntu 16.04.3 LTS release running the 4.4.0 Linux kernel and backed with the overlay2 filesystem driver. We also have a lot of images and containers! With a fresh install, this number should be zero.
The information about plug-ins is worth pointing out here. It’s telling us about all the things this installation of Docker supports. On a fresh install, this will look more or less like this, depending on which new plug-ins are distributed with Docker. Docker itself is made up of many different plug-ins all working together. This is powerful because it means it’s also possible to install a number of other plug-ins contributed by members of the community. It’s useful to be able to see which are installed even if just for the purpose of making sure Docker has recognized one that you added.
In most installations, /var/lib/docker will be the default root directory used to store images and containers. If you need to change this, you can edit your Docker startup scripts to launch the daemon, with the --data-root argument pointing to a new storage location. To test this by hand, you could run something like this:
$ sudo dockerd \
    -H unix:///var/run/docker.sock \
    -H tcp://0.0.0.0:2375 --data-root="/data/docker"
We will talk more abut runtimes later, but here you can see that we have two runtimes installed. The runc runtime is the default Docker runtime. If you think of Docker containers, you are usually thinking about the type of container that runc builds. On this server we also have the Intel Clear Containers runtime installed, which works a little differently. We’ll talk more about that in Chapter 11.
Downloading Image Updates
We’re going to use an Ubuntu base image for the following examples. Even if you have already grabbed the Ubuntu base image once, you can pull it again and it will automatically pick up any updates that have been published since you last ran it. That’s because latest is a tag that, by convention, is always moved to the most recent version of the image that has been published to the image registry. Invoking pull will look like this:
$ docker pull ubuntu:latest

Pulling repository ubuntu
5506de2b643b: Download complete
511136ea3c5a: Download complete
d497ad3926c8: Download complete
ccb62158e970: Download complete
e791be0477f2: Download complete
3680052c0f5c: Download complete
22093c35d77b: Download complete
That command pulled down only the layers that have changed since we last ran the command. You might see a longer or shorter list, or even an empty list, depending on when you ran it and what changes have been pushed to the registry since then.
Tip
It’s good to remember that even though you pulled latest, Docker won’t automatically keep the local image up to date for you. You’ll be responsible for doing that yourself. However, if you deploy an image based on a newer copy of ubuntu:latest, the Docker client will download the missing layers during the deployment just like you would expect. Keep in mind that this is the behavior of the Docker client, and other libraries or API tools may not behave this way. It’s always safest to deploy production code using a fixed tag rather than the latest tag. This helps guarantee that you got the version you expected.
In addition to referring to items in the registry by the latest tag or another version number tag, you can also refer to them by their content-addressable tag. These look like sha256:2f9a…82cf (where we’ve shortened a very long ID). These are actually generated as a hashed sum of the contents of the image and are a very precise identifier. This is by far the safest way to refer to Docker images where you need to make sure you are getting the exact version you expected, because these can’t be moved like a version tag. The syntax for pulling them from the registry is very similar, but note the @ in the tag.
docker pull ubuntu@sha256:2f9a...82cf
Note that unlike most Docker commands where you may shorten the hash, you cannot do that with SHA256 hashes. You must use the full hash here.
Inspecting a Container
Once you have a container created, running or not, you can now use docker to see how it was configured. This is often useful in debugging, and also has some other information that can be useful for identifying a container.
For this example, go ahead and start up a container:
$ docker run -d -t ubuntu /bin/bash
3c4f916619a5dfc420396d823b42e8bd30a2f94ab5b0f42f052357a68a67309b
We can list all our running containers with docker ps to ensure everything is running as expected, and to copy the container ID.
$ docker ps
CONTAINER ID  IMAGE         COMMAND     ... STATUS        ...  NAMES
3c4f916619a5  ubuntu:latest "/bin/bash" ... Up 31 seconds ...  angry_mestorf
In this case, our ID is 3c4f916619a5. We could also use angry_mestorf, which is the dynamic name assigned to our container. Many underlying tools need the unique container ID, though, so it’s useful to get into the habit of looking at that first. As we mentioned earlier, the ID as shown is actually the truncated version, but Docker treats these interchangeably with the long ones. As is the case in many version control systems, this hash is actually just the prefix of a much longer hash. Internally, the kernel uses a 64-byte hash to identify the container. But that’s painful for humans to use, so Docker supports the shortened hash.
The output to docker inspect is pretty verbose, so we’ll cut it down in the following code block to a few values worth pointing out. You should look at the full output to see what else you think is interesting:
$ docker inspect 3c4f916619a5
[{"Id":"3c4f916619a5dfc420396d823b42e8bd30a2f94ab5b0f42f052357a68a67309b","Created":"2018-11-07T22:06:32.229471304Z",..."Args":[],..."Image":"sha256:ed889b69344b43252027e19b41fb98d36...a9098a6d"..."Config":{"Hostname":"3c4f916619a5",..."Env":["PATH=/usr/local/sbin:/usr/local/bin:/usr/sbin:/usr/bin:/sbin:/bin"],"Cmd":["/bin/bash"],..."Image":"ubuntu",...},...}]
Note that long "Id" string. That’s the full unique identifier of this container. Luckily we can use the short version, even if that’s still not especially convenient. We can also see the exact time when the container was created in a much more precise way than docker ps gives us.
Some other interesting things are shown here as well: the top-level command in the container, the environment that was passed to it at creation time, the image on which it’s based, and the hostname inside the container. All of these are configurable at container creation time if you need to do so. The usual method for passing configuration to containers, for example, is via environment variables, so being able to see how a container was configured via docker inspect can reveal a lot when you’re debugging.
Exploring the Shell
Let’s get a container running with just an interactive bash shell so we can take a look around. We’ll do that, as we did before, by just running something like:
$ docker run -i -t ubuntu:16.04 /bin/bash
That will run an Ubuntu 16.04 LTS container with the bash shell as the top-level process. By specifying the 16.04 tag, we can be sure to get a particular version of the image. So, when we start that container, what processes are running?
$ ps -ef
UID        PID  PPID  C STIME TTY          TIME CMD
root         1     0  0 22:12 ?        00:00:00 /bin/bash
root        12     1  0 22:16 ?        00:00:00 ps -ef
Wow, that’s not much, is it? It turns out that when we told docker to start bash, we didn’t get anything but that. We’re inside a whole Linux distribution image, but no other processes started for us automatically. We only got what we asked for. It’s good to keep that in mind going forward.
Warning
Docker containers don’t, by default, start anything in the background like a full virtual machine would. They’re a lot lighter weight than that and therefore don’t start an init system. You can, of course, run a whole init system if you need to, or Docker’s own tini init system, but you have to ask for it. We’ll talk about that more in Chapter 7.
That’s how we get a shell running in a container. You should feel free to poke around and see what else looks interesting inside the container. Note that you might have a pretty limited set of commands available. You’re in an Ubuntu distribution, though, so you can fix that by using apt-get to install more packages. Note that these are only going to be around for the life of this container. You’re modifying the top layer of the container, not the base image! Containers are by nature ephemeral, so anything you do inside this container won’t outlast it.
Returning a Result
Would you spin up a whole virtual machine in order to run a single process and get the result? You usually wouldn’t do that because it would be very time-consuming and require booting a whole operating system to simply execute one command. But Docker doesn’t work the same way as virtual machines: containers are very lightweight and don’t have to boot up like an operating system. Running something like a quick background job and waiting for the exit code is a normal use case for a Docker container. You can think of it as a way to get remote access to a containerized system and have access to any of the individual commands inside that container with the ability to pipe data to and from them and return exit codes.
This can be useful in lots of scenarios: you might, for instance, have system health checks run this way remotely, or have a series of machines with processes that you spin up via Docker to process a workload and then return. The docker command-line tools proxy the results to the local machine. If you run the remote command in foreground mode and don’t specify doing otherwise, docker will redirect its stdin to the remote process, and the remote process’s stdout and stderr to your terminal. The only things we have to do to get this functionality are to run the command in the foreground and not allocate a TTY on the remote. This is actually the default configuration! No command-line options are required. We do need to have a container configured and ready to run beforehand, using docker create, or invoking a container we previously created with docker run and specifying the image.
If we do that, we can then reinvoke that container and just give it the command that we intend to run. Keep in mind that when we run these commands, Docker starts up the container, executes the command that we requested inside the container’s namespaces and cgroups, and then exits, so that no process is left running between invocations. Let’s say we created a Docker image whose ID was 8d12decc75fe. The following code shows what you can then do:
$ docker run 8d12decc75fe /bin/false
$ echo $?
1
$ docker run 8d12decc75fe /bin/true
$ echo $?
0
$ docker run 8d12decc75fe /bin/cat /etc/passwd

root:x:0:0:root:/root:/bin/bash
bin:x:1:1:bin:/bin:/sbin/nologin
daemon:x:2:2:daemon:/sbin:/sbin/nologin
adm:x:3:4:adm:/var/adm:/sbin/nologin
lp:x:4:7:lp:/var/spool/lpd:/sbin/nologin
sync:x:5:0:sync:/sbin:/bin/sync
shutdown:x:6:0:shutdown:/sbin:/sbin/shutdown
nobody:x:99:99:Nobody:/:/sbin/nologin

$ docker run 8d12decc75fe /bin/cat /etc/passwd | wc -l

8
Here we executed /bin/false on the remote server, which will always exit with a status of 1. Notice how docker proxied that result to us in the local terminal. Just to prove that it returns other results, we also run /bin/true, which will always return a 0. And there it is.
Then we actually ask docker to run cat /etc/passwd on the remote container. What we get is a printout of the /etc/passwd file contained inside that container’s filesystem. Because that’s just regular output on stdout, we can pipe it into local commands just like we would anything else.
Warning
The previous code pipes the output into the local wc command, not a wc command in the container. The pipe itself is not passed to the container. If you want to pass the whole command, including the pipes, to the server, you need to invoke a complete shell on the remote side and pass a quoted command, like bash -c "<your command> | <something else>". In the previous code, that would be: docker run 8d12decc75fe /bin/bash -c "/bin/cat /etc/passwd | wc -l".
Getting Inside a Running Container
You can pretty easily get a shell running in a new container as we demonstrated earlier with docker run. But it’s not the same as getting a new shell inside an existing container that is actively running your application. Every time you use docker run, you get a new container. But if you have an existing container that is running an application and you need to debug it from inside the container, you need something else.
Since Docker containers are Linux namespaces, there is both a Docker-native way to get into a container (docker exec), and a more Linux-native way to do it, called nsenter. Let’s take a look at both.
docker exec
First, let’s take a look at the easiest and best way to get inside a running container. The dockerd server and docker command-line tool support remotely executing a new process in a running container via the docker exec command. So let’s start up a container in background mode, and then enter it using docker exec and invoking a shell. The command you invoke doesn’t have to be a shell: it’s possible to run individual commands inside the container and see their results outside it using docker exec. But if you want to get inside the container to look around, a shell is the easiest way to do that.
To run docker exec, we’ll need our container’s ID, like we did previously when we inspected it. For this demo, we listed out the containers and our ID is 589f2ad30138. We can now use that to get inside the container with docker exec. The command line for that, unsurprisingly, looks a lot like the command line for docker run. We request an interactive session and a pseudo-TTY with the -i and -t flags:
$ docker exec -i -t 589f2ad30138 /bin/bash
root@589f2ad30138:/#
Note that we got a command line back that tells us the ID of the container we’re running inside. That’s pretty useful for keeping track of where we are. We can now run a normal Linux ps to see what else is running inside our container. We should see our other bash process that we backgrounded earlier when starting the container.
root@589f2ad30138:/# ps -ef
UID        PID  PPID  C STIME TTY          TIME CMD
root         1     0  0 23:13 ?        00:00:00 /bin/bash
root         9     0  1 23:14 ?        00:00:00 /bin/bash
root        17     9  0 23:14 ?        00:00:00 ps -ef
Warning
You can also run additional processes in the background via docker exec. You use the -d option just like with docker run. But you should think hard about doing that for anything but debugging because you lose the repeatability of the image deployment if you depend on this mechanism. Other people would then have to know what to pass to docker exec to get the desired functionality. If you’re tempted to do this, you would probably reap bigger gains from rebuilding your container image to launch both processes in a repeatable way. If you need to signal to software inside the container to take some action like rotating logs or reloading a configuration, it is cleaner to leverage docker kill -s <SIGNAL> with the standard Unix signal name to pass information to the process inside the container.
nsenter
Part of the core util-linux package from kernel.org is nsenter, short for “Namespace Enter,” which allows you to enter any Linux namespace. In Chapter 11, we’ll go into more detail on namespaces. But they are the core of what makes a container a container. Using nsenter, therefore, we can get into a Docker container from the server itself, even in situations where the dockerd server is not responding and we can’t use docker exec. nsenter can also be used to manipulate things in a container as root on the server that would otherwise be prevented by docker exec, for example. This can be really useful when you are debugging. Most of the time, docker exec is all you need, but you should have nsenter in your tool belt.
Most Linux distributions ship with the util-linux package that contains nsenter. But not all of them ship with one that is new enough to have nsenter itself installed, because it’s a recent addition to the package. Ubuntu 14.04, for example, still has util-linux from 2012. Ubuntu 16.04, however, has the newest package. If you are on a distribution that does not have it, the easiest way to get ahold of nsenter is to install it via a third-party Docker container.
This works by pulling a Docker image from the Docker Hub registry and then running a specially crafted Docker container that will install the nsenter command-line tool into /usr/local/bin. This might seem strange at first, but it’s a clever way to allow you to install nsenter to any Docker server remotely using nothing more than the docker command.
Note
The following example is intended to be directly run only on a Linux-based Docker server. It will not work as intended on Docker Community Edition for Mac or Windows. On those systems you can play around with nsenter a bit by running something like docker run -it --privileged --pid=host debian nsenter and passing whatever additional command-line arguments you want to nsenter.
This code shows how we install nsenter to /usr/local/bin on your Docker server:
$ docker run --rm -v /usr/local/bin:/target jpetazzo/nsenter
Unable to find image 'jpetazzo/nsenter' locally
Pulling repository jpetazzo/nsenter
9e4ef84f476a: Download complete
511136ea3c5a: Download complete
71d9d77ae89e: Download complete
Status: Downloaded newer image for jpetazzo/nsenter:latest
Installing nsenter to /target
Installing docker-enter to /target
Warning
You should be very careful about doing this! It’s always a good idea to check out what you are running, and particularly what you are exposing part of your filesystem to, before you run a third-party container on your system. With -v, we’re telling Docker to expose the host’s /usr/local/bin directory into the running container as /target. When the container starts, it is then copying an executable into that directory on our host’s filesystem. In Chapter 11, we will discuss some security frameworks and commands that can be leveraged to prevent potentially nefarious container activities.
Unlike docker exec, which can be run remotely, nsenter requires that you run it on the server itself. The README in the GitHub repo explains how to set this up to work over SSH automatically if you want to do that. For our purposes, we’ll log in to our Docker server and then invoke the command from there. In any case, like with docker exec, we need to have a container running. You should still have one running from earlier. If not, go back and start one, and then log into your server.
docker exec is pretty simple, but nsenter is a little inconvenient to use. It needs to have the PID of the actual top-level process in your container. That’s less than obvious to find and requires a few steps. Luckily there’s a convenience wrapper installed by that Docker container we just ran, called docker-enter, which takes away the pain. But before we jump to the convenience wrapper, let’s run nsenter by hand so you can see what’s going on.
First we need to find out the ID of the running container, because nsenter needs to know that to access it. This is the same as previously shown for docker inspect and docker exec:
$ docker ps
CONTAINER ID  IMAGE          COMMAND      ...  NAMES
3c4f916619a5  ubuntu:latest  "/bin/bash"  ...  grave_goldstine
The ID we want is that first field, 3c4f916619a5. Armed with that, we can now find the PID we need. We do that like this:
$ PID=$(docker inspect --format \{{.State.Pid\}} 3c4f916619a5)
This will store the PID we care about into the PID environment variable. We need to have root privilege to do what we’re going to do. So you should either su to root or use sudo on the command line. Now we invoke nsenter:
$ sudo nsenter --target $PID --mount --uts --ipc --net --pid
root@3c4f916619a5:/#
Note
For Docker Community Edition on Windows and Mac, something like this should accomplish the same thing:
$ docker run -it --privileged --pid=host debian nsenter \
    --target $PID --mount --uts --ipc --net --pid
If the end result looks a lot like docker exec, that’s because it does almost exactly the same thing under the hood!
There are a lot of command-line options there; what they’re doing is telling nsenter which parts of the container we need access to. Generally you want all of them, so you might expect that to be the default, but it’s not, so we specify them all.
Warning
Neither nsenter or docker exec work well for exploring a container that does not contain a Unix shell. In this case you usually need to explore the container from the Docker server by navigating directly to where the container filesystem resides on storage. This will typically look something like /var/lib/docker/overlay/365c…, but will vary based on the Docker setup, storage backend, and container hash. You can determine your Docker root directory by running docker info.
Back at the beginning of this section, we mentioned that there is a convenience wrapper called docker-enter that you install by running the installation Docker container. Having now seen the mechanism involved with running nsenter, you can now appreciate that if you actually just want to enter all the namespaces for the container and skip several steps, you can do this:
$ sudo docker-enter 3c4f916619a5 /bin/bash
root@3c4f916619a5:/#
Much easier and a lot less to remember. It’s still not anywhere nearly as convenient as docker exec, but in some situations it will be all you have if the Docker daemon is not responding, so it’s a very worthwhile tool to have available.
docker volume
Docker supports a volume subcommand that makes it possible to list all of the volumes stored in your root directory and then discover additional information about them, including where they are physically stored on the server.
These volumes are not bind-mounted volumes, but special data containers that are useful for persisting data.
If we run a normal docker command that bind mounts a directory, we’ll notice that it does not create any Docker volumes.
$ docker volume ls
DRIVER              VOLUME NAME

$ docker run -d -v /tmp:/tmp ubuntu:latest sleep 120
6fc97c50fb888054e2d01f0a93ab3b3db172b2cd402fc1cd616858b2b5138857

$ docker volume ls
DRIVER              VOLUME NAME
However, you can easily create a new volume with a command like this:
$ docker volume create my-data
If you then list all your volumes, you should see something like this:
# docker volume ls
DRIVER              VOLUME NAME
local               my-data

# docker volume inspect my-data
[{"CreatedAt":"2018-07-14T21:01:05Z","Driver":"local","Labels":{},"Mountpoint":"/var/lib/docker/volumes/my-data/_data","Name":"my-data","Options":{},"Scope":"local"}]
Now you can start a container with this data volume attached to it, by running the following:
 $ docker run --rm \
     --mount source=my-data,target=/app \
     ubuntu:latest touch /app/my-persistent-data
That container created a file in the data volume and then immediately exited.
If we now mount that data volume to a different container, we will see that our data is still there.
$ docker run --rm \
    --mount source=my-data,target=/app \
    fedora:latest ls -lFa /app/persistent-data

-rw-r--r-- 1 root root 0 Jul 14 21:05 /app/my-persistent-data
And finally, you can delete the data volume when you are done with it by running:
$ docker volume rm my-data

my-data
Note
If you try to delete a volume that is in use by a container (whether it is running or not), you’ll get an error like this:
Error response from daemon: unable to remove volume:
    remove my-data: volume is in use - [
    d0763e6e8d79e55850a1d3ab21e9d...,
    4b40d52978ea5e784e66ddca8bc22...]
These commands should help you to explore your containers in great detail. Once we’ve explained namespaces more in Chapter 11, you’ll get a better understanding of exactly how all these pieces interact and combine to create a container.
Logging
Logging is a critical part of any production application. When things go wrong, logs can be a critical tool in restoring service, so they need to be done well. There are some common ways in which we expect to interact with application logs on Linux systems, some better than others. If you’re running an application process on a box, you might expect the output to go to a local logfile that you could read through. Or perhaps you might expect the output to simply be logged to the kernel buffer where it can be read from dmesg. Or, as on many modern Linux distributions with systemd, you might expect logs to be available from journalctl. Because of the container’s restrictions and how Docker is constructed, none of these will work without at least some configuration on your part. But that’s OK, because logging has first-class support in Docker.
Docker makes logging easier in a few critical ways. First, it captures all of the normal text output from applications in the containers it manages. Anything sent to stdout or stderr in the container is captured by the Docker daemon and streamed into a configurable logging backend. Secondly, like many other parts of Docker, this system is pluggable and there are lots of powerful options available to you as plug-ins. But let’s not dive into the deep end just yet.
docker logs
We’ll start with the simplest Docker use case: the default logging mechanism. There are limitations to this mechanism, which we’ll explain in a minute, but for the simple case it works well, and it’s very convenient. If you are running Docker in development, this is probably the only logging strategy you’ll use there. This logging method has been there from the very beginning and is well understood and supported. The mechanism is the json-file method. The docker logs command exposes most users to this.
As is implied by the name, when you run the default json-file logging plug-in, your application’s logs are streamed by the Docker daemon into a JSON file for each container. This lets us retrieve logs for any container at any time.
We can display some logs from our example container running nginx with the following command:
$ docker logs 3c4f916619a5
2017/11/20 00:34:56 [notice] 12#0: using the "epoll" ...
2017/11/20 00:34:56 [notice] 12#0: nginx/1.0.15
2017/11/20 00:34:56 [notice] 12#0: built by gcc 4.4.7 ...
2017/11/20 00:34:56 [notice] 12#0: OS: Linux 3.8.0-35-generic
This is nice because Docker allows you to get the logs remotely, right from the command line, on demand. That’s really useful for low-volume logging.
Note
To limit the log output to more recent logs, you can use the --since option to display only logs after a specified RFC 3339 date (e.g., 2002-10-02T10:00:00-05:00), Unix timestamp (e.g., 1450071961), or Go duration string (e.g., 5m45s). You may also use --tail followed by a number of lines to tail.
The actual files backing this logging are on the Docker server itself, by default in /var/lib/docker/containers/<container_id>/ where the <container_id> is replaced by the actual container ID. If you take a look at one of those files, you’ll see it’s a file with each line representing a JSON object. It will look something like this:
{"log":"2018-02-04 23:58:51,003 INFO success: running.\r\n","stream":"stdout","time":"2018-02-04T23:58:51.004036238Z"}
That log field is exactly what was sent to stdout on the process in question; the stream field tells us that this was stdout and not stderr; and the precise time that the Docker daemon received it is provided in the time field. It’s an uncommon format for logging, but it’s structured rather than just a raw stream, which is beneficial if you want to do anything with the logs later.
Like a logfile, you can also tail the Docker logs live with docker logs -f:
$ docker logs -f 3c4f916619a5
nginx stderr | 2017/11/20 00:34:56 [notice] 12#0: using the "epoll" ...
nginx stderr | 2017/11/20 00:34:56 [notice] 12#0: nginx/1.0.15
nginx stderr | 2017/11/20 00:34:56 [notice] 12#0: built by gcc 4.4.7 ...
nginx stderr | 2017/11/20 00:34:56 [notice] 12#0: OS: Linux 3.8.0-35-generic
This looks identical to the usual docker logs, but the client then blocks, waiting on and displaying any new logs to appear, much like the Linux command line tail -f.
Tip
By configuring the tag log option similar to --log-opt tag="{{.ImageName}}/{{.ID}}", it is possible to change the default log tag (which every log line will start with) to something more useful. By default, Docker logs will be tagged with the first 12 characters of the container ID.
For single-host logging, this mechanism is pretty good. Its shortcomings are around log rotation, access to the logs remotely once they’ve been rotated, and disk space usage for high-volume logging. Despite being backed by a JSON file, this mechanism actually performs well enough that most production applications can log this way if that’s the solution that works for you. But if you have a more complex environment, you’re going to want something more robust, and with centralized logging capabilities.
Warning
The default settings do not currently enable log rotation. You’ll want to make sure you specify the --log-opt max-size and --log-opt max-file settings if running in production. Those limit the largest file size before rotation and the maximum number of logfiles to keep, respectively. max-file does not do anything unless you’ve also set max-size to tell Docker when to rotate the logs. Note that when this is enabled, the docker logs mechanism will return data only from the current logfile.
More Advanced Logging
For those times when the default mechanism isn’t enough—and at scale it’s probably not—Docker also supports configurable logging backends. This list of plug-ins is constantly growing. Currently supported are the json-file we described earlier, as well as syslog, fluentd, journald, gelf, awslogs, splunk, etwlogs, gcplogs, and logentries, which are used for sending logs to various popular logging frameworks and services.
That’s a big list of plug-ins we just threw out there. The supported option that currently is the simplest for running Docker at scale is the option to send your container logs to syslog directly from Docker. You can specify this on the Docker command line with the --log-driver=syslog option or set it as the default in the daemon.json file for all containers.
Tip
The daemon.json file is the configuration for the dockerd server. It can usually be found in the /etc/docker/ directory on the server. For Docker Community Edition, this file can be edited in Preferences → Daemon → Advanced from the UI. If you change this file, you will need to restart Docker Community Edition or the dockerd daemon.
There are also a number of third-party plug-ins available. We’ve seen mixed results from third-party plug-ins, primarily because they complicate installing and maintaining Docker. However, you may find that there is a third-party implementation that’s perfect for your system, and it might be worth the installation and maintenance hassle.
Warning
There are some caveats that apply to all of the logging drivers. For example, Docker supports only one at a time. This means that you can use the syslog or gelf logging friver, but not along with the json-file driver. Unless you run json-file or journald, you will lose the ability to use the docker logs command! This may not be expected and is a big consideration when you are changing the driver. There are too many gotchas to go through for each driver, but you should keep in mind the tradeoff between guaranteed delivery of logs and the potential for breaking your Docker deployment. UDP-based solutions or other nonblocking options are recommended.
Traditionally, most Linux systems have some kind of syslog receiver, whether it be syslog, rsyslog, or any of the many other options. This protocol in its various forms has been around for a long time and is fairly well supported by most deployments. When migrating to Docker from a traditional Linux or Unix environment, many companies already have syslog infrastructure in place, which means this is often the easiest migration path as well.
Note
Many newer Linux distributions are based on the systemd init system and therefore use journald for logging by default, which is different from syslog.
While we think that syslog is the easiest solution, it has its problems. The Docker syslog driver supports TLS, TCP, and UDP connection options, which sounds great, but you should be cautious about streaming logs from Docker to a remote log server over TCP or TLS. The problem with this is that they are both run on top of connection-oriented TCP sessions, and Docker tries to connect to the remote logging server at the time of container startup. If it fails to make the connection, it will block trying to start the container. If you are running this as your default logging mechanism, this can strike at any time on any deployment.
We don’t find that to be a particularly usable state for production systems and thus encourage you to use the UDP option for syslog logging if you intend to use the syslog driver. This does mean your logs are not encrypted and not guaranteed delivery. There are various philosophies around logging, and you’ll need to balance your need for logs against the reliability of your system. We err on the side of reliability, but if you run in a secure audit environment you may have different priorities. In a tighter security environment, you could run a syslog relay on the Docker host to receive over UDP and relay the logs off box over TLS.
Tip
You can log directly to a remote syslog-compatible server from a single container by setting the log option syslog-address similar to this: --log-opt syslog-address=udp://192.168.42.42:123.
One final caveat to be aware of regarding most of the logging plug-ins: they are blocking by default, which means that logging back-pressure can cause issues with your application. You can change this behavior by setting --log-opt mode=non-blocking and then setting the maximum buffer size for logs to something like --log-opt max-buffer-size=4m. Once these are set, the application will no longer block when that buffer fills up. Instead, the oldest loglines in memory will be dropped. Again, reliability needs to be weighed here against your business need to receive all logs.
Non-Plug-In Community Options
Outside of the Docker and third-party plug-ins, there are community contributions with many alternate ways of shipping your logs at scale. The most common non-Docker solution is to use a method to send your logs directly to a syslog-compatible server, bypassing Docker. There are several mechanisms in use:
-
Log directly from your application.
-
Have a process manager in your container relay the logs (e.g.,
systemd,upstart,supervisor, orrunit). -
Run a logging relay in the container that wraps
stdout/stderrfrom the container. -
Relay the Docker JSON logs themselves to a remote logging framework from the server or another container.
Warning
Some third-party libraries and programs, like supervisor, write to the filesystem for various (and sometimes unexpected) reasons. If you are trying to design clean containers that do not write directly into the container filesystem, you should consider utilizing the --read-only and --tmpfs options to docker run that we discussed in Chapter 4. Writing logs inside the container is not recommended. It makes them hard to get to, prevents them from being preserved beyond the container lifespan, and can wreak havoc with the Docker filesystem backend.
Many of these non-plug-in options share the same drawbacks as changing the logging driver in Docker itself: they hide logs from docker logs so that you cannot access them as easily during debugging without relying on an external application. Let’s see how these options stack up.
Logging directly from your application to syslog might make sense, but if you’re running any third-party applications, this approach probably won’t work and is inflexible, since you must redeploy all your application whenever you want to make changes to how logging is handled. And unless you also emit all your logs on stdout and stderr inside the container, they will not be visible in docker logs.
Spotify has a simple, statically linked Go relay to handle logging your stderr and stdout to syslog for one process inside the container. Generally you run this from the CMD line in the Dockerfile. Because it’s statically compiled, it has no dependencies, which makes it very flexible. By default, this relay swallows the loglines, so they are not visible in docker logs unless you start it with the -tee=true flag.
The svlogd daemon from the runit init system can collect logs from your process’s stdout and ship them to remote hosts over UDP. It’s simple to set up and available in many Linux distributions via native packages, which makes it easy to install.
If you want to have one system to support all your containers, a popular option is Logspout, which runs in a separate container, talks to the Docker daemon, and logs all of the system’s container logs to syslog (UDP, TCP, TLS). The advantage of this approach is that it does not preclude docker logs, but it does require that you set up log rotation. It also will not block starting up any containers when the remote syslog server is unavailable!
Finally, while you really should be capturing your logs somewhere, there are rare situations where you simply don’t want any logging. You can turn them off completely using the --log-driver=none switch.
Monitoring Docker
Among the most important requirements for production systems is that they be observable and measurable. A production system where you are blind to how it’s behaving won’t work well in the long run. In the modern operations environment, we monitor everything meaningful and report as many useful statistics as we can. Docker supports container health checks and some nice, basic reporting capabilities via docker stats and docker events. We’ll show you those and then look at a community offering from Google that does some nice graphing output, and a—currently experimental—feature of Docker that exports container metrics to the Prometheus monitoring system.
Container Stats
Let’s start with the CLI tools that ship with Docker itself. The docker CLI has an endpoint for viewing stats of running containers. The command-line tool can stream from this endpoint and every few seconds report back on one or more listed containers, giving basic statistics information about what’s happening. docker stats, like the Linux top command, takes over the current terminal and updates the same lines on the screen with the current information. It’s hard to show that in print so we’ll just give an example, but this updates every few seconds by default.
Command-line stats
$ docker stats b668353c3af5
CONTAINER     CPU %    MEM USAGE/LIMIT    MEM %  NET I/O    BLK I/O    PIDS
b668353c3af5  1.50%    60.39MiB/200MiB  30.19% 335MB/9.1GB  45.4MB/0B  17
Let’s break that rather dense output down into some manageable chunks. What we have is:
-
The container ID (but not the name).
-
The amount of CPU it’s currently consuming.
-
The amount of memory it has in use followed by the maximum amount it’s allowed to use.
-
Network and block I/O statistics.
-
The number of active processes inside the container.
Some of these will be more useful than others for debugging, so let’s take a look at what we’d do with them.
One of the more helpful pieces of output here is the percentage of memory used versus the limit that was set for the container. One common problem with running production containers is that overly aggressive memory limits can cause the kernel OOM (out of memory) killer to stop the container over and over again. The stats command can really help with tracking that down.
With regard to I/O statistics, if you run all of your applications in containers, then this summary can make it very clear where your I/O is going from the system. Before containers, this was much harder to figure out!
The number of active processes inside the container is helpful for debugging as well. If you have an application that is spawning children without reaping them, this can expose it pretty quickly.
One great feature of docker stats is that it can show not just one container, but all of them in a single summary. That can be pretty revealing, even on boxes where you think you know what they are doing.
That is all useful and easy to digest because it’s human formatted and available on the command line. But there is an additional endpoint on the Docker API that provides a lot more information than is shown in the client. We’ve steered away from hitting the API in this book so far, but in this case the data provided by the API is so much richer that we’ll use curl to call it and see what our container is doing. It’s nowhere near as nice to read, but there is a lot more detail. This is a good intro to calling the API yourself as well.
Stats API endpoint
The /stats/ endpoint that we’ll hit on the API will continue to stream stats to us as long as we keep the connection open. Since as humans we can’t really parse the JSON, we’ll just ask for one line and then use Python to “pretty-print” it—we’ll show that shortly. In order for this command to work, you’ll need to have Python installed (version 2.6 or later). If you don’t and you still want to see the JSON output, you can skip the pipe to Python, but you’ll get plain, ugly JSON back. If you already have a favorite JSON pretty-printer, you should feel free to use that instead.
Tip
Another useful tool for pretty-printing JSON on the command line is jq, which is available for most platforms. This is actually an incredibly powerful tool for working with JSON and is worth familiarizing yourself with if you work with JSON much.
Most Docker daemons will be installed with the API available only on the Unix domain socket and not published on TCP. So we’ll use curl from the host itself to call the API. If you plan to monitor this endpoint in production, you’ll want to expose the Docker API on a TCP port, usually over SSL and requiring credentials. The Docker documentation will walk you through this.
Note
You can usually inspect the contents of the DOCKER_HOST environment variable, using something like echo $DOCKER_HOST, to discover the hostname or IP address of the Docker server that you are using.
First, start up a container that you can read stats from:
$ docker run -d ubuntu:latest sleep 1000
91c86ec7b33f37da9917d2f67177ebfaa3a95a78796e33139e1b7561dc4f244a
Now that the container is running, you can get an ongoing stream of statistics about the container in JSON format by running something like curl with your container’s hash.
Note
In the following examples, we are running curl against the Docker socket, but you could just as easily run it against the Docker port, if you have it bound.
$ curl --unix-socket /var/run/docker.sock \
    http://v1/containers/91c86ec7b33f/stats
Note
This JSON stream of statistics will not stop on its own. So for now, we can use the Ctrl-C key combination to stop it.
To get a single group of statistics, we can run something similar to this:
$ curl --unix-socket /var/run/docker.sock \
    http://v1/containers/91c86ec7b33f/stats | head -1
And finally, if we have Python or another tool capable of pretty-printing JSON, we can make this output human-readable, as shown here:
$ curl --unix-socket /var/run/docker.sock \
    http://v1/containers/91c86ec7b33f/stats \
    | head -1 | python -m json.tool
{"blkio_stats":{"io_merged_recursive":[],"io_queue_recursive":[],"io_service_bytes_recursive":[{"major":8,"minor":0,"op":"Read","value":6098944},...],"io_service_time_recursive":[],"io_serviced_recursive":[{"major":8,"minor":0,"op":"Read","value":213},...],"io_time_recursive":[],"io_wait_time_recursive":[],"sectors_recursive":[]},"cpu_stats":{"cpu_usage":{...},"system_cpu_usage":1884140000000,"throttling_data":{"periods":0,"throttled_periods":0,"throttled_time":0}},"memory_stats":{"failcnt":0,"limit":1035853824,"max_usage":7577600,"stats":{..."total_active_anon":1368064,"total_active_file":221184,"total_cache":6148096,"total_inactive_anon":24576,"total_inactive_file":5890048,"total_mapped_file":2215936,"total_pgfault":2601,"total_pgmajfault":46,"total_pgpgin":2222,"total_pgpgout":390,"total_rss":1355776,"total_unevictable":0,"unevictable":0},"usage":7577600},"network":{"rx_bytes":936,"rx_dropped":0,"rx_errors":0,"rx_packets":12,"tx_bytes":468,"tx_dropped":0,"tx_errors":0,"tx_packets":6},"read":"2018-02-11T15:20:22.930379289-08:00"}
There is a lot of information in there. We’ve cut it down to prevent wasting any more trees or electrons than necessary, but even so, there is a lot to digest. The main idea is to let you see how much data is available from the API about each container. We won’t spend much time going into the details, but you can get quite detailed memory usage information, as well as block I/O and CPU usage information.
If you are doing your own monitoring, this is a great endpoint to hit as well. A drawback, however, is that it’s one endpoint per container, so you can’t get the stats about all containers from a single call.
Container Health Checks
As with any other application, when you launch a container it is possible that it will start and run, but never actually enter a healthy state where it could receive traffic. Production systems also fail and your application may become unhealthy at some point during its life, so you need to be able to deal with that.
Many production environments have standardized ways to health-check applications. Unfortunately, there’s no clear standard for how to do that across organizations and so it’s unlikely that many companies do it in the same way. For this reason, monitoring systems have been built to handle that complexity so that they can work in a lot of different production systems. It’s a clear place where a standard would be a big win.
To help remove this complexity and standardize on a universal interface, Docker has added a health-check mechanism. Following the shipping container metaphor, Docker containers should really look the same to the outside world no matter what is inside the container, so Docker’s health-check mechanism not only standardizes health checking for containers, but also maintains the isolation between what is inside the container and what it looks like on the outside. This means that containers from Docker Hub or other shared repositories can implement a standardized health-checking mechanism and it will work in any other Docker environment designed to run production containers.
Health checks are a build-time configuration item and are created with a check definition in the Dockerfile. This directive tells the Docker daemon what command it can run inside the container to ensure the container is in a healthy state. As long as the command exits with a code of zero (0), Docker will consider the container to be healthy. Any other exit code will indicate to Docker that the container is not in a healthy state, at which point appropriate action can be taken by a scheduler or monitoring system.
We will be using the following project to explore Docker Compose in a few chapters. But, for the moment, it includes a useful example of Docker health checks. Go ahead and pull down a copy of the code and then navigate into the rocketchat-hubot-demo/mongodb/docker/ directory:
$ git clone https://github.com/spkane/rocketchat-hubot-demo.git \
    --config core.autocrlf=input
$ cd rocketchat-hubot-demo/mongodb/docker
In this directory, you will see a Dockerfile and a script called docker-healthcheck. If you view the Dockerfile, this is all that you will see:
<codeclass="k">FROM</code> <codeclass="s2">mongo:3.2</code> <codeclass="k">COPY</code> <codeclass="s2">docker-healthcheck /usr/local/bin/</code> <codeclass="k">HEALTHCHECK CMD</code> <codeclass="s2">["docker-healthcheck"]</code>
It is very short because we are basing this on the upstream Mongo image, and our image inherits a lot of things from that including the entry point, default command, and port to expose:
ENTRYPOINT["docker-entrypoint.sh"]EXPOSE27017CMD["mongod"]
So, in our Dockerfile we are only adding a single script that can health-check our container, and defining a health-check command that runs that script.
You can build the container like this:
$ docker build -t mongo-with-check:3.2 .
Sending build context to Docker daemon  3.072kB
Step 1/3 : FROM mongo:3.2
 ---> 56d7fa068c3d
Step 2/3 : COPY docker-healthcheck /usr/local/bin/
 ---> 217c13baf475
Step 3/3 : HEALTHCHECK CMD ["docker-healthcheck"]
 ---> Running in d18658520abf
Removing intermediate container d18658520abf
 ---> f69ff65ac29c
Successfully built f69ff65ac29c
Successfully tagged mongo-with-check:3.2
And then run the container and looking at the docker ps output:
$ docker run -d --name mongo-hc mongo-with-check:3.2
1ad213256ab2f24fd65d91e5ce47c8a6c3c47a74cf0251e3afa6fdfc2fbadf0e

$ docker ps
... IMAGE                ... STATUS                         PORTS     ...
... mongo-with-check:3.2 ... Up 1 second (health: starting) 27017/tcp ...
You should notice that the STATUS column now has a health section in parentheses. Initially this will display health: starting as the container is starting up. You can change the amount of time that Docker waits for the container to initialize using the --health-start-period argument to docker run. The status will change to healthy once the container is up and the health check is successful.
$ docker ps
... IMAGE                ... STATUS                      PORTS     ...
... mongo-with-check:3.2 ... Up About a minute (healthy) 27017/tcp ...
You can query this status directly, using the docker inspect command.
$ docker inspect --format='{{.State.Health.Status}}' mongo-hc
healthy

$ docker inspect --format='{{json .State.Health}}' mongo-hc | jq
{"Status":"healthy","FailingStreak":0,"Log":[...]}
If your container began failing its health check, the status would change to unhealthy and you could then determine how to handle the situation.
$ docker ps
... IMAGE                ... STATUS                   PORTS     ...
... mongo-with-check:3.2 ... Up 9 minutes (unhealthy) 27017/tcp ...
Tip
As with most systems, you can configure a lot of details about your health checks, including how often Docker checks the health (--health-interval), how many failures are required to cause the container to be marked unhealthy (--health-retries), and more. You can even disable the health check completely (--no-healthcheck) if needed.
This feature is very useful, and you should strongly consider using it in all of your containers. This will help you improve both the reliability of your environment and the visibility you have into how things are running in it. It is also supported by most production schedulers and many monitoring systems, so it should be easy to implement.
Docker Events
The dockerd daemon internally generates an events stream around the container lifecycle. This is how various parts of the system find out what is going on in other parts. You can also tap into this stream to see what lifecycle events are happening for containers on your Docker server. This, as you probably expect by now, is implemented in the docker CLI tool as another command-line argument. When you run this command, it will block and continually stream messages to you. Behind the scenes, this is a long-lived HTTP request to the Docker API that returns messages in JSON blobs as they occur. The docker CLI tool decodes them and prints some data to the terminal.
This events stream is useful in monitoring scenarios or in triggering additional actions, like wanting to be alerted when a job completes. For debugging purposes, it allows you to see when a container died even if Docker restarts it later. Down the road, this is a place where you might also find yourself directly implementing some tooling against the API. Here’s how we use it on the command line:
$ docker events
2018-02-18T14:00:39-08:00 1b3295bf300f: (from 0415448f2cc2) die

2018-02-18T14:00:39-08:00 1b3295bf300f: (from 0415448f2cc2) stop

2018-02-18T14:00:42-08:00 1b3295bf300f: (from 0415448f2cc2) start
Tip
As with the Docker statistics, you can access the Docker events via curl using a command like curl --unix-socket /var/run/docker.sock http://v1/events.
In this example, we initiated a stop signal with docker stop, and the events stream logs this as a “die” message. The “die” message actually marks the beginning of the shutdown of the container. It doesn’t stop instantaneously. So, following the “die” message is a “stop” message, which is what Docker says when a container has actually stopped execution. Docker also helpfully tells us the ID of the image that the container is running on. This can be useful for tying deployments to events, for example, because a deployment usually involves a new image.
Once the container was completely down, we initiated a docker start to tell it to run again. Unlike the “die/stop” operations, this is a single command that marks the point at which the container is actually running. We don’t get a message telling us that someone explicitly started it. So what happens when we try to start a container that fails?
2015-02-18T14:03:31-08:00 e64a279663aa: (from e426f6ef897e) die
Note that here the container was actually asked to start, but it failed. Rather than seeing a “start” and a “die,” all we see is a “die.”
If you have a server where containers are not staying up, the docker events stream is pretty helpful in seeing what’s going on and when. But if you’re not watching it at the time, Docker very helpfully caches some of the events and you can still get at them for some time afterward. You can ask it to display events after a time with the --since option, or before with the --until option. You can also use both to limit the window to a narrow scope of time when an issue you are investigating may have occurred. Both options take ISO time formats like those in the previous example (e.g., 2018-02-18T14:03:31-08:00).
cAdvisor
docker stats and docker events are useful but don’t yet get us graphs to look at. And graphs are pretty helpful when we’re trying to see trends. Of course, other people have filled some of this gap. When you begin to explore the options for monitoring Docker, you will find that many of the major monitoring tools now provide some functionality to help you improve the visibility into your containers’ performance and ongoing state.
In addition to the commercial tooling provided by companies like DataDog, GroundWork, and New Relic, there are plenty of options for free, open source tools like Prometheus or even Nagios. We’ll talk about Prometheus in the next section, but first we’ll start with a nice offering from Google. A few years ago they released their own internal container advisor as a well-maintained open source project on GitHub, called cAdvisor. Although cAdvisor can be run outside of Docker, by now you’re probably not surprised to hear that the easiest implementation of cAdvisor is to simply run it as a Docker container.
To install cAdvisor on most Linux systems, all you need to do is run this code:
$ docker run \
    --volume=/:/rootfs:ro \
    --volume=/var/run:/var/run:rw \
    --volume=/sys:/sys:ro \
    --volume=/var/lib/docker/:/var/lib/docker:ro \
    --publish=8080:8080 \
    --detach=true \
    --name=cadvisor \
    google/cadvisor:latest

Unable to find image 'google/cadvisor:latest' locally
Pulling repository google/cadvisor
f0643dafd7f5: Download complete
...
ba9b663a8908: Download complete
Status: Downloaded newer image for google/cadvisor:latest
f54e6bc0469f60fd74ddf30770039f1a7aa36a5eda6ef5100cddd9ad5fda350b
Note
On RHEL and CentOS-based systems, you will need to add the following line to the docker run command shown here: --volume=/cgroup:/cgroup \.
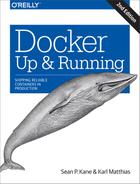
Once you have done this, you will be able to navigate to your Docker host on port 8080 to see the cAdvisor web interface (i.e., http://172.17.42.10:8080/) and the various detailed charts it has for the host and individual containers (see Figure 6-1).
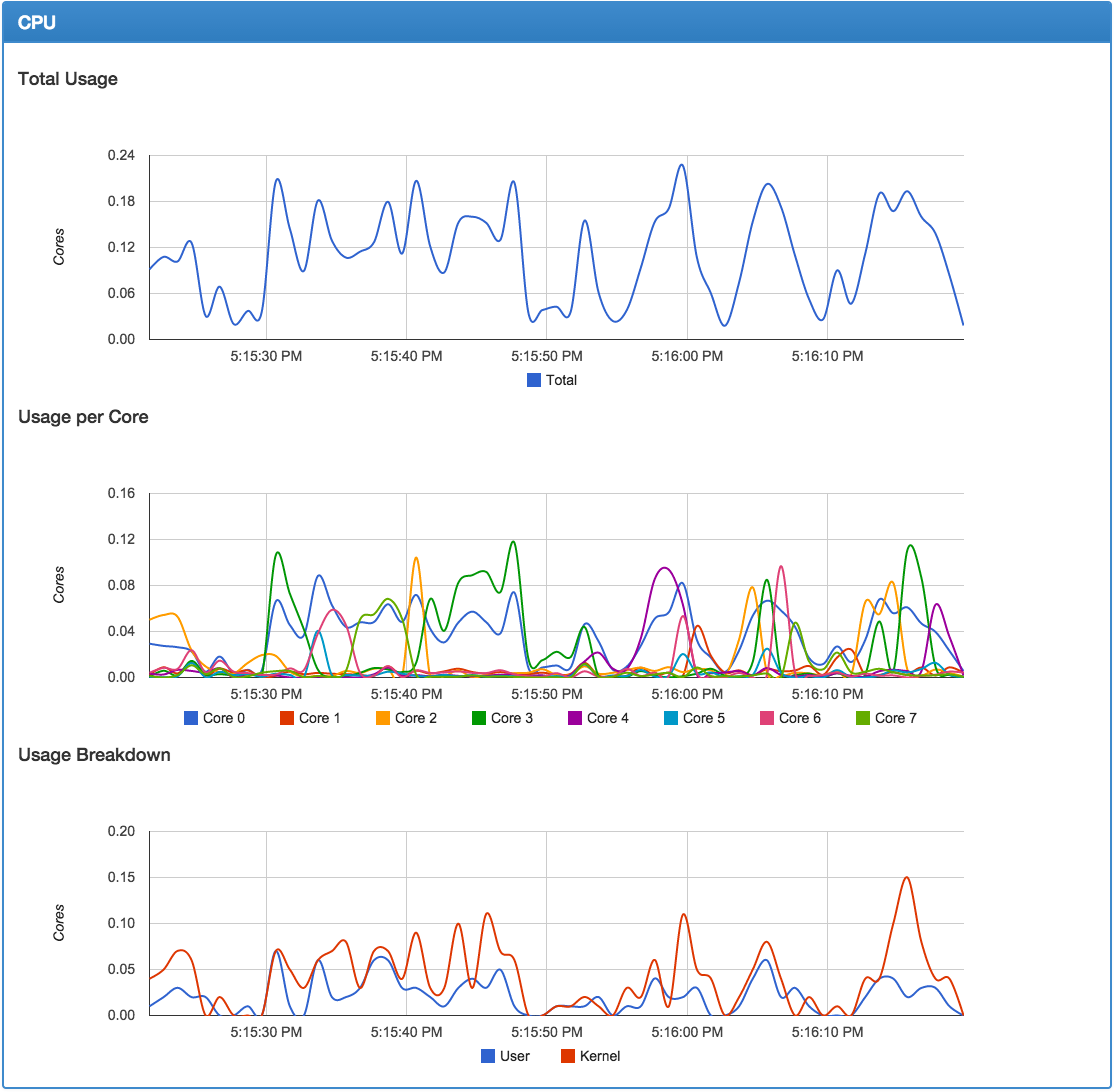
Figure 6-1. cAdvisor CPU graphs
cAdvisor provides a REST API endpoint, which can easily be queried for detailed information by your monitoring systems:
$ curl http://172.17.42.10:8080/api/v1.3/containers/
{"name":"/","subcontainers":[{"name":"/docker"}],"spec":{"creation_time":"2015-04-05T00:05:40.249999996Z","has_cpu":true,"cpu":{"limit":1024,"max_limit":0,"mask":"0-7"},"has_memory":true,"memory":{"limit":2095771648,"swap_limit":1073737728},"has_network":true,"has_filesystem":true,"has_diskio":true},"stats":[{"timestamp":"2015-04-05T00:26:50.679218419Z","cpu":{"usage":{"total":123375166639,"per_cpu_usage":[41967365270,...9229283688],"user":22990000000,"system":43890000000},"load_average":0},"diskio":{},"memory":{"usage":1910095872,"working_set":1025523712,"container_data":{...},"hierarchical_data":{...}},"network":{...},"filesystem":[{"device":"/dev/sda1","capacity":19507089408,"usage":2070806528,...}],"task_stats":{"nr_sleeping":0,"nr_running":0,"nr_stopped":0,"nr_uninterruptible":0,"nr_io_wait":0}},...}]}
As you can see from the preformatted output, the amount of detail provided here should be sufficient for many of your graphing and monitoring needs.
Prometheus Monitoring
The Prometheus monitoring system has become a popular solution for monitoring distributed systems. It works largely on a pull model, where it reaches out and gathers statistics from endpoints on a timed basis. Docker has an endpoint that was built for Prometheus and makes it really easy to integrate your container stats into a Prometheus monitoring system. At the time of this writing, the endpoint is currently experimental and not enabled in the dockerd server by default. This feature seems pretty popular, and we suspect it will become a permanent feature of the daemon shortly. It’s up to you if you want to use it as it stands. Our brief experience with it shows that it seems to work well, and it’s a pretty slick solution, as we’ll show you. We should point out that this solution is for monitoring the dockerd server, in contrast to the other solutions, which exposed information about the containers.
In order to export metrics to Prometheus, we need to reconfigure the dockerd server to enable the experimental features, and additionally to expose the metrics listener on a port of our choice. This is nice, because we don’t have to expose the whole Docker API on a TCP listener in order to get metrics out of the system—a security win at the expense of a little more configuration. To do that, we can either provide the --experimental and --metrics-addr= options on the command line, or we can put them into the daemon.json file that the daemon uses to configure itself. Because many current distributions run systemd and changing configurations there is highly dependent on your installation, we’ll use the daemon.json option since it’s more portable. We’ll demonstrate this on Ubuntu Linux 16.04 LTS. On this distribution, the file is usually not present to begin with. So let’s put one there using your favorite editor.
Tip
As previously mentioned, the daemon.json file for Docker Community Edition can be edited in Preferences → Daemon → Advanced from the UI. If you change this file, you will need to restart Docker Community Edition or the dockerd daemon.
Paste in the following, removing anything else that might be in there:
{"experimental":true,"metrics-addr":"0.0.0.0:9323"}
You should now have a file that contains only what you just pasted and nothing else.
Warning
Any time you make a service available on the network, you need to consider what security risks you might introduce. We believe the benefit of making metrics available is worth the tradeoff, but you should think through the repercussions in your scenario. For example, making them available on the public internet is probably not a good idea in most cases.
When we restart Docker we’ll now have a listener on all addresses on port 9323. That’s where we’ll have Prometheus connect to get our metrics. But first we need to restart the dockerd server and test out the endpoint:
$ systemctl restart docker
$ curl -s http://localhost:9323/metrics | head -15
# HELP builder_builds_failed_total Number of failed image builds
# TYPE builder_builds_failed_total counter
builder_builds_failed_total{reason="build_canceled"} 0
builder_builds_failed_total{reason="build_target_not_reachable_error"} 0
builder_builds_failed_total{reason="command_not_supported_error"} 0
builder_builds_failed_total{reason="dockerfile_empty_error"} 0
builder_builds_failed_total{reason="dockerfile_syntax_error"} 0
builder_builds_failed_total{reason="error_processing_commands_error"} 0
builder_builds_failed_total{reason="missing_onbuild_arguments_error"} 0
builder_builds_failed_total{reason="unknown_instruction_error"} 0
# HELP builder_builds_triggered_total Number of triggered image builds
# TYPE builder_builds_triggered_total counter
builder_builds_triggered_total 0
# HELP engine_daemon_container_actions_seconds The number of seconds it takes to
# process each container action
# TYPE engine_daemon_container_actions_seconds histogram
You should not get any errors returned from the systemctl call in the first line. If you do, you may have done something wrong when writing the daemon.json file. You should get some output from the curl command that looks something like what we show here. It might not be identical, and that’s OK as long as you get something that is not error messages.
So now we have a place where Prometheus could get to our statistics. But we need to have Prometheus running somewhere, right? We can easily do that by spinning up a container. But first we need to write a simple config. We’ll put it in /tmp/prometheus/prometheus.yaml. You can either use the cat trick we used before, or use your favorite editor to put the following into the file:
# Scrape metrics every 5 seconds and name the monitor 'stats-monitor'global:scrape_interval:5sexternal_labels:monitor:'stats-monitor'# We're going to name our job 'DockerStats' and we'll connect to the docker0# bridge address to get the stats. If your docker0 has a different IP address# then use that instead. 127.0.0.1 and localhost will not work.scrape_configs:-job_name:'DockerStats'static_configs:-targets:['172.17.0.1:9323']
Note
In Docker Community Edition for the Mac and Windows, you can use host.docker.internal:9323 in place of the 172.17.0.1:9323 shown here.
As noted in the file, you should use the IP address of your docker0 bridge here, or the IP address of your ens3 or eth0 interface since localhost and 127.0.0.1 are not routable from the container. The address we used here is the usual default for docker0, so it’s probably the right one for you.
Now that we’ve written that out, we need to start up the container using this config:
$ docker run -d -p 9090:9090 \
    -v /tmp/prometheus/prometheus.yaml:/etc/prometheus.yaml \
    prom/prometheus --config.file=/etc/prometheus.yaml
That will run the container and volume mount the config file we made into the container so that it will find the settings we need it to have to monitor our Docker endpoint. If it starts up cleanly, you should now be able to open your browser and navigate to port 9090 on your Docker host. There you will get a Prometheus window something like Figure 6-2.
Figure 6-2. Prometheus event graph
Here we’ve selected one of the metrics, the engine_daemon_events_total, and graphed it over a short period. You can easily query any of the other metrics in the drop-down. Further work and exploration with Prometheus would allow you to define alerts and alerting policies based on these metrics as well. And you don’t need to stop with monitoring the dockerd server. You can also expose metrics for Prometheus from your applications. If you’re intrigued and want to look at something more advanced, you might take a look at DockProm, which leverages Grafana to make nice dashboards and also queries your container metrics like those in the Docker API /stats endpoint.
Exploration
That gives you all the basics you need to start running containers. It’s probably worth downloading a container or two from the Docker Hub registry and exploring a bit on your own to get used to the commands we just learned. There are many other things you can do with Docker, including but not limited to:
-
Copying files in and out of the container with
docker cp -
Saving a container’s filesystem to a tarball with
docker export -
Saving an image to a tarball with
docker save -
Loading an image from a tarball with
docker import
Docker has a huge feature set that you will likely grow into over time. Each new release adds more functionality as well. We’ll get into a lot more detail later on about many of the other commands and features, but keep in mind that Docker’s whole feature set is very large.
Wrap-Up
In the next chapter we will dive into some of the more technical details about how Docker works and how you can use this knowledge to debug your containerized applications.