Table of Contents for
Foundations for Analytics with Python
 Foundations for Analytics with Python
Published by
O'Reilly Media, Inc., 2016
Foundations for Analytics with Python
Published by
O'Reilly Media, Inc., 2016
- Cover
- nav
- Foundations for Analyticswith Python
- Dedication
- Foundations for Analytics with Python
- Preface
- 1. Python Basics
- 2. Comma-Separated Values (CSV) Files
- 3. Excel Files
- 4. Databases
- 5. Applications
- 6. Figures and Plots
- 7. Descriptive Statistics and Modeling
- 8. Scheduling Scripts to Run Automatically
- 9. Where to Go from Here
- A. Download Instructions
- B. Answers to Exercises
- Bibliography
- Index
- About the Author
- Colophon
Chapter 3. Excel Files
Microsoft Excel is ubiquitous. We use Excel to store data on customers, inventory, and employees. We use it to track operations, sales, and financials. The list of ways people use Excel in business is long and diverse. Because Excel is such an integral tool in business, knowing how to process Excel files in Python will enable you to add Python into your data processing workflows, receiving data from other people and sharing results with them in ways they’re comfortable with.
Unlike Python’s csv module, there is not a standard module in Python for processing Excel files (i.e., files with the .xls or .xlsx extension). To complete the examples in this section, you need to have the xlrd and xlwt packages. The xlrd and xlwt packages enable Python to process Excel files on any operating system, and they have strong support for Excel dates. If you installed Anaconda Python, then you already have the packages because they’re bundled into the installation. If you installed Python from the Python.org website, then you need to follow the instructions in Appendix A to download and install the two packages.
A few words on terminology: when I refer to an “Excel file” that’s the same thing as an “Excel workbook.” An Excel workbook contains one or more Excel worksheets. In this chapter, I’ll be using the words “file” and “workbook” interchangeably, and I’ll refer to the individual worksheets within a workbook as worksheets.
As we did when working with CSV files in Chapter 2, we’ll go through each of the examples here in base Python, so you can see every logical step in the data processing, and then using pandas, so you can have a (usually) shorter and more concise example—though one that’s a bit more abstract—if you want to copy and modify it for use in your work.
To get started with the examples in this chapter, we need to create an Excel workbook:
-
Open Microsoft Excel.
-
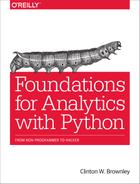
Add three separate worksheets to the workbook and name them january_2013, february_2013, and march_2013. Then add the data as shown in Figure 3-1, Figure 3-2, and Figure 3-3, respectively.
-
Save the workbook as sales_2013.xlsx.
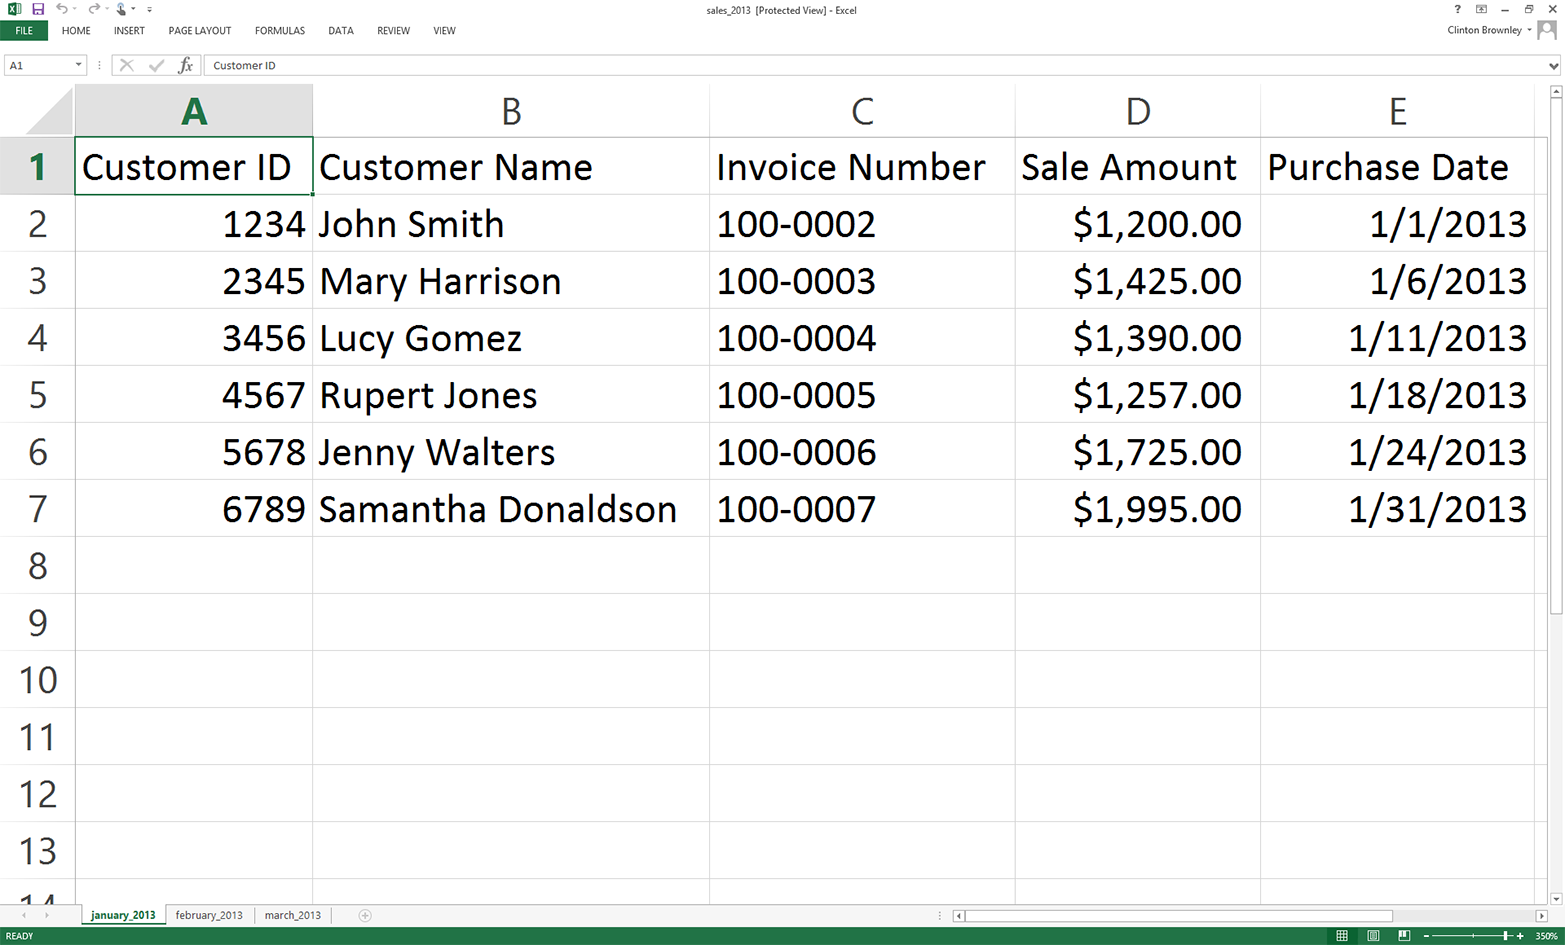
Figure 3-1. Worksheet 1: january_2013
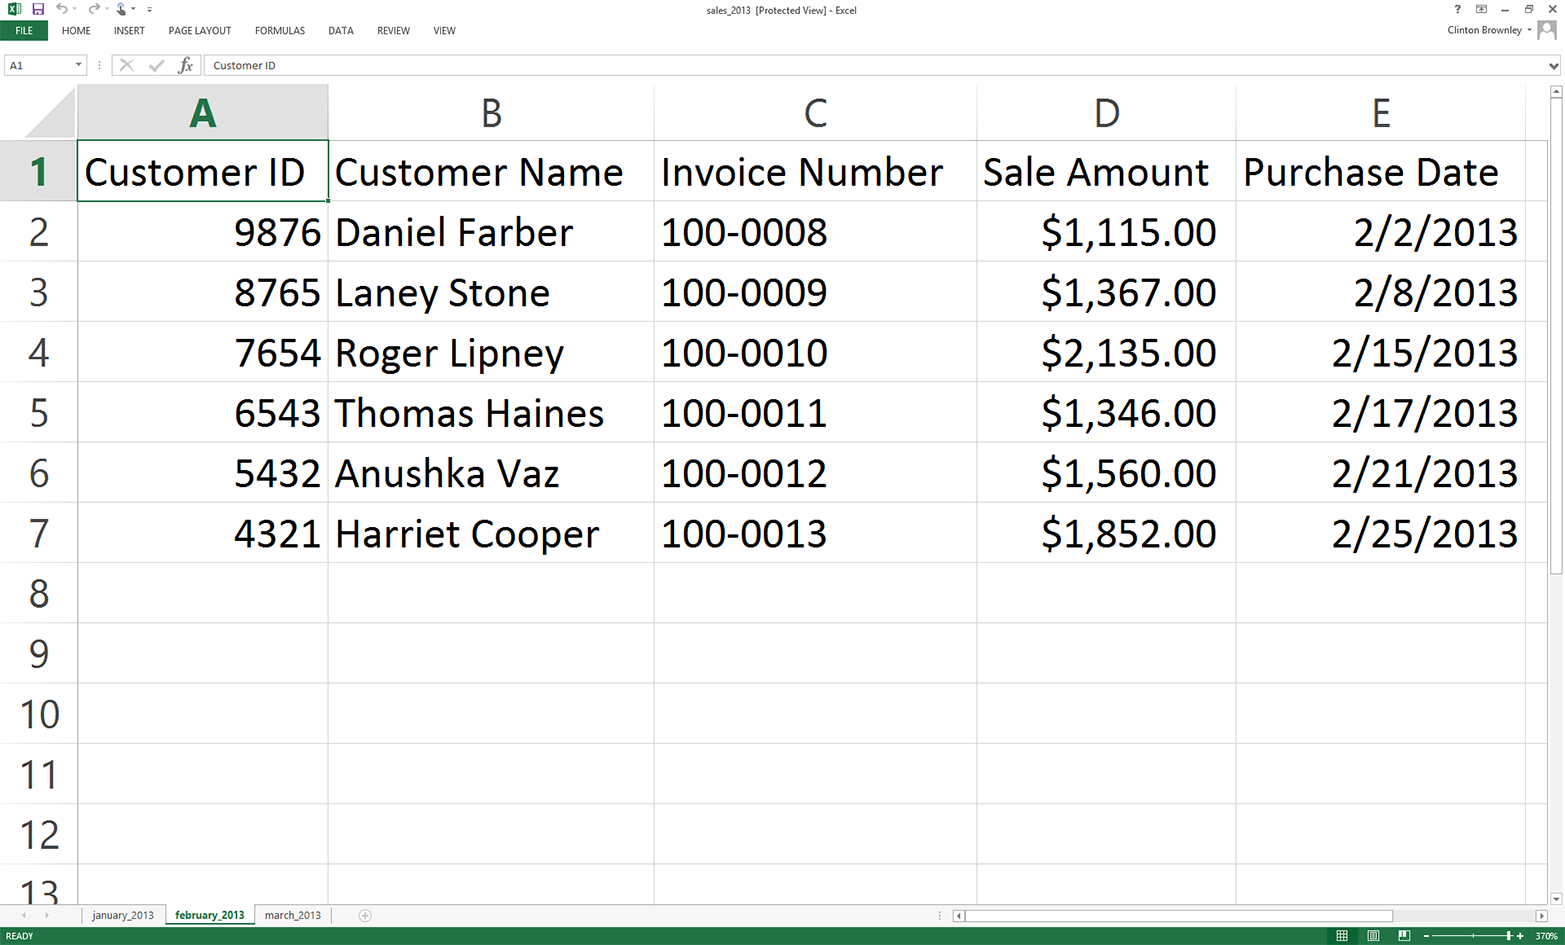
Figure 3-2. Worksheet 2: february_2013
Figure 3-3. Worksheet 3: march_2013
Introspecting an Excel Workbook
Now that we have an Excel workbook that contains three worksheets, let’s learn how to process an Excel workbook in Python. As a reminder, we are using the xlrd and xlwt packages in this chapter, so make sure you have already downloaded and installed these add-in packages.
As you are probably already aware, Excel files are different from CSV files in at least two important respects. First, unlike a CSV file, an Excel file is not a plain-text file, so you cannot open it and view the data in a text editor. You can see this by right-clicking on the Excel workbook you just created and opening it in a text editor like Notepad or TextWrangler. Instead of legible data, you will see a mess of special characters.
Second, unlike a CSV file, an Excel workbook is designed to contain multiple worksheets. Because a single Excel workbook can contain multiple worksheets, we need to learn how to introspect (i.e., look inside and examine) all of the worksheets in a workbook without having to manually open the workbook. By introspecting a workbook, we can examine the number of worksheets and the types and amount of data on each worksheet before we actually process the data in the workbook.
Introspecting Excel files is useful to make sure that they contain the data you expect, and to do a quick check for consistency and completeness. That is, understanding the number of input files and the number of rows and columns in each file will give you some idea about the size of the processing job as well as the potential consistency of the file layouts.
Once you understand how to introspect the worksheets in a workbook, we will move on to parsing a single worksheet, iterating over multiple worksheets, and then iterating over multiple workbooks.
To determine the number of worksheets in the workbook, the names of the worksheets, and the number of rows and columns in each of the worksheets, type the following code into a text editor and save the file as 1excel_introspect_workbook.py:
1#!/usr/bin/env python32importsys3fromxlrdimportopen_workbook4input_file=sys.argv[1]5workbook=open_workbook(input_file)6('Number of worksheets:',workbook.nsheets)7forworksheetinworkbook.sheets():8("Worksheet name:",worksheet.name,"\tRows:",\ 9worksheet.nrows,"\tColumns:",worksheet.ncols)
Figure 3-4, Figure 3-5, and Figure 3-6 show what the script looks like in Anaconda Spyder, Notepad++ (Windows), and TextWrangler (macOS), respectively.
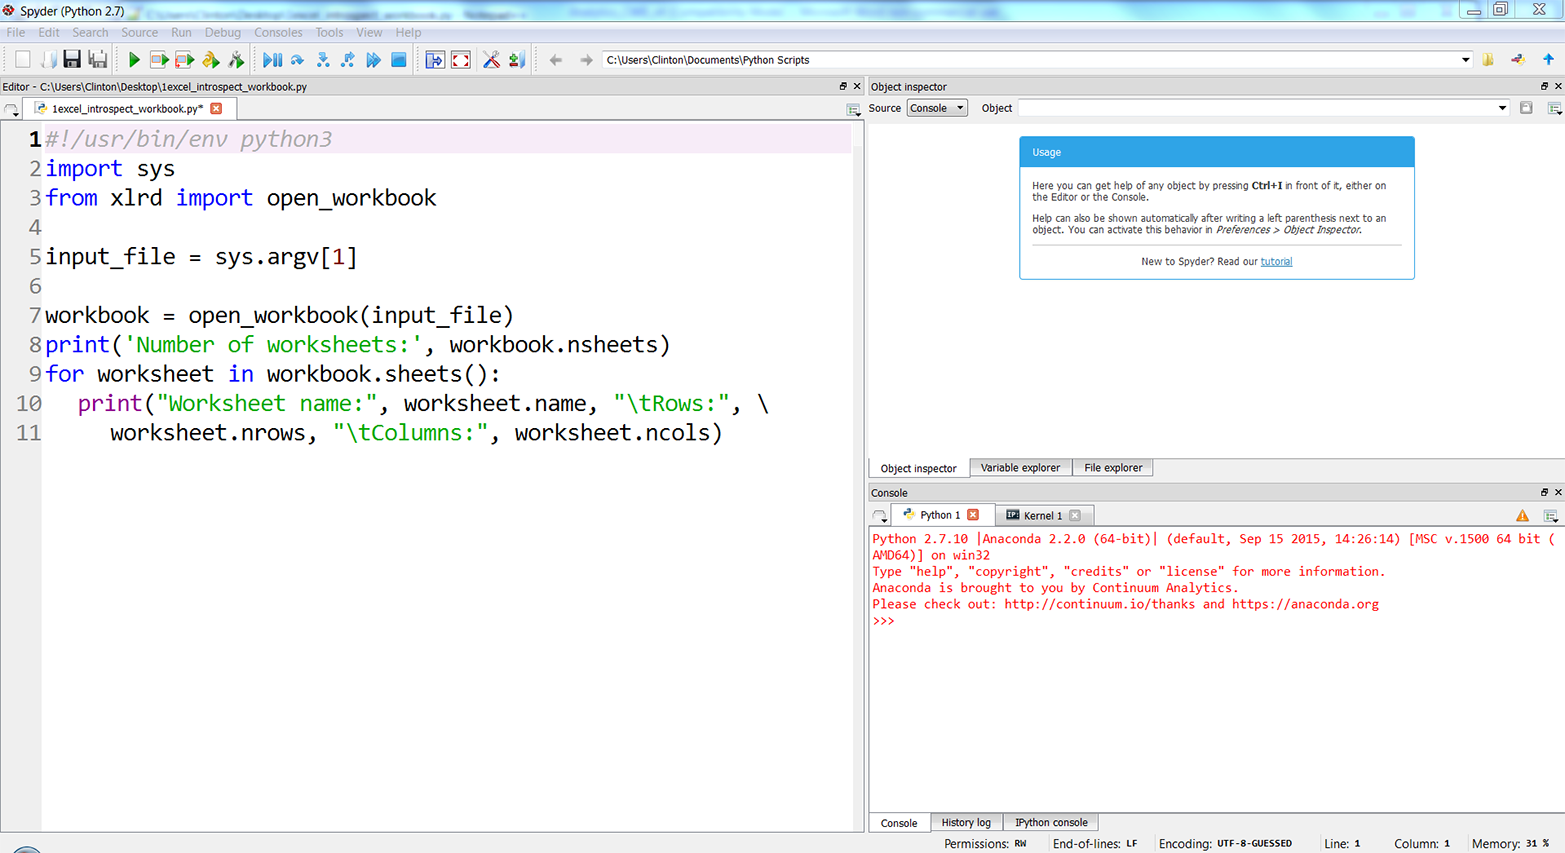
Figure 3-4. The 1excel_introspect_workbook.py Python script in Anaconda Spyder
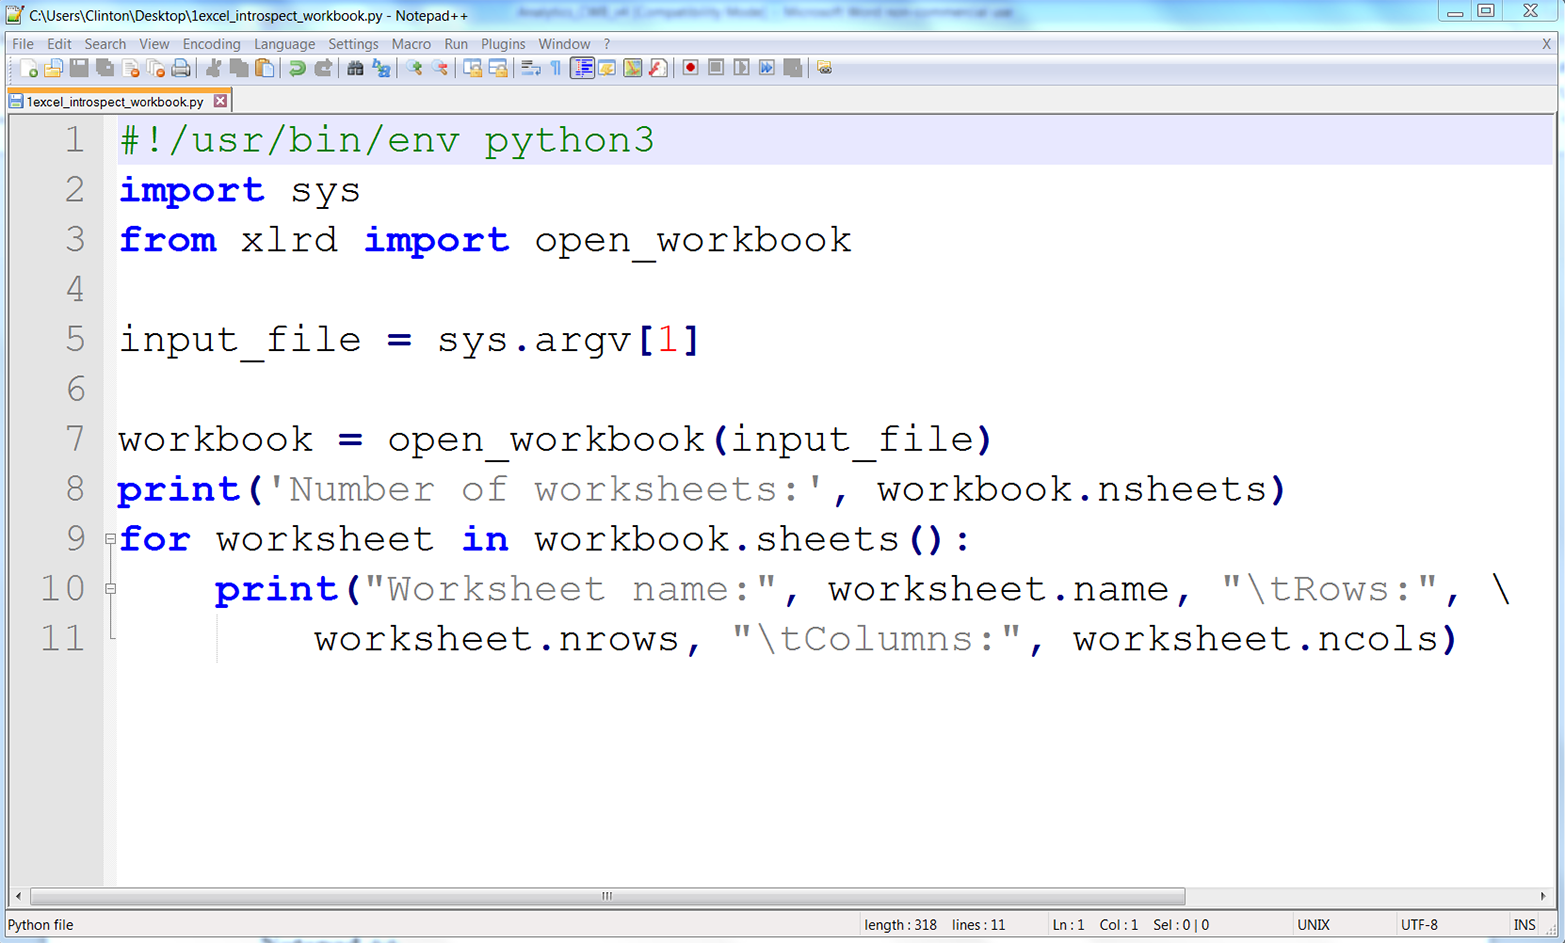
Figure 3-5. The 1excel_introspect_workbook.py Python script in Notepad++ (Windows)
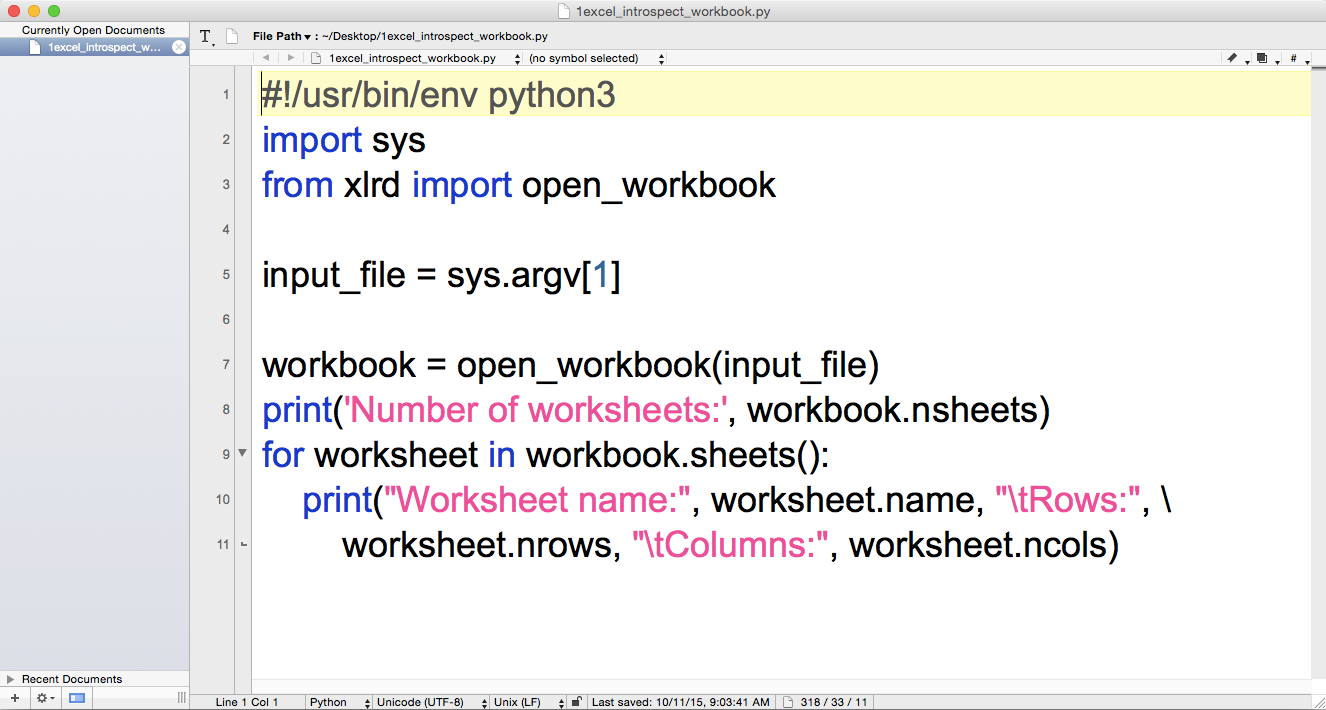
Figure 3-6. The 1excel_introspect_workbook.py Python script in TextWrangler (macOS)
Line 3 imports the xlrd module’s open_workbook function so we can use it to read and parse an Excel file.
Line 7 uses the open_workbook function to open the Excel input file into an object I’ve named workbook. The workbook object contains all of the available information about the workbook, so we can use it to retrieve individual worksheets from the workbook.
Line 8 prints the number of worksheets in the workbook.
Line 9 is a for loop that iterates over all of the worksheets in the workbook. The workbook object’s sheets method identifies all of the worksheets in the workbook.
Line 10 prints the name of each worksheet and the number of rows and columns in each worksheet to the screen. The print statement uses the worksheet object’s name attribute to identify the name of each worksheet. Similarly, it uses the nrows and ncols attributes to identify the number of rows and columns, respectively, in each worksheet.
If you created the file in the Spyder IDE, then to run the script:
-
Click on the Run drop-down menu in the upper-left corner of the IDE.
-
Select “Configure”
-
After the Run Settings window opens, select the “Command line options” check box and enter “sales_2013.xlsx” (see Figure 3-7).
-
Make sure the “Working directory” is where you saved the script and Excel file.
-
Click Run.
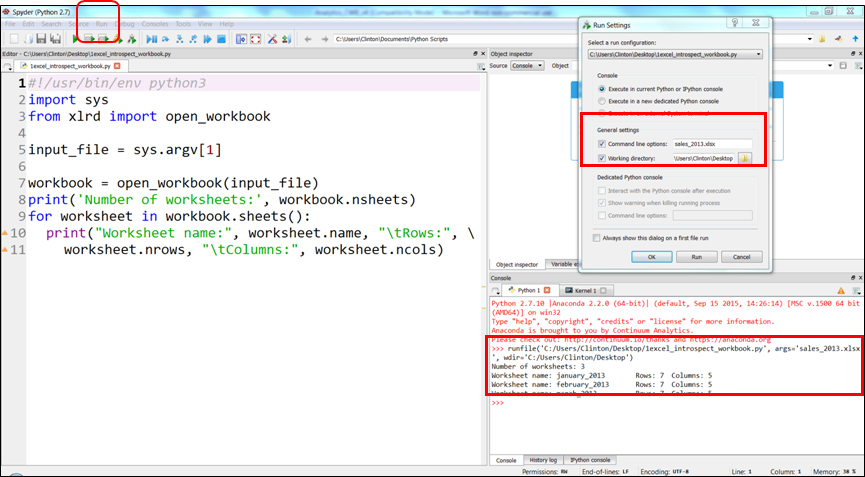
Figure 3-7. Specifying command line options in Anaconda Spyder
When you click the Run button (either the Run button in the Run Settings window or the green Run button in the upper-left corner of the IDE) you’ll see the output displayed in the Python console in the lower righthand pane of the IDE. Figure 3-7 displays the Run drop-down menu, the key settings in the Run Settings window, and the output inside red boxes.
Alternatively, you can run the script in a Command Prompt or Terminal window. To do so, use one of the following commands, depending on your operating system.
On Windows:
python 1excel_introspect_workbook.py sales_2013.xlsx
On macOS:
chmod +x 1excel_introspect_workbook.py
./1excel_introspect_workbook.py sales_2013.xlsx
You should see the output shown in Figure 3-8 (for Windows) or Figure 3-9 (for macOS) printed to the screen.
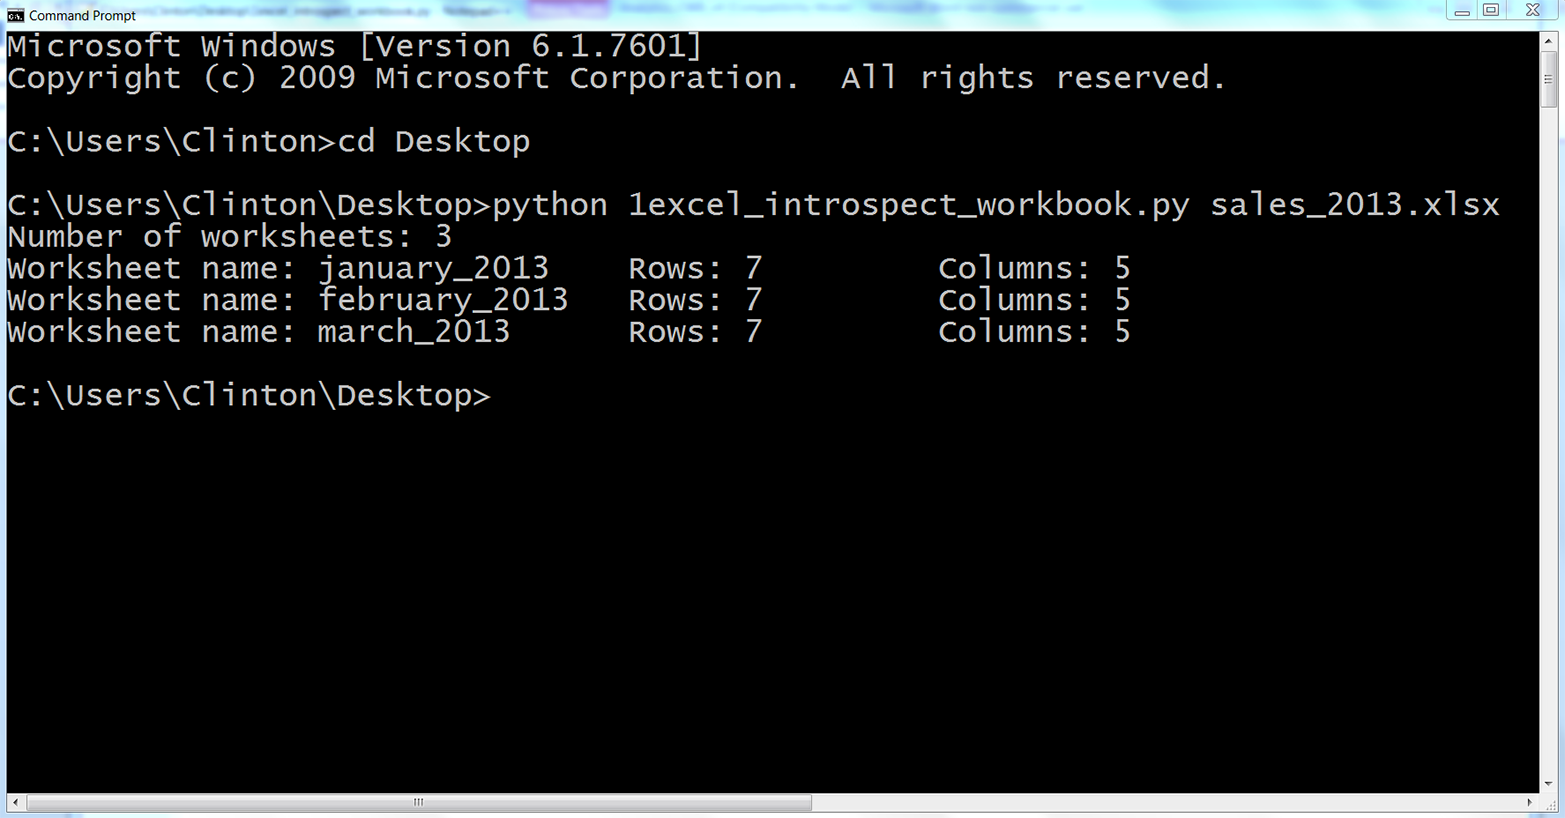
Figure 3-8. Output of Python script in a Command Prompt window (Windows)
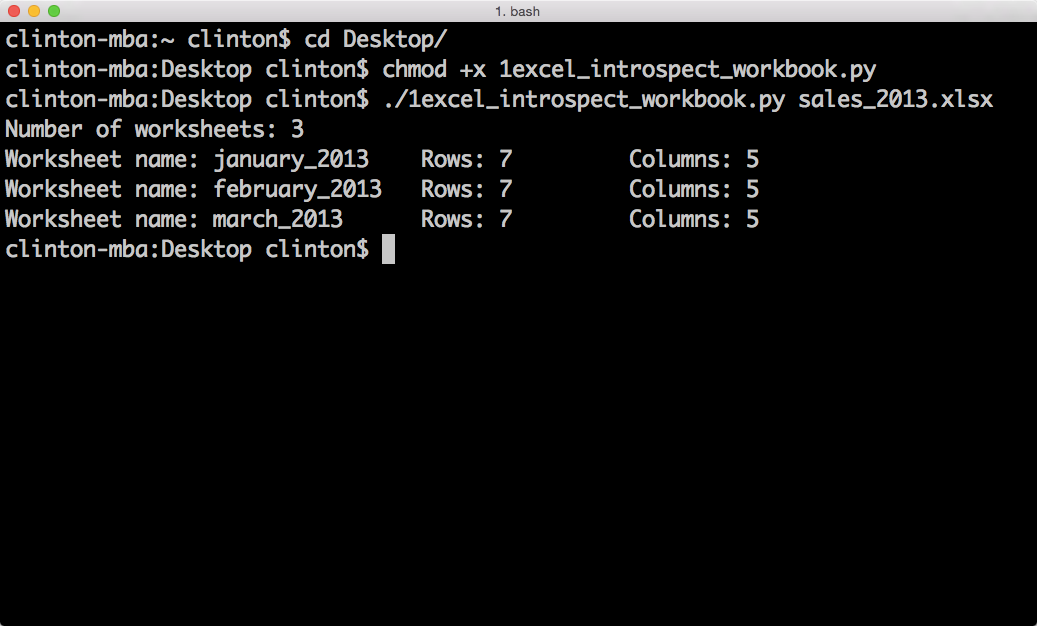
Figure 3-9. Output of Python script in a Terminal window (macOS)
The first line of output shows that the Excel input file, sales_2013.xlsx, contains three worksheets. The next three lines show that the three worksheets are named january_2013, february_2013, and march_2013. They also show that each of the worksheets contains seven rows, including the header row, and five columns.
Now that we know how to use Python to introspect an Excel workbook, let’s learn how to parse a single worksheet in different ways. We’ll then extend that knowledge to iterate over multiple worksheets and then to iterate over multiple workbooks.
Processing a Single Worksheet
While Excel workbooks can contain multiple worksheets, sometimes you only need data from one of the worksheets. In addition, once you know how to parse one worksheet, it is a simple extension to parse multiple worksheets.
Read and Write an Excel File
Base Python with xlrd and xlwt modules
To read and write an Excel file with base Python and the xlrd and xlwt modules, type the following code into a text editor and save the file as 2excel_parsing_and_write.py:
1#!/usr/bin/env python32importsys3fromxlrdimportopen_workbook4fromxlwtimportWorkbook5input_file=sys.argv[1]6output_file=sys.argv[2]7output_workbook=Workbook()8output_worksheet=output_workbook.add_sheet('jan_2013_output')9withopen_workbook(input_file)asworkbook:10worksheet=workbook.sheet_by_name('january_2013')11forrow_indexinrange(worksheet.nrows):12forcolumn_indexinrange(worksheet.ncols):13output_worksheet.write(row_index,column_index,\ 14worksheet.cell_value(row_index,column_index))15output_workbook.save(output_file)
Line 3 imports xlrd’s open_workbook function and line 4 imports xlwt’s Workbook object.
Line 7 instantiates an xlwt Workbook object so we can write the results to an output Excel workbook. Line 8 uses xlwt’s add_sheet function to add a worksheet named jan_2013_output inside the output workbook.
Line 9 uses xlrd’s open_workbook function to open the input workbook into a workbook object. Line 10 uses the workbook object’s sheet_by_name function to access the worksheet titled january_2013.
Lines 11 and 12 create for loops over the row and column index values, using the range function and the worksheet object’s nrows and ncols attributes, so we can iterate through each of the rows and columns in the worksheet.
Line 13 uses xlwt’s write function and row and column indexes to write every cell value to the worksheet in the output file.
Finally, line 15 saves and closes the output workbook.
To run the script, type the following on the command line and hit Enter:
python 2excel_parsing_and_write.py sales_2013.xlsx output_files\2output.xls
You can then open the output file, 2output.xls, to review the results.
You may have noticed that the dates in the Purchase Date column, column E, appear to be numbers instead of dates. Excel stores dates and times as floating-point numbers representing the number of days since 1900-Jan-0, plus a fractional portion of a 24-hour day. For example, the number 1 represents 1900-Jan-1, as one day has passed since 1900-Jan-0. Therefore, the numbers in this column represent dates, but they are not formatted as dates.
The xlrd package provides additional functions for formatting date-like values. The next example augments the previous example by demonstrating how to format date-like values so date-like values printed to the screen and written to the output file appear as they do in the input file.
Format dates
This example builds on the previous example by showing how to use xlrd to maintain date formats as they appear in input Excel files. For example, if a date in an Excel worksheet is 1/19/2000, then we usually want to write 1/19/2000 or another related date format to the output file. However, as the previous example showed, with our current code, we will end up with the number 36544.0 in the output file, as that is the number of days between 1/0/1900 and 1/19/2000.
To apply formatting to our date column, type the following code into a text editor and save the file as 3excel_parsing_and_write_keep_dates.py:
1#!/usr/bin/env python32importsys3fromdatetimeimportdate4fromxlrdimportopen_workbook,xldate_as_tuple5fromxlwtimportWorkbook6input_file=sys.argv[1]7output_file=sys.argv[2]8output_workbook=Workbook()9output_worksheet=output_workbook.add_sheet('jan_2013_output')10withopen_workbook(input_file)asworkbook:11worksheet=workbook.sheet_by_name('january_2013')12forrow_indexinrange(worksheet.nrows):13row_list_output=[]14forcol_indexinrange(worksheet.ncols):15ifworksheet.cell_type(row_index,col_index)==3:16date_cell=xldate_as_tuple(worksheet.cell_value\ 17(row_index,col_index),workbook.datemode)18date_cell=date(*date_cell[0:3]).strftime\ 19('%m/%d/%Y')20row_list_output.append(date_cell)21output_worksheet.write(row_index,col_index,date_cell)22else:23non_date_cell=worksheet.cell_value\ 24(row_index,col_index)25row_list_output.append(non_date_cell)26output_worksheet.write(row_index,col_index,\ 27non_date_cell)28output_workbook.save(output_file)
Line 3 imports the date function from the datetime module so we can cast values as dates and format the dates.
Line 4 imports two functions from the xlrd module. We used the first function to open an Excel workbook in the previous example, so I’ll focus on the second function. The xldate_as_tuple function enables us to convert Excel numbers that are presumed to represent dates, times, or date-times into tuples. Once we convert the numbers into tuples, we can extract specific date elements (e.g., year, month, and day) and format the elements into different date formats (e.g., 1/1/2010 or January 1, 2010).
Line 15 creates an if-else statement to test whether the cell type is the number three. If you review the xlrd module’s documentation, you’ll see that cell type three means the cell contains a date. Therefore, the if-else statement tests whether each cell it sees contains a date. If it does, then the code in the if block operates on the cell; if it doesn’t, then the code in the else block operates on the cell. Because the dates are in the last column, the if block handles the last column.
Line 18 uses the worksheet object’s cell_value function and row and column indexing to access the value in the cell. Alternatively, you could use the cell().value function; both versions give you the same results. This cell value is then the first argument in the xldate_as_tuple function, which converts the floating-point number into a tuple that represents the date.
The workbook.datemode argument is required so that the function can determine whether the date is 1900-based or 1904-based and therefore convert the number to the correct tuple (some versions of Excel for Mac calculate dates from January 1, 1904; for more information on this, read the Microsoft reference guide). The result of the xldate_as_tuple function is assigned to a tuple variable called date_cell. This line is so long that it’s split over two lines in the text, with a backslash as the last character of the first line (you’ll remember from Chapter 1 that the backslash is required so Python interprets the two lines as one line). However, in your script, all of the code can appear on one line without the backslash.
Line 18 uses tuple indexing to access the first three elements in the date_cell tuple (i.e., the year, month, and day elements) and pass them as arguments to the date function, which converts the values into a date object as discussed in Chapter 1. Next, the strftime function converts the date object into a string with the specified date format. The format, '%m/%d/%Y', specifies that a date like March 15, 2014 should appear as 03/15/2014. The formatted date string is reassigned to the variable called date_cell. Line 20 uses the list’s append function to append the value in date_cell into the output list called row_list_output.
To get a feel for the operations taking place in lines 16 and 18, after running the script as is, add a print statement (i.e., print(date_cell)) between the two date_cell = ... lines. Resave and rerun the script to see the result of the xldate_as_tuple function printed to the screen. Next, remove that print statement and move it beneath the second date_cell = ... line. Resave and rerun the script to see the result of the date.strftime functions printed to the screen. These print statements help you see how the functions in these two lines convert the number representing a date in Excel into a tuple and then into a text string formatted as a date.
The else block operates on all of the non-date cells. Line 23 uses the worksheet object’s cell_value function and row and column indexing to access the value in the cell and assigns it to a variable called non_date_cell. Line 25 uses the list’s append function to append the value in non_date_cell into row_list_output. Together, these two lines extract the values in the first four columns of each row as is and append them into row_list_output.
After all of the columns in the row have been processed and added to row_list_output, line 26 writes the values in row_list_output to the output file.
To run the script, type the following on the command line and hit Enter:
python 3excel_parsing_and_write_keep_dates.py sales_2013.xlsx\
output_files\3output.xls
You can then open the output file, 3output.xls, to review the results.
Pandas
Pandas has a set of commands for reading and writing Excel files as well. Here is a code example that will use pandas for Excel file parsing—save it as pandas_read_and_write_excel.py (this script reads an input Excel file, prints the contents to the screen, and writes the contents to an output Excel file):
#!/usr/bin/env python3importpandasaspdimportsysinput_file=sys.argv[1]output_file=sys.argv[2]data_frame=pd.read_excel(input_file,sheetname='january_2013')writer=pd.ExcelWriter(output_file)data_frame.to_excel(writer,sheet_name='jan_13_output',index=False)writer.save()
To run the script, type the following on the command line and hit Enter:
python pandas_parsing_and_write_keep_dates.py sales_2013.xlsx\
output_files\pandas_output.xls
You can then open the output file, pandas_output.xls, to review the results.
Now that you understand how to process a worksheet in an Excel workbook and retain date formatting, let’s turn to the issue of filtering for specific rows in a worksheet. As we did in Chapter 2, we’ll discuss how to filter rows by evaluating whether values in the row (a) meet specific conditions, (b) are in a set of interest, or (c) match specific regular expression patterns.
Filter for Specific Rows
Sometimes an Excel worksheet contains more rows than you need to retain. For example, you may only need a subset of rows that contain a specific word or number, or you may only need a subset of rows associated with a specific date. In these cases, you can use Python to filter out the rows you do not need and retain the rows that you do need.
You may already be familiar with how to filter rows manually in Excel, but the focus of this chapter is to broaden your capabilities so you can deal with Excel files that are too large to open and collections of Excel worksheets that would be too time consuming to deal with manually.
Value in Row Meets a Condition
Base Python
First, let’s see how to filter for specific rows with base Python. For this we want to select the subset of rows where the Sale Amount is greater than $1,400.00.
To filter for the subset of rows that meet this condition, type the following code into a text editor and save the file as 4excel_value_meets_condition.py:
1#!/usr/bin/env python32importsys3fromdatetimeimportdate4fromxlrdimportopen_workbook,xldate_as_tuple5fromxlwtimportWorkbook6input_file=sys.argv[1]7output_file=sys.argv[2]8output_workbook=Workbook()9output_worksheet=output_workbook.add_sheet('jan_2013_output')10sale_amount_column_index=311withopen_workbook(input_file)asworkbook:12worksheet=workbook.sheet_by_name('january_2013')13data=[]14header=worksheet.row_values(0)15data.append(header)16forrow_indexinrange(1,worksheet.nrows):17row_list=[]18sale=worksheet.cell_value\ 19(row_index,sale_amount_column_index)20sale_amount=float(str(sale).strip('$').replace(',',''))21ifsale_amount>1400.0:22forcolumn_indexinrange(worksheet.ncols):23cell_value=worksheet.cell_value\ 24(row_index,column_index)25cell_type=worksheet.cell_type\ 26(row_index,column_index)27ifcell_type==3:28date_cell=xldate_as_tuple\ 29(cell_value,workbook.datemode)30date_cell=date(*date_cell[0:3])\ 31.strftime('%m/%d/%Y')32row_list.append(date_cell)33else:34row_list.append(cell_value)35ifrow_list:36data.append(row_list)37forlist_index,output_listinenumerate(data):38forelement_index,elementinenumerate(output_list):39output_worksheet.write(list_index,element_index,element)40output_workbook.save(output_file)
Line 13 creates an empty list named data. We’ll fill it with all of the rows from the input file that we want to write to the output file.
Line 14 extracts the values in the header row. Because we want to retain the header row and it doesn’t make sense to test this row against the filter condition, line 15 appends the header row into data as is.
Line 20 creates a variable named sale_amount that holds the sale amount listed in the row. The cell_value function uses the number in sale_amount_column_index, defined in line 10, to locate the Sale Amount column. Because we want to retain the rows where the sale amount in the row is greater than $1,400.00, we’ll use this variable to test this condition.
Line 21 creates an if statement that ensures that we only process the remaining rows where the value in the Sale Amount column is greater than 1400.0. For these rows, we extract the value in each cell into a variable named cell_value and the type of cell into a variable named cell_type. Next, we need to test whether each value in the row is a date. If it is, then we’ll format the value as a date. To create a row of properly formatted values, we create an empty list named row_list in line 17 and then append date and non-date values from the row into row_list in lines 32 and 34.
We create empty row_lists for every data row in the input file. However, we only fill some of these row_lists with values (i.e., for the rows where the value in the Sale Amount column is greater than 1400.0). So, for each row in the input file, line 35 tests whether row_list is empty and only appends row_list into data if row_list is not empty.
Finally, in lines 37 and 38, we iterate through the lists in data and the values in each list and write them to the output file. The reason we append the rows we want to retain into a new list, data, is so that they receive new, consecutive row index values. That way, when we write the rows to the output file, they appear as a contiguous block of rows without any gaps between the rows. If instead we write the rows to the output file as we process them in the main for loop, then xlwt’s write function uses the original row index values from the input file and writes the rows in the output file with gaps between the rows. We’ll use the same method later, in the section on selecting specific columns, to ensure we write the columns in the output file as a contiguous block of columns without any gaps between the columns.
To run the script, type the following on the command line and hit Enter:
python 4excel_value_meets_condition.py sales_2013.xlsx output_files\4output.xls
You can then open the output file, 4output.xls, to review the results.
Pandas
You can filter for rows that meet a condition with pandas by specifying the name of the column you want to evaluate and the specific condition inside square brackets after the name of the DataFrame. For example, the condition shown in the following script specifies that we want all of the rows where the value in the Sale Amount column is greater than 1400.00.
If you need to apply multiple conditions, then you place the conditions inside parentheses and combine them with ampersands (&) or pipes (|), depending on the conditional logic you want to employ. The two commented-out lines show how to filter for rows based on two conditions. The first line uses an ampersand, indicating that both conditions must be true. The second line uses a pipe, indicating that only one of the conditions must be true.
To filter for rows based on a condition with pandas, type the following code into a text editor and save the file as pandas_value_meets_condition.py:
#!/usr/bin/env python3importpandasaspdimportsysinput_file=sys.argv[1]output_file=sys.argv[2]data_frame=pd.read_excel(input_file,'january_2013',index_col=None)data_frame_value_meets_condition=\data_frame[data_frame['Sale Amount'].replace('$','')\.replace(',','').astype(float)>1400.0]writer=pd.ExcelWriter(output_file)data_frame_value_meets_condition.to_excel(writer,sheet_name='jan_13_output',\index=False)writer.save()
To run the script, type the following on the command line and hit Enter:
python pandas_value_meets_condition.py sales_2013.xlsx\
output_files\pandas_output.xls
You can then open the output file, pandas_output.xls, to review the results.
Value in Row Is in a Set of Interest
Base Python
To filter for the rows where the purchase date is in a specific set (e.g., the set of dates 01/24/2013 and 01/31/2013) with base Python, type the following code into a text editor and save the file as 5excel_value_in_set.py:
1#!/usr/bin/env python32importsys3fromdatetimeimportdate4fromxlrdimportopen_workbook,xldate_as_tuple5fromxlwtimportWorkbook6input_file=sys.argv[1]7output_file=sys.argv[2]8output_workbook=Workbook()9output_worksheet=output_workbook.add_sheet('jan_2013_output')10important_dates=['01/24/2013','01/31/2013']11purchase_date_column_index=412withopen_workbook(input_file)asworkbook:13worksheet=workbook.sheet_by_name('january_2013')14data=[]15header=worksheet.row_values(0)16data.append(header)17forrow_indexinrange(1,worksheet.nrows):18purchase_datetime=xldate_as_tuple(worksheet.cell_value\ 19(row_index,purchase_date_column_index)\ 20,workbook.datemode)21purchase_date=date(*purchase_datetime[0:3]).strftime('%m/%d/%Y')22row_list=[]23ifpurchase_dateinimportant_dates:24forcolumn_indexinrange(worksheet.ncols):25cell_value=worksheet.cell_value\ 26(row_index,column_index)27cell_type=worksheet.cell_type(row_index,column_index)28ifcell_type==3:29date_cell=xldate_as_tuple\ 30(cell_value,workbook.datemode)31date_cell=date(*date_cell[0:3])\ 32.strftime('%m/%d/%Y')33row_list.append(date_cell)34else:35row_list.append(cell_value)36ifrow_list:37data.append(row_list)38forlist_index,output_listinenumerate(data):39forelement_index,elementinenumerate(output_list):40output_worksheet.write(list_index,element_index,element)41output_workbook.save(output_file)
This script is very similar to the script that filters for rows based on a condition. The differences appear in lines 10, 21, and 23. Line 10 creates a list named important_dates that contains the dates we’re interested in. Line 21 creates a variable named purchase_date that’s equal to the value in the Purchase Date column formatted to match the formatting of the dates in important_dates. Line 23 tests whether the date in the row is one of the dates in important_dates. If it is, then we process the row and write it to the output file.
To run the script, type the following on the command line and hit Enter:
python 5excel_value_in_set.py sales_2013.xlsx output_files\5output.xls
You can then open the output file, 5output.xls, to review the results.
Pandas
In this example, we want to filter for rows where the purchase date is 01/24/2013 or 01/31/2013. Pandas provides the isin function, which you can use to test whether a specific value is in a list of values.
To filter for rows based on set membership with pandas, type the following code into a text editor and save the file as pandas_value_in_set.py:
#!/usr/bin/env python3importpandasaspdimportsysinput_file=sys.argv[1]output_file=sys.argv[2]data_frame=pd.read_excel(input_file,'january_2013',index_col=None)important_dates=['01/24/2013','01/31/2013']data_frame_value_in_set=data_frame[data_frame['PurchaseDate']\.isin(important_dates)]writer=pd.ExcelWriter(output_file)data_frame_value_in_set.to_excel(writer,sheet_name='jan_13_output',index=False)writer.save()
Run the script at the command line:
pythonpandas_value_in_set.pysales_2013.xlsxoutput_files\pandas_output.xls
You can then open the output file, pandas_output.xls, to review the results.
Value in Row Matches a Specific Pattern
Base Python
To filter for rows where the customer’s name contains a specific pattern (e.g., starts with the capital letter J) in base Python, type the following code into a text editor and save the file as 6excel_value_matches_pattern.py:
1#!/usr/bin/env python32importre3importsys4fromdatetimeimportdate5fromxlrdimportopen_workbook,xldate_as_tuple6fromxlwtimportWorkbook7input_file=sys.argv[1]8output_file=sys.argv[2]9output_workbook=Workbook()10output_worksheet=output_workbook.add_sheet('jan_2013_output')11pattern=re.compile(r'(?P<my_pattern>^J.*)')12customer_name_column_index=113withopen_workbook(input_file)asworkbook:14worksheet=workbook.sheet_by_name('january_2013')15data=[]16header=worksheet.row_values(0)17data.append(header)18forrow_indexinrange(1,worksheet.nrows):19row_list=[]20ifpattern.search(worksheet.cell_value\ 21(row_index,customer_name_column_index)):22forcolumn_indexinrange(worksheet.ncols):23cell_value=worksheet.cell_value\ 24(row_index,column_index)25cell_type=worksheet.cell_type(row_index,column_index)26ifcell_type==3:27date_cell=xldate_as_tuple\ 28(cell_value,workbook.datemode)29date_cell=date(*date_cell[0:3])\ 30.strftime('%m/%d/%Y')31row_list.append(date_cell)32else:33row_list.append(cell_value)34ifrow_list:35data.append(row_list)36forlist_index,output_listinenumerate(data):37forelement_index,elementinenumerate(output_list):38output_worksheet.write(list_index,element_index,element)39output_workbook.save(output_file)
Line 2 imports the re module so that we have access to the module’s functions and methods.
Line 11 uses the re module’s compile function to create a regular expression named pattern. If you read , then the contents of this function will look familiar. The r means the pattern between the single quotes is a raw string. The ?P<my_pattern> metacharacter captures the matched substrings in a group called <my_pattern> so that, if necessary, they can be printed to the screen or written to a file. The actual pattern is '^J.*'. The caret is a special character that means “at the start of the string.” So, the string needs to start with the capital letter J. The period (.) matches any character except a newline, so any character except a newline can come after the J. Finally, the asterisk (*) means repeat the preceding character zero or more times. Together, the .* combination means that any characters except a newline can show up any number of times after the J.
Line 20 uses the re module’s search method to look for the pattern in the Customer Name column and to test whether it finds a match. If it does find a match, then it appends each of the values in the row into row_list. Line 31 appends the date values into row_list, and line 33 appends the non-date values into row_list. Line 35 appends each list of values in row_list into data if the list is not empty.
Finally, the two for loops in lines 36 and 37 iterate through the lists in data to write the rows to the output file.
To run the script, type the following on the command line and hit Enter:
python 6excel_value_matches_pattern.py sales_2013.xlsx output_files\6output.xls
You can then open the output file, 6output.xls, to review the results.
Pandas
In this example, we want to filter for rows where the customer’s name starts with the capital letter J. Pandas provides several string and regular expression functions, including startswith, endswith, match, and search (among others), that you can use to identify substrings and patterns in text.
To filter for rows where the customer’s name starts with the capital letter J with pandas, type the following code into a text editor and save the file as pandas_value_matches_pattern.py:
#!/usr/bin/env python3importpandasaspdimportsysinput_file=sys.argv[1]output_file=sys.argv[2]data_frame=pd.read_excel(input_file,'january_2013',index_col=None)data_frame_value_matches_pattern=data_frame[data_frame['Customer Name']\.str.startswith("J")]writer=pd.ExcelWriter(output_file)data_frame_value_matches_pattern.to_excel(writer,sheet_name='jan_13_output',\index=False)writer.save()
To run the script, type the following on the command line and hit Enter:
python pandas_value_matches_pattern.py sales_2013.xlsx\
output_files\pandas_output.xls
You can then open the output file, pandas_output.xls, to review the results.
Select Specific Columns
Sometimes a worksheet contains more columns than you need to retain. In these cases, you can use Python to select the columns you want to keep.
There are two common ways to select specific columns in an Excel file. The following sections demonstrate these two methods of selecting columns:
-
Using column index values
-
Using column headings
Column Index Values
Base Python
One way to select specific columns from a worksheet is to use the index values of the columns you want to retain. This method is effective when it is easy to identify the index values of the columns you care about or, when you’re processing multiple input files, when the positions of the columns are consistent (i.e., don’t change) across all of the input files.
For example, let’s say we only want to retain the Customer Name and Purchase Date columns. To select these two columns with base Python, type the following code into a text editor and save the file as 7excel_column_by_index.py:
1#!/usr/bin/env python32importsys3fromdatetimeimportdate4fromxlrdimportopen_workbook,xldate_as_tuple5fromxlwtimportWorkbook6input_file=sys.argv[1]7output_file=sys.argv[2]8output_workbook=Workbook()9output_worksheet=output_workbook.add_sheet('jan_2013_output')10my_columns=[1,4]11withopen_workbook(input_file)asworkbook:12worksheet=workbook.sheet_by_name('january_2013')13data=[]14forrow_indexinrange(worksheet.nrows):15row_list=[]16forcolumn_indexinmy_columns:17cell_value=worksheet.cell_value(row_index,column_index)18cell_type=worksheet.cell_type(row_index,column_index)19ifcell_type==3:20date_cell=xldate_as_tuple\ 21(cell_value,workbook.datemode)22date_cell=date(*date_cell[0:3]).strftime('%m/%d/%Y')23row_list.append(date_cell)24else:25row_list.append(cell_value)26data.append(row_list)27forlist_index,output_listinenumerate(data):28forelement_index,elementinenumerate(output_list):29output_worksheet.write(list_index,element_index,element)30output_workbook.save(output_file)
Line 10 creates a list variable named my_columns that contains the integers one and four. These two numbers represent the index values of the Customer Name and Purchase Date columns.
Line 16 creates a for loop for iterating through the two column index values in my_columns. Each time through the loop we extract the value and type of the cell in that column, determine whether the value in the cell is a date, process the cell value accordingly, and then append the value into row_list. Line 26 appends each list of values in row_list into data.
Finally, the two for loops in lines 27 and 28 iterate through the lists in data to write the values in them to the output file.
To run the script, type the following on the command line and hit Enter:
python 7column_column_by_index.py sales_2013.xlsx output_files\7output.xls
You can then open the output file, 7output.xls, to review the results.
Pandas
There are a couple of ways to select specific columns with pandas. One way is to specify the DataFrame and then, inside square brackets, list the index values or names (as strings) of the columns you want to retain.
Another way, shown next, is to specify the DataFrame in combination with the iloc function. The iloc function is useful because it enables you to select specific rows and columns simultaneously. So, if you use the iloc function to select columns, then you need to add a colon and a comma before the list of column index values to indicate that you want to retain all of the rows for these columns. Otherwise, the iloc function filters for the rows with these index values.
To select columns based on their index values with pandas, type the following code into a text editor and save the file as pandas_column_by_index.py:
#!/usr/bin/env python3importpandasaspdimportsysinput_file=sys.argv[1]output_file=sys.argv[2]data_frame=pd.read_excel(input_file,'january_2013',index_col=None)data_frame_column_by_index=data_frame.iloc[:,[1,4]]writer=pd.ExcelWriter(output_file)data_frame_column_by_index.to_excel(writer,sheet_name='jan_13_output',\index=False)writer.save()
To run the script, type the following on the command line and hit Enter:
python pandas_column_by_index.py sales_2013.xlsx output_files\pandas_output.xls
You can then open the output file, pandas_output.xls, to review the results.
Column Headings
A second way to select a subset of columns from a worksheet is to use the column headings. This method is effective when it is easy to identify the names of the columns you want to retain. It’s also helpful when you’re processing multiple input files and the names of the columns are consistent across the input files but their column positions are not.
Base Python
To select the Customer ID and Purchase Date columns with base Python, type the following code into a text editor and save the file as 8excel_column_by_name.py:
1#!/usr/bin/env python32importsys3fromdatetimeimportdate4fromxlrdimportopen_workbook,xldate_as_tuple5fromxlwtimportWorkbook6input_file=sys.argv[1]7output_file=sys.argv[2]8output_workbook=Workbook()9output_worksheet=output_workbook.add_sheet('jan_2013_output')10my_columns=['Customer ID','Purchase Date']11withopen_workbook(input_file)asworkbook:12worksheet=workbook.sheet_by_name('january_2013')13data=[my_columns]14header_list=worksheet.row_values(0)15header_index_list=[]16forheader_indexinrange(len(header_list)):17ifheader_list[header_index]inmy_columns:18header_index_list.append(header_index)19forrow_indexinrange(1,worksheet.nrows):20row_list=[]21forcolumn_indexinheader_index_list:22cell_value=worksheet.cell_value(row_index,column_index)23cell_type=worksheet.cell_type(row_index,column_index)24ifcell_type==3:25date_cell=xldate_as_tuple\ 26(cell_value,workbook.datemode)27date_cell=date(*date_cell[0:3]).strftime('%m/%d/%Y')28row_list.append(date_cell)29else:30row_list.append(cell_value)31data.append(row_list)32forlist_index,output_listinenumerate(data):33forelement_index,elementinenumerate(output_list):34output_worksheet.write(list_index,element_index,element)35output_workbook.save(output_file)
Line 10 creates a list variable named my_columns that contains the names of the two columns we want to retain. Because these are the column headings we want to write to the output file, we append them directly into the output list named data in line 13.
Line 16 creates a for loop to iterate over the index values of the column headings in header_list. Line 17 uses list indexing to test whether each column heading is in my_columns. If it is, then line 18 appends the column heading’s index value into header_index_list. We’ll use these index values in line 25 to only process the columns we want to write to the output file.
Line 21 creates a for loop to iterate over the column index values in header_index_list. By using header_index_list, we only process the columns listed in my_columns.
To run the script, type the following on the command line and hit Enter:
python 8excel_column_by_name.py sales_2013.xlsx output_files\8output.xls
You can then open the output file, 8output.xls, to review the results.
Pandas
To select specific columns based on column headings with pandas, you can list the names of the columns, as strings, inside square brackets after the name of the DataFrame. Alternatively, you can use the loc function. Again, if you use the loc function, then you need to add a colon and a comma before the list of column headings to indicate that you want to retain all of the rows for these columns.
To select columns based on column headings with pandas, type the following code into a text editor and save the file as pandas_column_by_name.py:
#!/usr/bin/env python3importpandasaspdimportsysinput_file=sys.argv[1]output_file=sys.argv[2]data_frame=pd.read_excel(input_file,'january_2013',index_col=None)data_frame_column_by_name=data_frame.loc[:,['Customer ID','Purchase Date']]writer=pd.ExcelWriter(output_file)data_frame_column_by_name.to_excel(writer,sheet_name='jan_13_output',\index=False)writer.save()
To run the script, type the following on the command line and hit Enter:
python pandas_column_by_name.py sales_2013.xlsx output_files\pandas_output.xls
You can then open the output file, pandas_output.xls, to review the results.
Reading All Worksheets in a Workbook
Up to this point in this chapter, I’ve demonstrated how to process a single worksheet. In some cases, you may only need to process a single worksheet. In these cases, the examples thus far should give you an idea of how to use Python to process the worksheet automatically.
However, in many cases you will need to process lots of worksheets, and there may be so many that it would be inefficient or impossible to handle them manually. It is in these situations that Python is even more exciting because it enables you to automate and scale your data processing above and beyond what you could handle manually. This section presents two examples to demonstrate how to filter for specific rows and columns from all of the worksheets in a workbook.
I only present one example for filtering rows and one example for selecting columns because I want to keep the length of this chapter reasonable (the sections on processing a specific subset of worksheets in a workbook and processing multiple workbooks are still to come). In addition, with your understanding of the other ways to select specific rows and columns from the earlier examples, you should have a good idea of how to incorporate these other filtering operations into these examples.
Filter for Specific Rows Across All Worksheets
Base Python
To filter for all of the rows in all of the worksheets where the sale amount is greater than $2,000.00 with base Python, type the following code into a text editor and save the file as 9excel_value_meets_condition_all_worksheets.py:
1#!/usr/bin/env python32importsys3fromdatetimeimportdate4fromxlrdimportopen_workbook,xldate_as_tuple5fromxlwtimportWorkbook6input_file=sys.argv[1]7output_file=sys.argv[2]8output_workbook=Workbook()9output_worksheet=output_workbook.add_sheet('filtered_rows_all_worksheets')10sales_column_index=311threshold=2000.012first_worksheet=True13withopen_workbook(input_file)asworkbook:14data=[]15forworksheetinworkbook.sheets():16iffirst_worksheet:17header_row=worksheet.row_values(0)18data.append(header_row)19first_worksheet=False20forrow_indexinrange(1,worksheet.nrows):21row_list=[]22sale_amount=worksheet.cell_value\ 23(row_index,sales_column_index)24sale_amount=float(str(sale_amount).replace('$','')\ 25.replace(',',''))26ifsale_amount>threshold:27forcolumn_indexinrange(worksheet.ncols):28cell_value=worksheet.cell_value\ 29(row_index,column_index)30cell_type=worksheet.cell_type\ 31(row_index,column_index)32ifcell_type==3:33date_cell=xldate_as_tuple\ 34(cell_value,workbook.datemode)35date_cell=date(*date_cell[0:3])\ 36.strftime('%m/%d/%Y')37row_list.append(date_cell)38else:39row_list.append(cell_value)40ifrow_list:41data.append(row_list)42forlist_index,output_listinenumerate(data):43forelement_index,elementinenumerate(output_list):44output_worksheet.write(list_index,element_index,element)45output_workbook.save(output_file)
Line 10 creates a variable named sales_column_index to hold the index value of the Sale Amount column. Similarly, line 11 creates a variable named threshold to hold the sale amount we care about. We’ll compare each of the values in the Sale Amount column to this threshold value to determine which rows to write to the output file.
Line 15 creates the for loop we use to iterate through all of the worksheets in the workbook. It uses the workbook object’s sheets attribute to list all of the worksheets in the workbook.
Line 16 is True for the first worksheet, so for the first worksheet, we extract the header row, append it into data, and then set first_worksheet equal to False. The code continues and processes the remaining data rows where the sale amount in the row is greater than the threshold value.
For all of the subsequent worksheets, first_worksheet is False, so the script moves ahead to line 20 to process the data rows in each worksheet. You know that it processes the data rows, and not the header row, because the range function starts at one instead of zero.
To run the script, type the following on the command line and hit Enter:
python 9excel_value_meets_condition_all_worksheets.py sales_2013.xlsx\
output_files\9output.xls
You can then open the output file, 9output.xls, to review the results.
Pandas
Pandas enables you to read all of the worksheets in a workbook at once by specifying sheetname=None in the read_excel function. Pandas reads the worksheets into a dictionary of DataFrames where the key is the worksheet’s name and the value is the worksheet’s data in a DataFrame. So you can evaluate all of the data in the workbook by iterating through the dictionary’s keys and values. When you filter for specific rows in each DataFrame, the result is a new, filtered DataFrame, so you can create a list of these filtered DataFrames and then concatenate them together into a final DataFrame.
In this example, we want to filter for all of the rows in all of the worksheets where the sale amount is greater than $2,000.00. To filter for these rows with pandas, type the following code into a text editor and save the file as pandas_value_meets_condition_all_worksheets.py:
#!/usr/bin/env python3importpandasaspdimportsysinput_file=sys.argv[1]output_file=sys.argv[2]data_frame=pd.read_excel(input_file,sheetname=None,index_col=None)row_output=[]forworksheet_name,dataindata_frame.items():row_output.append(data[data['Sale Amount'].replace('$','')\.replace(',','').astype(float)>2000.0])filtered_rows=pd.concat(row_output,axis=0,ignore_index=True)writer=pd.ExcelWriter(output_file)filtered_rows.to_excel(writer,sheet_name='sale_amount_gt2000',index=False)writer.save()
To run the script, type the following on the command line and hit Enter:
python pandas_value_meets_condition_all_worksheets.py sales_2013.xlsx\
output_files\pandas_output.xls
You can then open the output file, pandas_output.xls, to review the results.
Select Specific Columns Across All Worksheets
Sometimes an Excel workbook contains multiple worksheets and each of the worksheets contains more columns than you need. In these cases, you can use Python to read all of the worksheets, filter out the columns you do not need, and retain the columns that you do need.
As we learned earlier, there are at least two ways to select a subset of columns from a worksheet—by index value and by column heading. The following example demonstrates how to select specific columns from all of the worksheets in a workbook using the column headings.
Base Python
To select the Customer Name and Sale Amount columns across all of the worksheets with base Python, type the following code into a text editor and save the file as 10excel_column_by_name_all_worksheets.py:
1#!/usr/bin/env python32importsys3fromdatetimeimportdate4fromxlrdimportopen_workbook,xldate_as_tuple5fromxlwtimportWorkbook6input_file=sys.argv[1]7output_file=sys.argv[2]8output_workbook=Workbook()9output_worksheet=output_workbook.add_sheet('selected_columns_all_worksheets')10my_columns=['Customer Name','Sale Amount']11first_worksheet=True12withopen_workbook(input_file)asworkbook:13data=[my_columns]14index_of_cols_to_keep=[]15forworksheetinworkbook.sheets():16iffirst_worksheet:17header=worksheet.row_values(0)18forcolumn_indexinrange(len(header)):19ifheader[column_index]inmy_columns:20index_of_cols_to_keep.append(column_index)21first_worksheet=False22forrow_indexinrange(1,worksheet.nrows):23row_list=[]24forcolumn_indexinindex_of_cols_to_keep:25cell_value=worksheet.cell_value\ 26(row_index,column_index)27cell_type=worksheet.cell_type(row_index,column_index)28ifcell_type==3:29date_cell=xldate_as_tuple\ 30(cell_value,workbook.datemode)31date_cell=date(*date_cell[0:3])\ 32.strftime('%m/%d/%Y')33row_list.append(date_cell)34else:35row_list.append(cell_value)36data.append(row_list)37forlist_index,output_listinenumerate(data):38forelement_index,elementinenumerate(output_list):39output_worksheet.write(list_index,element_index,element)40output_workbook.save(output_file)
Line 10 creates a list variable named my_columns that contains the names of the two columns we want to retain.
Line 13 places my_columns as the first list of values in data, as they are the column headings of the columns we intend to write to the output file. Line 14 creates an empty list named index_of_cols_to_keep that will contain the index values of the Customer Name and Sale Amount columns.
Line 16 tests if we’re processing the first worksheet. If so, then we identify the index values of the Customer Name and Sale Amount columns and append them into index_of_cols_to_keep. Then we set first_worksheet equal to False. The code continues and processes the remaining data rows, using line 24 to only process the values in the Customer Name and Sale Amount columns.
For all of the subsequent worksheets, first_worksheet is False, so the script moves ahead to line 22 to process the data rows in each worksheet. For these worksheets, we only process the columns with the index values listed in index_of_cols_to_keep. If the value in one of these columns is a date, we format it as a date. After assembling a row of values we want to write to the output file, we append the list of values into data in line 36.
To run the script, type the following on the command line and hit Enter:
python 10excel_column_by_name_all_worksheets.py sales_2013.xlsx\
output_files\10output.xls
You can then open the output file, 10output.xls, to review the results.
Pandas
Once again, we’ll read all of the worksheets into a dictionary with the pandas read_excel function. Then we’ll select specific columns from each worksheet with the loc function, create a list of filtered DataFrames, and concatenate the DataFrames together into a final DataFrame.
In this example, we want to select the Customer Name and Sale Amount columns across all of the worksheets. To select these columns with pandas, type the following code into a text editor and save the file as pandas_column_by_name_all_worksheets.py:
#!/usr/bin/env python3importpandasaspdimportsysinput_file=sys.argv[1]output_file=sys.argv[2]data_frame=pd.read_excel(input_file,sheetname=None,index_col=None)column_output=[]forworksheet_name,dataindata_frame.items():column_output.append(data.loc[:,['Customer Name','Sale Amount']])selected_columns=pd.concat(column_output,axis=0,ignore_index=True)writer=pd.ExcelWriter(output_file)selected_columns.to_excel(writer,sheet_name='selected_columns_all_worksheets',\index=False)writer.save()
To run the script, type the following on the command line and hit Enter:
python pandas_column_by_name_all_worksheets.py sales_2013.xlsx\
output_files\pandas_output.xls
You can then open the output file, pandas_output.xls, to review the results.
Reading a Set of Worksheets in an Excel Workbook
Earlier sections in this chapter demonstrated how to filter for specific rows and columns from a single worksheet. The previous section demonstrated how to filter for specific rows and columns from all of the worksheets in a workbook.
However, in some situations, you only need to process a subset of worksheets in a workbook. For example, your workbook may contain dozens of worksheets and you only need to process 20 of them. In these situations, you can use the workbook’s sheet_by_index or sheet_by_name functions to process a subset of worksheets.
This section presents an example to demonstrate how to filter for specific rows from a subset of worksheets in a workbook. I only present one example because by this point you will be able to incorporate the other filtering and selection operations shown in previous examples into this example.
Filter for Specific Rows Across a Set of Worksheets
Base Python
In this case, we want to filter for rows from the first and second worksheets where the sale amount is greater than $1,900.00. To select this subset of rows from the first and second worksheets with base Python, type the following code into a text editor and save the file as 11excel_value_meets_condition_set_of_worksheets.py:
1#!/usr/bin/env python32importsys3fromdatetimeimportdate4fromxlrdimportopen_workbook,xldate_as_tuple5fromxlwtimportWorkbook6input_file=sys.argv[1]7output_file=sys.argv[2]8output_workbook=Workbook()9output_worksheet=output_workbook.add_sheet('set_of_worksheets')10my_sheets=[0,1]11threshold=1900.012sales_column_index=313first_worksheet=True14withopen_workbook(input_file)asworkbook:15data=[]16forsheet_indexinrange(workbook.nsheets):17ifsheet_indexinmy_sheets:18worksheet=workbook.sheet_by_index(sheet_index)19iffirst_worksheet:20header_row=worksheet.row_values(0)21data.append(header_row)22first_worksheet=False23forrow_indexinrange(1,worksheet.nrows):24row_list=[]25sale_amount=worksheet.cell_value\ 26(row_index,sales_column_index)27ifsale_amount>threshold:28forcolumn_indexinrange(worksheet.ncols):29cell_value=worksheet.cell_value\ 30(row_index,column_index)31cell_type=worksheet.cell_type\ 32(row_index,column_index)33ifcell_type==3:34date_cell=xldate_as_tuple\ 35(cell_value,workbook.datemode)36date_cell=date(*date_cell[0:3])\ 37.strftime('%m/%d/%Y')38row_list.append(date_cell)39else:40row_list.append(cell_value)41ifrow_list:42data.append(row_list)43forlist_index,output_listinenumerate(data):44forelement_index,elementinenumerate(output_list):45output_worksheet.write(list_index,element_index,element)46output_workbook.save(output_file)
Line 10 creates a list variable named my_sheets that contains two integers representing the index values of the worksheets we want to process.
Line 16 creates index values for all of the worksheets in the workbook and applies a for loop over the index values.
Line 17 tests whether the index value being considered in the for loop is one of the index values in my_sheets. This test ensures that we only process the worksheets that we want to process.
Because we’re iterating through worksheet index values, we need to use the workbook’s sheet_by_index function in conjunction with an index value in line 18 to access the current worksheet.
For the first worksheet we want to process, line 19 is True, so we append the header row into data and then set first_worksheet equal to False. Then we process the remaining data rows in a similar fashion, as we did in earlier examples. For the second and subsequent worksheets we want to process, the script moves ahead to line 23 to process the data rows in the worksheet.
To run the script, type the following on the command line and hit Enter:
python 11excel_value_meets_condition_set_of_worksheets.py sales_2013.xlsx\
output_files\11output.xls
You can then open the output file, 11output.xls, to review the results.
Pandas
Pandas makes it easy to select a subset of worksheets in a workbook. You simply specify the index numbers or names of the worksheets as a list in the read_excel function. In this example, we create a list of index numbers named my_sheets and then set sheetname equal to my_sheets inside the read_excel function.
To select a subset of worksheets with pandas, type the following code into a text editor and save the file as pandas_value_meets_condition_set_of_worksheets.py:
#!/usr/bin/env python3importpandasaspdimportsysinput_file=sys.argv[1]output_file=sys.argv[2]my_sheets=[0,1]threshold=1900.0data_frame=pd.read_excel(input_file,sheetname=my_sheets,index_col=None)row_list=[]forworksheet_name,dataindata_frame.items():row_output.append(data[data['Sale Amount'].replace('$','')\.replace(',','').astype(float)>2000.0])filtered_rows=pd.concat(row_list,axis=0,ignore_index=True)writer=pd.ExcelWriter(output_file)filtered_rows.to_excel(writer,sheet_name='set_of_worksheets',index=False)writer.save()
To run the script, type the following on the command line and hit Enter:
python pandas_value_meets_condition_set_of_worksheets.py\
sales_2013.xlsx output_files\pandas_output.xls
You can then open the output file, pandas_output.xls, to review the results.
Processing Multiple Workbooks
The previous sections in this chapter demonstrated how to filter for specific rows and columns in a single worksheet, all worksheets in a workbook, and a set of worksheets in a workbook. These techniques for processing a workbook are extremely useful; however, sometimes you need to process many workbooks. In these situations, Python is exciting because it enables you to automate and scale your data processing above and beyond what you could handle manually.
This section reintroduces Python’s built-in glob module, which we met in Chapter 2, and builds on some of the examples shown earlier in this chapter to demonstrate how to process multiple workbooks.
In order to work with multiple workbooks, we need to create multiple workbooks. Let’s create two more Excel workbooks to work with, for a total of three workbooks. However, remember that the techniques shown here can scale to as many files as your computer can handle.
To begin:
-
Open the existing workbook sales_2013.xlsx.
Now, to create a second workbook:
-
Change the names of the existing three worksheets to january_2014, february_2014, and march_2014.
-
In each of the three worksheets, change the year in the Purchase Date column to 2014.
There are six data rows in each worksheet, so you’ll be making a total of 18 changes (six rows * three worksheets). Other than the change in year, you don’t need to make any other changes.
-
Save this second workbook as sales_2014.xlsx.
Figure 3-10 shows what the january_2014 worksheet should look like after you’ve changed the dates.
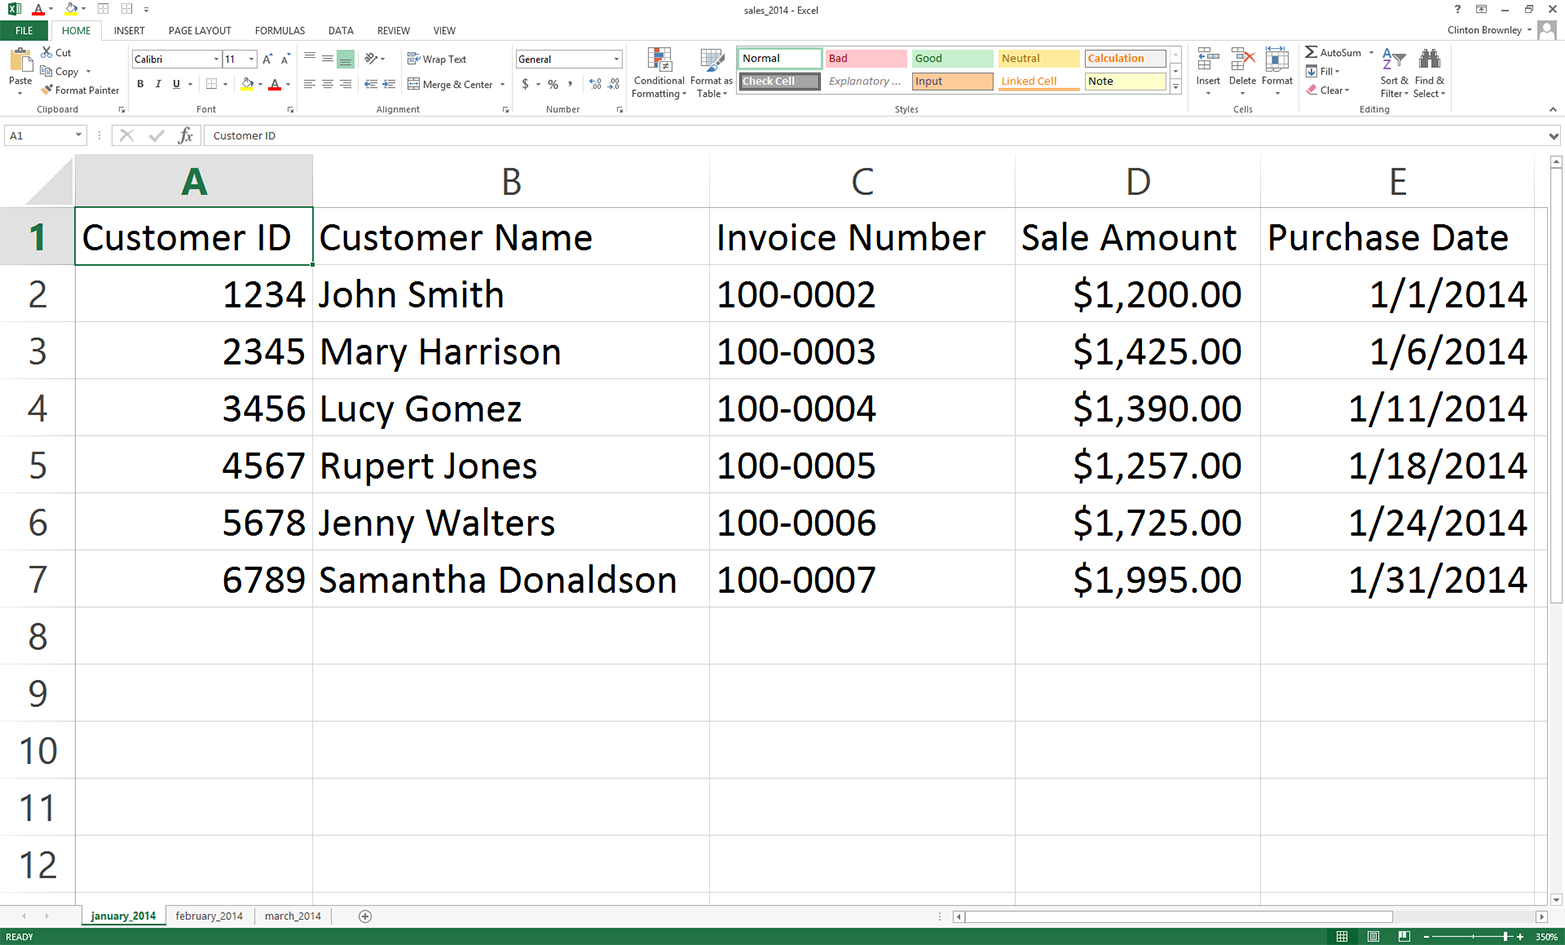
Figure 3-10. Creating a second workbook from the first by changing the dates
Now, to create a third workbook:
-
Change the names of the existing three worksheets to january_2015, february_2015, and march_2015.
-
In each of the three worksheets, change the year in the Purchase Date column to 2015.
There are six data rows in each worksheet, so you’ll be making a total of 18 changes (six rows * three worksheets). Other than the change in year, you don’t need to make any other changes.
-
Save this third workbook as sales_2015.xlsx.
Figure 3-11 shows what the january_2015 worksheet should look like after you’ve changed the dates.

Figure 3-11. Creating a third workbook from the second by changing the dates
Count Number of Workbooks and Rows and Columns in Each Workbook
In some cases, you may know the contents of the workbooks you’re dealing with; however, sometimes you didn’t create them so you don’t yet know their contents. Unlike CSV files, Excel workbooks can contain multiple worksheets, so if you’re unfamiliar with the workbooks, it’s important to get some descriptive information about them before you start processing them.
To count the number of workbooks in a folder, the number of worksheets in each workbook, and the number of rows and columns in each worksheet, type the following code into a text editor and save the file as 12excel_introspect_all_workbooks.py:
1#!/usr/bin/env python32importglob3importos4importsys5fromxlrdimportopen_workbook6input_directory=sys.argv[1]7workbook_counter=08forinput_fileinglob.glob(os.path.join(input_directory,'*.xls*')):9workbook=open_workbook(input_file)10('Workbook:%s'%os.path.basename(input_file))11('Number of worksheets:%d'%workbook.nsheets)12forworksheetinworkbook.sheets():13('Worksheet name:',worksheet.name,'\tRows:',\ 14worksheet.nrows,'\tColumns:',worksheet.ncols)15workbook_counter+=116('Number of Excel workbooks:%d'%(workbook_counter))
Lines 2 and 3 import Python’s built-in glob and os modules, respectively, so we can use their functions to identify and parse the pathnames of the files we want to process.
Line 8 uses Python’s built-in glob and os modules to create the list of input files that we want to process and applies a for loop over the list of input files. This line enables us to iterate over all of the workbooks we want to process.
Lines 10 to 14 print information about each workbook to the screen. Line 10 prints the name of the workbook. Line 11 prints the number of worksheets in the workbook. Lines 13 and 14 print the names of the worksheets in the workbook and the number of rows and columns in each worksheet.
To run the script, type the following on the command line and hit Enter:
python 12excel_introspect_all_workbooks.py "C:\Users\Clinton\Desktop"
You should then see the output shown in Figure 3-12 printed to your screen.
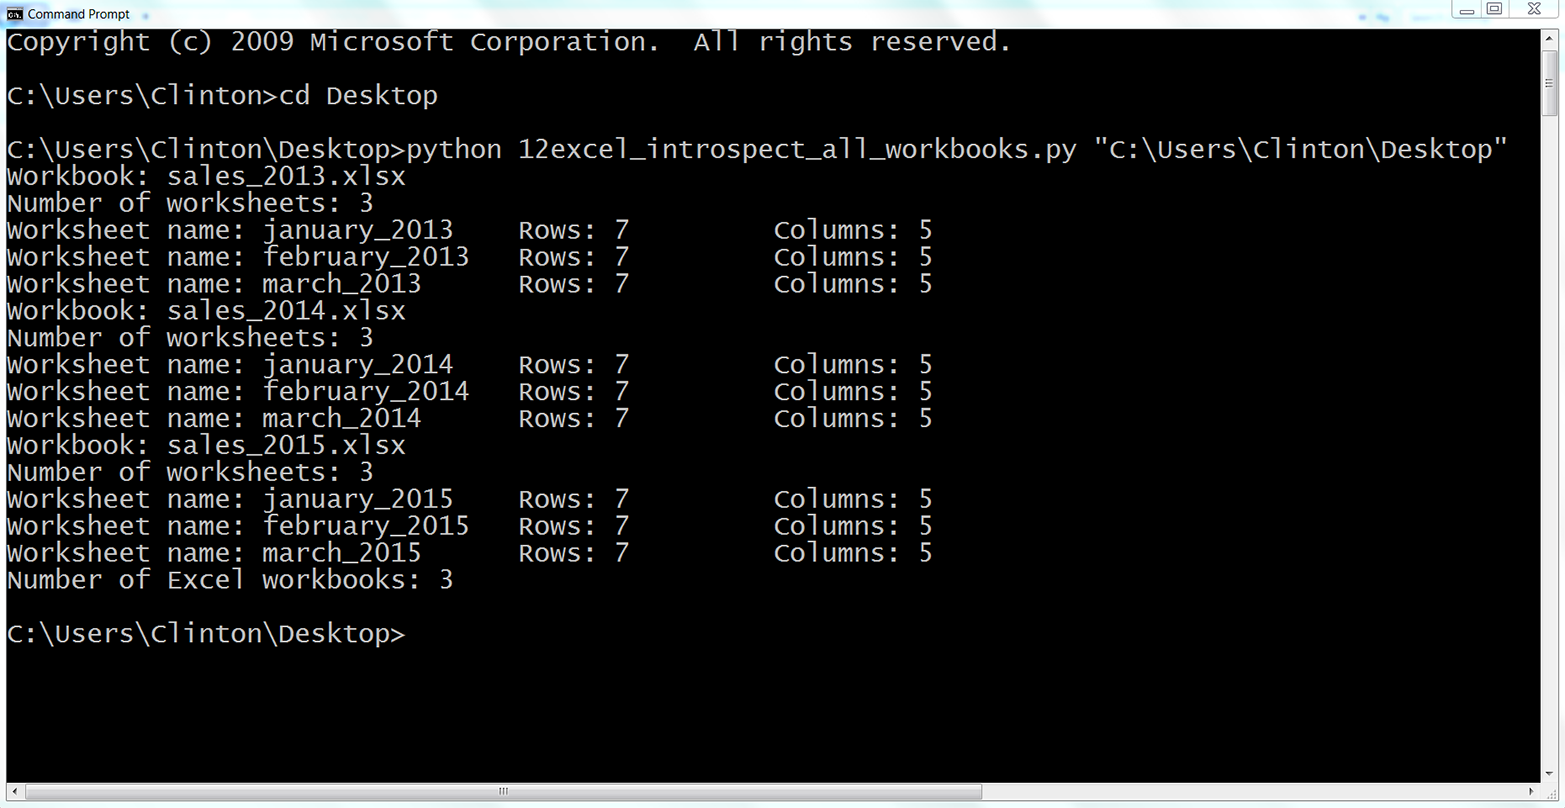
Figure 3-12. Output of Python script for processing multiple workbooks
The output shows that the script processed three workbooks. It also shows the names of the three workbooks (e.g., sales_2013.xlsx), the names of the three worksheets in each workbook (e.g., january_2013), and the number of rows and columns in each worksheet (e.g., 7 rows and 5 columns).
Printing some descriptive information about files you plan to process is useful when you’re less familiar with the files. Understanding the number of files and the number of rows and columns in each file gives you some idea about the size of the processing job as well as the consistency of the file layouts.
Concatenate Data from Multiple Workbooks
Base Python
To concatenate data from all of the worksheets in multiple workbooks vertically into one output file with base Python, type the following code into a text editor and save the file as 13excel_ concat_data_from_multiple_workbooks.py:
1#!/usr/bin/env python32importglob3importos4importsys5fromdatetimeimportdate6fromxlrdimportopen_workbook,xldate_as_tuple7fromxlwtimportWorkbook8input_folder=sys.argv[1]9output_file=sys.argv[2]10output_workbook=Workbook()11output_worksheet=output_workbook.add_sheet('all_data_all_workbooks')12data=[]13first_worksheet=True14forinput_fileinglob.glob(os.path.join(input_folder,'*.xls*')):15(os.path.basename(input_file))16withopen_workbook(input_file)asworkbook:17forworksheetinworkbook.sheets():18iffirst_worksheet:19header_row=worksheet.row_values(0)20data.append(header_row)21first_worksheet=False22forrow_indexinrange(1,worksheet.nrows):23row_list=[]24forcolumn_indexinrange(worksheet.ncols):25cell_value=worksheet.cell_value\ 26(row_index,column_index)27cell_type=worksheet.cell_type\ 28(row_index,column_index)29ifcell_type==3:30date_cell=xldate_as_tuple\ 31(cell_value,workbook.datemode)32date_cell=date(*date_cell[0:3])\ 33.strftime('%m/%d/%Y')34row_list.append(date_cell)35else:36row_list.append(cell_value)37data.append(row_list)38forlist_index,output_listinenumerate(data):39forelement_index,elementinenumerate(output_list):40output_worksheet.write(list_index,element_index,element)41output_workbook.save(output_file)
Line 13 creates a Boolean (i.e., True/False) variable named first_worksheet that we use to distinguish between the first worksheet and all of the subsequent worksheets we process. For the first worksheet we process, line 18 is True so we append the header row into data and then set first_worksheet equal to False.
For the remaining data rows in the first worksheet and all of the subsequent worksheets, we skip the header row and start processing the data rows. We know that we start at the second row because the range function in line 22 starts at one instead of zero.
To run the script, type the following on the command line and hit Enter:
python 13excel_ concat_data_from_multiple_workbooks.py "C:\Users\Clinton\Desktop"\
output_files\13output.xls
You can then open the output file, 13output.xls, to review the results.
Pandas
Pandas provides the concat function for concatenating DataFrames. If you want to stack the DataFrames vertically on top of one another, then use axis=0. If you want to join them horizontally side by side, then use axis=1. Alternatively, if you need to join the DataFrames together based on a key column, the pandas merge function provides these SQL join–like operations (if this doesn’t make sense, don’t worry; we’ll talk more about database operations in Chapter 4).
To concatenate data from all of the worksheets in multiple workbooks vertically into one output file with pandas, type the following code into a text editor and save the file as pandas_concat_data_from_multiple_workbooks.py:
#!/usr/bin/env python3importpandasaspdimportglobimportosimportsysinput_path=sys.argv[1]output_file=sys.argv[2]all_workbooks=glob.glob(os.path.join(input_path,'*.xls*'))data_frames=[]forworkbookinall_workbooks:all_worksheets=pd.read_excel(workbook,sheetname=None,index_col=None)forworksheet_name,datainall_worksheets.items():data_frames.append(data)all_data_concatenated=pd.concat(data_frames,axis=0,ignore_index=True)writer=pd.ExcelWriter(output_file)all_data_concatenated.to_excel(writer,sheet_name='all_data_all_workbooks',\index=False)writer.save()
To run the script, type the following on the command line and hit Enter:
python pandas_concat_data_from_multiple_workbooks.py "C:\Users\Clinton\Desktop"\
output_files\pandas_output.xls
You can then open the output file, pandas_output.xls, to review the results.
Sum and Average Values per Workbook and Worksheet
Base Python
To calculate worksheet- and workbook-level statistics for multiple workbooks with base Python, type the following code into a text editor and save the file as 14excel_sum_average_multiple_workbooks.py:
1#!/usr/bin/env python32importglob3importos4importsys5fromdatetimeimportdate6fromxlrdimportopen_workbook,xldate_as_tuple7fromxlwtimportWorkbook8input_folder=sys.argv[1]9output_file=sys.argv[2]10output_workbook=Workbook()11output_worksheet=output_workbook.add_sheet('sums_and_averages')12all_data=[]13sales_column_index=314header=['workbook','worksheet','worksheet_total','worksheet_average',\ 15'workbook_total','workbook_average']16all_data.append(header)17forinput_fileinglob.glob(os.path.join(input_folder,'*.xls*')):18withopen_workbook(input_file)asworkbook:19list_of_totals=[]20list_of_numbers=[]21workbook_output=[]22forworksheetinworkbook.sheets():23total_sales=024number_of_sales=025worksheet_list=[]26worksheet_list.append(os.path.basename(input_file))27worksheet_list.append(worksheet.name)28forrow_indexinrange(1,worksheet.nrows):29try:30total_sales+=float(str(worksheet.cell_value\ 31(row_index,sales_column_index))\ 32.strip('$').replace(',',''))33number_of_sales+=1.34except:35total_sales+=0.36number_of_sales+=0.37average_sales='%.2f'%(total_sales/number_of_sales)38worksheet_list.append(total_sales)39worksheet_list.append(float(average_sales))40list_of_totals.append(total_sales)41list_of_numbers.append(float(number_of_sales))42workbook_output.append(worksheet_list)43workbook_total=sum(list_of_totals)44workbook_average=sum(list_of_totals)/sum(list_of_numbers)45forlist_elementinworkbook_output:46list_element.append(workbook_total)47list_element.append(workbook_average)48all_data.extend(workbook_output)49 50forlist_index,output_listinenumerate(all_data):51forelement_index,elementinenumerate(output_list):52output_worksheet.write(list_index,element_index,element)53output_workbook.save(output_file)
Line 12 creates an empty list named all_data to hold all of the rows we want to write to the output file. Line 13 creates a variable named sales_column_index to hold the index value of the Sale Amount column.
Line 14 creates the list of column headings for the output file and line 16 appends this list of values into all_data.
In lines 19, 20, and 21 we create three lists. The list_of_totals will contain the total sale amounts for all of the worksheets in a workbook. Similarly, list_of_numbers will contain the number of sale amounts used to calculate the total sale amounts for all of the worksheets in a workbook. The third list, workbook_output, will contain all of the lists of output that we’ll write to the output file.
In line 25, we create a list, worksheet_list, to hold all of the information about the worksheet that we want to retain. In lines 26 and 27, we append the name of the workbook and the name of the worksheet into worksheet_list. Similarly, in lines 38 and 39, we append the total and average sale amounts into worksheet_list. In line 42, we append worksheet_list into workbook_output to store the information at the workbook level.
In lines 40 and 41 we append the total and number of sale amounts for the worksheet into list_of_totals and list_of_numbers, respectively, so we can store these values across all of the worksheets. In lines 43 and 44 we use the lists to calculate the total and average sale amount for the workbook.
In lines 45 to 47, we iterate through the lists in workbook_output (there are three lists for each workbook, as each workbook has three worksheets) and append the workbook-level total and average sale amounts into each of the lists.
Once we have all of the information we want to retain for the workbook (i.e., three lists, one for each worksheet), we extend the lists into all_data. We use extend instead of append so that each of the lists in workbook_output becomes a separate element in all_data. This way, after processing all three workbooks, all_data is a list of nine elements, where each element is a list. If instead we were to use append, there would only be three elements in all_data and each one would be a list of lists.
To run the script, type the following on the command line and hit Enter:
python 14excel_sum_average_multiple_workbooks.py "C:\Users\Clinton\Desktop"\
output_files\14output.xls
You can then open the output file, 14output.xls, to review the results.
Pandas
Pandas makes it relatively straightforward to iterate through multiple workbooks and calculate statistics for the workbooks at both the worksheet and workbook levels. In this script, we calculate statistics for each of the worksheets in a workbook and concatenate the results into a DataFrame. Then we calculate workbook-level statistics, convert them into a DataFrame, merge the two DataFrames together with a left join on the name of the workbook, and add the resulting DataFrame to a list. Once all of the workbook-level DataFrames are in the list, we concatenate them together into a single DataFrame and write it to the output file.
To calculate worksheet and workbook-level statistics for multiple workbooks with pandas, type the following code into a text editor and save the file as pandas_sum_average_multiple_workbooks.py:
#!/usr/bin/env python3importpandasaspdimportglobimportosimportsysinput_path=sys.argv[1]output_file=sys.argv[2]all_workbooks=glob.glob(os.path.join(input_path,'*.xls*'))data_frames=[]forworkbookinall_workbooks:all_worksheets=pd.read_excel(workbook,sheetname=None,index_col=None)workbook_total_sales=[]workbook_number_of_sales=[]worksheet_data_frames=[]worksheets_data_frame=Noneworkbook_data_frame=Noneforworksheet_name,datainall_worksheets.items():total_sales=pd.DataFrame([float(str(value).strip('$').replace(\',',''))forvalueindata.loc[:,'Sale Amount']]).sum()number_of_sales=len(data.loc[:,'Sale Amount'])average_sales=pd.DataFrame(total_sales/number_of_sales)workbook_total_sales.append(total_sales)workbook_number_of_sales.append(number_of_sales)data={'workbook':os.path.basename(workbook),'worksheet':worksheet_name,'worksheet_total':total_sales,'worksheet_average':average_sales}worksheet_data_frames.append(pd.DataFrame(data,\columns=['workbook','worksheet',\'worksheet_total','worksheet_average']))worksheets_data_frame=pd.concat(\worksheet_data_frames,axis=0,ignore_index=True)workbook_total=pd.DataFrame(workbook_total_sales).sum()workbook_total_number_of_sales=pd.DataFrame(\workbook_number_of_sales).sum()workbook_average=pd.DataFrame(\workbook_total/workbook_total_number_of_sales)workbook_stats={'workbook':os.path.basename(workbook),'workbook_total':workbook_total,'workbook_average':workbook_average}workbook_stats=pd.DataFrame(workbook_stats,columns=\['workbook','workbook_total','workbook_average'])workbook_data_frame=pd.merge(worksheets_data_frame,workbook_stats,\on='workbook',how='left')data_frames.append(workbook_data_frame)all_data_concatenated=pd.concat(data_frames,axis=0,ignore_index=True)writer=pd.ExcelWriter(output_file)all_data_concatenated.to_excel(writer,sheet_name='sums_and_averages',\index=False)writer.save()
To run the script, type the following on the command line and hit Enter:
python pandas_sum_average_multiple_workbooks.py "C:\Users\Clinton\Desktop"\
output_files\pandas_output.xls
You can then open the output file, pandas_output.xls, to review the results.
We’ve covered a lot of ground in this chapter. We’ve discussed how to read and parse an Excel workbook, navigate rows in an Excel worksheet, navigate columns in an Excel worksheet, process multiple Excel worksheets, process multiple Excel workbooks, and calculate statistics for multiple Excel worksheets and workbooks. If you’ve followed along with the examples in this chapter, you have written 14 new Python scripts!
The best part about all of the work you have put into working through the examples in this chapter is that you are now well equipped to navigate and process Excel files, one of the most common file types in business. Moreover, because many business divisions store data in Excel workbooks, you now have a set of tools you can use to process the data in these workbooks regardless of the number of workbooks, the size of the workbooks, or the number of worksheets in each workbook. Now you can take advantage of your computer’s data processing capabilities to automate and scale your analysis of data in Excel workbooks.
The next data source we’ll tackle is databases. Because databases are a common data store, it’s important for you to know how to access their data. Once you know how to access the data, you can process it in the same row-by-row fashion that you’ve learned to use when dealing with CSV and Excel files. Having worked through the examples in these two chapters, you’re now well prepared to process data in databases.
Chapter Exercises
-
Modify one of the scripts that filters rows based on conditions, sets, or regular expressions to print and write a different set of rows than the ones we filtered for in the examples.
-
Modify one of the scripts that filters columns based on index values or column headings to print and write a different set of columns that the ones we filtered for in the examples.
-
Create a new Python script that combines code from one of the scripts that filters rows or columns and code from the script that concatenates data from multiple workbooks to generate an output file that contains specific rows or columns of data from multiple workbooks.