Table of Contents for
Foundations for Analytics with Python
 Foundations for Analytics with Python
Published by
O'Reilly Media, Inc., 2016
Foundations for Analytics with Python
Published by
O'Reilly Media, Inc., 2016
- Cover
- nav
- Foundations for Analyticswith Python
- Dedication
- Foundations for Analytics with Python
- Preface
- 1. Python Basics
- 2. Comma-Separated Values (CSV) Files
- 3. Excel Files
- 4. Databases
- 5. Applications
- 6. Figures and Plots
- 7. Descriptive Statistics and Modeling
- 8. Scheduling Scripts to Run Automatically
- 9. Where to Go from Here
- A. Download Instructions
- B. Answers to Exercises
- Bibliography
- Index
- About the Author
- Colophon
Chapter 2. Comma-Separated Values (CSV) Files
The comma-separated values (CSV) file format is a very simple way of storing and sharing data. CSV files hold data tables as plain text; each cell of the table (or spreadsheet) is just a number or string. One of the principal advantages of a CSV file compared to an Excel file is that there are many programs capable of storing, transferring, and processing plain-text files; on the other hand, there are fewer that are capable of handling Excel files. Any spreadsheet program, word processor, or simple text editor can handle plain-text files, but not all of them can handle Excel files. While Excel is an incredibly powerful tool, when you work with Excel files, you’re basically limited to the tasks that Excel can perform. CSV files give you the freedom to send your data to the right tool for the job you want to do—or to build your own tools using Python!
You do lose some of Excel’s features when you work with CSV files: whereas every cell of an Excel spreadsheet has a defined “type” (number, text, currency, date, etc.), cells of CSV files are just raw data. Thankfully, Python is pretty clever about recognizing different data types, as we’ve seen in Chapter 1. Another trade-off with using CSV files is that they don’t store formulas, only data. However, by separating the data storage (CSV file) and data processing (Python script), you make it easier to apply your processing to different datasets. It’s also easier to find—and harder to propagate!—errors (in both the processing and the data files) when the processing and storage are separate.
In order to begin working with this format, you’ll need to create a CSV file (you can also download this file from https://github.com/cbrownley/foundations-for-analytics-with-python/blob/master/csv/supplier_data.csv):
-
Open a new spreadsheet and add the data as shown in Figure 2-1.
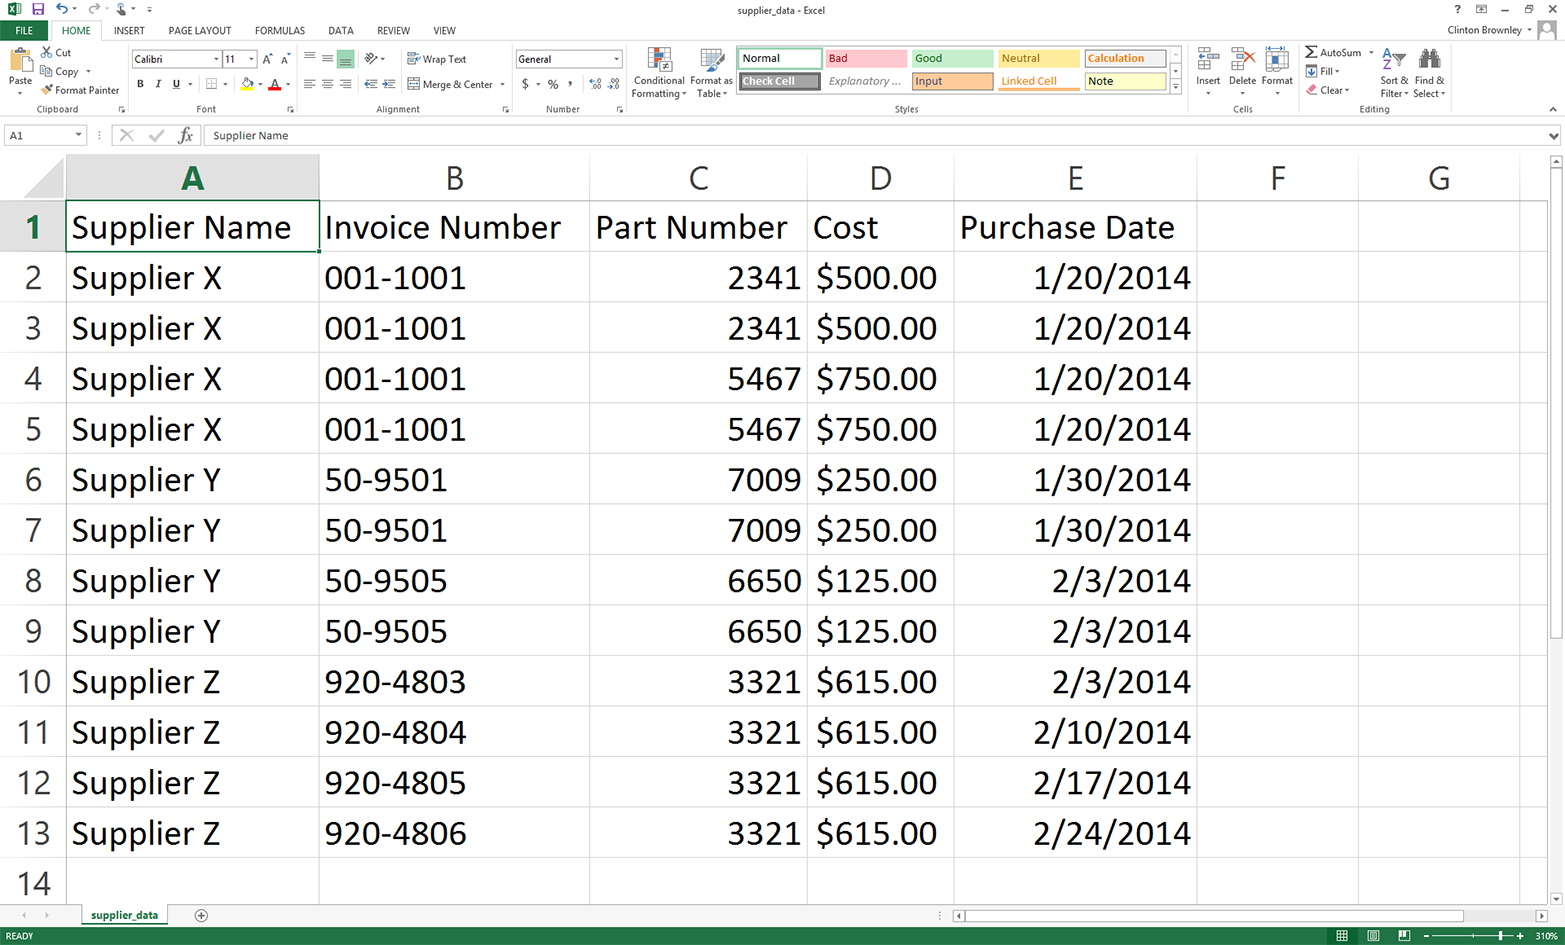
Figure 2-1. Adding data to the supplier_data.csv file
-
Save the file to your Desktop as supplier_data.csv.
To confirm that supplier_data.csv is indeed a plain-text file:
-
Minimize all of your open windows and locate supplier_data.csv on your Desktop.
-
Right-click the file.
-
Select “Open with” and then select a text editor like Notepad, Notepad++, or Sublime Text.
When you open the file in the text editor, it should look like what is shown in Figure 2-2.
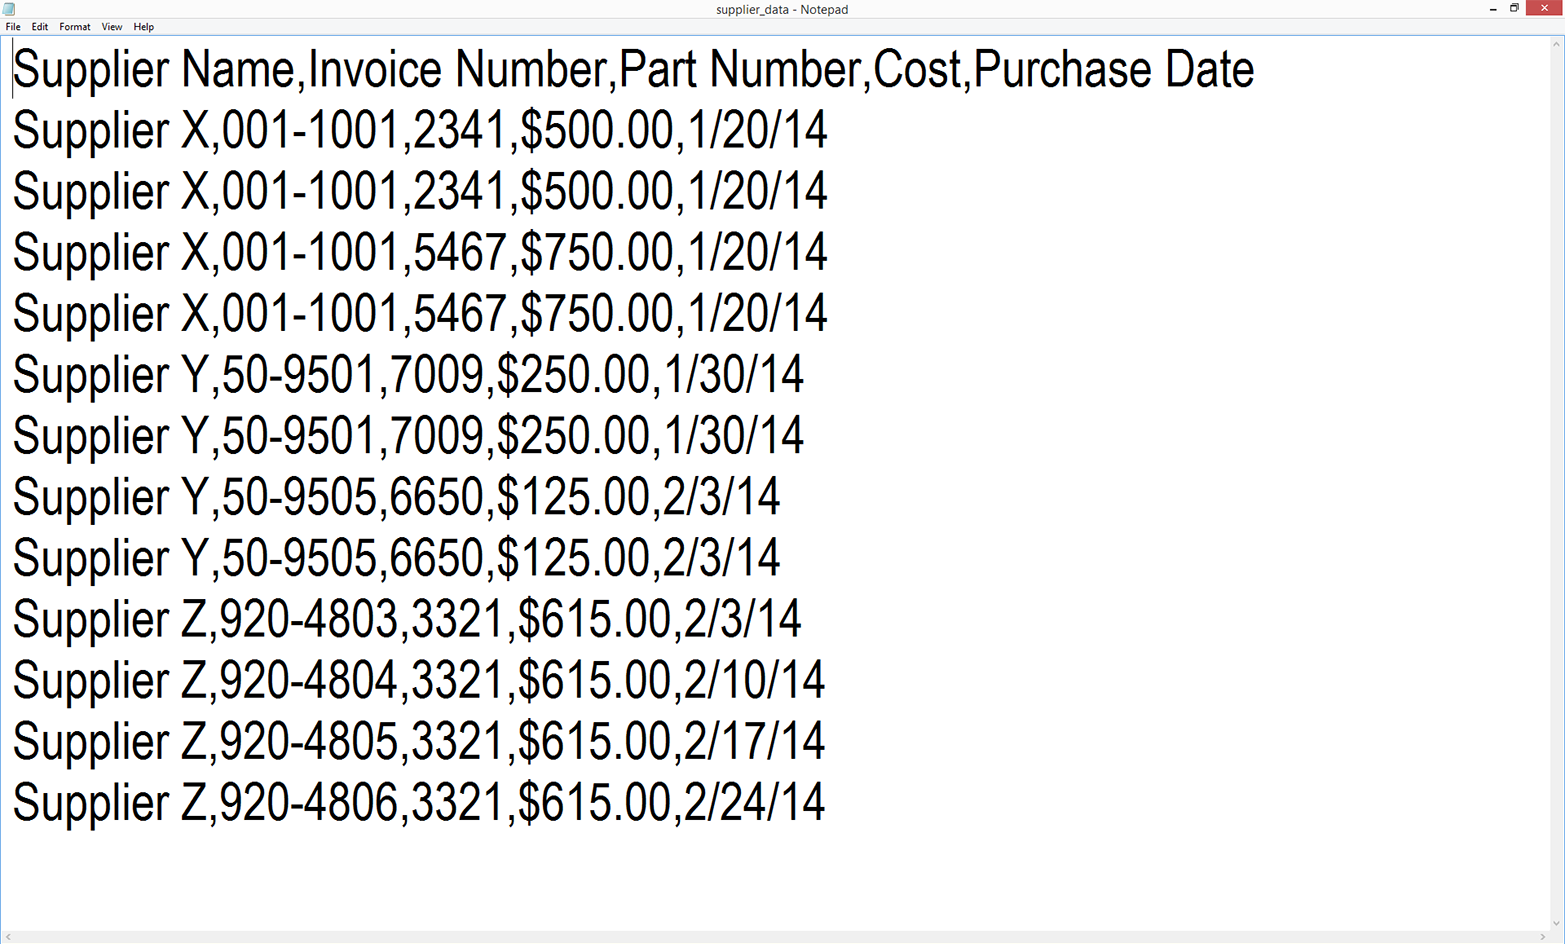
Figure 2-2. The supplier_data.csv file in Notepad
As you can see, the file is simply a plain-text file. Each row contains five values separated by commas. Another way to think about it is that the commas delineate the five columns in the Excel spreadsheet. You can now close the file.
Base Python Versus pandas
As mentioned in the Preface, each of the subsections in this chapter presents two versions of code to accomplish a specific data processing task. The first version of code in each subsection shows how to accomplish the task with base Python. The second version shows how to accomplish it with pandas. As you’ll see, pandas makes it easy to accomplish a task with relatively few lines of code, so it’s very useful for simply getting the job done or for accomplishing the task once you understand the programming concepts and operations it’s simplifying for you. However, I start each subsection with the base Python version so you learn how to accomplish the specific task with general programming concepts and operations. By presenting both versions, I want to give you the option to quickly get the job done with pandas or learn general programming and problem-solving skills you can build on as you develop your coding skills. I won’t explain the pandas versions in quite as much detail as the base Python versions; you can use the examples here as a “cookbook” to get the job done with pandas, but if you want to become a pandas power user after you work your way through this book, I recommend Wes McKinney’s Python for Data Analysis (O’Reilly) as a next step.
Read and Write a CSV File (Part 1)
Base Python, without csv module
Now let’s learn how to read, process, and write a CSV file in base Python (without using the built-in csv module). By seeing this example first, you’ll then have an idea of what’s going on “under the hood” when you use the csv module.
To work with our CSV file, let’s create a new Python script, 1csv_read_with_simple_parsing_and_write.py.
Type the following code into Spyder or a text editor:
1#!/usr/bin/env python32importsys3 4input_file=sys.argv[1]5output_file=sys.argv[2]6 7withopen(input_file,'r',newline='')asfilereader:8withopen(output_file,'w',newline='')asfilewriter:9header=filereader.readline()10header=header.strip()11header_list=header.split(',')12(header_list)13filewriter.write(','.join(map(str,header_list))+'\n')14forrowinfilereader:15row=row.strip()16row_list=row.split(',')17(row_list)18filewriter.write(','.join(map(str,row_list))+'\n')
Save the script to your Desktop as 1csv_read_with_simple_parsing_and_write.py.
Figures 2-3, 2-4, and 2-5 show what the script looks like in Anaconda Spyder, Notepad++ (Windows), and TextWrangler (macOS), respectively.
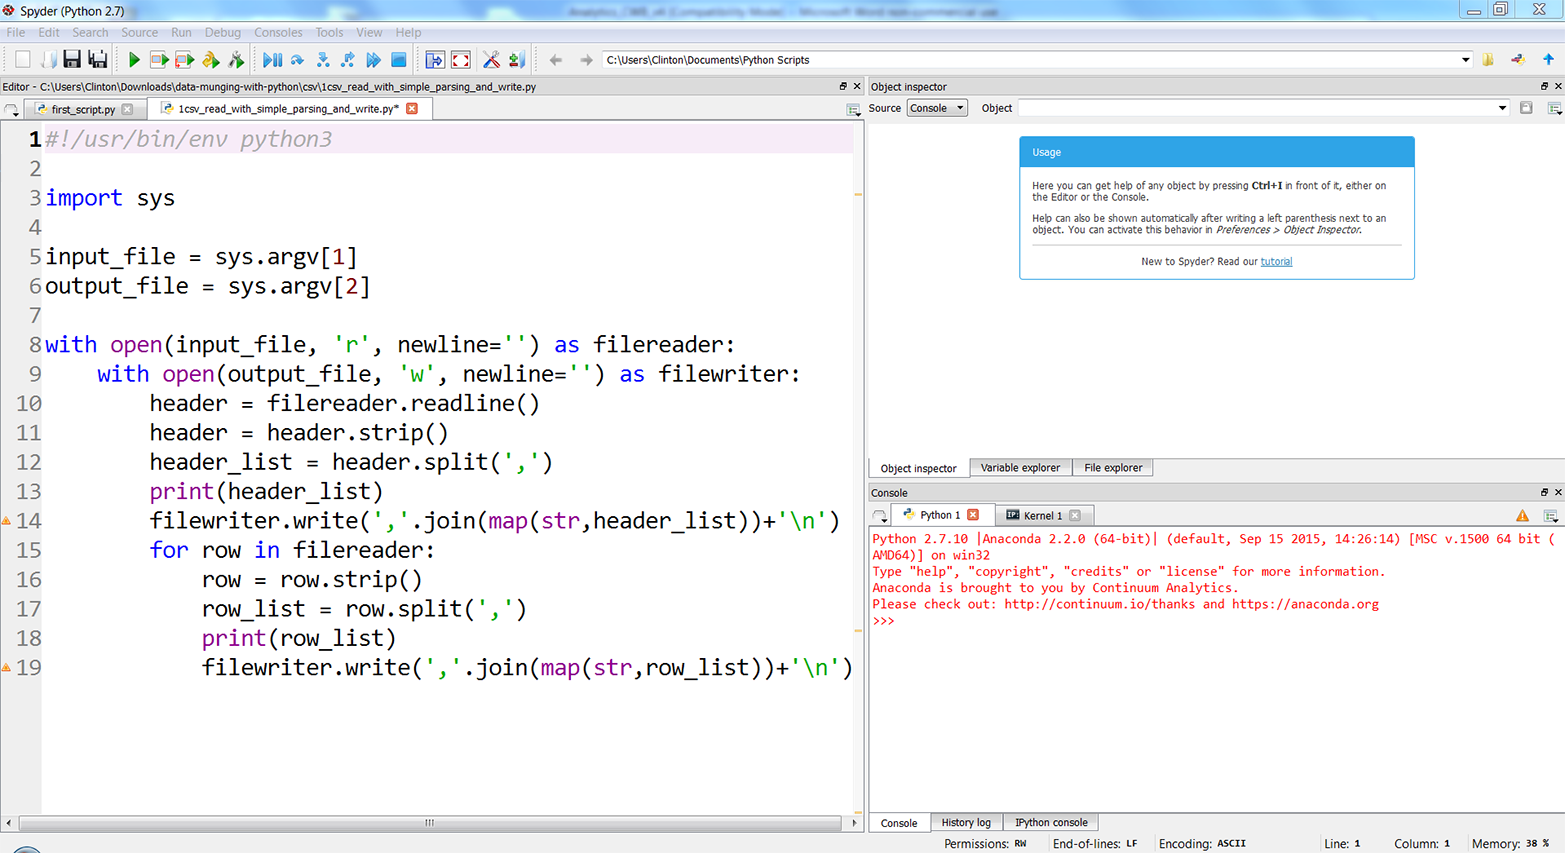
Figure 2-3. The 1csv_read_with_simple_parsing_and_write.py Python script in Anaconda Spyder
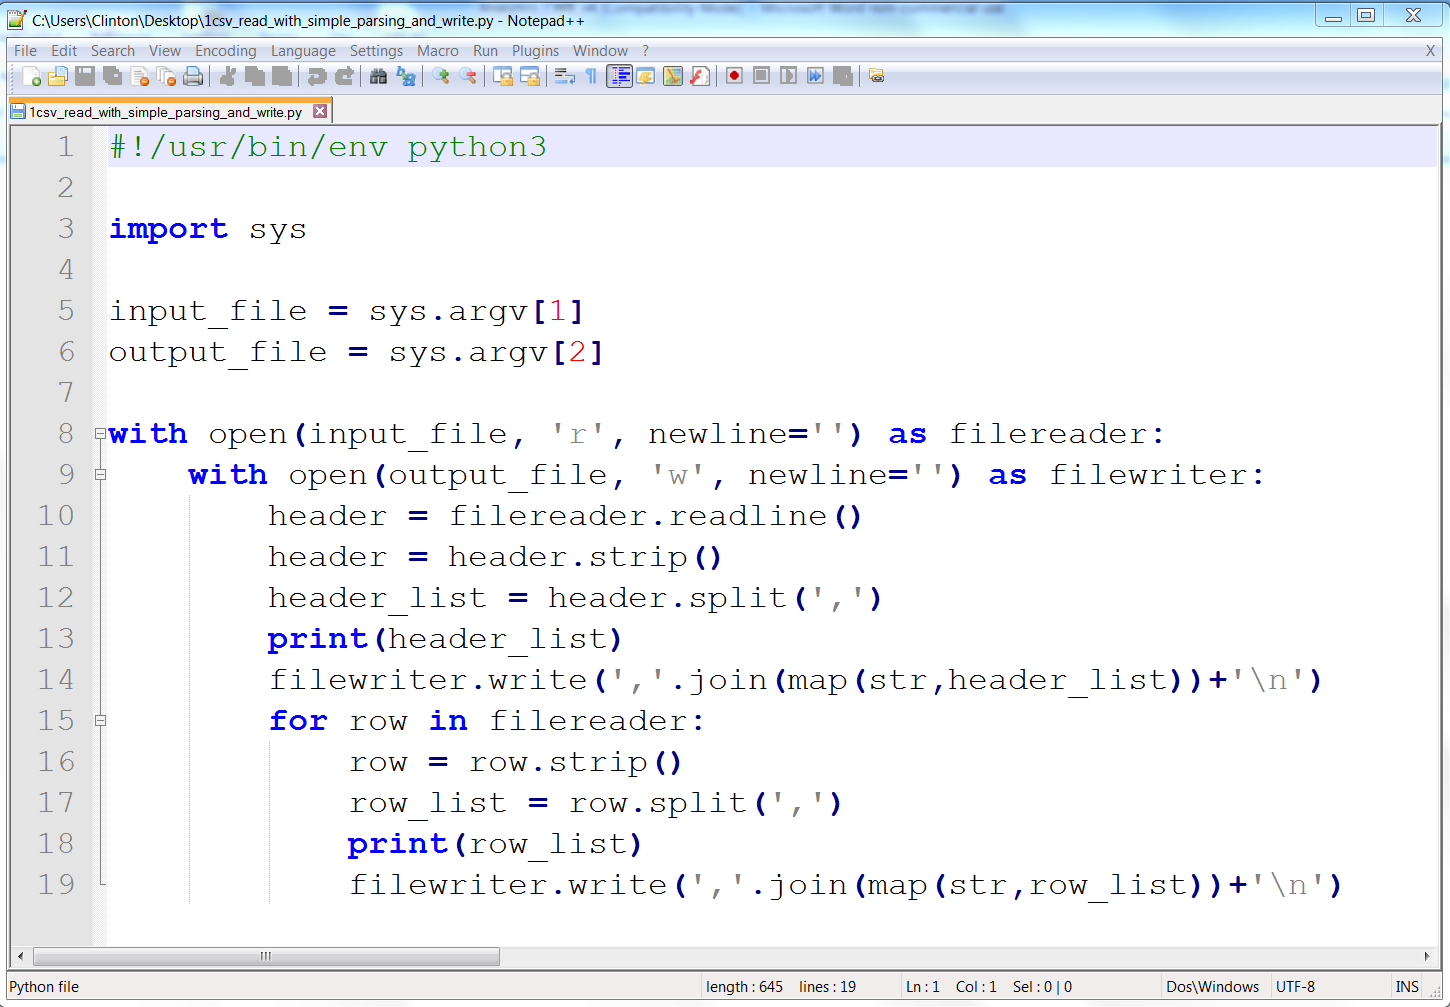
Figure 2-4. The 1csv_read_with_simple_parsing_and_write.py Python script in Notepad++ (Windows)
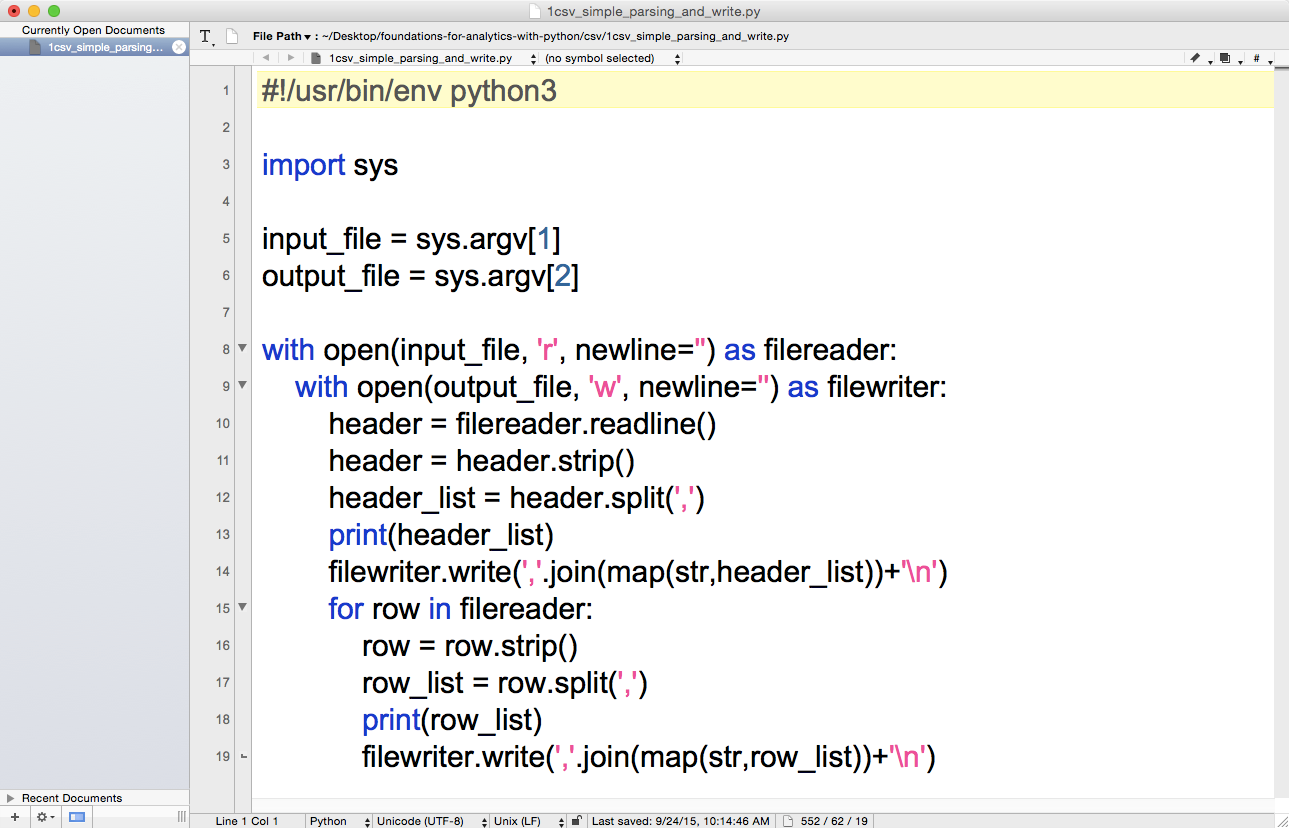
Figure 2-5. The 1csv_read_with_simple_parsing_and_write.py Python script in TextWrangler (macOS)
Before we run this script and view the output, let’s explore what the code in the script is supposed to do. We’ll discuss each of the blocks of code in turn (the line numbers refer to the line numbers shown in the screenshots):
#!/usr/bin/env python3importsys
As we discussed in Chapter 1, line 1 is a comment line that makes the script transferable across operating systems. Line 2 imports Python’s built-in sys module, which enables you to send additional input to your script from the command line.
input_file=sys.argv[1]output_file=sys.argv[2]
Lines 4 and 5 use the sys module’s argv parameter, which is the list of command-line arguments passed to a Python script—that is, what you enter at the command line at the time you run the script. Here is a generic version of the command-line arguments we’ll use to read a CSV input file and write a CSV output file on a Windows computer:
python script_name.py "C:\path\to\input_file.csv" "C:\path\to\output_file.csv"
The first word, python, tells your computer to use the Python program to process the rest of the command-line arguments. Python collects the rest of the arguments into a special list called argv. It reserves the first position in the list, argv[0], for the script name, so argv[0] refers to script_name.py. The next command-line argument is "C:\path\to\input_file.csv", the path to and name of the CSV input file. Python stores this value in argv[1], so line 4 in our script assigns this value to the variable named input_file. The last command-line argument is "C:\path\to\output_file.csv", the path to and name of the CSV output file. Python stores this value in argv[2] and line 5 assigns this value to the variable named output_file.
withopen(input_file,'r',newline='')asfilereader:withopen(output_file,'w',newline='')asfilewriter:
Line 7 is a with statement that opens input_file as a file object, filereader. The 'r' specifies read mode, which means input_file is opened for reading. Line 8 is another with statement that opens output_file as a file object, filewriter. The 'w' specifies write mode, which means output_file is opened for writing. As we saw in “Modern File-Reading Syntax”, the with syntax is helpful because it automatically closes the file object when the with statement is exited.
header=filereader.readline()header=header.strip()header_list=header.split(',')
Line 9 uses the file object’s readline method to read in the first line of the input file, which in this case is the header row, as a string and assigns it to a variable named header. Line 10 uses the string module’s strip function to remove spaces, tabs, and newline characters from both ends of the string in header and reassigns the stripped version of the string to header. Line 11 uses the string module’s split function to split the string on commas into a list, where each value in the list is a column heading, and assigns the list to a variable named header_list.
(header_list)filewriter.write(','.join(map(str,header_list))+'\n')
Line 12 is a print statement that prints the values in header_list (i.e., the column headings) to the screen.
Line 13 uses the filewriter object’s write method to write each of the values in header_list to the output file. Because there is a lot going on in this one line, let’s inspect it from the inside out. The map function applies the str function to each of the values in header_list to ensure each of the values is a string. Then the join function inserts a comma between each of the values in header_list and converts the list into a string. Next, a newline character is added to the end of the string. Finally, the filewriter object writes the string as the first row in the output file.
forrowinfilereader:row=row.strip()row_list=row.split(',')(row_list)filewriter.write(','.join(map(str,row_list))+'\n')
Line 14 creates a for loop to iterate through the remaining rows in the input file. Line 15 uses the strip function to remove spaces, tabs, and newline characters from both ends of the string in row and reassigns the stripped version of the string to row. Line 16 uses the split function to split the string on commas into a list, where each value in the list is a column value from the row, and assigns the list to a variable named row_list. Line 17 prints the values in row_list to the screens and line 18 writes the values to the output file.
The script executes lines 15 to 18 for every row of data in the input file, as these four lines are indented beneath the for loop in line 14.
You can test out the script by running it in a Command Prompt or Terminal window, as described next:
- Command Prompt (Windows)
-
-
Open a Command Prompt window.
-
Navigate to your Desktop (where you saved the Python script).
To do so, type the following line and then hit Enter:
cd
"C:\Users\[Your Name]\Desktop" -
Run the Python script.
To do so, type the following line and then hit Enter:
python 1csv_simple_parsing_and_write.py supplier_data.csv\
output_files\1output.csv
-
- Terminal (macOS)
-
-
Open a Terminal window.
-
Navigate to your Desktop (where you saved the Python script).
To do so, type the following line and then hit Enter:
cd /Users/[Your Name]/Desktop
-
Make the Python script executable.
To do so, type the following line and then hit Enter:
chmod +x 1csv_simple_parsing_and_write.py
-
Run the Python script.
To do so, type the following line and then hit Enter:
./1csv_simple_parsing_and_write.py supplier_data.csv\
output_files/1output.csv
-
You should see the output shown in Figure 2-6 printed to the Command Prompt or Terminal window.
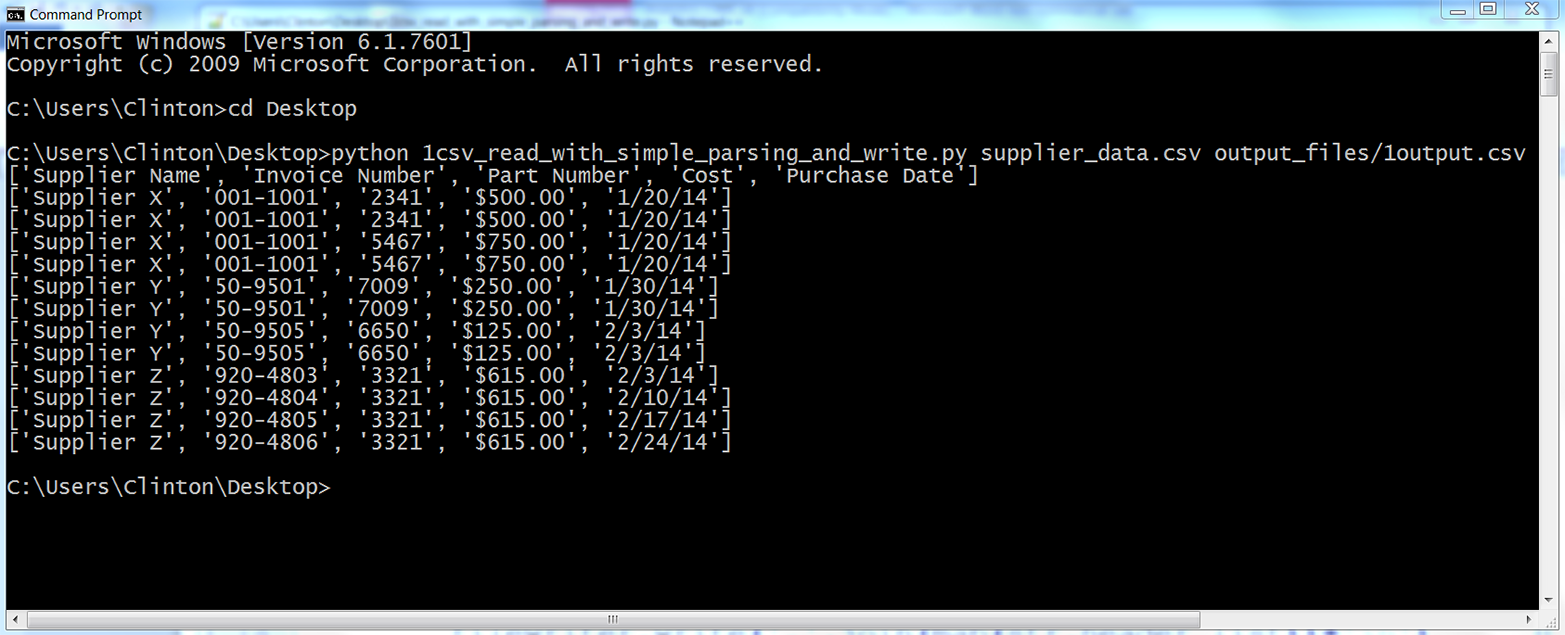
Figure 2-6. Output of running the 1csv_read_with_simple_parsing_and_write.py Python script
All of the rows in the input file have been printed to the screen and written to the output file. In most cases, you do not need to rewrite all of the data from an input file to an output file because you already have all of the data in the input file, but this example is useful because it foreshadows how you can embed the filewriter.write statement in conditional business logic to ensure you only write specific rows of interest to the output file.
Pandas
To process a CSV file with pandas, type the following code into a text editor and save the file as pandas_parsing_and_write.py (this script reads a CSV file, prints the contents to the screen, and writes the contents to an output file):
#!/usr/bin/env python3importsysimportpandasaspdinput_file=sys.argv[1]output_file=sys.argv[2]data_frame=pd.read_csv(input_file)(data_frame)data_frame.to_csv(output_file,index=False)
To run the script, type one of the following commands on the command line, depending on your operating system:
- On Windows:
-
python pandas_parsing_and_write.py supplier_data.csv\
output_files\pandas_output.csv
- On macOS:
-
chmod +x pandas_parsing_and_write.py
./pandas_parsing_and_write .py supplier_data.csv\
output_files/pandas_output.csv
You’ll note that in the pandas version of the script, we created a variable called data_frame. Like lists, dictionaries, and tuples, DataFrames are a way to store data. They preserve the “table” organization of your data without having to parse the data as a list of lists. DataFrames are part of the pandas package; they don’t exist unless you’ve imported pandas as part of your script. While we called the variable data_frame, that’s like using the variable name list—it’s useful at the learning stage, but you’ll probably want to use more descriptive variable names in the future.
How Basic String Parsing Can Fail
One way basic CSV parsing can fail is when column values contain extra commas. Open supplier_data.csv and make the last two cost amounts in the Cost column $6,015.00 and $1,006,015.00, respectively. With these two changes, the input file should look as shown in Figure 2-7.
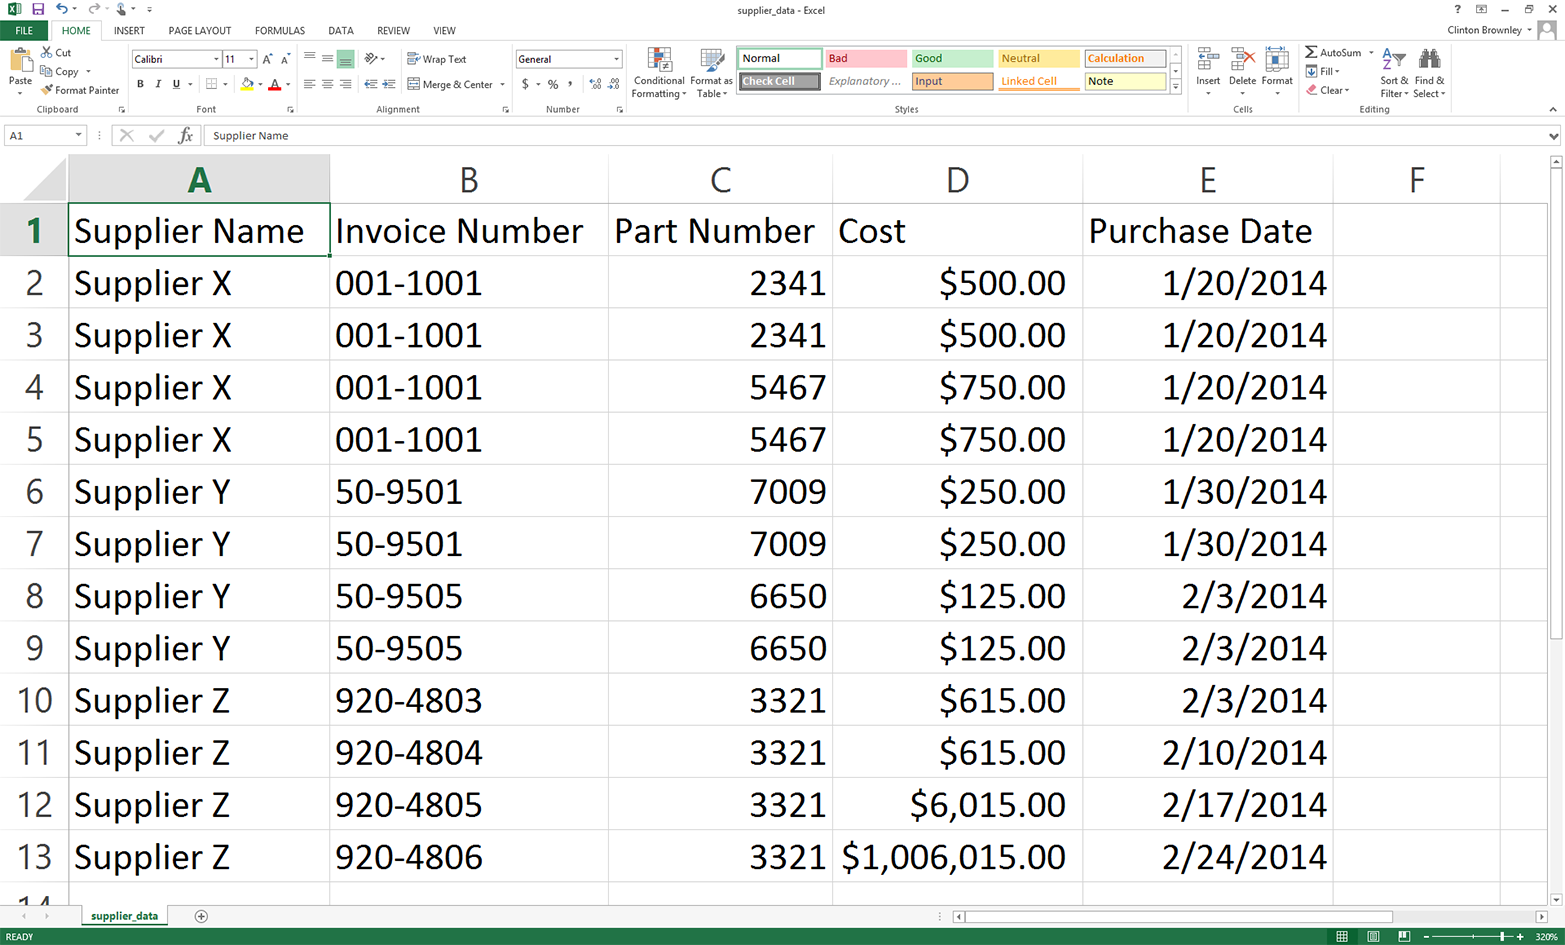
Figure 2-7. Modified input file (supplier_data.csv)
To see how our simple parsing script fails after changing the input file, rerun the script on the new, modified input file. That is, save the file with these changes, then hit the up arrow to recover the previous command you ran or retype the following command and hit Enter:
python 1csv_simple_parsing_and_write.py supplier_data.csv\
output_files\1output.csv
You should see the output shown in Figure 2-8 printed to the screen.
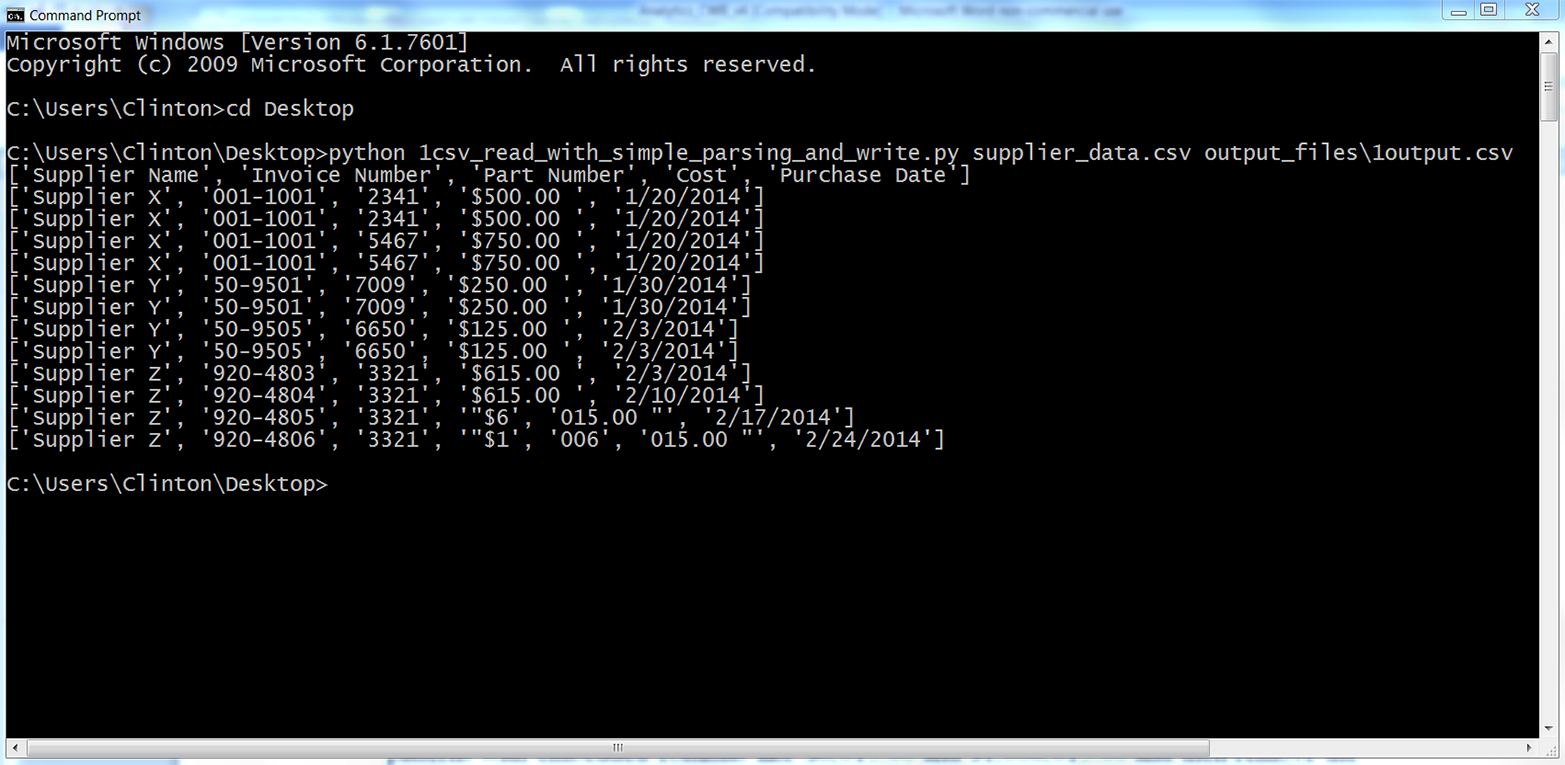
Figure 2-8. Output of running Python script on modified supplier_data.csv
As you can see, our script parsed each row based on the commas in the row. The script handled the header row and the first 10 data rows correctly because they did not include embedded commas. However, the script split the last two rows incorrectly because they did include embedded commas.
There are many ways to enhance the code in this script to handle values that contain embedded commas. For example, we could use a regular expression to search for patterns with embedded commas like $6,015.00 and $1,006,015.00 and then remove the commas in these values before splitting the row on the remaining commas. However, instead of complicating our script, let’s use Python’s built-in csv module, which is designed to handle arbitrarily complex CSV files.
Read and Write a CSV File (Part 2)
Base Python, with csv module
One of the advantages of using Python’s built-in csv module to process CSV files is that it has been designed to properly handle embedded commas and other complex patterns in data values. It recognizes these patterns and parses the data correctly so you can spend your time managing the data, performing calculations, and writing output instead of designing regular expressions and conditional logic just to properly ingest your data.
Let’s import Python’s built-in csv module and use it to process the version of the input file that contains the numbers $6,015.00 and $1,006,015.00. You’ll learn how to use the csv module and see how it handles commas within data items.
Type the following code into a text editor and save the file as 2csv_reader_parsing_and_write.py:
1#!/usr/bin/env python32importcsv3importsys4input_file=sys.argv[1]5output_file=sys.argv[2]6withopen(input_file,'r',newline='')ascsv_in_file:7withopen(output_file,'w',newline='')ascsv_out_file:8filereader=csv.reader(csv_in_file,delimiter=',')9filewriter=csv.writer(csv_out_file,delimiter=',')10forrow_listinfilereader:11(row_list)12filewriter.writerow(row_list)
As you can see, most of this code is similar to the code we wrote in the first version of this script. Therefore, I’ll only discuss the lines that are significantly different.
Line 2 imports the csv module so we can use its functions to parse the input file and write to an output file.
Line 8, the line beneath the second with statement, uses the csv module’s reader function to create a file reader object named filereader that we’ll use to read the rows in the input file. Similarly, line 9 uses the csv module’s writer function to create a file writer object called filewriter that we’ll use to write to an output file. The second argument in these functions (i.e., delimiter=',') is the default delimiter, so you do not need to include it if your input and output files are comma-delimited. I included the delimiter arguments in case you need to process an input file that has a different column delimiter or write to an output file with a different delimiter—for example, a semicolon (;) or tab (\t).
Line 12 uses the filewriter object’s writerow function to write the list of values in each row to the output file.
Assuming the input file and Python script are both saved on your Desktop and you have not changed directories in the Command Prompt or Terminal window, type the following on the command line and then hit Enter to run the script (if you are on a Mac, you’ll first need to run the chmod command on the new script to make it executable):
python 2csv_reader_parsing_and_write.py supplier_data.csv\
output_files\2output.csv
You should see the output shown in Figure 2-9 printed to the screen.
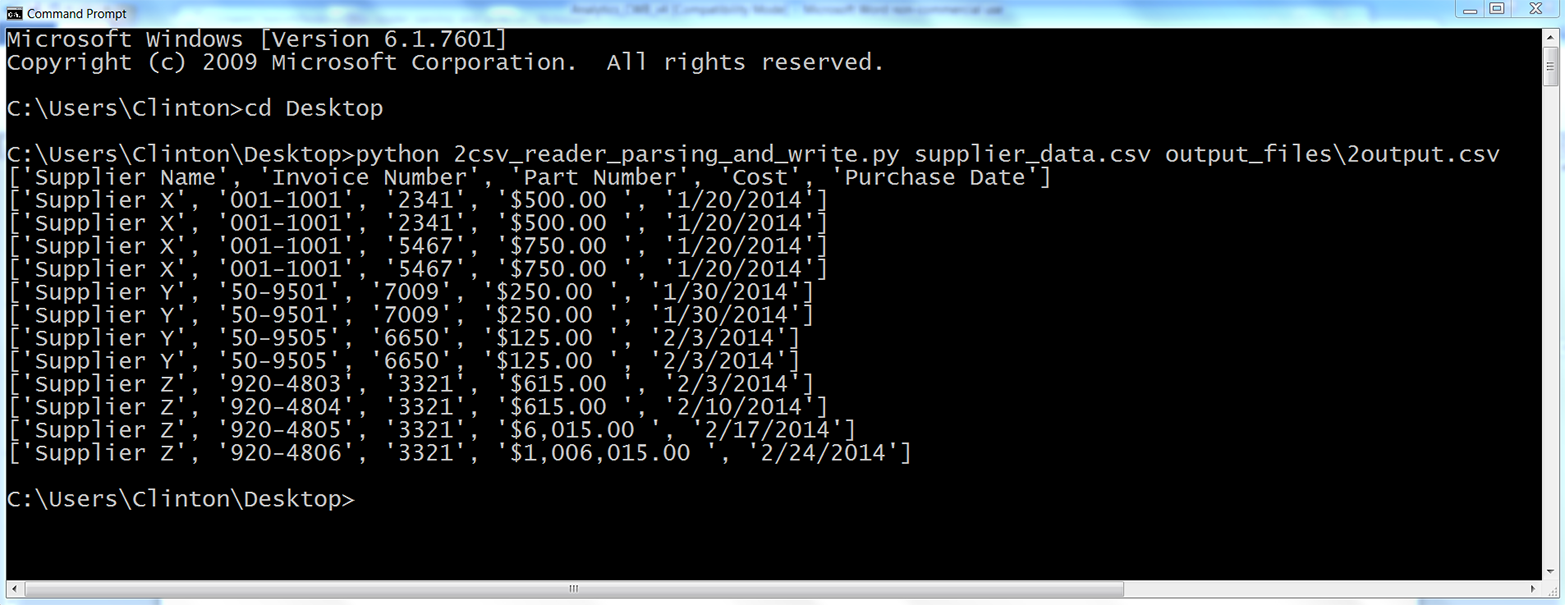
Figure 2-9. Output of running the Python script
All of the rows in the input file have been printed to the screen and written to the output file. As you can see, Python’s built-in csv module handled the embedded commas for us and correctly parsed every row into a list with five values.
Now that we know how to use the csv module to read, process, and write CSV files, let’s learn how to filter for specific rows and select specific columns so we can effectively extract the data we need.
Filter for Specific Rows
Sometimes a file contains more rows than you need. For example, you may only need a subset of rows that contain a specific word or number, or you may only need a subset of rows associated with a specific date. In these cases, you can use Python to filter for the specific rows you want to retain.
You may be familiar with how to filter rows manually in Excel, but the focus of this chapter is to broaden your capabilities so you can deal with CSV files that are too large to open in Excel and collections of CSV files that would be too time consuming to deal with manually.
The following subsections demonstrate three different ways to filter for specific rows in an input file:
-
Value in row meets a condition
-
Value in row is in a set of interest
-
Value in row matches a pattern of interest (regular expression)
You will notice that the code in these subsections has a consistent structure or format. I want to point out this common structure so it’s easy for you to identify where to modify the code to incorporate your own business rules.
Focus on the following structure in the next three subsections to understand how to filter for specific rows in an input file:
forrowinfilereader:***ifvalueinrowmeetssomebusinessruleorsetofrules:***dosomethingelse:dosomethingelse
This pseudocode shows the common structure of the code we’ll use to filter for specific rows in an input file. In the following subsections, we’ll see how to modify the line enclosed in *** to incorporate specific business rules and extract the rows you need.
Value in Row Meets a Condition
Base Python
Sometimes you need to retain rows where a value in the row meets a specific condition. For example, you may want to retain all of the rows in our dataset where the cost is above a specific threshold. Or you may want all of the rows where the purchase date is before a specific date. In these cases, you can test the row value against the specific condition and filter for the rows that meet the condition.
The following example demonstrates how to test row values against two conditions and write the subset of rows that meet the conditions to an output file. In this example, we want to retain the subset of rows where the supplier name is Supplier Z or the cost is greater than $600.00 and write the results to an output file. To filter for the subset of rows that meet these conditions, type the following code into a text editor and save the file as 3csv_reader_value_meets_condition.py:
1#!/usr/bin/env python32importcsv3importsys4input_file=sys.argv[1]5output_file=sys.argv[2]6withopen(input_file,'r',newline='')ascsv_in_file:7withopen(output_file,'w',newline='')ascsv_out_file:8filereader=csv.reader(csv_in_file)9filewriter=csv.writer(csv_out_file)10header=next(filereader)11filewriter.writerow(header)12forrow_listinfilereader:13supplier=str(row_list[0]).strip()14cost=str(row_list[3]).strip('$').replace(',','')15ifsupplier=='Supplier Z'orfloat(cost)>600.0:16filewriter.writerow(row_list)
Line 10 uses the csv module’s next function to read the first row in the input file into a list variable named header. Line 11 writes the header row to the output file.
Line 13 grabs the supplier’s name in each row and assigns it to a variable named supplier. It uses list indexing to grab the first value in each row, row[0], then it uses the str function to convert the value into a string. Next, it uses the strip function to remove spaces, tabs, and newline characters from the ends of the string. Finally, it assigns this stripped string to the variable supplier.
Line 14 grabs the cost value in each row and assigns it to a variable named cost. It uses list indexing to grab the fourth value in each row, row[3], then it uses the str function to convert the value into a string. Net, it uses the strip function to remove the dollar sign from the string. Then it uses the replace function to remove commas from the string. Finally, it assigns the resulting string to the variable cost.
Line 15 creates an if statement to test two values in each row against two conditions. Specifically, we want to filter for rows where the supplier name is Supplier Z or the cost is greater than $600.00. The first condition, between if and or, tests whether the value in the variable named supplier evaluates to Supplier Z. The second condition, between or and the colon, tests whether the value in the variable named cost, converted to a floating-point number, is greater than 600.0.
Line 16 uses the filewriter’s writerow function to write the rows that meet the conditions to the output file.
To run the script, type the following on the command line and hit Enter:
python 3csv_reader_value_meets_condition.py supplier_data.csv\
output_files\3output.csv
You won’t see any output printed to the screen, but you can open the output file, 3output.csv, to review the results. Check to make sure that they’re what you wanted—and then try modifying the code to give a different selection of data, specifying a different supplier or price threshold.
Pandas
Pandas provides the loc function for selecting specific rows and columns at the same time. You specify the row filtering condition before the comma and the column filtering condition after the comma. The conditions inside the following loc function specify that we want the rows where the name in the Supplier Name column contains a Z or the amount in the Cost column is greater than 600.0, and we want all of the columns. Type the following code into a text editor and save the file as pandas_value_meets_condition.py (this script uses pandas to parse a CSV file and write the rows that meet the conditions to an output file):
#!/usr/bin/env python3importpandasaspdimportsysinput_file=sys.argv[1]output_file=sys.argv[2]data_frame=pd.read_csv(input_file)data_frame['Cost']=data_frame['Cost'].str.strip('$').astype(float)data_frame_value_meets_condition=data_frame.loc[(data_frame['Supplier Name']\.str.contains('Z'))|(data_frame['Cost']>600.0),:]data_frame_value_meets_condition.to_csv(output_file,index=False)
Run the script from the command line, supplying the source and output files for your data:
python pandas_value_meets_condition.py supplier_data.csv\
output_files\pandas_output.csv
You won’t see any output printed to the screen, but you can open the output file, pandas_output.csv, to review the results. Play around with the parameters in the loc function to create different selections of your data.
Value in Row Is in a Set of Interest
Base Python
Sometimes you need to retain rows where a value in the row is in a set of interest. For example, you may want to retain all of the rows in our dataset where the supplier name is in the set {Supplier X, Supplier Y}. (These curly braces refer to set notation, not Python’s dictionary data structure.) Or you may want all of the rows where the purchase date is in the set {'1/20/14', '1/30/14'}. In these cases, you can test whether the row values are in the set and filter for rows with values in the set.
The following example demonstrates how to test row values against set membership and write the subset of rows with a value in the set to an output file. In this example, we want to retain the subset of rows where the purchase date is in the set {'1/20/14', '1/30/14'} and write the results to an output file. To filter for the subset of rows with values in this set, type the following code into a text editor and save the file as 4csv_reader_value_in_set.py:
1#!/usr/bin/env python32importcsv3importsys4input_file=sys.argv[1]5output_file=sys.argv[2]6important_dates=['1/20/14','1/30/14']7withopen(input_file,'r',newline='')ascsv_in_file:8withopen(output_file,'w',newline='')ascsv_out_file:9filereader=csv.reader(csv_in_file)10filewriter=csv.writer(csv_out_file)11header=next(filereader)12filewriter.writerow(header)13forrow_listinfilereader:14a_date=row_list[4]15ifa_dateinimportant_dates:16filewriter.writerow(row_list)
Line 6 creates a list variable named important_dates that contains the two dates of interest. This variable defines our set. It is helpful to create a variable that contains your values of interest and then reference the variable in your code. That way, if the values of interest change, you only have to make a change in one place (i.e., where you define the variable), and those changes will propagate throughout your code wherever you reference the variable.
Line 14 grabs the purchase date in each row and assigns the value to a variable named a_date. You can see from the row list’s index value, row[4], that the purchase date is in the fifth column.
Line 15 creates an if statement to test whether the purchase date in the variable named a_date is in the set of interest defined by important_dates. If the value is in the set of interest, the next line writes the row to the output file.
Run this script at the command line:
python 4csv_reader_value_in_set.py supplier_data.csv output_files/4output.csv
You can then open the output file, 4output.csv, to review the results.
Pandas
To filter for rows with values in a set of interest with pandas, type the following code into a text editor and save the file as pandas_value_in_set.py (this script parses a CSV file and writes the rows with values in the set of interest to an output file):
#!/usr/bin/env python3importpandasaspdimportsysinput_file=sys.argv[1]output_file=sys.argv[2]data_frame=pd.read_csv(input_file)important_dates=['1/20/14','1/30/14']data_frame_value_in_set=data_frame.loc[data_frame['Purchase Date'].\isin(important_dates),:]data_frame_value_in_set.to_csv(output_file,index=False)
The key new command here is the very succinct isin.
As before, we’ll run the script from the command line, supplying source and output filenames:
python pandas_value_in_set.py supplier_data.csv output_files\pandas_output.csv
You can then open the output file, pandas_output.csv, to review the results.
Value in Row Matches a Pattern/Regular Expression
Base Python
Sometimes you need to retain a subset of rows where a value in the row matches or contains a specific pattern (i.e., regular expression). For example, you may want to retain all of the rows in our dataset where the invoice number starts with “001-”. Or you may want all of the rows where the supplier name contains a “Y”. In these cases, you can test whether the row values match or contain the pattern and filter for rows with values that do.
The following example demonstrates how to test values against a specific pattern and write the subset of rows with a value that matches the pattern to an output file. In this example, we want to retain the subset of rows where the invoice number starts with “001-” and write the results to an output file. To filter for the subset of rows with values that match this pattern, type the following code into a text editor and save the file as 5csv_reader_value_matches_pattern.py:
1#!/usr/bin/env python32importcsv3importre4importsys5input_file=sys.argv[1]6output_file=sys.argv[2]7pattern=re.compile(r'(?P<my_pattern_group>^001-.*)',re.I)8withopen(input_file,'r',newline='')ascsv_in_file:9withopen(output_file,'w',newline='')ascsv_out_file:10filereader=csv.reader(csv_in_file)11filewriter=csv.writer(csv_out_file)12header=next(filereader)13filewriter.writerow(header)14forrow_listinfilereader:15invoice_number=row_list[1]16ifpattern.search(invoice_number):17filewriter.writerow(row_list)
Line 3 imports the regular expression (re) module so that we have access to the re module’s functions.
Line 7 uses the re module’s compile function to create a regular expression variable named pattern. If you read Chapter 1, then the contents of this function will look familiar. The r says to consider the pattern between the single quotes as a raw string.
The ?P<my_pattern_group> metacharacter captures the matched substrings in a group called <my_pattern_group> so that, if necessary, they can be printed to the screen or written to a file.
The actual pattern we are searching for is ^001-.*. The caret is a special character that says to only search for the pattern at the beginning of the string. So, the string needs to start with “001-”. The period . matches any character except a newline. So, any character except a newline can come after the “001-”. Finally, the * says to repeat the preceding character restriction zero or more times. Together, the .* combination is used to say that any characters except a newline can show up any number of times after the “001-”. To say it even more informally, “The string can contain anything after the ‘-’ and as long as the string starts with ‘001-’ it will match the regular expression.”
Finally, the re.I argument instructs the regular expression to perform case-insensitive matching. This argument is less critical in this example because the pattern is numeric, but it illustrates where to include the argument if your pattern contains characters and you want to perform case-insensitive matching.
Line 15 uses list indexing to extract the invoice number from the row and assigns it to a variable named invoice_number. In the next line, we’re going to look for the pattern in this variable.
Line 16 uses the re module’s search function to look for the pattern in the value stored in invoice_number. If the pattern appears in the value in invoice_number, then line 17 writes the row to the output file.
To run the script, type the following on the command line and hit Enter:
python 5csv_reader_value_matches_pattern.py supplier_data.csv\
output_files\5output.csv
You can then open the output file, 5output.csv, to review the results.
Pandas
To filter for rows with values that match a pattern with pandas, type the following code into a text editor and save the file as pandas_value_matches_pattern.py (this script reads a CSV file, prints the rows with values that match the pattern to the screen, and writes the same rows to an output file):
#!/usr/bin/env python3importpandasaspdimportsysinput_file=sys.argv[1]output_file=sys.argv[2]data_frame=pd.read_csv(input_file)data_frame_value_matches_pattern=data_frame.loc[data_frame['Invoice Number'].\str.startswith("001-"),:]data_frame_value_matches_pattern.to_csv(output_file,index=False)
With pandas, we can use startswith to find our data rather than the more cumbersome regular expression. To run the script, type the following on the command line and hit Enter:
python pandas_value_matches_pattern.py supplier_data.csv\
output_files\pandas_output.csv
You can then open the output file, pandas_output.csv, to review the results.
Select Specific Columns
Sometimes a file contains more columns than you need to retain. In this case, you can use Python to select only the columns that you need.
There are two common ways to select specific columns in a CSV file. The following sections demonstrate these two methods:
-
Using column index values
-
Using column headings
Column Index Values
Base Python
One way to select specific columns in a CSV file is to use the index values of the columns you want to retain. This method is effective when it is easy to identify the index values of the columns you want to retain or, when you’re processing multiple input files, when the positions of the columns are consistent (i.e., don’t change) across all of the input files. For instance, if you only need to retain the first and last columns of data, then you could use row[0] and row[-1] to write the first and last values in each row to a file.
In this example, we only want to retain the Supplier Name and Cost columns. To select these two columns using index values, type the following code into a text editor and save the file as 6csv_reader_column_by_index.py:
1#!/usr/bin/env python32importcsv3importsys4input_file=sys.argv[1]5output_file=sys.argv[2]6my_columns=[0,3]7withopen(input_file,'r',newline='')ascsv_in_file:8withopen(output_file,'w',newline='')ascsv_out_file:9filereader=csv.reader(csv_in_file)10filewriter=csv.writer(csv_out_file)11forrow_listinfilereader:12row_list_output=[]13forindex_valueinmy_columns:14row_list_output.append(row_list[index_value])15filewriter.writerow(row_list_output)
Line 6 creates a list variable named my_columns that contains the index values of the two columns we want to retain. In this example, these two index values correspond to the Supplier Name and Cost columns. Again, it is helpful to create a variable that contains your index values of interest and then reference the variable in your code. That way, if the index values of interest change you only have to make a change in one place (i.e., where you define my_columns), and the changes will propagate throughout your code wherever you reference my_columns.
Lines 12 through 15 are indented beneath the outer for loop, so they are run for every row in the input file. Line 12 creates an empty list variable called row_list_output. This variable will hold the values in each row that we want to retain. Line 13 is a for loop for iterating over the index values of interest in my_columns. Line 14 uses the list’s append function to populate row_list_output with the values in each row that have the index values defined in my_columns. Together, these three lines of code create a list containing the values in each row that we want to write to the output file. Creating a list is useful because the filewriter’s writerow method expects a sequence of strings or numbers, and our list variable row_list_output is a sequence of strings. Line 15 writes the values in row_list_output to the output file.
Again, the script executes these lines of code for every row in the input file. To make sure this sequence of operations is clear, let’s examine what happens the first time through the outer for loop. In this case, we’re operating on the first row in the input file (i.e., the header row). Line 12 creates the empty list variable row_list_output. Line 13 is a for loop that iterates through the values in my_columns.
The first time through the loop index_value equals 0, so in line 14 the append function pushes row[0] (i.e., the string Supplier Name) into row_list_output. Next, the code returns to the for loop in line 13, but this time index_value equals 3. Because index_value equals 3, in line 14 the append function pushes row[3] (i.e., the string Cost) into row_list_output. There are no more values in my_columns, so the for loop in line 13 is finished and the code moves on to line 15. Line 15 writes the list of values in row_list_output to the output file. Next, the code returns to the outer for loop in line 11 to start processing the next row in the input file.
To run the script, type the following on the command line and hit Enter:
python 6csv_reader_column_by_index.py supplier_data.csv output_files\6output.csv
You can then open the output file, 6output.csv, to review the results.
Pandas
To select columns based on their index values with pandas, type the following code into a text editor and save the file as pandas_column_by_index.py (this script reads a CSV file, prints the columns with index values zero and three to the screen, and writes the same columns to an output file):
#!/usr/bin/env python3importpandasaspdimportsysinput_file=sys.argv[1]output_file=sys.argv[2]data_frame=pd.read_csv(input_file)data_frame_column_by_index=data_frame.iloc[:,[0,3]]data_frame_column_by_index.to_csv(output_file,index=False)
Here, we’re using the iloc command to select columns based on their index position. Run the script at the command line:
python pandas_column_by_index.py supplier_data.csv\
output_files\pandas_output.csv
You can then open the output file, pandas_output.csv, to review the results.
Column Headings
Base Python
A second way to select specific columns in a CSV file is to use the column headings themselves instead of their index positions. This method is effective when it is easy to identify the headings of the columns you want to retain or, when you’re processing multiple input files, when the positions of the columns, but not their headings, vary across the input files.
For example, suppose we only want to retain the Invoice Number and Purchase Date columns. To select these two columns using column headings, type the following code into a text editor and save the file as 7csv_reader_column_by_name.py:
1#!/usr/bin/env python32importcsv3importsys4input_file=sys.argv[1]5output_file=sys.argv[2]6my_columns=['Invoice Number','Purchase Date']7my_columns_index=[]8withopen(input_file,'r',newline='')ascsv_in_file:9withopen(output_file,'w',newline='')ascsv_out_file:10filereader=csv.reader(csv_in_file)11filewriter=csv.writer(csv_out_file)12header=next(filereader,None)13forindex_valueinrange(len(header)):14ifheader[index_value]inmy_columns:15my_columns_index.append(index_value)16filewriter.writerow(my_columns)17forrow_listinfilereader:18row_list_output=[]19forindex_valueinmy_columns_index:20row_list_output.append(row_list[index_value])21filewriter.writerow(row_list_output)
The code in this example is slightly longer than that in the previous example, but all of it should look familiar. The only reason there is more code in this example is that we need to handle the header row first, separately, to identify the index values of the column headings of interest. Then we can use these index values to retain the values in each row that have the same index values as the column headings we want to retain.
Line 6 creates a list variable named my_columns that contains two string values, the names of the two columns we want to retain. Line 7 creates an empty list variable named my_columns_index that we will fill with the index values of the two columns of interest.
Line 12 uses the next function on the filereader object to read the first row from the input file into a list variable named header. Line 13 initiates a for loop over the index values of the column headings.
Line 14 uses an if statement and list indexing to test whether each column heading is in my_columns. For instance, the first time through the for loop, index_value equals 0, so the if statement tests whether header[0] (i.e., the first column heading, Supplier Name) is in my_columns. Because Supplier Name is not in my_columns, line 15 isn’t executed for this value.
The code returns to the for loop in line 13, this time setting index_value equal to 1. Next, the if statement in line 14 tests whether header[1] (i.e., the second column heading, Invoice Number) is in my_columns. Because Invoice Number is in my_columns, line 15 is executed and the index value of this column is pushed into the list my_columns_index.
The for loop continues, finally pushing the index value of the Purchase Date column into my_columns_index. Once the for loop is finished, line 16 writes the two strings in my_columns to the output file.
The code in lines 18 to 21 operates on the remaining data rows in the input file. Line 18 creates an empty list named row_list_output to hold the values in each row that we want to retain. The for loop in line 19 iterates over the index values in my_columns_index, and line 20 appends the values that have these index values in the row to row_list_output. Finally, line 21 writes the values in row_list_output to the output file.
Run the script at the command line:
python 7csv_reader_column_by_name.py supplier_data.csv output_files\7output.csv
You can then open the output file, 7output.csv, to review the results.
Pandas
To select columns based on their headings with pandas, type the following code into a text editor and save the file as pandas_column_by_name.py (this script reads a CSV file, prints the Invoice Number and Purchase Date columns to the screen, and writes the same columns to an output file):
#!/usr/bin/env python3importpandasaspdimportsysinput_file=sys.argv[1]output_file=sys.argv[2]data_frame=pd.read_csv(input_file)data_frame_column_by_name=data_frame.loc[:,['Invoice Number','Purchase Date']]data_frame_column_by_name.to_csv(output_file,index=False)
Once again, we’re using the loc command to select columns, this time with their column headers.
Run the script:
python pandas_column_by_name.py supplier_data.csv output_files\pandas_output.csv
You can then open the output file, pandas_output.csv, to review the results.
Select Contiguous Rows
Sometimes a file contains content at the top or bottom of the worksheet that you don’t want to process. For example, there may be title and authorship lines at the top of the file, or sources, assumptions, caveats, or notes listed at the bottom of the file. In many cases, we do not need to process this content.
To demonstrate how to select contiguous rows in a CSV file, we need to modify our input file:
-
Open supplier_data.csv in a spreadsheet.
-
Insert three rows at the top of the file, above the row that contains the column headings.
Add some text like “I don’t care about this line” in cells A1:A3.
-
Add three rows of text at the bottom of the file, below the last row of data.
Add some text like “I don’t want this line either” in the three cells in column A below the last row of data.
-
Save the file as supplier_data_unnecessary_header_footer.csv. It should now look like Figure 2-10
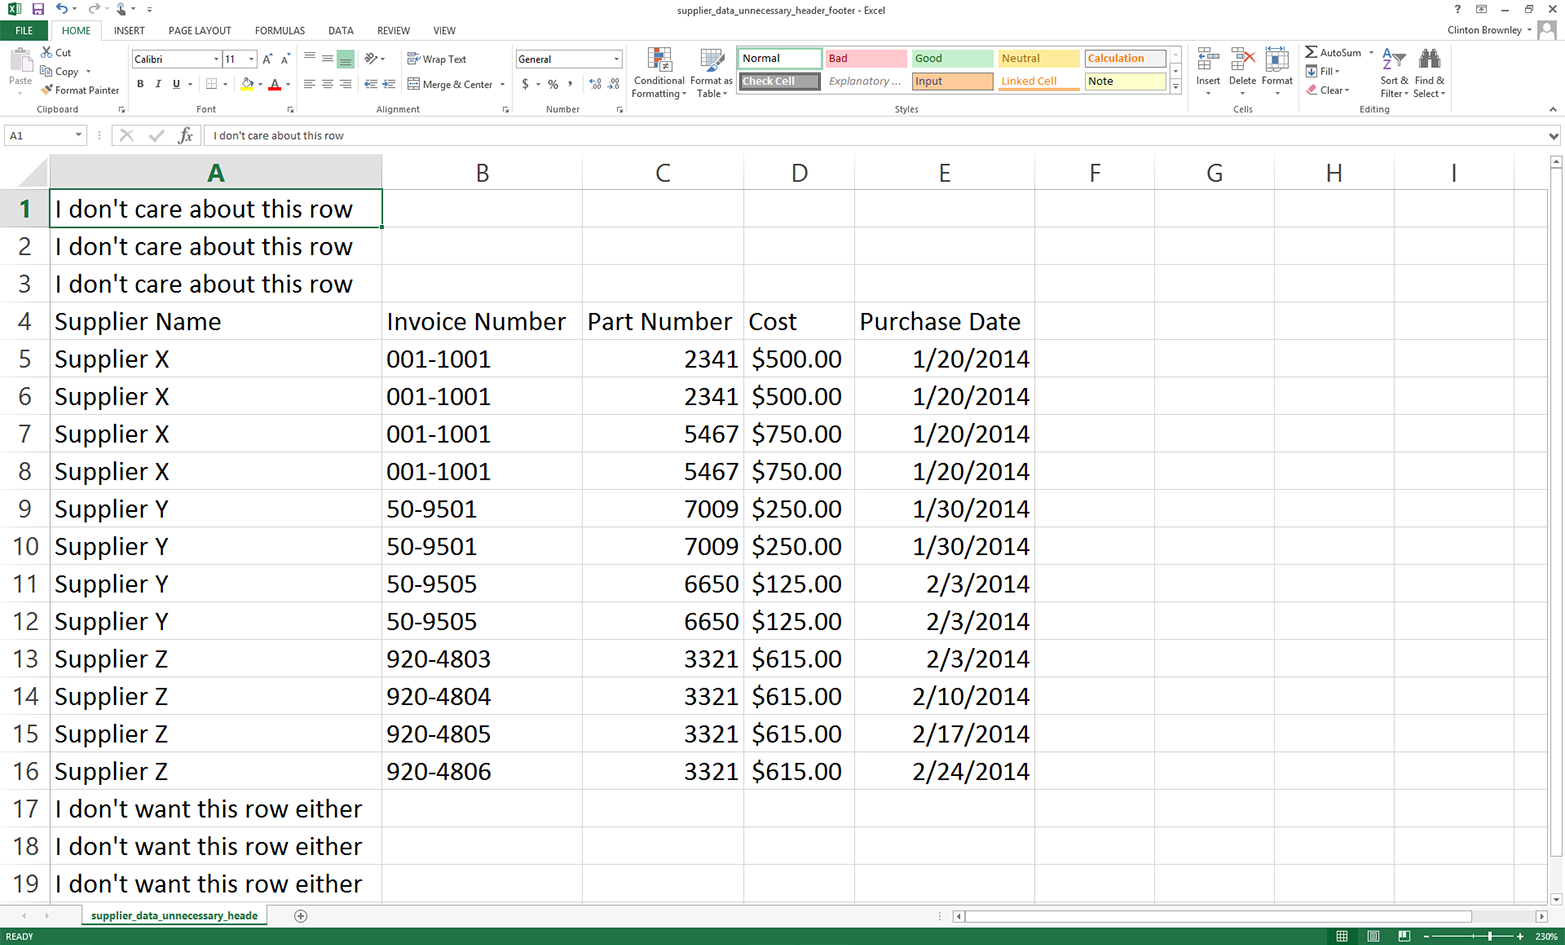
Figure 2-10. CSV file that has extraneous rows above and below the rows you want
Now that the input file contains unnecessary header and footer information, let’s modify our Python script so that it does not read these lines.
Base Python
To select specific rows with base Python, we’ll use a row_counter variable to keep track of the row numbers so we can identify and select the rows we want to retain. From the earlier examples, we already know that there are 13 rows of data we want to retain. You can see in the if block shown below that the only rows we want to write to the output file are the ones with row indexes greater than or equal to 3 and less than or equal to 15.
To select these rows with base Python, type the following code into a text editor and save the file as 11csv_reader_select_contiguous_rows.py:
1#!/usr/bin/env python32importcsv3importsys4input_file=sys.argv[1]5output_file=sys.argv[2]6row_counter=07withopen(input_file,'r',newline='')ascsv_in_file:8withopen(output_file,'w',newline='')ascsv_out_file:9filereader=csv.reader(csv_in_file)10filewriter=csv.writer(csv_out_file)11forrowinfilereader:12ifrow_counter>=3androw_counter<=15:13filewriter.writerow([value.strip()forvalueinrow])14row_counter+=115
We use the row_counter variable in combination with an if statement to retain only the rows we care about and skip the unwanted header and footer content. For the first three rows in the input file, row_counter is less than three, so the if block isn’t executed and the value in row_counter increases by one.
For the last three rows in the input file, row_counter is greater than 15, so again the if block isn’t executed and the value in row_counter increases by one.
The rows we want to retain are in between the unnecessary header and footer content. For these rows, row_counter ranges from 3 to 15. The if block processes these rows and writes them to the output file. We use the string module’s strip function in a list comprehension to remove spaces, tabs, and newline characters from both ends of each of the values in each row.
You can see the value of the row_counter variable along with the row content by adding a print statement like print(row_counter, [value.strip() for value in row]) above the existing writerow statement.
To run the script, type the following on the command line and hit Enter:
python 11csv_reader_select_contiguous_rows.py supplier_data_unnecessary_header_\
footer.csv output_files\11output.csv
You can then open the output file, 11output.csv, to review the results.
Pandas
Pandas provides the drop function for deleting rows or columns based on a row index value or column heading. In the following script, the drop function removes the first three rows and the last three rows from the input file (i.e., the rows whose indexes are 0, 1, and 2 and 16, 17, and 18). Pandas also provides the versatile iloc function, which we can use to select a single row based on its index value to make it the column index. Finally, it provides the reindex function, which we can use to conform one or more axes to new indexes.
To retain the header column row and data rows and remove the unnecessary header and footer rows with pandas, type the following code into a text editor and save the file as pandas_select_contiguous_rows.py:
#!/usr/bin/env python3importpandasaspdimportsysinput_file=sys.argv[1]output_file=sys.argv[2]data_frame=pd.read_csv(input_file,header=None)data_frame=data_frame.drop([0,1,2,16,17,18])data_frame.columns=data_frame.iloc[0]data_frame=data_frame.reindex(data_frame.index.drop(3))data_frame.to_csv(output_file,index=False)
To run the script, type the following on the command line and hit Enter:
python pandas_select_contiguous_rows.py supplier_data_unnecessary_header_\
footer.csv output_files\pandas_output.csv
You can then open the output file, pandas_output.csv, to review the results.
Add a Header Row
Sometimes a spreadsheet does not contain a header row even though you do want column headings for all of the columns. In this situation, you can add column headings with your script.
To demonstrate how to add column headings in a script, we need to modify our input file:
-
Open supplier_data.csv in a spreadsheet.
-
Delete the first row in the file (i.e., the header row that contains the column headings).
-
Save the file as supplier_data_no_header_row.csv. It should look like Figure 2-11.
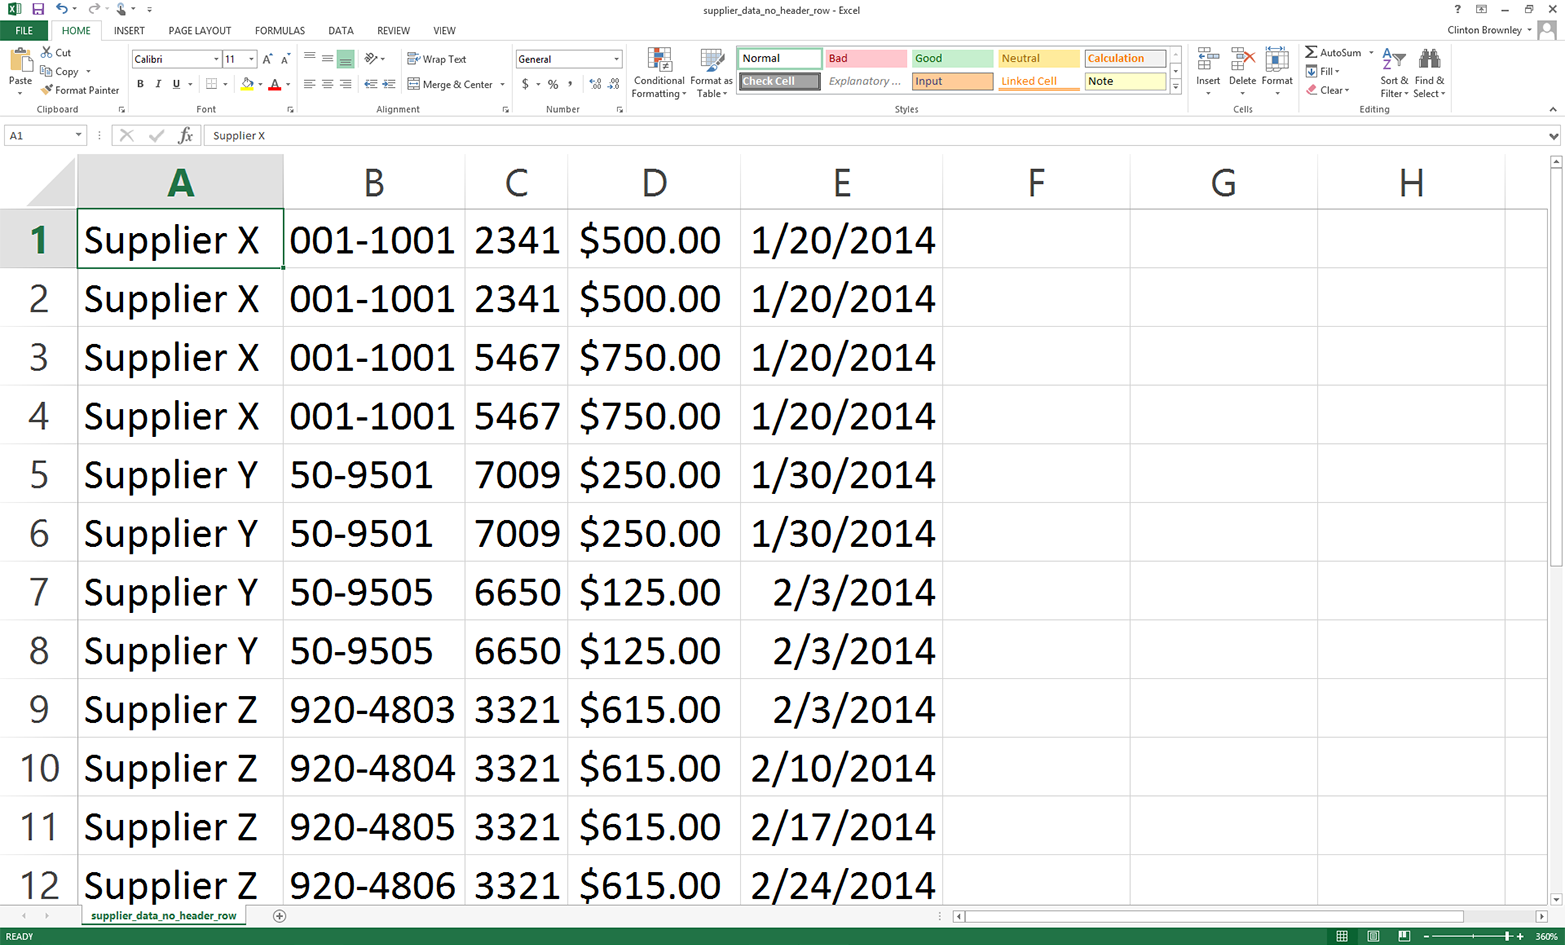
Figure 2-11. CSV file containing the data rows, but not the header row
Base Python
To add column headings in base Python, type the following code into a text editor and save the file as 12csv_reader_add_header_row.py:
1#!/usr/bin/env python32importcsv3importsys4input_file=sys.argv[1]5output_file=sys.argv[2]6withopen(input_file,'r',newline='')ascsv_in_file:7withopen(output_file,'w',newline='')ascsv_out_file:8filereader=csv.reader(csv_in_file)9filewriter=csv.writer(csv_out_file)10header_list=['Supplier Name','Invoice Number',\ 11'Part Number','Cost','Purchase Date']12filewriter.writerow(header_list)13forrowinfilereader:14filewriter.writerow(row)
Line 10 creates a list variable named header_list that contains five string values for the column headings. Line 12 writes the values in this list as the first row in the output file. Similarly, line 14 writes all of the data rows to the output file beneath the header row.
To run the script, type the following on the command line and hit Enter:
python 12csv_reader_add_header_row.py supplier_data_no_header_row.csv\
output_files\12output.csv
You can then open the output file, 12output.csv, to review the results.
Pandas
The pandas read_csv function makes it straightforward to indicate that the input file doesn’t have a header row and to supply a list of column headings. To add a header row to our dataset that doesn’t have one, type the following code into a text editor and save the file as pandas_add_header_row.py:
#!/usr/bin/env python3importpandasaspdimportsysinput_file=sys.argv[1]output_file=sys.argv[2]header_list=['Supplier Name','Invoice Number',\'Part Number','Cost','Purchase Date']data_frame=pd.read_csv(input_file,header=None,names=header_list)data_frame.to_csv(output_file,index=False)
To run the script, type the following on the command line and hit Enter:
python pandas_add_header_row.py supplier_data_no_header_row.csv\
output_files\pandas_output.csv
You can then open the output file, pandas_output.csv, to review the results.
Reading Multiple CSV Files
Up to this point in this chapter, I’ve demonstrated how to process a single CSV file. In some cases, you may only need to process one file. In these cases, the examples thus far should give you an idea of how to use Python to process the file programmatically. Even when you have just one file, the file may be too large to handle manually, and handling it programmatically can also reduce the chances of human errors such as copy/paste errors and typos.
However, in many cases, you need to process lots of files—so many files that it is inefficient or impossible to handle them manually. In these situations, Python is even more exciting because it enables you to automate and scale your data processing above and beyond what you can handle manually. This section introduces Python’s built-in glob module and builds on some of the examples shown earlier in this chapter to demonstrate how to process CSV files at scale.
In order to work with multiple CSV files, we need to create multiple CSV files. We’ll create three files to use in the following examples but remember that the techniques shown here scale to as many files as your computer can handle—hundreds or more!
- CSV file #1
-
Open a spreadsheet.
Add the data shown in Figure 2-12.
Save the file as sales_january_2014.csv.
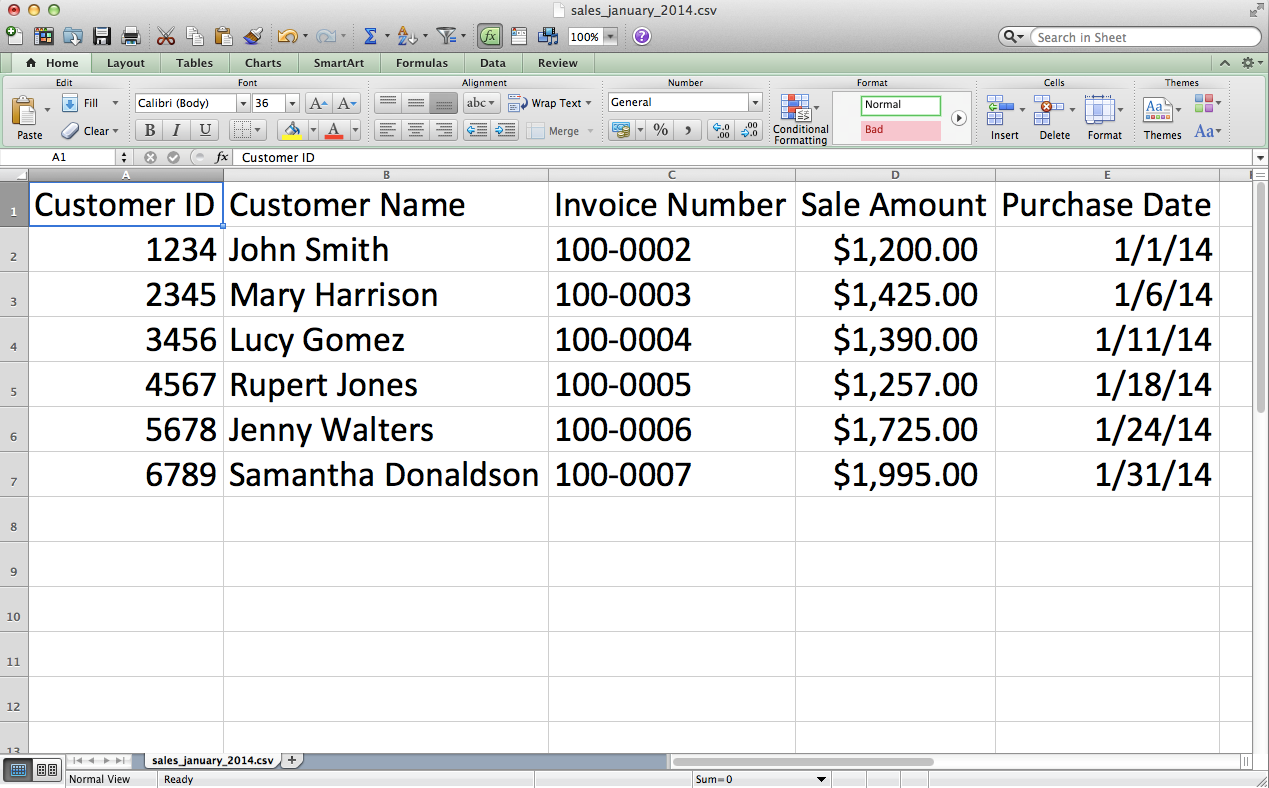
Figure 2-12. CSV file #1: sales_january_2014.csv
- CSV file #2
-
-
Open a spreadsheet.
-
Add the data shown in Figure 2-13.
-
Save the file as sales_february_2014.csv.
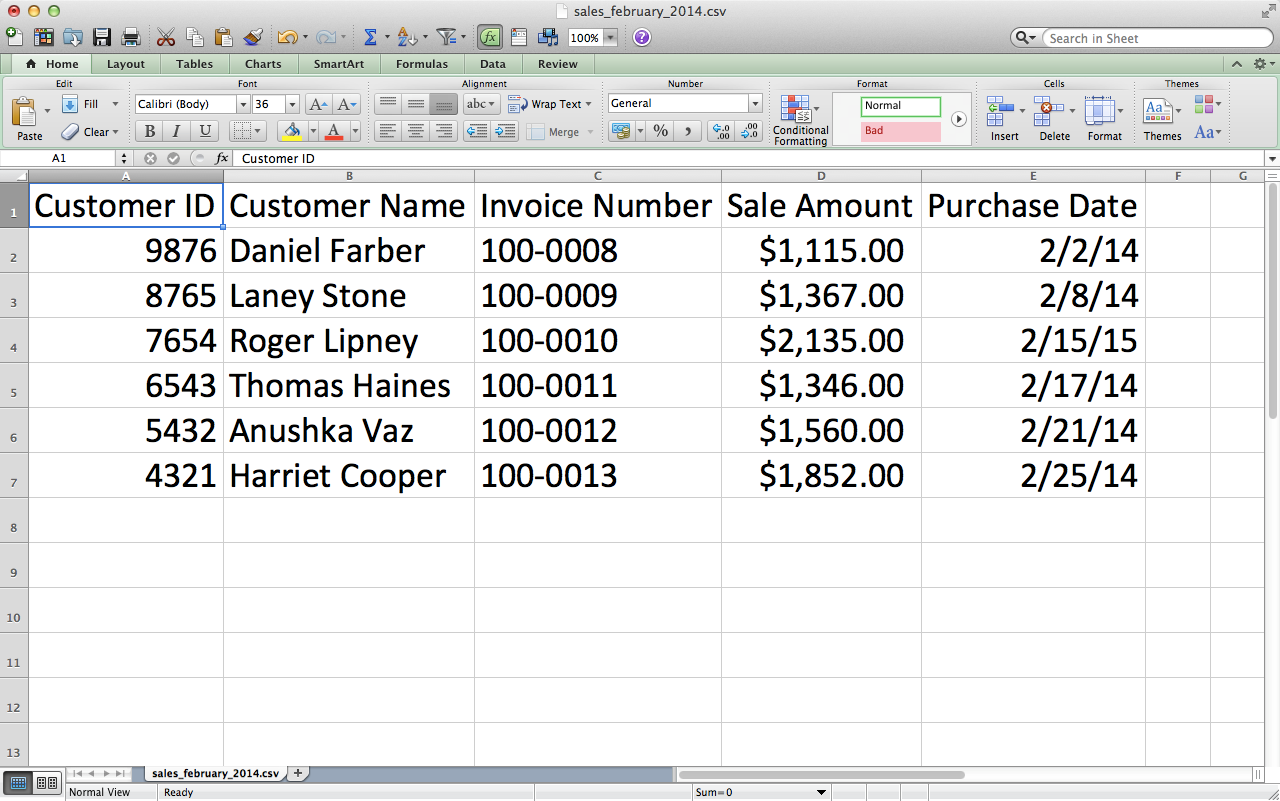
Figure 2-13. CSV file #2: sales_february_2014.csv
-
- CSV file #3
-
-
Open a spreadsheet.
-
Add the data shown in Figure 2-14.
-
Save the file as sales_march_2014.csv.
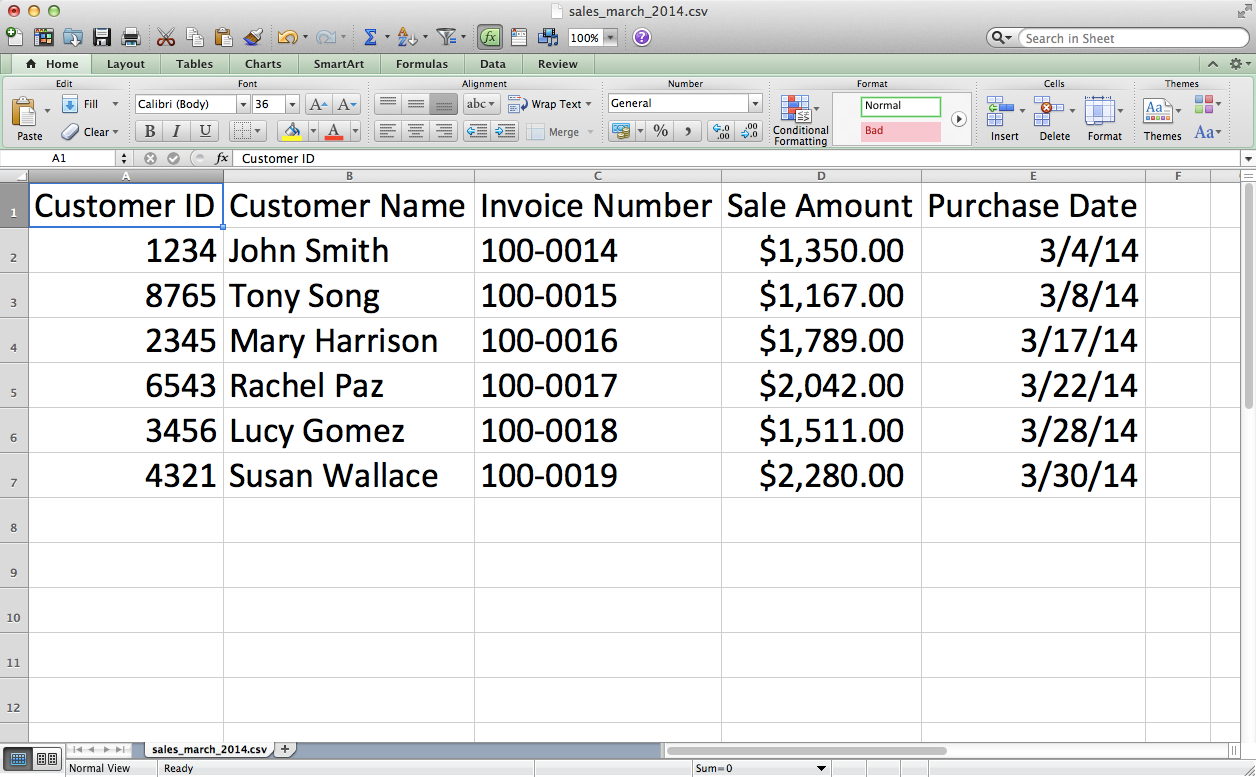
Figure 2-14. CSV file #3: sales_march_2014.csv
-
Count Number of Files and Number of Rows and Columns in Each File
Let’s start with some simple counting of rows and columns; this is pretty basic, but it’s also a good way to get a sense of a new dataset. While in some cases you may know the contents of the input files you’re dealing with, in many cases someone sends you a set of files and you don’t immediately know their contents. In these cases, it’s often helpful to count the number of files you’re dealing with and to count the number of rows and columns in each file.
To process the three CSV files you created in the previous section, type the following code into a text editor and save the file as 8csv_reader_counts_for_multiple_files.py:
1#!/usr/bin/env python32importcsv3importglob4importos5importsys6input_path=sys.argv[1]7file_counter=08forinput_fileinglob.glob(os.path.join(input_path,'sales_*')):9row_counter=110withopen(input_file,'r',newline='')ascsv_in_file:11filereader=csv.reader(csv_in_file)12header=next(filereader,None)13forrowinfilereader:14row_counter+=115('{0!s}:\t{1:d} rows\t{2:d} columns'.format(\ 16os.path.basename(input_file),row_counter,len(header)))17file_counter+=118('Number of files: {0:d}'.format(file_counter))
Lines 3 and 4 import Python’s built-in glob and os modules so we can use their functions to list and parse the pathnames of the files we want to process. The glob module locates all pathnames that match a specific pattern. The pattern can contain Unix shell–style wildcard characters like *. In this specific example, the pattern we’re looking for is 'sales_*'. This pattern means that we’re looking for all files with names that start with sales_ and then have any characters after the underscore. Because you created the three input files, you know that we’re going to use this code to identify our three input files, whose names all start with sales_ and then have different months after the underscore.
In the future, you may want to find all CSV files in a folder, rather than files that start with sales_. If so, then you can simply change the pattern in this script from 'sales_*' to '*.csv'. Because '.csv' is the pattern at the end of all CSV filenames, this pattern effectively finds all CSV files.
The os module contains useful functions for parsing pathnames. For example, os.path.basename(path) returns the basename of path. So, if path is C:\Users\Clinton\Desktop\my_input_file.csv, then os.path.basename(path) returns my_input_file.csv.
Line 8 is the key line for scaling your data processing across multiple input files. Line 8 creates a for loop for iterating through a set of input files and also uses functions from the glob and os modules to create a list of input files to be processed. There is a lot going on in this one line, so let’s review its components from the inside out. The os module’s os.path.join() function joins the two components between the function’s parentheses. input_path is the path to the folder that contains the input files, and 'sales_*' represents any filename that starts with the pattern 'sales_'.
The glob module’s glob.glob() function expands the asterisk (*) in 'sales_*' into the actual filename. In this example, glob.glob() and os.path.join() create a list of our three input files:
['C:\Users\Clinton\Desktop\sales_january_2014.csv',
'C:\Users\Clinton\Desktop\sales_february_2014.csv',
'C:\Users\Clinton\Desktop\sales_march_2014.csv']
Then the for loop syntax at the beginning of the line executes the lines of code indented beneath this line for each of the input files in this list.
Line 15 is a print statement that prints the filename, number of rows in the file, and number of columns in the file for each of the input files. The tab characters, \t, in the print statement are not necessary but help to align the three columns by placing a tab between the columns. This line uses the {} characters to pass these three values into the print statement. For the first value, we use the os.path.basename() function to extract the final element in the full pathname. For the second value, we use a row_counter variable to count the total number of rows in each input file. Finally, for the third value, we use the built-in len function to count the number of values in the list variable header, which contains the list of column headings from each input file. We use this value as the number of columns in each input file. Finally, after line 15 prints information for each file, line 17 uses the value in file_counter to display the number of files the script processed.
To run the script, type the following on the command line and hit Enter:
python 8csv_reader_counts_for_multiple_files.py "C:\Users\Clinton\Desktop"
Notice that the input on the command line after the script name is a path to a folder. In earlier examples, the input in that position was the name of the input file. In this case, we want to process many input files, so we have to point to the folder that holds all of the input files.
You should see the names of the three input files along with the number of rows and columns in each file printed to the screen. Beneath the rows of information about the three input files, the final print statement shows the total number of input files that were processed. The displayed information should look as shown in Figure 2-15.
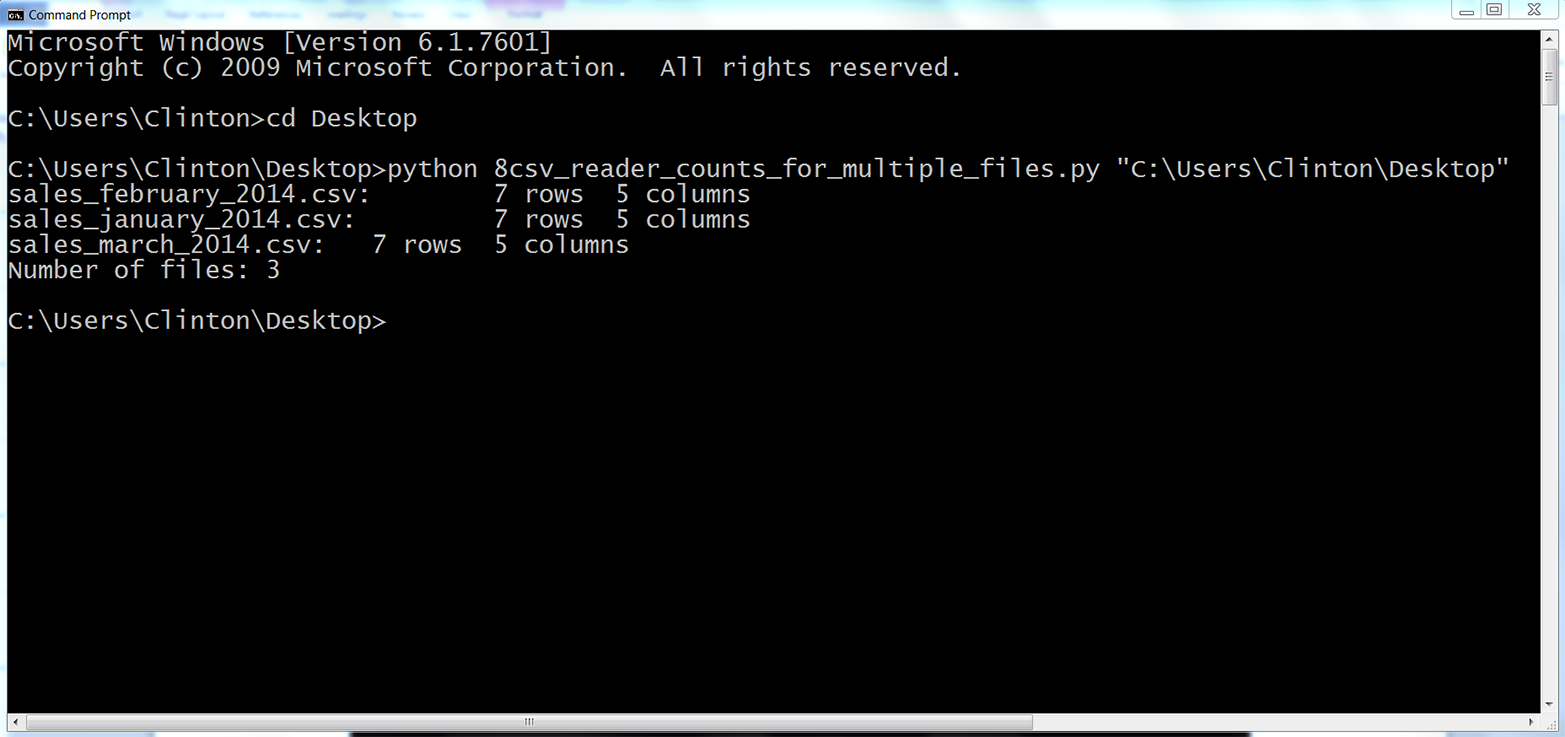
Figure 2-15. Output of Python script: number of rows and columns in three CSV files
The output shows that the script processed three files and each file has seven rows and five columns.
This example demonstrated how to read multiple CSV files and print some basic information about each of the files to the screen. Printing some basic information about files you plan to process is useful when you’re less familiar with the files you need to process. Understanding the number of input files and the number of rows and columns in each file gives you some idea about the size of the processing job, as well as the potential consistency of the file layouts.
Concatenate Data from Multiple Files
When you have multiple files that contain similar data you’ll often want to concatenate the data so that all of the data is in one file. You may have done this previously by opening each file and copying and pasting the data from each worksheet into a single worksheet. This manual process is time consuming and error prone. Moreover, in some cases, given the quantity and/or size of the files that need to be merged together, a manual process is not even possible.
Given the drawbacks of concatenating data manually, let’s see how to accomplish this task with Python. We’ll use the three CSV files we created at the beginning of this section to demonstrate how to concatenate data from multiple files.
Base Python
To concatenate data from multiple input files vertically into one output file with base Python, type the following code into a text editor and save the file as 9csv_reader_concat_rows_from_multiple_files.py:
1#!/usr/bin/env python32importcsv3importglob4importos5importsys6input_path=sys.argv[1]7output_file=sys.argv[2]8 9first_file=True10forinput_fileinglob.glob(os.path.join(input_path,'sales_*')):11(os.path.basename(input_file))12withopen(input_file,'r',newline='')ascsv_in_file:13withopen(output_file,'a',newline='')ascsv_out_file:14filereader=csv.reader(csv_in_file)15filewriter=csv.writer(csv_out_file)16iffirst_file:17forrowinfilereader:18filewriter.writerow(row)19first_file=False20else:21header=next(filereader,None)22forrowinfilereader:23filewriter.writerow(row)
Line 13 is a with statement that opens the output file. In earlier examples that involved writing to an output file, the string in the open function has been the letter 'w', meaning the output file has been opened in write mode.
In this example, we use the letter 'a' instead of 'w' to open the output file in append mode. We need to use append mode so that the data from each input file is appended to (i.e., added to) the output file. If we used write mode instead, the data from each input file would overwrite the data from the previously processed input file and the output file would only contain the data from the last input file that was processed.
The if-else statement that starts on line 16 relies on the first_file variable created in line 9 to distinguish between the first input file and all of the subsequent input files. We make this distinction between the input files so that the header row is written to the output file only once. The if block processes the first input file and writes all of the rows, including the header row, to the output file. The else block processes all of the remaining input files and uses the next method to assign the header row in each file to a variable (effectively removing it from further processing) before writing the remaining data rows to the output file.
To run the script, type the following on the command line and hit Enter:
python 9csv_reader_concat_rows_from_multiple_files.py "C:\Users\Clinton\Desktop"\
output_files\9output.csv
You should see the names of the input files printed to the screen, as shown in Figure 2-16.
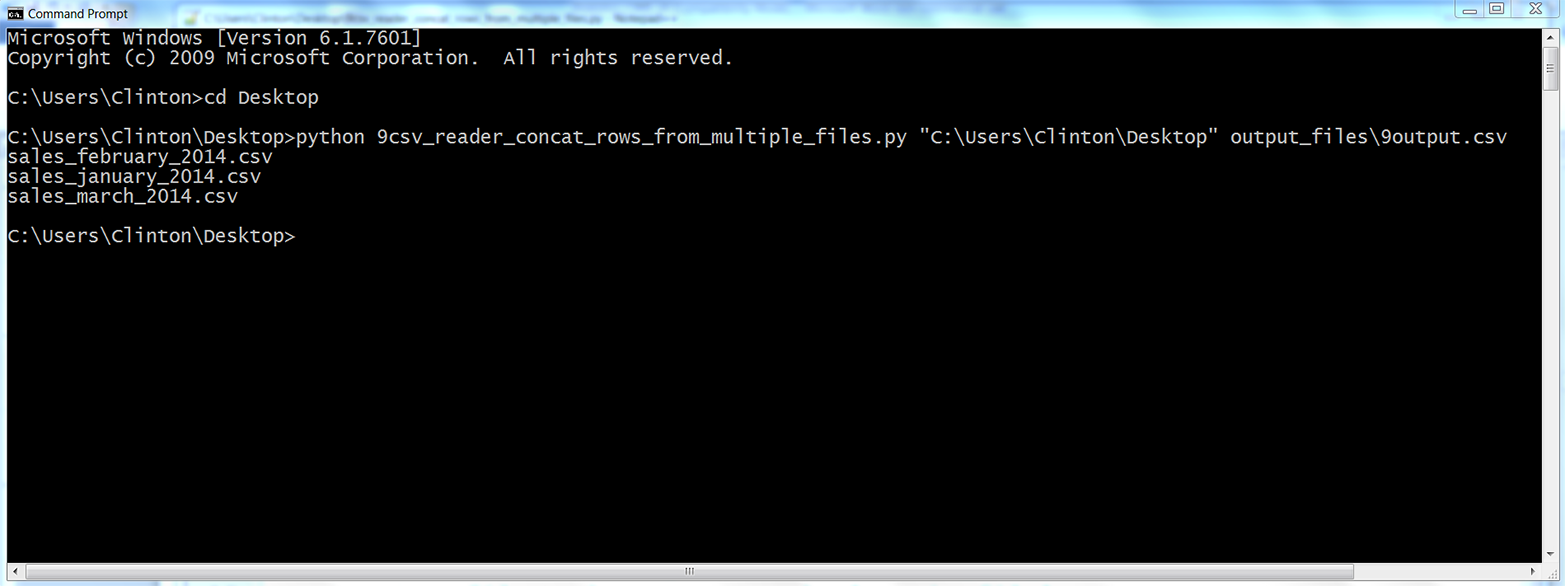
Figure 2-16. Output of Python script: names of the files concatenated into the output file
The output on the screen shows the names of the files that were processed. In addition, the script has also concatenated the data from the three input files into a single output file called 9output.csv, located in the output_files folder on your Desktop. Figure 2-17 shows what the contents should look like.
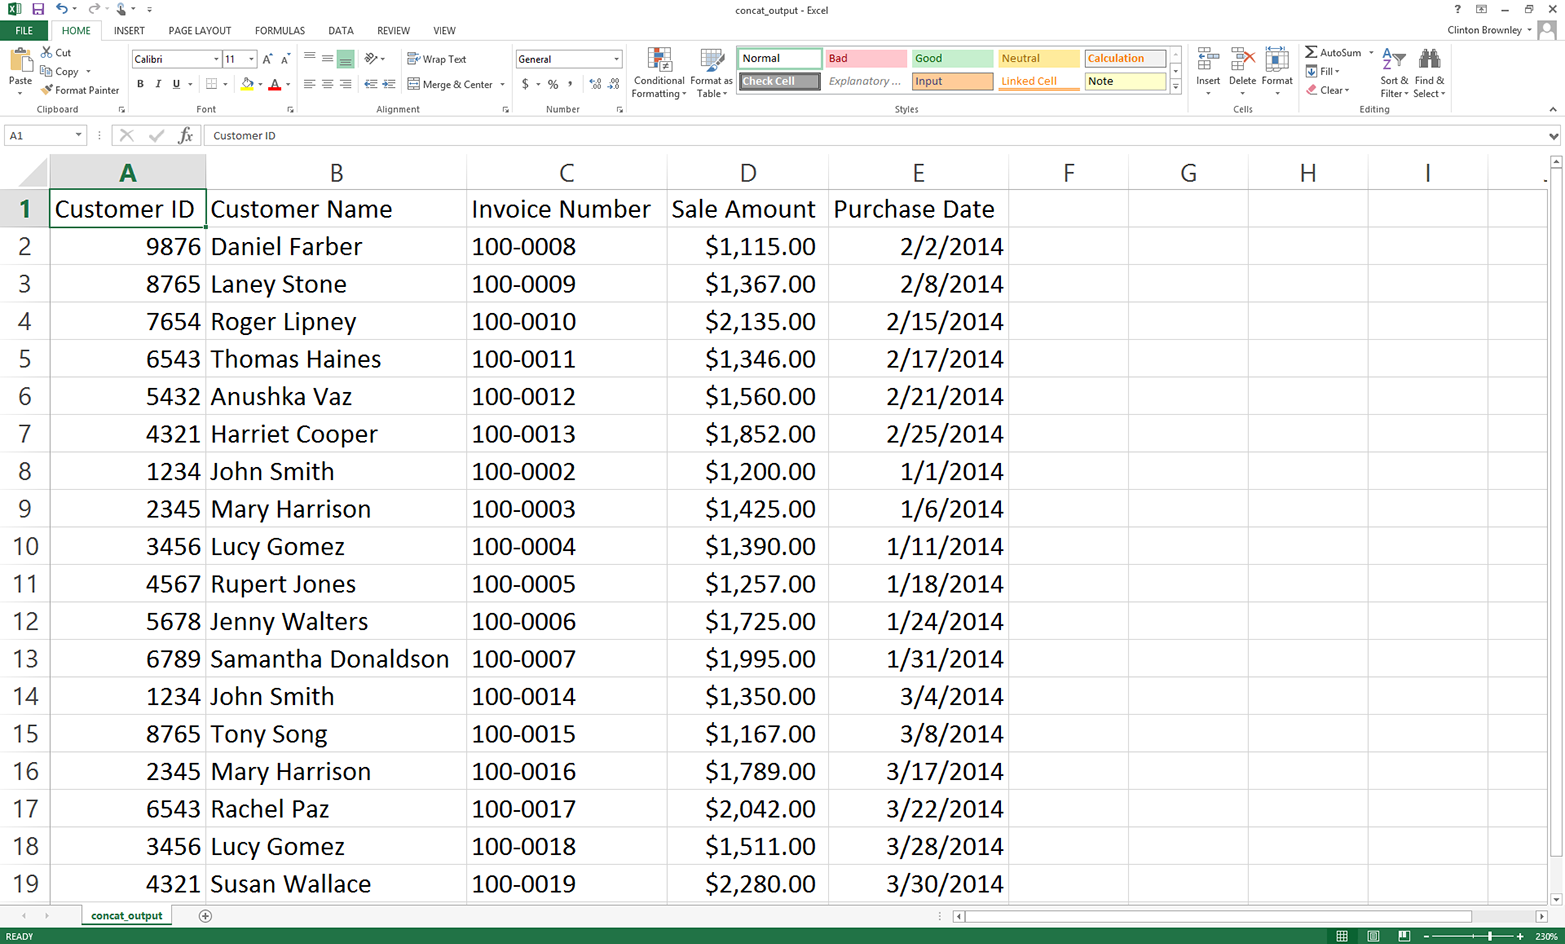
Figure 2-17. Output CSV file, which contains concatenated rows from the input files
This figure shows that the script successfully concatenated the data from the three input files. The output file contains one header row and all of the data rows from the three input files.
In the code discussion, I mentioned why we use 'a' (append mode) instead of 'w' (write mode) in line 13. I also mentioned why we distinguish between the first input file and all of the subsequent files. To experiment and learn, you may want to change the 'a' to a 'w' and then resave and rerun the script on the input files to see how the output changes. Similarly, you may want to eliminate the if-else statement and simply print all of the rows from all of the input files to see how the output changes.
One important point is that the pattern in this example, 'sales_*', is relatively specific, meaning you’re unlikely to have any files on your Desktop whose names start with ’sales_' besides the three input files. In other situations you’re more likely to use a less specific pattern, like '*.csv' to search for all CSV files. In these situations, you don’t want to create your output file in the same folder that contains all of your input files. The reason you don’t want to do this is that, in the script, you open the output file while you’re still processing input files. So, if your pattern is '*.csv' and your output file is a CSV file, then your script is going to try to process the output file like one of your input files, which is going to cause problems and errors. This possibility is why it is better practice to send an output file to a different folder, as we did in this example.
Pandas
Pandas makes it straightforward to concatenate data from multiple files. The basic process is to read each input file into a pandas DataFrame, append all of the DataFrames into a list of DataFrames, and then use the concat function to concatenate all of the DataFrames together into one DataFrame. The concat function has an axis argument you can use to specify that you want to stack the DataFrames vertically on top of one another (axis=0) or horizontally side by side (axis=1).
To concatenate data from multiple input files vertically into one output file with pandas, type the following code into a text editor and save the file as pandas_concat_rows_from_multiple_files.py:
#!/usr/bin/env python3importpandasaspdimportglobimportosimportsysinput_path=sys.argv[1]output_file=sys.argv[2]all_files=glob.glob(os.path.join(input_path,'sales_*'))all_data_frames=[]forfileinall_files:data_frame=pd.read_csv(file,index_col=None)all_data_frames.append(data_frame)data_frame_concat=pd.concat(all_data_frames,axis=0,ignore_index=True)data_frame_concat.to_csv(output_file,index=False)
This code stacks the DataFrames vertically. If instead you need to concatenate them horizontally, then set axis=1 in the concat function. In addition to a DataFrame, pandas also has a Series data container. You use identical syntax to concatenate Series, except the objects you concatenate are Series instead of DataFrames.
Sometimes, instead of simply concatenating the data vertically or horizontally, you need to join the datasets together based on the values in a key column in the datasets. Pandas offers a merge function that provides these SQL join–like operations. If you’re familiar with SQL joins, then it’ll be easy for you to pick up the merge function’s syntax: pd.merge(DataFrame1, DataFrame2, on='key', how='inner').
NumPy, another add-in Python module, also provides several functions for concatenating data vertically and horizontally. It’s conventional to import NumPy as np. Then, to concatenate data vertically, you can use np.concatenate([array1, array2], axis=0), np.vstack((array1, array2)), or np.r_[array1, array2]. Similarly, to concatenate data horizontally, you can use np.concatenate([array1, array2], axis=1), np.hstack((array1, array2)), or np.c_[array1, array2].
To run the script, type the following on the command line and hit Enter:
python pandas_concat_rows_from_multiple_files.py "C:\Users\Clinton\Desktop"\
output_files\pandas_output.csv
You can then open the output file, pandas_output.csv, to review the results.
Sum and Average a Set of Values per File
Sometimes when you have multiple input files, you need to calculate a few statistics for each input file. The example in this section uses the three CSV files we created earlier and shows how to calculate a column sum and average for each input file.
Base Python
To calculate a column sum and average for multiple files with base Python, type the following code into a text editor and save the file as 10csv_reader_sum_average_from_multiple_files:
1#!/usr/bin/env python32importcsv3importglob4importos5importsys6input_path=sys.argv[1]7output_file=sys.argv[2]8output_header_list=['file_name','total_sales','average_sales']9csv_out_file=open(output_file,'a',newline='')10filewriter=csv.writer(csv_out_file)11filewriter.writerow(output_header_list)12forinput_fileinglob.glob(os.path.join(input_path,'sales_*')):13withopen(input_file,'r',newline='')ascsv_in_file:14filereader=csv.reader(csv_in_file)15output_list=[]16output_list.append(os.path.basename(input_file))17header=next(filereader)18total_sales=0.019number_of_sales=0.020forrowinfilereader:21sale_amount=row[3]22total_sales+=float(str(sale_amount).strip('$').replace(',',''))23number_of_sales+=124average_sales='{0:.2f}'.format(total_sales/number_of_sales)25output_list.append(total_sales)26output_list.append(average_sales)27filewriter.writerow(output_list)28csv_out_file.close()
Line 8 creates a list of the column headings for the output file. Line 10 creates the filewriter object, and line 11 writes the header row to the output file.
Line 15 creates an empty list that will store each row of output that we’ll write to the output file. Because we want to calculate a sum and an average for each input file, line 16 appends the name of the input file into the output_list.
Line 17 uses the next function to remove the header row from each input file. Line 18 creates a variable named total_sales and sets its value equal to zero. Similarly, line 19 creates a variable named number_of_sales and sets its value equal to zero. Line 20 is a for loop for iterating over the data rows in each of the input files.
Line 21 uses list indexing to extract the value in the Sale Amount column and assigns it to the variable named sale_amount. Line 22 uses the str function to ensure the value in sale_amount is a string and then uses the strip and replace functions to remove any dollar signs and commas in the value. Then it uses the float function to convert the value to a floating-point number, and adds the value to the value in total_sales. Line 23 adds one to the value in number_of_sales.
Line 24 divides the value in total_sales by the value in number_of_sales to calculate the average sales for the input file and assigns this number, formatted to two decimal places and converted into a string, to the variable average_sales.
Line 25 adds the total sales as the second value in output_list. The first value in the list is the name of the input file. This value is added to the list in line 17. Line 26 adds the average sales as the third value in output_list. Line 27 writes the values in output_list to the output file.
The script executes this code for each of the input files, so the output file will contain a column of filenames, a column of total sales, and a column of average sales corresponding to each of the input files.
To run the script, type the following on the command line and hit Enter:
python 10csv_reader_sum_average_from_multiple_files.py \
"C:\Users\Clinton\Desktop" output_files\10output.csv
You can then open the output file, 10output.csv, to review the results.
Pandas
Pandas provides summary statistics functions, like sum and mean, that you can use to calculate row and column statistics. The following code demonstrates how to calculate two statistics (sum and mean) for a specific column in multiple input files and write the results for each input file to an output file.
To calculate these two column statistics with pandas, type the following code into a text editor and save the file as pandas_ sum_average_from_multiple_files.py:
#!/usr/bin/env python3importpandasaspdimportglobimportosimportsysinput_path=sys.argv[1]output_file=sys.argv[2]all_files=glob.glob(os.path.join(input_path,'sales_*'))all_data_frames=[]forinput_fileinall_files:data_frame=pd.read_csv(input_file,index_col=None)total_sales=pd.DataFrame([float(str(value).strip('$').replace(',',''))\forvalueindata_frame.loc[:,'Sale Amount']]).sum()average_sales=pd.DataFrame([float(str(value).strip('$').replace(',',''))\forvalueindata_frame.loc[:,'Sale Amount']]).mean()data={'file_name':os.path.basename(input_file),'total_sales':total_sales,'average_sales':average_sales}all_data_frames.append(pd.DataFrame(data,\columns=['file_name','total_sales','average_sales']))data_frames_concat=pd.concat(all_data_frames,axis=0,ignore_index=True)data_frames_concat.to_csv(output_file,index=False)
We use list comprehensions to convert the string dollar values in the Sale Amount column into floating-point numbers, and then we use the DataFrame function to convert the object into a DataFrame so we can use the two functions to calculate the sum and mean values for the column.
Because each row in the output file should contain the input filename, sum, and mean for the Sale Amount column in the file, we combine these three pieces of data into a DataFrame, use the concat function to concatenate all of the DataFrames together into one DataFrame, and then write the DataFrame to an output file.
To run the script, type the following on the command line and hit Enter:
python pandas_ sum_average_from_multiple_files.py "C:\Users\Clinton\Desktop"\
output_files\pandas_output.csv
You can then open the output file, pandas_output.csv, to review the results.
We’ve covered a lot of ground in this chapter. We’ve discussed how to read and parse a CSV file, navigate rows and columns in a CSV file, process multiple CSV files, and calculate statistics for multiple CSV files. If you’ve followed along with the examples in this chapter, you have written 12 Python scripts.
The best part about all of the work you have put into working through the examples in this chapter is that they are the basic building blocks for navigating and processing files. Having gone through the examples in this chapter, you’re now well prepared to process Excel files, the topic of our next chapter.
Chapter Exercises
-
Modify one of the scripts that filters for rows based on conditions, sets, or regular expressions to print and write a different set of rows than the ones we filtered for in the examples.
-
Modify one of the scripts that filters for columns based on index values or column headings to print and write a different set of columns than the ones we filtered for in the examples.
-
Create a new set of CSV input files in a folder, create a separate output folder, and use one of the scripts that processes multiple files to process the new input files and write the results to the output folder.