Table of Contents for
Learning Puppet 4
 Learning Puppet 4
Published by
O'Reilly Media, Inc., 2016
Learning Puppet 4
Published by
O'Reilly Media, Inc., 2016
- Cover
- nav
- Learning Puppet 4
- Learning Puppet 4
- Foreword
- Preface
- Introduction
- I. Controlling with Puppet Apply
- 1. Thinking Declarative
- 2. Creating a Learning Environment
- 3. Installing Puppet
- 4. Writing Manifests
- 5. Using the Puppet Configuration Language
- 6. Controlling Resource Processing
- 7. Expressing Relationships
- 8. Upgrading from Puppet 3
- 9. Wrap-Up of Puppet Basics
- II. Creating Puppet Modules
- 10. Creating a Test Environment
- 11. Separating Data from Code
- 12. Using Modules
- 13. Designing a Custom Module
- 14. Improving the Module
- 15. Extending Modules with Plugins
- 16. Documenting Modules
- 17. Testing Modules
- 18. Publishing Modules
- III. Using a Puppet Server
- 19. Preparing for a Puppet Server
- 20. Creating a Puppet Master
- 21. Creating a Puppet Server
- 22. Connecting a Node
- 23. Migrating an Existing Puppet Master
- 24. Utilizing Advantages of a Puppet Server
- 25. Managing TLS Certificates
- 26. Growing Your Puppet Deployment
- IV. Integrating Puppet
- 27. Tracking Puppet Status with Dashboards
- 28. Running the Puppet Agent on Windows
- 29. Customizing Environments
- 30. Controlling Puppet with MCollective
- 31. Managing Network Infrastructure with Puppet
- 32. Assimilating Puppet Best Practices
- 33. Finding Support Resources
- Afterword
- A. Installing Puppet on Other Platforms
- B. Configuring Firewalls on Other Platforms
- C. Installing Ruby
- Index
- About the Author
- Colophon
Chapter 27. Tracking Puppet Status with Dashboards
Puppet provides fantastic tools for managing your nodes. In a stable, well-tuned environment, Puppet is omnipresent but completely invisible. Nodes build themselves. Applications configure themselves. Everything “just works.”
Unfortunately, most of us never get all the way to that perfectly stable state. There’s always a new deployment going on, a refactoring of an older project. There’s always something that happened you want to find details for.
And let’s be honest. Everyone likes big green lights and flashing red alarms. You just can’t get away from them. So let’s cover some ways to provide a dashboard for your Puppet nodes. We’ll start by one created by Puppet Labs themselves.
Using Puppet Dashboard
Puppet Dashboard provides a web interface to browse the results of Puppet runs on your client nodes. It stores node reports in a database and provides a web UI to review those changes.
In addition, the dashboard can be used as an ENC. It provides a web interface to group nodes and associate them with classes and parameters. This can be a user-friendly interface for node classification.
Puppet Dashboard was originally a Puppet Labs product, but it has since become a community-maintained project. Within Puppet Labs the dashboard evolved to become the commercial Puppet Enterprise Console, discussed in the next section.
Some people question why anyone would use Puppet Dashboard now that PuppetDB is available. I agree that PuppetDB provides more comprehensive storage for Puppet report data. PuppetDB is a full-featured data storage solution that requires some knowledge and know-how to extract useful data. Puppet Dashboard provides a drop-in, immediately available overview in a format that is easy for service desks to see happy green and problematic red. It’s quite easy to install and get useful data from the dashboard in 30 minutes.
I know many sites that continue to use Puppet Dashboard long after deploying PuppetDB.
Installing Dashboard Dependencies
In this section, we will build a node and install the dependencies necessary for hosting Puppet Dashboard.
As with a Puppet server, you should not name the node that hosts the dashboard with the same name as the service. Puppet Dashboard is a web service that likely will end up being moved to another node at some point. Furthermore, the dashboard gets it own certificate signed by the Puppet server—separate and distinct from the key and certificate issued to the Puppet agent running on the node.
In a production installation, you would create a CNAME for the service name pointing at the node that hosts the service.
For our testing setup, the node is named dashserver while the dashboard itself will be viewable at the common service name of https://dashboard.example.com/. Both of these names are on the same line in the hosts file provided.
Starting the dashboard VM
Start up the dashboard virtual instance. This boots a machine which is named dashserver as just noted:
learning-puppet4$vagrantupdashboardBringingmachine'dashboard'upwith'virtualbox'provider...==>puppetserver:Importingbasebox'puppetlabs/centos-7.2-64-nocm'...==>puppetserver:MatchingMACaddressforNATnetworking...==>puppetserver:Checkingifbox'puppetlabs/centos-7.2-64-nocm'isuptodate...==>puppetserver:SettingthenameoftheVM:learning-puppet4_dashboard_144075009...snip...learning-puppet4$vagrantsshdashboard[vagrant@dashserver~]$
As this is a new virtual instance, install the necessary utilities and a text editor of choice, as you did back in Chapter 2:
$sudoyuminstallrsyncgitvimnanoemacs-nox
Preparing the database
First, we’ll install a database in which dashboard will store node reports and node classification.
Note
I have chosen to cover the MySQL installation as more people use Puppet Dashboard with MySQL today, and thus it has been better tested. It is also possible to use PostgreSQL with the dashboard.CentOS 7 uses the MariaDB fork of MySQL by MySQL’s original creator, rather than the version maintained by Oracle. If you are using a different OS, the package used in the next command might be mysql-server:
[vagrant@dashserver~]$sudoyuminstall-ymariadb-serverLoadedplugins:fastestmirror...snip...Installed:mariadb-server.x86_641:5.5.44-1.el7_1DependencyInstalled:mariadb.x86_641:5.5.44-1.el7_1mariadb-libs.x86_641:5.5.44-1.el7_1libaio.x86_640:0.3.109-12.el7perl-Compress-Raw-Bzip2.x86_640:2.061-3.el7perl-Compress-Raw-Zlib.x86_641:2.061-4.el7perl-DBD-MySQL.x86_640:4.023-5.el7perl-DBI.x86_640:1.627-4.el7perl-Data-Dumper.x86_640:2.145-3.el7perl-IO-Compress.noarch0:2.061-2.el7perl-Net-Daemon.noarch0:0.48-5.el7perl-PlRPC.noarch0:0.2020-14.el7Complete!
The very first thing to do is to enable security for the database. Start the database and run the script shown here to secure your installation. The following output is shortened for brevity, but shows all of the prompts that you need to answer:
[vagrant@dashserver~]$sudosystemctlstartmariadb[vagrant@dashserver~]$/usr/bin/mysql_secure_installationEntercurrentpasswordforroot(enterfornone):[HITENTER]OK,successfullyusedpassword,movingon...Setrootpassword?[Y/n]yNewpassword:somethingsecretRe-enternewpassword:somethingsecretPasswordupdatedsuccessfully!Reloadingprivilegetables.....Success!Removeanonymoususers?[Y/n]y...Success!Disallowrootloginremotely?[Y/n]y...Success!Removetestdatabaseandaccesstoit?[Y/n]y-Droppingtestdatabase......Success!-Removingprivilegesontestdatabase......Success!Reloadprivilegetablesnow?[Y/n]y...Success!
Now we need to create a database and user for Puppet Dashboard to use. We’ll log in as the root user to create the new database and user. During login, provide the same password you used in the previous step, where it said something secret. Provide a different password for the dashboard user you are creating here:
[vagrant@dashserver ~]$ mysql -u root -p
Enter password: password you entered above
Welcome to the MariaDB monitor.  Commands end with ; or \g.
Type 'help;' or '\h' for help. Type '\c' to clear the current input statement.

MariaDB [(none)]> CREATE DATABASE dashboard_production CHARACTER SET utf8;
Query OK, 1 row affected (0.01 sec)

MariaDB [(none)]> GRANT all ON dashboard_production.*
     TO dashboard@localhost IDENTIFIED BY 'PickYourOwnPassword';
Query OK, 0 rows affected (0.00 sec)

MariaDB [(none)]> quit
Bye
We need to expand max_allowed_packet to 32 megabytes. We do so with the following command (typed exactly as printed):
[vagrant@dashserver~]$sudosed-i.bak/etc/my.cnf.d/server.cnf\-e's/\[mysqld\]/[mysqld]\nmax_allowed_packet = 32M/'
Or you can edit the file by hand if you prefer. Ensure it contains this:
[mysqld]max_allowed_packet=32M
Finally, restart mariadb to pick up the changes:
[vagrant@dashserver~]$sudosystemctlrestartmariadb[vagrant@dashserver~]$sudosystemctlstatusmariadbmariadb.service-MariaDBdatabaseserverLoaded:loaded(/usr/lib/systemd/system/mariadb.service;disabled)Active:active(running)sinceFri2015-08-2809:06:29UTC;6sagoProcess:4222ExecStartPost=/usr/libexec/mariadb-wait-ready$MAINPIDProcess:4193ExecStartPre=/usr/libexec/mariadb-prepare-db-dir%nMainPID:4221(mysqld_safe)CGroup:/system.slice/mariadb.service├─4221/bin/sh/usr/bin/mysqld_safe--basedir=/usr└─4391/usr/libexec/mysqld--basedir=/usr--datadir=/var/lib/mysql--plugin-dir=/usr/lib64/mysql/plugin--log-error=/var/log/mariadb/mariadb--pid-file=/var/run/mariadb/mariadb.pid--socket=/var/lib/mysql/mysql.socksystemd[1]:StartingMariaDBdatabaseserver...mysqld_safe[4221]:Loggingto'/var/log/mariadb/mariadb.log'.mysqld_safe[4221]:Startingmysqlddaemonwithdatabasesfrom/var/lib/mysqlsystemd[1]:StartedMariaDBdatabaseserver.
At this point we have installed, secured, and configured MySQL appropriately for Puppet Dashboard.
Ensuring dependencies
One of the reasons I recommend putting Puppet Dashboard on a separate server is because it has a tremendous amount of dependencies. We’re going to install many of them now.
Our first step is to install the EPEL package repository:
[vagrant@puppetmaster~]$sudoyuminstall-yepel-release
Puppet Dashboard is a Rails application, so we need to install Ruby, RubyGems, Rake, and Bundler:
[vagrant@dashserver~]$sudoyum-yinstallrubyruby-develrakerubygem-bundlerLoadedplugins:fastestmirror…snip…Installed:ruby.x86_640:2.0.0.598-25.el7_1ruby-devel.x86_640:2.0.0.598-25.el7_1rubygem-bundler.noarch0:1.3.1-3.el7rubygem-rake.noarch0:0.9.6-25.el7_1DependencyInstalled:libyaml.x86_640:0.1.4-11.el7_0ruby-irb.noarch0:2.0.0.598-25.el7_1ruby-libs.x86_640:2.0.0.598-25.el7_1rubygem-bigdecimal.x86_640:1.2.0-25.el7_1rubygem-json.x86_640:1.7.7-25.el7_1rubygem-io-console.x86_640:0.4.2-25.el7_1rubygem-psych.x86_640:2.0.0-25.el7_1rubygems.noarch0:2.0.14-25.el7_1rubygem-rdoc.noarch0:4.0.0-25.el7_1rubygem-thor.noarch0:0.17.0-3.el7rubygem-net-http-persistent.noarch0:2.8-5.el7Complete!
We’ll need compilers and a JavaScript runtime installed to build native binaries for some extensions. Install the gcc-c++ and nodejs packages to get the necessary tools:
[vagrant@dashserver~]$sudoyum-yinstallgcc-c++nodejsLoadedplugins:fastestmirror…snip…Installed:gcc-c++.x86_640:4.8.3-9.el7nodejs.x86_640:0.10.36-3.el7DependencyInstalled:c-ares.x86_640:1.10.0-3.el7libstdc++-devel.x86_640:4.8.3-9.el7libuv.x86_641:0.10.34-1.el7v8.x86_641:3.14.5.10-17.el7http-parser.x86_640:2.0-4.20121128gitcd01361.el7DependencyUpdated:cpp.x86_640:4.8.3-9.el7gcc.x86_640:4.8.3-9.el7libgcc.x86_640:4.8.3-9.el7libgomp.x86_640:4.8.3-9.el7libstdc++.x86_640:4.8.3-9.el7Complete!
It also depends on having the MySQL, PostgreSQL, SQLite, and XML development libraries available. You can install them like so:
[vagrant@dashserver~]$sudoyum-yinstallmariadb-devel\libxml2-devellibxslt-develsqlite-develLoadedplugins:fastestmirror…snip…Installed:libxslt-devel.x86_640:1.1.28-5.el7libxml2-devel.x86_640:2.9.1-5.el7_1.2mariadb-devel.x86_641:5.5.44-1.el7_1sqlite-devel.x86_640:3.7.17-6.el7_1.1DependencyInstalled:zlib-devel.x86_640:1.2.7-13.el7libgcrypt-devel.x86_640:1.5.3-12.el7_1krb5-devel.x86_640:1.12.2-14.el7libcom_err-devel.x86_640:1.42.9-7.el7libselinux-devel.x86_640:2.2.2-6.el7libgpg-error-devel.x86_640:1.12-3.el7libsepol-devel.x86_640:2.1.9-3.el7libverto-devel.x86_640:0.2.5-4.el7libxslt.x86_640:1.1.28-5.el7openssl-devel.x86_641:1.0.1e-42.el7.9pcre-devel.x86_640:8.32-14.el7xz-devel.x86_640:5.1.2-9alpha.el7keyutils-libs-devel.x86_640:1.5.8-3.el7DependencyUpdated:e2fsprogs.x86_640:1.42.9-7.el7e2fsprogs-libs.x86_640:1.42.9-7.el7krb5-libs.x86_640:1.12.2-14.el7libcom_err.x86_640:1.42.9-7.el7libgcrypt.x86_640:1.5.3-12.el7_1.1libxml2.x86_640:2.9.1-5.el7_1.2libss.x86_640:1.42.9-7.el7openssl.x86_641:1.0.1e-42.el7.9openssl-libs.x86_641:1.0.1e-42.el7.9pcre.x86_640:8.32-14.el7sqlite.x86_640:3.7.17-6.el7_1.1xz.x86_640:5.1.2-9alpha.el7xz-libs.x86_640:5.1.2-9alpha.el7Complete!
Installing Apache for Puppet Dashboard
To run the dashboard under Passenger, we’ll use Apache httpd to provide the base web service. Install Apache httpd, the Apache development tools, and the TLS module as follows:
[vagrant@dashserver~]$sudoyuminstall-yhttpdhttpd-develmod_sslLoadedplugins:fastestmirror...snip...Installed:httpd.x86_640:2.4.6-31.el7.centoshttpd-devel.x86_640:2.4.6-31.el7.centosmod_ssl.x86_641:2.4.6-31.el7.centosDependencyInstalled:apr.x86_640:1.4.8-3.el7apr-devel.x86_640:1.4.8-3.el7apr-util.x86_640:1.5.2-6.el7apr-util-devel.x86_640:1.5.2-6.el7cyrus-sasl.x86_640:2.1.26-17.el7cyrus-sasl-devel.x86_640:2.1.26-17.el7expat-devel.x86_640:2.1.0-8.el7httpd-tools.x86_640:2.4.6-31.el7.centosmailcap.noarch0:2.1.41-2.el7openldap-devel.x86_640:2.4.39-6.el7libdb-devel.x86_640:5.3.21-17.el7_0.1Complete!
Installing Passenger for Puppet Dashboard
Phusion provides a Yum repo with Passenger binaries. They don’t provide a release RPM, just the repo configuration file. Download and install it with the following commands:
[vagrant@dashserver~]$curl-sSLopassenger.repo\https://oss-binaries.phusionpassenger.com/yum/definitions/el-passenger.repo[vagrant@dashserver~]$sudomvpassenger.repo/etc/yum.repos.d/passenger.repo
Now install Passenger and the Passenger module for Apache:
$sudoyuminstall-ypassengermod_passengerLoadedplugins:fastestmirror...snip...Installed:passenger.x86_640:5.0.16-8.el7mod_passenger.x86_640:5.0.16-8.el7DependencyInstalled:rubygem-rack.noarch1:1.5.2-4.el7
Start up Apache and confirm that the Phusion Passenger configuration is correct:
$sudosystemctlenablehttpdln-s'/usr/lib/systemd/system/httpd.service''/etc/systemd/system/multi-user.target.wants/httpd.service'$sudosystemctlstarthttpd$sudopassenger-configvalidate-install--validate-apache2--auto*CheckingwhetherthisPassengerinstallisinPATH...✓*CheckingwhethertherearenootherPassengerinstallations...✓*CheckingwhetherApacheisinstalled...✓*CheckingwhetherthePassengermoduleiscorrectlyconfiguredinApache...✓Everythinglooksgood.:-)
At this point, the system is prepared for the dashboard to be installed.
Configuring Firewall for Puppet Dashboard
Next, we need to adjust the firewall on the server. Puppet servers will connect to the dashboard to deliver reports. System administrators and DevOps engineers will also browse the results using a web browser:
[dashboard~]$sudofirewall-cmd--permanent--zone=public--add-port=80/tcpsuccess[dashboard~]$sudofirewall-cmd--permanent--zone=public--add-port=443/tcpsuccess[dashboard~]$sudofirewall-cmd--permanent--zone=public--add-port=3000/tcpsuccess[dashboard~]$sudofirewall-cmd--reloadsuccess
Tip
It is safe for you to run these commands on a virtual host running on your personal workstation. In a production setting, you’d want to limit access to specific IP networks.Enabling the Puppet agent on Puppet Dashboard
At this point, we should add the dashserver node to the Puppet server, to take advantage of the configuration management available. Connect to the server using this command:
[vagrant@dashserver~]$puppetagent--test--server=puppet.example.comInfo:CreatinganewSSLkeyfordashserver.example.comInfo:CachingcertificateforcaInfo:csr_attributesfileloadingfrom/etc/puppetlabs/puppet/csr_attributes.yamlInfo:CreatinganewSSLcertificaterequestfordashserver.example.comInfo:CertificateRequestfingerprint(SHA256):4A:25:F1:3A:B5:DC:0F:64:CC...Info:CachingcertificateforcaExiting;nocertificatefoundandwaitforcertisdisabled
When the command succeeds, you’ll need to log in to the Puppet server and sign the certificate, as done in Part III and shown here:
[vagrant@puppetserver~]$puppetcert--signdashserver.example.comNotice:Signedcertificaterequestfordashserver.example.comNotice:RemovingfilePuppet::SSL::CertificateRequestdashserver.example.comat'/var/opt/puppetlabs/puppetserver/ssl/ca/requests/dashserver.example.com.pem'
Rerun the puppet agent command on the dashboard server, and your node will receive the Puppet configuration you built in Part II.
Enabling Puppet Dashboard
At this point, we will download and configure the Puppet Dashboard Rails application.
Puppet Dashboard requires no special permissions on the node. Therefore we will create a puppet-dashboard user, and complete the setup using that user account.
Installing Puppet Dashboard
Create a puppet-dashboard user account. You can place the home directory anywhere you want, but /usr/share/puppet-dashboard and /opt/puppet-dashboard are the most common places. For the following example, I have chosen the home directory in /opt/puppet-dashboard. Give useradd the -m option to create the home directory, for reasons I’ll explain shortly:
[vagrant@dashserver~]$sudouseradd-d/opt/puppet-dashboard-mpuppet-dashboard
At this point, we want to become the dashboard user. All further installation steps will be done as the dashboard user. We want all the files installed to be owned by the dashboard user, and operating as that user guarantees that.
The first thing we’ll need to do is fix the permissions and remove all files from the application root. Run the following commands:
[vagrant@dashserver~]$sudosu-puppet-dashboard[puppet-dashboard@dashserver~]$chmod755/opt/puppet-dashboard[puppet-dashboard@dashserver~]$rm.[a-z]*[puppet-dashboard@dashserver~]$ls-latotal0drwx------2puppet-dashboardpuppet-dashboard6Aug2906:38.drwxr-xr-x.4rootroot61Aug2906:38..
The directory must be empty or the following git clone operation will fail. As the dashboard user we’re going to clone the puppet-dashboard Git repository into this directory:
$gitclonehttps://github.com/sodabrew/puppet-dashboard.git./Cloninginto'.'...remote:Countingobjects:24226,done.remote:Total24226(delta0),reused0(delta0),pack-reused24226Receivingobjects:100%(24226/24226),13.54MiB|5.41MiB/s,done.Resolvingdeltas:100%(12058/12058),done.
At this point, we have a complete installation of Puppet Dashboard in an appropriate installation directory. Now run bundler to install the Ruby gems upon which the Dashboard depends. As you’ll see, it installs many, many gems. Bundler will install the dependencies within the dashboard user’s home directory, and not pollute the system paths:
[puppet-dashboard@dashserver~]$bundleinstall--deployment--withoutpostgresqlFetchinggemmetadatafromhttps://rubygems.org/...........Usingrake(0.9.6)Installingi18n(0.6.11)Installingmulti_json(1.10.1)Installingactivesupport(3.2.21)…snip…Installinguglifier(1.3.0)Installingwill_paginate(3.0.7)Yourbundleiscomplete!Itwasinstalledinto./vendor/bundle
We have installed Puppet Dashboard and its dependencies into the /opt/puppet-dashboard directory. Next, we’ll configure the dashboard and initialize the database.
Configuring Puppet Dashboard
To configure Puppet Dashboard, you’ll need to modify two configuration files. The first file is /opt/puppet-dashboard/config/database.yml. You can copy this from the example and then edit it, or simply create it in the format shown here:
[puppet-dashboard@dashserver~]$cdconfig/[puppet-dashboard@dashserverconfig]$cpdatabase.yml.exampledatabase.yml[puppet-dashboard@dashserverconfig]$$EDITORdatabase.yml[puppet-dashboard@dashserverconfig]$catdatabase.ymlproduction:adapter:mysql2database:dashboard_productionusername:dashboardpassword:thepasswordyouspecifiedforthedashboarduserencoding:utf8[puppet-dashboard@dashserverconfig]$chmod0440database.yml
As you can see, the database config file contains the database type, username, and password. The chmod command ensures that it is only readable by the dashboard user.
The second file is /opt/puppet-dashboard/config/settings.yml. You should copy this much more extensive file from the example and then edit it:
[puppet-dashboard@dashserverconfig]$cpsettings.yml.examplesettings.yml[puppet-dashboard@dashserverconfig]$$EDITORsettings.yml
There are only five settings you must change, which I’ve shown here (obviously you should change the names to match your own domain if you aren’t using example.com to learn):
# CN that is used in Dashboard's certificate.cn_name:'dashboard.example.com'# Hostname of the certificate authority.ca_server:'puppet.example.com'# Hostname of the inventory server.inventory_server:'puppet.example.com'# Hostname of the file bucket server.file_bucket_server:'puppet.example.com'disable_legacy_report_upload_url:true
If you want the dashboard to show times in a specific time zone, uncomment this line and set the appropriate environment:
# Uncomment the following line to set a local time zone. Run# "rake time:zones:local" for the name of your local time zone.#time_zone: 'Pacific Time (US & Canada)'
You can add custom links to the top bar of the dashboard by uncommenting and editing the following lines (this can be useful to direct people to other useful services):
# Adds optional custom links in the top bar of puppet dashboard.# Example that will add two links:#custom_links:# -# href: /link/href# title: The title that will be displayed# -# href: /node_groups/1# title: Special group
Puppet Dashboard can be used as an ENC. This allows you to assign configuration classes (modules) to hosts from the dashboard web interface. If you only intend to use the dashboard to review node status and reports, you should enable the read_only_mode setting. If you intend to use the dashboard as an ENC, this setting must be set to false:
# Disables the UI and controller actions for editing nodes, classes,# groups and reports. Report submission is still allowedenable_read_only_mode:true
Tip
Puppet Dashboard doesn’t provide a history of changes to the node configuration. Most people feel this makes it unsuitable for tracking change in production environments. Best practice is to enable theenable_read_only_mode setting, and use a different ENC that provides an audit trail.Finally, delete this next-to-last line with the secret token, as you’ll be generating a unique one to use:
# Generate a new secret_token for production use!secret_token:'b1bbd28f6f9ebfc25f09da9bff4....
Generate a new secret key and add it to the configuration file:
[puppet-dashboard@dashserverconfig]$cd../[puppet-dashboard@dashserver~]$exportRAILS_ENV=production[puppet-dashboard@dashserver~]$echo"secret_token: \ '$(bundleexecrakesecret)'">>config/settings.yml
Defining the Puppet Dashboard schema
There is a Rake task that populates the MySQL database with the appropriate schema (database tables and columns) for Puppet Dashboard. This task produces a lot of output that may not make a lot of sense. However, it will complain loudly if it fails for any reason:
[puppet-dashboard@dashserver~]$bundleexecrakedb:setupdashboard_productionalreadyexists--create_table("delayed_job_failures",{:force=>true})->0.0104s--create_table("delayed_jobs",{:force=>true})->0.0019s--add_index("delayed_jobs",["failed_at","run_at","locked_at",…snip…--initialize_schema_migrations_table()->0.0153s--assume_migrated_upto_version(20141217071943,["/home/vagrant/puppet-dashboard/db/migrate"])->0.0215s
Tip
The only errors I’ve seen at this point were if the MySQL server was not running, or if the passwords in the configuration file were not correct.Now that the database has been defined, you can precompile all static assets for higher performance:
[puppet-dashboard@dashserver~]$bundleexecrakeassets:precompile/usr/bin/ruby/opt/puppet-dashboard/vendor/bundle/ruby/bin/rakeassets:precompile:allRAILS_ENV=productionRAILS_GROUPS=assets
Connecting Puppet Dashboard to Puppet Server
Generate a unique TLS key and certificate request using the following commands. The cert:request command will submit the CSR to the Puppet CA:
[puppet-dashboard@dashserver~]$bundleexecrakecert:create_key_pair[puppet-dashboard@dashserver~]$bundleexecrakecert:request
You may get the following error at this point:
[puppet-dashboard@dashserver~]$bundleexecrakecert:requestrakeaborted!404"Not Found"/opt/puppet-dashboard/lib/puppet_https.rb:34:in'put'/opt/puppet-dashboard/lib/tasks/install.rake:50:in'block (2 levels) in <top>'Tasks:TOP=>cert:request(Seefulltracebyrunningtaskwith--trace)
When the command succeeds, you’ll need to log in to the Puppet server and sign the certificate, as done in Part III and shown here:
[vagrant@puppetserver~]$puppetcert--signdashboard.example.comNotice:Signedcertificaterequestfordashboard.example.comNotice:RemovingfilePuppet::SSL::CertificateRequestdashboard.example.comat'/var/opt/puppetlabs/puppetserver/ssl/ca/requests/dashboard.example.com.pem'
Return to the dashboard server and execute the following request to download and store the signed certificate. The dashboard will also retrieve the CA’s certificate and the CA revocation list:
[puppet-dashboard@dashserver~]$bundleexecrakecert:retrieve[puppet-dashboard@dashserver~]$ls-1certs/dashboard.ca_cert.pemdashboard.ca_crl.pemdashboard.cert.pemdashboard.private_key.pemdashboard.public_key.pem
At this point, Puppet Dashboard is an authorized client of the Puppet server and can submit requests to it.
We are done taking action as the dashboard user, so exit back to our normal vagrant user login. As you won’t need to log in as this user again, we can disable the shell for it at this time:
[puppet-dashboard@dashserver~]$exit[vagrant@dashserver~]$sudousermod-s/bin/nologinpuppet-dashboard
Enabling the Dashboard Rails service
Now we’ll configure Apache to start up Puppet Dashboard running as a Rails application under Phusion Passenger. First, Apache comes with several configuration files that provide a helpful defaults for setting up Rails applications. We don’t need and won’t be using this configuration, so let’s remove them:
[vagrant@dashserver~]$cd/etc/httpd/conf.d[vagrant@dashserverconf.d]$sudormssl.confwelcome.confuserdir.conf
Install an Apache configuration file from the learning-puppet4 repo. This file contains a complete, self-standing service definition for the Puppet Dashboard service:
[vagrant@dashserverconf.d]$sudocp/vagrant/etc-puppet/dashboard.conf./
Restart Apache to pick up the changes. Here’s what it looks like when it restarted successfully:
$sudosystemctlrestarthttpd$sudosystemctlstatushttpdhttpd.service-TheApacheHTTPServerLoaded:loaded(/usr/lib/systemd/system/httpd.service;enabled)Active:active(running)sinceThu2015-08-2705:24:38UTC;5sagoProcess:14661ExecStop=/bin/kill-WINCH${MAINPID}(status=0/SUCCESS)MainPID:14666(httpd)Status:"Processing requests..."CGroup:/system.slice/httpd.service├─14666/usr/sbin/httpd-DFOREGROUND├─14693Passengerwatchdog├─14696Passengercore├─14703Passengerust-router├─14714/usr/sbin/httpd-DFOREGROUND├─14715/usr/sbin/httpd-DFOREGROUND├─14716/usr/sbin/httpd-DFOREGROUND├─14717/usr/sbin/httpd-DFOREGROUND└─14718/usr/sbin/httpd-DFOREGROUNDdashboard.example.comsystemd[1]:StartingTheApacheHTTPServer...dashboard.example.comsystemd[1]:StartedTheApacheHTTPServer.
There are two logs that may contain errors from the dashboard initialization. Check the Apache error log for Passenger startup failures, and your syslog daemon log for messages from the running Puppet Dashboard service. The following command can be useful to view both logs when you are debugging problems:
[vagrant@dashserver~]$sudotail-f/var/log/messages/var/log/httpd/error_log
Viewing the dashboard
At this point, you should open a browser and connect to the dashboard. If you are running the Dashboard on a Vagrant node, you will need to add the node’s IP address to the hosts file on your personal computer.
On a Mac or Linux system, add the following line to /etc/hosts. On a Windows machine, add the same line to C:\Windows\System32\drivers\etc\hosts:
192.168.250.7dashboard.example.com
Now open up a browser and connect to http://dashboard.example.com/.
Note
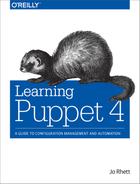
At this point, you will get a TLS certificate error. You can safely ignore this when running Vagrant on your personal machine. We have documented how to resolve this problem in “Eliminating certificate errors”.You should see a screen that looks exactly like Figure 27-1.
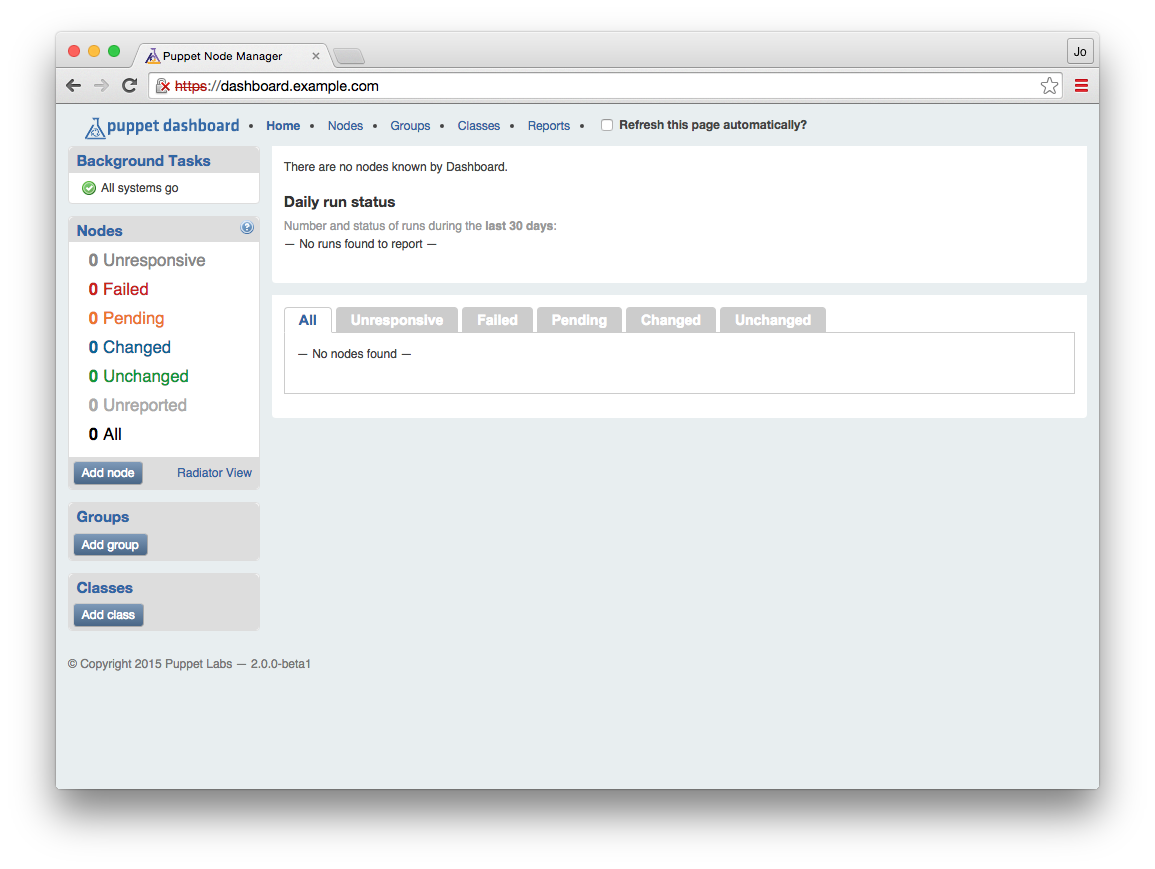
Figure 27-1. Puppet Dashboard with no node reports
There’s no information here, as no nodes are reporting here yet. Let’s configure the Puppet server to send node reports to the Dashboard.
Sending node reports to the dashboard
Enable the dashboard as a target for node reports on your Puppet server. Do so by adding http to the report processors, and a reporturl setting pointing to the dashboard in /etc/puppetlabs/puppet/puppet.conf:
[master]reports=store,httpreporturl=https://dashboard.example.com:3000/reports/upload
Restart the Puppet server, and it will start forwarding node reports to the dashboard. For Puppet Server the command would be:
[vagrant@puppetserver~]$sudosystemctlrestartpuppetserver
For the deprecated Puppet master, you would restart Apache:
[vagrant@puppetmaster~]$sudosystemctlreloadhttpd
Now you should run Puppet on a client node. After the run has finished, check back and you should see the message shown in Figure 27-2 on the top left of the console.
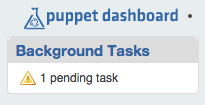
Figure 27-2. One node report has been received
A pending task means that a report has been received and is waiting to be processed. If you see this message, node report forwarding is working properly. If you do not see this on the dashboard, check the system log on your Puppet server for messages about the report submission:
[vagrant@puppetserver~]$greppuppet/var/log/messages
Enabling worker processes
Puppet Dashboard uses background worker processes to process node reports. We need to enable a service to run these workers. Adjust the configuration files for this service like so:
[vagrant@dashserver~]$cd/opt/puppet-dashboard/ext/redhat[vagrant@dashserverredhat]$sed-e's#usr/share#opt#'\puppet-dashboard.sysconfig|sudotee/etc/sysconfig/puppet-dashboard[vagrant@dashserverredhat]$echo"WORKERS=$(grepcores/proc/cpuinfo\|cut-d' '-f3)"|sudotee/etc/sysconfig/puppet-dashboard-workers
This has adjusted the system configuration files for the dashboard installation path, and selected the correct number of workers. Now enable and start the puppet-dashboard-workers service like so:
[vagrant@dashserver~]$sudosystemctlenablepuppet-dashboard-workersln-s'/etc/systemd/system/puppet-dashboard-workers.service''/etc/systemd/system/multi-user.target.wants/puppet-dashboard-workers.service'[vagrant@dashserver~]$sudosystemctlstartpuppet-dashboard-workers
Now that the worker processors are enabled, the pending tasks should reduce to zero. You should also see some information in the node reports.
If Background Tasks says 1 new failed task, click it. Do you see a message about an attribute that was supposed to be an array, like the one shown in Figure 27-3?
Figure 27-3. Background task failure
If so, then you should download and apply the patch from Puppet Dashboard Pull Request 329, which contains a fix for processing reports from Puppet 4 nodes. Then restart the workers service:
[vagrant@dashserver~]$sudo-upuppet-dashboardbash-l[puppet-dashboard@dashservervagrant]$cd[puppet-dashboard@dashserver~]$curl-sL\http://github.com/sodabrew/puppet-dashboard/pull/329.diff|patch-u-p1patchingfileapp/models/report.rb[puppet-dashboard@dashserver~]$exit[vagrant@dashserver~]$sudosystemctlrestartpuppet-dashboard-workers
Viewing node status
Now that you have enabled the worker processes, you can see the results of each node’s Puppet agent convergence in the web interface. Puppet Dashboard provides an extensive amount of information for your review. Let’s review each of the pages now.
Tip
Puppet Dashboard refers to the Puppet run, while this book uses the more accurate term catalog evaluation or convergence. In this chapter, we utilize the same terms you’ll see on the display for Puppet dashboard.Viewing nodes by status
The home page of Puppet Dashboard provides an overview of the convergence history of Puppet nodes that connect to the Puppet server.
In the toolbar on the left, the Nodes widget contains a count of all nodes with reports, and another count of the number of nodes that last reported each status, as shown in Figure 27-4.
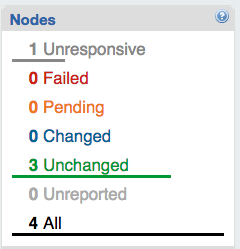
Figure 27-4. Puppet Dashboard: Nodes widget
In the main display, you’ll find a graphic display of run status over the last 30 days, as shown in Figure 27-5.
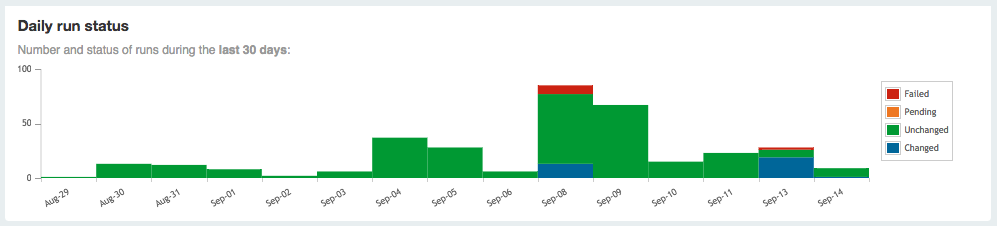
Figure 27-5. Puppet Dashboard: Run status graph
Beneath it you’ll find a list of nodes and the last time they reported (Figure 27-6).
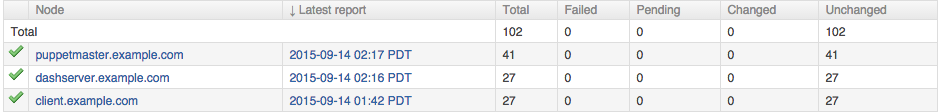
Figure 27-6. Puppet Dashboard: Node list
Just above the list of nodes is a tab bar of node statuses. Selecting one of these tabs will limit the list to show you only nodes that last reported the selected status (Figure 27-7).

Figure 27-7. Puppet Dashboard: Node status tabs
Reviewing a node’s history
If you click on a node name, you’ll be taken to the node’s overview page (Figure 27-8). This contains a graph of the node’s Puppet run (catalog evaluation) status over 30 days, a graph of the run time, and a table showing the status from every stored run report for that node.
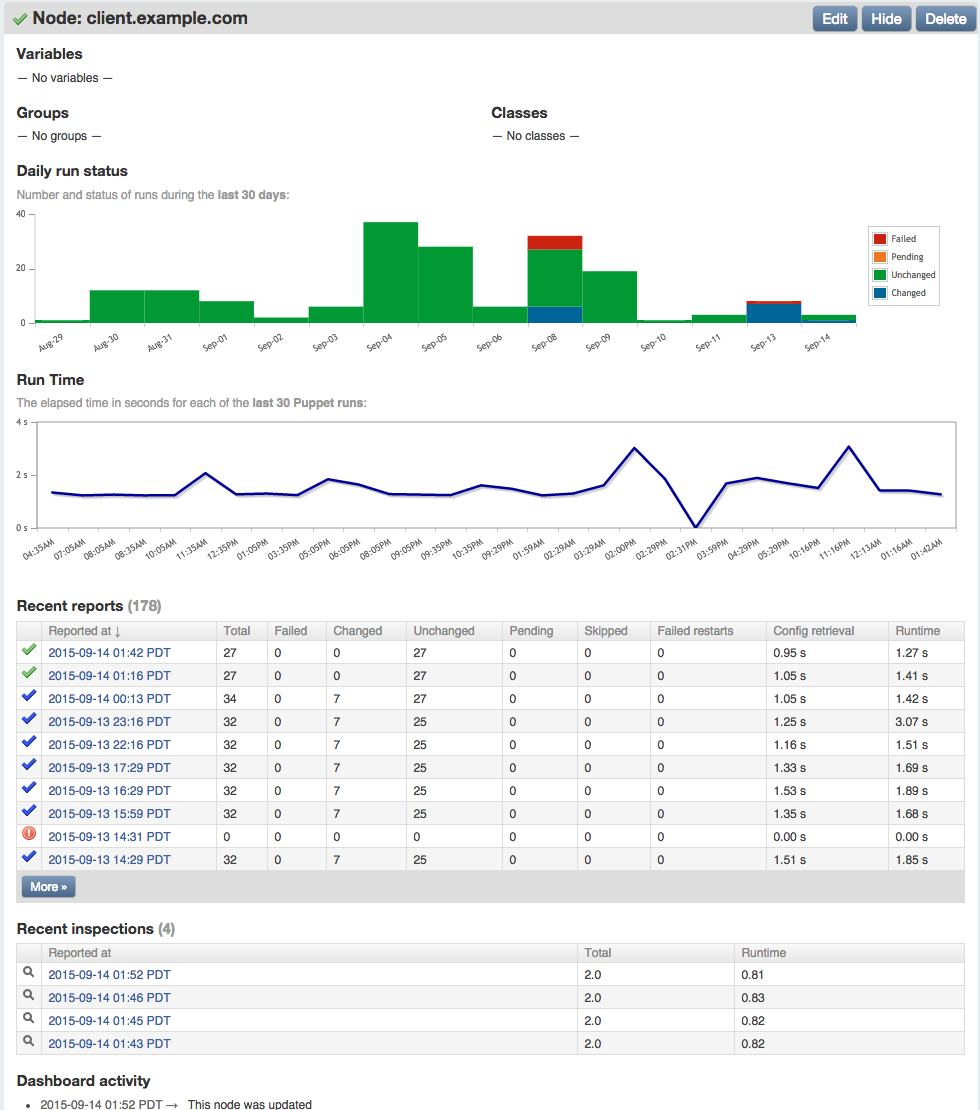
Figure 27-8. Node overview
In the preceding figure, you’ll notice that four inspections were reported, which contain the current status of all resource attributes for which auditing was enabled.
The report was created by running puppet inspect on the node. The dashboard provides an interface to browse through both run reports and audit inspections.
Analyzing a node’s run report
If you click on the datestamp next to a node name, you’ll see an overview of that node’s Puppet catalog evaluation (Figure 27-9). This report includes detailed statistics about the number of resources, the changes made during the run, and the time intervals of each stage of the Puppet run.
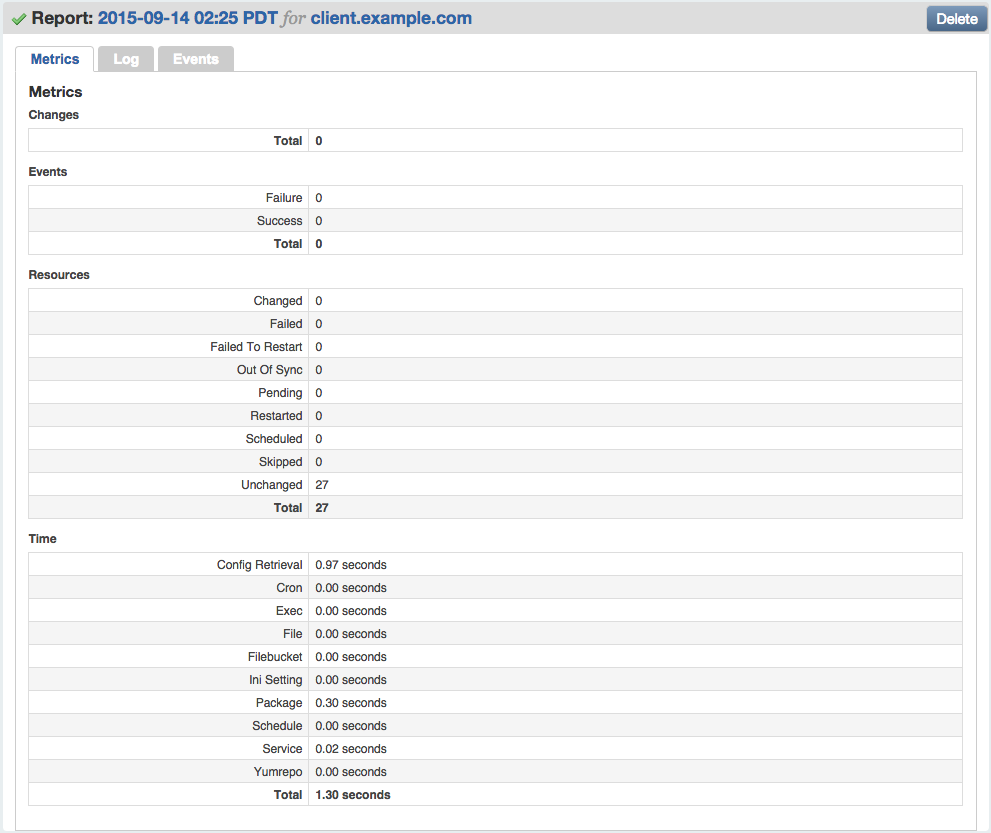
Figure 27-9. Puppet run report
Finding node failures
Puppet Dashboard can help you identify problems with nodes. If a Puppet agent convergence fails on a node, the node will show up in the red Failed count on the left.
You can see a list of all nodes whose most recent Puppet run failed by clicking Failed in the widget bar on the left, or by clicking Failed on the Status tab bar in the main display (Figure 27-10).
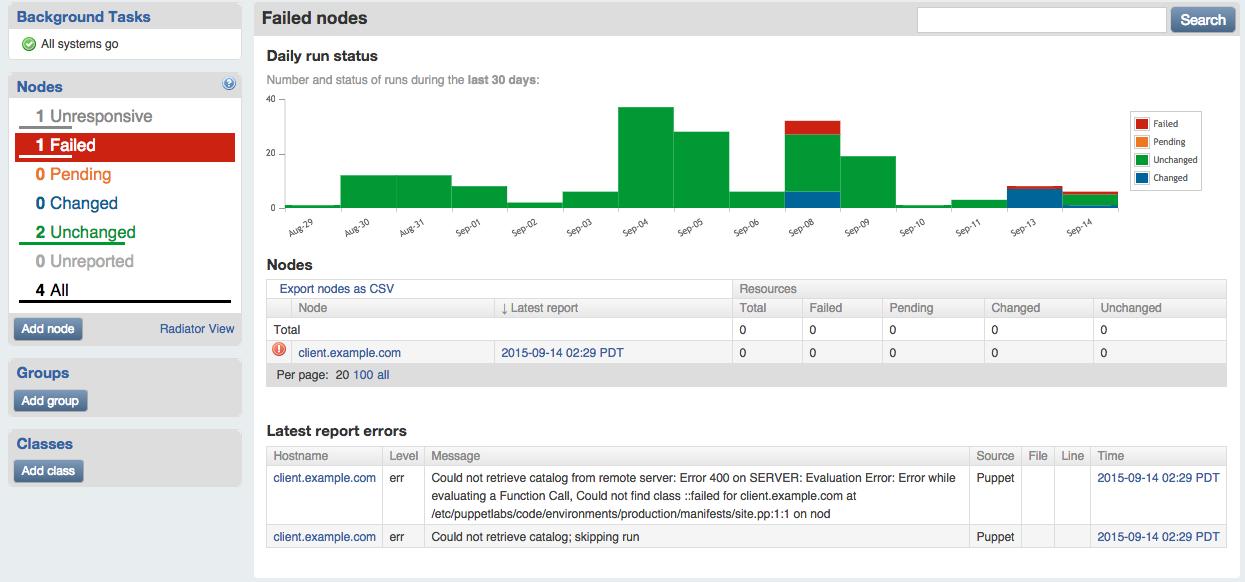
Figure 27-10. Node status: Failed
You can see a list of all failed Puppet runs, current and previous, by clicking on Reports at the top right, and then Failed in the tab bar shown on that page (Figure 27-11).
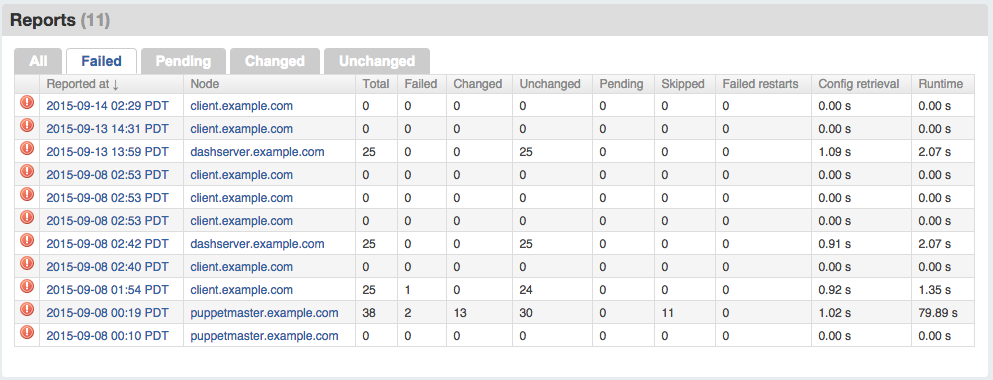
Figure 27-11. Run reports: Failed
Identifying out-of-sync nodes
The Puppet Dashboard can help you identify nodes that are out of sync with policy. If a node has not sent a Puppet report in a few hours, the node will show up in the grey Unreported count on the left.
If you click on Unresponsive in the node status widget, you’ll find a report of nodes that have not reported recently (Figure 27-12).
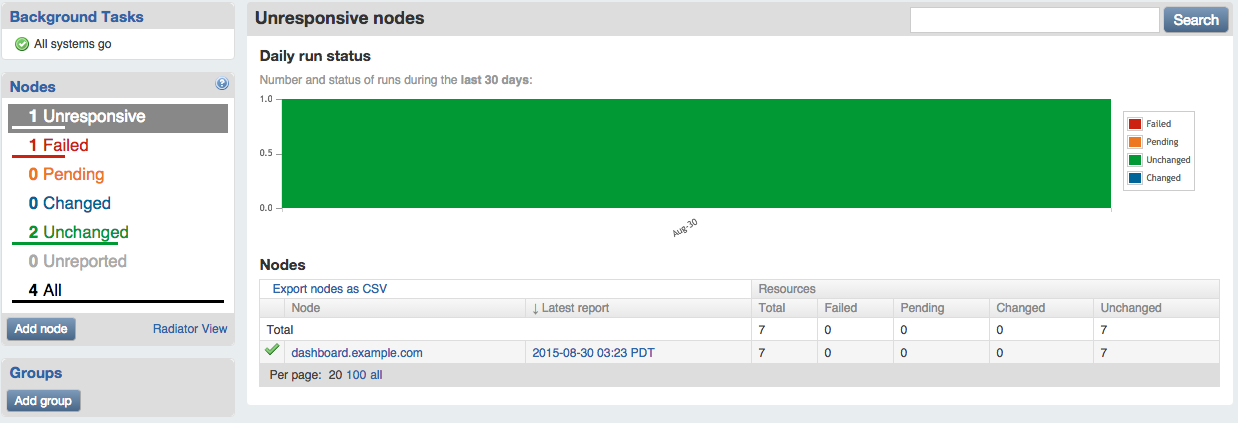
Figure 27-12. Node status: Unresponsive
There are a number of reasons why nodes may not be reporting:
- The node has a networking problem.
- The node has been shut down.
- Puppet has been prevented from running on the node.
Unfortunately, Puppet Dashboard can’t identify why the node hasn’t sent a report to the Puppet server recently. Someone will need to investigate this situation.
Using Dashboard as a Node Classifier
In addition to assigning classes to nodes using Hiera, you can do assignment within the Puppet Dashboard interface. The dashboard provides a convenient graphical interface to assign classes and input parameters to nodes.
Warning
Puppet Dashboard doesn’t provide a history of changes to the node configuration. Sites with auditing requirements may find this unsuitable for tracking change in production environments.Let’s walk through this process so you can see how it works.
To enable the ENC functionality, ensure that the enable_ready_only_mode setting is disabled in /opt/puppet-dashboard/config/settings.yml:
# Disables the UI and controller actions for editing nodes, classes,# groups and reports. Report submission is still allowedenable_read_only_mode:false
If you have changed the value, restart the httpd process to pick up the change with systemctl reload httpd.
Setting the environment for a node
Click on the client.example.com node name in the main screen. Then click the Edit button near the top right of the title bar for the node, shown in Figure 27-13.

Figure 27-13. Puppet Dashboard: Node title bar
On the following screen (Figure 27-14), you have the option to set the node’s environment, to assign classes to the node, or to define parameters (top-level variables) for the node.
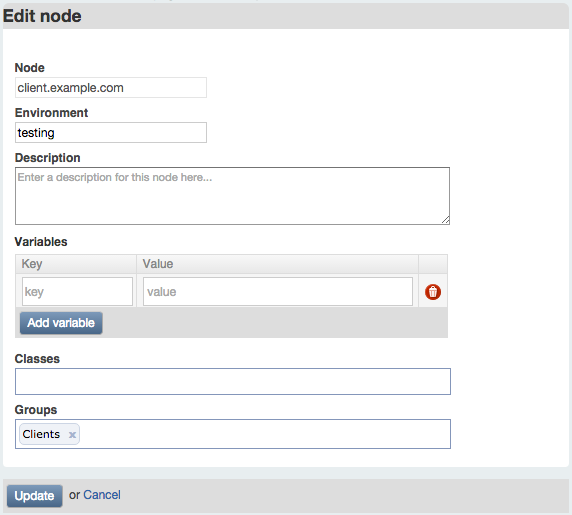
Figure 27-14. Puppet Dashboard: Edit node
While it can be useful to assign classes or parameters to individual nodes, you will generally want to do this with a node group, as described shortly. At this time, write a description for the node and select the test environment for it.
Click Update to save your changes.
Repeat this process for each node you wish to add a description for, or assign to the test environment.
Adding classes to the dashboard
Under Classes in the left sidebar, click the “Add class” button. On the following page, enter the name of a class available on the Puppet server. Add a description for the dashboard display, then click Create (Figure 27-15).
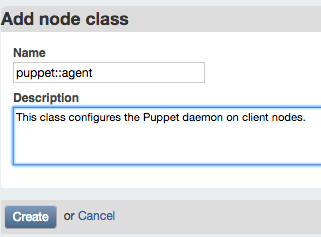
Figure 27-15. Puppet Dashboard: Add node class
To make use of the module created in Part II, enter puppet::agent as the class name.
Repeat this process for each class you wish to assign to nodes. You may wish to add mcollective::server to the class list, for example.
Creating node groups
Under Groups in the left sidebar, click the “Add group” button. On the following page enter a name you’d like to use for a group of nodes (Figure 27-16).
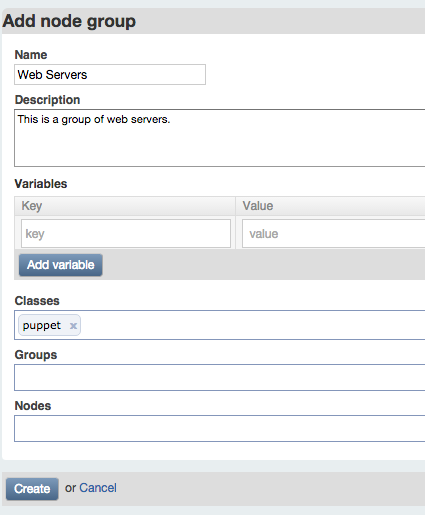
Figure 27-16. Puppet Dashboard: Add node group
Enter a description for dashboard users to understand the meaning of the group. As you can see from this screen, a group can contain:
- Nodes that are included in the group
- Other groups that are included in the group
- Classes that apply to all nodes in the group
- Parameter keys and values provided with the group
For practice, you can create a group named Clients, with a node of client.example.com and classes puppet::agent and mcollective::server. For testing purposes, add a parameter named findme with any value you like.
Note
You’ll notice that the dashboard autocompletes entries based on node and class information in its database.When you are done, click Create. You will see a filtered status view that contains only the results from nodes within the group (Figure 27-17).
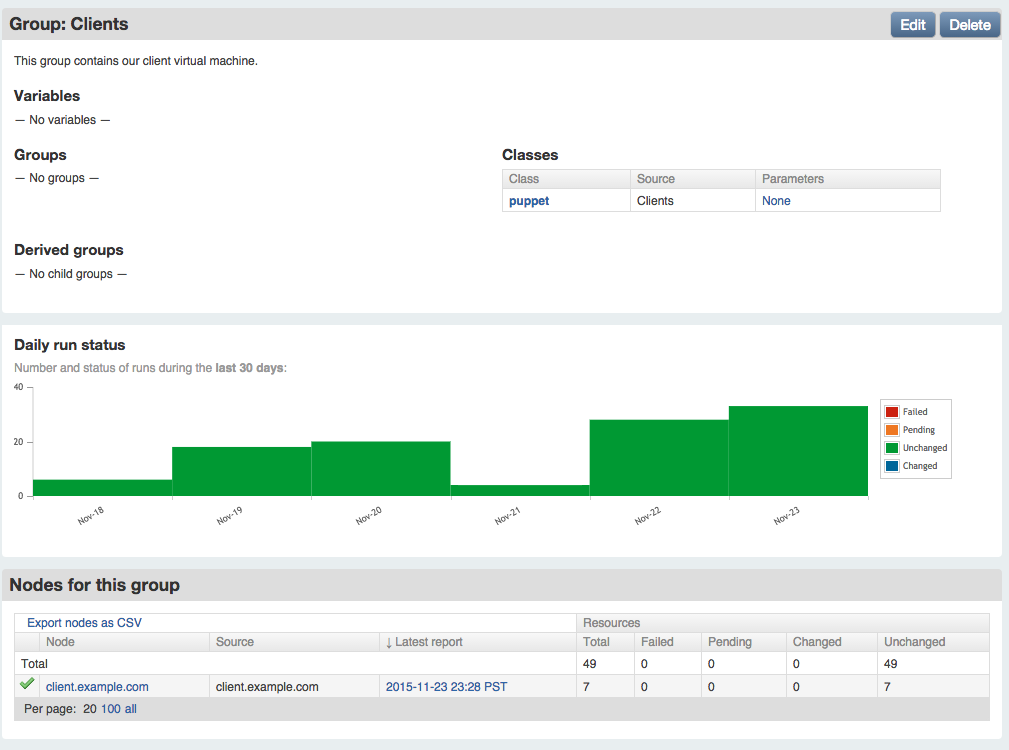
Figure 27-17. Puppet Dashboard: View Clients group
Installing the node classifier
To enable ENC lookups from the dashboard’s nodes and classes, install the external_node query script on the Puppet server. You can copy this file from the dashboard instance, or download it directly from the GitHub repository:
[vagrant@puppetserver~]$sudomkdir-p/opt/puppet-dashboard/bin[vagrant@puppetserver~]$sudochownvagrant/opt/puppet-dashboard/bin[vagrant@puppetserver~]$cd/opt/puppet-dashboard/bin[vagrant@puppetserverbin]$curl-sL-oexternal_node\https://github.com/sodabrew/puppet-dashboard/raw/master/bin/external_node[vagrant@puppetserverbin]$chmod755external_node
There are two ways to make the node classifier work correctly:
- Edit the script to contain the correct dashboard URL and filenames.
- Provide the Dashboard URL and the server’s TLS key and certificate filenames with environment variables.
I have found that editing the script (or installing it with a customized template using Puppet) is easiest. You can edit it as follows:
[vagrant@puppetserver~]$$EDITOR/opt/puppet-dashboard/bin/external_node
Adjust the following settings near the top of the script:
DASHBOARD_URL="https://dashboard.example.com:3000"# These settings are only used when connecting to dashboard over https (TLS)CERT_PATH="/etc/puppetlabs/puppet/ssl/certs/puppetserver.example.com.pem"PKEY_PATH="/etc/puppetlabs/puppet/ssl/private_keys/puppetserver.example.com.pem"CA_PATH="/etc/puppetlabs/puppet/ssl/certs/ca.pem"
Testing class and parameter assignment
Before enabling the ENC for the Puppet server, test that ENC node lookup is working properly with the dashboard. The following test query should retrieve the data configured in the Dashboard for the client node:
$sudo/opt/puppet-dashboard/bin/external_nodeclient.example.com---name:client.example.comenvironment:testclasses:mcollective::server:{}puppet::agent:{}parameters:findme:Itworks!
As you can see, the output contains the environment configured with the node, plus the classes and parameters assigned to the Clients group. The group name itself does not appear in the output, as this is a user interface feature internal to the dashboard.
If you are using an unmodified external_node script, then you may need to set environment variables when performing the query:
[vagrant@puppetserver~]$cd/var/opt/puppetlabs/puppetserver[vagrant@puppetserverpuppetserver]$sudo/usr/bin/env\CA_PATH=ssl/certs/ca.pem\CERT_PATH=ssl/certs/puppetserver.example.com.pem\PKEY_PATH=ssl/private_keys/puppetserver.example.com.pem\PUPPET_DASHBOARD_URL=https://dashboard.example.com:3000\/opt/puppet-dashboard/bin/external_nodeclient.example.com
Test out the results with different hostnames. When the output is what you expect, enable the node classifier, as described next.
Querying the dashboard’s ENC
Enable the Puppet Dashboard as an ENC using the following settings in the [master] section of /etc/puppetlabs/puppet/puppet.conf on the Puppet server:
[master]node_terminus=execexternal_nodes=/opt/puppet-dashboard/bin/external_node
Alternatively, pass the Puppet server’s key and certificate to the script using environment variables as follows:
[master]node_terminus=execexternal_nodes=/usr/bin/envCA_PATH=$ssldir/certs/ca.pemCERT_PATH=$ssldir/certs/puppetserver.example.com.pemPKEY_PATH=$ssldir/private_keys/puppetserver.example.com.pemPUPPET_DASHBOARD_URL=https://dashboard.example.com:3000/opt/puppet-dashboard/bin/external_node
After making these changes, you’ll need to restart the Puppet server:
[vagrant@puppetserver~]$sudosystemctlrestartpuppetserver
From this point forward, the dashboard will be queried for the environment, classes, and parameters (node variables) of each node. The response from the dashboard will be used along with the results of Puppet Lookup to configure the node.
Implementing Dashboard in Production
This section contains important processes you should follow when building a production Puppet Dashboard instance. None of these are necessary for a test instance running on Vagrant. Skip over this section for now if you’d like, and come back to it when implementing a production server.
Eliminating certificate errors
If you are familiar with Apache configuration, you may have observed that the Puppet Dashboard service has been configured to answer on both TCP port 3000 and port 443. This configuration enhances security and improves the user experience.
The Puppet Dashboard service on port 3000 has special rules to allow only connections that utilize TLS certificates signed by the Puppet certificate authority. The Puppet server must provide its own TLS certificate when communicating with the dashboard.
When users connect to view node status, they will connect to the standard TLS port of 443. If their browser is given a certificate signed by the Puppet certificate authority (which is not authorized as a trusted CA in any browser), they will receive a certificate error from their browser.
Best Practice
Never ask users to click through certificate warnings. One day they’ll click through a fraudulent intercept, and give their credentials (or worse) to an imposter.
You can provide a better experience by obtaining a TLS certificate from a certificate authority trusted by web browsers, the same as you would do for any public website. Generate an TLS key and CSR, and install the key and signed certificate on the dashboard server.
Starting at line 23 in /etc/httpd/conf.d/dashboard.conf are the keys and certificate settings for the VirtualHost handling users on port 443. Comment out or remove the lines referencing the Puppet keys and uncomment the lines referencing the new key and certificate. Following is an example that shows a key and certificate installed in the RedHat standard TLS directories:
# This cert was signed by the Puppet CA and will produce a browser warning#SSLCertificateFile /opt/puppet-dashboard/certs/dashboard.cert.pem#SSLCertificateKeyFile /opt/puppet-dashboard/certs/dashboard.private_key.pem# Change to keys and certificates issued by a trusted certificate authority# to avoid browser errorsSSLCertificateFile/etc/pki/tls/certs/dashboard.crtSSLCertificateKeyFile/etc/pki/tls/private/dashboard.key
Optimizing the database
The dashboard database is a normal MySQL database. You can back it up, restore it, and optimize it using standard tools and processes.
There is a special job that optimizes the dashboard’s database schema. You should configure this to run from the dashboard user’s cron once a month. Edit the dashboard user’s cron like so:
[vagrant@puppetserver~]$sudocrontab-upuppet-dashboard-e
The contents of the crontab should contain something like this:
MAILTO=you@example.comRAILS_ENV=production*31**/bin/bundleexecrakedb:raw:optimize
This is the bog-standard Unix crontab format you can find documented everywhere. The operational line here will run the optimize job on the first day of the month at 3 a.m., and email the results to you. You should adjust the email address and timing of the optimization to whatever you desire.
Pruning old reports
Reports will remain in the database forever unless they are pruned. To keep the database size from outgrowing the space available, you should run the following job to prune old reports after they are no longer useful.
As in the previous example, configure this to run from the dashboard user’s cron once a month. Add the following line to the dashboard user’s crontab:
MAILTO=you@example.comRAILS_ENV=production*4*0*/bin/bundleexecrakereports:pruneupto=3unit=mon
This runs the prune job every Sunday at 4 a.m., and emails any output to you. As written, it will expire any report older than three months. You should adjust this parameter based on the disk storage available, and your organization’s data retention requirements.
Rotating logs
While most messages go to the system logger, some low-level log messages are stored in the log/ subdirectory of the installation directory. To keep these files from growing too large, install the dashboard’s logrotate file, which tells the nightly logrotate process how to trim these files.
The only necessary change to this file is to alter the installation path to match where Puppet Dashboard was installed:
$cd/opt/puppet-dashboard/ext/redhat$sed-e's#usr/share#opt#'puppet-dashboard.logrotate\|sudotee/etc/logrotate.d/puppet-dashboard
This will keep the dashboard’s logfiles from getting out of control.
Ensuring a high-performance dashboard
Once you have finished testing and wish to deploy Puppet Dashboard in production, there are two issues to consider for performance: available RAM and fast storage. The dashboard tends to be write-heavy, generally doing 5:1 writes versus reads at most sites.
The dashboard server only needs sufficient RAM and for the database to be stored on the fastest disks available. Some of the best ways to meet these requirements are as follows:
- Physical server
- Mirror the root and operating system volumes for redundancy on small, stable disks. Put the MySQL database on a RAID 0+1 or RAID-6 high-speed disk array.
- Virtual server
- Put the operating system on the regular shared storage volumes used by other virtualized systems. Place the MySQL database on direct attached storage using VMWare’s Raw Device Mapping or OpenStack Block Storage.
- Cloud server
- Put the operating system on the regular instance volumes (such as AWS GP2 EBS volume). Place the MySQL database on direct attached SSD if possible (e.g., AWS R3 instance), or a remote drive with dedicated bandwidth and high IOPS commitment (e.g., AWS C4 instance with an EBS Provisioned IOPS volume).
Keep in mind this is all relative. If you have fewer than 100 nodes, almost any server will suffice. If you have thousands of nodes and an information radiator querying the dashboard every minute, you’ll want to spend significant effort tuning the server appropriately.
Sizing the dashboard database
The data store size is one of the most important considerations when building a production Puppet Dashboard service. Running out of disk space can cripple the dashboard, and rebuilding a MySQL database on a new volume is nobody’s idea of a fun Friday night.
Thankfully, there is a formula you can use to size your dashboard pretty much exactly as required.
On your Puppet server, you will find node reports in the $vardir/reports directory. These reports contain messages for each resource processed during the Puppet run. The more resources that are applied to a client node, the larger the report file will be.
The dashboard server will be storing every node report for as long as you tune the report database to retain the information. In practice, the MySQL data store uses slightly more space than the compact YAML file in the reports directory.
Using this information, calculate the disk space for the MySQL database by multiplying all of the following pieces of information and rounding up:
- Number of nodes
- Size of the reports
- Puppet runs per day (48 by default)
- Number of days before data is purged
- Average increase in MySQL data versus YAML file = 1.2
In a very stable environment where all nodes apply similar amount of Puppet resources, and very few ad hoc Puppet runs are done out of schedule, it is possible to target the disk space very closely:
| Nodes | Report size | Puppet runs | Purge time | DB size adj | Expected disk space |
|---|---|---|---|---|---|
| 50 | 128 KB | 48 | 30 | 1.2 | 12 GB |
| 100 | 128 KB | 48 | 90 | 1.2 | 67 GB |
| 2,000 | 256 KB | 48 | 90 | 1.2 | 2.5 TB |
In reality, it’s not usually so simple, for a variety of reasons:
- Ongoing work adds new nodes on a regular basis.
- Autoscaled environments have a dynamic number of nodes.
- Different node types have vastly different numbers of resources applied to them, creating a large discrepancy in report sizes.
To give you a concrete example, at one customer we had these node types:
- More than 10,000 globally distributed nodes running Puppet four times a day, and managing only 120 resources.
- A little more than 200 servers in the core data center running Puppet the standard 48 times a day, each with more than 5,000 managed resources.
- An on-demand testing platform that built and tore down complete cluster sets. Nodes in the cluster ran Puppet exactly twice, with more than 14,000 resources applied between the two runs before being destroyed at the end of the test.
To scale the dashboard appropriately in this environment, we did three separate calculations, including a reasonable estimate for the maximum on-demand runs in a single day, and expected growth for servers and remote sites. That estimate was accurate enough that it is still running with average 80% space utilization on the same size disk cluster two years later.
Not every situation is so easy to predict. Last year I worked with a company that has two very large peak periods within the year, during which time the production deployment tripled in size. The saving grace is that during these rush periods the number of ad hoc convergence runs drops to nearly zero, as nonemergency deployments are limited during these periods. All of the reporting systems were scaled to handle peak load, and thus ran with extra capacity outside of the rush periods.
Evaluating Alternative Dashboards
There are several alternatives to the dashboards created by Puppet Labs. Depending on your needs or requirements, these may suit you better.
Some of these dashboards make use of PuppetDB’s data, which can provide more detailed introspection of node status than available in the Puppet Dashboard. Any dashboard that gets node information from PuppetDB requires you to install PuppetDB before it will be useful.
Puppetboard
Puppetboard is a web interface to PuppetDB aiming to replace the reporting functionality of Puppet Dashboard (see Figures 27-18 and 27-19).
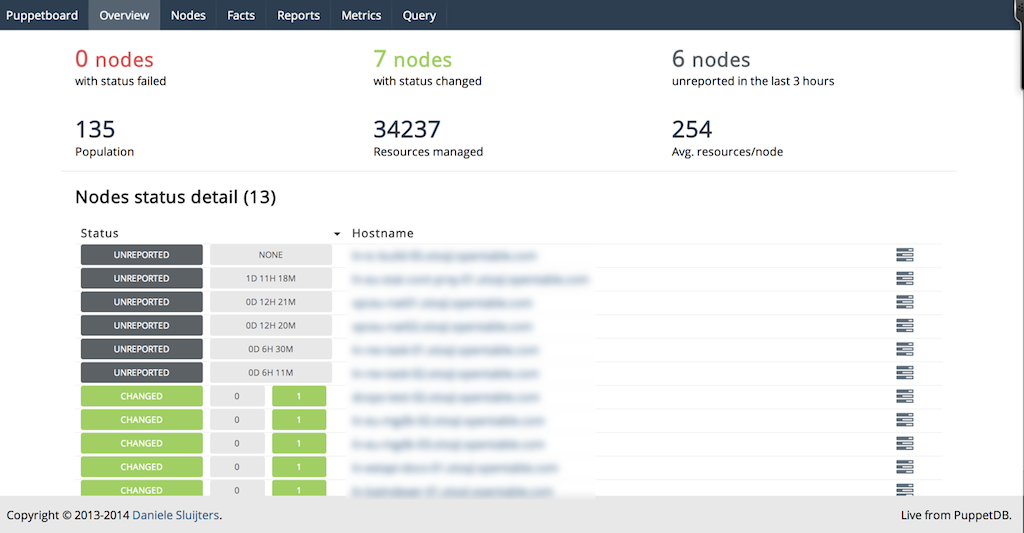
Figure 27-18. Puppetboard: Overview
At the time this book was written, the website still had an old disclaimer about how young the project was. Puppetboard is now over two years old with constant and progressive development during that time period.
Puppetboard is supposed to be a tool, not a solution. So it’s always gonna be less polished and more utilitarian than something like Puppet Enterprise.
Spencer Krum / nibalizer
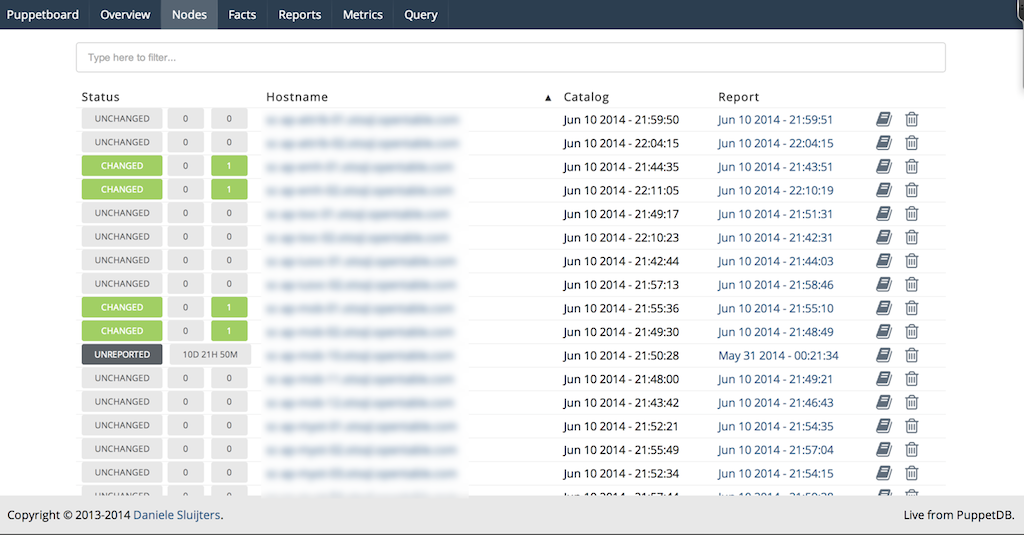
Figure 27-19. Puppetboard: Nodes
You can find more information about Puppetboard at https://github.com/voxpupuli/puppetboard. There is a Puppet module to install Puppetboard available at puppet/puppetboard on the Puppet Forge.
Puppet Explorer
Puppet Explorer is a web application to explore PuppetDB data (see Figures 27-20 and 27-21). It is made using AngularJS and CoffeeScript and runs in the client browser. A small web server providing the static resources, and one or more PuppetDB servers, are the only backend systems required.
You can find more information about Puppet Explorer at https://github.com/spotify/puppetexplorer. There is a Puppet module maintained by the project available at spotify/puppetexplorer on the Puppet Forge.
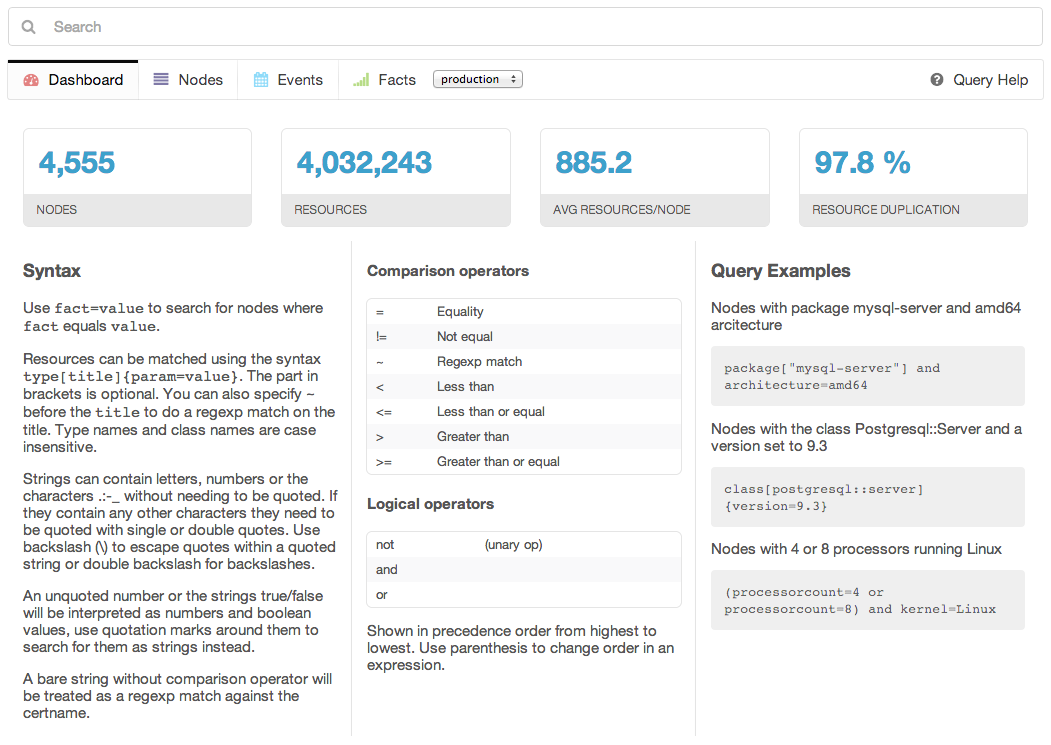
Figure 27-20. Puppet Explorer: Dashboard
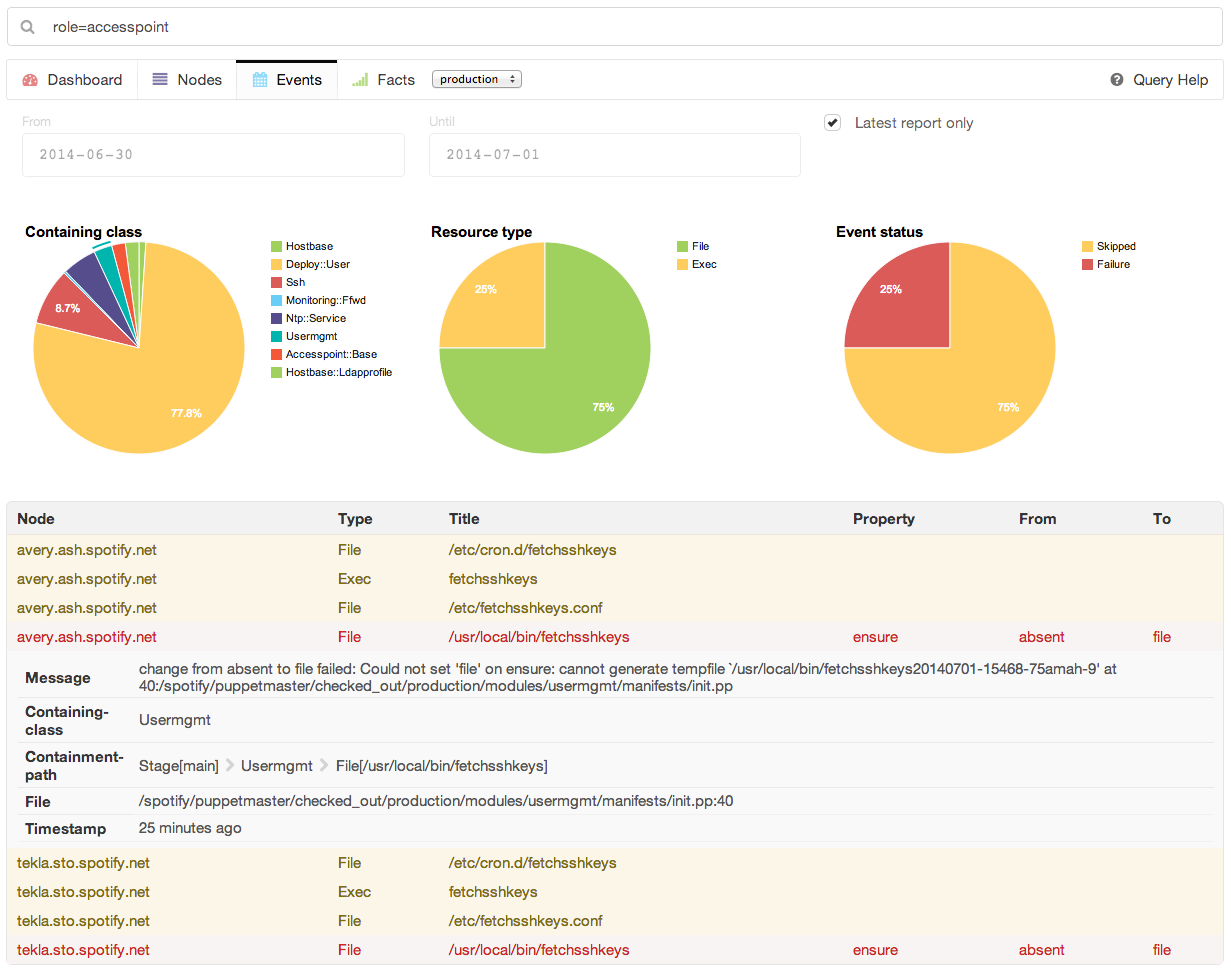
Figure 27-21. Puppet Explorer: Events
Spotify uses this dashboard in its operations, and provides regular updates.
PanoPuppet
Panorama Puppet, or PanoPuppet for short, is a web frontend that interfaces with PuppetDB and gives you a panorama view over your Puppet environments (see Figures 27-22 and 27-23). It’s coded in Python 3 using the Django framework for the web interface and requests library to interface with PuppetDB. It also uses Bootstrap for the CSS and JQuery for some table sorting.
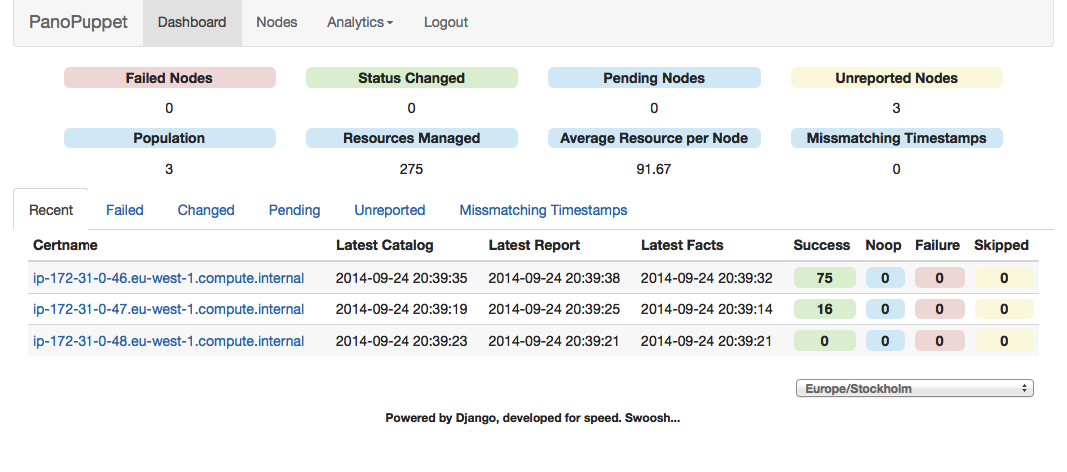
Figure 27-22. PanoPuppet: Dashboard
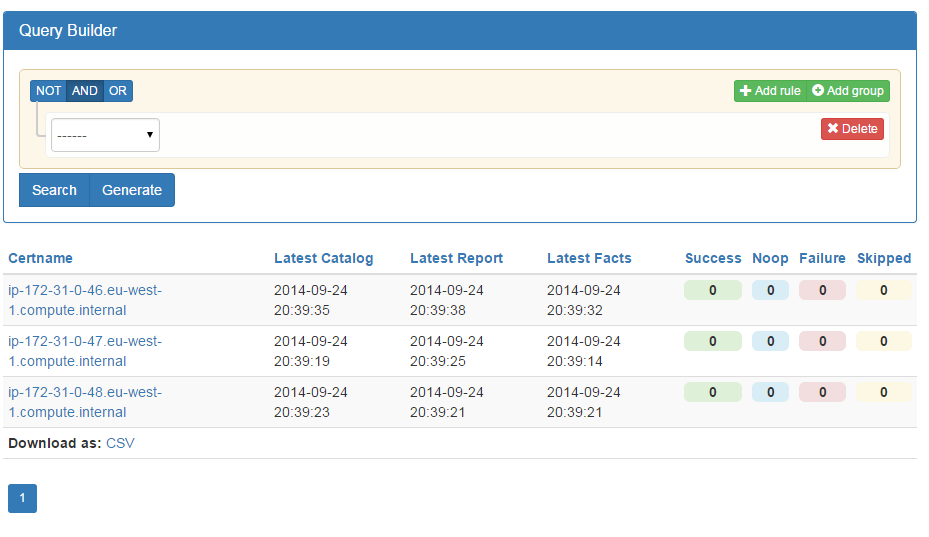
Figure 27-23. PanoPuppet: Nodes
The screenshots shown on the project are impressive and look powerful. As the author, propyless, says on the website:
The interface was written originally as an idea from work, we have tried to use different types of web interfaces that show the status of the Puppet environment. Most of them were too slow, too bloated to give us the information we wanted quickly. Why should PuppetDB which has an amazing response time suffer from a slow frontend? When you reach a point where the environment could have over 20,000 puppetized nodes you need something fast.
You can find more information about PanoPuppet at https://github.com/propyless/panopuppet.
ENC Dashboard
ENC Dashboard is a project that replicated the functionality of Puppet Dashboard in a new Rails 3 design (see Figures 27-24 and 27-25). This project looks very familiar if you have used Puppet Dashboard before, but provides a faster interface and some additional new features.
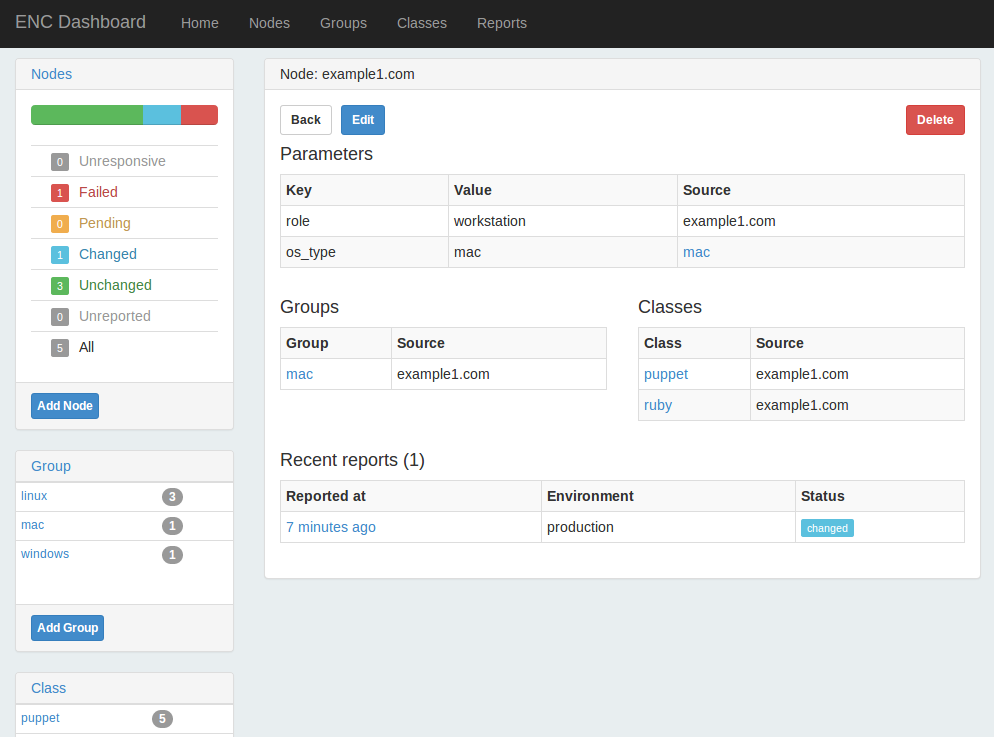
Figure 27-24. ENC Dashboard: Node view
This dashboard provides the ability to disable, enable, or trigger a Puppet run on a node, if you have installed the Puppet agent for MCollective (we’ll cover this in Chapter 30).
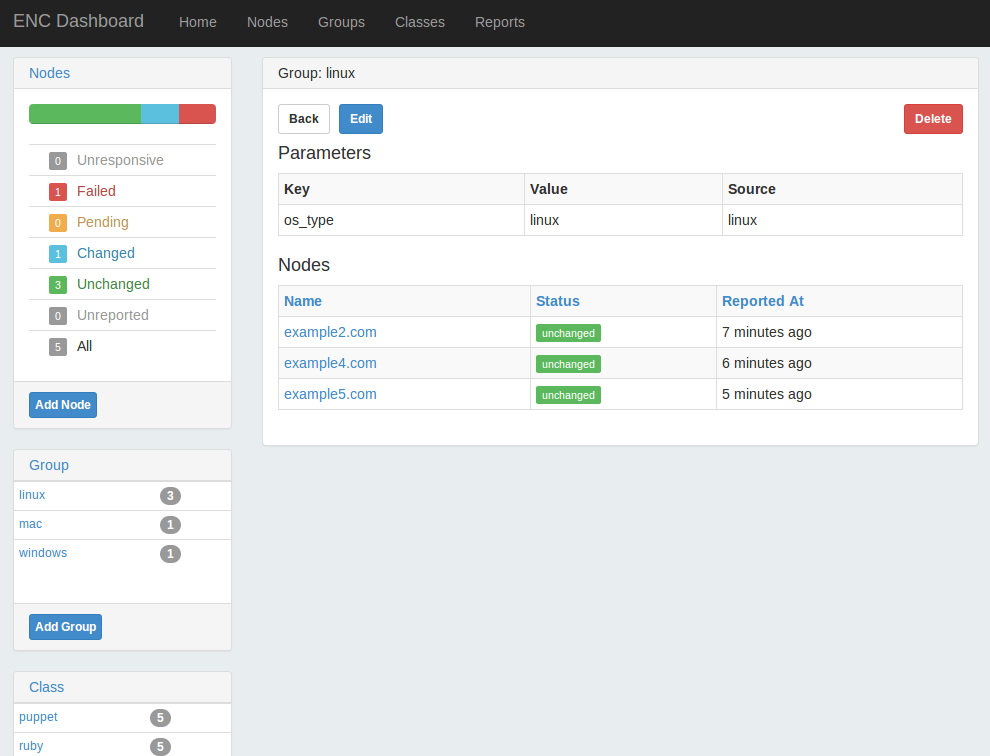
Figure 27-25. ENC Dashboard: Group view
It doesn’t include the external_node classifier script used on the server for submission, so you’d need to copy that from the Puppet Dashboard project. I haven’t tested out this product, but the developer was responsive to inquiries.
You can find more information about ENC Dashboard at https://github.com/jbussdieker/ruby-enc.
Foreman
I’ve listed Foreman last because it isn’t a direct comparison with the Puppet Dashboard. Foreman is a full system management tool that includes plugins for Puppet providing reports and ENC functionality similar to that provided by Puppet Dashboard (see Figure 27-26).
From the Foreman website:
Foreman is a complete lifecycle management tool for physical and virtual servers. We give system administrators the power to easily automate repetitive tasks, quickly deploy applications, and proactively manage servers, on-premise or in the cloud.
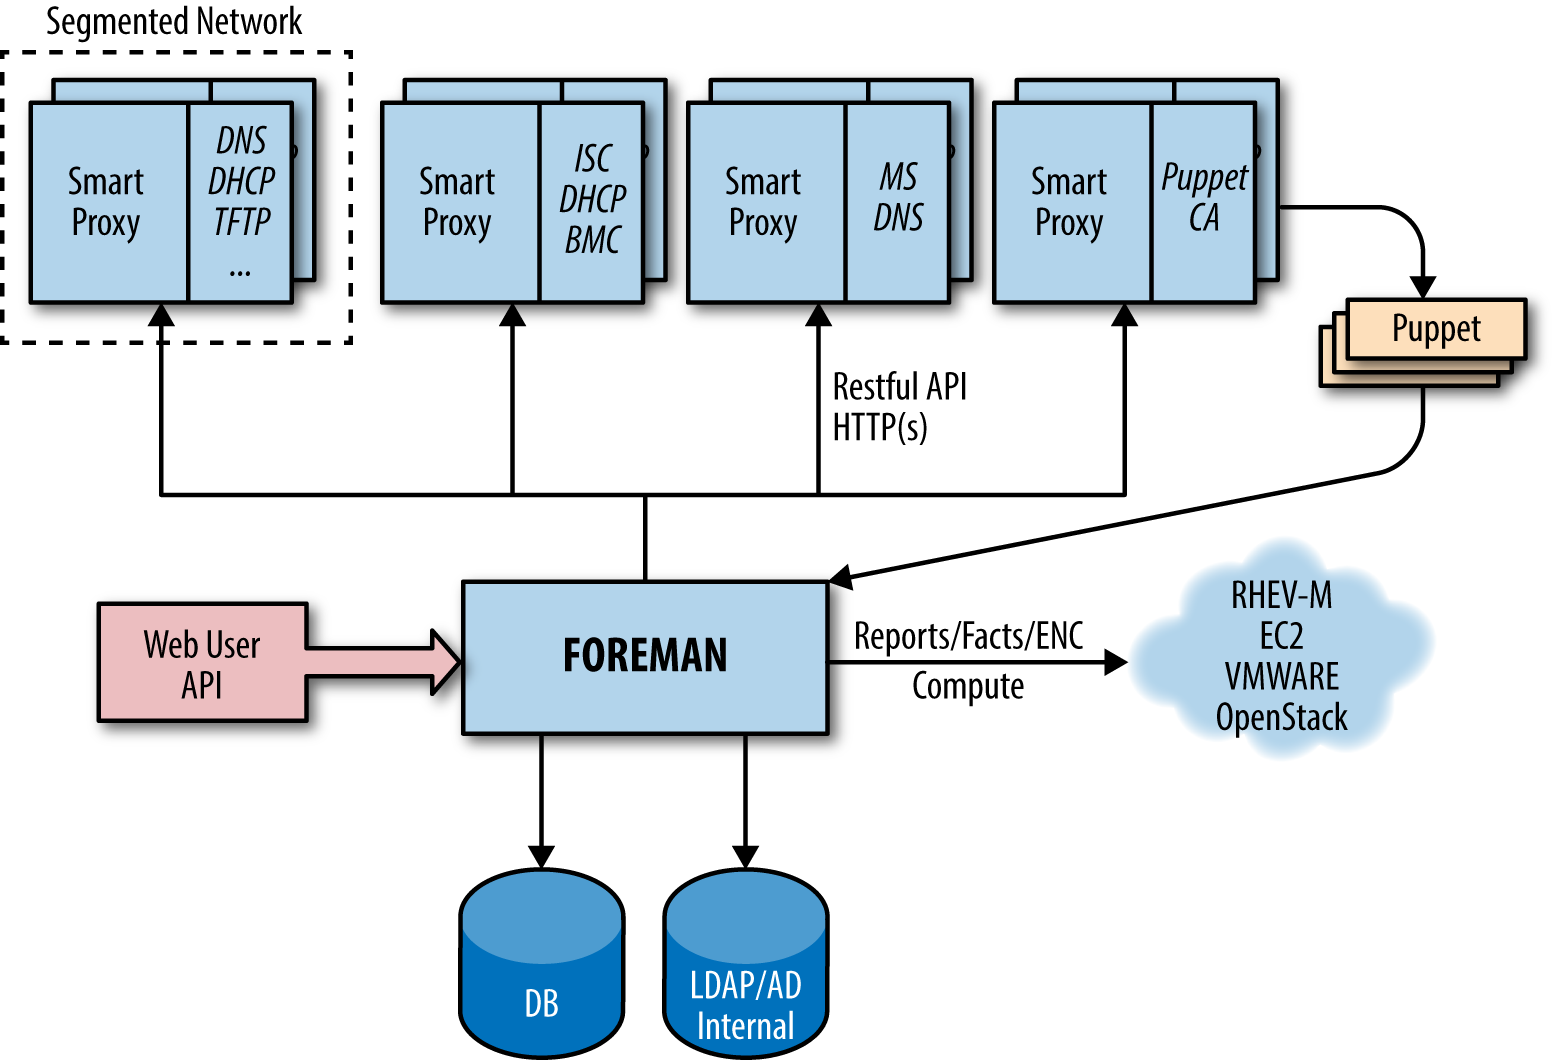
Figure 27-26. Foreman: Architecture
Foreman provides both a dashboard overview of Puppet nodes, and an interface for defining and customizing class and variable assignments for use as an ENC (see Figure 27-27).
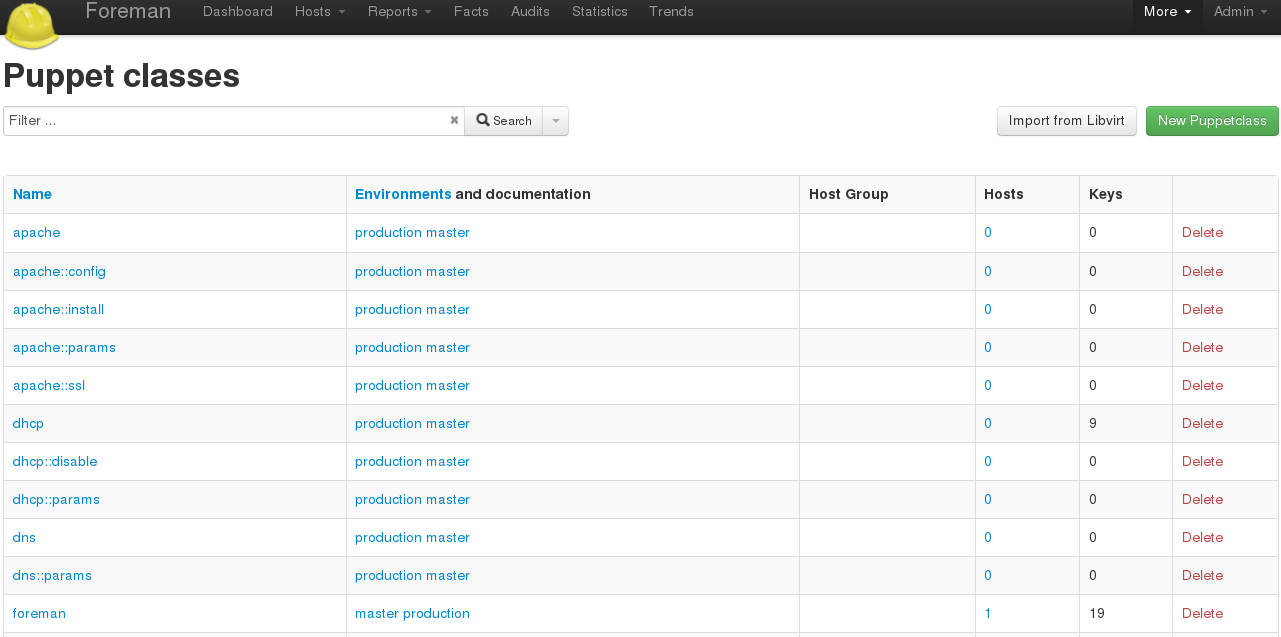
Figure 27-27. Foreman: Puppet classes
You can find more information about Foreman at https://www.theforeman.org/introduction.html. There is a Puppet module officially maintained by the Foreman project at theforeman/foreman on the Puppet Forge.
Foreman is actively developed by RedHat and supporting community members.
Upgrading to the Enterprise Console
Puppet Enterprise provides a full-featured dashboard within the Enterprise Console. The Enterprise Console is a completely rewritten replacement for the Puppet Dashboard that utilizes PuppetDB. It includes all of the functionality provided by the original dashboard, and adds enterprise features and functionality.
Viewing Status
The Enterprise Console provides a clean overview of node and server status (Figure 27-28).
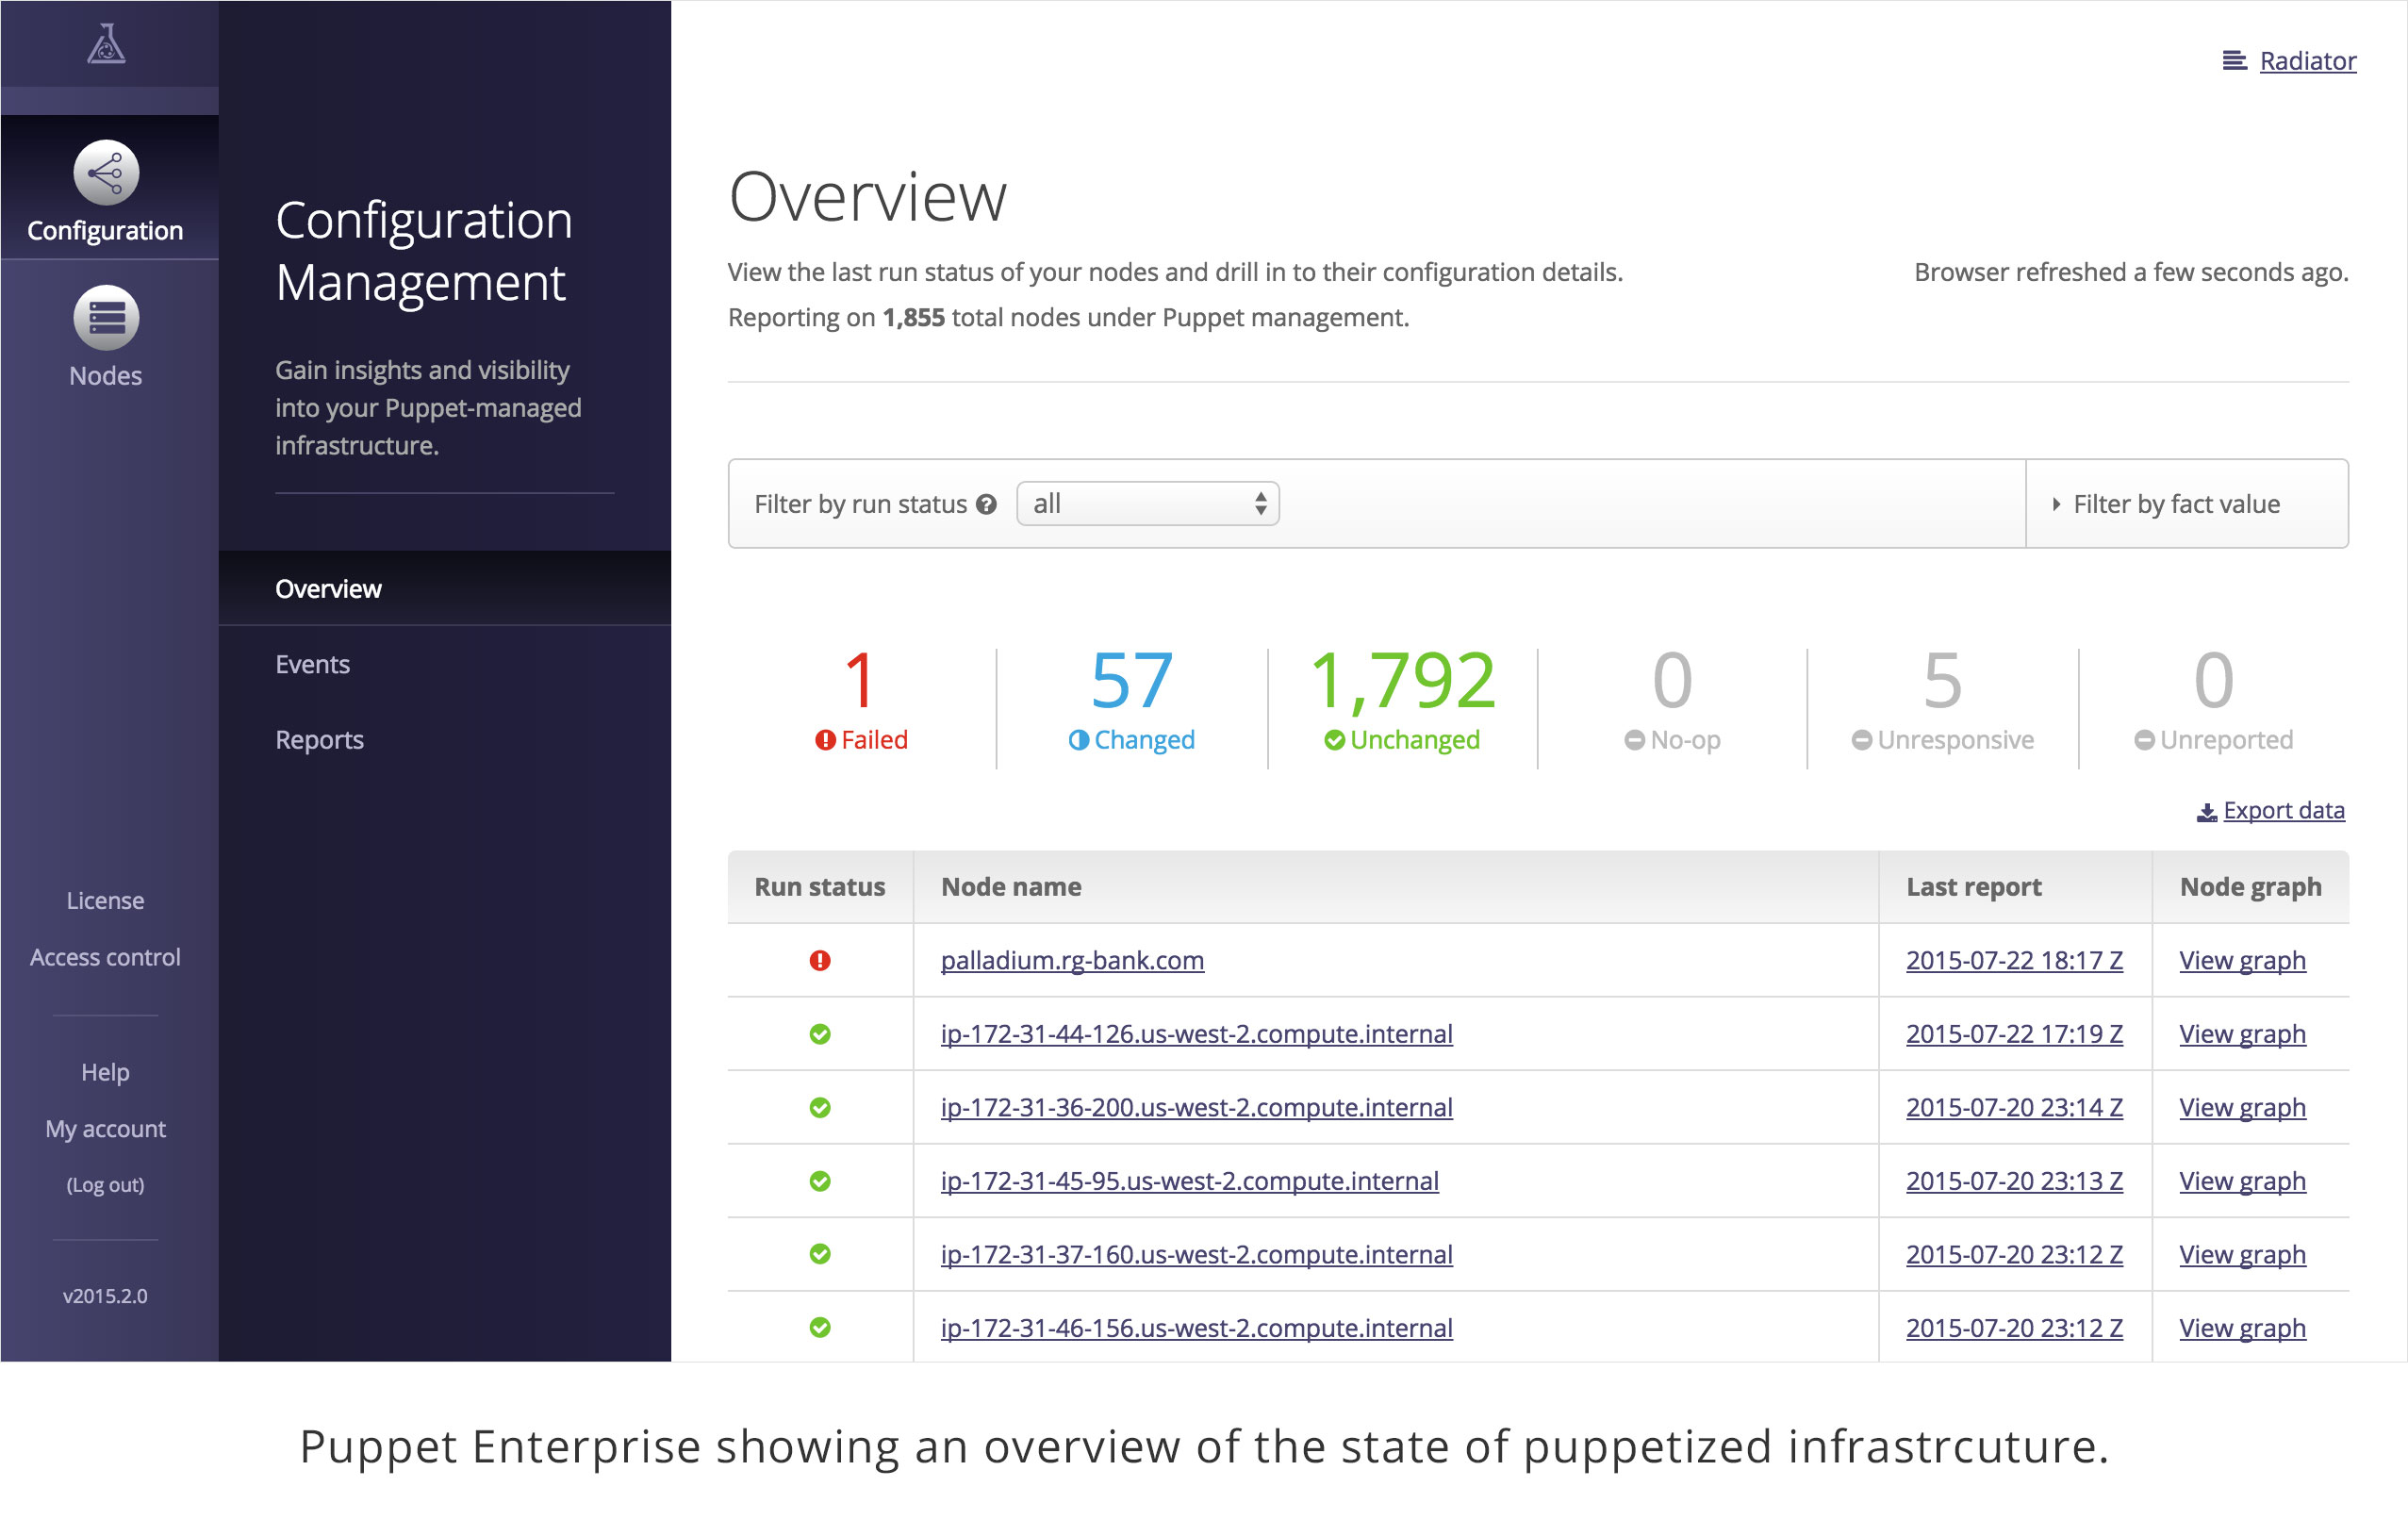
Figure 27-28. Puppet Enterprise: Configuration management overview
From here you can quickly drill down to review details of any event.
Classifying Nodes
The Enterprise Console provides a rules-based classification engine far more capable than the basic grouping functionality provided by Puppet Dashboard (Figure 27-29).
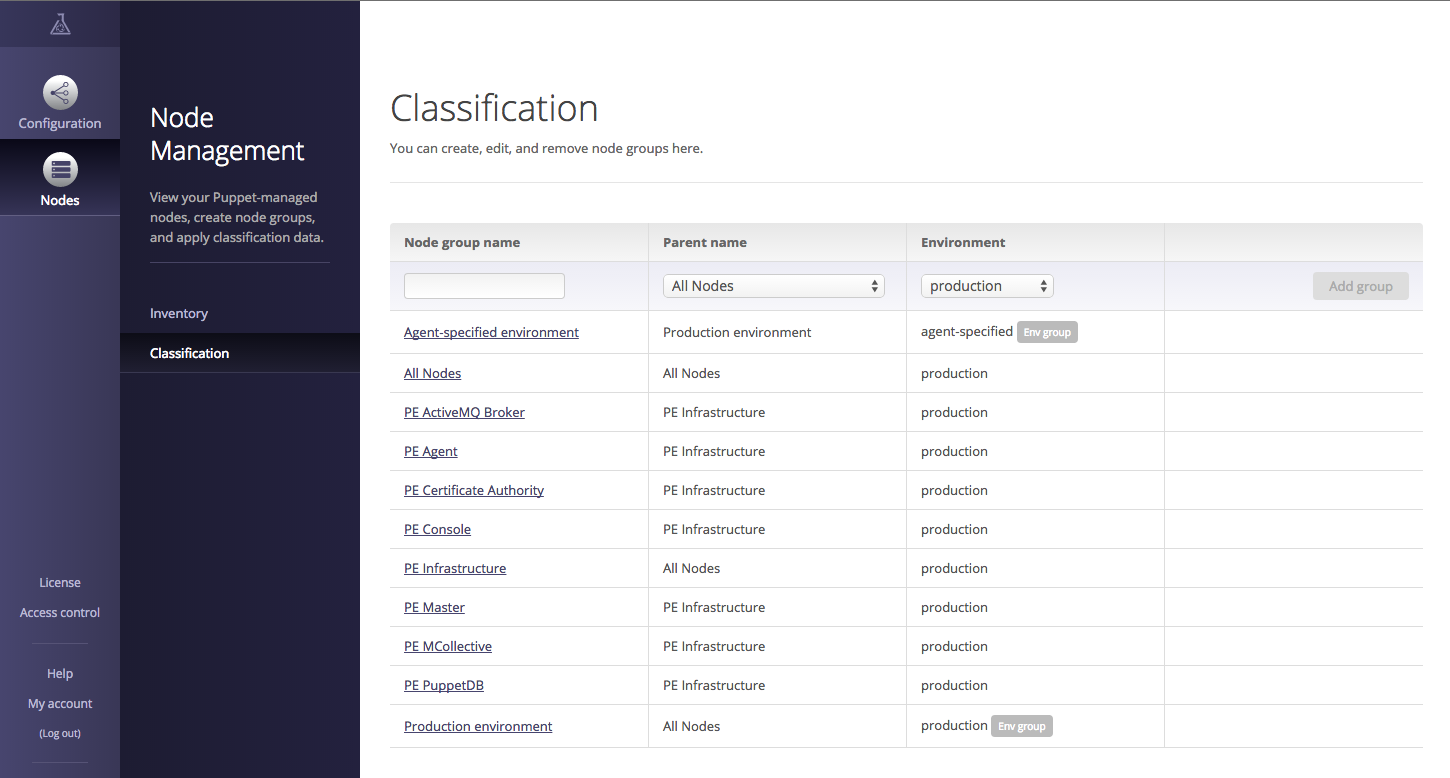
Figure 27-29. Puppet Enterprise: Node management and classification
In addition to grouping nodes and assigning classes and parameters (as done in Puppet Dashboard), rules can use facts and metadata provided by the node to dynamically assign nodes to groups, and override the environment used by the node. This significantly reduces the monotony of setting up many similar nodes.
Inspecting Events
The Enterprise Console provides an interface to view every resource in the node’s catalog to determine the precise reason for the failure (Figure 27-30).
You can click through to find specific details from the attempt to apply the resource on the node. The console provides a visualization of the DAG-model dependency graph of the Puppet catalog, making it possible to visually trace resource relationships.
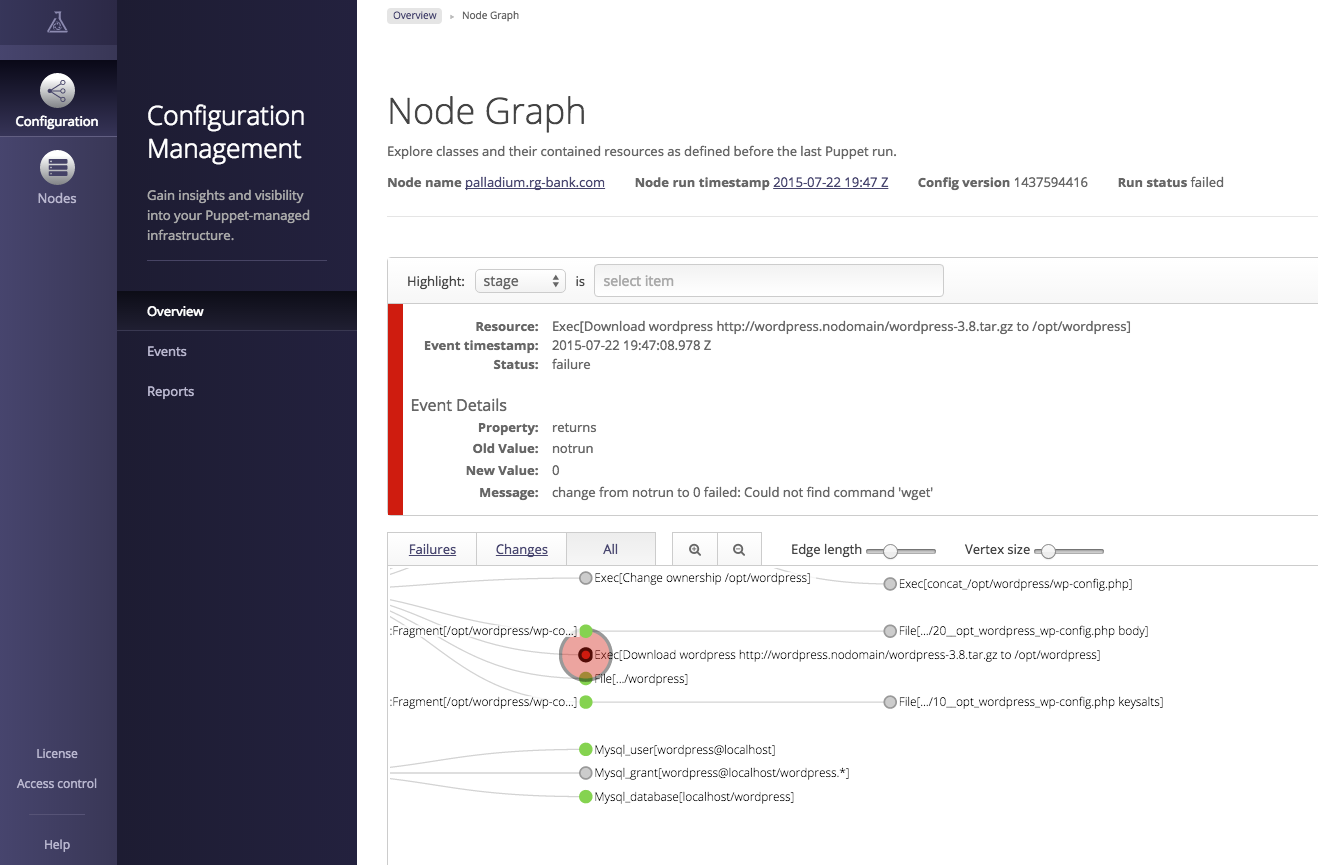
Figure 27-30. Puppet Enterprise: Node graph
Tracking Changes
The Enterprise Console tracks changes on a per-node basis as well as a per-class basis. This makes it easy to determine what changes were applied, and exactly when (Figure 27-31).
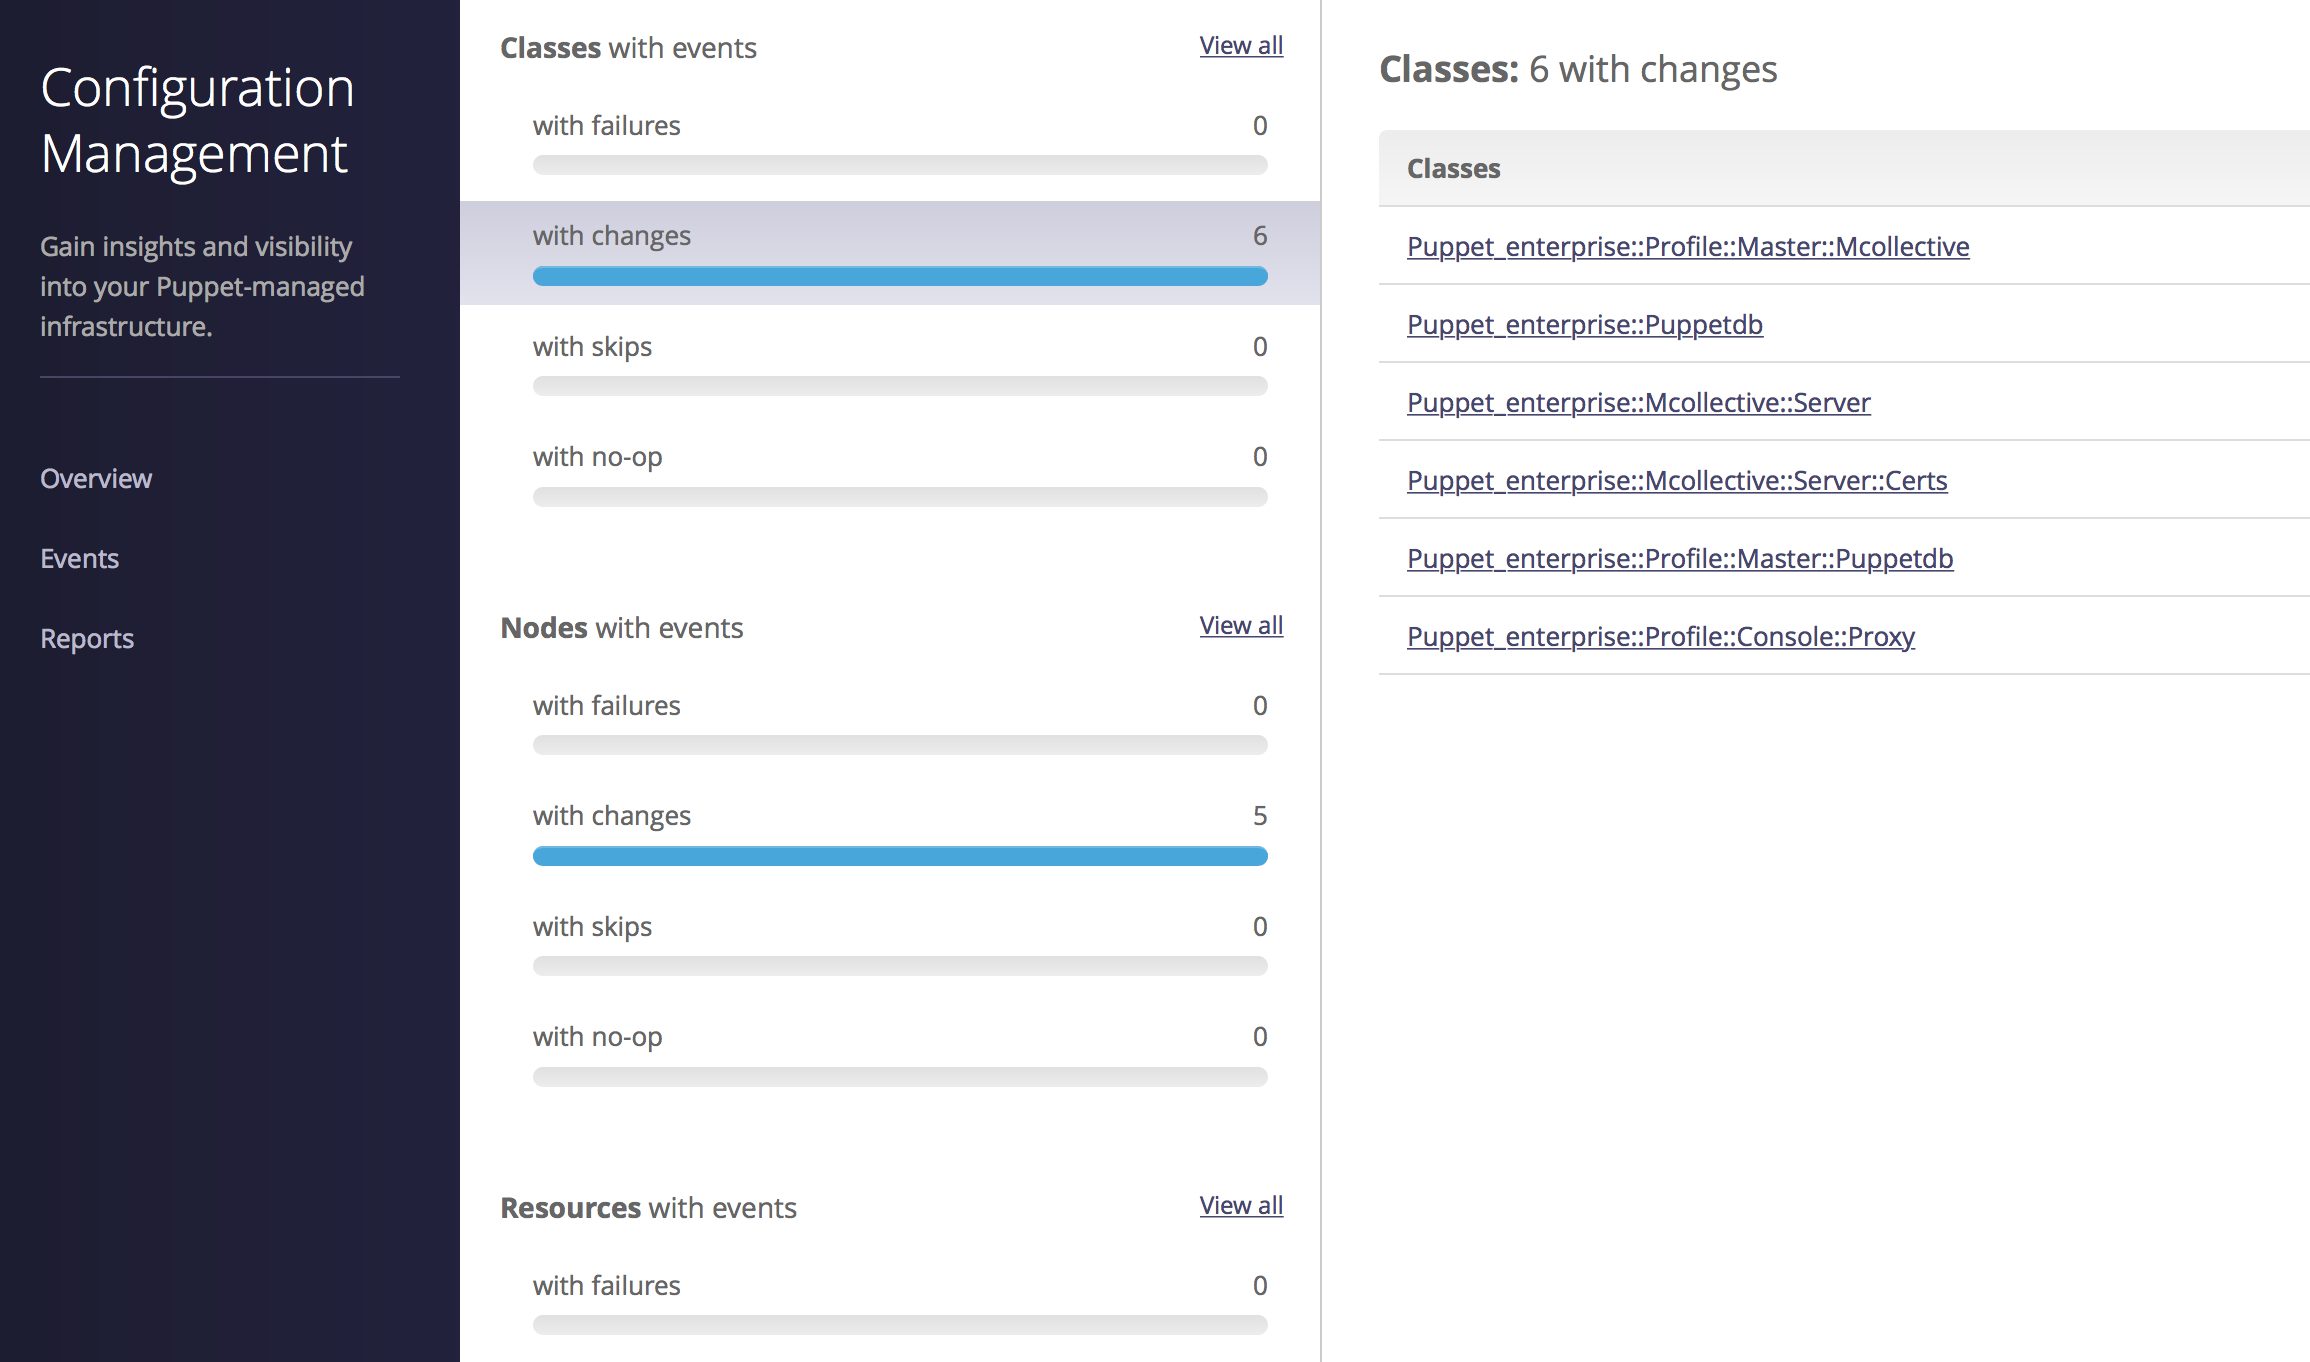
Figure 27-31. Puppet Enterprise: Change management
This allows you to quickly see and react to problems that occur when changes are applied to the nodes.
The Reports interface provides detailed insight into Puppet run reports and statistics, as shown in Figure 27-32.
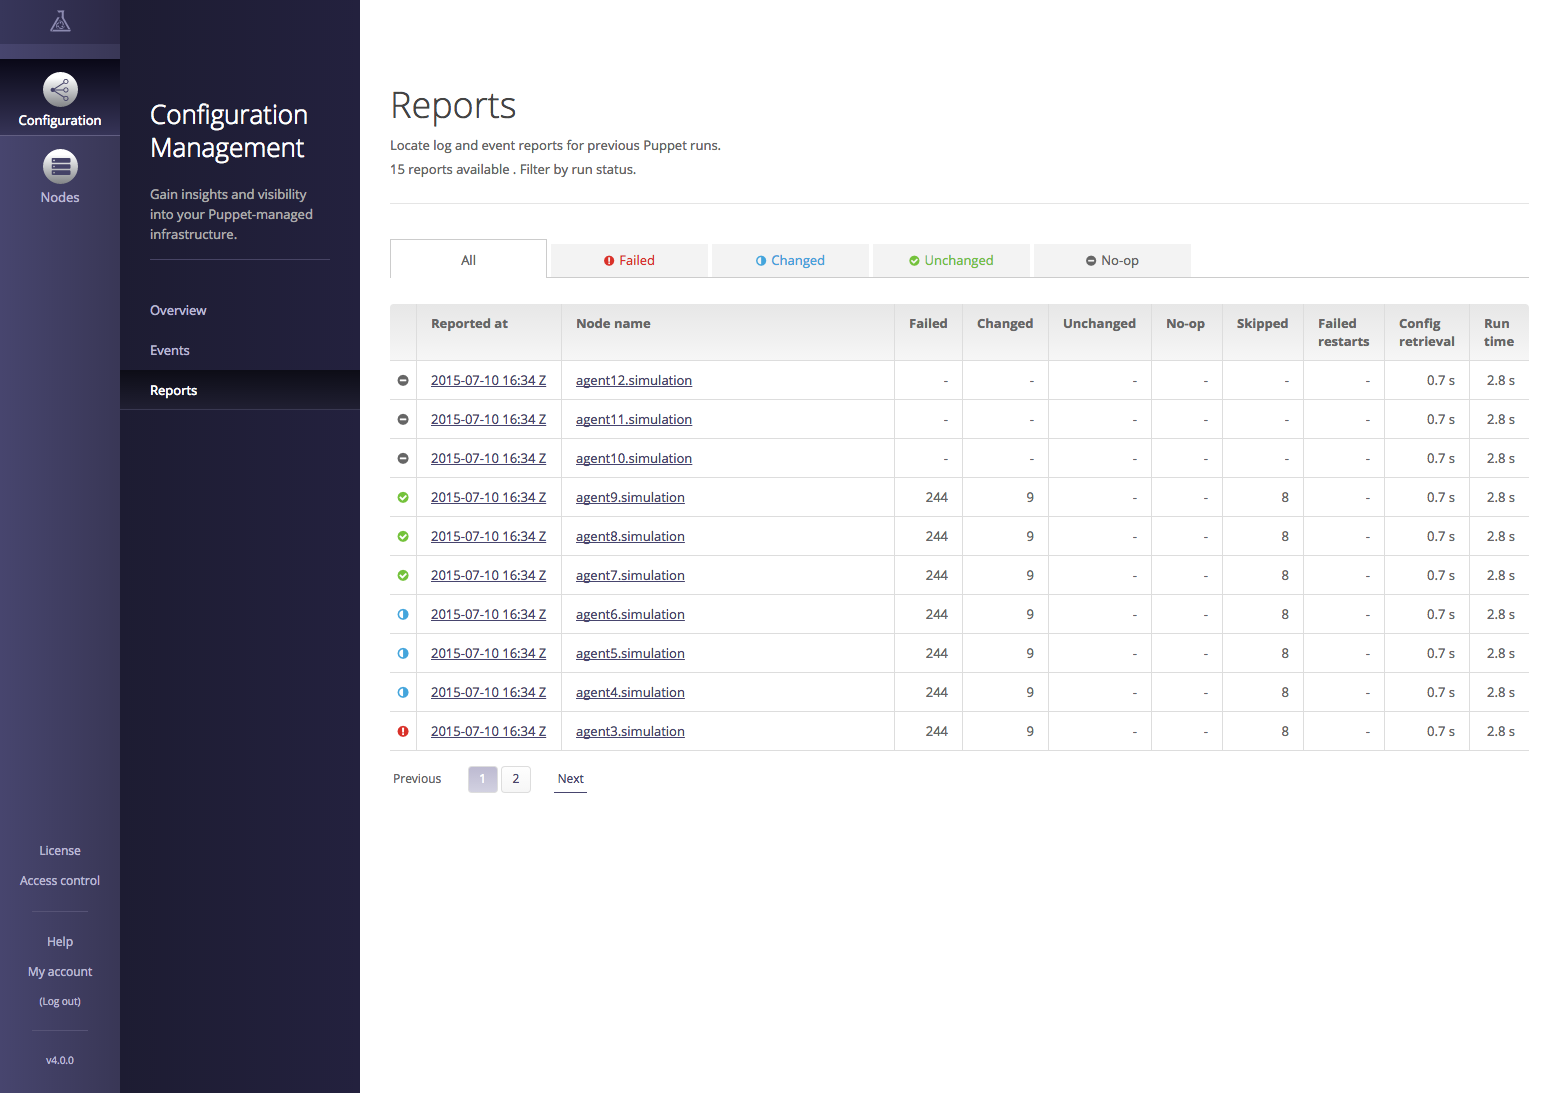
Figure 27-32. Puppet Enterprise: Reports
You can click on a node to see the resources managed on it and their last reported state. Or you can click on the report time and see the history of changes in that report.
Controlling Access
The Enterprise Console provides for granular role-based access control (RBAC). This makes it possible to delegate control over specific resources to individuals and groups within your organization. Users and groups can be defined within the Enterprise Console, or imported from an external authentication mechanism such as LDAP or Microsoft Active Directory.
Evaluating Puppet Enterprise
You can find a comparison of Puppet Open Source and Puppet Enterprise at “What Puppet Enterprise Brings to Puppet” on the Puppet Labs website.
A detailed list of the Puppet Enterprise features that focuses on the Enterprise Console can be found at “Enterprise Features” on the Puppet Labs website.
Puppet Enterprise can be downloaded from the Puppet Labs website and evaluated for free at “Puppet Enterprise Download”.
Finding Plugins and Tools
Following is a short list of tools and plugins that you may find useful. Each of the following descriptions came from the README of the project. I’ve added comments in italics for clarification purposes where necessary:
- https://github.com/manuq/puppet-dashboard-nodefiles-plugin
- Plugin for Puppet Dashboard to add arbitrary files from nodes.
- https://github.com/garethr/puppet-shelf
- A Puppet report processor and a web service that consumes a report and colorfully displays the current state of your Puppet agents. This focuses on two things I think are important: Puppet run time and number of failures during a run.
- https://github.com/xaque208/puppetdashboardmonitor
- A tool for monitoring the highlights of Puppet Dashboard. For example, you can use this to create alarms in a monitoring system for failed Puppet runs.
- https://github.com/simonswine/zabbix-puppetdashboard
- This template allows you to monitor and graph Puppet reports via Puppet Dashboard in Zabbix.
- https://github.com/homeaway/puppetlinker
- A Chrome extension that finds all references to a Puppet file (.pp) from Puppet Dashboard and links them back to a source control repo (e.g., GitHub) where that file originated.
- https://github.com/skylost/puppetdash-rundeck
- A simple Ruby application to integrate Puppet Dashboard with Rundeck. This gets a node list from Puppet Dashboard in the XML format used by Rundeck APIs for building lists.
To find other projects, query GitHub for “puppet dashboard”. Keep in mind that many things on GitHub sound like good ideas but appear to have been abandoned or never started.