Table of Contents for
Beginning Android Programming with Android Studio, Fourth Edition
 Beginning Android Programming with Android Studio, Fourth Edition
Published by
Wrox, 2016
Beginning Android Programming with Android Studio, Fourth Edition
Published by
Wrox, 2016
- Cover
- Contents
- Title Page
- Introduction
- Chapter 1: Getting Started with Android Programming
- Chapter 2: Using Android Studio for Android Development
- Chapter 3: Activities, Fragments, and Intents
- Chapter 4: Getting to Know the Android User Interface
- Chapter 5: Designing Your User Interface with Views
- Chapter 6: Displaying Pictures and Menus with Views
- Chapter 7: Data Persistence
- Chapter 8: Content Providers
- Chapter 9: Messaging
- Chapter 10: Location-Based Services
- Chapter 11: Networking
- Chapter 12: Developing Android Services
- Appendix: Answers to Exercises
- Copyright
- Dedication
- Credits
- About the Author
- About the Technical Editor
- Acknowledgments
- End User License Agreement
Chapter 2
Using Android Studio for Android Development
Chapter 1 covers how to install and initially configure Android Studio for the purposes of developing Android applications. This chapter explains how to navigate the intricacies of Android Studio in a way that helps you develop applications more easily and with great efficiency.
Android Studio contains myriad features to help everyone from the greenest novices to the most senior superstar developers. By the time you finish this chapter, you will be able to navigate through the features of Android Studio with confidence, produce code that is easy to read and easy to reuse with the help of refactoring, save and share your code to GitHub, and use breakpoints to quickly find problems in your applications.
Let's begin by examining the features of Android Studio.
EXPLORING THE IDE
In this section you explore the Android Studio Integrated Development Environment, which is also known as the IDE. Basically, the IDE is the interface between you and Android Studio. The more you know about the tools, windows, and options that are available to you in Android Studio, the faster you will be able to produce code and the more confident you will be at creating applications.
- If you haven't already, open Android Studio. If you worked through Chapter 1, you created a very quick Hello World project. You are going to create another quick project for this chapter; this time, however, you explore the different options available as you start up and work with your project.
- Now that you have opened Android Studio, you see should a screen that looks like Figure 2.1.
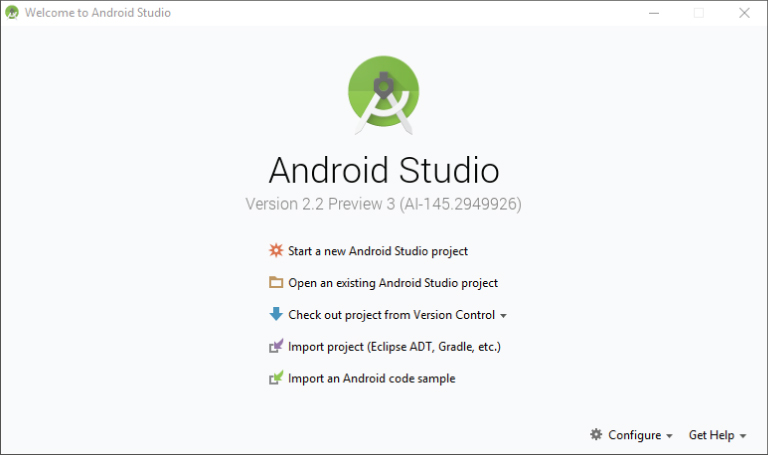
- The Android Studio welcome screen contains an option for you to open existing projects that you might have already created in Android Studio. It also presents options for opening a project from VCS, and importing projects from other IDEs, such as Eclipse.
- Click the Start a New Android Studio Project option from the Android Studio welcome screen. You should now see the Create New Project screen (shown in Figure 2.2), which enables you to configure some of the basic options for your project.
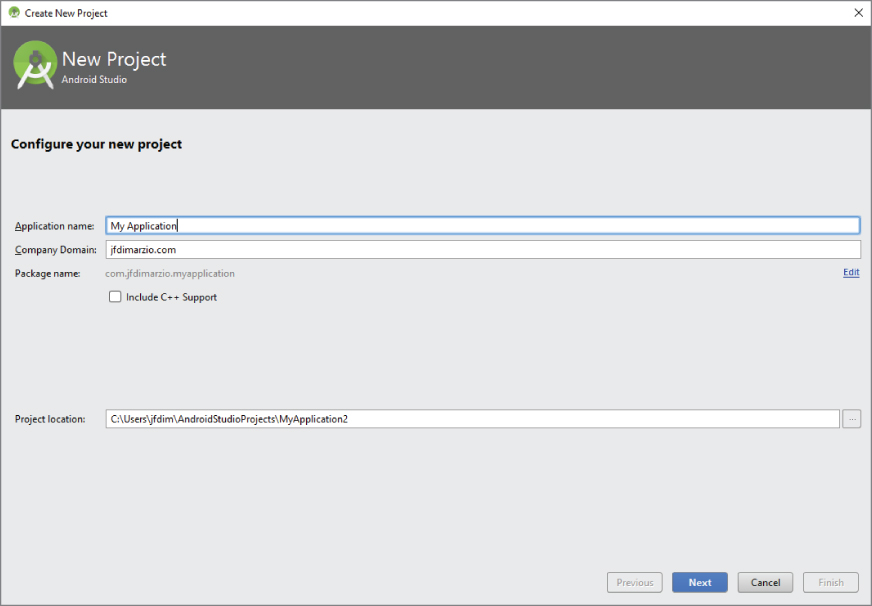
The first option you have is to name your project. Let's call this one IDEExplorer. The second option—the Company Domain—is very important because it is used to name the Java package to which your code will belong. You can type any name that you want into this field. There is no validation to check that you actually own the domain that you specify, but you should try to use a valid domain. I have used jfdimarzio.com. As you can see from the Package Name line, Android Studio automatically reverses your company domain to create the package name.
The final option on the Create New Project screen is the path to which Android Studio will save your new project. I typically accept the default here because it makes it easier for me to find projects in the future. However, feel free to specify any valid location that you want to use—it will not affect this tutorial. Click Next to continue.
The next screen allows you to select the form factor on which your application will run (see Figure 2.3). For the purposes of this book, you exclusively use Phone and Tablet. The version of Android is Android N (or Nougat, depending on the version of the SDK you downloaded. As of the writing of this book, the name was officially announced as Nougat, but the SDK was still labeled N).
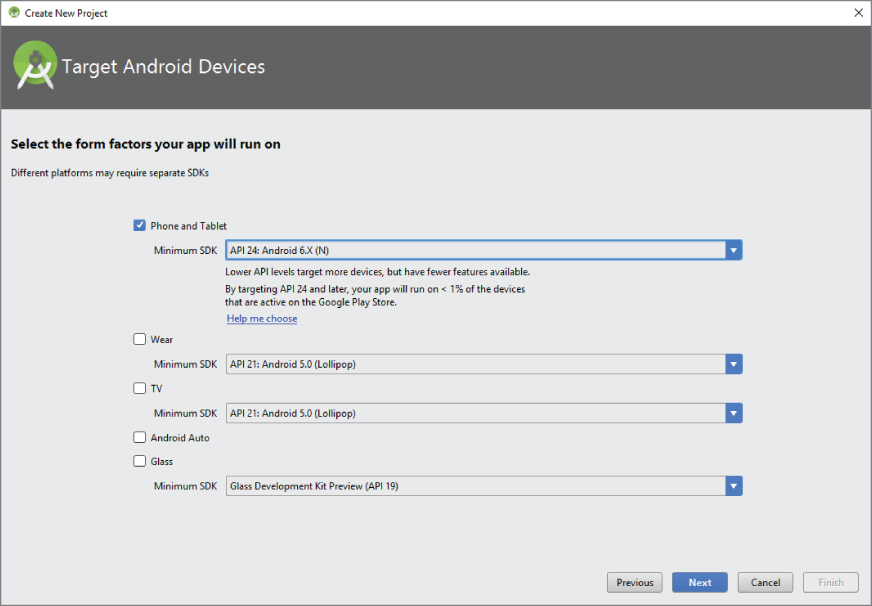
The other options on this screen allow you to create applications that run on Android Wear, Android Auto, and the elusive Google Glass. If you are feeling adventurous after reading this book, feel free to try some of these other application form factor options. For now, make sure to select Phone and Tablet and Android N and click Next to continue.
The next screen is the Add an Activity to Mobile screen, as shown in Figure 2.4. This screen is a helper that adds commonly used features to your project at the time the project is created. The options on this screen range from Add No Activity to Tabbed Activity. For example, if you were to select the Google Maps Activity option, Android Studio would create for you a project with a basic activity that contains a Google Map in it already. This can drastically cut down on the amount of time needed to create some types of applications.
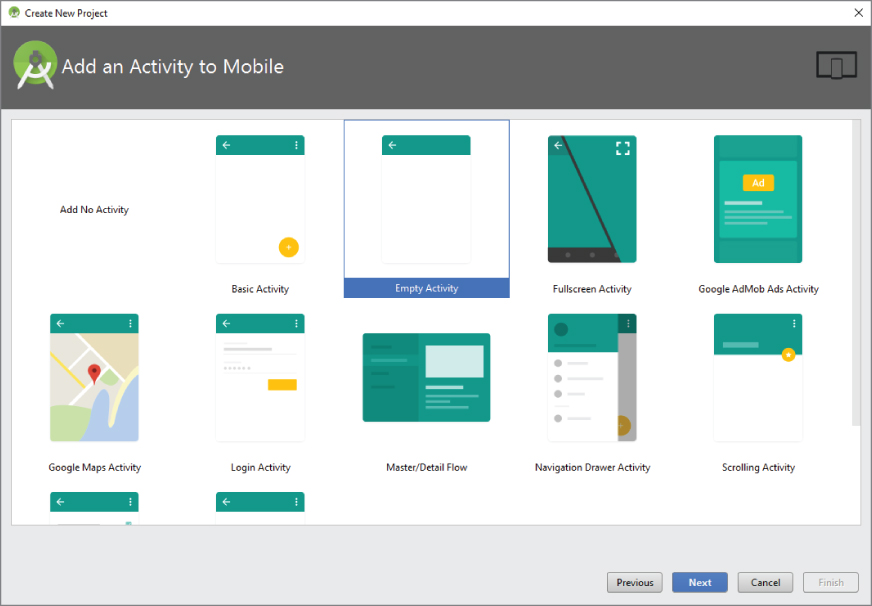
The default option is Empty Activity. This is the most useful for our examples because it creates a basic activity for you, with no code in it—thus allowing you to easily follow the examples in this book.
Click Next to go to the Customize the Activity screen, as shown in Figure 2.5.
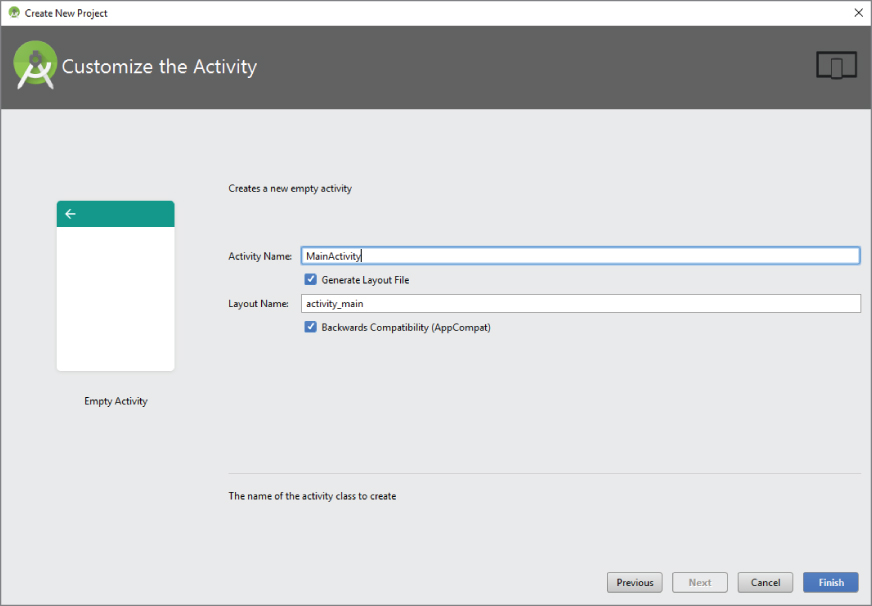
The Customize the Activity screen contains two options, one for naming your activity, and one for naming the main layout (presumably to be used by the main activity). Let's explore these two options.
- It is accepted practice in Android development to name your main activity—that is, the activity that is loaded on startup by your application—as
MainActivity. The reason for this is to make it easier to locate the startup code for your application. If anyone else needs to look at or work with your application, they should know that theMainActivityis the starting point. All other activities can be named by their function, for exampleInputFormActivityorDeleteRecordActivity. - The layout file follows the “name” naming convention. The startup layout, that is the layout for the screen elements that will be displayed when your application is started by the user, is the
activity_mainlayout. All other layouts should be named according to the activity that they support (activity_input,activity_delete).
Click the Finish button to finish creating the project and jump into exploring the IDE.
The Android Studio IDE should now be visible to you as shown in Figure 2.6.
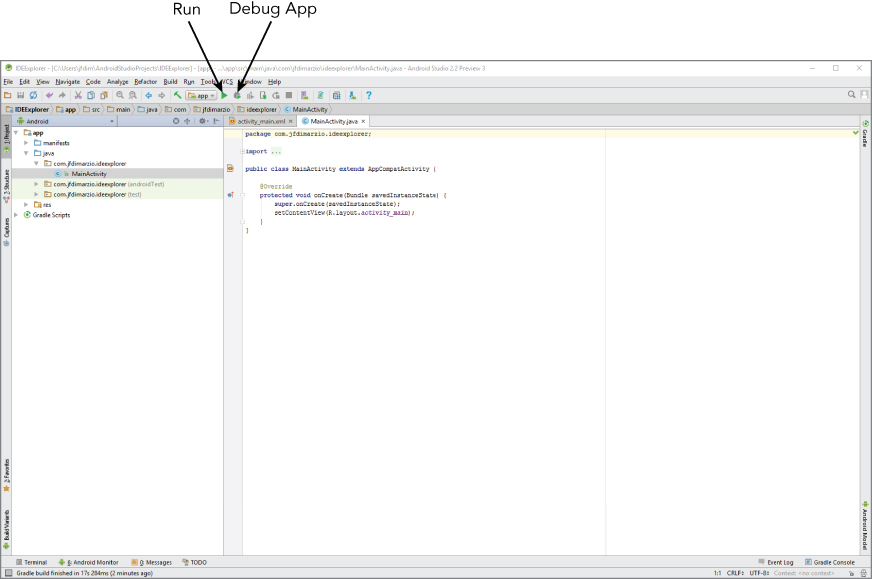
The upper portion of the IDE represents the menu bars or ribbons. Here, as with most applications that you have used in the past, you have all of your options for interacting directly with the IDE. The most important ones to note are the green arrow, which represents the Run app option, and the green arrow with a bug behind it, which is the Debug App option. The Debug App option is arguably the one that you use the most in this book.
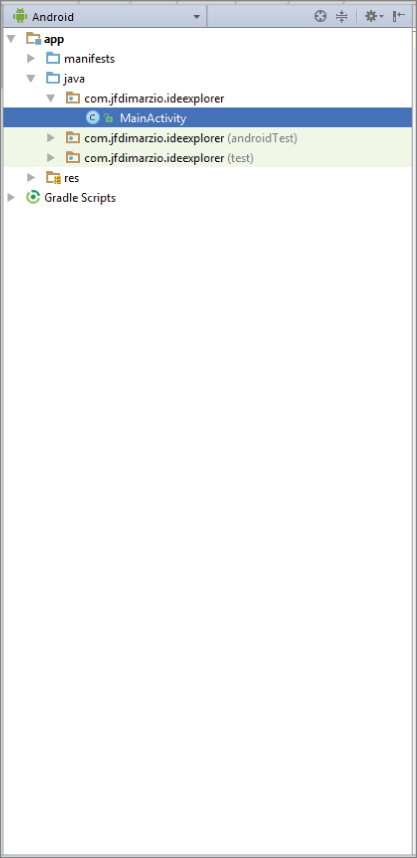
By default, the left side of the IDE shows the Project window, as shown in Figure 2.7. The Project window enables you to quickly navigate the files within your project. By default, the Project window is set to the Android view (seen just above the Project window display). To change the view, click the word Android and use the drop-down list of options to make the change. I like to keep mine on Project view when I am working.
On the right side of the IDE (and taking up the largest area) are the Editor tabs (see Figure 2.8). The Editor tabs are where you write and work with your code files.
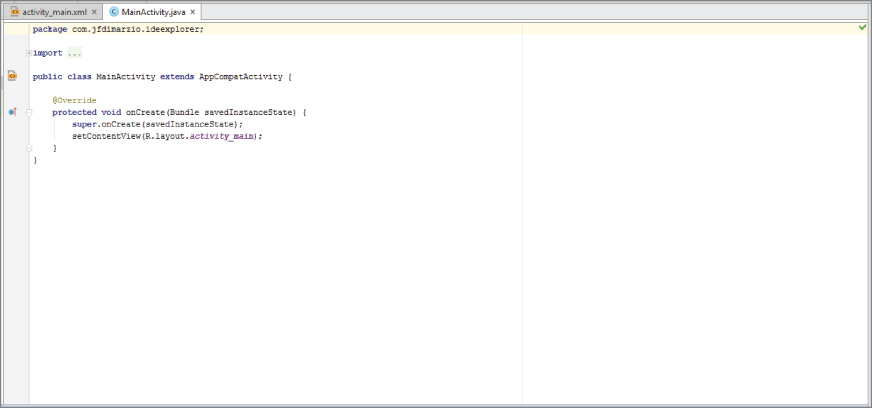
To work on a new file, simply locate the file in the Project window and double-click it to open a new Editor tab that contains that file's code. If you need to create a new file from scratch, right-click the directory into which you want to place your file, and select New ![]() <File Type> from the context menu.
<File Type> from the context menu.
Finally, at the bottom of the IDE, you should see a button labeled Android Monitor. Click this button to open the Android Monitor (see Figure 2.9).
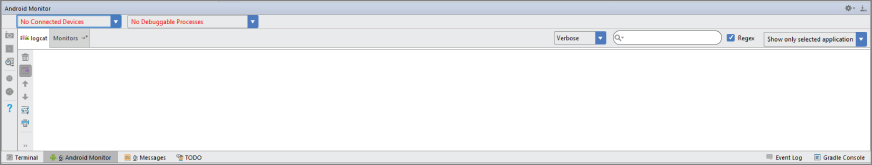
The Android Monitor automatically displays when you debug an application. It contains a very useful tool called logcat. Logcat displays most of the helpful messages that are output by your application while you are trying to debug it. In future chapters, you will make use of logcat—including writing custom messages to it.
USING CODE COMPLETION
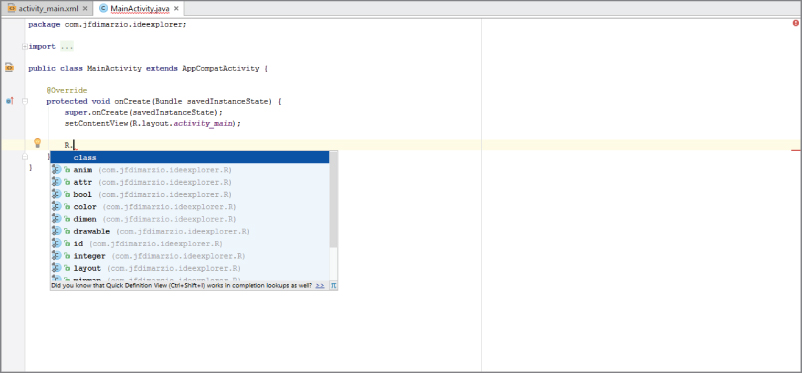
Code completion is an invaluable tool that shows you contextual options for completing the piece of code that you are trying to write. For example, in the editor tab for the MainActivity.js file, locate the line that reads
setContentView(R.layout.activity_main);Place your cursor after this line and press the Enter key. On the new line, type the letter R, and then type a period, as shown here:
R.Android Studio Code Completion should display a list of values that you could use to try to complete the code statement. Figure 2.10 shows what this list might look like. This is important if you are not entirely sure of the spelling of a method call or of how to identify the different method signatures.
You can also use code completion to insert code stubs into your classes. If you are inheriting from a class that has methods you must override, code completion notifies you that there are methods that need to be overridden. With a click, it inserts the stubs of those methods into your application.
Finally, the ability to import packages is one of the Android Studio features and its code completion implementation that you will use most often while navigating the examples in this book. For example, if you were to attempt to create a variable of a type that belongs to a package that you have not imported, Android Studio recognizes this and underlines the type with a red squiggle. Set the cursor to that line and press Alt+Enter to automatically import the package into a using statement at the top of your code file.
DEBUGGING YOUR APPLICATION
After you have built an application, you need to be able to debug it and see what is going on inside your code. One of the handiest ways to be able to see inside your code it through the use of breakpoints. Breakpoints allow you to pause the execution of your code at specific locations and see what is going on (or what is going wrong). Let's take a look at how to use breakpoints in Android Studio.
Setting Breakpoints
Breakpoints are a mechanism by which you can tell Android Studio to temporarily pause execution of your code, which allows you to examine the condition of your application. This means that you can check on the values of variables in your application while you are debugging it. Also, you can check whether certain lines of code are being executed as expected—or at all.
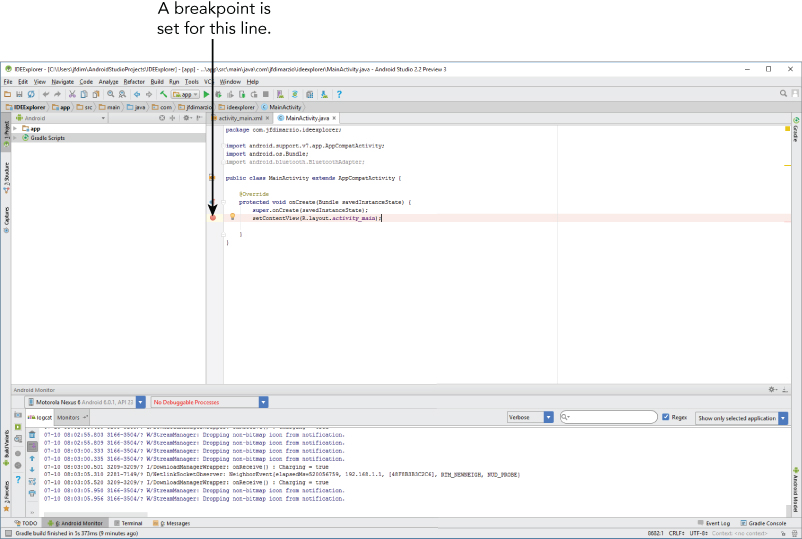
To tell Android Studio that you want to examine a specific line of code during debugging, you must set a breakpoint at that line. Click the margin of the editor tab next to line of code you want to break at, to set a breakpoint. A red circle is placed in the margin, and the corresponding line is highlighted in red, as shown in Figure 2.11.
You can also set a breakpoint by placing your cursor in the line of code where you want it to break and clicking Run ![]() Toggle Line Breakpoint. Notice that the term used is toggle, which means that any breakpoints you set can be turned off the same way you turn them on. Simply click an existing breakpoint to remove it from your code.
Toggle Line Breakpoint. Notice that the term used is toggle, which means that any breakpoints you set can be turned off the same way you turn them on. Simply click an existing breakpoint to remove it from your code.
Let's say that you do not know the exact line of code where you want the break to be. You might want to check on the condition of your code when a specific method is called. You can set a method breakpoint by selecting Run ![]() Toggle Method Breakpoint. A method breakpoint is represented by a red circle containing four dots placed at the method signature, as shown in Figure 2.12.
Toggle Method Breakpoint. A method breakpoint is represented by a red circle containing four dots placed at the method signature, as shown in Figure 2.12.
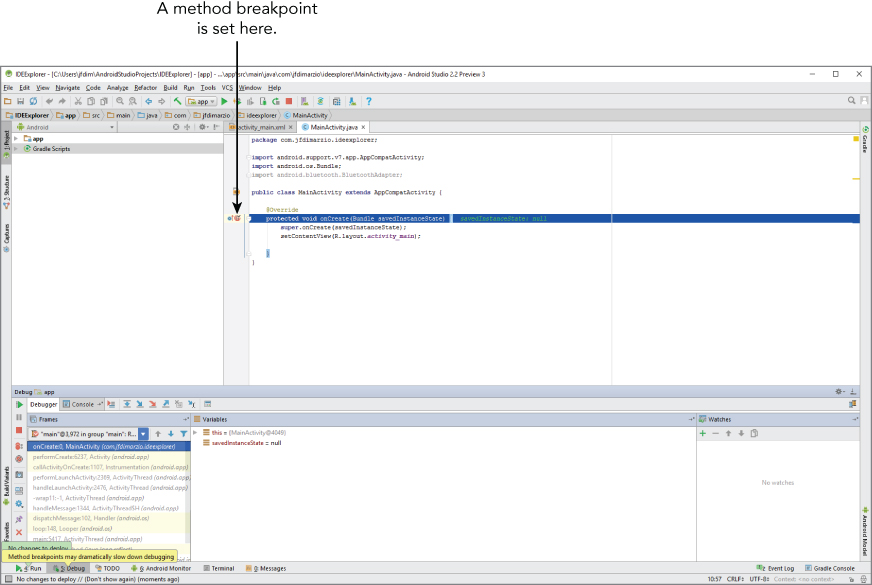
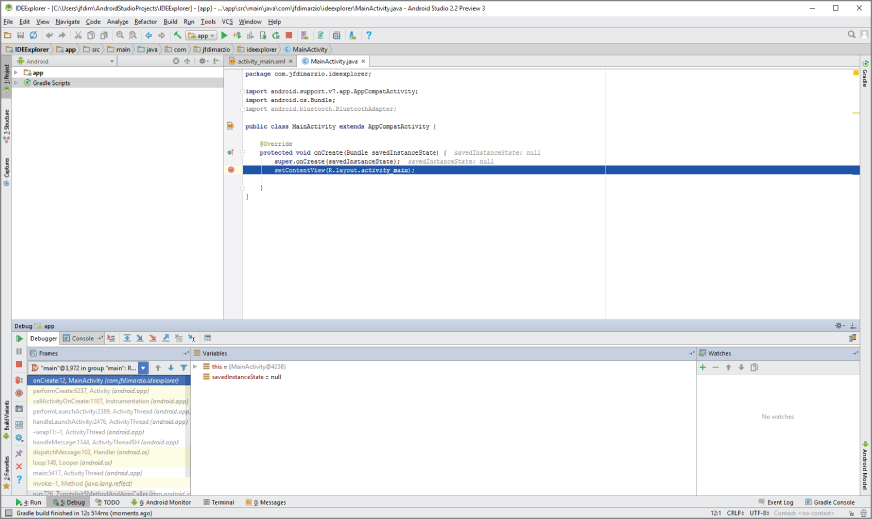
Notice in the lower left-hand area of Figure 2.12 that Android Studio has issued a warning that method breakpoints can dramatically slow down debugging. This is because method breakpoints do more than simple breakpoints in their default state. By default, method breakpoints are set apart from simple breakpoints. Android Studio pauses execution when the method is hit, and it also automatically sets a corresponding breakpoint and pauses at the end of the method (as shown in Figure 2.13).
Thus far, I've discussed simple and method breakpoints. However, there are two other types of breakpoints that you examine in this section: temporary breakpoints and conditional breakpoints.
Temporary Breakpoints
A temporary breakpoint is useful when you are trying to debug a large loop, or you just want to make sure a line of code is being hit during execution. To set a temporary breakpoint, place your cursor at the location in the code where you want it to break and select Run ![]() Toggle Temporary Line Breakpoint. Notice that a red circle containing a 1 is now placed in the margin (once you set the conditions as shown in Figure 2.14).
Toggle Temporary Line Breakpoint. Notice that a red circle containing a 1 is now placed in the margin (once you set the conditions as shown in Figure 2.14).
The 1 in the red circle represents the fact that Android Studio only stops at this breakpoint the first time your code enters it. After that, the line is executed as though there is no breakpoint set. This can be very useful if you want to ensure a line within a loop is being hit, but you don't want to stop at the line every time it is executed.
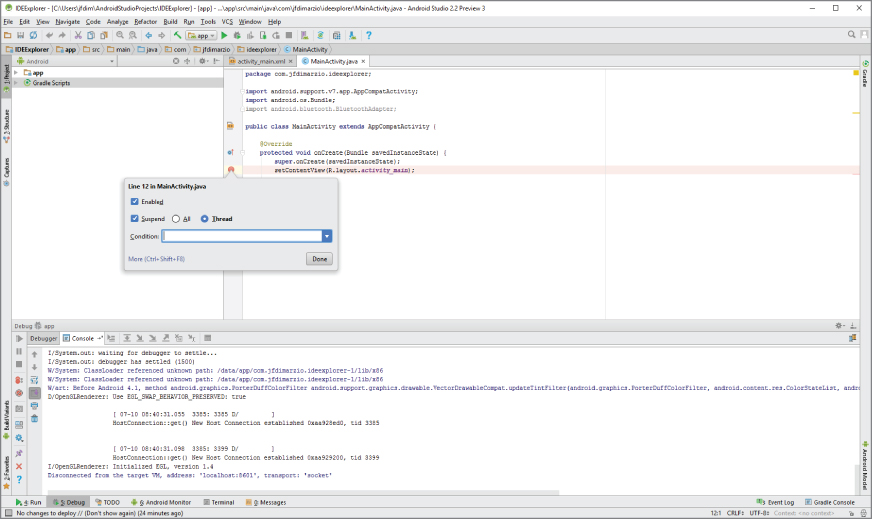
However, let's say that you want to ensure that a line within a loop is only being called when a specific variable is set to true (or something similarly complex). In such a case, you can use a conditional breakpoint.
Conditional Breakpoints
A condition breakpoint is a breakpoint at which Android Studio only pauses when specific conditions are met. To set a conditional breakpoint, first set a simple breakpoint at the line of code you want to examine, then right-click the simple breakpoint to bring up the condition context menu (refer to Figure 2.14).
From here you can set conditions that tell Android Studio when to pause at a breakpoint. For example, you can tell Android Studio to only pause at a line of code when your variable named foo equals true. You would then set the condition in the breakpoint to
foo == trueConditional breakpoints are extremely useful in diagnosing intermittent issues in complex code blocks.
Navigating Paused Code
While in debug mode, Android Studio pauses at any breakpoint that you have set. That is, as long as a breakpoint has been set on a reachable line of code (a line of code that would be executed by system), Android Studio halts execution at that line until you tell it to continue.
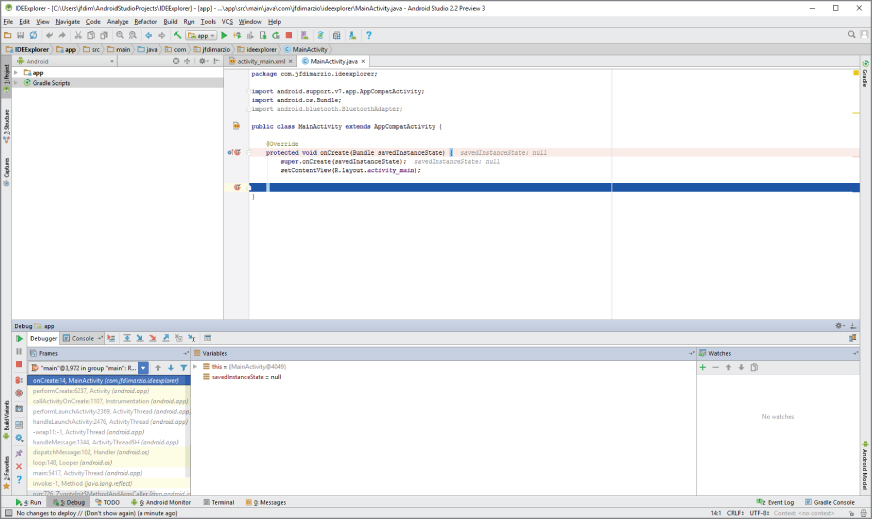
When Android Studio hits, and pauses at, a breakpoint, the red circle in the margin next to the corresponding line of code changes to a circle with a check mark (see Figure 2.15).
Once a breakpoint has been hit, the debug window opens at the bottom of Android Studio, as shown in Figure 2.16. The debug window contains many of the tools you use to navigate around your code.
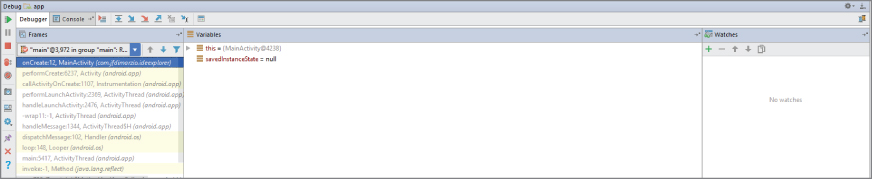
Notice the navigation buttons located in the menu bar of the debug window. The most commonly used are Step Over and Step Into. Step Over advances you to the line of code that immediately follows the one at which you are currently paused. This means that if you are paused at a method call, and you press Step Over, Android Studio executes the method call without pausing and then pauses again when execution reached the next line. However, what if an exception happens in that method call and execution never reaches the next line of code? For these situations use Step Into.
Step Into follows execution wherever it leads in the code. Therefore, if you are paused at a method call and click Step Into, Android Studio will shift the view to the method call and pause execution at the first line of code within that method. This allows you to then follow the execution of that method line-by-line before it returns to the calling block.
PUBLISHING YOUR APPLICATION
After you have created, and fully debugged, your application, you might want to deploy it to the Google Store for others to enjoy. The following sections outline the steps for publishing your applications.
Generating a Signed APK
To publish your finished application on the Google Play Store, you must generate a signed APK (the Android application package). The APK is the compiled, executable version of your application. Signing it is much like signing your name to a document. The signature identifies the app's developer to Google and the users who install your application. More importantly, unless your Android Studio is in developer mode, unsigned applications will not run. Use the following steps to generate a signed APK:
- Generate a signed APK from your code by selecting Build
 Generate Signed APK from the Menu bar to bring up the Generate Signed APK window as shown in Figure 2.17.
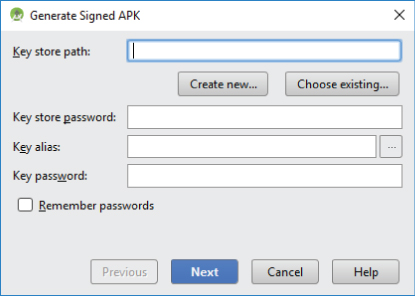
- Assuming you have never published an application from Android Studio, you need to create a new key store. Click the Create New button to display the New Key Store window (see Figure 2.18).
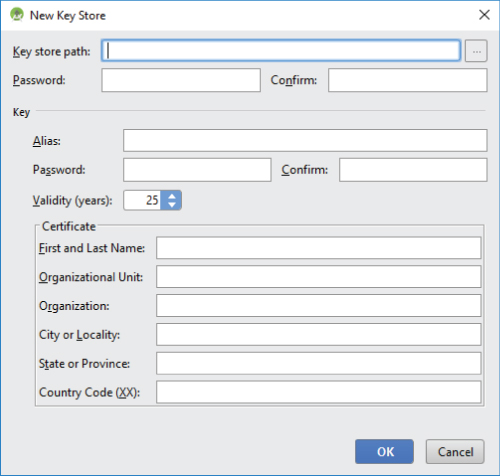
- Fill out all of the information on this form because it pertains to your entity and application.
Notice that there are two places for a password. These are the passwords for your key store and your key, respectively. Because a key store can hold multiple keys, it requires a separate password than that of the key for a specific app.
- Click OK to return to the Generate Signed APK window.
- In the Generate Signed APK windows, click Next to review and finish the process.
Now that you have a signed APK, you can upload it to the Google Play Store using the developer console at https://play.google.com/apps/publish/.
SUMMARY
Android Studio is a powerful IDE that contains many tools. In this chapter you learned how to navigate the different areas of the Android Studio IDE, such as the Project window and the Editor tabs. You also learned how to set breakpoints and navigate through paused code.
EXERCISES
- When you are creating a new Android project, for what is the Company Domain field used?
- For what is the Add an Activity to Mobile screen used?
- What is Android Code Completion?
- What is a breakpoint?
You can find answers to the exercises in the appendix.
WHAT YOU LEARNED IN THIS CHAPTER
| TOPIC | KEY POINTS |
| Android Studio IDE | Create a new project |
| Name the Java package | |
| Name the main entry point for your application | |
| Code Completion | Provides contextual information for completing your code |
| Breakpoints | Paused only while in debug mode |
| Simple | |
| Temporary | |
| Method | |
| Conditional |