Table of Contents for
Testable JavaScript
 Testable JavaScript
Published by
O'Reilly Media, Inc., 2013
Testable JavaScript
Published by
O'Reilly Media, Inc., 2013
Chapter 8. Automation
The point of writing testable JavaScript is so that you and your colleagues can easily fix and maintain the code going forward; hence it is a good skill to possess. Writing tests for future versions of the code becomes easy, and this solid foundation makes automation much more effective. Automation ensures that you can write testable JavaScript in a repeatable way as quickly as possible. When considering automation, you must know what to automate, when to automate, and how to automate.
What to Automate
Determining what to automate is easy: automate everything! This includes JSLint and other forms of static analysis, all tests, code coverage reports, application packaging, and application deployment, including rollback, feedback, bug submission, statistics, and bucket or feature testing. Anything you have to do more than once should be automated. Any time you use up front to automate will be more than paid back over the lifetime of your code.
When to Automate
In terms of when to automate, you have three opportunities: while coding, while building, and while deploying. These three points in the software development process all have different requirements, even if some of the tools you use for each process are the same. For instance, the process for deploying your code to test it while under development may be different from the process for deploying the code to production. As much as those two processes should be kept the same, in reality they are different. Deploying code to a test virtual machine is different from deploying it to multiple servers distributed around the world. Similarly, running unit tests and generating code coverage metrics in your local development environment is, unfortunately, slightly different from running all unit tests during the build process.
Of course, you should use the same tool to deploy locally that you use to deploy to production. And the same tool should run unit tests locally, since during the build the particulars will be different. The only way to deal with these differences is to ensure that the process and the tools are automated.
We will not delve deep into the deployment side, as those tools differ the most across organizations due to vast scale differences. For instance, Yahoo! Mail deployments will look radically different from deployments to five servers worldwide, even though the end goals are all the same. Instead, we will focus on development and build automation, which tend to be more similar regardless of application size or reach.
Setting up an automated local environment plays nicely into setting up an automated build environment, which is essentially a superset of the development environment. An automated build environment aggregates tools and tests from the automated development environment and puts a prettier face on them.
How to Automate
Automating your JavaScript environment requires tooling. Whether you roll your own or use something off the shelf, the end result must be a sane continuous integration environment. That means building and testing your code in a simple and repeatable manner.
While your continuous integration system will typically be kicked off automatically (either at timed intervals or as the result of a check-in), developers must also know how to manually kick off a continuous integration run for those one-off situations that always seem to occur. If this process is difficult or arcane to accomplish, it will not get done and chaos will ensue.
Repeatable means the process runs to completion every time without spurious errors in either the build process or the tests. Avoiding too many emails and false-positive test results from the continuous integration environment is paramount, as if too many emails from the build system with bad (either too much or blatantly wrong) information are received, the emails will soon be ignored and your continuous integration environment will be wasted.
Continuous integration automation must be rock-solid.
Automating with Continuous Integration
Perhaps the biggest advantage of a completely automated environment is the ability to do continuous integration. By constantly building and testing (at every commit), you catch errors very quickly, before the code is deployed anywhere.
Developers are responsible for running unit tests before checking in their code, but unit testing is only the beginning. In a continuous integration environment, the code is tested as a whole for any mismatches (and unit tests are executed over the entire codebase in case you accidentally break something else in the process!).
To accomplish this for every commit, you need to run the build and the tests as quickly as possible. You can run unit tests in parallel, followed by a quick deploy to a test environment for some basic integration testing. Not all of your tests need to run while doing continuous integration—typically you just need to run unit tests and several integration tests that test very basic and core application functionality.
You will be able to trace failures directly back to the commit and the developer responsible for the failure. At this point, all builds should be halted until the problem is fixed. (Perhaps the developer’s name should go up on a “wall of shame” for breaking the build!) All attention should now be focused on fixing the build so that the rest of the team can continue moving forward.
Upon success, the build can be deployed to a QA environment for more extensive testing, and from there into other environments, and eventually out to production.
A quick, fully automated development build gives rise to a continuous integration environment. Applications with many integration points and pieces are especially prone to errors between all the moving parts. The ability to quickly discern issues in an automated fashion without having to bother developers or QA people speeds development by not wasting time on obviously broken builds.
Note
The Integrate Button website, maintained by the authors of Continuous Integration: Improving Software Quality and Reducing Risk (Addison-Wesley), provides a lot more detail about the process and benefits of continuous integration.
There are very few, if any, reasons why you should not be using continuous integration in your project.
Automating the Development Environment
The software development stage is the most manual, error-prone, time-consuming part of any software project. Until we can teach computers to write code for us, we are stuck typing characters one at a time into an editor. Every modern industry has been completely transformed by automation, with newer, shinier, faster machines doing the repetitive tasks humans once toiled at. Not so with writing software. The “science” and “art” of writing software has not changed in the more than 40 years since the terminal was introduced—the conversion from punch cards to terminals in the early 1970s was the last “breakthrough” in software creation. Instead of writing software on pads of columned paper to be punch-carded, we can now type our programs directly into the computer—woo-hoo.
So, writing software is a very hard, very time-consuming, and very manual process. Any automated tool that can in any way facilitate, speed up, and automate the task is a very good thing. Let’s take a tour of some tools that are available for this task and see how we can use them to automate the development environment.
The editor
The most basic and most controversial tool in the developer’s arsenal is the editor. The best editor is the one you are most comfortable with. There are fancy IDEs that auto-complete keywords and variable names, but do not have as rich a set of plug-ins as other, more basic editors. There are pros and cons to every editor, so use the one you are most comfortable with. Whatever editor you use, ensure that you familiarize yourself with all its features to make your job as easy as possible. Auto-indenting, auto-complete, brace matching, and other convenience features will improve your life by reducing the amount of time it takes to complete the compile–run cycle. Each editor has its own set of tricks and tips for tons of features you do not know about, so search around and find them! A good starting place is VIM ☺.
Unit tests
Having taken the time to write the unit tests, now you should enjoy the fruits of your labor by running them automatically while you develop. Several unit test frameworks provide similar features: the ability to run unit tests from the command line, dynamic code coverage report generation, and multiple browser support. JUTE is a handy tool that does all of that, and a bit more. In this section we will focus on integrating JUTE into our development environment to run our unit tests and generate coverage reports as painlessly as possible (in the spirit of full disclosure, I am the author of JUTE).
Available as an npm package, JUTE’s biggest requirements are the use of YUI3 Test and your directory structure. From our work with Yahoo! Mail, my colleagues and I determined that the sanest directory structure between application and test code is a mirrored hierarchy. From the root directory there are two main subdirectories, src and test. The test directory tree mirrors the src directory tree. All unit tests for each file in the src tree live in the corresponding directory in the test tree. Of course, your mileage may vary, and you do not have to set up your repository that way—some people like to have their test files in the same directory as the source code, and JUTE can be configured for this scenario. However, my experience suggests that having a mirrored test tree is a superior layout.
Begin by installing JUTE:
% npm install juteUse the npm variable to
configure it. The most important configuration variable is docRoot, which is the root of your project.
By default, JUTE expects a test directory within your docRoot:
% npm config set jute:docRoot /path/to/project/rootNow you must restart JUTE (as you must do after any configuration variable change):
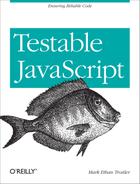
% npm restart juteThe JUTE UI should be running in your browser at http://localhost:5883, where you will see something similar to Figure 8-1.
Starting with the Status panel, you will see all “captured” browsers—in this case there is only one captured browser, the one I’m using to look at this page. To “capture” a browser, simply navigate to the root JUTE UI page. Any submitted unit tests will be run through all captured browsers in parallel.
The middle frame, while not running tests, simply shows all available unit tests. This list is populated by recursively finding all *.html files in the test subdirectory. To run any test, click on one of the Run links. You can choose to run either with or without code coverage. To run multiple tests, check the checkboxes in the corresponding columns and click the Run Tests button. Remember, these HTML files are the “glue” HTML files we discussed in Chapter 4.
Finally, the Results panel will display the results and any optionally generated code coverage reports for all the tests that were run.
You can also run tests from the command line, and they will run within any captured browser:
% jute_submit_test --test path/to/test.htmlWhatever you set as docRoot
will be prepended to the path passed to jute_submit_test. Of course, you can run
multiple tests from a single command also:
% jute_submit_test --test test1.html --test test2.htmlFinally, you can read in test files from stdin:
% find . -name '*.html' -print | jute_submit_test -test -This is similar to what the JUTE UI does to display all your tests in the UI.
Running a test with code coverage enabled will automatically generate an LCOV-style coverage report for that test, a link to which will be available in the Results column along with the JUnit XML output from the test itself.
The actual output files are, by default, placed in an output directory in the
docRoot directory. You can change this using the
outputDir configuration
variable:
% jute config set jute:outputDir resultsNote that the full path to this directory is
docRoot + outputDir, so it must
live within your docRoot. All test-result XML files
and LCOV data are placed in this directory. The test result filenames
are browser User Agent strings, so you can tell how your tests ran in
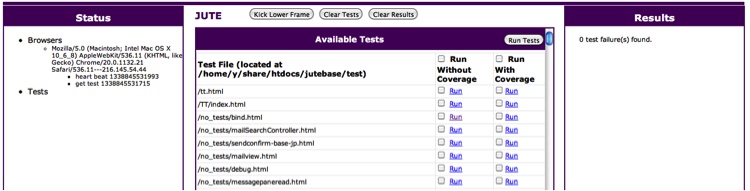
each browser. Figure 8-2 shows the
Results panel in the UI after running a test.
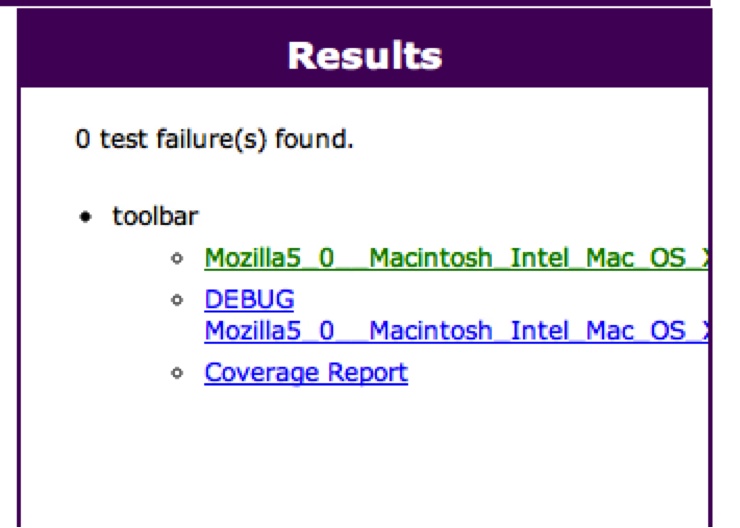
The “toolbar” test—the name comes from the Test Suite name—has a JUnit XML results file (which we already saw in Chapter 4), an output file containing debugging information (mainly YUI Test output, anything your code prints to the console, and timing information), and a dynamically generated coverage report. Connecting another browser to JUTE by visiting its page shows both browsers in the Status panel (see Figure 8-3).
Now both Chrome and Firefox are connected to this JUTE instance and are ready to run unit tests.
Running jute_submit_test will
cause any submitted tests to be run in both browsers in parallel, and
there will be results for both Chrome and Firefox in the Results
panel. Here is the directory listing after running the “toolbar” test
with both browsers connected:
% ls output/toolbar/
cover.json
lcov.info
lcov-report/
Mozilla5_0__Macintosh_Intel_Mac_OS_X_10_6_8__AppleWebKit536_11__
KHTML__like_Gecko__Chrome20_0_1132_21_Safari536_11-test.xml
Mozilla5_0__Macintosh_Intel_Mac_OS_X_10_6_8__AppleWebKit536_11__
KHTML__like_Gecko__Chrome20_0_1132_21_Safari536_11.txt
Mozilla5_0__Macintosh_Intel_Mac_OS_X_10_6_rv_12_0__Gecko20100101_
Firefox12_0-test.xml
Mozilla5_0__Macintosh_Intel_Mac_OS_X_10_6_rv_12_0__Gecko20100101_
Firefox12_0.txt
There is only one coverage report, regardless of how many browsers are connected. However, there are now two JUnit XML files and two debugging output files: one set of each for each browser, as named by its User Agent string.
Is your code on a headless server? Want even more automation? Instead of using a “real” browser, JUTE can utilize PhantomJS as a backend! The latest version of PhantomJS (1.6.1 as of this writing) does not require that an X server be running. PhantomJS integration with JUTE is trivial:
% jute_submit_test --test path/to/test.xml --phantomjsNow our results will contain another set of JUnit XML results and a debug logfile for the PhantomJS browser. And as a special added bonus, you also get a snapshot of the “browser” right after all the tests finish (see Figure 8-4).
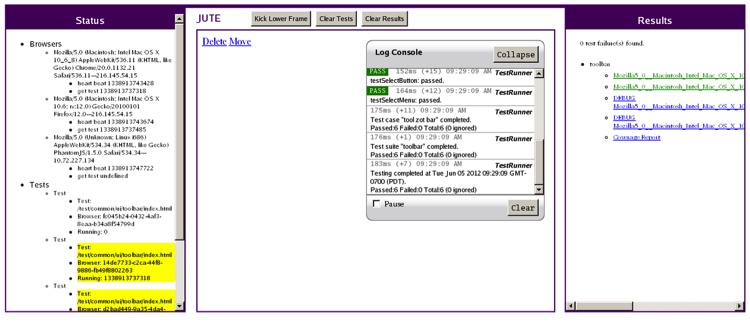
Figure 8-4 shows what the headless PhantomJS browser looks like on a headless Linux system. You can see the currently running test in the middle panel. You can also see the PhantomJS browser in the Status panel. The yellow highlighted tests in the Status panel are the ones currently running.
A final word on JUTE in your development environment: JUTE requires no changes to your test code (or code under test) to get dynamic code coverage reports and command-line execution, and all the other goodies JUTE provides. You can still manually load your “glue” HTML test files directly into a browser and execute them directly if you wish. When we discuss automating the build environment we will see how JUTE also fits very nicely in that scenario.
With its dynamic code coverage report generation, JUTE allows you to easily track your unit test progress while you are developing code, via either the command line or the UI. That is a big step toward testable JavaScript.
Code reviews
Short of full-blown Fagan code analysis reviews, sharing code with peers to be reviewed before checking it in is crucial to ensuring that both you and your peers are aware of what you are doing. Besides sharing knowledge, code reviews promote style guidelines among the team and help newer members get up to speed more quickly with the codebase.
What should be reviewed? Reviewing a giant chunk of JavaScript makes my eyes glaze over, so going line by line for the bigger chunks is where Fagan analysis really shines. At a minimum, a code walkthrough for large chunks of code with some peers is warranted. However, code reviews for bug fixes are where automation really helps.
Code reviews can be as simple as emailing a diff to some or all team members, but typically a more robust solution is more sustainable. I am very fond of the open source Review Board application. It is relatively easy to set up (you only have to set it up once!) and has good integration with CVS, Subversion, Git (and other source control systems), and Bugzilla.
Installing the RBTools package gives you the post-review
command-line script that should be used to create review requests;
Review Board also has an HTTP JSON
API that you can leverage for more complex integrations. I
highly recommend using either Review Board or something similar for
code reviews. Tying the code reviews into your bug tracking system
tightens the loop—to close the loop completely, you need pre- and
post-commit hooks into your source code repository.
Commit hooks
Most source control repositories allow pre-commit hooks, meaning you can run arbitrary checks before code is checked in and possibly reject the commit. This is the place to check that code was reviewed, check that this commit is associated with a bug, ensure that unit tests and smoke tests have been run, check code against JSLint, and generally enforce any kind of analysis and checking you want before code gets into the system.
The details of how to set up a pre-commit hook vary for each repository, but typically they are just shell scripts that exit nonzero to abort the commit. Of course, not all developers follow all required processes and practices before checking in, so “trust but verify.”
Here is a quick Perl pre-commit Subversion (SVN) hook that will run JSLint on any JavaScript file and fail the commit unless JSLint gives each JavaScript file a clean bill of health:
#!/usr/bin/perl

# Passed from SVN
my $REPO = shift;
my $TXN  = shift;

# Set up PATH
$ENV{PATH} = "$ENV{PATH}:/usr/bin:/usr/local/bin";

# The log message
my @logmsg = `svnlook log -t "$TXN" "$REPO"`;
#print STDERR @logmsg;

# Get file changeset
my @changes = `svnlook changed --transaction "$TXN" "$REPO"`;
my $failed = 0;
#print STDERR @changes;

# Find JS files
foreach (@changes) {
    my($cmd, $file) = split(/\s+/);
    # Only JSLint *.js files that haven't been deleted!
    if ($file =~ /\.js$/ && $cmd ne 'D') {
        # Text of changed file:
        # my @cat = `svnlook cat "$REPO" --transaction "$TXN" $file`;
        # OR just grab the pre-committed file itself directly
        # This script runs from the directory of the commit itself so
        # these relative paths are the uncommitted versions
            my @jslint = `/usr/local/bin/jslint $file`;
        if ($?) {
            print STDERR '-' x 20, "\n";
            print STDERR "JSLint errors in $file:\n";
            print STDERR '-' x 20;
            print STDERR @jslint;
            $failed++;
        }
    }
}

# STDERR goes back to client if failed
exit $failed;
This example grabs the log message but doesn’t use it:
my @changes = `svnlook changed --transaction "$TXN" "$REPO"`;
The code also demonstrates how to get the text of the changed file directly:
# my @cat = `svnlook cat "$REPO" --transaction "$TXN" $file`;
But it does not use it in favor of the path to the file itself,
which is what the jslint
command-line tool wants.
Grabbing the text of the commit message allows you to enforce a certain format for the message itself, perhaps ensuring that a bug ID is associated with this commit or that a code review was completed by valid usernames (that can then be put into your bug tracking tool, unless a tool such as Review Board already does this for you).
The Git pre-commit hook works similarly—exit nonzero to fail the commit. The difference, of course, is how you grab the log message and potentially committed files.
Let’s create a Git pre-commit hook that will reject any commit containing any of these violations: function length greater than 30 lines, more than five arguments, or cyclomatic complexity greater than 9. We’ll use the jscheckstyle npm package to get complexity values for each function:
% npm install jscheckstyle -gThis package has the added benefit of outputting a Jenkins-compatible format, which will come in handy when we automate our build. Here is the pre-commit script (it lives in .git/hooks/pre-commit):
#!/usr/bin/perl

# Get file list
my @files = `git diff --cached --name-only HEAD`;
my $failed = 0;

foreach (@files) {
    # Check *.js files only
    if (/\.js$/) {
        my @style = `jscheckstyle --violations $_`;
        if ($?) {
            # Send pretty error output to client
            print @style;
            $failed++;
        }
    }
}

exit $failed;
This code simply gets the list of files that are to be committed and runs all JavaScript ones through jscheckstyle. If any fail the violation checks, the output is sent back to the client and the commit is aborted.
Here is a sample attempted commit on a complex file from my Injectify npm package:
% git commit index.js
The "sys" module is now called "util". It should have a similar
interface.
jscheckstyle results - index.js
┏━━━━━━━━━━━━━━━━━━━━━━━━━━━━━━━━━━━━┳┳┓
┃ Line   ┃ Function                     ┃Length┃Args┃Complex..┃
┣━━━━━━━━━━━━━━━━━━━━━━━╋━━━━━━━━━━━━╋╋┫
┃ 30     ┃ Injectify.prototype.parse    ┃197   ┃2   ┃27       ┃
┣━━━━━━━━━━━━━━━━━━━━━━━╋━━━━━━━━━━━━╋╋┫
┃ 228    ┃ Injectify.prototype.statement┃42    ┃1   ┃10       ┃
┗━━━━━━━━━━━━━━━━━━━━━━━━━━━━━━━━━━━━┻┻┛
The parse function is very
complex, and the statement function
is borderline too complex. You can use Git configuration variables to
determine violation thresholds to suit your environment and tolerance
for complexity. In this case, the commit failed due to these
violations.
Let your imagination run wild with all the interesting bits that can be automated, verified, and checked before spurious code gets into your repository. Any code committed to the repository should be considered production-ready.
Other development tools
Working with JSLint on existing files may drive you batty. You can get a big head start toward fixing basic JSLint errors using fixmyjs. It will automatically fix those basic JSLint errors, taking a lot of the drudgery out of lots of JSLint errors. Using it is simple:
% npm install fixmyjs -g
% fixmyjs myFile.js
In the preceding code, myFile.js will be updated in place using nondestructive modification; diff the new code against what you had earlier to see the results. If you are afraid, you can do a dry run first to see what it will do:
% fixmyjs -r myFile.jsOr even output a patch file instead:
% fixmyjs -p myFile.jsThis is a great tool to jump-start your new JSLint-ed life. You will be pleasantly surprised by what it finds (perhaps even some bugs) and what it is able to automatically fix. Once your code is JSLint-friendly it’s much easier to keep it that way than it is to rely on a tool to fix it up for you, so get in the habit of keeping it clean.
Of course, if you have to fix a lot of JSLint errors, the first thing to determine is exactly how the code got into that state in the first place. Waiting until later to try to JSLint your code is a recipe for disaster—regardless of whether it’s code you’ve written or code you’ve just started maintaining, there is no excuse for not keeping it JSLint-compatible.
Automating the Build Environment
The automations made in the build environment are a superset of what is happening in the development environment. You do not want to make large complexity numbers fail the build if they are not also being checked in the development environment. Similarly, do not fail the build due to JSLint errors if you are not also running the code through JSLint in the development environment. We developers hate surprises in the build environment, so don’t try to spring any new requirements onto the code in the build environment that are not also present in the development environment.
The build
The steps necessary to actually do a build—any build—are codified using a makefile, an Ant XML file, or some other build system. Like your application, the build should be not a monolithic monster, but a set of smaller pieces. Each piece should do one thing only, and the pieces should then be collected in a specific order to complete the build.
Do not have a single target that minifies and compresses code in one shot—those are two distinct actions. The build itself should also be parameterized, so do not hardcode paths or settings deep within the build; let those be supplied via the command line or some other configurable source. Developers will want to run pieces of the build in their environments, and run a full build to deploy to their local environments while the “real” build runs on a dedicated build machine and deploys out to QA and production, so make sure your build process is flexible enough to handle those varying scenarios. Ideally, developers and build masters can use the same build script to produce similar or identical builds regardless of environment and settings.
Having a build script is great, and being able to execute in isolation the individual pieces that make up a build is great. The next step is to automate it!
Jenkins
Jenkins, formerly Hudson, is a nice tool for automating the build process. With lots of community-supplied plug-ins plus hooks for even more local customization, Jenkins does a good job of managing and tracking builds, with all the bells and whistles and a nice UI that anyone can use.
Installing Jenkins is relatively straightforward, especially if you have experience deploying WARs (Web application ARchive files), as that is how Jenkins is packaged. Download either the latest or the Long Term Support version of Jenkins, dump the WAR into the proper container directory, restart your server, and you should be good to go. If you want to get up and running very quickly to play around, simply download the WAR and run:
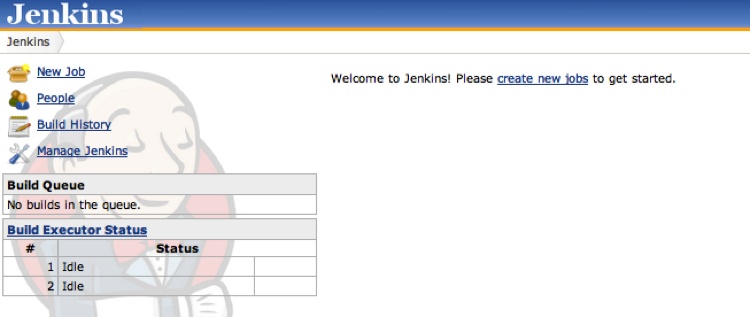
% java -jar jenkins.warJenkins will start up on port 8080. When it’s ready, you will see the Jenkins home administrative page (see Figure 8-5).
Before we jump in and create a job, let’s take a quick look at some plug-ins that may be of interest. Click Manage Jenkins, and you will see lots of configuration options. For now, click Manage Plugins to be transported to Jenkins’s plug-in manager. From here you can update any currently installed plug-ins, install new ones, and see what you already have installed. By default, CVS and Subversion support are enabled; if you need Git support, click the Available tab and find the Git plug-in (see Figure 8-6).

Check the Git Plugin box and install Git, and then let Jenkins restart itself. Be careful about restarting Jenkins on your own! You will have lots of Jenkins jobs, so if you ever need to restart Jenkins, let Jenkins do it. It will wait until there are no currently running jobs and then restart itself (this is done in Manage Jenkins→Prepare for Shutdown).
Now Git will be available as a source code management (SCM) system when you create a new Jenkins job. A lot of plug-ins are available for Jenkins, some of which we will encounter later.
Creating a Jenkins project
Now you can create a project. You basically need to tell Jenkins two things: where to find your source code repository and how to build it. At a minimum, Jenkins will check your code out into a clean area and run your build command. As long as your build command exits with zero, your build has succeeded.
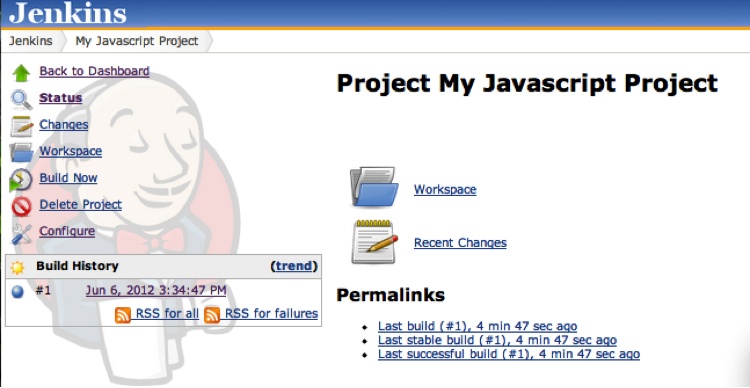
So, go to the top-level Jenkins page and click New Job, and give your job a name. Do not put spaces in your project name! Then click “Build a free-style software project.” Click OK, and you are ready to configure your new job. Figure 8-7 shows the home page of a Jenkins project.
Click the Configure link and start filling out the basics. For a Subversion project, the Subversion URL can look like the one shown in Figure 8-8.
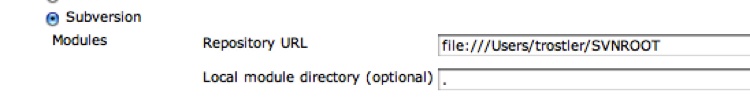
For a local Subversion repository, if you installed the Git plug-in you can put in a Git URL (even something on GitHub).
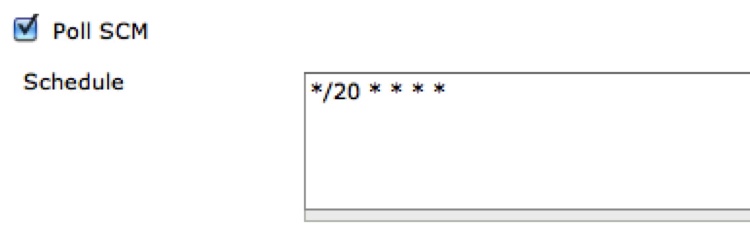
Under Build Triggers, it’s nice to “Poll SCM” repeatedly to pick up any changes. In Figure 8-9 I am polling Subversion every 20 minutes, and if something has changed a build will be kicked off (here is our continuous integration!).
Finally, you need to tell Jenkins what to do once it checks out your repository to actually do the build.
Here is a quick makefile that will run unit tests on all the code and then compress the code into a release directory to be blasted out to production web servers if all is OK:
DO_COVERAGE=1
RELEASE=release
UGLIFY=uglifyjs

SRC  := $(shell find src -name '*.js')
OBJS := $(patsubst %.js,%.jc,$(SRC))

%.jc : %.js
    -mkdir -p $(RELEASE)/$(@D)
    $(UGLIFY) -o $(RELEASE)/$(*D)/$(*F).js $<

prod: unit_tests $(OBJS)

setupJUTE:
ifdef WORKSPACE
    npm config set jute:docRoot '$(WORKSPACE)'
    npm restart jute
endif

server_side_unit_tests: setupJUTE
    cd test && find server_side -name '*.js' -exec echo
{}?do_coverage=$(DO_COVERAGE)" \; | jute_submit_test --v8 --test -

client_side_unit_tests: setupJUTE
    cd test && find client_side -name '*.html' -exec echo
"{}?do_coverage=$(DO_COVERAGE)" \; | jute_submit_test --v8 --test -

unit_tests: server_side_unit_tests client_side_unit_tests

.PHONY: server_side_unit_tests client_side_unit_tests unit_tests
setupJUTE
This makefile uses UglifyJS for code compression, but YUI Compressor and Google’s Closure Compiler work just as well. The makefile lives at the root of our application’s repository and has a src and test directory tree under it containing the source and test files, respectively.
Executing the prod
(default) target will run all the unit tests and minimize all the
code, assuming all the unit tests run successfully. The unit tests
are all run through V8, so no browser is required. However, this may
not be appropriate for all your client-side JavaScript tests, so use
PhantomJS (--phantomjs) or
Selenium (--sel_host) to run them
through a real browser. You can even use “captured” browsers as long
as at least one browser is captured to the JUTE instance running on
the machine. Note that in our case we must configure JUTE when running under Jenkins so that JUTE knows where
the document root is while Jenkins is doing a build. If you have a
dedicated build box you could configure JUTE once to always point to
the Jenkins workspace and be done. Regardless, dynamic code coverage
information can be toggled on the make command line
to turn off code coverage:
% make prod DO_COVERAGE=0There is some makefile magic (or insanity, depending on your
perspective) with the implicit rule for UglifyJS. Regardless of how
you like your makefiles, this will transform all your JavaScript
files into compressed versions in a directory tree that mirrors the
src tree rooted under the
release directory. When the
build is finished, we simply tar
up the release directory and drop it on our web servers.
OK, enough fun; let’s integrate this makefile into our Jenkins job. (Of course, you could use Ant as your build system and cook up and maintain a bunch of XML files instead; Jenkins merely executes whatever you tell it, so roll your own build system if you like. It can’t be any uglier than Ant, can it?)
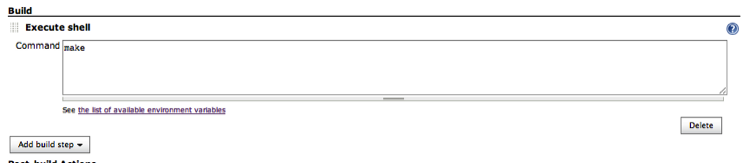
So, back to Jenkins: simply add make as the build command (this assumes
you checked in your makefile in your SVN root directory), as shown
in Figure 8-10.
Save it and then execute a build, either by waiting for the SVN check to determine there are new files or by clicking Build Now. If all went well (why wouldn’t it?), you will have a successful build.
Unit testing using Selenium
Let’s take a quick detour into Selenium-land. Running unit tests during the build should occur in “real” browsers. You could keep browsers captured to the JUTE instance running on the build box, but there is a faster way, especially since as the number of unit tests increases, the time required to run them and to execute your build will increase as well. Fortunately, when using a Selenium grid, JUTE can parallelize the unit tests against a given number of Selenium nodes connected to a single grid hub. Further, using Selenium you can generate screenshots at the end of each test, which is not possible with “captured” browsers. The screenshots are saved along with the unit test results for easy debugging of unit test failures if the log output is not sufficient.
Setting up a Selenium grid is simple. The idea is that there is a single hub to which all Selenium nodes connect. Any outside process that wants to control Selenium browsers merely connects to this hub, which then passes off the work to a currently idle node. Results flow from the hub back to the Selenium requestor.
Hop on over to SeleniumHQ and grab the latest version of the Selenium server (2.28.0 as of this writing). This single JAR file encapsulates both the hub and node pieces necessary for your grid. Multiple Selenium nodes can run on a single host; in fact, both the hub and the nodes can run on the same box without issue. Virtual machines also make great Selenium hub and node hosts; just do not get too crazy. Depending on the specifications of your host, running a lot of nodes simultaneously can quickly bog down a machine. I have found that Windows running in a smallish-sized virtual machine can handle only two or three Selenium nodes, maximum. Just do not expect to run 10+ Selenium nodes on anything but a large server instance. Also, a hub instance can be connected to from multiple operating systems, so a hub running on Windows can be connected to Selenium nodes running on a Mac, Linux, or Windows machine.
Copy the Selenium server JAR to the hub host and node hosts, and fire it all up. You start the hub like so:
% java -jar selenium-server-standalone-2.28.0.jar -role hubThe hub listens on port 4444 by default; you can change this
using the -port option. However, as
all nodes and Selenium clients default to using port 4444 to connect
to the Selenium master, you will need to change the port values for
all of those processes as well.
Now fire up some nodes with the following command (all on one line):
% java -jar selenium-server-standalone-2.28.0.jar -role node
-hub http://<HUB HOST>:4444/grid/register
The Selenium nodes need to know where the hub is (host and port) so that they can connect to it. Also, the nodes listen on port 5555 by default, so if you run multiple nodes on a single host you must cook up different port values for each node beyond the first one. The port numbers of the nodes do not matter; they just need an open port. So, to start another node instance on the same host as the previous one, use:
% java -jar selenium-server-standalone-2.28.0.jar -role node
-hub http://<HUB HOST>:4444/grid/register -port 6666
Now you have two nodes running on a single host. These nodes can be on the same machine as the hub or on another box running a different operating system.
Finally, you can configure each node to tell the hub which
browsers and which operating system this node can execute. Adding the
-browser switch to the command line
configures all of this information. For example, this tells the hub
that this node can run Firefox version 13 on the Linux
platform:
-browser browserName=firefox,version=13,platform=LINUX
Selenium clients requesting specific browsers, versions, and platforms for their Selenium commands use this information. More details about Selenium node configuration are available at the code.google selenium website.
JUTE can now leverage your Selenium grid to run all your unit tests in parallel across the grid. Here is a sample command line (all on one line):
% jute_submit_test --sel_host <grid host> --sel_port 4444
--seleniums 5 --test -
In the preceding code, <grid
host> is the hostname of your Selenium hub and
-sel_port is the port on which the
hub is listening—this is only required if the hub is listening on a
port other than 4444. The --seleniums option tells JUTE how to
parallelize your unit tests. This example splits all your tests into
five chunks and hits each Selenium node with one-fifth of the total
number of tests.
To be clear, using this command line, if you submit 1,000 tests to JUTE each Selenium node will run 200 tests in parallel. Yahoo! Mail has used this setting to good effect, running close to 3,000 unit tests in about 10 minutes across only four Selenium nodes.
JUTE will snapshot the browser after any failed test. If you
would like snapshots after every test regardless of result, use the
--snapshot option.
To specify which browser all these tests should utilize, use the
--sel_browser option to jute_submit_test.
Putting it all together, a nice makefile target to run all your tests in one shot through Selenium would look like this:
selenium_tests:
    cd test && find . -name '*.html' -printf '%p?do_coverage=1\n' |
    jute_submit_test --sel_host 10.3.4.45 --seleniums 5 --test -
Unit test output
All that remains (besides adding stuff to your build) is to have Jenkins recognize the unit test output (the JUnit XML files that JUTE generates), the coverage data (which JUTE also generates), and any other build data you want Jenkins to consider.
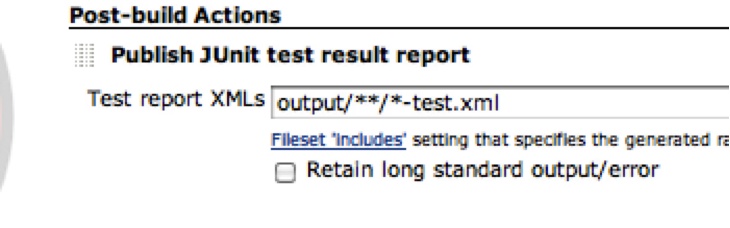
Conveniently, JUTE puts all test output into a (configurable) output directory called output by default. This directory exists in jute:docRoot, which conveniently is also the Jenkins workspace directory. So, to have Jenkins recognize our unit test results we simply configure our project with a post-build action of “Publish JUnit test result report” and use this file glob to pull in all test results (all JUTE test result output ends in -test.xml), as shown in Figure 8-11.
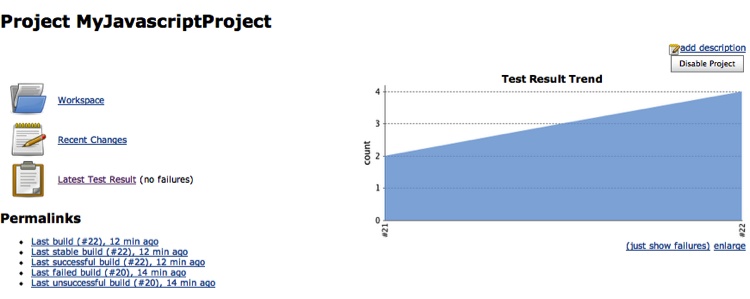
Now we’ll kick off another build, and when things go right the first time we will see what’s shown in Figure 8-12 on our project’s dashboard.
Note the link to Latest Test Result and the graph with the number of successful unit tests run—pretty slick!
Coverage output
Integrating code coverage is unfortunately slightly more complex in the latest version of Jenkins, as support for LCOV-formatted coverage files seems to be missing. So, we must first aggregate all the individual coverage files into one file and then convert that file into another format that Jenkins supports.
Aggregating all the individual coverage files (the lcov.info files in each directory) into a
single file is easy using the lcov executable.
Here is our makefile rule to do just that:
OUTPUT_DIR=output
TOTAL_LCOV_FILE=$(OUTPUT_DIR)/lcov.info
make_total_lcov:
    /bin/rm -f /tmp/lcov.info ${TOTAL_LCOV_FILE}
    find $(OUTPUT_DIR) -name lcov.info -exec echo '-a {}' \;
| xargs lcov > /tmp/lcov.info
    cp /tmp/lcov.info ${TOTAL_LCOV_FILE}
All this does is collect all the generated lcov.info files in the output directory and run them through
lcov -a ... to aggregate them into
a single lcov.info file, which
will sit in the root of the output directory.
Now that we have the aggregated lcov.info file, we need to convert it to the Cobertura XML format. We can do this using a handy script provided at this GitHub project:
cobertura_convert:
    lcov-to-cobertura-xml.py $(TOTAL_LCOV_FILE) -b src
-o $(OUTPUT)/cob.xml
Adding those two targets to our original unit_tests target will generate all the
information Jenkins needs to display code coverage information.
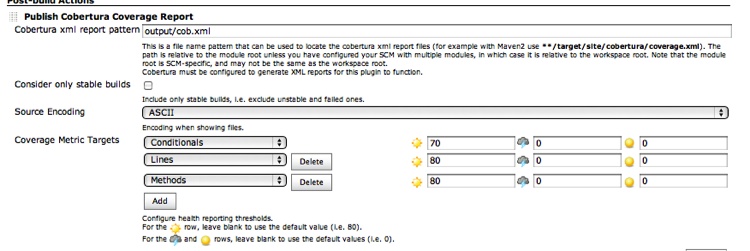
The next step is to install the Cobertura Jenkins plug-in. Once that is complete the Publish Cobertura Coverage Report option will be available as a post-build action, so add it and tell the plug-in where the Cobertura XML files reside (in the output/ directory), as shown in Figure 8-13.
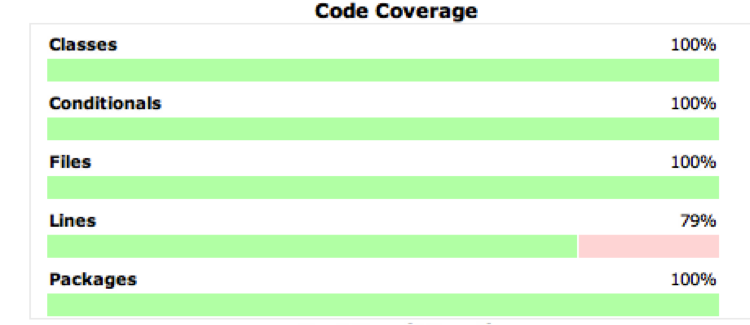
Rebuild your project, and voilà, you have a Coverage Report link and a coverage graph on your dashboard, as shown in Figure 8-14.
Clicking on the Coverage Report link will let you drill down to individual files and see which lines were covered by your tests and which weren’t. Figure 8-15 shows what a coverage report looks like.
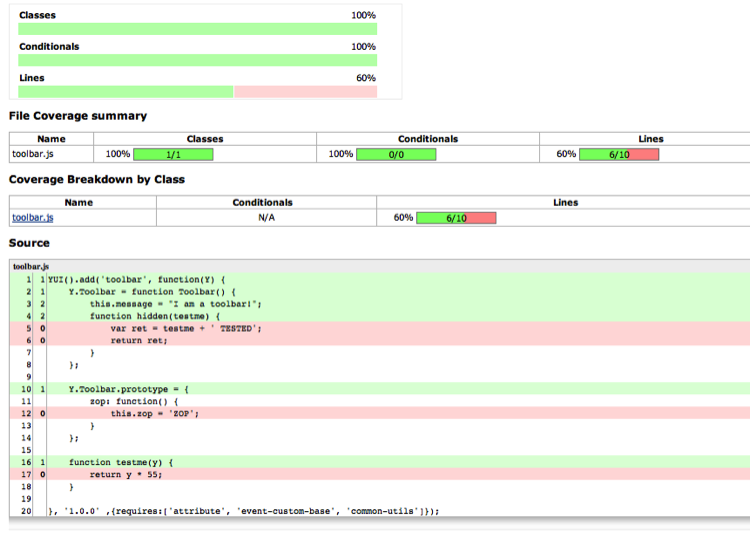
This output is very similar to the LCOV output format we saw in Chapter 5. Jenkins will now track your code coverage percentages over time, so you can watch the trend go (hopefully) up.
Complexity
We will add one more Jenkins plug-in, and then you are on your own. Earlier we discussed the jscheckstyle npm package, which coincidentally can output its report in Checkstyle format—and wouldn’t you know it, there is a Jenkins plug-in for that format! Even though you may be checking complexity numbers pre-commit, it is still a great idea to also generate those numbers as part of your build, for two reasons. One, it is easy to see at a glance the complexity of all the files in your project, and two, you can keep an eye on the complexity trends in your entire application. The dashboard Jenkins provides is also great for nondevelopers to easily see the state of the project. Hopefully that is a good thing.
The flow should be similar: install the Jenkins plug-in, update the makefile to generate the required files, and then configure your project to use the installed plug-in and to point to the generated files. So, let’s do it!
First we will install the Checkstyle Jenkins plug-in and then add these targets to the makefile to generate the complexity information via jscheckstyle:
CHECKSTYLE=checkstyle
STYLE := $(patsubst %.js,%.xml,$(SRC))
%.xml : %.js
    -mkdir -p $(CHECKSTYLE)/$(@D)
    -jscheckstyle --checkstyle $< > $(CHECKSTYLE)/$(*D)/$(*F).xml
This is very similar to the UglifyJS code shown earlier. We are
transforming the JavaScript files in the src directory into XML files in a
Checkstyle mirrored directory. Note the use of the - before the jscheckstyle command—jscheckstyle exits with
an error if it finds any violations, but that would then stop the
build. With a pre-commit hook this is probably overkill; however,
failing the build due to violated complexity constraints is not the
worst thing in the world.
So, append the $(STYLE)
prerequisite to the prod
target:
prod: unit_tests $(OBJS) $(STYLE)
and all those files will be generated on your next build. Now to tell Jenkins about it: on the Configure screen of your project add the “Publish Checkstyle analysis results” post-build action, and configure it as shown in Figure 8-16.
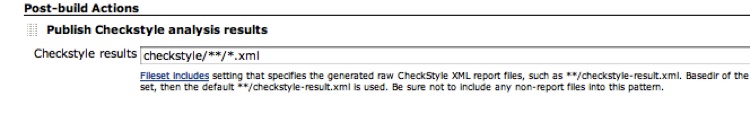
Here we are just telling the plug-in to look in the checkstyle directory of the Workspace root and pull out all the XML
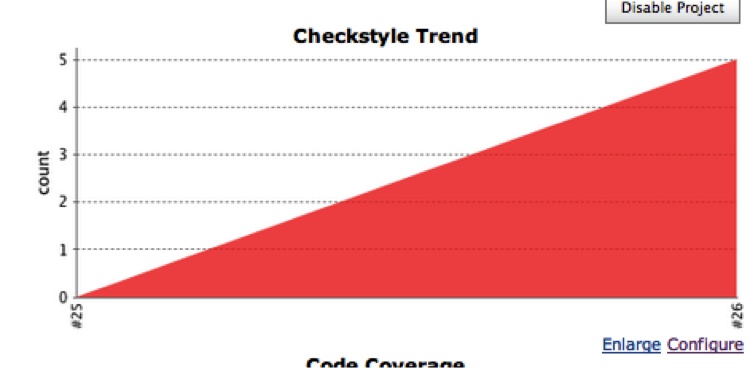
files to analyze. Click Build and bask in the results (see Figure 8-17).
This graph will now be on your project’s dashboard, and clicking on it (or on the Checkstyle Warnings link that is also now on your dashboard) will show you a history and what all the current warnings are, including any new ones present in this build. You can drill further into the details of each warning and all the way down to the code itself to view the offending code. Great stuff!
JSLint
Integrating JSLint with Jenkins is very similar to the previous integrations—for this, you need the Violations Jenkins plug-in. Go ahead and install it, and you will see that it also handles Checkstyle-formatted files. We will look at that later; for now, the Violations plug-in requires JSLint output to be in a certain XML format, which is simple to generate:
<jslint>
    <file name="<full_path_to_file>">
        <issue line="<line #>" reason="<reason>" evidence="<evidence" />
        <issue ... >
    </file>
</jslint>
If you run the jslint npm package with the --json argument, you will see it is a
trivial transformation from the JSLint JSON to this XML format. My
implementation of the transformation is available at the Testable JS GitHub project.
The idea here is to run JSLint on our codebase, output that in XML format, and tell the Violations plug-in where to find the XML. So first we will add the standard stuff to our makefile:
JSLINT=jslint
JSL  := $(patsubst %.js,%.jslint,$(SRC))
%.jslint : %.js
    -mkdir -p $(JSLINT)/$(@D)
    ./hudson_jslint.pl $< > $(JSLINT)/$(*D)/$(*F).jslint
Then we will add the JSL
targets to our prod target:
prod: unit_tests $(OBJS) $(STYLE) $(JSL)
And we are ready! Of course, to just run JSLint in isolation, simply add this target:
jslint: $(JSL)
After checking that in, install and configure the Violations plug-in with the location of the *.jslint XML files (see Figure 8-18).
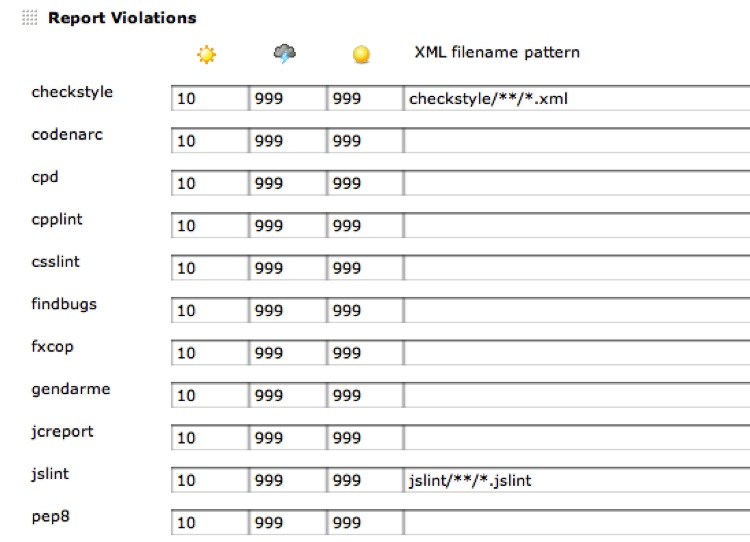
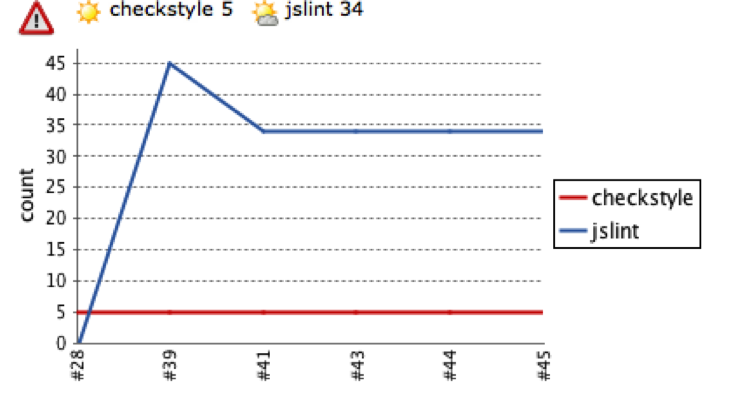
You’ll note that while I was at it I also configured the location of the jscheckstyle output. Now rebuilding your project will embed on your project’s dashboard the snazzy Violations graph shown in Figure 8-19.
Clicking on it will give you a breakdown of all the JSLint and Checkstyle errors in your code, and allow you to drill down to each individual file to see exactly what is going on. When viewing the file line by line, hovering your mouse over the violation icon will display detailed error information about that line.
Duplicate code
Although doing a build is very helpful in terms of finding all the duplicate code in your project, some duplicate-code-finding tools can be smart about ignoring whitespace and comments and comparing the underlying tokens and syntax tree to really find duplicate or very similar chunks of code.
One such tool is dupfind. It parses through all your code looking for duplicated sections. You can tweak the “fuzziness” of the matches and see what pops out. This command-line tool is an excellent addition to your automated build process. It can output a CPD-compatible XML file that—surprise, surprise—a Jenkins plug-in can visualize.
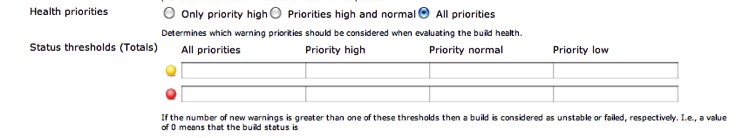
Installing the Duplicate Code Scanner plug-in creates the “Publish duplicate code analysis results” post-commit action, which you can enable in your project (see Figure 8-20).
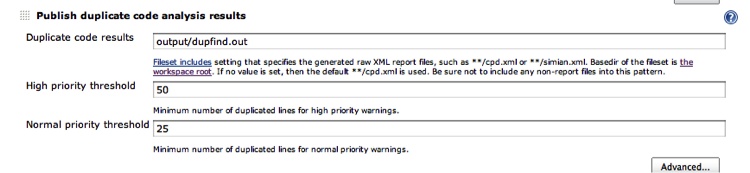
The priority threshold values allow you to configure how many duplicated lines indicate a normal problem or a very big problem. The plug-in will then track and graph all the duplicated sections of code. In the Advanced configuration you can set thresholds for when this plug-in will mark a build as “unstable” or even “failed” (see Figure 8-21).
Installing dupfind is easy; get the dupfind.jar file from dupfind’s GitHub and add a line similar to this to your makefile:
dupfind: $(SRC)
    java -Xmx512m -jar ./dupfind.jar > output/dupfind.out
Then add the dupfind target
to your prod target, and you are
ready to configure dupfind itself. One of the places dupfind looks for
its configuration file in the current directory is in a file named
dupfind.cfg. Here is one
now:
{
    min:        30,
    max:        500,
    increment:  10,
    fuzzy:      true,
    cpd:        true,

    sources:
    [
        {
            name:   "myProject",
            def:    true,
            root:   ".",
            directories:
            [
                "src"
            ],
            include:
            [
                "*.js"
            ],
            exclude:
            [
                "*/.svn",
                "*-[^/]*.js",
            ]
        }
    ]
}
This JSON-formatted configuration file tells dupfind
specifically what to do. The most interesting bits are the fuzzy property that allows dupfind to do
fuzzy matches (it will ignore variable names, for instance) and the
sources array that allows us to
fine-tune which directories and files dupfind should investigate and
which to skip.
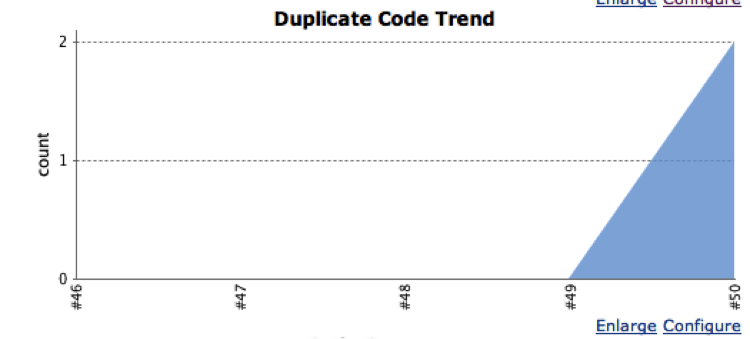
Once you have configured the file, on your dashboard you’ll get a snazzy duplicate-code graph, as shown in Figure 8-22.
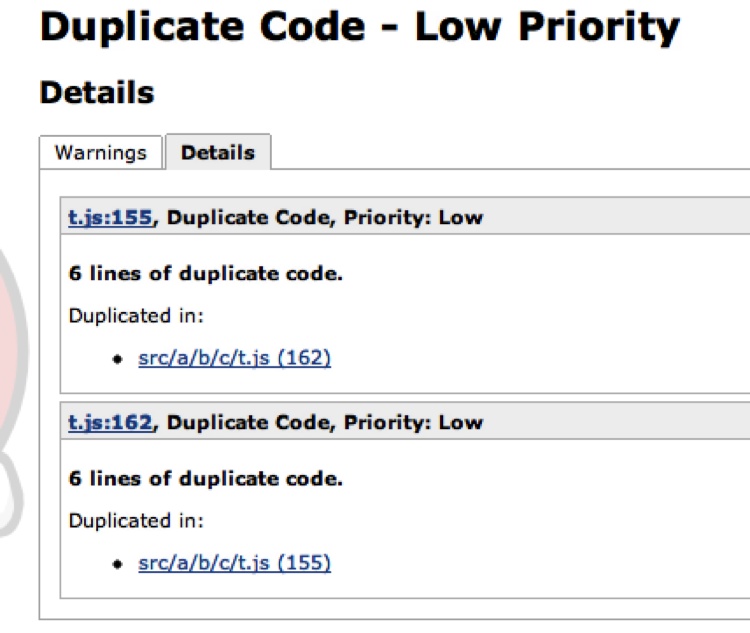
From this graph you can then drill down into the details, as shown in Figure 8-23.
From here you can drill down to the files themselves and see the detected duplications. In this case, dupfind found a duplicate chunk of code in the same file. Remember, the priority of the duplicated code is set while configuring the plug-in; here the priority is “low” because there are only six lines of duplicated code.
Other analysis
The latest version of PMD—5.0 as of this writing—has support for some ECMAScript analysis that may be useful to you. Although JSLint does a better/more thorough job, it is relatively easy to add new rule sets to PMD for more custom checking in your environment. PMD output is well supported by various Jenkins plug-ins, which makes it a good choice if you’re using Jenkins. Also, as time goes on, hopefully more ECMAScript rule sets will be included with or available for PMD, and ECMAScript will become a supported language with CPD, so keep an eye on PMD!
Finally, I encourage you to browse the long list of Jenkins plug-ins that are available; you can always write your own if you see that something is missing!
Notification
There is no need for Jenkins to operate in a vacuum. Setting up the E-mail Notification” post-build action will email potentially different sets of people when a build changes state. The possible states are “successful,” “fail,” and “unstable.” Jenkins distinguishes between failed builds and unstable builds: a failed build occurs when a build command exits with a nonzero exit status, and an unstable build is caused by post-build plug-ins noticing that something has gone wrong, such as a unit test failure or code coverage below a certain threshold.
Jenkins can also email only the committers who caused the build to change state from “successful” to “failed” or “unstable,” using data from the commit logs. This is an absolutely critical feature to enable!
Dependent builds
You can kick off other Jenkins builds if the current build completes successfully. For instance, you may want to stage the completed build if it completed successfully, or kick off performance or integration testing on the successful build. Breaking these steps into separate Jenkins projects keeps things modular and automated.
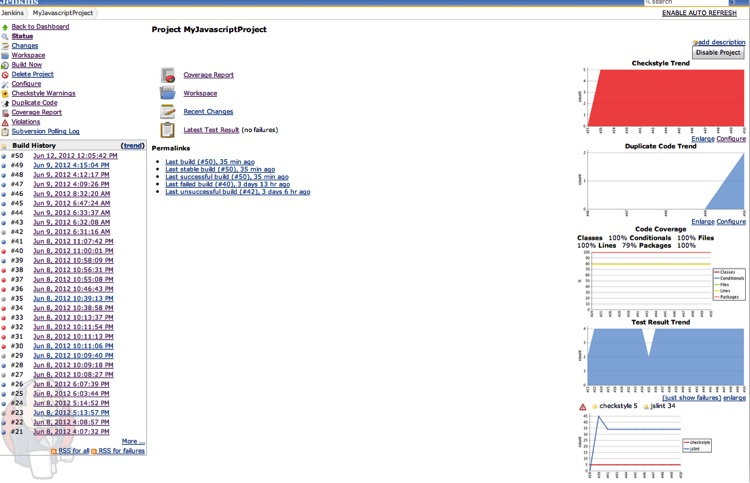
The Full Monty
Figure 8-24 shows a snapshot of a Jenkins dashboard with all the aforementioned plug-ins disabled and building—that’s a good-looking dashboard!
Non-UI usage
Jenkins can be almost completely controlled via the command line or a remote
API. There are two command-line methods of controlling Jenkins: via
SSH and via cli.jar. Jenkins
starts up its own SSHD server by default on a random port. To
determine the port number, make a HEAD request to your base Jenkins URL and
find the X-SSH-Endpoint header key;
its value is the random port on which Jenkins’s SSHD is listening.
Alternatively, you can configure Jenkins to listen on a fixed port for
SSHD in the Configure System configuration settings area. My random
SSH port is 64812, so this command:
% ssh -p 64812 localhost build MyJavaScriptProject -swill kick off a build of MyJavaScriptProject and wait for build
results.
Visiting
http://<Your Local
Jenkins URL>/cli presents the opportunity
to download cli.jar, which you
can also use to control Jenkins. After downloading the JAR, running
this command (all on one line):
% java -jar ~/Downloads/jenkins-cli.jar
-s http://localhost:8080 build MyJavaScriptProject -s
will kick off a build of the MyJavaScriptProject project and wait for it
to complete. Upon completion, you will receive the final status for
that build. Jenkins can be almost completely managed via cli.jar; visiting
http://<Your Local
Jenkins URL>/cli gives lots more
information about what is possible. The commands available via SSH are
only a subset of what is available from cli.jar.
Deployment
Whether you’re deploying to 1 server or 50,000 servers, some things remain the same (and some, of course, are radically different). After verifying that your code is good to go to production, you must shut down the current code cleanly and bring up the new code. The goal is to drop as few connections as possible (if any). Most web servers have a “graceful” restart feature that should be utilized. If you have only one server, connections will be refused while the server is down. If you’ve got 50,000 servers behind various load balancers, the process will (hopefully) be seamless.
Rollback goes hand in hand with deployment. You should be ready to switch back to the old code as quickly as possible—not that anything will go wrong, of course. Ideally, merely flipping a symlink chooses between the “old” and “new” code—leave the old code on the box while you upgrade.
An upgrade can look like this:
Upload new files to the host.
Gracefully stop the server.
Update the symlink to point to the new code.
Start the server.
Profit!
For instance, suppose the DocumentRoot in your Apache configuration file
points to a symlink at /var/www/current that resolves to /var/www/VERSION_X. Now you put /var/www/VERSION_Y on the box, and when
Apache is stopped, you change /var/www/current
symlink from VERSION_X
to VERSION_Y.
When a rollback is necessary, simply gracefully stop the server, reposition the symlink, and then start the server. Of course, you will have a script that does all that for you automatically, right?
Recap
Automating your development, build, and deployment processes is crucial for a sane application life cycle. Fortunately, there are a lot of JavaScript tools that (mostly) fit together that can help you with this. Leveraging and melding these tools, from pre-commit hooks to Jenkins plug-ins, allows you to lather, rinse, and repeat as quickly as possible. Like most things, the tools are only as good as their usage. Developers must constantly be vigilant about their code and processes to ensure that everything is running smoothly and that any issues are dealt with as quickly as possible.