Table of Contents for
Testable JavaScript
 Testable JavaScript
Published by
O'Reilly Media, Inc., 2013
Testable JavaScript
Published by
O'Reilly Media, Inc., 2013
Chapter 7. Debugging
Debugging sucks. I heartily recommend not doing it. For those rare times when you must, however, there are many great tools and techniques to assist you.
In-Browser Debugging
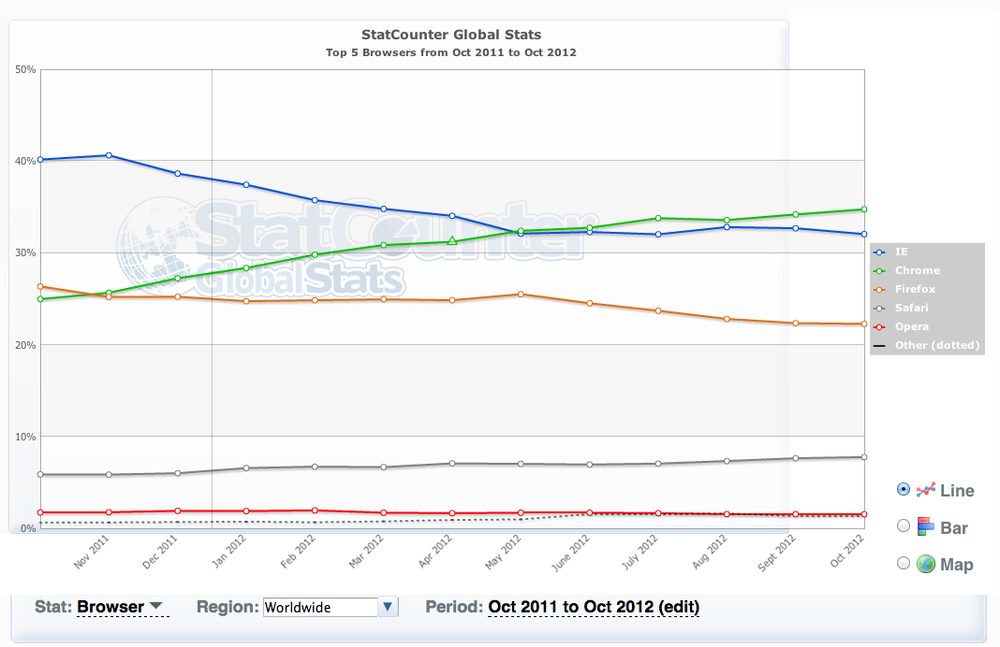
Debugging client-side JavaScript invariably leads to using the debuggers provided by the various browsers themselves, or extensions to the browsers. You can view the current market share of each browser worldwide, or in your region, at the StateCounter website. Figure 7-1 shows the graph as of October 2012.
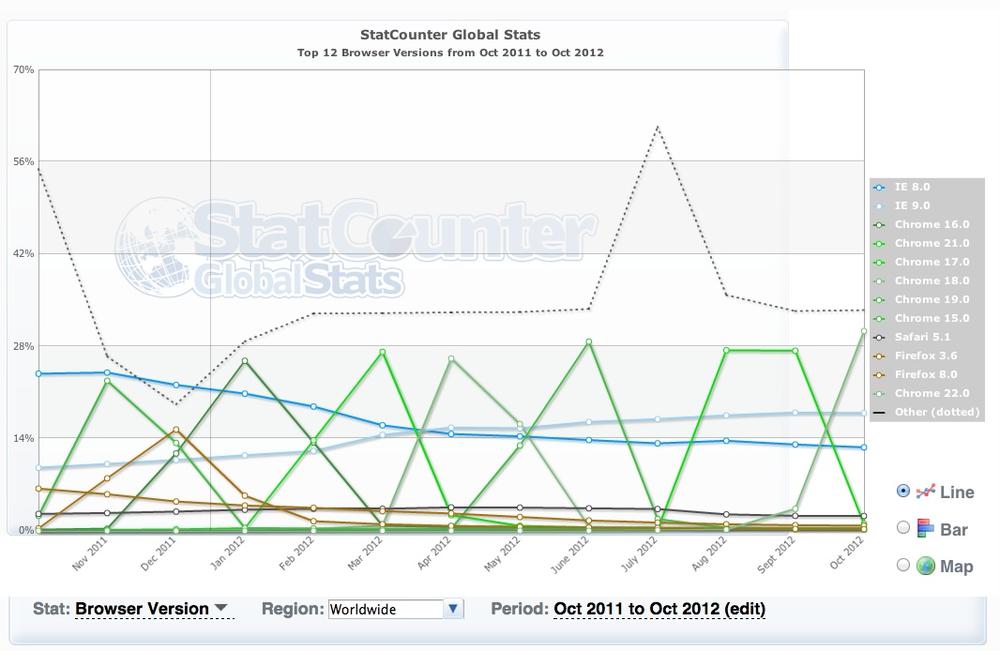
Of course, your web server logs will provide the most accurate assessment of browser usage for your application, but according to the global statistics shown in Figure 7-1, usage of Google Chrome is on the rise while all other browsers are either declining or stagnant. In terms of specific browser versions, Figure 7-2 shows that as of October 2012, use of Chrome 17 and IE 9.0 was rising, while use of all other major browser versions, representing only about a 15% share of the market, was falling. The scariest part of the graph in Figure 7-2 is the dotted line. This line represents mobile and tablet browsers, and its position in the graph indicates that these browsers are used more than the others.
We will discuss debugging on mobile and tablet browsers later in the chapter. In the meantime, let’s take a quick look at the various debuggers each major desktop browser provides. I will highlight some basics and differences between them, but for the most part they are similar and are constantly evolving. You will find a wealth of information about the current features of each debugger online.
Firefox
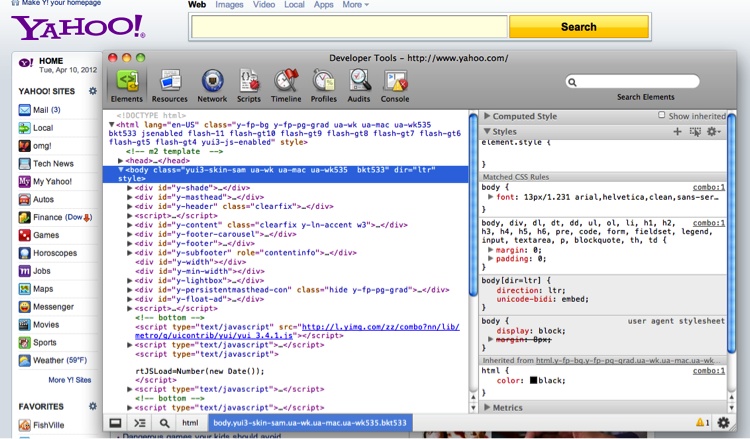
The granddaddy of them all, Firebug is a Firefox extension that provides all the debugging bells and whistles expected in a JavaScript debugger. After installing the latest version (1.11.1 as of this writing) and restarting Firefox, start Firebug by selecting Tools→Web Developer→Firebug→Open Firebug. The Firebug window will open by default at the bottom of the browser; alternatively, you can “detach” it from the browser and place it in its own window if you like. Figure 7-3 shows the Firebug window while browsing Yahoo.com.
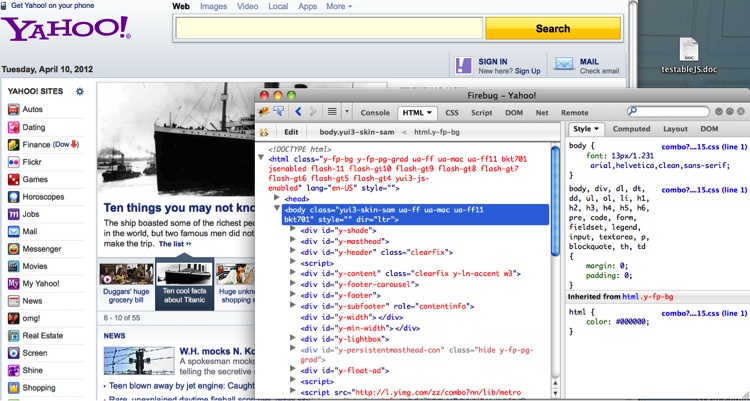
With Firebug, you can manipulate HTML and CSS, step through JavaScript, and set breakpoints. The Net panel will show you the familiar waterfall graph of loading elements. You will see gaps in this graph after JavaScript loads while it is being parsed—holes that Speed Tracer (in Chrome) and dynaTrace (on Windows) can fill in.
Firebug also provides the window.console
object that you can use to log messages to the console. In addition to
printing strings, you can pass any object to the console output methods
and Firebug will dereference it for you to display its fields. You can
display basic timing information using the console.time(<STRING>) and console.timeEnd(<STRING>) methods (yes, the strings have to match, allowing you to
have multiple overlapping timings simultaneously). Firebug will also
display the time that has elapsed between the two calls. You can view
more detailed timings using the console.profile() and console.profileEnd()
methods. Firebug will display complete timing information for each
function that was called between those two invocations. Firebug also
provides the console.trace()
method to generate a stack trace, including all parameters that were passed to each
function within the trace. Objects can be inspected using
console.dir(<object>) and HTML nodes can be inspected using console.dirxml(<node
reference>).
Finally, console.assert(<boolean
condition>) will
display a red error message in the console if the condition does not
evaluate to true.
You can execute arbitrary JavaScript in Firebug or place console.* statements in your code to track it
as it runs, and you can insert a debugger statement to set a breakpoint, but be
careful to take them out when you are done debugging!
Finally, Firebug allows the naming of anonymous functions using the displayName
property. This is easiest to see with an example. Imagine debugging this
function:
function getIterator(countBy, startAt, upTill) {

    countBy = countBy || 1;
    startAt = startAt || 0;
    upTill  = upTill || 100;

    var current = startAt;

    return function() {
        current += countBy;
        return (current > upTill) ? NaN : current;
    };
}
The simple function in the preceding example creates an iterator. The following code demonstrates its usage:
var q = getIterator(10, 0, 200);
console.log(q());
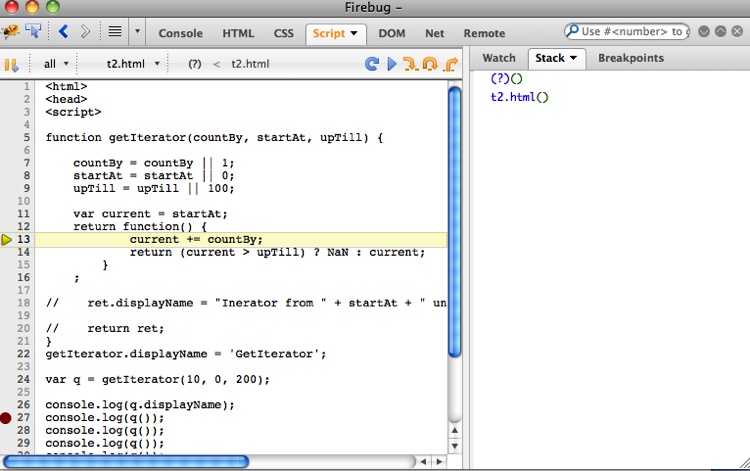
That’s simple enough, but debug this in Firebug and look at the stack, as shown in Figure 7-4.
The stack reveals a function named (?). Firebug does not know what to call this
anonymous function, so you can tell it what to call it using the
displayName property of the anonymous
function, like so:
function getIterator(countBy, startAt, upTill) {

    countBy = countBy || 1;
    startAt = startAt || 0;
    upTill  = upTill || 100;

    var current = startAt
        , ret = function() {
            current += countBy;
            return (current > upTill) ? NaN : current;
        }
    ;

    ret.displayName = "Iterator from " + startAt + " until "
      + upTill + " by "  countBy;

    return ret;
}
Here I added the displayName
property to the anonymous function—and a pretty descriptive displayName at that! Now when we use Firebug
to step through this code, we’ll see something similar to Figure 7-5.
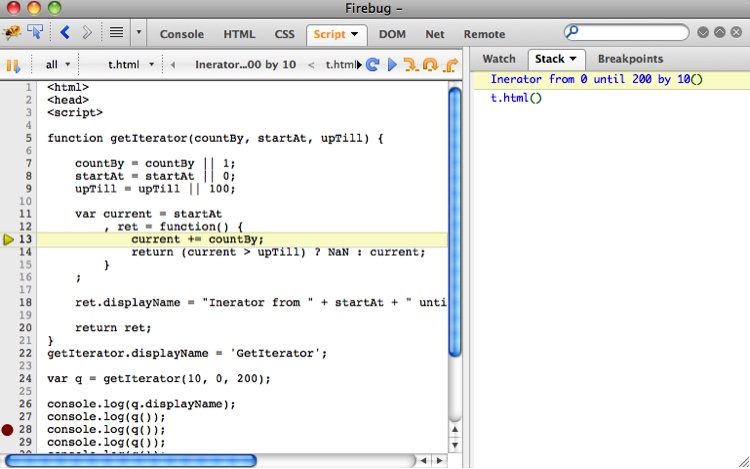
That’s much better! We have transformed (?) into something very descriptive and
helpful. You can add the displayName
property to any function, and it can be anything you like. Obviously, it
is especially useful for anonymous functions, such as those typically
used in event callbacks or, as in this example, ones you generate
yourself.
Chrome
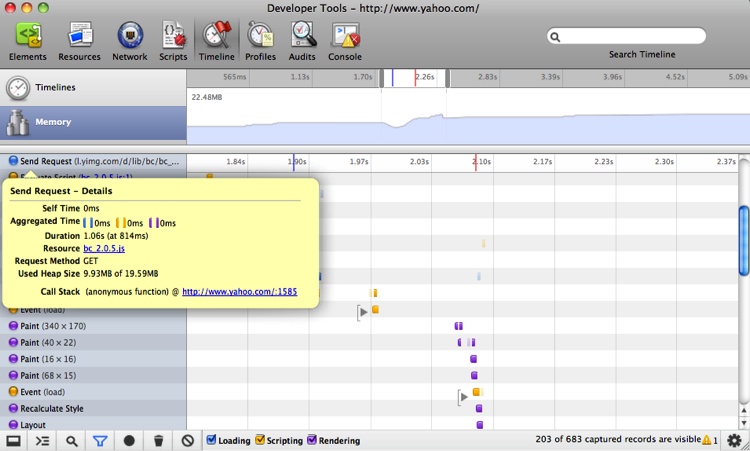
Chrome has an equally useful set of developer tools, including a debugger. Accessed from the View→Developer menu, the Chrome Developer Tools can also be attached to the bottom of the main Chrome window or detached as a separate window. Figure 7-6 shows the window for Yahoo.com.
Awaiting you here is a set of tabs that are similar to those in Firebug. However, Chrome’s Timeline tab includes much of the same data as Speed Tracer, showing not only network traffic, but also what the UI thread is up to, including painting, events, and layout. The Timeline graph also displays when the main resource has finished loading (a purple line) and when the main resource DOM document is finished parsing (a red line). These events represent the initial load time and the first time when the user sees the initial HTML and can start interacting with it—both important measurements. The Timeline panel also has a memory graph. For longer-lived applications with just one page you do not want to see the number forever climbing upward, as such a condition indicates a memory leak in your code. Figure 7-7 shows a peek at the Timeline panel.
The Chrome debugger also supports all of Firebug’s console methods, and for minified code the debugger has a nice “prettifier” that renders the JavaScript code readable again. Once the code is prettified, you can set breakpoints as normal—a very handy feature! Obfuscated and minified code requires more work to prettify, and we will investigate how to do this using source maps later in this chapter.
The Chrome debugger also supports the “naming” of eval blocks. As you
are not using eval, this hopefully
will not affect you. However, some tools—especially tools that
manipulate JavaScript, such as the CoffeeScript compiler—use eval generously. The following format:
//@ sourceURL=<any string without spaces>will make your eval appear in
the Scripts drop-down, where you can select it to jump immediately to
the eval statement. Here is a quick
example:
var two = eval('1 + 1; //@ sourceURL=addedOnePlusOne!');Figure 7-8 shows what this looks like in the Scripts panel of the Chrome debugger.
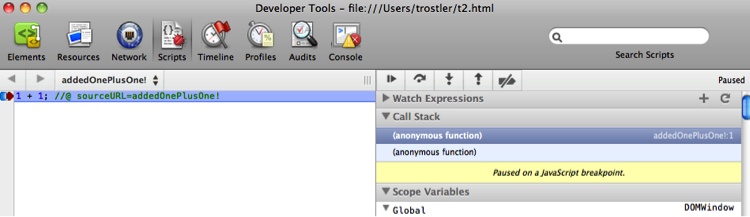
As you can see in the figure, addedOnePlusOne! is available in the list of
scripts to select to jump directly to—and the evaled expression will be available to examine
and breakpoint, as it is in the earlier example. The name is also
visible in the stack trace.
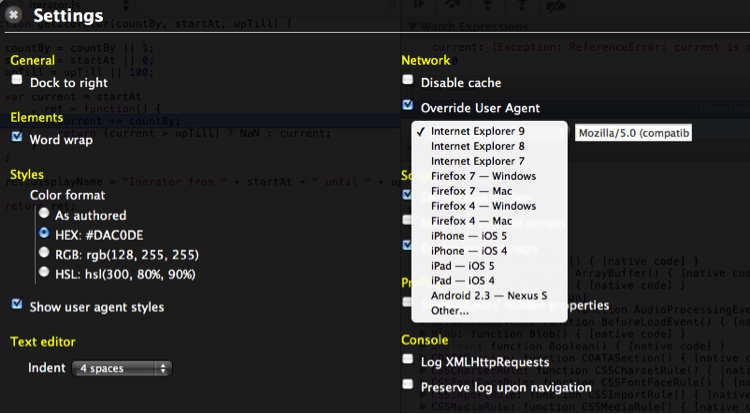
Chrome also allows you to easily change the User Agent string it sends when fetching web pages. You can access this capability in the Settings menu, where you can pretend to be any browser you want (see Figure 7-9).
Finally, Chrome allows you to break on all errors, even errors
that were caught in a try/catch block, as shown in Figure 7-10.
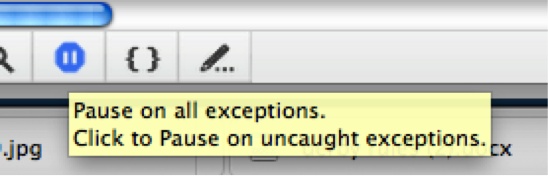
You can toggle this feature on and off. I recommend that you leave it on initially, to ensure that the errors and exceptions you are catching are acceptable.
Safari
Like Chrome, Safari is based on WebKit, and its debugger is very similar to the Chrome debugger. To use the tools, you begin by enabling the Develop menu in Safari. The checkbox for doing so is hidden under Preferences→Advanced→”Show Develop menu in menu bar” (see Figure 7-11).

Now you have a Develop top-level menu with a lot of options. Go ahead and open the Web Inspector, and you’ll see something similar to Figure 7-12.
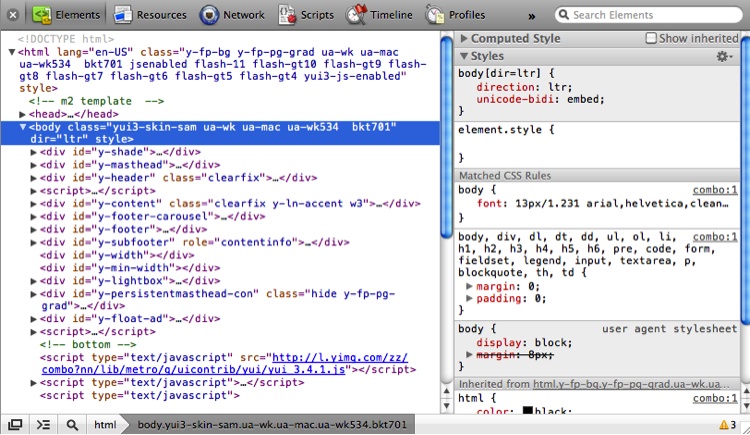
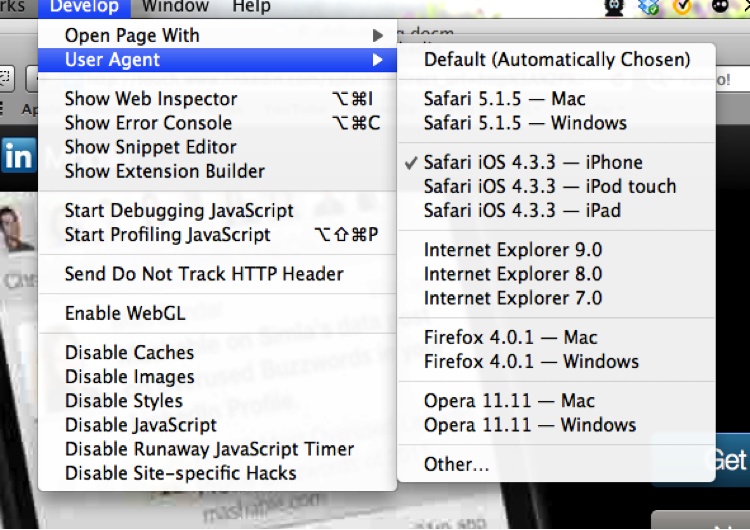
Chrome has added some bells and whistles that are not available in the standard WebKit—namely, the remote debugging JSON protocol (even though it was ported back to WebKit, the feature is not yet available in Safari) and other advanced options—but typically Safari and Chrome behave in virtually the same manner when rendering pages, so choose whichever one you enjoy developing with the most. Of course, there are differences between the two browsers, but they are not as pronounced as are those between Safari/Chrome and Firefox, and especially between Safari/Chrome and Internet Explorer. Like Chrome, Safari also offers easy access to changing the User Agent string it sends to masquerade as different browsers. You can enter an arbitrary string to trick websites into sending content optimized for other browsers. This is most useful for pretending to be a mobile iOS browser, as the iPhone, iPad, and iTouch User Agent strings are all available. Figure 7-13 shows what happens after selecting the iPhone User Agent string and visiting LinkedIn.
Safari also supports the displayName property on functions for display in its debugger.
Internet Explorer
I cannot say much about Internet Explorer that has not been said already. Unfortunately, most of your users may be using IE. Fortunately, use of IE 8 and earlier versions is waning; however, IE 8 and later versions do provide a nice debugger. You access the IE debugger by pressing the F12 key on your keyboard (hence the name “F12 Developer Tools”) or via the Tools menu. The debugger provides similar tools to Firefox and WebKit-based browsers, including rudimentary profiling information.
IE 8 also provides the console
object, but with very limited functionality: only log, info,
warn, error, and assert are supported. At some point you will
have to use the IE debugger, but fear not, it is not ridiculously
hideous.
Node.js Debugging
Node.js ships with a decent command-line debugger. Starting the debugger is easy:
% node debug myscript.jsThe debugger has a small set of commands, which you can review using
the help command:
% node debug chrome.js
< debugger listening on port 5858
connecting... ok
break in chrome.js:1
  1 var webdriverjs = require("webdriverjs")
  2     , fs = require('fs')
  3     , WebSocket = require('faye-websocket')
debug> help
Commands: run (r), cont (c), next (n), step (s), out (o),
backtrace (bt), setBreakpoint (sb), clearBreakpoint (cb),
watch, unwatch, watchers, repl, restart, kill, list, scripts,
breakpoints, version
debug>
These commands are detailed in the aforementioned documentation, but all the basics are there: starting, stopping, and stepping through code; setting and clearing breakpoints; and watching variables.
An interesting twist is the repl command: this
switches into REPL (read-evaluate-print-loop) mode, where you can evaluate
JavaScript (including inspecting variables) in the current context and
scope of the debugger at that moment. Exiting out of REPL mode brings you
back into debugger mode, where you can issue the commands listed
earlier.
You can also use the familiar debugger
statement somewhere in your code to trigger a breakpoint.
The watch commands are not
terribly useful, but they are amusing, as you can “watch” a variable and
at each breakpoint the debugger will dump the variable’s contents—not only
at explicit breakpoints, but also after each step, next, or out
command. There is currently no support for conditional breakpoints.
Running node debug
<script> to interactively debug your
Node.js script is useful, if clunky. V8, the JavaScript engine upon which
Node.js runs, provides a JSON-based protocol for debugging code. You can
access this mode using the --debug and
--debug-brk switches. There currently
can be only one debugger connected to a session at a time; running
node debug ... immediately utilizes
that single debugger connection. The --debug and --debug-brk flags start your Node.js
script and either wait or allow a single connection from a remote debugger
(at a time).
Details regarding the V8 JSON debugging protocol are available at
the code.google V8 website. To
use it, simply connect to the debugger port (5858 by default) and pass and
accept the JSON objects. The bit the developers conveniently forgot to
document is the required presence of a Content-Length header. Regardless, a bare-bones
implementation using the protocol is available. You can install it via
npm:
% npm install pDebug -gNow you can write programs to debug and exercise your applications. First, start a Node.js program you want to inspect or debug:
% node -debug-brk myProgram.jsThis will load the debugger but will not start your program. Attach to it and start issuing debugger commands:
var pDebug = require('pDebug').pDebug
    , debug = new pDebug({ eventHandler: function(event) {
        console.log('Event'); console.log(event); } })
;

debug.connect(function() {
    var msg = { command: 'continue' };
    debug.send(msg, function(req, resp) {
        console.log('REQ: ');
        console.log(req);

        console.log('RES: ');
        console.log(resp);
    });

});
You can also start your program running and attach to it later using:
% node -debug myProgram.jsUsing the API specified on the V8 wiki, you can programmatically send requests and get responses and events from a local or remote debugger running your program. I’ll leave it up to your imagination how to leverage such power—a good start would be conditional breakpoints!
You can also use WebKit’s debugger and developer tools to debug your Node.js application using an npm module such as node-inspector:
% npm install node-inspector -gNow you can fire up your Node.js program under the debugger:
% node -debug-brk myProgram.jsstart the inspector in the background:
% node-inspector &and point Chrome or Safari to this URL: http://localhost:8080/debug?port=5858.
As if by magic, the debugger will open and you will be debugging your Node.js program! Very, very awesome! And funny you should ask, but yes, since PhantomJS is built on WebKit, you can feed this URL to it and open the debugger console in PhantomJS. Figure 7-14 shows a screenshot of PhantomJS running the WebKit debugger.
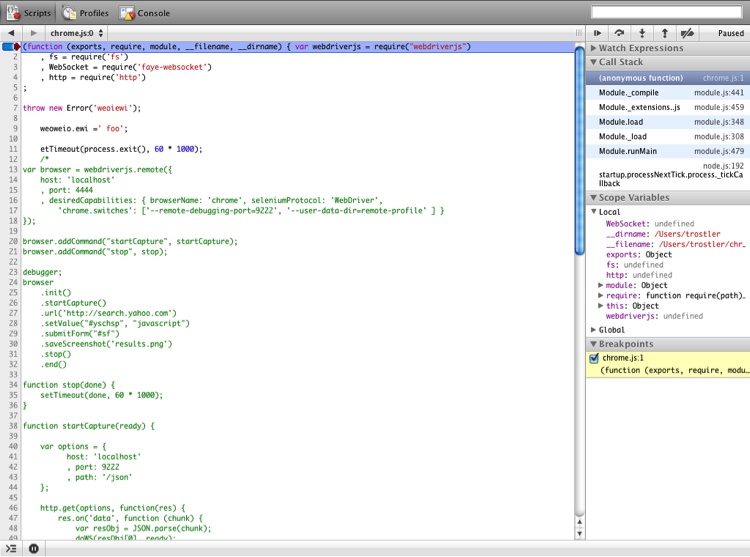
Once PhantomJS exposes the debugger server interface, the details of which we will discuss shortly, you can manipulate the debugger remotely—mind-bendingly zany! For now, you should stick with Chrome or Safari to visually debug your Node.js applications.
Remote Debugging
Debugging JavaScript remotely is easy. This situation is more common and more useful than you may originally think. Remote debugging is either necessary or useful in the following scenarios:
Debugging mobile browsers
Debugging server-side JavaScript
Debugging browser tools
Programmable debugging
First we will look at the nuts and bolts of remote debugging in two environments (Chrome and Firefox), and then we will visit each of the aforementioned scenarios in turn to see how it works. Remote debugging allows the debugger to run in a separate process (or even another host) from the JavaScript being debugged.
Chrome
Chrome/WebKit has, by far, the most mature remote development environment. Versions 18 and later of Chrome have the latest version of the JSON-based remote debugging API, version 1.0. Note that this is not the same API as the V8 debugger API. Chrome allows its debugger to be used on remote code and allows a remote debugger to connect to Chrome to debug JavaScript running within it. That’s service!
To debug JavaScript running in Chrome remotely, you need to start the Chrome executable with a port for the debugger to listen on. Here’s the code if you’re using Windows:
% chrome.exe --remote-debugging-port=9222Here it is if you’re on a Mac (all on one line):
% /Applications/Google\ Chrome.app/Contents/MacOS/Google\ Chrome
--remote-debugging-port=9222
You should also start Chrome with this option:
--user-data-dir=<some directory>This is equivalent to starting Chrome with a fresh profile, such as your Firefox profile. Now you can attach to port 9222 and interact with the 1.0 debugger profile.
Here is an example of how to use this functionality to pull out
timing statistics—the same statistics as those that Speed Tracer and the
Chrome debugger’s Timeline panel visualize. We will use Selenium to
automatically spawn a Chrome instance listening on port 9222 for
debugger connections. You may find it interesting that the JSON
debugging API runs over Web Sockets, not HTTP; use of Web Sockets makes
event propagation trivial. Using EventHub or socket.io would provide the same functionality
over plain HTTP.
Let’s take a look at a Node.js script using webdriverjs, the Node.js package discussed in Chapter 6 for Selenium WebDriver, which leverages Chrome’s remote debugging capabilities. This script is a bit longer, so we will look at it in two parts. This first part starts up Selenium with the appropriate Chrome command-line options and exercises the browser with the flow we want to capture:
var webdriverjs = require("webdriverjs")
    , browser = webdriverjs.remote({
        host: 'localhost'
        , port: 4444
        , desiredCapabilities: {
            browserName: 'chrome'
            , seleniumProtocol: 'WebDriver'
            , 'chrome.switches': [
                '--remote-debugging-port=9222'
                , '--user-data-dir=remote-profile'
            ]
        }
    }
);

browser.addCommand("startCapture", startCapture);

browser
    .init()
    .url('http://search.yahoo.com')
    .startCapture()
    .setValue("#yschsp", "JavaScript")
    .submitForm("#sf")
    .saveScreenshot('results.png')
    .end();
This is mostly standard webdriverjs stuff we have seen before.
However, there are two additions. The first addition is the chrome.switches desired capability. The Chrome
driver conveniently allows us to provide command-line switches to the
Chrome executable. Here we are telling Chrome to start listening for
remote debugger connections on port 9222 and to use a profile from a
specific directory. We do not need any specific Chrome extensions or
settings to use remote debugging, so this is pretty much just a blank
profile.
The second addition is the startCapture function. webdriverjs allows us
to define a custom method that can be chained along with all the
standard webdriverjs methods. Any custom method receives a callback
function to be invoked when the custom function is finished. Here we
have defined a startCapture method
that will start capturing all Chrome-supplied timing information—network
times, painting times, layout times, everything that is available. There
is no corresponding stopCapture
function in this example, as we will just capture everything until the
browser is closed.
Here is the startCapture
function:
function startCapture(ready) {

    var http = require('http')
        , options = {
           host: 'localhost'
           , port: 9222
           , path: '/json'
        }
    ;

    http.get(options, function(res) {
        res.on('data', function (chunk) {
            var resObj = JSON.parse(chunk);
            connectToDebugger(resObj[0], ready);
        });
    }).on('error', function(e) {
        console.log("Got error: " + e.message);
    }
Visiting http://localhost:9222/json (or
whatever host Chrome is now running on) will return a JSON response,
which is an array of tabs that can be attached to for remote debugging.
Since we just opened this Chrome instance with Selenium there is only
one tab, and hence only one object in the array. Note that webdriverjs
passed startCapture a callback
function to be called when our startCapture step is finished. So, this
function connects to the local (or remote) Chrome instance, gets the
JSON data about the current tab we want to debug, and then hands off
this information to the connectToDebugger function, shown here:
function connectToDebugger(obj, ready) {

    var fs = require('fs')
        , WebSocket = require('faye-websocket')
        , ws = new WebSocket.Client(obj.webSocketDebuggerUrl)
        , msg = {
            id: 777
            , method: "Timeline.start"
            , params: {
                maxCallStackDepth: 10
            }
        }
        , messages = ''
    ;

    ws.onopen = function(event) {
        ws.send(JSON.stringify(msg));
        ready();
    };

    ws.onmessage = function(event) {
        var obj = JSON.parse(event.data);

        if (obj.method && obj.method === 'Timeline.eventRecorded') {
            obj.record = obj.params.record;  // Zany little hack
            messages += JSON.stringify(obj) + '\n';
        }
    };

    ws.onclose = function(event) {
        var header = '<html isdump="true">\n<body><span id="info">'
          + '</span>\n<div id="traceData" isRaw="true" version="0.26">'
          , footer = '</div></body></html>'
        ;

        ws = null;
        fs.writeFileSync('DUMP.speedtracer.html', header + messages
          + footer, 'utf8');
    };
OK, this is the meat of the whole thing! Remember, the debugger
protocol runs over a web socket connection. The faye-websocket npm
module provides an excellent client-side web socket implementation,
which we leverage here. The object provided by startCapture contains the webSocketDebuggerUrl property, which is the
web socket address to connect to for this tab—which was just spawned by
Selenium.
After connecting to the specified web socket address,
faye-websocket will issue a callback to the onopen function. Our onopen function will send a single
JSON-encoded message:
msg = {
    id: 777
    , method: "Timeline.start"
    , params: {
        maxCallStackDepth: 10
    }
};
The specification for this message is available at the Chrome Developers Tools website. This tells Chrome to send us web socket messages, which are Chrome debugger events, for every Timeline event. Once we’ve sent this message, we call the webdriverjs callback so that our webdriverjs chain can continue (remember that?).
Now, we perform some Selenium actions for which we want to capture
Timeline events—in this case,
loading Yahoo! and
then searching for “JavaScript”. While all this is happening, Chrome is
sending us Timeline.eventRecorded
events, which we dutifully capture and keep via the onmessage web socket callback.
Finally, after those actions have finished, we shut down Selenium,
which closes Chrome, which calls our onclose handler, which does some interesting
things as well—namely, dumping all our saved events into an HTML file.
This HTML file is, conveniently, the same file format used by Speed
Tracer, so if you load this HTML file into Chrome with the Speed Tracer
extension installed, it will load the Speed Tracer UI with this
data—awesome! This allows you to automatically capture Speed Tracer
input that you can use to compare against previous versions of your
code, or examine at your leisure. Figure 7-15 shows how the HTML
code looks when loaded into Chrome, with Speed Tracer installed.
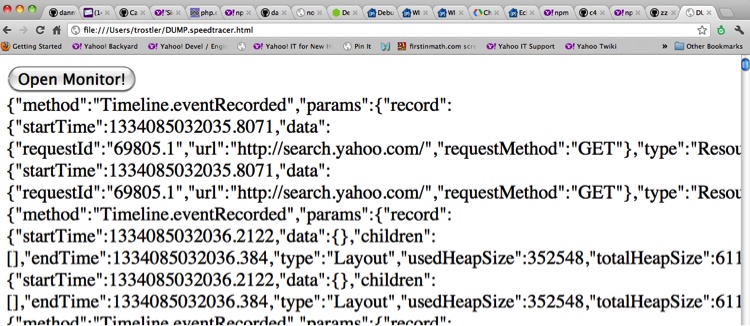
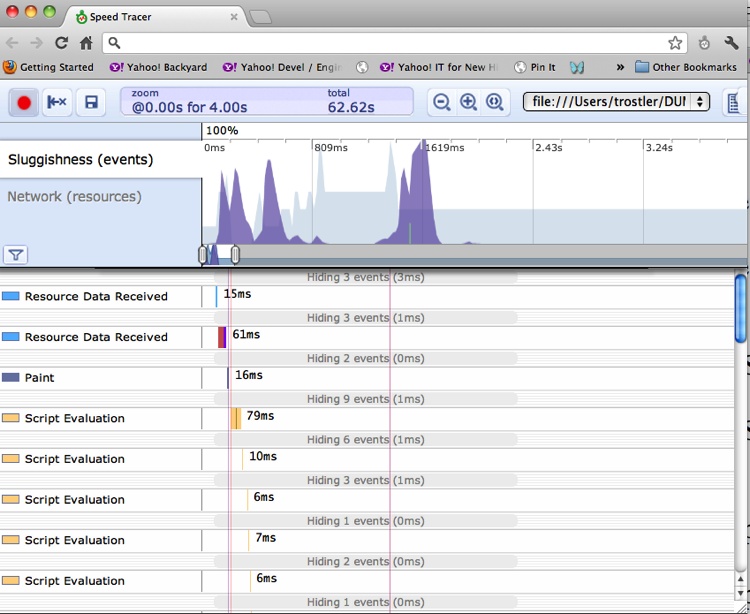
Clicking the Open Monitor! button brings up the Speed Tracer UI with our captured data in it, as shown in Figure 7-16.
Beyond capturing Timeline events from Chrome, you can also completely control the Chrome debugger from a remote location, pausing and resuming scripts, capturing console output, calling and evaluating JavaScript in the context of the page, and doing all the other things you can do using the Chrome debugger directly.
PhantomJS
Similar to Chrome, PhantomJS can be used as a target for remote debugging. But in this case, the remote machine can be headless, or you can run PhantomJS locally without having to fire up another browser instance with its own separate profile.
Unfortunately, you cannot directly interact with the web application running in the PhantomJS browser. Fortunately, you can step through the code and interact programmatically with your running code via a PhantomJS script.
Remote debugging using PhantomJS is most useful for scriptable or programmable debugging. Here is how to set it up using the latest version (1.7.0 as of this writing):
% phantomjs -remote-debugger-port=9000 ./loader.js <webapp URL>In the preceding command line, loader.js is a PhantomJS script that simply loads your URL and waits:
// Open page from the command line in PhantomJS
var page = new WebPage();

page.onError = function (msg, trace) {
    console.log(msg);
    trace.forEach(function(item) {
        console.log('  ', item.file, ':', item.line);
    })
}

page.open(phantom.args[0], function (status) {
    // Check for page load success
    if (status !== "success") {
        console.log("Unable to access network");
    } else {
        setInterval(function() {}, 200000);
    }
});
This script will also dump out any syntax errors or uncaught
exceptions from your application, which is nice. Once this script is
running, open your local WebKit-based browser, type
http://<phantomjs_host>:9000
in the URL bar, and click on the link that is your web application. The
familiar debugger will open and you will be live-debugging your
application.
PhantomJS provides an evaluate
method that allows you to manipulate the DOM of the loaded page
and execute JavaScript on the page. Note that any JavaScript executed by
PhantomJS on the page is sandboxed and cannot interact with the running
JavaScript in your application—but that is what the remote debugger is
for! One-way interaction from your web application to a PhantomJS script
can happen via console.log
messages, and there are interesting ways to leverage that path, as we
will see when gathering unit test output and code coverage information
and using PhantomJS as a target for automated unit test execution.
Firefox
Firebug also has a remote debugging capability, using the Crossfire extension. Crossfire is an extension to Firebug that exposes a debugging protocol to the network for programmable debugging. The latest version (0.3a10 as of this writing) is available at their website. Once you have installed Crossfire and restarted Firefox, you will see a Crossfire icon in your Add-on bar. Clicking on that icon and then clicking Start Server brings up the dialog box shown in Figure 7-17.
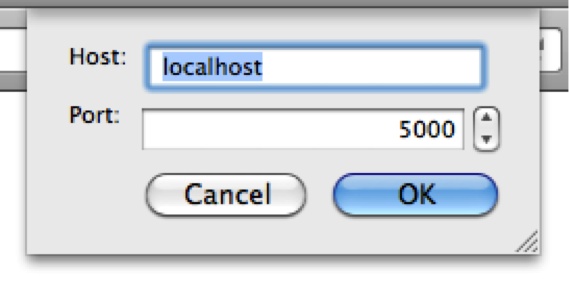
Click OK to start the Crossfire server on this host, listening on port 5000 (or set the port number to something else).
Alternatively, you can start Firefox with a command-line option to automatically start the Crossfire server on a given port:
% firefox -crossfire-server-port 5000Now you can connect to the Crossfire server and start debugging! Similarly to Chrome’s tabs, Firebug treats each tab as a separate “context.” Unfortunately, the Selenium Firefox driver does not currently support passing arbitrary command-line options to the Firefox executable, and nor does Crossfire support profile-based configuration, so this cannot be automated by Selenium. I hope this changes soon.
Crossfire is not as mature as the debugging server built into Chrome. I expect this to change over time, but currently you are better off using the WebKit/Chrome-based debugger for remote debugging within the browser.
Mobile Debugging
Mobile debugging is just an offshoot of remote debugging. To be clear, we are talking about debugging in mobile browsers. The two main browsers, Chrome in Android and Safari in iOS, are based on WebKit. We’ve already seen some examples of remote debugging using WebKit-based browsers, and the latest versions of Android (now up to 4.2, Jelly Bean) and iOS (6) allow for remote debugging. If you’re sure that all your users will be running these latest versions, then no problem! Let’s take a quick look at the native solutions before investigating a more general one.
Android 4
You can install Chrome for Android Beta on Android 4.0 and later from the Google Play store. This version allows for remote debugging from your desktop using the standard WebKit debugging protocol. Once Chrome for Android Beta is installed, you must go to Settings→Developer Tools to enable remote debugging.
Meanwhile, on your desktop you must install the Android Software Developer Kit (SDK) from the Android website. We only need one script from this package: the Android Debug Bridge (adb). That executable is available in the stock SDK download and installing it is easy. Once you’ve downloaded the SDK, run the Android executable, which is the Android SDK Manager. From that tool you have the option to install the Android SDK Platform tools, which contain the adb tool. Simply check the corresponding box and click Install. Figure 7-18 shows what the Android SDK Manager tool looks like on my Mac.
Installing all that stuff will take a long time so if you just want the adb tool, uncheck all the other checkboxes and then click Install. Once the tool is installed, a platform-tools directory will exist in the main SDK tree. You must now connect your phone to your desktop using your USB cable. You can run the adb tool like so:
% ./adb forward tcp:9222 localabstract:chrome_devtools_remote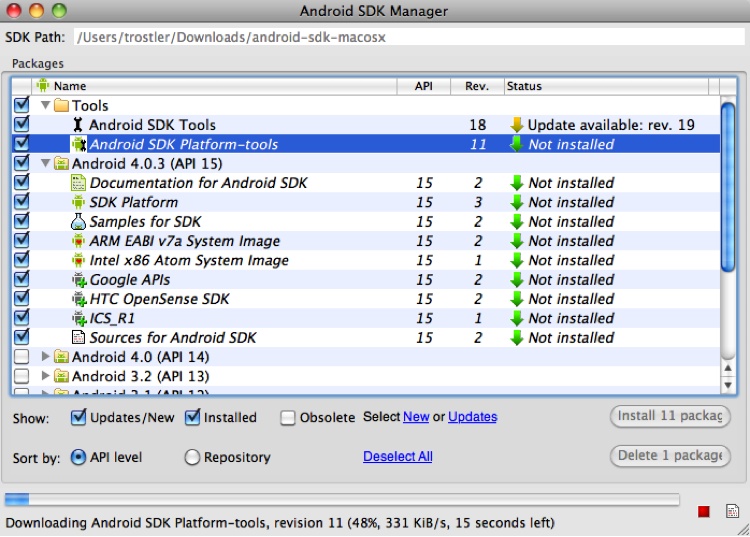
On your desktop Chrome, connect to http://localhost:9222 and you will see a list of the URLs in each tab on the Chrome browser on your phone. Click the tab you would like to debug, and voilà, you can use the Developer Tools on your desktop Chrome to debug and control the browser on your phone.
The biggest shortcoming to this approach is that you must be running Android 4.0 or later, you must install Chrome Beta, and your phone must be physically connected to your desktop. This method works only for that exact scenario.
iOS 6
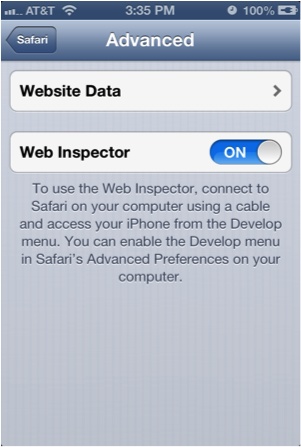
iOS 6 brings a new remote Web Inspector feature to Mobile Safari. Start by selecting Settings→Safari→Advanced to enable the feature on your iDevice (see Figure 7-19).
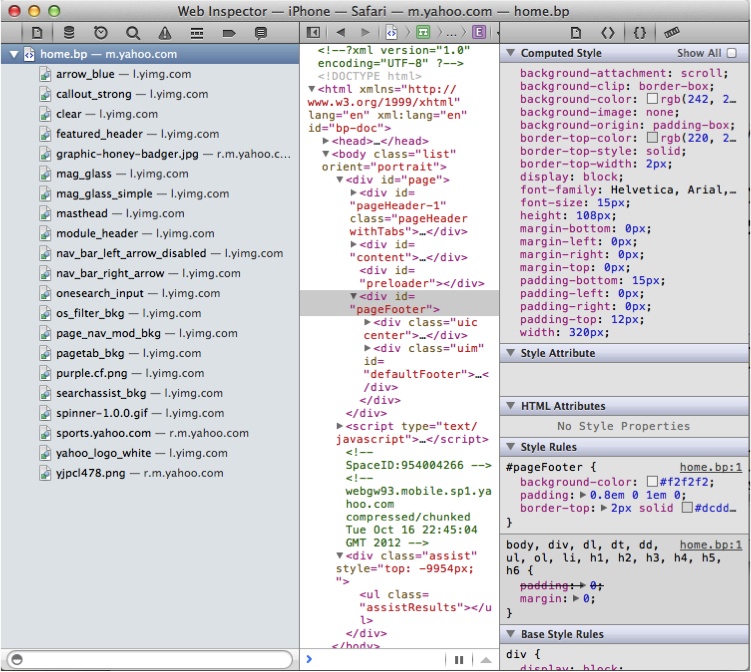
Now browse to the site you want to debug in Mobile Safari [in this example, Yahoo!], connect the device to a Mac running desktop Safari 6.0+, and pull down the Develop menu (which must be enabled), as shown in Figure 7-20.
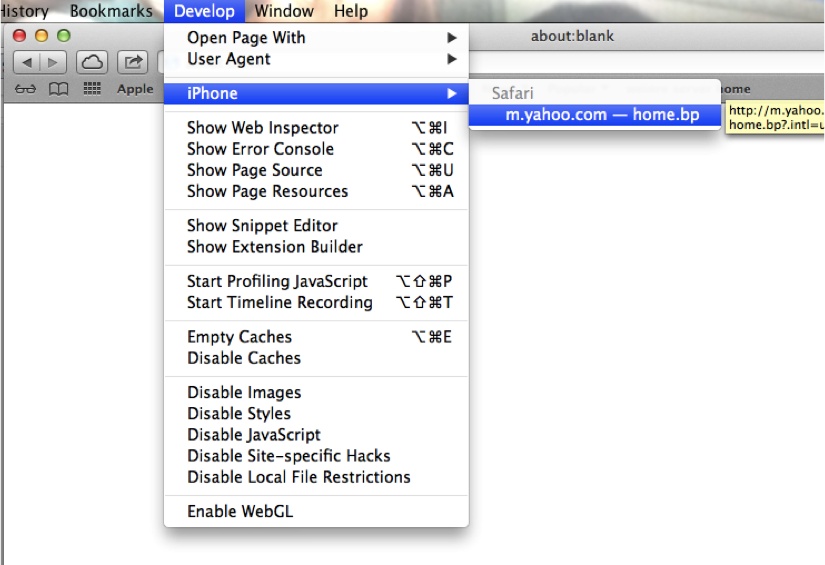
As you can see here, my iPhone is now available to be Web Inspected remotely. You can choose any open mobile Safari page to attach the debugger to and then debug as usual, setting breakpoints, stepping through JavaScript, and inspecting page elements. Figure 7-21 shows the Safari Web Inspector window for the mobile Yahoo.com page.
Adobe Edge Inspect
Adobe Edge Inspect (originally Adobe Shadow) is a cross-mobile-OS solution that allows remote WebKit mobile debugging on all versions of Android, iOS, and Kindle Fire. It consists of a desktop Chrome extension, a desktop daemon (similar to adb), and an application on your device. Your device must be on the same local network as your desktop so that they can connect to each other. Adobe Edge Inspect only works on Windows 7 and Mac OS X.
Start at the Adobe Creative Cloud website and grab the latest version of the Inspect daemon. From that page you can also download the application for iOS, Android, or Kindle Fire and the Inspect Chrome extension.
Start up the Inspect application; to do this you must log into the Creative Cloud website again—Bad Adobe!
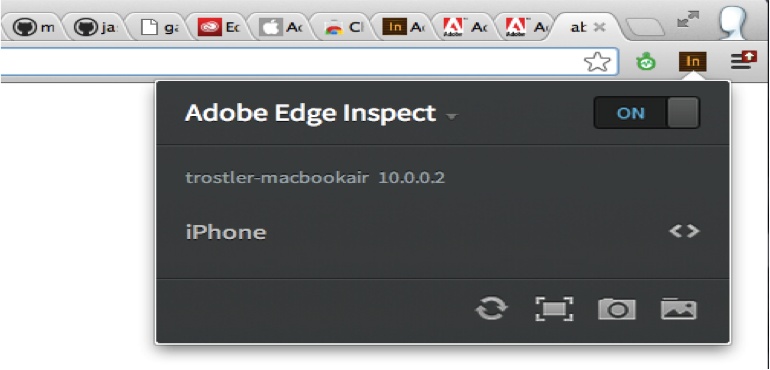
In Chrome, install the Adobe Inspect extension from the Chrome Web Store and you will be greeted by the Inspect extension icon on your browser; click it and you’ll see something similar to Figure 7-22.
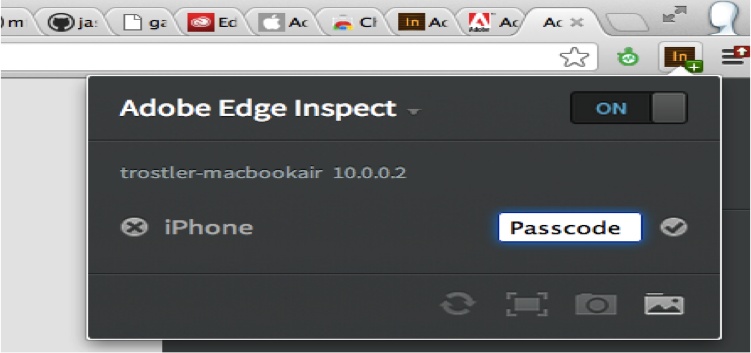
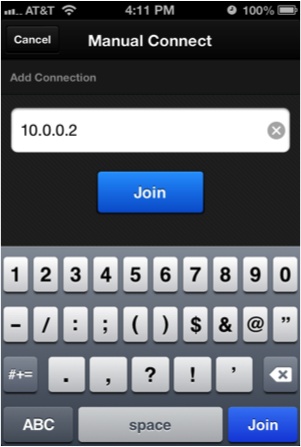
Make sure the slider is set to “on.” Adobe Inspect is now ready to accept connections from a mobile device running the Adobe Inspect application, so grab that from your mobile app store and run it. You will be prompted to add a connection. Although a “discovery” feature is available for this, I have not had success with it. Fortunately, you can manually add a connection by specifying the IP address of your desktop running the Adobe Inspect daemon (see Figure 7-23).
After connecting, you will be presented with a PIN that you must enter into your desktop Chrome browser (see Figure 7-24).
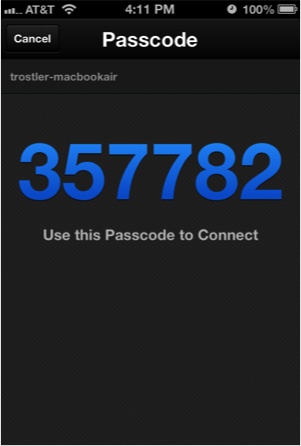
That passcode is entered into your desktop Chrome browser from the extension icon. At this point, the device is ready to be debugged (see Figure 7-25).
Now open a tab in your desktop Chrome browser and navigate to the page you would like to debug; that page will also load on your mobile device. In fact, once you are connected, any URL you visit will be mirrored on that device. Clicking the <> icon from within the Inspect extension will bring up the debugger, and what is being debugged is the version of the URL on the mobile device.
You can now use the debugger as you would on a local page, selecting elements, changing CSS, and debugging JavaScript. It is as though the location being debugged is running in the local browser.
This works on all versions of Android, iOS, and Kindle Fire. The only requirements are that the device (or devices, as multiple devices can be mirrored from a single Chrome desktop simultaneously) must be on the same local network as the desktop, you must use Chrome, and you must be using Windows 7 or Mac OS X.
Things get goofy when a website offers both a “mobile” and “desktop” version of its site, so it’s best to set the User Agent of your desktop Chrome browser to match whatever device is being mirrored. You can do this from the Developer Tools menu; click on the Settings wheel in the lower-right corner and select the Overrides tab (see Figure 7-26).
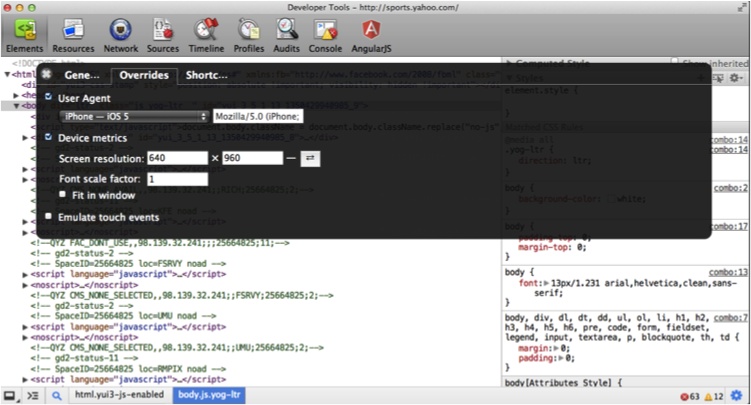
Now the site viewable in desktop Chrome will match what is being viewed on your mobile device, making for easier debugging.
While this is a neat tool, with the advent of iOS 6 and good native Android debugging the value of using Adobe Inspect is limited, so stick with the native solutions if possible.
Other Mobile Debugging Options
Other mobile debugging options are also available, such as weinre (pronounced “winery”), which became part of PhoneGap and is now an incubator project at Apache called Apache Cordova. weinre—which stands for WEb INspector REmote—works similarly to Adobe Inspect, but Inspect is more polished. And with the advent of native iOS 6 and Android debugging, its usefulness is minimized.
Jsconsole.com is another option: it requires the injection of its JavaScript via a bookmarklet to inject debugging code. The end result is similar, but the method is more clunky and complicated.
Going forward, your best bet for a robust debugging environment is either one of the native options discussed here, or Adobe Inspect. But this space is changing quickly, so keep your eyes and ears open for new solutions!
Production Debugging
The techniques and tools we have discussed thus far are fabulous when debugging in your local development environment. But what about code that is already in production? Minification, combination, and obfuscation make production code extremely hard to debug. We already discussed the fact that WebKit browsers have a “prettify” button to “unwrap” minified code, but what about combined and obfuscated code? Or how about JavaScript code generated from another tool from another language, such as CoffeeScript or even Java (via GWT)?
Minified Code
As previously mentioned, WebKit browsers have a “de-minify” button for the simplest case of only compressed code. Figure 7-27 shows minified code in the Chrome debugger.
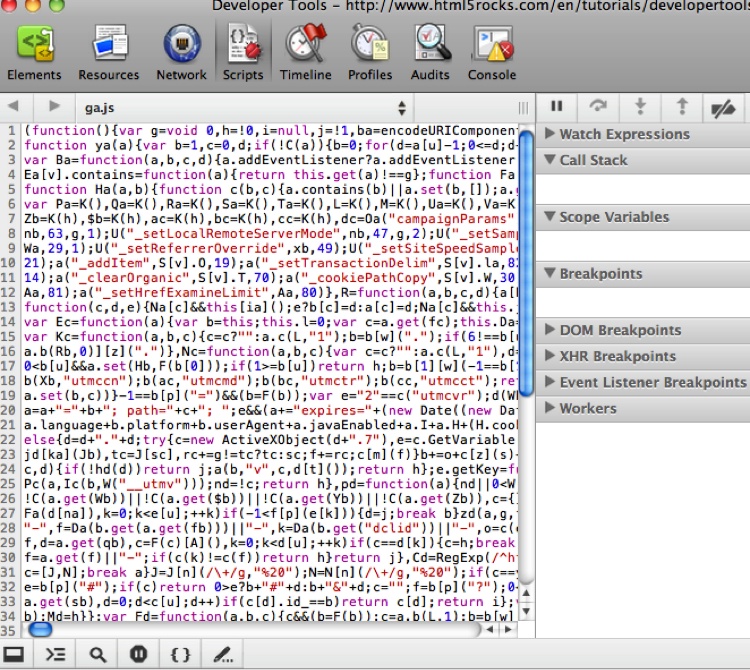
As you can see, this is not terribly useful! It is impossible to set a breakpoint, and if the code does stop somewhere it is impossible to tell exactly where. Decompressing the code after clicking the {} button yields what’s shown in Figure 7-28.
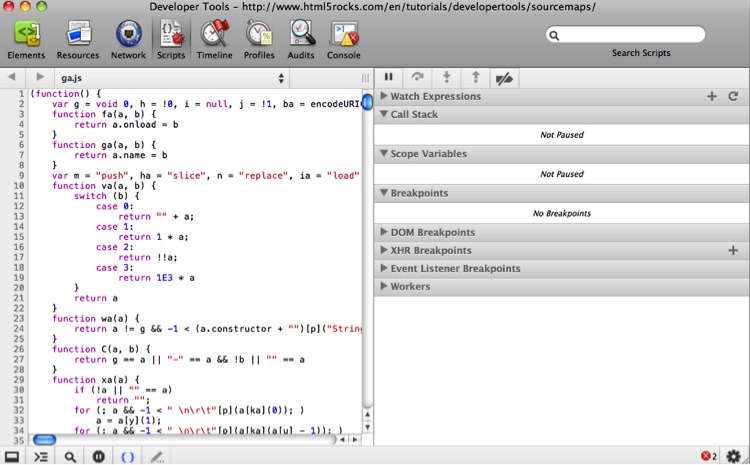
Great, now this code is readable and breakpoints can be set on each line. But this code was also obfuscated using Google’s Closure Compiler, so we do not have access to the original variable names (similar obfuscation tools will yield similar results).
Source Maps
Source maps come to our rescue here. A source map is a single file containing one large JSON object mapping lines in the compressed, obfuscated, and combined JavaScript code back to the original code. An added bonus is the fact that the “original code” does not even need to be JavaScript! The source map specification is available here and is currently at Revision 3.
Using source maps, code that has been minified, combined, and obfuscated can be mapped directly back to the original source in the debugger. As of this writing, only Google Chrome supports source maps natively (on the Beta branch), although other browsers are sure to follow. The Google Closure Compiler combines and generates minified and obfuscated code and can also output a source map for that code. Google also supplies the Closure Inspector, a Firebug extension that lets Firebug understand source maps as well. Hopefully, source map support will soon be supported in all browsers natively.
Let’s take a quick look at the process. For this example we will
use the getIterator
function shown earlier. Here it is again, in a file called iterator.js:
function getIterator(countBy, startAt, upTill) {

    countBy = countBy || 1;
    startAt = startAt || 0;
    upTill = upTill || 100;

    var current = startAt
        , ret = function() {
            current += countBy;
            return (current > upTill) ? NaN : current;
        }
    ;

    ret.displayName = "Inerator from " + startAt + " until "
        + upTill + " by " + countBy;

    return ret;
}
As you can see, there’s nothing special here—it weighs in at 406 bytes.
Let’s grab the latest version of compiler.jar from the Google Closure Compiler home page. Now we are ready to run the Closure Compiler on iterator.js:
% java -jar compiler.jar --js iterator.js --js_output_file it-comp.jsHere is our new file, it-comp.js (lines broken for readability):
function getIterator(a,b,c){var a=a||1,b=b||0,c=c||100,d=b
,e=function(){d+=a;return d>c?NaN:d};
e.displayName="Iterator from "+b+" until "+c+" by "+a;return e};
This file weighs in at a svelte 160 bytes! In addition to deleting
all the whitespace (and any comments), variable names were renamed:
countBy was transformed to a, startAt to b, upTill
to c, and so forth. This cuts down on
the size of the file tremendously, and now we are ready to deploy into
production!
Or are we? There is still a problem with this code: debugging the code in a browser will be very difficult. Even “unminifying” it using the {} button in a WebKit debugger will not bring our original source code back, due to our renaming of the variables.
Fortunately, the Closure Compiler can make more advanced transformations to our code to make it even smaller. However, these transformations will deviate our code even further from the original.
And here is where this becomes a problem. If we load the code into the debugger as part of our web page and try to debug it, we see that the code is quite ugly (see Figure 7-29).
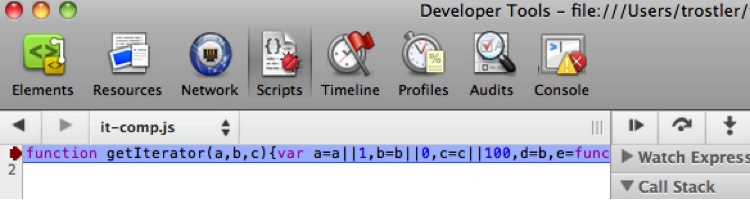
Figure 7-30 shows the unminified version.
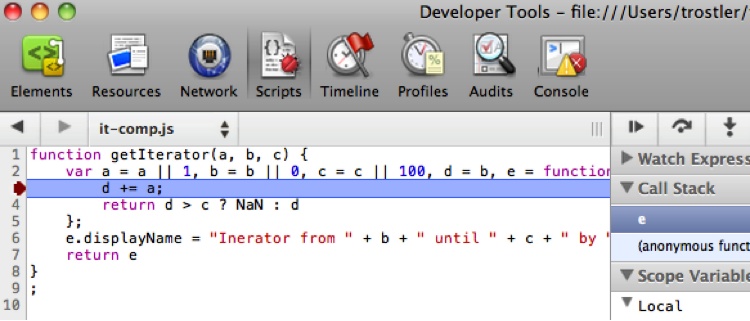
OK, that version is slightly less ugly, but the variable names are still not correlated to our original source, and the line numbers are different from those in the original file.
Source maps to the rescue! First we tell the Closure Compiler to generate a source map for us (all on one line):
% java -jar compiler.jar --js iterator.js --js_output_file
it-comp.js --create_source_map ./it-min.js.map --source_map_format=V3
If we take a look at the generated source map file, it-min.js.map, it is indeed a giant JSON object:
{
"version":3,
"file":"it-comp.js",
"lineCount":1,
"mappings":"AAAAA,QAASA,YAAW,CAACC,CAAD,CAAUC,CAAV,CAAmBC,CAAnB,CAA2B,
CAE3C,IAAAF,EAAUA,CAAVA,EAAqB,CAArB,CACAC,EAAUA,CAAVA,EAAqB,CADrB
,CAEAC,EAASA,CAATA,EAAmB,GAFnB,CAIIC,EAAUF,CAJd,CAKMG,EAAMA,QAAQ
,EAAG,CACfD,CAAA,EAAWH,CACX,OAAQG,EAAA,CAAUD,CAAV,CAAoBG,GAApB,CAA0BF
,CAFnB,CAMvBC,EAAAE,YAAA,CAAkB,gBAAlB,CAAqCL,CAArC,CAA+C,SAA/C,CAA2DC
,CAA3D,CAAoE,MAApE,CAA6EF,CAE7E,OAAOI,EAfoC;",
"sources":["iterator.js"],
"names":["getIterator","countBy","startAt","upTill","current","ret"
,"NaN","displayName"]
}
The meat of this object is the mappings property,
which is a Base64 VLQ-encoded string. You can read plenty of gory
details about this encoding, as well as what exactly is encoded,
online.
The last bit of magic is to tie the source map to the JavaScript served to the browser, which you can do by adding an extra HTTP header or by adding a magical line to the minified JavaScript telling the debugger where to find the corresponding source map:
function getIterator(a,b,c){var a=a||1,b=b||0,c=c||100,d=b
,e=function(){d+=a;return d>c?NaN:d};
e.displayName="Iterator from "+b+" until "+c+" by "+a;return e};
//@ sourceMappingURL=file:////Users/trostler/it-min.js.map
Here we added a line to the Closure Compiler output pointing to the source map generated by the compiler.
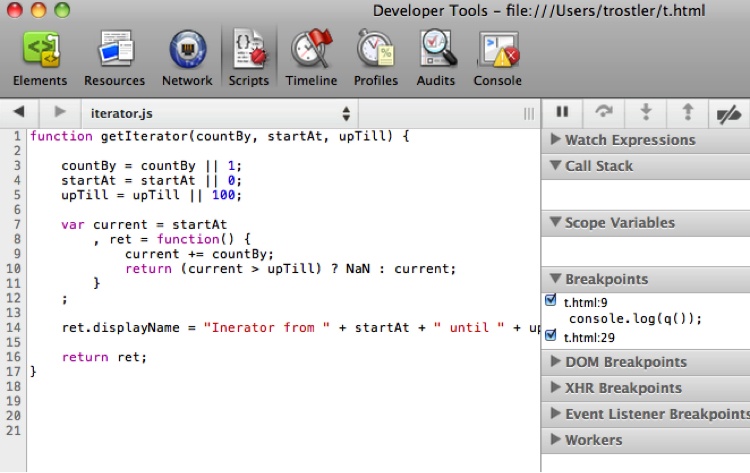
Now go back to the browser, load it all up, and look in the debugger (see Figure 7-31).
Not only is the code in the debugger window our exact original code, but also the filename in the Scripts pull-down is the original filename. Breakpoints can be set as though this were the exact code running in the browser, but indeed the browser is actually running the minified output from the Closure Compiler.
The biggest issue when using source maps is printing/evaluating expressions, as the original source looks like it is being executed as is, but those original variable names do not actually exist in the browser as it is executing your minified code. You cannot evaluate expressions to determine variable values, nor do you have the mapping to know what the variable was transformed into! Figure 7-32 shows an example.
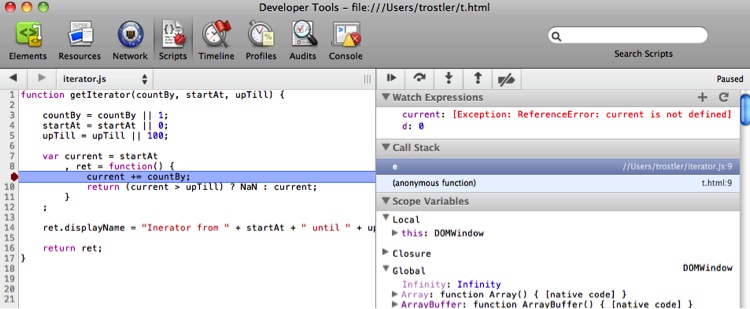
In the debugger I am looking at code where the variable current should be defined, but my Watch
Expressions display reveals that it is not defined! Conversely, some
random variable named d is defined
with the value 0, but it does not
appear to be so defined in the source code listing. This is weird and
something to be aware of. Perhaps future versions of the specification
will handle this inconsistency.
Google’s GWT compiler can also output source maps, and work is being done for the CoffeeScript compiler as well, so as far as you can tell you are debugging your original native code while the browser is actually running the compiled version. As time goes on other tools besides the Closure Compiler will support this format, so get behind (or ahead?) of it!
Recap
There are myriad ways to debug both client- and server-side JavaScript. Debuggers available within (or via an extension to) all the major browsers provide an incredible array of excellent tools for more than just step-by-step debugging, including HTML and CSS live editing, tracing, and profiling. Chrome and headless PhantomJS expose themselves for remote debugging, and Firefox via Crossfire is heading in that direction as well.
Server-side JavaScript is also well served using the built-in command-line debugger, a programmable debugger, or a remote debugger in WebKit-based browsers.
There is also a wide-open field for programmable debuggers. I hope the day will soon come when stepping through code line by line will be mostly a thing of the past. Automated tools to help speed up the debugging process will be a most welcome addition to the current tool chain.
Performance problems can also be quickly tracked down using excellent tools such as Speed Tracer and the Profile or Performance tab provided by most in-browser debuggers, and there is experimental support for profiling Node.js applications as well.
Finally, production and non-JavaScript debugging can be made straightforward with the use of source maps.
So, even though debugging is painful, these modern tools do manage to take away a lot of the tedium. The olden days of “console.log” are (hopefully!) long past.