Table of Contents for
Testable JavaScript
 Testable JavaScript
Published by
O'Reilly Media, Inc., 2013
Testable JavaScript
Published by
O'Reilly Media, Inc., 2013
Chapter 5. Code Coverage
Even though code coverage metrics can be misleading, they are still vital. While code coverage is typically associated with unit tests, it is equally easy to generate code coverage metrics from integration tests. And it is trivial to combine multiple code coverage reports into a single report that includes all your unit and integration tests, thereby providing a complete picture of exactly what code is covered by your full suite of tests.
Regardless of the coverage tools you utilize, the flow is similar: instrument JavaScript files for code coverage information, deploy or exercise those files, pull the coverage results and persist them into a local file, potentially combine coverage results from different tests, and either generate pretty HTML output or just get the coverage numbers and percentages you are interested in for upstream tools and reporting.
Coverage Basics
Code coverage measures if, and if so, how many times, a line of code is executed. This is useful for measuring the efficacy of your test code. In theory, the more lines that are “covered”, the more complete your tests are. However, the link between code coverage and test completeness can be tenuous.
Here is a simple Node.js function that returns the current stock price of a given symbol:
/**
 * Return current stock price for given symbol
 *    in the callback
 *
 * @method getPrice
 * @param symbol <String> the ticker symbol
 * @param cb <Function> callback with results cb(error, value)
 * @param httpObj <HTTP> Optional HTTP object for injection
 * @return nothing
 **/
function getPrice(symbol, cb, httpObj) {
    var http = httpObj || require('http')
        , options = {
            host: 'download.finance.yahoo.com'  // Thanks Yahoo!
            , path: '/d/quotes.csv?s=' + symbol + '&f=l1'
        }
    ;

    http.get(options, function(res) {
        res.on('data', function(d) {
            cb(null, d);
        });
    }).on('error', function(e) {
          cb(e.message);
    });
}
Given a stock ticker symbol and a callback, this function will fetch
the current price of the symbol. It follows the standard callback
convention of providing the error as the first callback argument, if there
was one. Also note that this function allows the http object to be injected to ease testing.
Doing this allows for looser coupling between this function and the
http object, greatly increasing
testability (you could also use Mockery for this; see Chapter 4). In a general production scenario, this value
defaults to the system-provided HTTP object while allowing for a stubbed
or mocked value for testing. Whenever a function has a tightly coupled
relationship with external objects it is usually worthwhile to allow for
injection of that object, for both testability and loose coupling.
We discussed dependency injection in detail in Chapter 2, and here is another example where dependency injection makes testing easier. Besides testability, what if the host providing the stock price service required HTTPS? Or even HTTPS for some symbols and HTTP for others? The flexibility provided by injection is almost always a good thing, and it’s easy to take advantage of it.
Writing a test for maximum code coverage is an almost trivial
process. First we stub out the http
object:
/**
 * A simple stub for HTTP object
 */
var events = require('events').EventEmitter
    , util = require('util')
    , myhttp = function() {  // Dummy up NodeJS's 'http' object
        var _this = this ;
        events.call(this);

        this.get = function(options, cb) {
            cb(_this);
            return _this;
        };
    }
    ;
util.inherits(myhttp, events);
It is important to realize that we are not testing the http module that is supplied by Node.js (nor do we want to). Yes, there may be bugs in it,
but our tests are not trying to find them. We only want to test the code
in this function, not any other external object, regardless of who wrote
it or where it came from. Integration tests will (hopefully) find any bugs
due to interactions between our code and its dependencies.
This stubbed-out http object will
make testing possible. Here is how we can use it using YUI Test’s asynchronous testing methods (I am omitting
the YUI Test boilerplate for clarity):
testPrice: function() {
    var symbol = 'YHOO'
        , stockPrice = 50  // Wishful thinking??
        , _this = this
        , http = new myhttp()
    ;
    getPrice(symbol, function(err, price) {
        _this.resume(function() {
            Y.Assert.areEqual(stockPrice, price, "Prices not equal!");
        }, http);  // Inject our 'http' object
    http.fire('data', stockPrice);  // Our mock data
    this.wait(1000);
}
This is a basic test for a successful case. To test an error case,
we just fire the error event on our
http object:
testPriceError: function() {
    var symbol = 'YHOO'
        , _this = this
        , http = new myhttp()
    ;
    getPrice(symbol, function(err, price) {
        _this.resume(function() {
            Y.Assert.areEqual(err, 'an error', "Did not get error!");
        }, http);
    http.fire('error', { message: 'an error'} );
    this.wait(1000);
}
With these two tests, code coverage data will show 100% code
coverage—awesome! This means there could not possibly be any more testing
to do and the getPrice function works
exactly as expected, right? Well, of course not. This is why large code
coverage percentages can be misleading. This function is not fully tested,
but coverage numbers indicate otherwise.
What is also interesting is the sheer amount of test code versus the
amount of code under test. We have written almost three times the amount
of code to test this function as the function itself contains—maybe more,
if we count the YUI Test boilerplate that is not included in these
listings. While we did achieve 100% code coverage, we can’t say with
confidence from just these tests that the getPrice function is 100% reliable. This is the
crux of a complaint sometimes made about unit testing: it hinders and
slows down development. Unfortunately, with time to market being so
important for web applications, unit testing—and testing in general—is
typically given short shrift. At best, unit tests are created later, after
the code has shipped; at worst, they are never created. This is
problematic, as testing after the fact is neither as helpful nor as
productive as testing while (or even before) developing the code. An ounce
of prevention is absolutely better than a pound of cure.
While large coverage percentages can be misleading, low coverage percentages are not. Even if most (or even all) lines are executed by a test or set of tests, this does not necessarily mean that all edge cases have been tested, or even that the general case has been tested. However, low code coverage percentages show clearly those lines that are not being exercised or tested at all. This is a very strong indication of what your testing resources should target next.
Code Coverage Data
Code coverage data typically comes in two pieces, line coverage and function coverage, both of which are most easily expressed as percentages. These numbers are easily understood for individual unit tests. When testing either an individual function or a method within an object, the total number of functions and lines in the file loaded serves as the denominator for the percentage calculation. So, if you spread your testing across multiple files for a single module, unit test coverage will be low for each individual test. Aggregation of all the coverage numbers from each individual test will give the complete coverage picture for that file.
Similarly, when trying to ascertain the total coverage percentages of your entire application (or even a single directory of files), your totals, by default, will not include any files for which there are no tests. Coverage metrics are completely blind to any files that do not have tests associated with them, so be careful with the “final” aggregated numbers.
To get the full picture of your test’s code coverage you must generate “dummy” or “empty” test files to account for files without any tests, and therefore without any coverage. We will investigate this technique later in this chapter.
A Hands-on Example
In this section, I will demonstrate coverage using YUI’s coverage
tools. Unzip the latest version and you’ll see that the java/build directory contains the two
necessary JAR files: yuitest-coverage.jar and yuitest-coverage-report.jar. Of course, you
will need a recent version of the Java runtime (1.5 or later) installed
somewhere convenient, such as in your PATH.
The first JAR is used to transform plain JavaScript files into instrumented files for code coverage, and the second generates reports from the extracted coverage information.
Instrumenting Files
Instrumenting a file is simple:
% java -jar yuitest-coverage.jar -o coveraged.js instrument-me.jsThe file coveraged.js is now
a fully working copy of instrument-me.js with embedded coverage
tracking. If you look at the file you will see how it was transformed:
interspersed between each statement is a new statement that increments a
counter belonging to a global variable that tracks whether the line was
executed. This instrumented file is a drop-in replacement for the
original file. After exercising the code, the counts can be extracted
from the global variable _yuitest_coverage.
Obtaining code coverage information from unit tests is a simple matter of instrumenting the code tested by the unit tests, running the tests, and then extracting the coverage information.
Extracting code coverage information from integration tests requires instrumenting all application
JavaScript files, deploying the bundle exactly as you would the regular
code, running your Selenium (or manual[9]) tests against the instrumented build, and then extracting
the coverage information. You can usually instrument all your code in
one shot by using a single find operation (this
must all be on one line, of course):
% find build_dir -name "*.js" -exec echo "Coveraging {}" \;
-exec java -jar yuitest-coverage.jar -o /tmp/o {} \;
-exec mv /tmp/o {} \;
Here we just start at the root of the deployment directory, find all JavaScript files, and replace them in place with their coveraged versions. We can then package and deploy the application as normal. However, as code coverage deals with lines of code, not statements, make sure you run the coverage tools on noncompressed JavaScript.
Anatomy of a Coveraged File
The YUI coverage tool takes a plain JavaScript file and morphs it into a
file that tracks which lines and functions are executed. To see this in
action, let’s revisit the sum
function:
function sum(a, b) {
    return a + b;
}
Converting this file to its coveraged version:
% java -jar yuitest_coverage sum.js -o sum_cover.jsyields a 37-line file! The first 18 lines are boilerplate defining global variables and functions that YUI Test Coverage uses to track its information, if they are not already defined. The remaining 19 lines are as follows:
_yuitest_coverage["sum.js"] = {
    lines: {},
    functions: {},
    coveredLines: 0,
    calledLines: 0,
    coveredFunctions: 0,
    calledFunctions: 0,
    path: "/home/trostler/sum.js",
    code: []
};
_yuitest_coverage["sum.js"].code=["function sum(a, b)
  {","    return a + b;","}"];
_yuitest_coverage["sum.js"].lines = {"1":0,"2":0};
_yuitest_coverage["sum.js"].functions = {"sum:1":0};
_yuitest_coverage["sum.js"].coveredLines = 2;
_yuitest_coverage["sum.js"].coveredFunctions = 1;
_yuitest_coverline("sum.js", 1); function sum(a, b) {
    _yuitest_coverfunc("sum.js", "sum", 1);
    _yuitest_coverline("sum.js", 2); return a + b;
}
The first block of lines defines the _yuitest_coverage["sum.js"] object, which will
hold the counts for line and function coverage as well as some other
bookkeeping.
Setup continues in the last block, which defines the line counts
(there are two countable lines in the file, line 1 and line 2, and one
function at line 1, called sum).
The actual counting of lines happens with each call to _yuitest_coverline or _yuitest_coverfunc. Those functions are
defined in the boilerplate, but all they do is increment the count for
either the function or the line number.
So, in this example, when this file is loaded _yuitest_coverline("sum.js", 1) is executed,
as every file has the first line executed. When the sum function is actually called _yuitest_coverfunc is executed first, meaning
that our sum function is called, then
_yuitest_coverline is executed,
incrementing this line’s count, and finally the actual return a+b is executed and we are done.
In this way, at the beginning of every file, between every statement, and at the beginning of every function, YUI Test Coverage is tracking the lines and functions executed.
It is important to note that each time this file is loaded the counts are reset. Caching may prevent this, but be aware that if a file is loaded multiple times, any previous coverage information will be lost. It is always best to extract the coverage results after each test is run.
Exercise/Deploy
Different strategies are required for generating coveraged versions of JavaScript files for client- versus server-side code. An HTTP server can dynamically serve coveraged versions of certain JavaScript files based on a query string or other method. Dynamically generating server-side coveraged versions of JavaScript files can be accomplished by spying on Node.js’s loader.
Client-Side JavaScript
For unit testing, the HTML glue file can now include the coveraged version
of the file to be tested instead of the regular version. There are
several strategies for doing this, and we will discuss a fully automated
method in Chapter 6.
The simplest method is to instrument all your code before you run your
unit tests. The HTML will pick up the instrumented version of your code
when running the test. A fancier way, if you are using Apache, is to
dynamically instrument the code based off a mod_rewrite rule. In
this scenario, you must tag which JavaScript files you want coverage
information for in the HTML file. Using a query string for this purpose
is most convenient:
<script src="/path/to/file/myModule.js?coverage=1"></script>
A matching mod_rewrite rule
will redirect requests of this type to a script that picks up the
original file, generates the coveraged version of it, and then returns
that instead of the plain version:
RewriteEngine On
RewriteCond %{QUERY_STRING} coverage=1
RewriteRule ^(.*)$ make_coverage.pl?file=%{DOCUMENT_ROOT}/$1 [L]
This will pass off any request for a file with a coverage=1 query string to a script that
returns the coveraged version of the requested file.
The script can be as simple as:
#!/usr/bin/perl
use CGI;
my $q    = CGI->new;
my $file = $q->param('file');
system("java -jar /path/to/yuitest_coverage.jar -o /tmp/$$.js $file");
print $q->header('application/JavaScript');
open(C, "/tmp/$$.js");
print <C>;
There is no need to instrument the test code itself; the only code you should be instrumenting is the JavaScript actually being tested. If your module has external dependencies that also must be included to run your tests, you may be tempted to instrument those as well in order to see the connectedness of your code. However, I advise against this. You presumably also have unit tests for the dependencies, and further, any code your tests cover in an external module does not count as being “covered,” as the tests for this module are not intended to test that other module. Unit testing is all about isolation, not seeing what other modules your module may use.
In fact, in an ideal world, no external dependencies should even be loaded to test a single module; they should be stubbed or mocked out from your test code. Few things are worse than having to debug another module beyond the one you are currently trying to test. Isolation is key.
As for deploying coveraged code for integration/Selenium-type testing, the setup could not be simpler. Here, all code must be instrumented and then deployed as usual. Note that instrumented code will run more slowly because it has double the number of statements, so do not performance-test against a coveraged deployment!
Once you have deployed the code, run your tests, but note that coverage information is not persisted across reloads. If you reload the browser between every test, or if you jump to another page, you will need to extract and persist the coverage information before moving on.
Fortunately, Selenium makes this easy, as each test case or suite
has a tearDown function
within which you can accomplish this.
Also, a deployed instrumented build is fun for manual testing.
Load the page in your browser and click around; when you’re finished you
can dump the coverage information to the console (view the _yuitest_coverage global variable) and cut and
paste that into a file for transformation into HTML. You can now see
exactly what code was exercised during your random clicking.
It is important to note that you are not actually “testing” anything when you manually click around a coveraged build. You are merely satisfying your curiosity about what code is executed when you click around.
Server-Side JavaScript
Mucking about with the Node.js loader is a not-too-hideous way to dynamically inject coveraged versions of JavaScript under test into the mix. If this proves too scary (it involves overriding a private method), fear not, as there is another option.
The scary but more transparent technique is to override Node.js’s Module_load
method. Yes, this is an internal method that can change at any moment,
and all will be lost, but until then, this method is very
transparent.
Here is the basic code:
var Module = require('module')
    , path = require('path')
    , originalLoader = Module._load
    , coverageBase = '/tmp'
    , COVERAGE_ME = []
;

Module._load = coverageLoader;

// Figure out what files to generate code coverage for
//       & put into COVERAGE_ME
// And run those JS files thru yuitest-coverage.jar
//     and dump the output into coverageBase

// Then execute tests
//    All calls to 'require' will filter thru this:
function coverageLoader(request, parent, isMain) {
    if (COVERAGE_ME[request]) {
        request = PATH.join(coverageBase, path.basename(request));
    }

    return originalLoader(request, parent, isMain);
}

// At the end dump the global _yuitest_coverage variable
First we determine which JavaScript files we want to have code coverage associated with, and generate the coveraged versions of those files—this will drop them all into the /tmp directory without any other path information.
Now we execute our tests using whatever framework we like. While
our tests execute, their calls to require will
filter through the coverageLoader
function. If it is a file we want code coverage information for, we
return the coveraged version; otherwise, we delegate back to the regular
Node.js loader to work its magic and load the requested module
normally.
When all the tests are finished, the global _yuitest_coverage variable will be available
to be persisted, and will be converted to LCOV format and optionally
HTML-ized.
In the preceding code, the client-side JavaScript told the HTTP
server to generate coverage information for it using a query
parameter—but what about for server-side JavaScript? For this, I like to
add an extra parameter to the require
call. Like the query string for the client-side JavaScript, the extra
parameter to require is transparent.
This may be overkill, so another option is to regex-match the required file, if it exists in your local
development area (as opposed to native, external, third-party modules
that return a coveraged version).
Note that all of this requires two passes: the first pass
determines which files need code coverage generated for them, and the
second pass actually runs the tests, dynamically intercepts the require’s calls, and potentially returns
coveraged versions of the requested files. This occurs because the
yuitest_coverage code requires
spawning an asynchronous external process to create the coveraged files,
yet the require call is synchronous.
It’s not a deal-breaker, but it is something to be aware of. If Node.js
ever releases a synchronous spawning method, or if a pure synchronous
JavaScript coverage generator becomes available, the coveraged versions
of the files could be generated in the overridden _load method.
So, how does adding an extra parameter to require to request code coverage work? For
starters, your test code looks like this:
my moduleToTest = require('./src/testMe', true);This statement in your test file that requires the module you are
testing simply adds a second parameter (true) to the require call. Node.js ignores this unexpected
parameter. A simple regex will catch this:
/require\s*\(\s*['"]([^'"]+)['"]\s*,\s*true\s*\)/g
It looks nastier than it is. The idea is to suck in the source of
your test JavaScript file and run this regex on it, which will capture
all instances of modules required with the extra true parameter. You are free to get crazier
using an abstract syntax tree walker (using a tree generated by JSLint
or Uglify.js) or a JavaScript parser, but in practice this regex has
been 100% solid (If you have a require statement that breaks it, let me know
how ugly it is!).
Once you have collected the list of modules for which you want to generate code coverage metrics, the following code will generate the coveraged versions of them:
var tempFile = PATH.join(coverageBase, PATH.basename(file));
    , realFile = require.resolve(file)
;

exec('java -jar ' + coverageJar + " -o " + tempFile + " " + realFile
  , function(err) {
    COVERAGE_ME[file] = 1;
});
This code is looped over the results of the regular expression,
asking Node.js where the file exists and then running that through the
YUI code coverage tool and stashing the result where coverageLoader can find it later when the file
under test is required.
The last bit is to run the tests and then persist the coverage
results. The _yuitest_coverage
variable is a JavaScript object that needs to be converted to JSON and
persisted. Finally, it can be converted to LCOV format and pretty HTML
can be generated, and you are done:
var coverOutFile = 'cover.json';
fs.writeFileSync(coverOutFile, JSON.stringify(_yuitest_coverage));
exec([ 'java', '-jar', coverageReportJar, '--format', 'lcov', '-o'
  , dirname, coverOutFile ].join(' '), function(err, stdout, stderr) {
    ...
});
Earlier, I alluded to another way to get coverage information
using Node.js. Of course, there are probably several ways, many that I
have never imagined, but the one I alluded to utilizes suffixes. The
Node.js loader by default knows about three kinds of file
extensions—.js, .json, and .node—and deals with them accordingly. When
the Node.js loader is searching for a file to load, if no extension is
provided the loader will tack on these extensions to continue its
search. Due to the synchronous nature of the loader, we unfortunately
cannot dynamically generate the coverage information at load time, so we
still need the require(' trick to determine which files need code coverage and
pregenerate them.module',
true)
Also, this method, unlike using the second parameter to require, forces us to load a specific
coveraged version of the file under test. In this instance, we could
just use the full path to a coveraged version of the file instead, but
using the extension is cleaner. We also must be sure to dump the
generated coveraged file into the same directory as the original and
give it our new extension so that the original loader will load it for
us.
Let’s take a look in our test file:
require('./src/myModule.cover');This will load the coveraged version of the file. Our regex changes to match this:
/require\s*\(\s*['"]([^'"]+)\.cover['"]\)/g
When we generated the coveraged version of the file, instead of
dumping it into coverageBase
(/tmp, typically) we just put it
right next to the original file, but we ensured that it has a .cover extension:
var realFile = require.resolve(file)
    , coverFile = realFile.replace('.js', '.cover');
;
exec('java -jar ' + coverageJar + " -o " + coverFile + " " + realFile,
  function(err) {});
We no longer need to keep track of which files are covered, as the loader will do the right thing due to the .cover extension.
Finally, we just tell the loader what to do when it encounters a file with a .cover extension:
require.extensions['.cover'] = require.extensions['.js'];
Conveniently, this is exactly what the loader should do with files with a .js extension.
There are several ways to generate code coverage information for your server-side JavaScript. Pick the one that works best for you. And fear not: if the steps covered here are too terrible to contemplate, Chapter 8 will provide a fully automated solution for dynamically incorporating code coverage generation and reporting without all the fuss.
Persisting Coverage Information
Persisting coverage information means taking it from the browser’s memory and saving it locally to disk. “Locally” is where the web server that is serving the test files is running. Each page refresh will clear out any coverage information for the JavaScript loaded on the page, so before a page refresh, coverage information must be stored on disk somewhere or it will be lost forever.
Unit Tests
This is all fun and games until you are able to persist coverage information
locally. For unit testing, persisting coverage information, presents the
exact same problem as persisting unit test results—namely, POST-ing or Ajax-ing the data back to the
server for persistence. Normally you can run unit tests without a web
server: simply load the HTML glue file into your browser and your tests
will run. However, to persist test results and coverage information you
will need the help of a web server.
YUI Test provides helper hooks to get this information in various formats:
var TestRunner = Y.Test.Runner;
TestRunner.subscribe(TestRunner.TEST_SUITE_COMPLETE_EVENT, getResults);
TestRunner.run();

function getResults(data) {
  var reporter = new Y.Test.Reporter(
    "http://www.yourserver.com/path/to/target",
    Y.Test.Format.JUnitXML);
  reporter.report(results);
}
Use this snippet at the bottom of each of your test suites, and unit test reports will be sent to your server in JUnit XML format, which is recognized by Hudson/Jenkins and many other build tools. YUI also provides output in XML, JSON, and TAP formats. The XML and JSON formats you will have to deal with yourself, but the TAP format, from the Perl world, is also recognized by a host of tools.
When passing the test results back you can also piggyback the coverage results:
function getResults(data) {
      // Use JUnitXML format for unit test results
      var reporter = new Y.Test.Reporter(
        "http://www.yourserver.com/path/to/target",
        Y.Test.Format.JUnitXML);
      // Toss in coverage results
      reporter.addField("coverageResults",
        Y.Test.Runner.getCoverage(Y.Coverage.Format.JSON));
      // Ship it
      reporter.report(results);
}
The addField method on the
reporter object allows you to pass
back arbitrary data to the server. In this case we are grabbing the
coverage results, encoding them as JSON, and passing them back along
with the unit test results. Note that JSON is the only sane output for
coverage information; it is the format the YUI coverage reporting tool
expects.
The end result of this is a POST to our server with results and coverageResults parameters. These two chunks
of data can now be persisted to the local filesystem.
Integration Tests
Persisting coverage information from integration tests using Selenium follows
a similar pattern. After running the Selenium test(s) but before
navigating away from the current page, you must grab the coverage
information and pass it back to the server. Selenium provides tearDown and after hooks where this code should be placed
to ensure that it is captured.
This is best done in Selenium using the global variable _yuitest_coverage, where all the coverage
information is kept. Using Selenium1, the code looks like this:
String coverage = selenium.getEval(
  "JSON.stringify(window._yuitest_coverage)");
Using Selenium2/WebDriver, the code is as follows:
String coverage = (String)((JavaScriptExecutor) driver)
  .executeScript("return JSON.stringify(window._yuitest_coverage);");
Then simply dump the coverage
string out to a file, ideally named after your test, such as testClick.coverage.json.
Keep in mind that if your application incorporates iframes,
coverage information from code in the iframe will not be gathered from
the top-level _yuitest_coverage
variable. After grabbing the code coverage from the top-level main
window, you will need to tell Selenium1 to use it like so:
selenium.SelectFrame("src=foo.html");Use this code if you are using Selenium2/WebDriver:
driver.SwitchTo().Frame(driver.FindElement(By.CssSelector(
  "iframe[src=\"foo.html\"]")));
With this code you can grab the contents of the _yuitest_coverage variable. Of course, you can
use any Selenium selector to pick the iframe that you want to extract
code coverage from.
Be sure to aggregate the _yuitest_coverage data from each iframe into
the total coverage report. We will examine how to do that in depth in
the Aggregation section.
Generating Output
While the JUnit XML format is understood by most if not all build tools, the YUI JSON coverage format is not. Fortunately, it is a simple step to convert the YUI JSON coverage output to the industry- and open source standard LCOV format (all on one line):
% java -jar yuitest-coverage-report.jar --format LCOV
-o <output_directory> coverage.json
In the preceding code, coverage.json is the JSON file dumped from the
coverageResults POST parameter (or
grabbed directly from _yuitest_coverage
for integration tests). Now in <output_directory>lcov and genhtml (which is distributed along with LCOV)
commands. Hudson/Jenkins will accept this file format natively and generate the
pretty HTML coverage automatically, or you can roll your own HTML using
the genhtml command. Information on
lcov, genhtml, and friends is available here. Sample genhtml output is available here. Very snazzy! You can see line by
line which lines and functions were covered and which were not (and how
many times each line was executed).
Figure 5-1 shows what some sample output looks like.
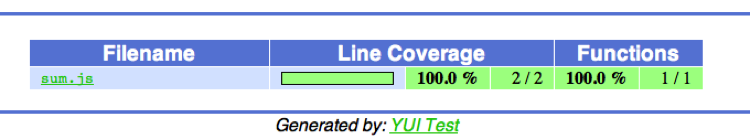
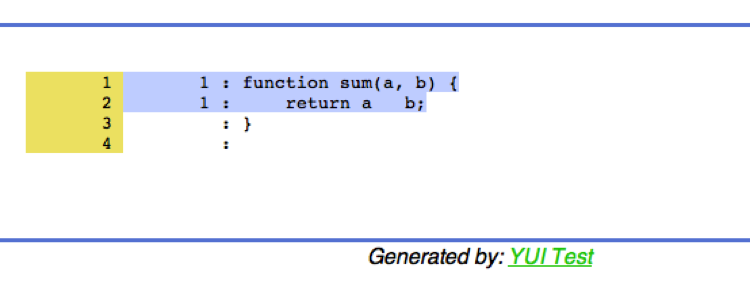
Figure 5-2 shows the file
containing our sum function. Two out of
two lines were covered and one out of one function was reached.
Although it’s not terribly exciting, we can see that each line was executed once, giving us 100% code coverage. It’s great motivation watching the graph and code coverage counts increase while developing code!
The genhtml command accepts
many options to customize the HTML output, if you are the tinkering kind
who just is not happy with the look of the default output.
Aggregation
For both the unit test and integration test pieces we were able to persist coverage
information for individual tests or suites, but how can we see the whole
picture? For this, the lcov command
comes to the rescue!
The lcov -a command aggregates multiple LCOV files into one large file. So, a
command like this:
% lcov -a test.lcov -a test1.lcov -a test2.lcov ... -o total.lcovwill merge together the set of LCOV files. This can be used to merge all unit tests as well as all integration tests together.
In order to be merged, all LCOV files must share the same root directory. This is not a problem when merging all unit test coverage results or all integration test coverage results independently of each other, but when trying to merge unit and integration tests this can become an issue.
Looking at the format of LCOV files, the first line of each new file
coverage section begins with the full path to that source file (a
JavaScript one, in our case). If the two roots do not match, lcov will not be able to merge them.
We need a simple shell script to ensure that the roots are the same (also, the machine where the merge is happening must have the source tree rooted at that location). Most likely, one of the sets of roots will be correct and the other will be wrong. Since LCOV files are just plain tests, it’s simply a matter of rerooting the incorrect LCOV file to match where the source code actually resides.
If your source code on the box where you want to generate the coverage HTML is rooted at /a/b/c but the LCOV file from the integration tests has the source rooted at /d/e/f, write a script in your favorite language to convert /d/e/f to /a/b/c. In Perl the script looks like this:
my $old = '/a/b/c';
my $new = '/d/e/f';
open(F, "wrong.lcov");
open(G, ">right.lcov");
while(<F>) {
    s#^$old#$new#;
    print G;
}
close(G);
close(F);
In the preceding code, wrong.lcov is converted to be merged with another LCOV file rooted at /d/e/f. Once you have a total LCOV file you are happy with, generating pretty HTML is easy:
% genhtml -o /path/to/docRoot/coverage total.lcovNow point your browser to /coverage on that host and watch your coverage numbers grow!
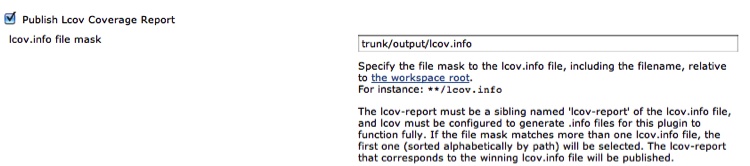
The generated output—either a single or an aggregated LCOV-formatted file—can then be easily fed into an automated build tool such as Hudson/Jenkins. Conveniently, older versions of Hudson natively understand LCOV-formatted files and only need a pointer to the aggregated file to be included in the build output. Figure 5-3 shows how this is configured.
Hudson handles the HTML-izing and persisting of coverage data across builds to easily track your code coverage over time. On the front page of your Hudson build you will now have the button shown in Figure 5-4.
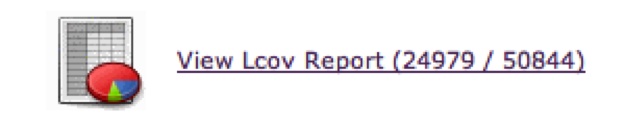
When this button is clicked, the Hudson build will show the coverage tables. According to the figure, 24,979 out of 50,844 lines were covered.
More recent versions of Jenkins do not have this functionality. We will investigate what to do about that in Chapter 8.
Hidden Files
What about files that do not have any code coverage data? These files are hidden from the total report and are not accounted for. What we need are “dummy” empty LCOV files for these modules so that they can be aggregated with the rest of the LCOV files to give a clearer picture of our test coverage.
The simplest method to account for these otherwise hidden files is to ensure that all of your application files have at least one empty test for them. Then run the empty test against the coveraged version of the file to generate the (0%) LCOV output. You can now persist and process this LCOV data as you normally would, and all your code will be accounted for in the aggregated coverage rollup.
Here is the HTML of an empty test of the kind that all application files must have. Once you are ready to write tests for this code, you can remove this HTML glue and replace it with the actual tests:
<html lang="en">
<body class="yui3-skin-sam">
    <div id="log"></div>
    <h3>Running dummy unit test for APP_FILE</h3>
    <script src="http://yui.yahooapis.com/3.4.0/build/yui/yui.js">
     </script>
    <script src="/path/to/coveraged/file/without/tests.js"></script>
    <script>
        YUI().use('test',  function(Y) {
            Y.Test.Runner.add(
                new Y.Test.Suite('no test').add(
                    new Y.Test.Case({
                        name: 'dummy_NOTESTS'
                        , 'testFile': function() {
                            Y.Assert.areEqual(true, true);
                        }
                    })
                )
            );
            Y.TestRunner.go();
        });
    </script>
</body>
</html>
This empty test is enough to load up the coveraged version of the file and have the empty coverage information be persisted along with all the nondummy coverage numbers, and be included in the aggregated rollup.
When looking at the total report, it will be quite obvious which files do not have any tests covering them.
In larger environments, these dummy test files should be autogenerated by comparing what the HTML glue code includes with all the code in your application and determining where the gaps are. The autogenerated version of this file will be created dynamically and be included in your test runs.
A nice way to accomplish this is to iterate through all your test HTML files and look to see what JavaScript files are being loaded, then compare that list with the list of all the JavaScript files in your project.
Let’s look at a quick Perl script that does just that. This script is called like so (all on one line):
% perl find_no_unit_tests.pl --test_dir test --src_dir dir1
--src_dir dir2 ... --src_base /homes/trostler/mycoolapp
The idea is to pass in the root of where all your tests live (in
this case, in a directory called test) and a list of source directories from
which to pull JavaScript files. The src_base option is the root directory of your
project. This script will create a list of all your JavaScript source
files and a list of all JavaScript files included by your tests, and then
output the difference between those two sets:
#!/usr/local/bin/perl

use Getopt::Long;
use File::Find;
use File::Basename;

my($debug, $test_dir, @src_dir, $src_base);
my $src_key = 'src';   // root of source tree
GetOptions (
    "test_dir=s" => \$test_dir,
    "src_dir=s"  => \@src_dir,
    "src_base=s" => \$src_base,
) || die "Bad Options!\n";;

my $src_files = {};

find(\&all_src_files, @src_dir);
find(\&all_tested_files, $test_dir);
We ingest the command-line options, traverse all the source directories, and pull out the names of all the JavaScript files:
 sub all_src_files {
    return unless (/\.js$/);
    foreach my $src_dir (@src_dir) {
        $File::Find::name =~ s/^\Q$src_base\E//;
    }
    $src_files->{$File::Find::name}++;
}
The %src_files hash now contains
all your JavaScript source files. Here is the code to blow through the
test files:
sub all_tested_files {
    return unless (/\.html?$/);

    open(F, $_) || die "Can't open $_: $!\n";
    while(my $line = <F>) {
        if ($line =~ /["']([^"]+?\/($src_key\/[^"]+?\.js))["']/) {
            my($full_file_path) = $2;
            print "Test file $File::Find::name is coveraging
              $full_file_path\n" if ($debug);
            delete $src_files->{$full_file_path};
        }.
    }
}
The nastiest thing here, by far, is the regex looking for script tags of the form:
<script src="/path/to/JS/file"></script>
Once a filename is pulled that file is deleted from the %src_files hash, which marks it as
“covered.”
The %src_files hash contains only
JavaScript files without unit tests. Now it is simple to use your favorite
templating system to generate an empty unit test for each of these files.
You can save these empty tests somewhere in your test directory tree to be run later by your
automated unit test running tool (we will investigate one such tool in
Chapter 8), so now your entire project’s code
coverage will be accounted for regardless of whether a file has unit tests
associated with it or not.
When these empty tests are run the code coverage for these files will stick out like a sore thumb (hopefully), as the coverage will be very close to 0% (it probably will not be exactly 0%, as any code not nested in a function will get executed by just loading the file itself).
Coverage Goals
Typically, unit test coverage goals are different from integration coverage goals. Since integration tests cover larger swaths of code, it is harder to determine the correlation between what has been covered and what has been tested. Unlike unit tests, which are tightly focused on a particular piece of code such as a function or a small piece of functionality, feature tests cover significantly more lines. This is a manifestation of the exact same problem seen with code coverage and unit tests: just because a line of code is executed by a test does not mean that code is “tested.”
Therefore, the already tenuous connection between a line of code being executed and a line of code being tested for unit tests is even more pronounced for integration tests and code coverage tests. After all, the desired result of testing is not “code coverage,” it is correct code.
Of course, to have any confidence that your code is correct, the code must be executed during a test and must perform as expected. Simply executing a line of code from a test is not sufficient, but it is necessary.
So, where does that leave code coverage?
The sane consensus, which I also advocate, is to strive for unit test code coverage results of approximately 80% line coverage. Function coverage is not important for unit-testing purposes, as ideally, your unit tests are only testing one function or method (other than to know which functions have any tests associated with them). Other code, especially initialization code when unit-testing methods, gets covered incidentally. Your unit tests should cover at least 80% of the function under test. But be careful how you achieve that level of coverage, as that number is not the real goal. The true goal is good tests that exercise the code in expected and unexpected ways. Code coverage metrics should be the by-product of good tests, not the other way around! It is easy, but useless, to write tests just to obtain larger coverage. Fortunately, professional developers would never do that.
As for integration tests, which test at the feature level, code coverage metrics are relatively useless by themselves. It is instructive to see and understand all the code that is necessary for a feature. Typically you will be surprised by what code is being executed or not—and initially, that is interesting information to have. But over time, code coverage metrics for feature testing are not too meaningful. However, aggregated coverage information about all feature testing is very useful. In fact, the aggregated coverage metrics for any and all kinds of testing, including performance, integration, and acceptance testing, are very nice numbers to have to check the thoroughness of your testing.
What percentage of code is executed by your acceptance tests? Your integration tests? Your performance tests? These are good numbers to know. Interestingly, there is no standard, as with unit test line coverage, to shoot for. These are numbers that should increase over time, so you should start by aiming for the most common code paths. Concentrate your feature tests on the most-used features. Clearly, you want higher coverage there first. Between unit testing and feature testing, line coverage should approach 100%, but remember that code coverage metrics are not the ultimate goal of your testing. Exercising your code under many different conditions is. Do not put the cart before the horse.
Recap
Generating and viewing code coverage information is crucial for unit testing and important for aggregated integration testing. While code coverage numbers do not tell the whole tale, code coverage information does provide a nice single number to use to track the progress of your tests.
Large percentages can be misleading, but small percentages are not. You, your boss, and anyone else can clearly see at a glance how much code is covered by tests, whether unit tests or otherwise. Small line coverage percentages provide obvious signposts for where to focus future testing efforts.
It is relatively straightforward to capture code coverage results from both unit and integration tests and merge them into a single report. This provides a handy metric for tracking test progress. In Chapter 8 we will discuss how to automate this process even further using the open source JavaScript Unit Test Environment.
Along with static code analysis, tracking the code coverage of your tests gives you another metric to analyze your code. No number can give a complete picture of your code or your tests, good or bad, but gathering and tracking these numbers over time provides insight into how your code is evolving.
Reaching code coverage goals must be a by-product of good testing, not the goal itself. Do not lose track of why you are writing all these tests: to ensure that your code is correct and robust.