Table of Contents for
Testable JavaScript
 Testable JavaScript
Published by
O'Reilly Media, Inc., 2013
Testable JavaScript
Published by
O'Reilly Media, Inc., 2013
Chapter 6. Integration, Performance, and Load Testing
In addition to unit testing, it is also important for you to conduct integration, performance, and load testing on your applications. Writing integration tests that run either against “real” browsers or headlessly in an automated build environment is surprisingly simple. As is true of most things, once the boilerplate code and configuration are in place, it’s easy to add tests. For the tests we conduct in this chapter, we will generate a standard waterfall graph of web application load times. Generating and integrating a waterfall graph is also surprisingly simple!
Integration Testing
Conducting an integration test on a web application requires running your application in a browser and ensuring that its functionality works as expected. Testing pieces in isolation through unit testing is a nice start, but you must follow this up with integration testing. Integration testing tests how your code fits together in the larger scheme of things. There is no mocking or stubbing out of dependencies at this level; you are testing at the application level.
Selenium
Testing JavaScript in a browser typically involves Selenium. Testing with Selenium usually requires a chunk of Java code running on the same box as the browsers you want to spawn to run your tests, and a client-side API for controlling the remote browser. Selenium2/WebDriver can control Firefox, Chrome, and Internet Explorer for Mac OS X and Windows.
You can write Selenium tests in a variety of languages, or you can use a Firefox plug-in that will generate your tests in various languages by following your mouse movements and keystrokes. Selenium also provides a set of assertion and verification functions that test the current page to ensure the current state is valid.
Using the Selenium IDE is the quickest way to get something to play with. While in any version of Firefox, go to the SeleniumHQ site and get the latest version of the IDE (1.10.0 as of this writing), and let Firefox install the add-on.
Now load your website and open the Selenium IDE (Tools→Selenium IDE). Set the Base URL to the URL of the page where your web application resides. Click on the record button on the upper right of the Selenium IDE and Selenium will start tracking your mouse and keyboard movements as you click and type around your application. Click the record button again to stop recording.
Select File→Export Test Case As and you can save your clicking and typing in a variety of languages for Selenium2/WebDriver, or for original Selenium (Remote Control), which you should not use if you’re new to Selenium.
You can rerun these tests from within the Selenium IDE by clicking the green play button. The log at the bottom of the Selenium IDE window will let you know what is going on.
A common problem with Selenium is that it uses element IDs by default to identify the elements you are interacting with, and using a JavaScript framework that dynamically generates IDs will cause your test to fail, as the elements with these dynamic IDs will not be found during subsequent runs. Fortunately, the Target text field in the Selenium IDE lets you remedy this situation by using XPath or CSS expressions to locate elements, instead of the IDs used by default (of course, if you are setting element IDs yourself you will not have this problem). Click the find button next to the Target text field to locate elements you want to target when changing selectors.
You can also run saved test cases from the command line using JUnit. Export your test case as a JUnit 4 (WebDriver Backend) file and name it something interesting. The IDE will put the following declaration at the top of your file:
package com.example.tests;
Change the declaration to match your environment, or just delete that line.
Now you’ll need both the current version of the Selenium server and the client drivers. From the SeleniumHQ site, download the current version of the Selenium server (version 2.28 as of this writing) and the Java Selenium client driver (version 2.28.0 as of this writing). You will need to unzip the Java Selenium client.
To compile your exported Selenium script you need the selenium-server JAR:
% java -cp path/to/selenium-server-standalone-2.28.0.jar test.javaThis will compile your exported Selenium test case. To execute the test you need to start the Selenium server, like so:
% java -jar path/to/selenium-server-standalone-2.28.0.jarAnd now you can run your JUnit test case (all on one line):
% java -cp path/to/selenium-server-standalone-2.28.0.jar:Downloads/selenium-2.20.0/libs/junit-dep-4.10.jar:. org.junit.runner.JUnitCore test
You need the path to the Selenium server JAR and the JUnit JAR (which is supplied by the Java
Selenium client code if you do not already have it somewhere). The
preceding code assumes you deleted the package declaration. If not, you need
something like this (again, all on one line):
% java -cp selenium-server-standalone-2.28.0.jar:selenium-2.20.0/libs/junit-dep-4.10.jar:. org.junit.runner.JUnitCore com.example.tests.test
The compiled Java program must reside in com/example/tests for the Java interpreter to find it (or you can change the class path).
Using the Selenium IDE is clunky; you are better served by handwriting the test cases yourself (you can use JUnit for this). But note that this becomes an exercise in learning XPath or CSS selectors and/or using ID attributes judiciously throughout your HTML so that Selenium can “grab” them and manipulate your application: clicking links and buttons, dragging and dropping, editing form elements, and so on.
You can use either the assert or the verify family of Selenium functions to verify
your application’s functionality. Note that the assert family of functions will fail the test
immediately and skip to the next test function, while the verify family of functions will fail the
assertion but continue running further code within the test function.
You should almost always use the assert family of functions in your Selenium
tests.
Fortunately, there are JavaScript bindings for Selenium (both Remote Control and WebDriver) by way of npm packages for NodeJS, so we can write Selenium integration tests using our beloved JavaScript.
WebDriver
Using the webdriverjs npm module to drive Selenium2 is straightforward:
var webdriverjs = require("webdriverjs")
    , browser = webdriverjs.remote({
        host: 'localhost'
        , port: 4444
        , desiredCapabilities: { browserName: 'firefox' }
    })
;

browser
    .testMode()
    .init()
    .url("http://search.yahoo.com")
    .setValue("#yschsp", "JavaScript")
    .submitForm("#sf")
    .tests.visible('#resultCount', true, 'Got result count')
    .end();
With the Selenium server started locally, the preceding code
will start a Firefox browser, search for “JavaScript” at the Yahoo! search page, and ensure
that an element whose id is
resultCount is visible.
Generating a screenshot is equally easy. Simply add the saveScreenshot call:
var webdriverjs = require("webdriverjs")
, browser = webdriverjs.remote({
host: 'localhost'
, port: 4444
, desiredCapabilities: { browserName: 'firefox' }
})
;
browser
.testMode()
.init()
.url("http://search.yahoo.com")
.setValue("#yschsp", "javascript")
.submitForm("#sf")
.tests.visible('#resultCount', true, 'Got result count')
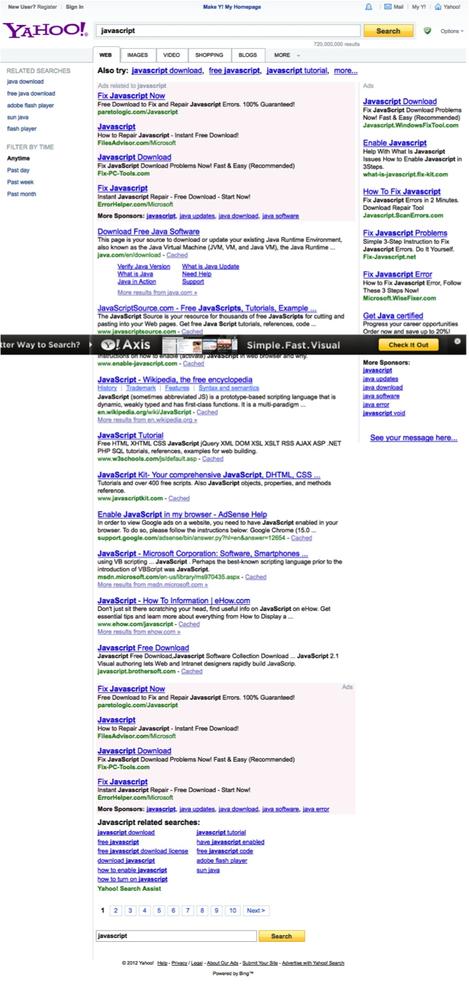
.saveScreenshot('results.png')
.end();And now you have a beautiful screenshot, as shown in Figure 6-1. Note that although the Yahoo! Axis ad appears in the middle of Figure 6-1, it is actually positioned at the bottom of the visible page. But since Selenium is taking a snapshot of the entire page, it appears in the middle. When you view this page in a browser, the ad appears at the bottom of the visible area.
To run this example in Chrome, you need to download the Chrome driver for your operating
system and install it somewhere in your PATH. Then you
simply change this line:
, desiredCapabilities: { browserName: 'firefox' }to this:
, desiredCapabilities: { browserName: 'chrome' }and your tests will run in Google Chrome.
How about Internet Explorer? You can download the latest IE
driver for your platform from the code.google selenium site. Then put
the executable in your PATH and
fire it up. It starts up on port 5555 by default:
, port: 5555
, desiredCapabilities: { browserName: 'internetExplorer' }
Remote Control
A nice npm module for Selenium Remote Control (Selenium1) is soda. Here is the same example as before, this time running against Safari using the soda module:
var soda = require('soda')
    , browser = soda.createClient({
        url: 'http://search.yahoo.com'
        , host: 'localhost'
        , browser: 'safari'
    })
;

browser
    .chain
    .session()
    .open('/')
    .type('yschsp', 'JavaScript')
    .submit('sf')
    .waitForPageToLoad(5000)
    .assertElementPresent('resultCount')
    .end(function(err) {
        browser.testComplete(function() {
            if (err) {
                console.log('Test failures: ' + err);
            } else {
                console.log('success!');
            }
        })
    });
The soda module chains Selenium commands (“Selenese”) similarly to the webdriverjs module, but instead of WebDriver commands, you now use the Selenium1 commands. The main difference is that Selenium1 supports a wider range of browsers because it is all just JavaScript running in each browser, whereas WebDrivers are external processes that allow more control over the browsers than Selenium1 does. Note that the standalone Selenium server JAR understands both Selenium1 and Selenium2 commands, so that part does not change. Only the client-side commands change.
Grid
Selenium also supports a “grid” configuration comprising one central “hub” and many distributed “spokes” that actually spawn browsers and feed commands to them. This is great for parallel processing of Selenium jobs or for acting as a central repository for Selenium runners that provide developer and QA access to Selenium without requiring each person to run and maintain his own Selenium instance.
Each spoke connects to the central hub with the browser(s) it can spawn, and the hub hands Selenium jobs to a spoke when a matching capability list comes in. A single hub can service Mac, Windows, and Linux clients running different browsers.
Conveniently, the latest version of the Selenium standalone server supports both WebDriver and Remote Control for grids. To start a grid hub, simply use this command:
% java -jar selenium-server-standalone-2.28.0.jar -role hubOnce the hub is started, start up the nodes that connect to the hub and spawn browsers using the following code (all on one line)—the nodes can run on the same host as the hub, or on a remote host:
% java -jar selenium-server-standalone-2.28.0.jar
-role node -hub http://localhost:4444/grid/register
This node assumes the hub is running on port 4444 (the default) and on the same machine as the node.
The best part about this setup is that your client-side code
does not change! Using webdriverjs you can take advantage of the extra
nodes for parallelization; whereas a single standalone server can
handle one request at a time, each node can handle multiple requests
simultaneously. Pointing a browser to
http://localhost:4444/grid/console (on the host
where the hub is running) will provide a nice visual of the number of
nodes connected to the hub and the number of jobs they can each handle
in parallel. The older Selenium1 Remote Control−backed grids could
only handle one Selenium job per node. The newer WebDriver-based grids
can handle several. Five is the default, but you can change this using
the -maxSession
<num> command-line switch for each
node.
You can now batter the Selenium hub with nodes and jobs to support all your testing, regardless of the language the tests are written in and which browsers you want to test on (which, I hope, is all of them).
CasperJS
Selenium is not the only browser integration-testing framework around. Built on top of PhantomJS, CasperJS provides similar functionality as Selenium but in a completely headless environment. Using pure JavaScript or CoffeeScript, you can script interactions with your web application and test the results, including screenshots, without any Java. When using CasperJS with the latest version of PhantomJS (1.7.0 as of this writing) you no longer need X11 or Xvfb running to start up the PhantomJS WebKit browser, as PhantomJS is now built on the Lighthouse Qt 4.8.0 device-independent display framework. This means truly headless integration testing is now possible on your servers.
To use CasperJS, first you must install the latest version of PhantomJS from the code.google phantomjs site. Downloading the binary version for your operating system is easiest, but building from source is not much more difficult (unless you have an older version of Linux; I had to make some changes when compiling for Red Hat Enterprise 4/CentOS 4, due to my lack of Thread Local Storage, and to remove some SSE optimizations).
Now grab the latest version of CasperJS; 1.0.0-RC6 as of this writing.
Here is the CasperJS version of the earlier Yahoo! search test:
var casper = require('casper').create();

casper.start('http://search.yahoo.com/', function() {
    this.fill('form#sf', { "p": 'JavaScript' }, false);
    this.click('#yschbt');
});

casper.then(function() {
    this.test.assertExists('#resultCount', 'Got result count');
});

casper.run(function() {
   this.exit();
});
Here’s how to run this CasperJS script:
% bin/casperjs yahooSearch.js
PASS Got result count
%
Sweet, that was easy enough. And it is significantly quicker than connecting to a possibly remote Selenium server and having it spawn and then kill a browser. This is running in a real WebKit browser, but note that the version of WebKit that Apple uses in Safari and the version of WebKit that Google uses in Chrome are different from what is running here with PhantomJS.
How about a screenshot?
var casper = require('casper').create();

casper.start('http://search.yahoo.com/', function() {
    this.fill('form#sf', { "p": 'JavaScript' }, false);
    this.click('#yschbt');
});

casper.then(function() {

    this.capture('results.png', {
        top: 0,
        left: 0,
        width: 1024,
        height: 768
    });

    this.test.assertExists('#resultCount', 'Got result count');
});

casper.run(function() {
   this.exit();
});
The capture code can also capture a given CSS selector instead of the entire page; see Figure 6-2.

This looks very similar to the Firefox screenshot captured by Selenium! The biggest difference between the two concerns specifying the exact size of the screenshot you want; CasperJS does not capture the entire browser area, whereas Selenium does.
CasperJS has other tricks up its sleeve, including automatic export of test results to a JUnit XML-formatted file. Here is the full script:
var casper = require('casper').create();

casper.start('http://search.yahoo.com/', function() {
    this.fill('form#sf', { "p": 'JavaScript' }, false);
    this.click('#yschbt');
});

casper.then(function() {
    this.capture('results.png', {
        top: 0,
        left: 0,
        width: 1024,
        height: 768
    });

    this.test.assertExists('#resultCount', 'Got result count');
});

casper.run(function() {
    this.test.renderResults(true, 0, 'test-results.xml');
});
Besides outputting test results to the console, the test-results.xml file will now contain the JUnit XML test output, a format well understood by build tools including Hudson/Jenkins. Here are the contents of that file after running this test:
<testsuite>
    <testcase classname="ss" name="Got result count">
    </testcase>
</testsuite>
Here is the console output:
PASS 1 tests executed, 1 passed, 0 failed.
Result log stored in test-results.xml
Of course, you will want to test your code in Internet Explorer, as (unfortunately) the bulk of your users are probably using it, and for that you will have to use Selenium. But CasperJS is a great addition for quick testing in a headless environment.
Performance Testing
A central aspect of performance testing concerns knowing how your web application loads. The HTTP Archive (HAR) format is the standard for capturing this information; the specification is available at Jan Odvarko’s blog. A HAR is a JSON-formatted object that can be viewed and inspected by many tools, including free online viewers. To monitor your web application’s performance, you’ll want to generate a HAR of the application’s profile and inspect the data for issues. Capturing and monitoring this data over time will give you insight into how your application is performing.
Generating HAR Files
Several tools are capable of generating HAR files. One of the most flexible is a programmable proxy that intercepts HTTP requests and responses. The proxy can work with any browser, including mobile ones, giving it maximum flexibility.
Another option is to use a packet-sniffing tool such as tcpdump to capture HTTP traffic in PCAP format, and to then use a tool such as pcap2har to generate the HAR. This arguably gives “truer” performance numbers, as there is no proxy between your server and the client. Although this method is messier, I encourage you to check it out if the proxy method does not work for you. For instance, mobile browsers do not allow you to set proxies, so generating HARs for mobile devices requires a packet sniffer. Visit this code.google webpage for more details.
Using a proxy
To investigate how proxies work, we will play with the open source programmable proxy browsermob. Written in Java, this proxy is easily integrated into Selenium WebDriver scripts and has some nice programmable features, as well as a REST interface. Unfortunately, as of this writing not all features are available via the REST interface. But enough are available to do some damage!
To use browsermob, you simply start up the proxy and get it ready to start capturing a HAR, start Selenium WebDriver and set the proxy to the browsermob proxy, use Selenium to connect and do whatever else needs to happen, and then collect the HAR from browsermob and dump it out to a file.
Note
browsermob is actually more full-featured than is strictly necessary to just get a HAR. It can run multiple simultaneous proxies, set upload and download speeds, blacklist and whitelist sites, and even add custom DNS.
browsermob starts on port 8080 by default. This is not a proxy port, it is the port the REST interface communicates on, so there’s no reason to change it, but you can if you want to.
After you download browsermob-proxy, start it up:
% /bin/sh bin/browsermob-proxyNow you can communicate with it to start up and tear down a proxy (or multiple proxies) and take advantage of its other functionality. I’ve hacked up JavaScript bindings for the browsermob-proxy that are available as an npm package:
% npm install browsermob-proxyAt this point, you’re ready for some serious HAR file generation in JavaScript!
For starters, HARs can only be generated automatically using Selenium WebDriver with Firefox or Internet Explorer, as those are the only browsers whose proxy settings Selenium WebDriver can alter programmatically. Since HARs measure network time, this is not a big issue, unless each browser requests radically different resources on launch. This means you must have the Selenium server running somewhere to start Firefox or Internet Explorer (standalone or grid).
The browsermob-proxy npm module will generate a HAR using one of two methods:
The easy method
The advanced method
Let’s start with the easy method, which is advisable if you just have one URL whose waterfall graph you want to view. The following code generates the HAR file for Yahoo.com:
var Proxy = require('browsermob-proxy').Proxy
    , fs = require('fs')
    , proxy = new Proxy()
    ;

    proxy.doHAR('http://yahoo.com', function(err, data) {
        if (err) {
            console.error('ERROR: ' + err);
        } else {
            fs.writeFileSync('yahoo.com.har', data, 'utf8');
        }
    });
In the preceding code, we loaded the browsermob-proxy module and
created a new Proxy object. As this
object has no parameters, it assumes browsermob-proxy is running on
localhost or port 8080. Next, we simply passed
inu the URL and a callback; if there were no errors, the second
parameter to the callback will be the HAR data for that site. Dump
this data to a file, and you’re done.
If your browsermob-proxy is not running on localhost or port 8080 (the defaults), just specify where it is in the constructor:
, proxy = new Proxy( { host: 'some.other.host', port: 9999 } )Remember also that this requires the 2.x version of the Selenium
server to be running somewhere; the default configuration assumes it
is running on localhost port 4444. If that is not the case, you must
specify where it is in the Proxy
constructor:
, proxy = new Proxy( { selHost: 'some.other.host', selPort: 6666 } )Now let’s take a look at the advanced method of generating HAR files. You would use this method if you wanted a HAR file for more advanced web interaction than just loading up a page. With this method, you set up the proxy, it starts to capture the data, and the browsermob-proxy module calls back into your Selenium code with the proxy to use. You then instantiate a Selenium object using that proxy with whatever browser and page you want, and you use the provided callback to generate the HAR file, which calls your provided callback with the HAR data.
For this example, we’ll use the earlier Selenium webdriverjs example of loading up a Yahoo! page and then searching for “JavaScript”. First we generate a HAR for all of that interaction, like so:
var Proxy = require('browsermob-proxy').Proxy
    , webdriverjs = require("webdriverjs")
    , fs = require('fs')
    , proxy = new Proxy()
;

/*
 * Call into the proxy with a 'name' for this session, a Selenium
 *     function to run the interaction we want to capture, and
 *     finally a callback that will contain either the HAR data or
 *     an error
 */
proxy.cbHAR('search.yahoo.com', doSeleniumStuff, function(err, data) {
        if (err) {
            console.error('Error capturing HAR: ' + err);
        } else {
            fs.writeFileSync('search.yahoo.com.har', data, 'utf8');
        }
});

/*
 * This is the Selenium function that gets passed the proxy webdriverjs
 *     should use and a callback to call when the interaction is done
 */
function doSeleniumStuff(proxy, cb) {
    var browser = webdriverjs.remote({
        host: 'localhost'
        , port: 4444
        , desiredCapabilities: {
             browserName: 'firefox'
             , seleniumProtocol: 'WebDriver'
             , proxy: { httpProxy: proxy }
        }
    });

    // Just run our regular Selenium stuff - note this can just
    //    be your regular test code or something special you want
    //    to capture with a HAR
    // Just pass the browsermob-proxy callback to 'end()'
    browser
        .testMode()
        .init()
        .url("http://search.yahoo.com")
        .setValue("#yschsp", "JavaScript")
        .submitForm("#sf")
        .tests.visible('#resultCount', true, 'Got result count')
        .saveScreenshot('results.png')
        .end(cb);
}
This method assumes browsermob-proxy is running on the same host
(localhost) and default port (8080) as this
script. You can change these values by passing in a configuration
object to the Proxy constructor.
This method also enables you to control the Selenium interaction, so
you no longer need to pass in selHost and selPort to the Proxy constructor if the Selenium standalone
server or grid is not running on localhost port
4444.
Also, do not forget that Selenium dynamic proxy injection only
works with Firefox and Internet Explorer using WebDriver (not
Selenium1/Remote Control), so your Selenium webdriverjs
object must specify one of those two browsers.
The browsermob-proxy npm package also allows you to specify
bandwidth and latency. This is useful for not only HAR generation, but
also slow-connection testing in general, enabling you to experience
your site from a 56k modem with 200 ms of latency, like a dial-up
connection from halfway around the world. You specify these values to
the Proxy constructor using the
downloadKbps, uploadKbps, and latency keys, like so:
, proxy = new Proxy({
    downloadKbps: 56
    , uploadKbps: 56
    , latency: 200
})
This will slow everything down significantly, which is necessary for testing low-bandwidth situations.
The browsermob-proxy allows further advanced interaction as well. I strongly encourage you to check it out. Other alternatives, such as Fiddler and Charles, can do similar things, but browsermob-proxy is free and works great.
But why should Selenium have all the fun? PhantomJS and CasperJS are equally adept at generating HAR files. All you need to do is to set the proxy, which is easy to do in both PhantomJS and CasperJS.
The browsermob-proxy module is written for Node.js, and PhantomJS/CasperJS is an entirely different beast, even though they look very similar. Therefore, we first must set up the proxy using Node.js, then spawn off a CasperJS process with the correct proxy information, and finally collect the HAR and output it back in Node.js-land.
Basically, the process is very similar to the advanced method we used earlier, except the passed function callback for the Selenium piece will spawn a CasperJS script to do the driving. Once that is done, we can grab the HAR. Someday perhaps PhantomJS and Node.js will play nicely together, or PhantomJS will gain HTTP request code. Until then, we need Node.js.
Here is how it looks from the Node.js side:
var Proxy = require('browsermob-proxy').Proxy
    , spawn = require('child_process').spawn
    , fs = require('fs')
;

var proxy = new Proxy();
proxy.cbHAR('MyCoolHARFile', doCasperJSStuff, function(err, data) {
    if (err) {
        console.error('ERR: ' + err);
    } else {
        fs.writeFileSync('casper.har', data, 'utf8');
    }
});

function doCasperJSStuff(proxy, cb) {
    casperjs = spawn('bin/casperjs'
      , [ '--proxy=' + proxy, process.argv[2] ]);
    casperjs.on('exit', cb);
}
We are using proxy.cbHAR just
like in the earlier example, but the passed-in Selenium function is
actually spawning off a CasperJS job (namely, the one passed into this
script on the command line) with the proxy set to browsermob. Once the CasperJS process exits,
we call back to generate the HAR file. Here is how to use it:
% node casperHAR.js casperScript.jsIn the preceding code, casperHAR.js is the file from the previous code sample and casperScript.js is any CasperJS script (such as the one demonstrated earlier for searching Yahoo!). As with the Selenium examples, you can pass in the location where the browsermob-proxy is actually running (host and port) and any bandwidth limitations you would like to inspect. Pretty easy!
This demonstrates that any program can “drive” web interaction when generating a HAR file. Here we saw how Selenium and CasperJS do it, but any other tool you have that can drive a browser and set a proxy will work well too.
Viewing HAR Files
So, thus far we have generated HAR files, which are just JSON, and you know that you can get arbitrarily fancy, perhaps sticking their values in a database or storing the files to watch trends in your application profile. But at some point you are going to want to view the things.
Visualizing the data in HAR files is easy. The simplest method is to go to the canonical web-based viewer; simply drag a HAR file onto the page (go HTML5!) and drop it into any moderately modern browser, and you will see a waterfall graph of the HAR data. Make sure you uncheck the “Validate data before processing” checkbox before uploading your HAR. I have yet to come across a HAR file that validates correctly! Figure 6-3 shows a HAR file for our search.yahoo.com search example.
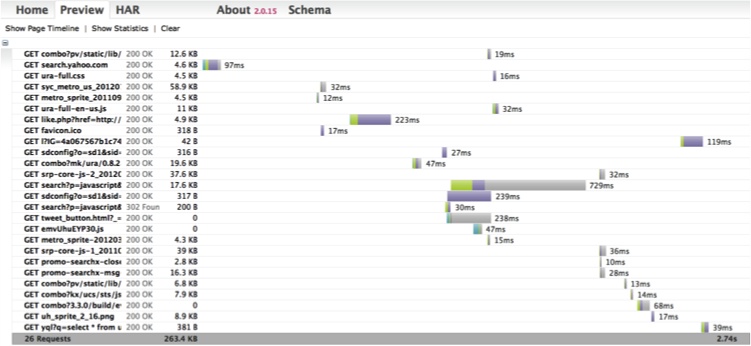
This is pretty snazzy! From this graph, we can see that 26 requests were made; hovering over any bar will reveal a specific breakdown of the amount of time each request took, in order: DNS Lookup, Connecting, Sending, Waiting, and Receiving.
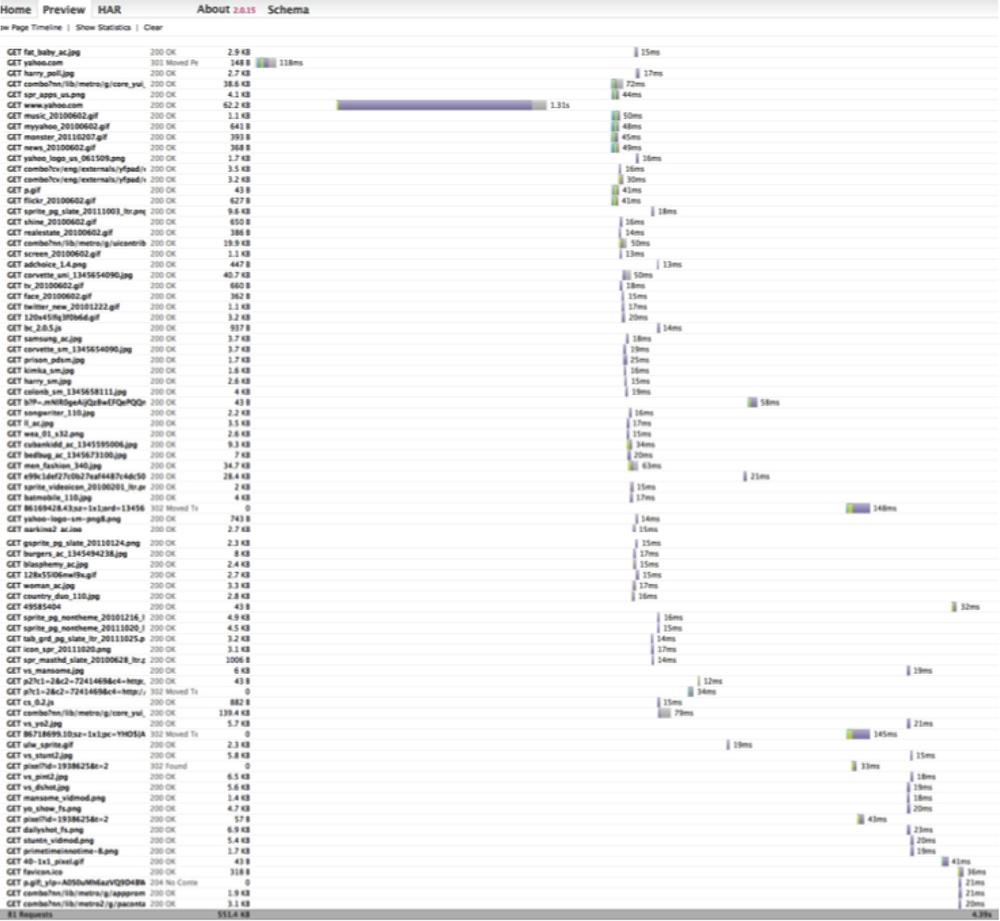
A much more involved example comes from Yahoo.com. In this example, shown in Figure 6-4, 81 requests were made to download the page, and the download time was 4.39 seconds (actually, the page was visible much sooner than that; the data that was downloaded at the end of the process comprised a big Flash ad). The perceived performance and the initial time until the page looks ready are the most important bits of information to pay attention to, not the total amount of time all the pieces take to download.
Other options are also available for viewing HAR files without having to upload them to a remote website. For starters, download the source code for the HAR Viewer. You can also easilyembed HAR graphs generated by the HAR Viewer into your own pages (the HAR files themselves can be grabbed remotely).
Another way to interrogate HAR files is with YSlow. Besides being a browser plug-in that gives grades on load performance, YSlow is also available as a command-line tool that can read HAR files and export YSlow output. You can run YSlow from the command line or from within a Node.js script via the following command:
% npm install yslow -gThe YSlow output can be in XML, plain text, or JSON format. To graphically view the YSlow output, a beacon can be sent to a YSlow visualizer, which you can also install locally if you do not want to send your precious YSlow data to a third party.
Let’s take a look at how this all fits together. After installing YSlow, we’ll feed it a HAR file and use the beacon to view the results at Showslow.com:
% yslow -i all -b http://www.showslow.com/beacon/yslow/ yahoo.com.harThis will send our HAR output from Yahoo.com to be visualized. Then we cruise over to Show Slow and find our URL in the list of recent beacons to see the full graphical output.
In this case, a lot of people have YSlow’ed Yahoo.com, so there are nice history graphs, and of course all the grades are A’s! At the bottom of the page is a link back to the HAR Viewer for Yahoo.com—the circle is complete!
You can generate visualizations yourself using the -beacon
feature—all the data provided by the beacon is detailed. Or you
can leverage the Showslow code and run your own local Showslow
server.
HAR files are very interesting, but of course they do not represent the complete performance picture. Entire books are dedicated to this topic, and with good reason!
Browser Performance Testing
HAR files are amusing and easy to generate, but they do not tell the entire story. Beyond network performance, browsers must also parse HTML, parse and execute JavaScript, and lay out and paint the browser window, and that all takes time. How much time? There are tools to measure what exactly the browser is doing while your web application is running. dynaTrace AJAX Edition for Firefox and Internet Explorer (Windows only) and Speed Tracer for Chrome are two such tools. Both accomplish the same basic tasks. While a page is loading, the tools are collecting timing information that can be graphed immediately, or saved and graphed and inspected later. By inspecting the graphed output, you can identify performance issues and then fix them. The process of collecting these low-level timings is very specific to each browser; hence, there can be no generic collector like a HAR proxy.
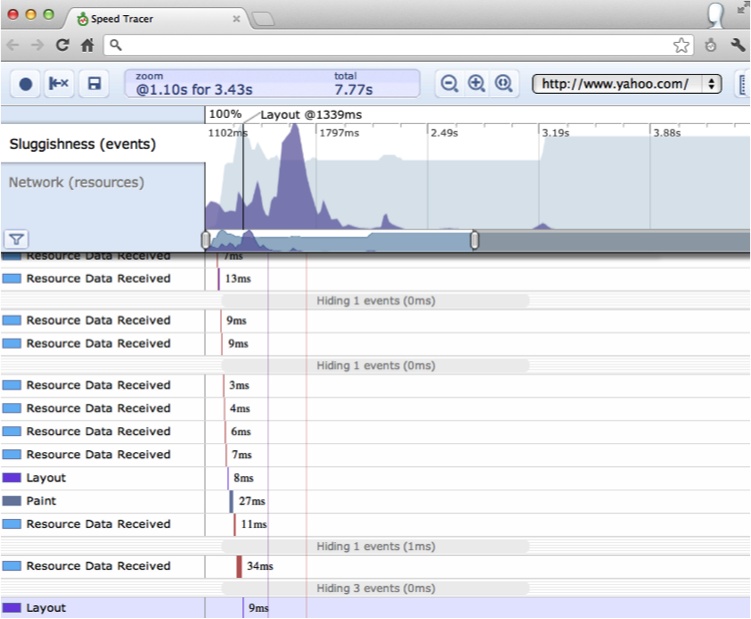
In this section we will take a quick look at Speed Tracer. Speed Tracer is an extension for Google Chrome.
Install the extension, and then click on its little green stopwatch icon to bring up the Speed Tracer UI. Clicking the red record button will start tracing browser internals, which mostly consists of fetching resources from the network, parsing HTML and JavaScript, and laying out and painting the browser window. This is all presented in the familiar waterfall graph. At the top of the UI are a Sluggishness graph and a Network graph. The Network graph is essentially identical to the HAR graphs we saw earlier. The Sluggishness graph is more interesting and visualizes how responsive (or not) the user interface is at the specified time. The taller peaks indicate that the browser’s single UI thread was blocked—a bad thing!
Speed Tracer provides hints regarding problem areas in your application (as does YSlow); for instance, Speed Tracer will flag an event lasting longer than 100 ms. Event handling blocks the main UI thread while events are being serviced, so handlers longer than 100 ms can make the UI seem sluggish.
Finally, Speed Tracer provides a save button to save the data so that you can load and examine it again at a later time—this is a great feature to leverage during an automatic build process. To wit, as part of our build we can automatically generate the Speed Tracer data for our application to ensure that no changes are impacting performance (we will investigate this further in Chapter 8). Figure 6-5 provides a peek at the Speed Tracer UI analyzing Yahoo.com.
Load Testing
Performance testing identifies bottlenecks in your code that hinder performance at the application level, basically answering the question, “How fast can your application go?” Load testing attempts to identify how much your application can handle. This is very similar to performance testing. In fact, you could argue that performance testing is a subset of load testing. Performance testing determines what your application does under the smallest loads, while load testing determines how your application performs under maximum loads—both what the maximum load is and how your application reacts as the maximum is approached. The “maximum” is not necessarily the number of requests per second until the whole thing crashes, but rather how much load your application can handle before the response time becomes unacceptable. You get to define what the response time is.
Although being able to handle huge loads and still respond within a reasonable amount of time is nice, the end goal of load testing is not only to attempt to wring out low response times in the face of heavy loads, but also to know what your maximum acceptable response time is. Perhaps it is easier to scale servers horizontally when the maximum is reached rather than rewriting your codebase to handle the load itself. Eventually there will be a point where scaling horizontally or vertically will be necessary, and identifying that point is very helpful.
But load testing is not just for entire applications. Individual functions can be load-tested as well to determine their performance. Load testing is also not just about “time”; memory, disk, and CPU usage are also important to consider when testing a system or function under load. The end result of maxing out one (or more) of those resources is increased response time, so knowing which of those values has hit the wall is crucial.
Browser Load Testing
Load testing a web application in a browser usually involves sending your
application as much traffic as possible and measuring its performance.
Measuring performance typically means response time: you GET a page or POST a form multiple times and track how long
the application takes to respond.
The canonical tool for this type of testing is Apache Bench.
The command-line ab tool takes many options to GET, POST,
PUT, or DELETE pages, and dumps out a CSV file of the results. In this chapter, we will work
with the Node.js version, called nodeload.
nodeload has lots of great features beyond just hitting URLs repeatedly, so let’s get started. Begin by installing the tool:
% sudo npm install nodeload -gAs a basic example we will use the nl.js utility, which
acts similarly to the ab Apache Bench
executable:
% nl.js
1 Aug 20:28:52 - nodeload.js [options] <host>:<port>[<path>]

Available options:
  -n, --number NUMBER              Number of requests to make.
Defaults to value of --concurrency unless a time limit is specified.
  -c, --concurrency NUMBER         Concurrent number of connections.
Defaults to 1.
  -t, --time-limit NUMBER          Number of seconds to spend running
test. No timelimit by default.
  -e, --request-rate NUMBER        Target number of requests per
seconds. Infinite by default
  -m, --method STRING              HTTP method to use.
  -d, --data STRING                Data to send along with PUT or
POST request.
  -r, --request-generator STRING   Path to module that exports
getRequest function
  -i, --report-interval NUMBER     Frequency in seconds to report
statistics. Default is 10.
  -q, --quiet                      Supress display of progress
count info.
  -h, --help                       Show usage info
A typical usage of this utility looks like this:
% nl.js -c 10 -n 1000 http://yhoo.it/XUdX3pDo not try this at home, as this will hit Yahoo.com 1,000 times, with 10 requests happening at a time. Here is what I got when I did not try this at home:
% nl.js -c 10 -n 1000 http://yahoo.com
http.createClient is deprecated. Use `http.request` instead.
Completed 910 requests
Completed 1000 requests

Server:                                 yahoo.com:80
HTTP Method:                            GET
Document Path:                          /
Concurrency Level:                      10
Number of requests:                     1000
Body bytes transferred:                 207549
Elapsed time (s):                       11.19
Requests per second:                    89.37
Mean time per request (ms):             111.23
Time per request standard deviation:    147.69

Percentages of requests served within a certain time (ms)
  Min: 86
  Avg: 111.2
  50%: 94
  95%: 113
  99%: 1516
  Max: 1638
These 1,000 requests averaged 111.2 milliseconds round trip, with one request taking 1.638 seconds to return. This kind of testing works best when also generating server-side statistics. Normally you would let this test run much longer, not only for “endurance testing” (can your application sustain a lot of hits over a long time?) but also to watch CPU, RAM, and disk utilization on the web server, as well as on any other backend machine that is providing services to your web application. Conveniently, nodeload can also generate those values.
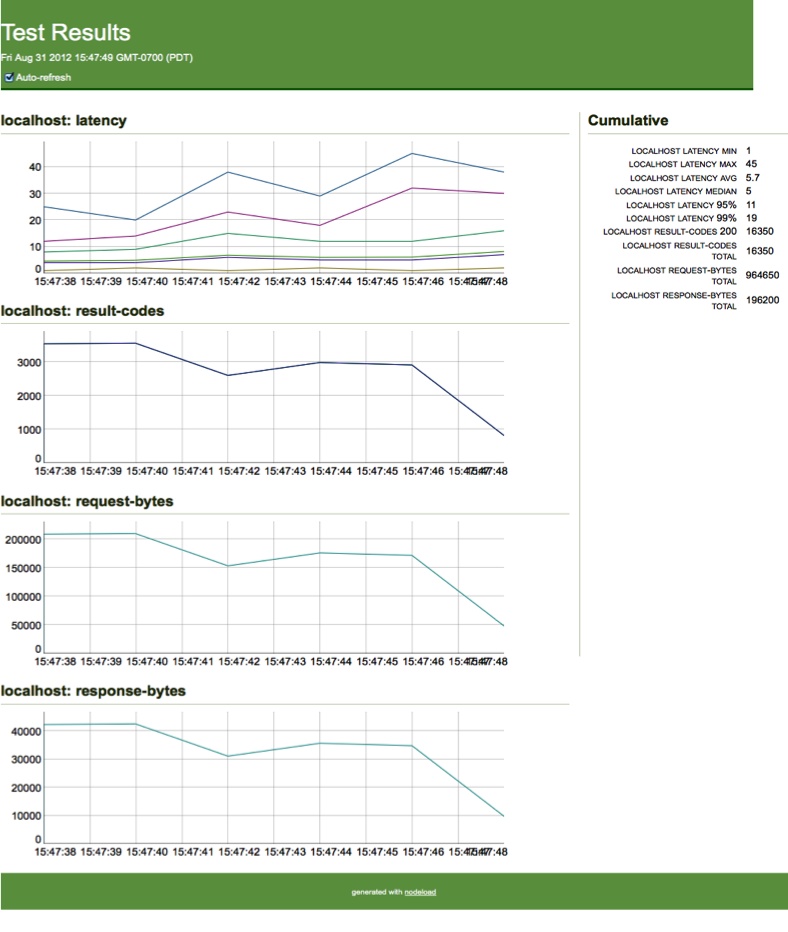
nodeload also has a great reporting function. To see it, let’s look at a full example. First we will put a long-running load on our web application. While our web server is servicing those hits, we will measure its CPU, disk, and RAM load. Finally, while the test is running, we can watch a live-updated graph of web server performance.
The first step is to send lots of hits. Here we’re sending 100,000 of them:
% nl.js -c 10 -n 100000 -i 2 http://localhost:8080While this is running, nodeload runs a web server on port 8000 to display the request activity (see Figure 6-6).
Upon completion, the final HTML and JSON values are saved into the current directory—pretty snazzy.
Meanwhile, you can monitor what is happening on the server side using your favorite statistics generator (vmstat, iostat, uptime, ps, etc.), using nodeload to graph and persist the values. Using Linux and the /proc filesystem, you can report and graph server-side values easily.
nodeload also provides a handy Loop class that will execute code at a specified frequency. As an
example, this construct will execute the getMemory and getCPU functions once every five seconds, at
most:
var myLoop = new loop.Loop(
    function(finished, args) {
        getMemory();
        getCPU();
        finished();
    }
    , []   // No args
    , []   // No conditions
    , .2   // Once every 5 seconds
);

myLoop.start();
The last parameter in the preceding code is the maximum number of times per second that the loop should execute.
The header of this script sets up all our variables:
var reporting = require('nodeload/lib/reporting')
    , report = reporting.REPORT_MANAGER.getReport('System Usage')
    , memChart = report.getChart('Memory Usage')
    , cpuChart = report.getChart('CPU Usage')
    , loop = require('nodeload/lib/loop')
    , fs = require('fs')
;
Here I am defining a single report ('System Usage') with two charts, 'Memory Usage' and 'CPU Usage'. The getMemory function uses the Linux /proc filesystem to get memory usage
data:
function getMemory() {
    var memData = getProc('meminfo', /\s*kb/i);

    memChart.put({ 'Free Memory': memData['MemFree']
      , 'Free Swap': memData['SwapFree'] });
    report.summary['Total Memory'] = memData['MemTotal'];
    report.summary['Total Swap'] = memData['SwapTotal'];
}
We can, of course, pick out any value we like. The getProc utility
function is not shown; it simply takes a file in the /proc filesystem and objectifies it. The
interesting bits are adding the current data point to the memory chart
we defined in the header and adding it to the report summary, which is
displayed in the righthand column on the reporting web page.
The getCPU function is
similar:
function getCPU() {
    var meminfo   = fs.readFileSync('/proc/loadavg', 'utf8')
        , vals    = meminfo.split(/\s+/)
        , cpuInfo = getProc('cpuinfo')
    ;

    cpuChart.put( {
        '1 Min': vals[0]
        , '5 Min': vals[1]
        , '15 Min': vals[2]
    });

    report.summary['CPU'] = cpuInfo['model name'];
}
Again, we grab some values and add them to the CPU chart. Fire up the script and go to port 8000 to view the live results.
The summary information is displayed on the right, and live-updating graphs are in the main column. When the script ends, by whatever means necessary, a file will be available in the local directory with the HTML of the graph.
nodeload has a lot of other tricks up its sleeve, including multiple loops for parallel execution of loops; a statistics package for further analysis of data sets; and a very flexible, programmatic way to specify requests (you do not have to just send vanilla HTTP requests). Of course, you can wrap any testing, hitting of web pages, or anything else within a loop, and easily graph the result.
Finally, the monitoring package allows for easy monitoring and collection of runtime data to prod your code for slowness and bottlenecks.
Tracking Resource Usage
Tracking the memory and CPU usage of your application is especially interesting in two scenarios: a single-page client-side JavaScript application and a server-side daemon. If the user does not stay on a single page for any length of time, JavaScript memory usage probably (of course, there are exceptions) does not matter; CPU usage may be a factor if a lot of processing is happening in the browser. Newer versions of modern browsers, such as Chrome, also do an excellent job of isolating memory- and CPU-hungry pages from one another. However, a single-page web application should be mindful of CPU and, especially, memory usage. Any long-running server-side process also must take care not to peg the CPU and to ensure that its memory footprint will not continue to grow until the program crashes (or worse).
Using modern browsers, the only way to leak memory in JavaScript is to keep references to objects you no longer need. This typically happens within a closure that references objects (potentially large objects) that you either no longer need or use, or do not even realize the closure is referencing. Here is an example:
function createClosure() {
    var bigHairyVariable = { ... }, wow = 'wow';
    return {
         a: bigHairyVariable
         , b: wow
         , c: 87
         , d: function() { return bigHairyVariable; }
     };
}

// never use global.a - wasted a lot of memory - a leak?
var global = createClosure();
Of course, rarely, if ever, will the code look so basic; moreover,
this does not fit the typical idea of a memory “leak” from languages such
as C, where memory is explicitly allocated. In fact, this may not be a
leak at all if using bigHairyVariable
at some point in the future is what is intended.
JavaScript object and function variables are references. In the
preceding example, bigHairyVariable
goes out of scope when the function returns, but the memory it points to
is still being referenced by two other variables, global.a and the function global.d. Setting global.a = null frees that reference to whatever
bigHairyVariable was originally
pointing to, but that memory cannot be freed yet as global.d still references it. The only way to
free this memory is to set global.d to
null:
global.d = null; // or global = null
The memory is not freed right away; not until the next time the
garbage collector runs will the chunk of memory that bigHairyVariable was pointing to be
freed.
Calling createClosure again will
allocate a brand-new memory chunk for bigHairyVariable and keep that memory allocated
until all references are released.
Note that if we called this function from within another function, when the return value went out of scope (when that function returned) all the memory associated with it would be marked as free (unless, of course, that function returned a closure referencing that variable!).
Client-Side Tracking
The WebKit Developer Tools provide excellent support for tracking the memory usage of your client-side JavaScript. As you will see in this section, the Profile panel is your friend for both memory and CPU tracking.
Memory usage
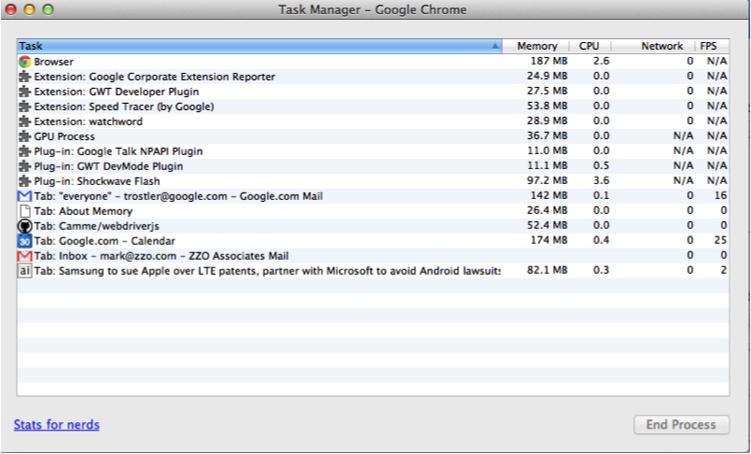
First, to get a look at overall memory usage, fire up your Chrome browser and go
to chrome://memory-redirect/. There is a lot of
data here, a summary of which you can find by selecting Wrench→Tools→Task
Manager or Windows→Task Manager. This
output is similar to that of the top utility but
within the browser, including CPU usage, I/O, and network status
information for each plug-in and tab, as well as overall browser
activity (see Figure 6-7).
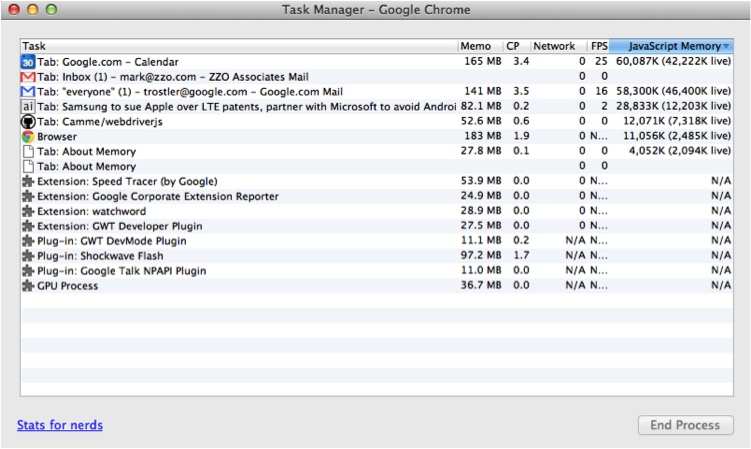
You can alter the columns that are shown by right- or context-clicking on a column header. For now, JavaScript memory is most useful. Other potentially interesting values are current cache sizes (see Figure 6-8) and, of course, “Goats Teleported.”
There is a lot of good overall information here. Let’s take a closer look at our application.
The heavy memory user here is Gmail. This is not surprising, as Gmail is a single-page web application with lots of JavaScript (like Google Calendar).
Note
As all recent browser versions use mark-and-sweep for garbage collection instead of reference counting, cycles can now be freed properly. But there are still plenty of other ways for your application to consume memory! A good overview is available on the Mozilla Developer Network site.
To determine whether an application is leaking memory, our first stop is the Memory graph in the Timeline panel (see Figure 6-9).
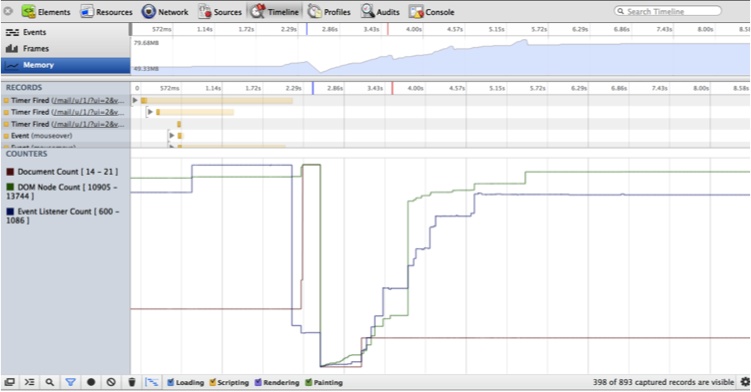
Memory usage can go up as long as it comes back down. As Figure 6-9 shows, this is a well-behaved application in terms of memory usage—usage goes up and down as the application requests and then releases memory. If your memory usage always increases and never decreases, you may have a memory leak.
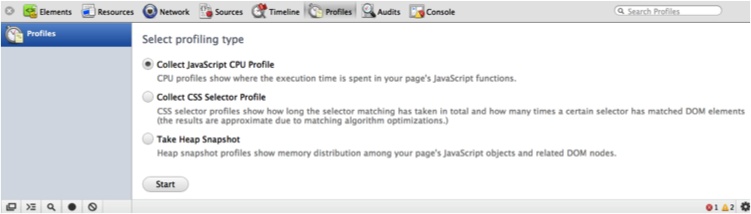
In our case, the Profiles tab in the WebKit Developer Tools comes to our rescue! (See Figure 6-10.)
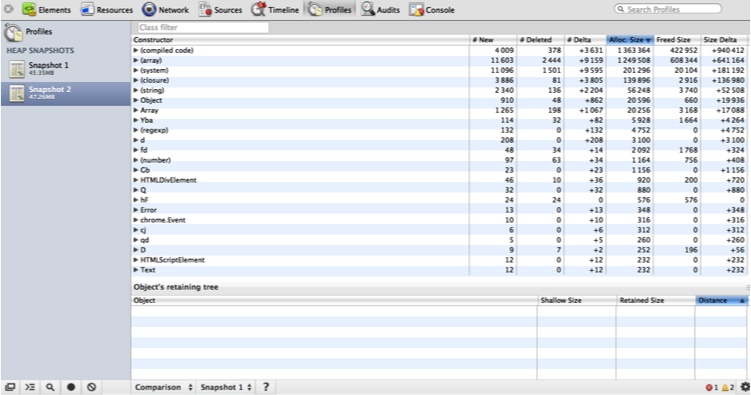
A heap snapshot makes it very easy to see how much memory a set of JavaScript objects is using. When you take a heap snapshot, the application runs the garbage collector first so that you are getting a “clean” view of actual memory usage (see Figure 6-11). Use the Class Filter text box to filter the resultant objects into the ones you are concerned about.
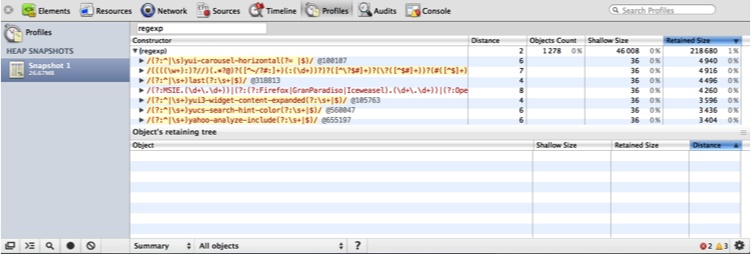
According to Figure 6-11, there are more than 1,200 regular expression objects; drilling down, you can inspect every one of them. Besides your own objects, you can also filter on DOM objects. If you are concerned that a certain action is leaking memory, take multiple snapshots. In the Summary view, shown in Figure 6-12, you can see which objects were allocated between each snapshot (note the pull-down at the bottom where I have selected “Objects allocated between Snapshots 1 and 2”).
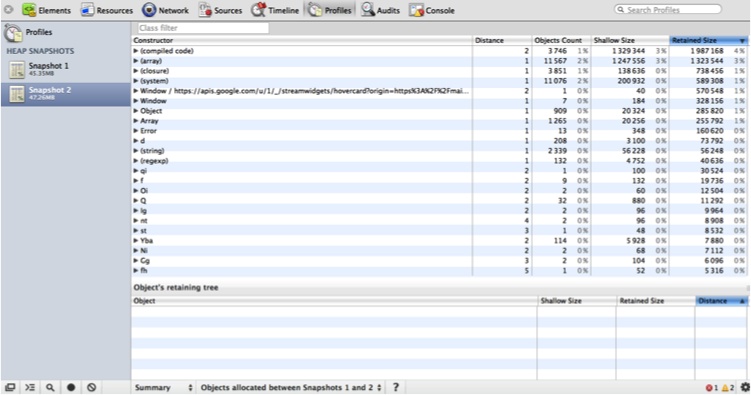
Finally, you can compare two heap snapshots for another view of what has changed between the two (see Figure 6-13).
Here, I used a lot of memory between Snapshot 1 and Snapshot 2. According to the Comparison view, more than 1,000 new array objects were created between the two snapshots. To determine whether this was intended, you can drill down into each object to see what they contain.
Interestingly, there currently is no way to trigger a heap snapshot programmatically. One solution to this issue is to insert a debugger statement into your code, and manually trigger a heap snapshot once the interpreter stops.
You can read about Gmail’s approach to finding and squashing memory leaks in its code. Also, the Chrome Developer Tools team has created a leak finder.
CPU usage
Collecting a JavaScript CPU profile from the Profiles tab shows similar information from the CPU usage angle. You can easily inspect how much time (real or a percentage) your program spends in each function, and how many times each function was executed. Click Start to begin capturing CPU information; you can click around or perform some actions and then click Stop to see what happened.
Figure 6-14 shows that the YUI function to add a node was the heavy hitter (although it was called many times, it still only took 40 ms to decorate the page). This displays the call stack to that function, and clicking on the link on the right will take you to the actual code.
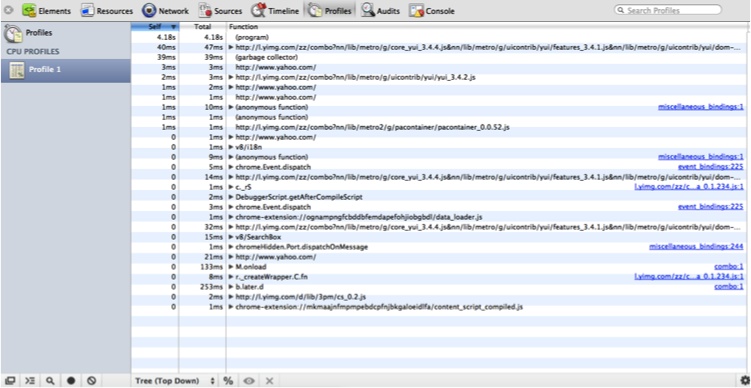
Clicking the % button will toggle the display between real time and percentage time spent in each function.
By taking heap snapshots and collecting CPU profiles, you can gain a very intimate understanding of what exactly your application is up to while it is running.
If you are interested in tracking noninteractive code paths, use
console.profile:
<html>
    <script>
        var Cache = function() {
            this.cache = {};
            this.add = function(key, val) {
                var now = new Date().getTime();
                cache[key] = { val: val, time: now };
            };
        }

        var cache = new Cache();
        console.profile('squared');
        for (var i = 0, l = 1000000; i < l; ++i) {
            cache.add(i, i ^ 2);
        }
        console.profileEnd('squared');
    </script>
</html>
Loading this code in a WebKit-based browser and opening the Profiles tab will produce output similar to that shown in Figure 6-15.
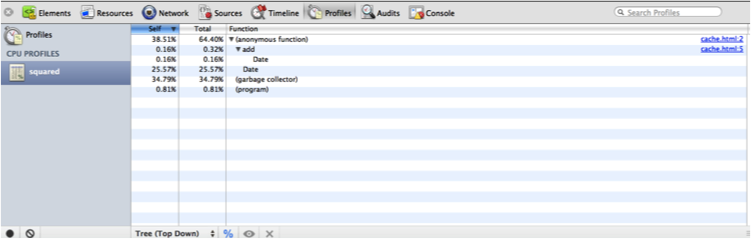
The Profiles tab has captured the “squared” profile report, and now it is available for inspection.
Server-Side Tracking
Node.js exposes the V8 profiler, which you can use to gather CPU and memory
usage data beyond console.trace.
Using the webkit-devtools-agent npm
package makes profiling Node.js server-side applications almost
as easy (and pretty) as profiling client-side ones. So, install it, and
get ready to rumble!:
% sudo npm install webkit-devtools-agent -gThis package allows your Node.js application to utilize the Heap Snapshot and JavaScript CPU Profiles tabs in a WebKit-based browser (such as Chrome or Safari). To use the package, simply require it at the top of your program and then signal your Node.js process with a USR2 signal:
var agent = require('webkit-devtools-agent');
process.kill(process.pid, 'SIGUSR2');
Of course, you can also send the USR2 signal externally from your program. This starts up a local daemon listening for connections from a WebKit browser that will then fire up the Developer Tools to analyze your program.
To get all this to work, you will need to start a copy of Chrome
with the -remote-debugging-port=9222
option. On a Mac, from a shell issue the following command (all on one
line):
% /Applications/Google\ Chrome.app/Contents/MacOS/Google\ Chrome
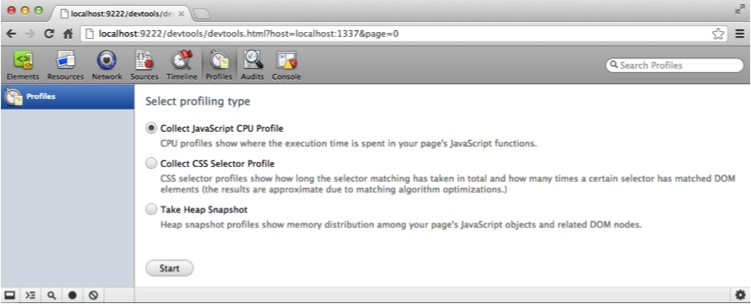
--remote-debugging-port=9222 -user-data-dir=/tmpAnother WebKit-based browser can use this copy of Chrome to connect to debug the Node.js application. Once your application has started and you have signaled it with USR2, you can now connect to the following URL from another WebKit browser: http://localhost:9222/devtools/devtools.html?host=localhost:1337&page=0.
This loads the Developer Tools as served by the first WebKit
browser, which speaks the Web Sockets protocol to the webkit-developer-agent spawned by your Node.js
program. While the entire set of Chrome Developer Tools appears, only
the Profiles tab actually works (see Figure 6-16).
Programmatic heap snapshots
Using the UI, you can also collect a JavaScript CPU profile or take a heap snapshot of your Node.js program. Alternatively, you can programmatically take a heap snapshot using the heapdump package:
% sudo npm install heapdump -gUsing this package is simple, but it does require an addition to
your code. First, you must require the
module:
require('heapdump');When you’re ready to take a heap snapshot, simply send the USR2 signal to your Node.js process:
% kill -USR2 <NodeJS process ID>This will dump into the current directory a heap snapshot file that can be viewed using Chrome Canary, the developer build of Chrome.
To programmatically trigger a heap dump, signal yourself:
process.kill(process.pid, 'SIGUSR2');
After requiring heapdump, the preceding statement will trigger a heap dump to the application’s directory.
To see the dump in all its glory, open the Developer Tools in Chrome Canary and click the Profiles tab. Then right-click Profiles to load the snapshot, and select the heapdump-snapshot file output by your Node.js process. The heap snapshot will appear in the list of snapshots—click on it to check it out.
Programmatic CPU usage
Capturing CPU usage in Node.js is similar to taking a heap snapshot. To profile the entire application, simply issue this command:
% node --prof myapp.jsWhen your application exits, the file v8.log will be written to the application’s
directory. If you build Node.js from source, you can use your
operating system’s *-tick-processor
execute command to visualize this file, but it is simpler to
just install the profiler npm
package:
% sudo npm install profiler -gNow you can build the nprof command-line
tool. First find the node_modules
directory where the package was installed. In that directory will be a
profiler directory; change into
that directory and issue the following command:
% /bin/sh tools/build-nprofThis will create an nprof JavaScript executable in the profiler directory. Execute it either with the path to your v8.log file or from a directory with a v8.log file in it:
% .../node_modules/profiler/nprof path/to/v8.logYou will be greeted by output similar to Chrome’s JavaScript CPU Profile output (but in glorious text).
Recap
Your job does not end with writing code and unit-testing it. Especially for web-based applications, integration and rudimentary performance testing are also necessary. Integration testing is not just for QA people anymore. Using pure JavaScript, developers can easily create integration tests that integrate into Selenium.
By leveraging Selenium or CasperJS, you can easily generate and view HAR files for your web applications, all in pure JavaScript. Keeping track of the code you are writing and the effects the code is having on the entire application is a required activity for all well-rounded JavaScript developers. Now that you know how to do it—both in “real” browsers and in PhantomJS—it’s easy to include this in your development workflow.
In addition to network issues, performance testing is also concerned with digging deep into the browser to determine exactly what it is doing and how long it is taking, as this is what provides the deepest understanding of an application. Tools such as dynaTrace AJAX Edition and Speed Tracer provide this highly browser-dependent data to be analyzed.
Load and runtime monitoring are also easy to accomplish using nodeload or similar tools. Of course, the monitoring and testing processes are relatively straightforward, and the results will provide lots of detail regarding what is happening with your application, but tracking down the actual underlying issues can require patience and perseverance!
Finally, you can stay completely on top of your application’s memory and CPU usage using Chrome Developer Tools and Node.js modules. These tools will help you to optimize your code as well as find memory and CPU bottlenecks.
Tools for JavaScript are continuing to increase in quantity and robustness. As the number of tools increases, it is important to understand JavaScript’s memory model and code hot spots so that you will be productive regardless of which tool you choose.