Table of Contents for
Hacking Exposed Malware & Rootkits: Security Secrets and Solutions, Second Edition, 2nd Edition
 Hacking Exposed Malware & Rootkits: Security Secrets and Solutions, Second Edition, 2nd Edition
Published by
McGraw-Hill, 2016
Hacking Exposed Malware & Rootkits: Security Secrets and Solutions, Second Edition, 2nd Edition
Published by
McGraw-Hill, 2016
- Cover
- Hacking Exposed Malware & Rootkits: Security Secrets and Solutions, Second Edition Davis
- Title Page
- Copyright Page
- Dedication
- Hacking Exposed Malware & Rootkits: Security Secrets and Solutions, Second Edition Davis
- Hacking Exposed Malware & Rootkits: Security Secrets and Solutions, Second Edition Davis
- Contents
- Foreword
- Acknowledgments
- Introduction
- Part I Malware
- 1 Malware Propagation
- 2 Malware Functionality
- Part II Rootkits
- 3 User-Mode Rootkits
- 4 Kernel-Mode Rootkits
- 5 Virtual Rootkits
- 6 The Future of Rootkits
- Part III Prevention Technologies
- 7 Antivirus
- 8 Host Protection Systems
- 9 Host-Based Intrusion Prevention
- 10 Rootkit Detection
- 11 General Security Practices
- Appendix System Integrity Analysis: Building Your Own Rootkit Detector
- Index
APPENDIX
SYSTEM INTEGRITY ANALYSIS: BUILDING YOUR OWN ROOTKIT DETECTOR
In this appendix, we cover in greater detail how to turn some of the major anti-rootkit techniques discussed in Chapter 10 into a system integrity validation tool. The concept of system integrity has been around for quite some time, but somewhere along the way the conversation was dropped. We hope to educate the reader on the importance of integrity analysis and revitalize the debate.
For educational purposes, this appendix will start with some code to detect the basic rootkit techniques. As detailed in Chapter 10, plenty of free tools, varying in terms of depth, capability, and operating-system support, are available for performing rootkit detection and eradication. You’ll need to make an objective opinion as to whether these tools meet your needs and if a custom solution is needed.
The code we’re about to walk you through inspects some of the key areas in Windows operating systems that indicate the system has been compromised. We refer to these infection points as integrity violation indicators, or IVIs. We’ll discover four such IVIs, although many others have been discussed in the book, for instance:
• SSDT hooking
• IRP hooking
• IAT hooking
• DKOM
In order to detect system integrity violations in these areas, we’ll explain three basic detection techniques that can also be extended to the other IVIs mentioned in the book:
• Pointer validation (SSDT, IRP, and IAT)
• Function detour/patch detection (SSDT, IRP, and IAT)
• DKOM detection (DKOM)
Analyzing systems for IVIs using these three techniques is a simple methodology for benchmarking the integrity of your operating system. For each of the analysis areas or IVIs, we’ll look at why system integrity is important and how you can detect the indicator’s presence with code samples. This basic methodology can be used as a starting point for building and customizing your own rootkit detector.
We touched on this topic in Chapters 3 and 4 when discussing user-mode and kernel-mode rootkits, as well as in Chapter 10 when we covered anti-rootkit technologies. In this appendix, we hope to expand this theme into a powerful, extensible, and yet user-friendly system integrity analysis methodology.
After our cautionary note, we’ll offer some context to this appendix with a brief introduction to system integrity analysis and a history of similar work performed in this field. Then we’ll jump right into the IVIs and source code for detecting them.

The source code in this chapter is released under the GNU Public License version 3 (GPLv3). A copy of this license may be obtained at http://www.gnu.org/licenses/gpl-3.0.html.
What Is System Integrity Analysis?
The word integrity carries many connotations in the field of computer security, and its definition varies greatly depending on who you ask and in what context. The concept of integrity is most commonly tied to data integrity, such as the use of MD5 file hashes to verify a file’s contents do not change during transmission. For example, a forensic investigator would always validate a copy of a drive image with the original by comparing their respective MD5 hashes. The major objective of verifying the integrity of the data or file is to ensure its correctness and consistency across all modes of use: transmission, processing, and storage.
System integrity analysis has the same goal, but its scope is broader. Rather than validating the state of a file, the goal is to validate the state of the entire computer system. Holistic system integrity analysis touches on many topics, including physical access, information protection, access control, authentication, authorization, and even hardware-compatibility issues. All of these areas represent challenges to ensuring a system remains stable and usable.
Operating system integrity analysis (what we focus on in this appendix) is a subset of system integrity analysis, where the focus is placed on validating the state of correctness and consistency of the operating system and its components. Remember, all of the broader system integrity analysis considerations still influence operating system integrity. For example, a hardware keylogger can capture keystrokes at the firmware level before they reach the operating system, if the keylogger is physically installed inline. Analysis of the operating system may show a high level of trust, but the computer system itself is being compromised at a lower level.
To put a different spin on the word integrity, let’s assume for a second that a particular computer system’s integrity is synonymous with the level of trust you put in it. The importance of this trust takes on a whole new meaning when you consider all of the areas of everyday life that are computerized: you trust the computer system in your car will crank the engine on a cold day, the medical equipment in the hospital will correctly measure the drip rate on an injured patient’s morphine IV bag, a plane’s navigation system will ensure you land you safely, and electronic voting systems will correctly tally the results of a presidential election. Now, what would your trust level be in these systems if you knew there was a good chance a rootkit had been installed on each of them and the equipment did nothing to attempt to detect or deter such rootkits, even though well-documented detection techniques were available for free? Would you still board the plane? If your answer is no, then why would you find the same negligence acceptable in security software that claims to protect your personal information and your child’s Internet access? If your answer is yes, then perhaps it will take a very serious digital devastation that directly affects you to convince you—or perhaps this appendix will do the job!
By nature, malware and rootkits violate operating system integrity and, therefore, the system as a whole. The system can no longer be trusted, and any information retrieved from the operating system itself must be considered unreliable. That’s why employing system integrity validation tools that run on the same level as the operating system is so important. Such tools, such as the one we present in this chapter, can perform an objective sanity check on the operating system’s most critical components (what we’ve defined as integrity violation indicators). Using such an evaluation in a repeatable process to constantly reevaluate the integrity of the system, particularly ones that are exposed to the public, is equally important.
To appreciate the significance of system integrity analysis, consider this: to the best of our knowledge, no digital forensic product on the market today attempts to validate system integrity before collecting digital evidence. This means people are being prosecuted on possibly tainted evidence—evidence not collected in the most critical manner possible. Sure, integrity validation tools can be fooled as well, but the point is these major commercial products should perform some fundamental checks to at least show due diligence. The problem is not isolated to forensic products: antivirus, HIPS/HIDS, personal firewalls, and many other tools do not attempt to validate the state of the operating system before installation.
This is not a new concern; the problem was pointed out years ago, but somehow the message got lost and the issue has been forgotten. We hope to raise the issue again in this appendix.
The Two Ps of Integrity Analysis
Nearly all of the detection methodologies in this appendix, and in much of system integrity analysis in general, require the application of two basic rules that correspond to two of the three detection techniques listed at the beginning of this appendix:
1. Pointer validation Most of the Windows operating system is written in C, which makes heavy use of pointers for speed. As a result, many of the data structures we’ll be analyzing for integrity analysis will be pointer based (lists, tables, and strings). A typical operation will be to walk a table of function pointers (for example, in detecting SSDT and IRP hooks) and ensure those pointers point to a memory location within a “trusted” system module.
2. Patch detection Sometimes pointer validation can be foiled by code patches. Examples include detours and inline function hooks. In the former, a function’s prologue is overwritten; in the latter, a piece of a function’s body is overwritten. By dynamically disassembling blocks of code in a function, a detection utility can sometimes very easily spot patches. In most cases, when a patch is detected in a function, it reveals the use of a jump instruction to transfer execution to another malicious module in memory, which involves a pointer operation. At this point, the pointer principle in rule #1 applies.
Usually the proper validation of a given data structure’s integrity requires the application of both Ps—pointers and patches. An example is the SSDT. Most detection utilities available today simply walk the table of pointers and make sure those pointers point to a location inside the Windows kernel. Those tools are missing the next step—the second P, patch detection. Each one of those SSDT entries represents a system service function that could be patched. Thus, after validating the pointers, the tool should also check each function for patches.
Table A-1 summarizes the detection techniques presented in this appendix in the context of the two Ps of integrity analysis.
In the remainder of the appendix, we will explain the two Ps—pointer validation and patch detection—by presenting an example of the SSDT. We’ll also illustrate how to combine these two techniques by providing an example of IRP hook detection in a loaded driver and briefly mention how the same techniques apply to IAT hook detection. Finally, we’ll illustrate a technique for detecting DKOM.
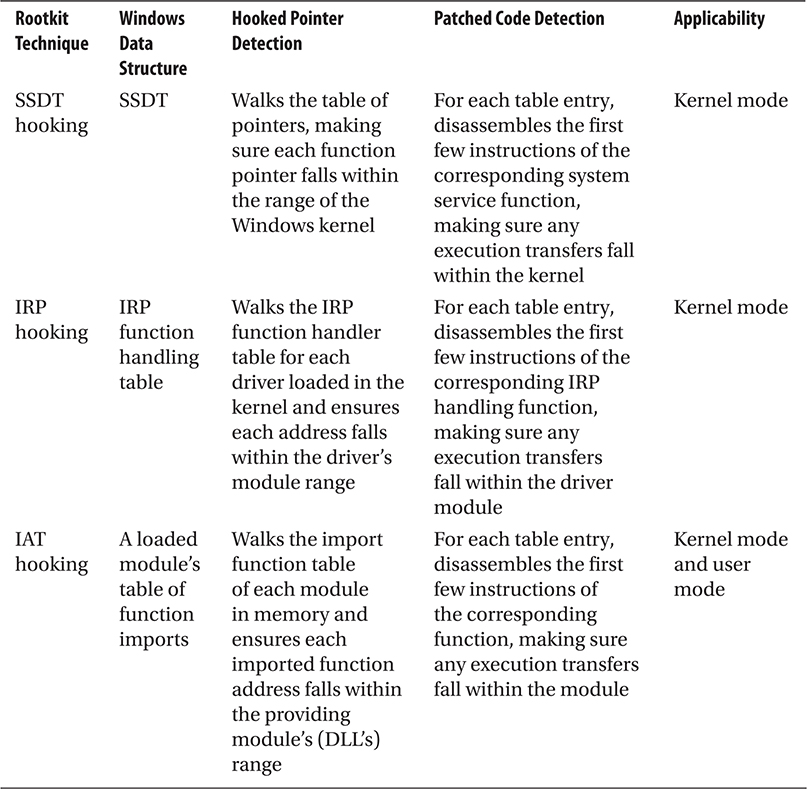
Table A-1 Mapping of the Two Ps to Rootkit Techniques
Pointer Validation: Detecting SSDT Hooks
The system service dispatch table (SSDT) is a data structure exported by the Windows kernel, ntoskrnl.exe (or ntkrnlpa.exe for Physical Address Extension–enabled systems). As discussed in Chapter 4, this structure is used by Windows to allow user-mode applications access to system resources and functionality. When a user-mode program needs to open a file, for example, it calls win32 API functions from various Windows support libraries (kernel32.dll, advapi32.dll, etc.), which, in turn, call system functions exported by ntdll.dll (that eventually reach a real function in the kernel). A kernel function KiSystemService() is executed whenever a system service is needed. This function looks up the requested system service function in the SSDT and then calls that function.
This mapping is defined in the SSDT structure, which is actually a term used to refer collectively to several tables that implement the system call interface. The first such table, and the starting point for getting a copy of the SSDT, is exported by the kernel as KeServiceDescriptorTable. This structure has four fields that contain pointers to four system service tables, which are internally referenced as an unexported structure called KiServiceTable. Typically, the first entry in the KeServiceDescriptorTable indirectly contains a pointer to the service table for ntoskrnl.exe. The second entry points to the SSDT for win32k.sys (GDI subsystem). The third and fourth entries are unused. Figure A-1 demonstrates the relationships among these structures.
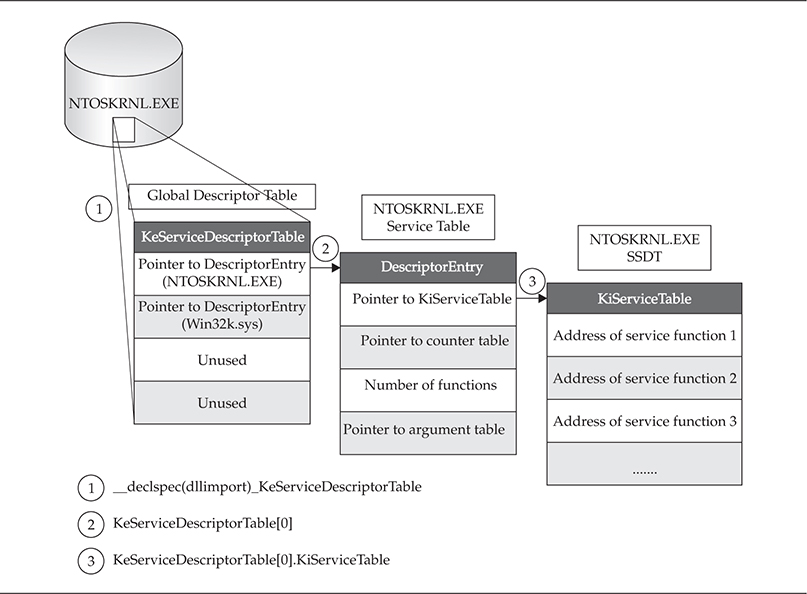
Figure A-1 Various structures involved in service dispatching
Figure A-1 is labeled with three steps that show how to get to the “real” SSDT structure for the Windows kernel. The structure shown in step 3, the KiServiceTable, is the structure referred to in most literature on the topic of SSDT hooking.
The system maintains a second copy of the SSDT. This second copy is called the KeServiceDescriptorTableShadow. For more information on this structure, go to Alexandar Volynkin’s site at http://www.volynkin.com/sdts.htm.
The easiest way to detect an SSDT hook is in three steps:
1. Get a copy of the current “live” global SSDT table.
2. Find the base address of the kernel in memory and its module size.
3. Examine each entry in the table and determine whether the address of the service functions point into the address space of the kernel; if the address falls within the kernel, most likely the entry is legitimate. If the entry falls outside of the kernel, it’s hooked.
Alas, as it turns out, this process isn’t as easy as it looks.
Here, we’re examining the global service table. Every thread in Windows gets its own local copy of this global table, which could also be independently hooked later. This appendix doesn’t cover how to detect SSDT hooks under these circumstances.
SSDT Detection Code
In the following sections, we’ll discuss the detection code that implements the three steps just outlined.
Getting a Copy of SSDT In order to get the table information programmatically, first we have to locate the data structure. Because we can achieve this using a number of documented methods, we’ll pick the most straightforward method: the kernel exports the table as a symbol, KeServiceDescriptorTable, so this method simply links dynamically to this symbol, importing the module into our program. Of course, this is extremely loud and obvious, and any rootkit monitoring this structure would be alerted to your activity. One variation of the C code is simply:

Thus, at runtime, the variable KeServiceDescriptorTable will be loaded and accessible to our code. The type _KeServiceDescriptorTable is a custom structure defined in the program’s header file. The fields in this structure correspond to our discussion at the beginning of this section of the four system tables (ntoskrnl.exe, win32k.sys, and two unused tables) and how the first entry in each table is a reference to a descriptor table that contains a pointer to the actual SSDT. The data structures that implement this configuration are
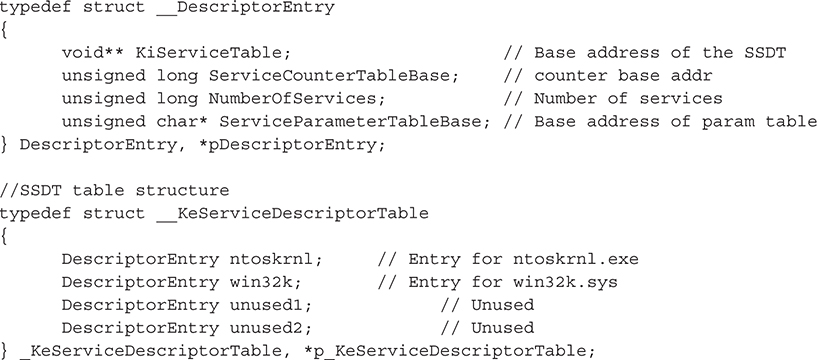
Before moving on, make sure you have a firm grasp of the relationship between these two structures and how they correspond to the concepts illustrated in Figure A-1.
Now that we have the SSDT stored in this structure, we can simply loop through the structure and print the table:
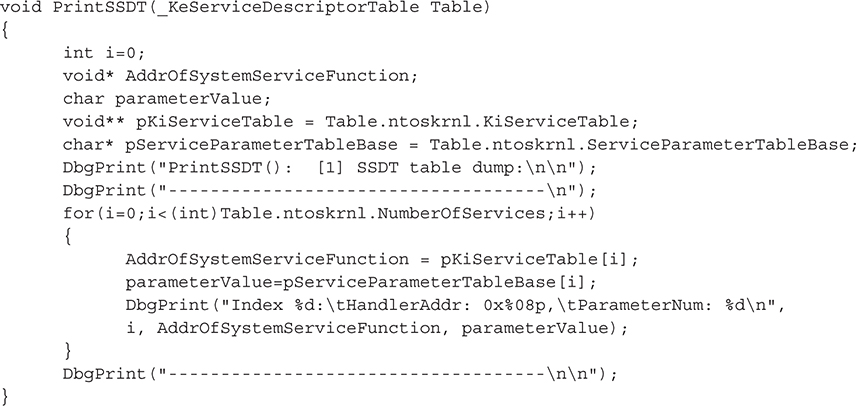
As pointed out by the hacker 90210 in a post on rootkit.com (http://www.rootkit.com/newsread.php?newsid=176), this method can be unreliable if the SSDT is relocated (i.e., not located at the address in index 0 of the base table). Ironically, the poster states that Kaspersky antivirus is an example of a security product that relocates the SSDT to fool some rootkits. It has an unfortunate side effect of also fooling rootkit detectors that rely on the method just described. Hacker 90210 suggests the best way to find the real location of the service table for ntoskrnl is to parse the kernel’s binary file (ntoskrnl.exe), find all relocation references, and determine if any of those relocations reference the system service table. If a relocation is found that does reference the address of the service table, the program parses the assembly instruction to look for opcodes that indicate the table was moved to an immediate address. If the opcodes match, then this instruction relocates the table, and the program copies the immediate address (RVA) that it was relocated to. The program then dumps the SSDT located at that address.
Another simple way to get the address of KeServiceDescriptorTable is to call the Windows API function GetProcAddress(). This function retrieves the memory address of an exported symbol inside a given module. Other alternatives, such as the one used by SDTRestore (http://www.security.org.sg/code/sdtrestore.html), include manually finding the offset of the structure in the ntoskrnl.exe binary by examining its export table. The offset is then added to the baseload address of ntoskrnl.exe. This is a service pack–independent way of finding the structure. It should be noted this technique will fail on systems that are booted with custom userspace memory sizes (e.g., using the /3G switch when booting Windows) because this technique assumes kernel space starts at 0x80000000.
Find the Base Address of the Kernel The base address of any module loaded in memory can be retrieved using a number of system APIs (such as LoadLibrary()). The infamous (previously) undocumented function ZwQuerySystemInformation() is suitable for this purpose. The simple technique is
1. Get a list of loaded modules.
2. Loop through the module list and find the one named “ntoskrnl.exe.”
3. Return ntoskrnl.exe’s base address and size.
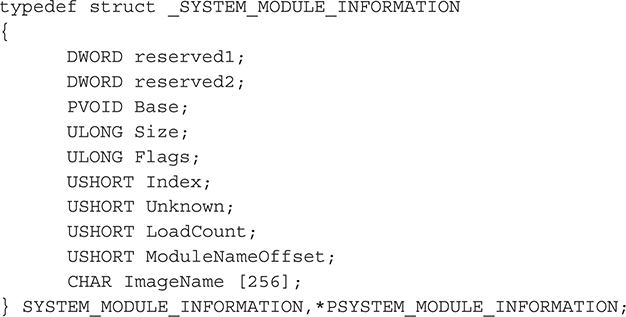
ZwQuerySystemInformation() will accept a slew of information class structures to retrieve various types of data (process list, loaded module list, and so on). We’ll pass it a type called SystemModuleInformation, which is defined as
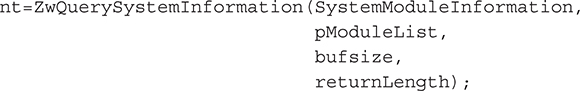
To get the attributes of ntoskrnl.exe, we’ll call the API, passing the appropriate arguments:
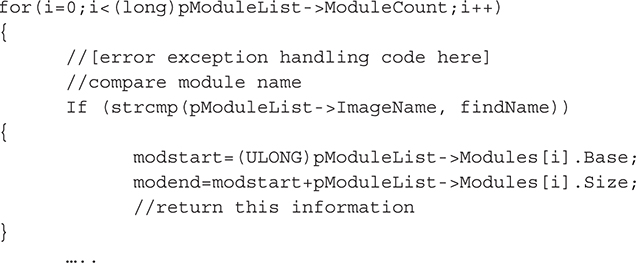
Then, we’ll loop through the module list and find ntoskrnl.exe, recording its base address and size:
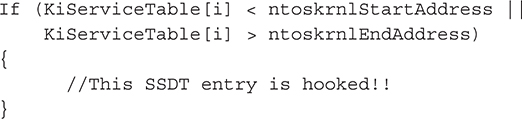
Examine Each SSDT Entry for Hooks Now that we have the SSDT information and we know where the service function addresses in the SSDT should be pointing to (the range of ntoskrnl.exe), it’s a simple matter of walking the table and comparing each function address. This requires an easy modification of the PrintSSDT() function to compare each entry with the notskrnl.exe range:
The next step would be to either restore the original SSDT entry (by loading the ntoskrnl.exe binary from disk and finding the correct address for this entry) or, optionally, perform some analysis on the module that is “hooking” the function, which may be a software firewall or AV product. A cursory analysis could eliminate false positives.
One issue to consider is false negatives; just because the address of a particular service function in the SSDT is valid (i.e., in the range of the kernel) doesn’t mean the service function itself isn’t tainted. The function itself could be compromised by a classic function detours/patch. A stealthy alternative to SSDT hooking that achieves the same goal is to patch the actual code of the module that implements the function pointed to by the SSDT, rather than hooking the pointer itself in the SSDT. This approach has become more and more popular, as evidenced by the W32/Almanahe rootkit from 2007.
Let’s now take a more in-depth look at detours.
Patch/Detour Detection in the SSDT
As discussed in Chapter 4, function detours (i.e., patches) are widely used throughout Windows, most notably in Windows Update service through hot patching. In fact, Microsoft released an open-source utility called Detours that helps developers implement function detours in their own products for various purposes (see http://research.microsoft.com/en-us/projects/detours/). The product is still maintained today by Microsoft Research.
Function detours are extremely simple in design. A detour targets a function for patching and overwrites the function’s prologue to jump to the detour’s own function. At this point, the detour can perform preprocessing tasks, such as altering parameters that were meant for the original function. The detour’s function then calls what is known as a trampoline function, which calls the original function without detouring it (passing in any modified parameters). The original function then does what it was designed to do and returns to the detoured function, which can perform some post-processing tasks, such as modifying the results of the original function, which, for file hiding, would be to remove certain entries.
For our purposes, we’re not interested in finding the trampoline function; we’re interested in detecting the initial detour, which typically overwrites the first 5 bytes of the function prologue (enough space for a near JMP instruction and operand). We’ll scan 25 bytes for such an overwrite.
The method used to detect these prologue patches is similar to the SSDT hook detection approach, but instead of walking a table of function addresses and making sure those addresses fall in the range of the kernel, we’ll check that the first few instructions of a given function do not jump or call into another module. However, before we discuss the detection steps and the code, let’s take an in-depth look at x86 architecture fundamentals that impact our detection logic. Hold on to your hats…
This detection technique does not cover how to detect inline function hooking, which overwrites function bytes in the body of the function instead of in the prologue.
Making Sense of JMPs and CALLs
To understand the complexity of parsing x86 instructions and how this applies to detour detection, let’s look at how you would manually analyze x86 instruction opcodes and operands to detect a detour. In our actual code, we’ll use an open-source disassembler to do the hard work we’re about to dive into now.
When reading the first few bytes of the function we want to test, we have to be able to interpret the raw bytes. The raw bytes will correspond to instructions and data, and each will be handled in different ways. For the instructions, since we’re looking for branch instructions (namely JMP variations and CALL), we have a finite set of opcodes to consider. We can hardcode these opcodes into our detection routine by looking up the values of all of the various JMP/CALL instructions in the x86 manuals. (For an online quick reference to the real manual, go to https://pdos.csail.mit.edu/6.828/2014/readings/i386/s03_05.htm.) Here, we’re essentially implementing our own rudimentary disassembler. We’ll also need to know how large the instructions are (i.e., JMP is 1 byte), so we can refer to this basic lookup table as we read the bytes. Then, it’s simply a matter of determining if the instruction is a JMP/CALL.
For the instruction operands/data, our goal is to convert them into the correct memory addresses, so we can determine where this JMP/CALL is branching execution. If the operand references a memory address outside of the function’s binary module, it is most likely a detour. In order to handle the operands/data, we must account for all of the x86 call types and addressing modes that the instructions’ arguments can take. There are four call types, but the two that we care about are near calls and far calls. Near calls occur in the same code segment (specified in the Code Segment, or CS, register) in memory and, as such, use relative addressing (the address is an offset from the current instruction address). Thus, near call instructions can appear as
• rel16/rel32 16-bit or 32-bit relative address (e.g., JMP 0xABCD)
• rm16/rm32 16-bit or 32-bit registry or memory address (e.g., JMP EAX or JMP [EAX] or JMP 0x12345678)
Far calls branch into completely different code segments in memory; thus the processor arbitrates the transfer of execution (since it runs in protected mode). The processor consults the GDT or LDT of the specified segment selector to determine the type of selector, access privileges, code privilege level, and other attributes. The far call instructions appear as [segment]:[offset] pointers:
• ptr16:16 A 16-bit selector with a 16-bit offset (e.g., JMP 0x1234:0x5512)
• ptr16:32 A 16-bit selector with a 32-bit offset (e.g., JMP 0x1234:0x4412ABCD)
• m16:16 A 16-bit memory address selector with a 16-bit memory address offset
• m16:32 A 16-bit memory address selector with a 32-bit memory address offset
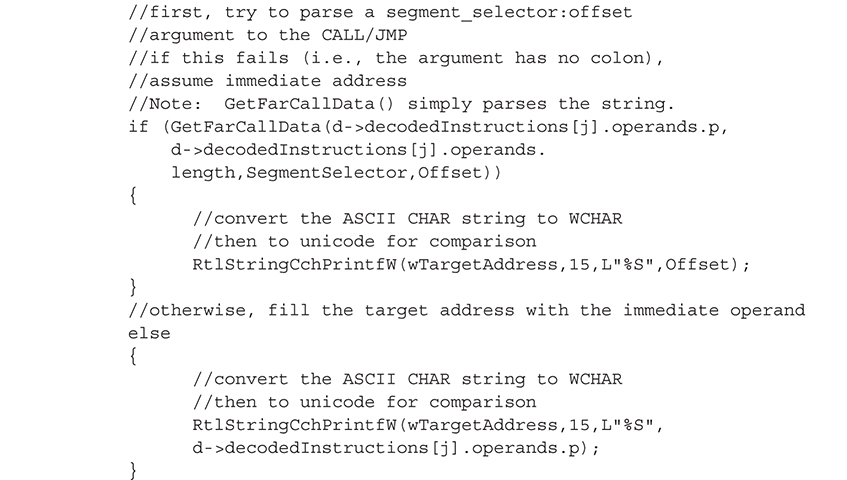
As you can see, this is starting to get a little complicated. We’re going to have to do some pointer arithmetic and also look up segment selectors in the Global Descriptor Table (GDT). Remember, the GDT is a table that the processor uses to maintain memory protection for various memory segments. Thus, we must consult the GDT to calculate the effective address for far calls. We’ll explain how this is done.
For the first two types, the address supplied is a pointer with two parts. The first part (to the left of the colon, ptr16) is a 16-bit pointer to a segment selector; this selector will point to an entry in the GDT table that contains the appropriate memory base address for the code segment (the entry could be data, call gates, and other types as well). The second part (to the right of the colon, 16) is a 16-bit offset into that selected segment. Thus, adding the base address from the GDT to the specified offset gives the effective address (this conversion process is known as logical to linear address translation in Intel x86 terminology). This is the argument to the JMP/CALL instruction.
Table A-2 summarizes the lookup table to use when processing function prologue bytes for detours.
We haven’t included variations of JMP/CALL that use indirect addressing (i.e., registers or memory addresses) as operands (JMP opcode 0xFF). We’re also not interested in conditional JMPs (JCXZ variations, opcode 0xE3). Also note that 64-bit architecture works differently, and some of these opcodes are not allowed (those marked by an asterisk[*]).
To explain the mnemonics used in Table A-2, the entry “Far JMP p16:32” means “a far JMP instruction is executed with the target of the jump being a far pointer defined by a 16-bit selector value and a 32-bit offset value.” This notation means you must consult the GDT to find the base address of the segment pointed to by the segment selector p16 (a 16-bit pointer) and add it to the offset specified by the 16- or 32-bit address to the right of the colon.
Notice that short JMPs can only take a 1-byte address as an operand. Thus, we don’t care about these JMPs because they are intramodular.
Based on this lookup table, we’ll perform one of two actions based on the opcode:
1. If the opcode refers to a Near JMP or Near CALL (0xE8 and 0xE9), the target of the JMP will be calculated as the address of the instruction just after the JMP plus the operand (since the address is relative).
2. If the opcode refers to a Far JMP or Far CALL (0xEA and 0x9A), the 16-bit segment selector (to the left of the colon) is parsed to determine if the GDT or LDT must be consulted to find the segment base address, which is added to the given offset (to the right of the colon). This is the target of the JMP or CALL.
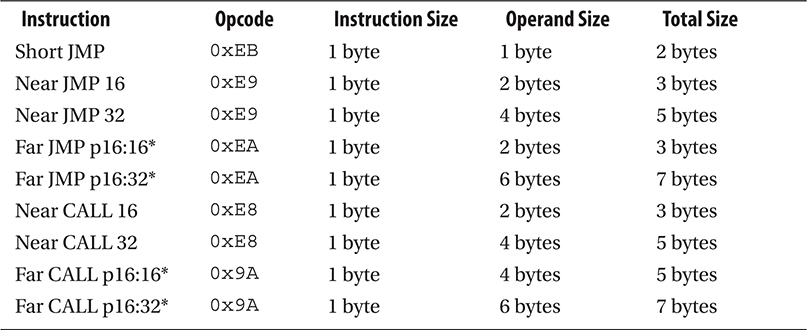
Table A-2 Lookup Table for Detour Detection
If you don’t understand all that, it’s okay. The code to achieve this is incredibly simple, but the explanation is not (as you probably realize by now). Spend some time digesting what we’ve discussed about x86 architecture in this section. Also, be sure to take a look at the 756-page Intel Programmer’s Manual, particularly Chapter 5 on memory protection mechanisms (http://www.intel.com/Assets/PDF/manual/253668.pdf).
Detection Methodology
Now that we’ve discussed some fundamentals, let’s get right to the crux of the issue. How do you detect a function prologue that has been overwritten and then resolve the address of the malicious JMP/CALL instruction?
The first step is to define what module and function you want to scan for detours. Your answer may vary based on your goals. For example, you may want to scan every single exported function in every loaded module (DLL, kernel driver, exe, and so on) in memory on your system. More likely, you’ll want to validate core system modules. To keep things simple, we’ll assume the module is ntoskrnl.exe and the function is SeAccessCheck(). We chose ntoskrnl.exe because this builds off of our SSDT detection code presented earlier (remember, we mentioned the next step after validation if an SSDT entry is not hooked is to check the function prologue for evidence of detours/patches). We chose SeAccessCheck() because the well-known rootkit MigBot (by Greg Hoglund) installs a detour in this function’s prologue. Thus, we’ll have a good test case to validate our code.
After you know the function/module you’re interested in, we’ll pass a pointer to that function to the detour-scanning routine, IsFunctionPrologueDetoured(). This routine will scan the prologue of SeAccessCheck, looking for a detour in the first 25 bytes. It will identify JMP/CALL routines using an open-source disassembler and then attempt to resolve the target of the instruction.
If, after all of that work, the calculated address of the JMP/CALL points outside the address space of SeAccessCheck()’s containing module (ntoskrnl.exe), then you should strongly suspect that this function has been patched/detoured.
Detour Detection Code
So now we’ll present the code to implement the detection technique discussed in the previous section. We’ll build off of the SSDT detection code presented earlier, which requires essentially the same data structures declared for the SSDT code, looping over the SSDT entries and then calling a new function, IsFunctionPrologueDetoured(), to test the first few instructions for a CALL/JMP. The main loop for iterating over the SSDT is shown next. We’ll then break out various code blocks to give a deeper explanation of the most important parts.
Note that the source code (prototype and definition) for some of the functions in the code snippets that follow are not included here for conciseness. However, the function names are self-explanatory, and we’ll point out the missing information in the comments as we go.
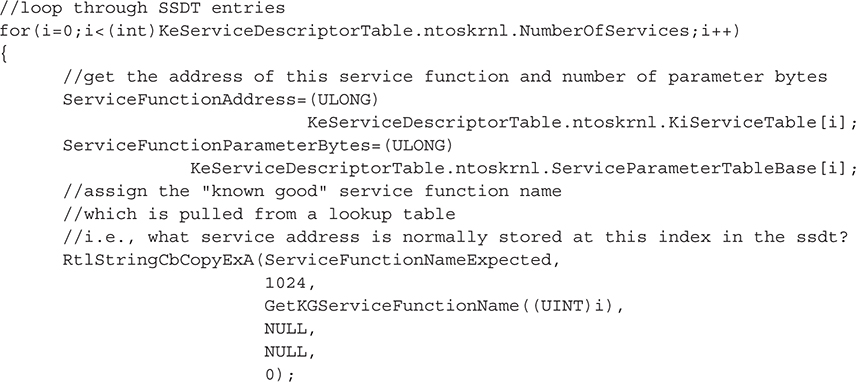
We should point out the distinction between these two variables: ServiceFunctionNameExpected and ServiceFunctionNameFound. The first variable is populated using a lookup table not previously mentioned. This lookup table contains all of the known indexes for system service functions based on Windows versions and service packs. The idea is that you know what function should be at any given index in the SSDT based on the current operating system version and service pack. This information can be gathered from any tool that can dump the SSDT table, such as WinDbg (we used the data available online at http://www.metasploit.com/users/opcode/syscalls.html with some custom PHP parsing scripts to download and format the lookup table into C code). By dumping the tables for all major Windows versions and service packs, we can build a simple lookup table to reference while looping over this particular system’s SSDT. Including this in the output is useful for showing, side by side, the differences in the expected SSDT entry and the actual SSDT entry.
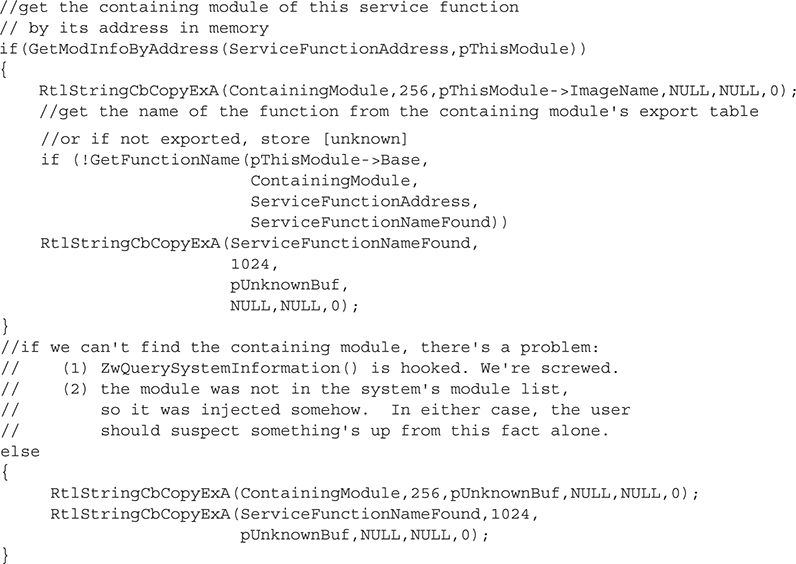
Here, we’re extracting the function name of the actual SSDT entry (i.e., the variable ServiceFunctionNameFound) by parsing ntoskrnl’s export table. Why do we have to do that? Because the SSDT doesn’t include the function name, only its address, parameter bytes, and index. So we take that address and attempt to find a corresponding export in ntoskrnl.exe. This is, of course, doomed to fail on a majority of the SSDT entries because most of these service functions are not exported by the kernel (although they are available for internal use by the kernel itself)!
The next step is to find out what module contains this function by attempting to find a loaded module in memory that contains the given service function address:
To determine if the given SSDT entry points to a detoured function, we’ll call IsFunctionPrologueDetoured(), which will be examined in more detail shortly:
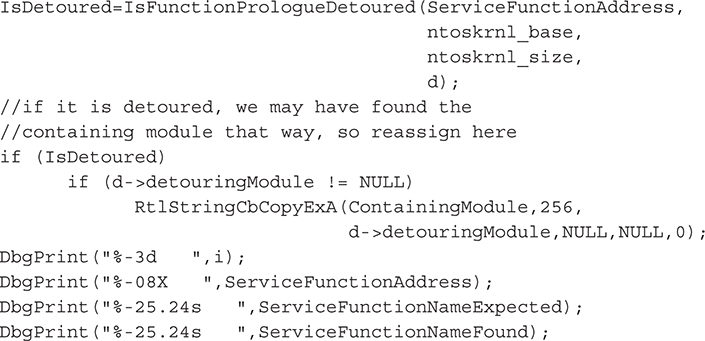
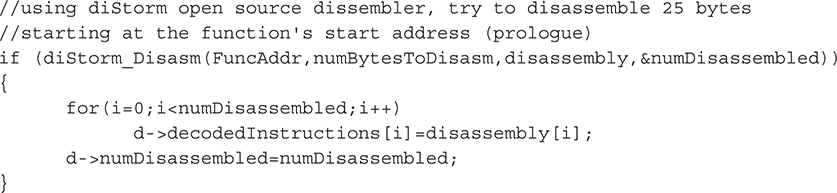
At this point, we have the SSDT information and our best guess as to whether the function has been detoured. When outputting this information, seeing the disassembly of the bytes we examined in the function that made us determine whether it was or wasn’t detoured is useful. This process is much harder than simple opcode checks (e.g., 0x9A is a CALL). In fact, the easiest thing to do is to incorporate one of the many superbly written x86 disassemblers from the open-source community. We chose Gil Dabah’s diStorm disassembler (https://github.com/gdabah/distorm)—let’s take a moment to thank the author of this incredibly lightweight and accurate dissembler! This free tool allows us to disassemble and display the first 25 bytes of the function prologue, which we use to determine whether the function was detoured:
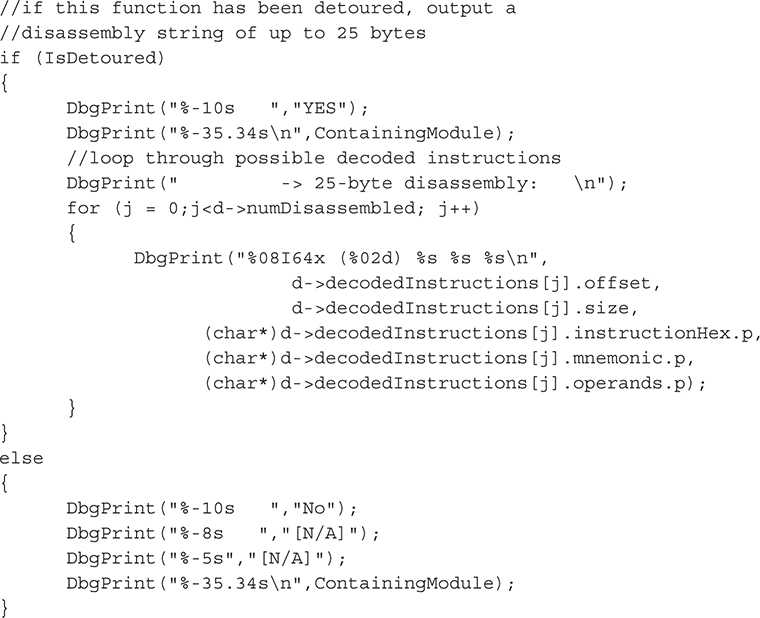
The main block of IsFunctionPrologueDetoured() is shown next. This function is called in the main loop of the previous function, as we loop through SSDT entries.
Now that we’ve disassembled the function prologue, we’ll parse the resulting information for any JMP or CALL instructions. The presence of such an instruction in a function’s prologue could be evidence of a detour by a malicious module. To eliminate any false positives, any detour that remains within the module’s address space is considered benign.
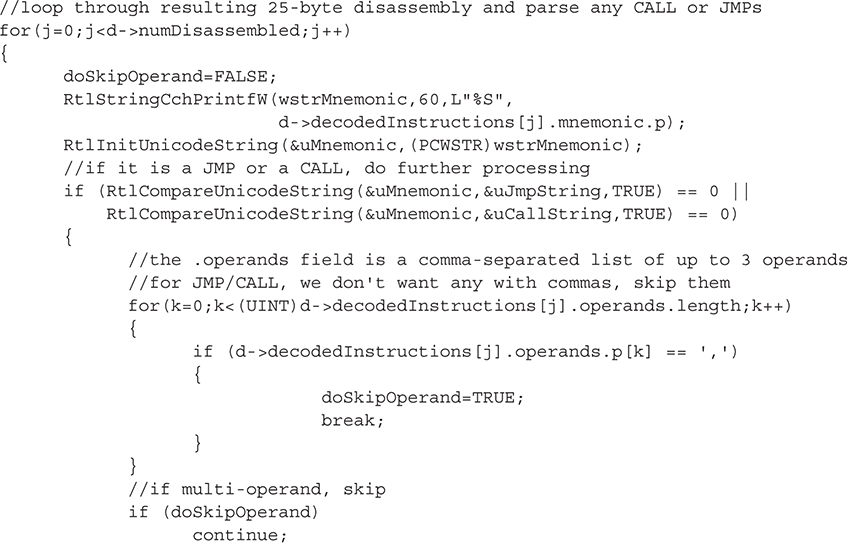
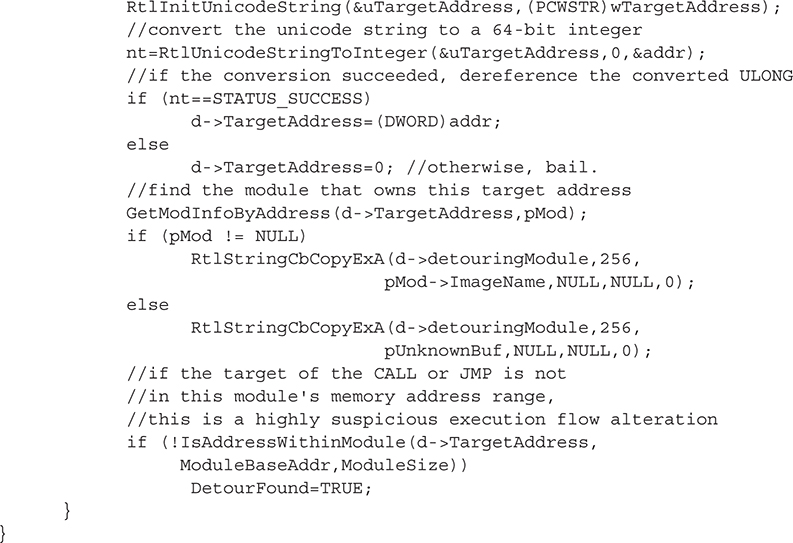
The code we’ve just illustrated shows you how to validate that the system service functions listed in the SSDT have not been detoured.
The output shown next is from our driver (written in C). To obtain the output, we issued DbgPrint() commands in our source code and captured it in WinDbg as we debugged the operating system in a Virtual Guest OS using Oracle’s Virtual Box free software.
An abbreviated output listing is shown here:
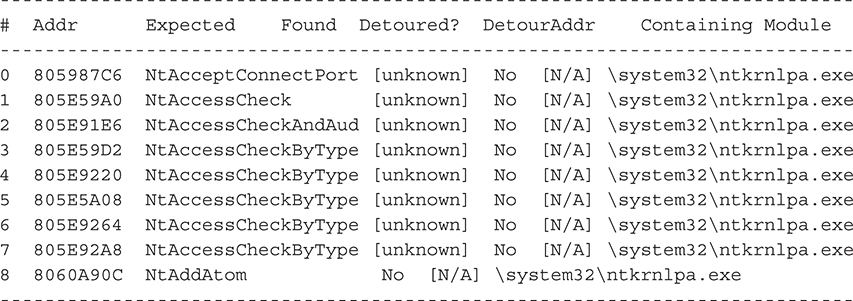
Note how many of the “found” functions are listed as [unknown]: this means those functions are not exported by the kernel. The first exported function in the SSDT is NtAddAtom().
To quickly test this code, we’ve installed the Migbot rootkit, which writes a detour in SeAccessCheck’s prologue (part of ntdll.dll). To test for this detour, we wrote a short routine, LookForMigbot(), using the capabilities discussed previously.
If the reader wishes to test this code, Windows XP (no service pack) must be used, since the Migbot rootkit first validates that the SeAccessCheck function is from this version of Windows before it will operate.
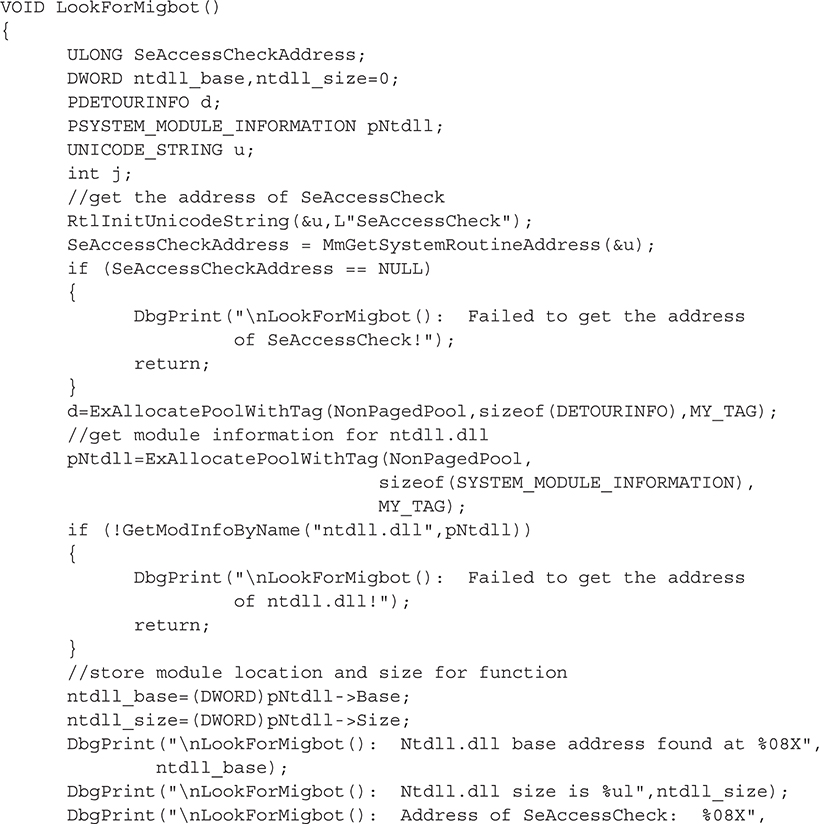
This function performs the following tasks:
• Obtains the address of SeAccessCheck using MmGetSystemRoutineAddress().
• Finds the base address and size of ntdll.dll (which contains SeAccessCheck).
• Calls IsFunctionPrologueDetoured() with the function address, module base address, module size, and a DETOURINFO structure to be filled with detour information.
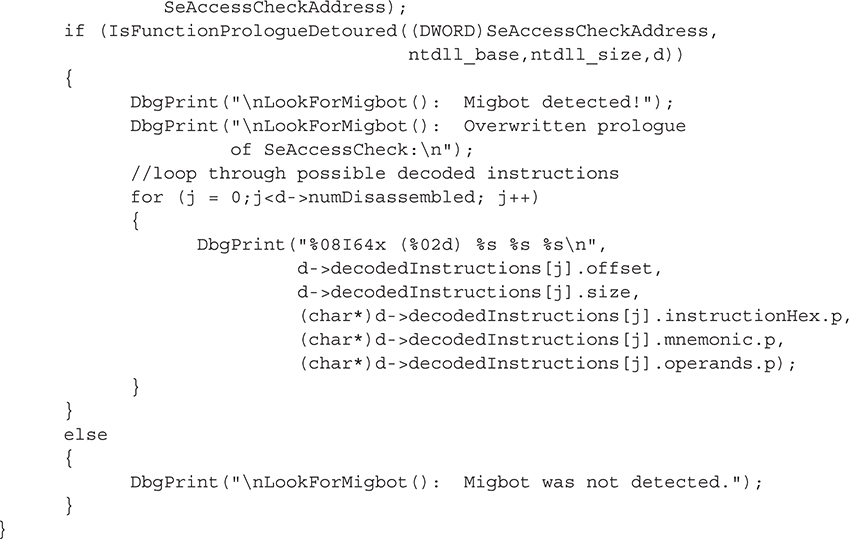
The output from the previous function from a clean system is shown here:
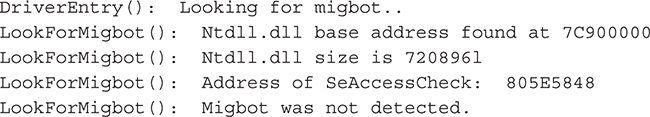
Running Migbot’s migloader with no arguments patches SeAccessCheck (and NtDeviceIoControlFile) and prints out the overwritten bytes:

After running the detection routine, the output shows that the SeAccessCheck function prologue has been overwritten with a Far JMP to Migbot’s own detouring function (highlighted in bold):
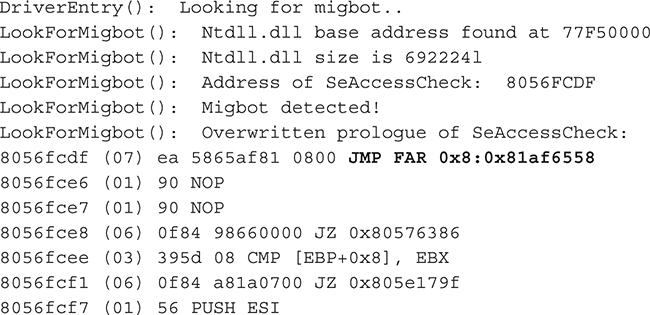
Note the notation of the intrasegment Far JMP is consistent with the concepts regarding x86 segmented memory explained previously in this appendix. The corresponding C code in the Migbot driver exactly matches this output (except 0x11223344 is dynamically altered as was explained), including the two NOP instructions at the end of the overwrite (0x90 opcode):

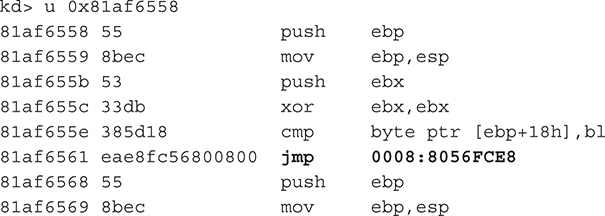
If we disassemble the target address of the Far JMP (0x81af6558) in WinDbg, we’ll see the contents of the rootkit’s detouring function named my_function_detour_seaccesscheck():
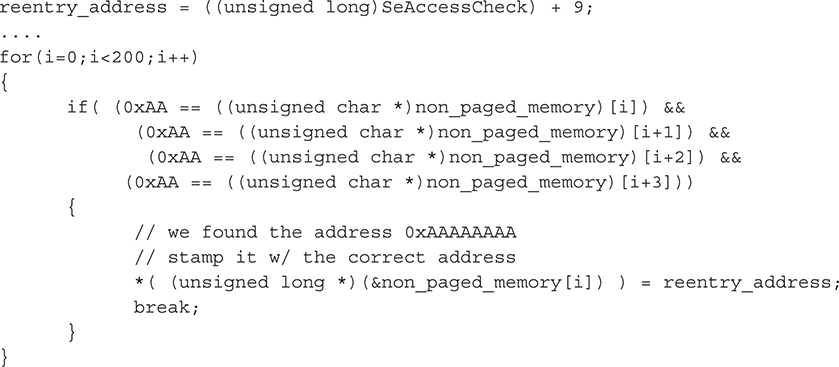
Note the match in the Migbot driver’s source code:
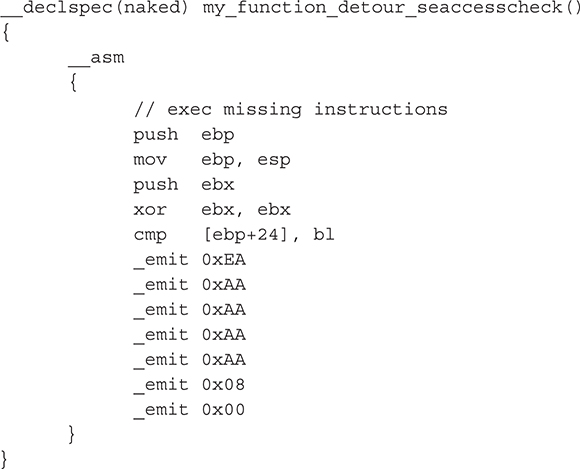
And again, the rootkit dynamically overwrites the placeholder address 0xAAAAAAAA with the address of the place to jump back to when the rootkit’s own detour function has been called: 9 bytes past the start of SeAccessCheck (recall the 9-byte addition is to avoid an infinite loop). Indeed, we can verify that the rootkit “stamps” the correct address by adding 9 to the address of SeAccessCheck (from the output of our own detection code):
8056FCDF + 9 = 8056FCE8
The corresponding source code in the rootkit is
To wrap up, please remember this technique, as is the case with just about any heuristic technique, can cause false positives and is purely experimental. Any detected detour could be a legitimate operating-system hot patch. Further analysis should be conducted on the module that contains the patching code to see if it is signed or otherwise benign.
The Two Ps for Detecting IRP Hooks
Now that you know how to detect general hooking of pointers and patched/detoured code, the issue of IRP hooking decomposes to just another data structure to validate. Therefore, we’ll jump right into the code (no pun intended!).
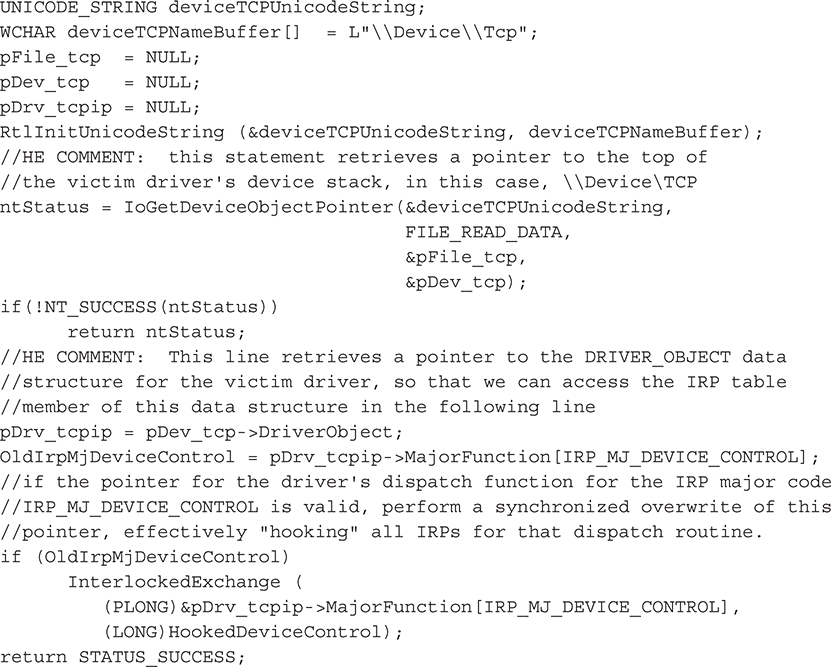
A list of loaded kernel drivers can be obtained with ZwQuerySystemInformation() as discussed previously. Once you have a list of loaded drivers, you simply need to pick one to validate. For the purpose of this section, we’ll use the TCP IRP Hook rootkit to show how the detection works. This particular rootkit hooks the dispatch routine for the IRP_MJ_DEVICE_CONTROL major function code of the driver that runs the operating system’s TCP/IP stack, TCPIP.sys. This function code is one of the most critical function codes, as it is the primary one used to communicate with user-mode applications. By hooking the entry for this function code in the IRP table of TCPIP.sys, IRP Hook essentially intercepts all network traffic from user-mode applications.
The IRP Hook source code for creating this pointer hook is shown here (we commented the source code by prefacing our comments with “HE COMMENT”):
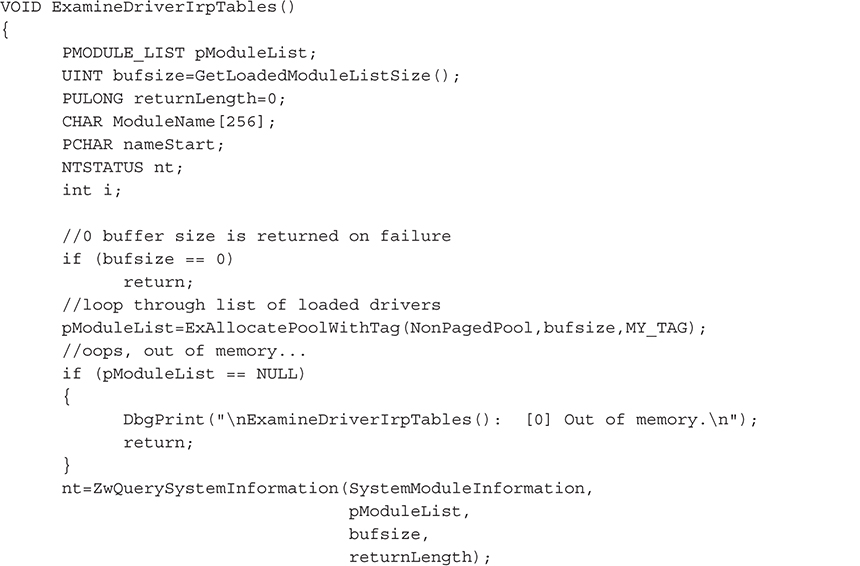
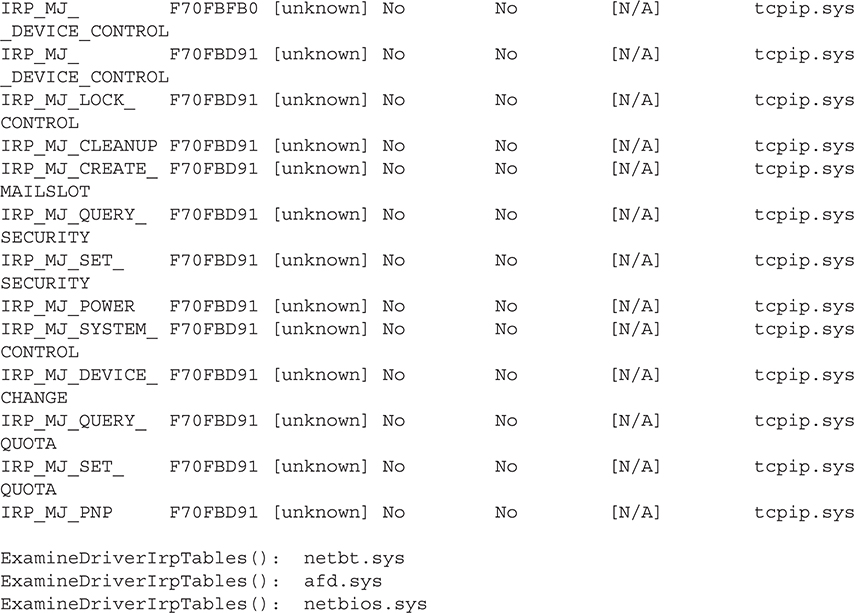
Our detection code simply combines the techniques for detecting pointer hooks and detour patches previously discussed. The code is called in the function ExamineDriverIrpTables(), which loops through the list of loaded drivers in kernel memory until it finds TCPIP.sys:
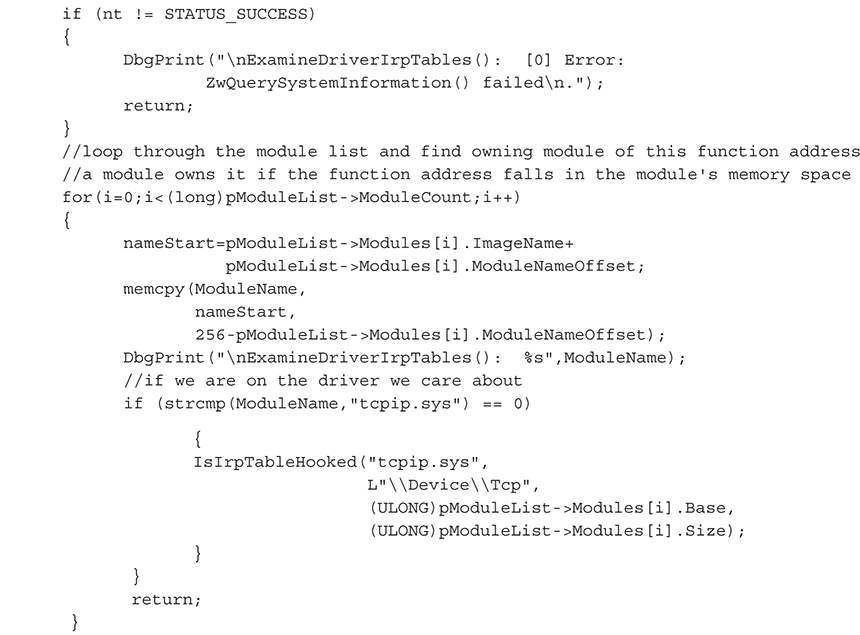
The source code for IsIrpHooked() is the same as the code for the SSDT hook/detour detection shown earlier, with one major exception: we are looping over the 28 major IRP function codes in the driver’s IRP table instead of looping through the ~270 entries in the SSDT table. With each iteration, we validate that the pointer references a memory location inside the driver.
This output shows the hooked IRP entry (bolded) after installing IRP Hook:
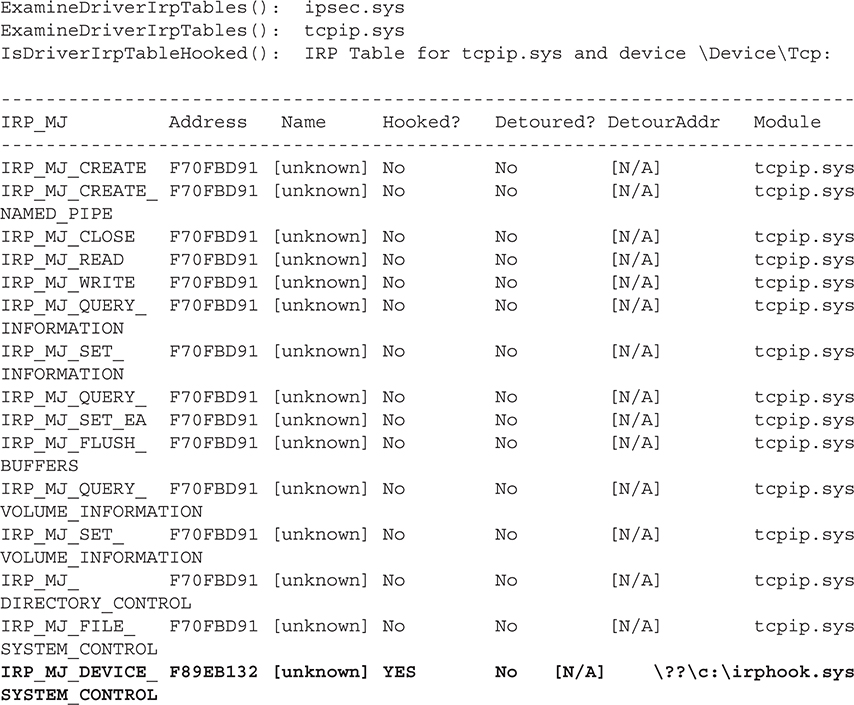
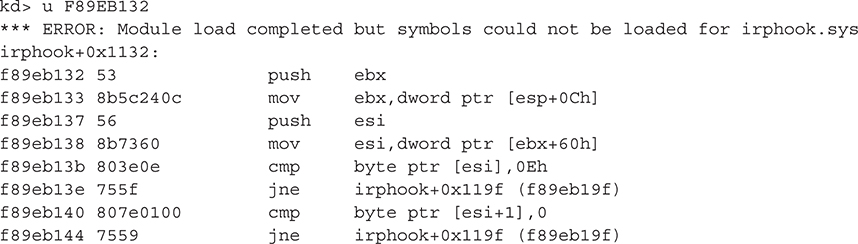
As expected, the IRP Hook rootkit has overwritten the pointer to the function that handles the IRP_MJ_DEVICE_SYSTEM_CONTROL function code with the address 0xF89EB132. Note that all of the other IRP dispatch handler functions point to the address 0xF70FBD91. Disassembling the former shows the disassembly of the first few bytes of the rootkit’s dispatch routine, which replaces the legitimate one inside TCPIP.sys:
It is important to note that we’ve just validated the driver’s IRP function handler table; the driver’s initialization, unload, AddDevice(), or other required routine could also be hooked. Those pointers should be validated as well.
The Two Ps for Detecting IAT Hooks
Validating an Import Address Table (IAT) of a given module involves walking the loaded module list of the target process and checking imports of all DLLs to make sure they point inside the given DLL. This method also combines the techniques we’ve previously shown. Therefore, we leave this as an exercise for you the reader to undertake, using the supplied code to detect IAT hooks.
Our Third Technique: Detecting DKOM
We’ve covered the two Ps detection method, and now we’ll turn to our third and final detection technique: detecting DKOM through handle inspection. In this section, the detection methodology only addresses variations of DKOM that attempt to alter kernel structures from user mode through modification of the section object \\Device\PhysicalMemory. The methodology will work against any type of rootkit that uses this section object, such as those that attempt to install a call gate and numerous other examples, some of which can be found at Phrack Magazine (http://www.phrack.com/issues.html?issue=59&id=16#article) and The Code Project (http://www.codeproject.com/KB/system/soviet_kernel_hack.aspx).
This form of DKOM will not work on systems beyond Windows 2003 Server Service Pack 1.
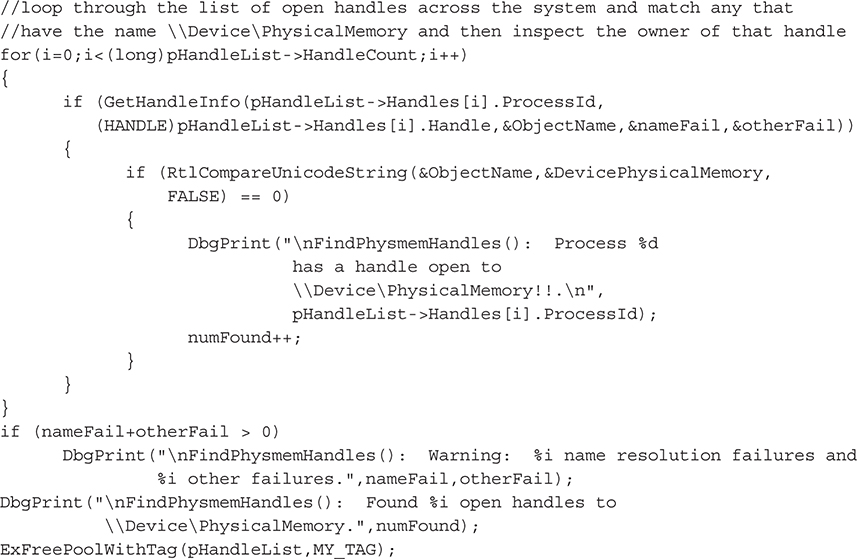
Because DKOM modifies data structures directly in memory, detecting the side effects of DKOM behavior is very difficult. Certain forms of DKOM rely on writing directly to memory from user mode using the section object \\Device\PhysicalMemory. Therefore, a rather rudimentary detection method is to examine the open handles for every process to see if a handle to \\Device\PhysicalMemory exists.
Every accessible resource in Windows is represented by an object, and all objects are managed by the Object Manager. Examples of objects include ports, files, threads, processes, registry keys, and synchronization primitives like mutexes, semaphores, and spinlocks. At any given moment, literally thousands of objects are being created, updated, accessed, and deleted synchronously and asynchronously. The Object Manager handles these operations on behalf of processes and threads that have open handles to the objects. An object is not freed/released until all threads and processes that have an open handle to it release that handle. This detection routine will obtain a list of such open handles and inspect the name of the corresponding object to see if it matches the string "\\Device\PhysicalMemory".
This query for open handles is just a snapshot in time, so the detection routine’s effectiveness is limited to whether the DKOM rootkit was active at the time the list of handles was obtained. A more reliable detection method would involve registering a kernel-mode callback routine that is notified by the Object Manager whenever a new handle to an object is created.
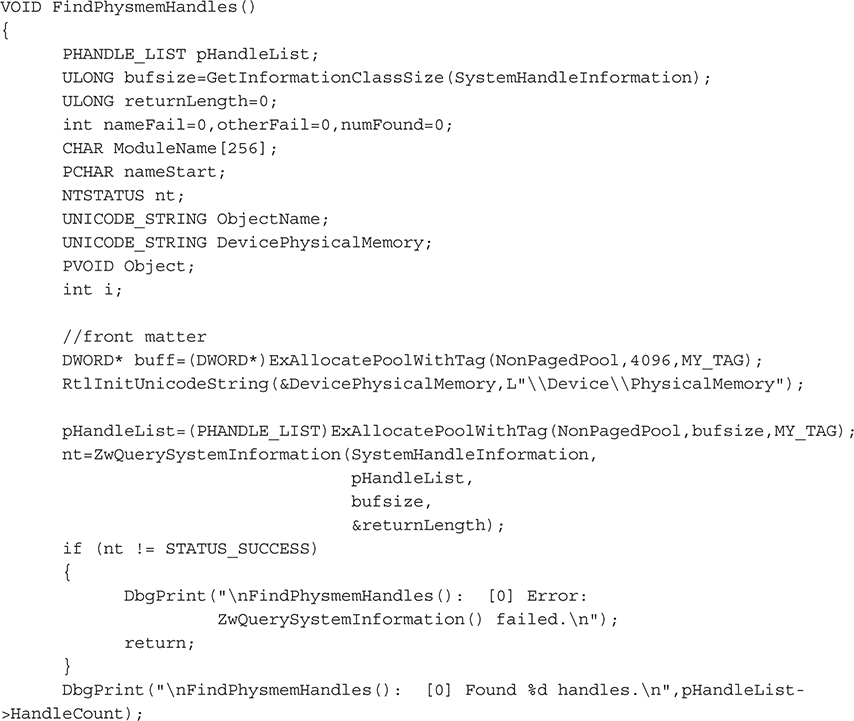
To accomplish this task, we’ve written a new function, FindPhysmemHandles(). This function simply enumerates the list of open handles, attempting to retrieve the name of the corresponding object for each open handle. If the name matches "\\Device\PhysicalMemory", this process has an open handle to this resource and is suspect.
The first task is to get a list of systemwide open handles using our old friend ZwQuerySystemInformation():
Next, we’ll loop over this list of open handles, searching for the required string:
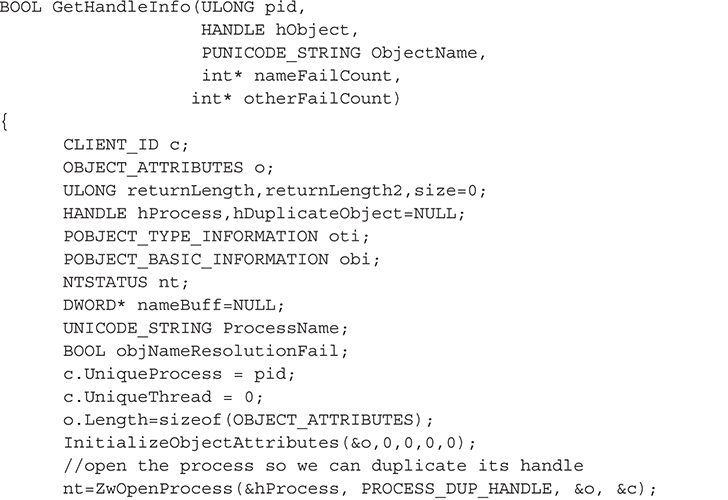
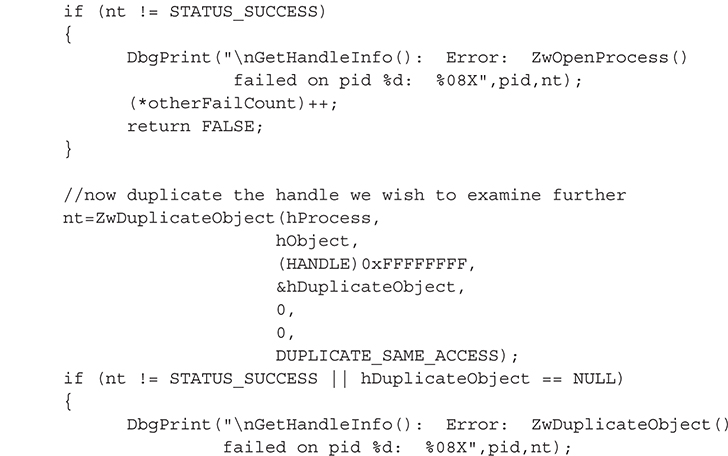
The core of this functionality is implemented in the GetHandleInfo() function, which takes the handle stored in a SYSTEM_HANDLE_INFORMATION structure (an array of such structures makes up the list of open handles obtained via ZwQuerySystemInformation()) and makes the corresponding object accessible to the process. This is necessary because any particular handle from the list of open handles means nothing in the context of the process; it is only valid in the context of the process that obtained the handle. Thus, we have to call ZwDuplicateObject() to make a copy of the handle in our process address space, so we can subsequently call ZwQueryObject() to obtain the object’s name. Here are the steps to make the object accessible to our process:
1. Call ZwOpenProcess() to obtain a handle to the process that owns the object to inspect.
2. Pass the handle of #1 to ZwDuplicateObject() to obtain an identical handle that is valid in the process’s context.
After this, we can obtain the object’s name:
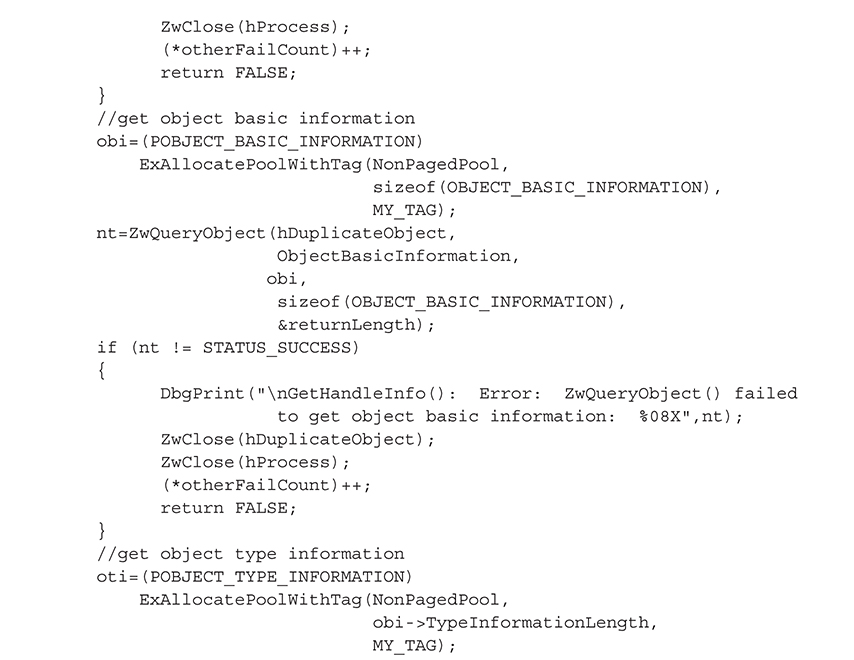
3. Call ZwQueryObject() to get basic information, specifically the size of the type structure.
4. Call ZwQueryObject() to get the type information using #1 size.
5. Call ZwQueryObject() to get the name information.
The code to accomplish these five steps is shown in the following GetHandleInfo() function:
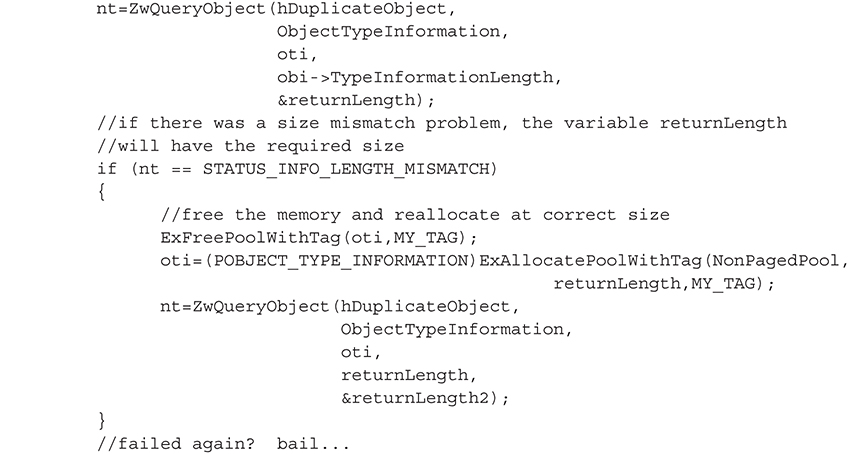
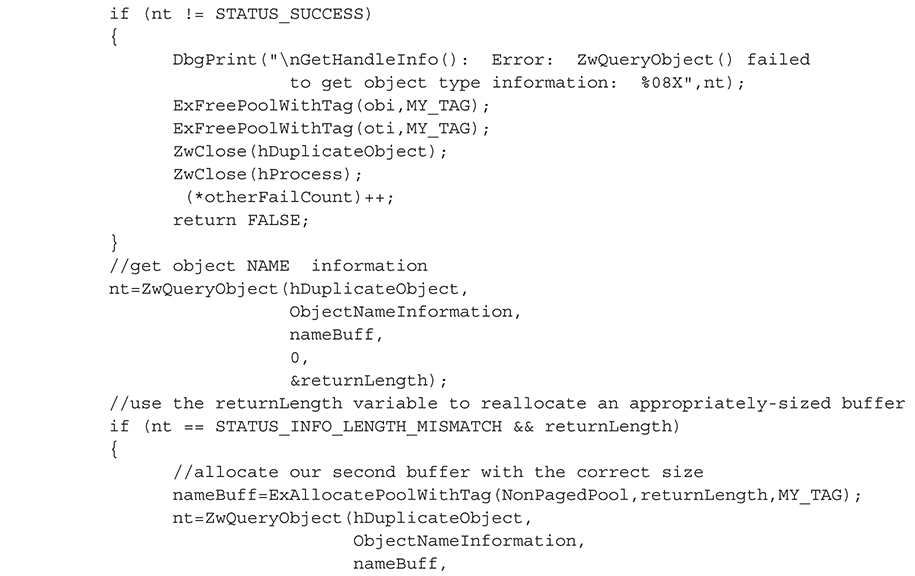
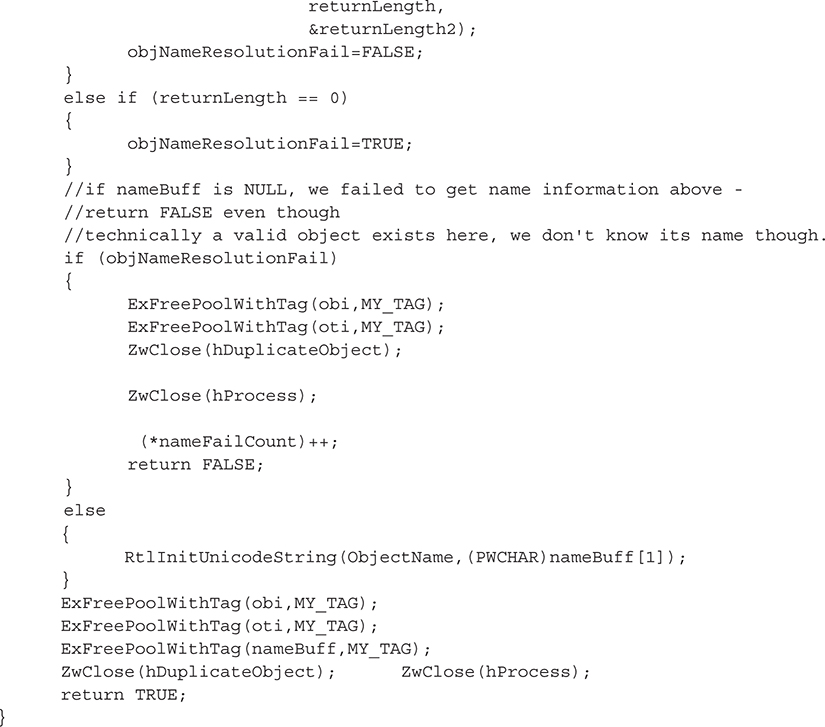
One more thing about the GetHandleInfo() function. Sometimes it will fail to retrieve the name of a successfully retrieved handle (our tests show that about 12 percent fail on average) for several possible reasons, such as insufficient access rights (the object may require special permissions), the object not having a name, or the object being released before we could complete our request. These are the unfortunate side effects of attempting to query a set of live objects. As mentioned previously, a more stable method would be to register a callback routine so you receive auto-notification of new objects. Note that without the object name, our detection method will fail.
Next, we’ll show how you can use this detection code to uncover the abuse of the \\Device\PhysicalMemory object using a rather obscure example called irqs (see http://www.codeproject.com/KB/system/soviet_kernel_hack.aspx). This example installs a call gate in user mode and then attempts to obtain APIC interrupt information through the call gate. It installs the call gate by mapping every physical page of RAM into its own process’s address space, searching for the physical address of the memory page that holds the Global Descriptor Table (GDT). Once this address is found, it writes a call gate into a new entry in the GDT. The call gate is subsequently used to collect the APIC interrupt information.
Our detection code also works for detecting other malicious methods, such as the PHIDE rootkit by 90210, which uses \\Device\PhysicalMemory to install a call gate from user mode to escalate privileges and hide processes and files.
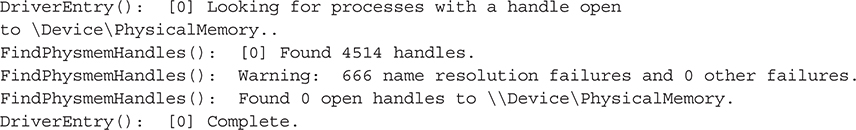
Output from our detection routine on an uninfected system is shown here:
After executing the irqs program, it begins to map physical memory addresses using the undocumented function NtMapViewOfSection(). This process is intensive and slow; therefore, we have plenty of time for executing our detection utility (remember, the target process must maintain an open handle to \\Device\PhysicalMemory for it to be detected). The following output excerpt illustrates our detection utility recognizing the open handle as the irqs program is running:
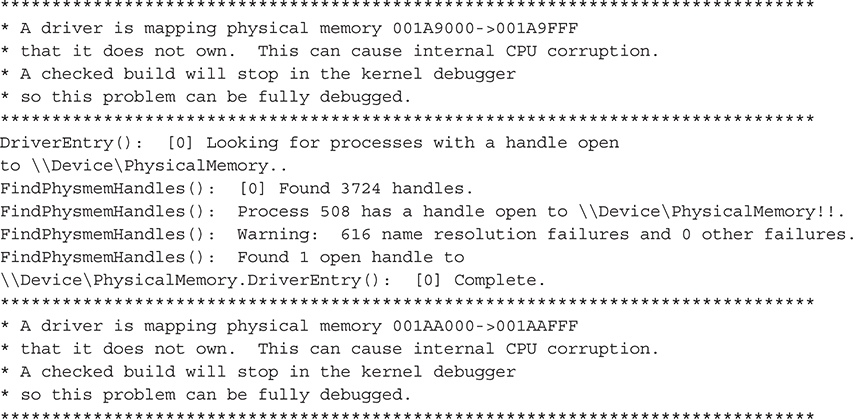
From the output, we can tell process #508 is using the section object. We can verify the identity of this process using WinDbg’s !process extension command and specifying the hexadecimal value of 508 (508 base 10 = 0x1fc base 16):
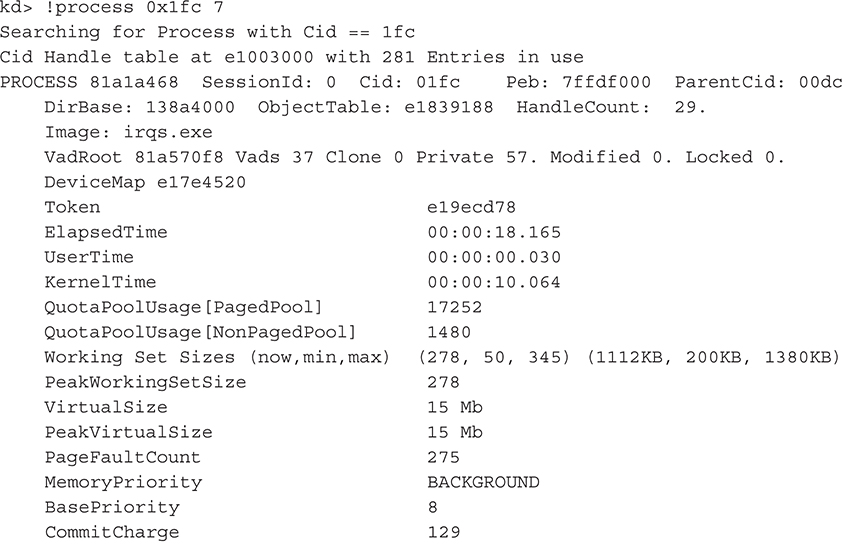
Note the debug messages enclosed in asterisks are sent from the kernel and refer to the irqs utility mapping kernel memory it shouldn’t have access to.
Sample Rootkit Detection Utility
We have released a tool called Codeword rootkit detection tool. Please feel free to play around with it. It can be found at https://code.google.com/archive/p/codeword/.