Table of Contents for
Practical Cloud Security
 Practical Cloud Security
Published by
O'Reilly Media, Inc., 2019
Practical Cloud Security
Published by
O'Reilly Media, Inc., 2019
- Cover
- nav
- Practical Cloud Security
- Practical Cloud Security
- Preface
- 1. Principles and Concepts
- 2. Data Asset Management and Protection
- 3. Cloud Asset Management and Protection
- 4. Identity and Access Management
- 5. Vulnerability Management
- 6. Network Security
- 7. Detecting, Responding, and Recovering from Security Incidents
- Index
- About the Author(s)
- Colophon
Chapter 7. Detecting, Responding, and Recovering from Security Incidents
By now, you know what your cloud assets are, and you have put some reasonable protections in place for them. Everything’s good, right? When you’re two thirds through a mystery novel and the mystery appears to be solved, you know the story isn’t over. It’s probably not a big surprise that you’re not done with cloud security yet either, since there are still pages left in this book.
All of the previous sections have dealt with identifying your assets and protecting them. Unfortunately, you won’t always be successful. In fact, in some organizations and industries, minor security incidents are a routine part of life! At some point attackers will almost certainly attempt, and sometimes succeed, in getting unauthorized access. At that point, the trick is to detect them as quickly as possible, kick them out, and do whatever damage control is needed. As part of this, it is helpful to understand what attackers often do and how attacks often proceed.
We’ve seen many high-profile breaches in the past few years. What often distinguishes a bad breach from a really bad breach — there are no good ones — is how long it took to detect what was going on and how effectively the victim responded. One study of 477 companies showed that the mean time to identify a breach was 197 days, and that companies that identified a breach in fewer than 100 days saved more than $1 million compared to those that took more than 100 days.1 Let’s see what we can do to detect issues and respond to them before they become disasters.
Differences from Traditional IT
Let’s look again at the shared responsibility model diagram, (Figure 1-9) from Chapter 1.
In a traditional environment, you had to worry about what was happening at every one of these levels. The good news about a cloud provider is that, as with other controls, intrusion detection and response are the provider’s job in the areas that are their responsibility. You could be affected by a breach at your provider, in which case you should be notified and may need to perform response and recovery activities specific to the services you’re using. However, in the vast majority of cases, all of your detection, response, and recovery activities will be in the areas marked “consumer responsibility.”
For the most part, you don’t get to see any logs from the levels that are the provider’s responsibility, although you can sometimes see actions the provider has taken on your behalf such as accessing your encryption keys. However, there’s a important new source of privileged user logs when using cloud: you can track things your team did using the cloud provider’s portals, APIs, and command line interfaces.
You will also not be allowed to touch the physical hardware in a cloud environment. Many incident response teams use a “jump bag” with forensic laptops, hard drive duplicators, and similar technology. Although you may still need such tools for dealing with incidents involving non-cloud infrastructure (for example, malware infections on employee laptops), you will need virtual, cloud-based equivalents of the “jump bag” tools for incident response in cloud. This also means that the forensic parts of cloud incident response can be done from anywhere, although there may still be significant benefits to being physically colocated with other people involved in the response.
What to Watch
Any system of reasonable size offers so many different logs and metrics that it’s easy to get buried in data that’s not useful for security purposes. Picking what to watch is very important! Unfortunately, this will necessarily be specific to your environment and application, so you really need to think about your threat model — what assets you have and who is most likely to attack them — as well as what logs come out of the systems in your asset management pipeline, discussed in Chapter 3.
As an example, if you have many terabytes of data, watching metrics on the volume of your network traffic and the length of connections might be very useful to spot someone in the process of stealing it. However, network traffic metrics like that won’t be as useful if you’re distributing software that you think someone may try to compromise with a backdoor. In that case, the volume of data, destination, and session length won’t change, but the content will be corrupted.
As another example, if you’ve paid for a specific tool such as antivirus, and have done the work to ensure that all of your cloud VMs are running it, it’s pretty silly to ignore it when it’s screaming that it has found something. When you see alerts from that tool, it may have successfully protected you from the entire attack. However, it may have only blocked part of the attack, or it may have only detected something suspicious but not blocked it. You need to investigate to see how the malware got on the system at all and whether the attack was fully blocked or not.
Once you have a threat model in mind, and a good idea of what components make up your environment, here are some good general starting points for what to watch. These are roughly in priority order, although of course that depends heavily on your environment. We will look at more concrete examples in the sample application at the end of the chapter.
For each of the following types of events, you need to make sure that the log entries enough contain data to be useful. At a minimum, this usually means when, what, and who — when the event happened, what happened, and who triggered the event. In some cases “who” might be a system or other automatic tool, such as when a system reports high CPU usage.
Warning
With one exception, you should never put passwords, API keys, sensitive personal information, protected health information, or any other sensitive data in logs. In most cases, not every individual who has access to the logs is authorized to see that information. In addition, having copies of sensitive information in more places than necessary increases the risk that it will be accidentally disclosed.
In fact, for privacy reasons, you should avoid directly logging personally identifiable data wherever feasible. If you need to be able to figure out who was referred to in logs, use a non-personally-identifiable unique ID, such as a GUID, and keep a table elsewhere that lets you correlate those GUIDs to the actual entity.
The exception to the rule about sensitive data in logs is session recording for privileged user monitoring, which may log passwords or other sensitive information. In this case, access to the session records must be very tightly controlled, but the benefit of being able to audit privileged users will often outweigh the risk of having secrets in those records.
Privileged user access
Almost everyone should be logging, and at least spot-checking, privileged user logins at all levels of their environments. Watching these can be a great way to trigger questions that lead to detecting malicious activity, such as, “Why is that person logging in at all?” or, “Didn’t that person leave the company?” or, “Does anyone recognize this account?”
Monitoring privileged user access doesn’t mean you don’t trust your administrators. In a perfect world, you wouldn’t have to place 100% trust in any single individual. Every task would end up with at least two people who knew about that task being performed, requiring collusion in order to perform tasks without being detected2. That level of diligence certainly isn’t necessary for all tasks in all organizations, although you should consider it for high value actions such as money transfers or access to secret data stores. What we’re mostly focused on here is detecting an unauthorized person pretending to be an administrator. Given that one of the most prevalent causes of security incidents is lost or stolen credentials, watching what your administrators are doing is a great way to catch someone pretending to be one of your administrators.
Cloud providers can keep good logs of when someone logged on as one of your administrators uses the cloud administrative interfaces (the web portal, APIs, or command line interfaces) and what they’re doing. Some examples can be logs such as “created an instance”, “created a database”, or “created an administrative user.” These logs may be collected by cloud services like AWS AccessTrail, Azure ActivityLog, Google Stackdriver Logging, and IBM Cloud Activity Tracker, but in some cases you have to explicitly turn on the logging feature, specify where and how long to retain logs, and pay for the storage.
In addition to privileged user logs collected by the cloud provider, administrators often also have privileged access to the systems created on cloud. For example, you may have administrative accounts on virtual machines, or on firewall appliances, or on databases. Access to these may be reported using a protocol like syslog or other means. You may also have other systems used by administrators, such as a password vault to check out shared IDs. Generally speaking, any systems used by administrators to perform privileged actions should log those actions for later inspection.
Administrative activity logs should be divided into two types, which I’ll label “toxic” logs and “sanitized” logs.
“Toxic” logs might contain sensitive information in them, such as passwords and API keys that could give an attacker direct access to the system. You may not have any toxic logs in your environment. In general, toxic logs should be accessed only during a suspected incident, or by a small, monitored team that regularly spot-checks administrative sessions. When toxic logs are accessed, that should also send some form of notification so that at least two people know the toxic logs were accessed. Some examples of toxic logs are:
-
Secure shell session logs or other logs showing commands and options
-
The exact commands executed by admins on virtual machines via a cloud provider feature, such as “AWS Run Command”, unless you have some way to keep secrets from being logged with those commands
-
The exact commands executed by admins on containers, such as those beginning with “kubectl exec”, unless you have some way to keep secrets from being logged with those commands
“Sanitized” logs are specifically designed not to contain secrets. The vast majority of logs should fall into this category. Some examples of sanitized logs are:
-
Actions that the admin performs via a cloud API or the cloud provider console.
-
Actions that the admin performs on the Kubernetes console, such as deploying a new application or authorizing additional users.
-
Successful and failed authentication and authorization attempts for any of the components in the system. For instance, if an administrator successfully logs into the cloud console but is not allowed to create a resource there, both events should be logged.
Logs from defensive tooling
If you have defensive tools discussed in previous chapters, such as antivirus, firewalls, web application firewalls, intrusion detection systems, or network monitoring tools, you need to be looking at the logs that these produce. You can’t be certain that those tools will be 100% effective in preventing all attacks. In some cases, the tools may block the initial attack and let a subsequent attack through, or may only log that something happened without blocking the attack. You need to collect and analyze the logs from these services, or you may be giving up a big early warning advantage.
The problem is that some of these tools are necessarily “noisy” and have a high percentage of false positive alerts. Don’t underestimate the risk of false positives! It’s very easy to train yourself and your staff to ignore alerts that may actually be important. You need a feedback loop that when a false positive is shown to people, they have a way to try to either filter out specific logs from processing altogether, or tune the system so that those don’t produce false alerts as often. This is an art, of course, because you run the risk of filtering or tuning out a true positive, but in most cases you should accept a very small risk of tuning out true positives to avoid ignoring the alerts altogether. Just as you should have multiple layers of protection, you should also have multiple detection layers so that you’re not dependent on only one tool to detect malicious activity.
The logging recommendations for most defensive tooling in cloud environments is very similar to on-premises environments.
Anti-DDOS
Systems used to defend against denial-of-service attacks should be configured to alert on attacks, because they may escalate over time or indicate that an extortion attempt is likely. In addition, in some cases a DDOS attack can be a smokescreen to cover up other breach activity, although there is disagreement as to how common this is.3
Web Application Firewalls (WAF)
Both distributed and centralized WAF solutions can alert on attacks that were blocked or on requests that look suspicious. These alerts can be useful to understand that an attack against your web applications was attempted.
Tip
WAFs are often used in lieu of avoid manual code reviews for PCI DSS certification. As part of that, you’ll also need to show that you’re retaining and analyzing the logs from the WAF systems.
Firewalls and Intrusion Detection Systems (IDS)
Internet-facing firewalls and IDS will need to be tuned fairly low for alerting, because systems exposed to the Internet are under constant low-grade attack such as port scans and password guessing. However, the historical data provided by these systems may be of use when an incident is suspected.
On the other hand, a firewall or IDS deployed inside your perimeter should be tuned to be fairly sensitive, because alerts here are probably indicative of misconfiguration or an actual attack. Aside from other defensive tools, which can be whitelisted so that they don’t cause alerts, nothing else should really be scanning your inside network or causing failed connections.
In this same general category are “network traffic analysis” systems, which typically aggregate flow data from routers and switches to give an overall picture of how data is moving in, out, and through your environment. These can also be configured to send alerts that might indicate something wrong.
Antivirus (AV)
Ensure that you will get alerts if any in-scope systems in your asset management system aren’t running AV, and if any malware is found.
Note that if a vulnerability is exploited by an attacker to get in, the first step usually involves dropping some malware on your system. If the attacker is smart, they’ll make sure the malware they use is custom enough not to trip any antivirus software you have in place. Attackers can use services or have labs to run malware through every piece of AV software available to make sure their malware isn’t detected. Fortunately, not all attackers are that smart, and it’s still very helpful to catch the dumb ones. You must be careful not to reject tools just because they’re not 100% effective!
Note
In the infamous 2013 Target breach, one of the mistakes was not responding to the alerts from the anti-malware software.
Endpoint Detection and Response (EDR)
Where traditional anti-malware software focuses primarily on blocking malicious activity, EDR software is more focused on allowing teams to investigate and respond to threats that have gotten through the first line of defenses. If antivirus is like the flame-retardant materials, EDR software is like the smoke detector and sprinkler systems.
This is typically done by recording lots of information about the running systems — such as hash values of each executable or library that has run on the system, or a history of what network connections were attempted or made. While some of this information may be obtained via operating system or network logs, EDR software can accumulate it all in one place easily. There, it can be associated with threat intelligence feeds, such as newly discovered command and control servers or newly reported malware signatures, to detect both current and historical activity. Some EDR software can also be used to quarantine and investigate systems when an attack is identified.
While these capabilities are often used interactively by a response team, EDR solutions can also send alerts when threats are discovered in your environment, so they overlap somewhat with antivirus software.
File Integrity Monitoring (FIM)
Some files shouldn’t change regularly, and if they are changed, that might be evidence of an attack. For example, if someone modifies the configuration of the logging system, that’s suspicious. In fact, on a Linux system, most changes to the /etc directory tree should be viewed with some suspicion.
FIM software can alert when specific files are changed, and some products also allow you to alert when certain Windows registry entries are changed. Some cloud providers offer File Integrity Monitoring capability as part of the IaaS cloud management platform. There are also free and paid versions of FIM products that you can deploy to your systems.
Tip
File integrity monitoring is explicitly required for PCI DSS certification, and some auditors may require it to cover not only flat files but also changes to the Windows registry.
Cloud Service Logs and Metrics
In addition to logging administrator actions, most cloud providers also offer useful logs and metrics about their services. Browse through the logs and metrics available for the cloud services you’re using, and think about which ones might go haywire in an attack and/or be useful for figuring out how bad things are after the fact. Some examples:
-
CPU usage metrics. Spikes in CPU usage not explained by increased usage might indicate active ransomware encryption or cryptomining.
-
Network logs and metrics. For example, if you are using Virtual Private Cloud subnets, many cloud providers can provide metrics on the data passing in and out of these subnets, as well as flow logs showing accepted and denied traffic. Denied traffic when the source is your own component indicates either a misconfiguration or an attack, and should be investigated. Spikes in network traffic might indicate that a denial of service attack is beginning or that an attacker is actively stealing data.
-
Storage input/output metrics. A spike in I/O not explained by increased usage might indicate active ransomware, a denial of service attack, or an attacker in the process of stealing data.
-
Metrics on requests to platform components, such as databases or message queues. If your database starts going crazy, that may be an indication of an attacker stealing large amounts of data. If your message queue starts going crazy, perhaps an attacker is in part of the system and is attempting to send messages to other components.
-
End-user logins and activity on software-as-a-service offerings. A user who starts pulling down huge amounts of data from a cloud storage service could be an indication that the account is compromised. If you’re using a Cloud Access Security Broker (CASB) to mediate access to a cloud service, it may also generate more detailed events related to user activity that you can monitor.
-
Each platform service may have logs and metrics that are useful for detection and response in addition to operational monitoring. For example, if you’re using an orchestration platform such as Kubernetes, you can turn on auditing. A Kubernetes documentation page on Auditing explains how to turn on audit logging for Kubernetes and how to direct those logs to a collection point. Similarly, object storage, databases, and other cloud services have service-specific logs and metrics.
Operating System Logs and Metrics
If you are running virtual machines or bare metal machines in the cloud, the security of the operating system is generally your responsibility, and this includes collecting and analyzing logs. This is almost identical to on-premises infrastructure:
-
The CIS Benchmarks list a reasonable base set of events to log for many different operating systems, products, and services that you may have in your environment.
-
If you’re using Microsoft Windows, Microsoft provides some good information about event IDs to monitor. For example, a fairly common type of attacks is a pass-the-hash attack, and a documentation page provides information about specific events IDs to monitor in order to spot that attack.
-
If you’re using Linux, many Linux operating system vendors provide instructions on how to enable audit logging to meet different industry and regulatory requirements. Even if you don’t have to comply with those requirements, the instructions can be a useful starting point for what to log and analyze in your environment.
-
Metrics such as memory usage, CPU usage, and I/O can be very useful to security teams as well as operations teams.
Middleware logs
If you’re running your own database, queue manager, application server, or other middleware, you may need to turn on logging and metric collection. In addition to any privileged user activities discussed earlier in “Privileged user access”, you may be able to alert on all access to sensitive databases that originate from anywhere except the legitimate application ID or system, or access to specific tables, or other alerts useful for tracking access to sensitive data.
Secrets Server
If you’re running a secrets server, as discussed in Chapter 4, you should log all access to secrets. Some examples of unusual activity that you may wish to alert on and investigate include:
-
Authentication or authorization failures on the secrets server, which may indicate an attack
-
An unusual amount of activity for secrets retrieval
-
The use of administrative credentials
Your Application
If you’ve written a custom application or are running a third party application, it may produce its own logs and metrics that would be useful to both operations teams and security teams. For example, a banking application may log all transfers, and transfers over a certain threshold might generate an alert.
How to Watch
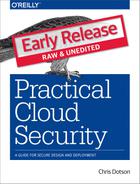
Now that we’ve covered what types of events and metrics might be good to watch for your environment, let’s look at how to effectively collect and use them to detect and respond to intrusions. Figure 7-1 shows the different steps in this process. These steps may all be done by a single product or service, such as a SIEM, or by multiple products and services acting together.
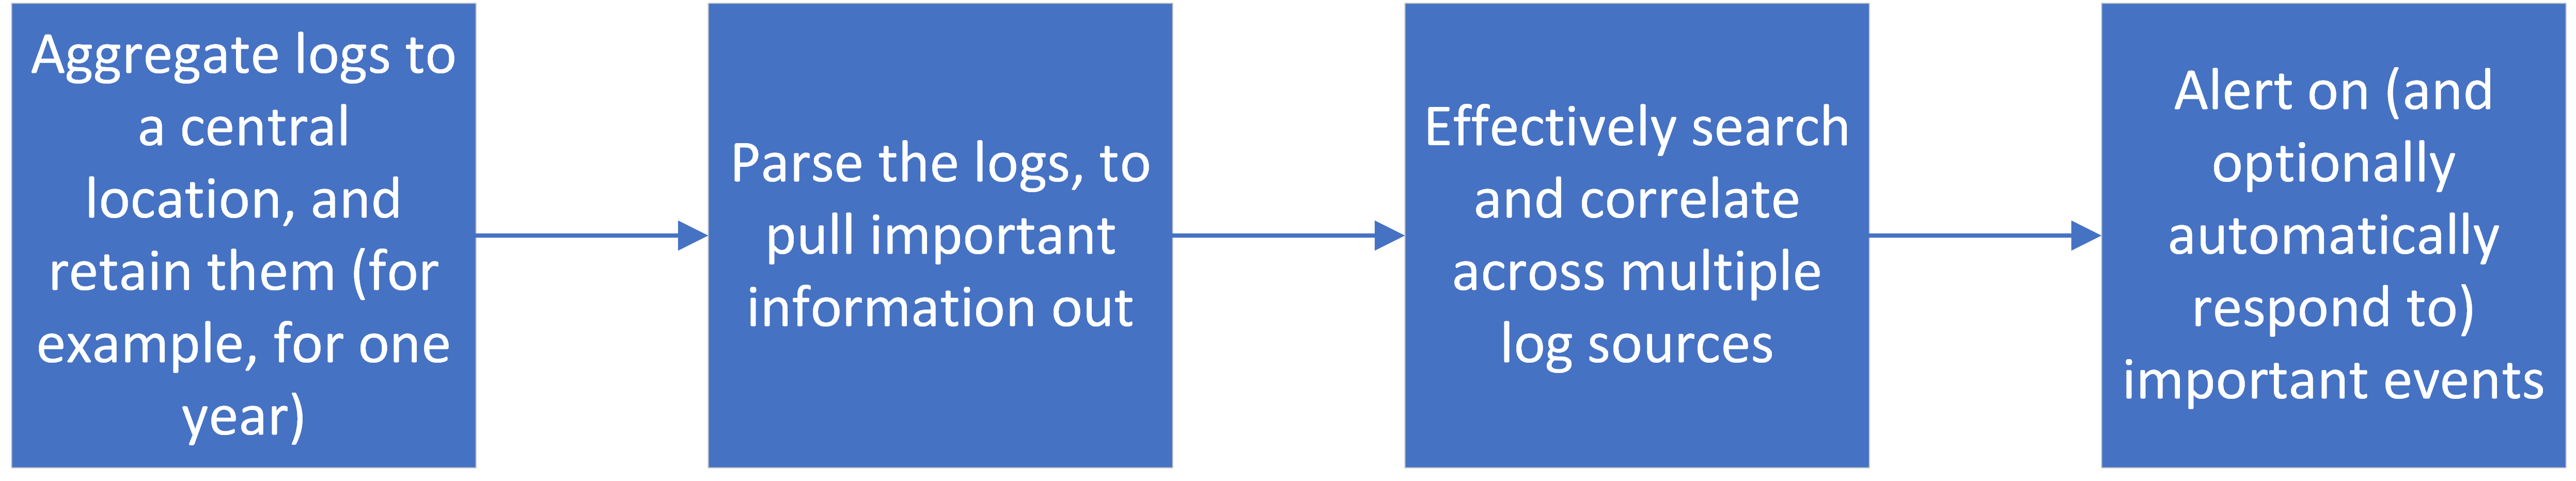
Figure 7-1. Logging and alerting chain
Tip
Make sure the time is synchronized on all of your systems, generally by using Network Time Protocol (NTP). In addition, make sure either that all timestamps contain time zone information, or that you use the same time zone (such as GMT) for all logs. This is usually very easy to configure, and it can be a nightmare to correlate events between different log sources when the system clocks or time zones are off.
Aggregation and Retention
All of the logs described earlier need to be stored somewhere and kept for a minimum length of time. While allowing logs to collect on various different systems is far better than no logs at all, it’s far from ideal. Individual system disks may fill up, causing loss of logs and operational problems, and an attacker who gets into a system can erase the logs to cover his tracks. Plus, it can be very slow and inconvenient to get into dozens of different systems to search logs and pull together a picture of what’s going on.
In the past, important logs would often be printed onto paper and shipped to a physically secure location. While that’s a pretty safe way of securing them and making them uneraseable by computer, paper has some pretty big drawbacks — it’s not searchable by automation, it’s heavy, it’s expensive, and it’s a fire hazard.
In the cloud, you can get many of the same benefits much more easily by locating your log aggregation service in a separate cloud account with different administrative credentials, so that the logs can’t be wiped out by someone with access to the primary systems. (This is also a good idea for backups, as discussed later.) Most cloud providers have services that can aggregate, retain, and search logs so you don’t have to set up log aggregation from scratch.
Tip
You should retain most logs for at least one year, but longer retention periods can sometimes be helpful for investigating security incidents. If you’re subject to any industry or regulatory standards, look at the specific retention requirements for those logs, but one year is usually sufficient.
Once you have all of your logs and alerts in a central, secure location with the proper retention period, you need to tackle the problems of looking through those logs to alert on suspicious behavior, and of making sure the alerts get to the right people and are acknowledged and investigated.
Parsing logs
Once you have the logs aggregated in a safe place, congratulations! A determined human can eventually go through all of those logs and get answers to important questions, although it may take a while. However, one of the primary motivations for inventing computers was to process data much faster than humans can.
Log parsers pull specific pieces of information (fields) out of the different types of events. Some examples:
-
For an operating system event, the parser will recognize the timestamp, the name of the system generating the event, and the event text. Further parsing may happen on some types of events; for example, for a failed login type of OS event, the parser can also recognize the IP address from which the login was attempted.
-
For firewall logs, the parser will recognize the timestamp, source IP address, destination IP address, and accepted/denied result.
-
For antivirus logs, the parser will recognize the timestamp, hostname, and event details such as a failed update or the discovery of malware.
Unfortunately, there are thousands of different log formats. There are a few common event log formats that make parsing a little easier, however. Many tools can parse logs in these formats into specific fields, although that doesn’t always mean the fields are useful. Some examples:
-
Syslog. The term “syslog” can be confusing because it is often used to refer to a program to accept syslog messages, a network protocol (usually running over udp/514 or tcp/514) and a format for lines in a log file, although “format” is a little generous. There are a couple of popular syslog formats (RFC 3164, which is a collection of things seen in the wild, and RFC 5424, which is more prescriptive). Typically, a syslog record will contain a timestamp, the name of the system generating the message, the type of process sending the message, a severity level, and a mostly free-form message. It’s often up to the parser to figure out what generated the free-form message and perform further parsing on it.
-
Common Log Format and Extended Log Format are primarily used by web servers to log requests.
-
Common Event Format, or CEF, is an extension of syslog format, primarily used by MicroFocus ArcSight, that provides additional structured fields.
-
CADF is the Cloud Audit Data Federation standard for logs by cloud providers, intended to allow switching between cloud providers without changing the log aggregation and parsing systems.
Searching and Correlation
Once the logs are aggregated and parsed, you can search based on the parsed fields and correlate events between different systems. For example, you can search for all login failures during a certain time period, all cases where a successful login happened without a VPN connection for the same user, or malware detection followed by a login.
The ability to perform quick searches across multiple different log sources and types of logs can be invaluable during incident response. Test the ability of the system to quickly perform multiple searches by many frantic people before you’re in the middle of a security incident!
Note
Many systems have the idea of “hot” and “cold” storage. Hot storage can be queried instantly, whereas cold storage may need to be retrieved and reloaded before it can be searched.
Alerting and Automated Response
When an automated system sees something a human should look at, it raises an alert (occasionally called an “offense”), and in some cases may automatically respond by disabling access or shutting down a component. Alerts may be based on certain events, on correlations of events happening that shouldn’t happen at all, or by reaching certain thresholds.
This is really where the art lies in log analysis. If the system is tuned so sensitively that your security team is constantly getting false alerts, all of the alerts will quickly be ignored. On the other hand, if you’re not getting at least some alerts regularly, you’re probably not following up on some things that you should. You need a feedback loop for each type of false alert to determine whether it makes sense to filter out those types of events, raise thresholds, or take other actions to reduce false alerts. Consider running periodic tests that you know will generate alerts, to ensure that they’re not ignored.
There are some alerts that you should almost always follow up on, however. Multiple login failures for privileged users, malware found on systems, and other alerts that may be precursors of a security incident should at least get a look, even if they’re usually false alarms.
Don’t forget that you need also to have alerts when logs stop flowing. That’s a security issue too! In many cases, it just means something is malfunctioning, which might prevent you from seeing a future problem. In some cases, however, it might actually be an indicator of an attack in progress.
Automated response sounds great in principle, but it really has the potential to disrupt your business. In addition to outages caused by an incorrect response or an automated overreaction, automated response systems can also be deliberately leveraged by attackers to cause outages. It’s not fun to realize that you’ve spent a considerable amount of money to prevent denial of service attacks, only to intentionally enable an attacker to conduct an easy denial of service attack using a simple port scanner or a few failed logins. Some environments have high enough security requirements that you’re willing to take an outage rather than accept even a small risk of letting a possible attack continue until a human can investigate, but in most cases the operational and security risks have to be balanced more closely.
Alerting shouldn’t be a “fire and forget” activity. You often need a way to rotate different individuals in and out, because nobody wants to be on call all of the time, and you need some way to ensure that an alert is acknowledged within a certain amount of time or escalated to someone else to handle. There are cloud-based services for everything, and alerting is no exception. In most cases, the same system can be used for both operational response and security response activities.
Larger organizations will usually either build a system or contract with a managed security service provider (MSSP) for a 24x7 Security Operations Center (SOC) to monitor and respond to alerts. A room with lots of screens displaying important looking graphics is optional, but is impressive looking to your C-suite management and customers, and can help present important information quickly in an urgent situation. In many cases, organizations use a hybrid model where some of the lower-level monitoring and alerting is performed by a MSSP, and the more important alerts are escalated to in-house staff.
Modern systems can produce billions of log events. We can probably use even more automation to help deal with them, and this is where a SIEM can come in handy.
Security Information and Event Managers (SIEMs)
A SIEM can perform some or all of the steps described in the previous sections. For example, you may have your SIEM aggregate logs, or you may instead have a separate system aggregate and filter logs, and feed only a subset of them to the SIEM. Because many cloud providers have lower-cost, high volume log aggregation services, and because logs are often used for operational troubleshooting in addition to security incident detection and response, many organizations have a cloud log aggregator feed security-relevant events into the SIEM.
SIEM rules can be used to detect potential bad behavior, sometimes by correlating events that happened in two different places or against historical data. Here are some questions that might be raised by a properly configured SIEM, or by a security operator viewing SIEM alerts:
-
“Database traffic is up 200% from the monthly average. Maybe the application is just really popular right now, but is someone is systematically stealing our data?”
-
“We just saw an outbound connection to an IP address that has been used by a known threat actor recently, according to this threat intelligence feed. Is that a compromised system talking to a command-and-control server?”
-
“There were 150 failed attempts on an account followed by a success. Is that a successful brute force attack?”
-
“We saw a single failed login attempt on 300 different accounts followed by a success on account #301. Is that a successful password spraying attack?”
-
“A port scan was followed by a lot of traffic from a port that hasn’t been used in months. Port scans happen all the time, but perhaps a vulnerable service was found and compromised?”
-
“John doesn’t normally log in at 3:00 AM ET, or from that country. Maybe that’s not really John?”
-
“Three different accounts logged in from the same system over the course of 30 minutes. It seems unlikely all of those people are actually using that system, so maybe that system and those accounts are compromised?”
-
“A new administrative account was just created outside of normal business hours. Maybe someone’s working late, but maybe there’s an issue?”
-
“Someone was just added to the administrator group. That’s a rare event, so shouldn’t we check on it?”
-
“Why are there firewall denies with a source of an internal system? Either something is misconfigured or there’s an unauthorized user trying to move around the network.”
A SIEM can be run in-house as part of a Security Operations Center, or can be run by a managed security services provider on your behalf. Regardless of whether you choose to use a SIEM or not, make sure that you are meeting your requirements for aggregation and retention, parsing, searching and correlation, alerting, and automated response capabilities.
Threat Hunting
Only after you have the basics down — that is, you’re collecting security-relevant logs and metrics, parsing them, and responding to alerts generated by your systems — should you move on to threat hunting.
Threat hunting is when you go looking for problems, rather than following up on specific alerts. You start by creating a hypothesis, such as, “Perhaps I’m being targeted by Advanced Persistent Threat 12345,” or, “Maybe someone is after the secret plans to my spaceship.” You then go looking for evidence to either further or disprove that hypothesis.
Preparing for an Incident
You have the logs, and you are doing useful things with them such as getting alerts. Now you need to plan for what to do when one of those alerts is the real deal. Depending on the risk to your environment, your plans don’t have to be exhaustive, because even a little bit of planning can help enormously.
The first decision that you need to make is this: at what point are you going to call for outside help? This will depend heavily upon your organization’s risk, the severity of the incident, and the size of your security team. However, even large, well-prepared organizations may need outside help for more serious security incidents. A quick search will turn up many incident response firms, and it’s a good idea to have vetted two of them ahead of time in case you need them.
In addition, you may want to consider cybersecurity insurance, particularly if you have a small team and little incident response can be done in-house. In some cases, this insurance may be included with general business protection policies, although many exclude cybersecurity incidents. As with any insurance, you need to carefully read the coverage and exclusions, as some policies exclude common types of attacks such as social engineering attacks, or deny coverage based on unclear security requirements for the insured. However, these policies can pay for most or all expenses associated with incident response.
The most important preparation work is the collection and retention of logs, described earlier, so that you can call up a reasonable amount of current and historical data to perform investigations. In addition to that, you need to put together a team, a plan, and some tools.
Team
The incident response team has the stressful job of figuring out what’s going on during an attack and containing the incident as much as possible. The first thing you need is to identify primary and backup technical incident response leaders. These people will be responsible for running any internal investigations and coordinating with any outside help.
You also need to identify primary and backup business leaders, who can be available immediately to sign off on business decisions such as taking systems down or authorizing payments. In smaller organizations, the technical leader and business leaders might be the same people, but you still need at least one primary and one backup person.
In addition to the team leadership, you will also need technical specialists in the different areas that are most likely to be attacked in your threat model. For example, if you are worried about someone taking the data on your customers from your cloud web application, you might need to line up network specialists, web server specialists, database specialists, and specialists familiar with the inner design and workings of the application itself. You don’t want to realize in the middle of an incident that you can’t reach any of the people who understand “component X,” if that’s where the problem is suspected.
Finally, you also need primary and backup contacts identified in:
-
Your legal department (or from your legal firm) to help with questions about complying with contracts and regulations.
-
Your communications department, or someone authorized to speak with the media.
-
Your HR department, or someone authorized for hiring/firing decisions in case an insider threat is identified.
-
Someone authorized to speak with law enforcement authorities, should that become necessary.
All of these responsibilities may fall to different individuals, or may be performed by the leaders identified earlier in this section, provided that you have primary and backup coverage for each area.
Whether you have a full-time incident response team or not, you should also have the equivalent of a volunteer fire department. Identify knowledgeable people who can be trained in incident response, and get management pre-approval to pull them off of what they’re currently doing to deal with a high-priority incident.
A few other notes on creating and maintaining an incident response team follow:
-
Nobody wants to be on call during a weekend or over a holiday. Unfortunately, the attackers know this, and so incidents are more likely to begin at these inconvenient times.
-
If incident response is a regular activity in your organization, burnout is a serious concern. It is even more of a concern if you have a largely volunteer team that is attempting to deal with incident response on top of a normal workload. If possible, rotate people in and out so that they have a break from incident response activities.
-
Determine general incident response roles for team members ahead of time and write them down so that during the incident, nobody is confused over who is responsible for what.
-
Have the team meet at least quarterly to make sure everyone is still on board with the plans.
Once you have an incident response team, you need some plans for the team to follow.
Plans
Most of the team composition advice in the previous section is not cloud-specific, but your plans will be. You need to come up with some likely scenarios in your cloud environment and have some plans to cover those scenarios.
As part of your planning, you need to understand what your cloud provider is committed to doing in the event of a security incident. Will they provide additional logs or take forensic images? Do they provide contact information for security incidents? You don’t want to be in the middle of an incident trying to read the terms of service to figure out your provider’s responsibility.
In many cases, the cloud provider will be responsible for responding only to incidents involving breaches to their cloud services, and not to incidents that only involve your application hosted on their cloud services. However, there are some exceptions, such as DDOS attacks, where the cloud provider may work with you to help mitigate the attack — or may turn off all outside network access to your application to prevent the attack from impacting their other customers! It’s important to know what they can do for you ahead of time.
You also need at least a small pre-approved budget for dealing with security incidents. This doesn’t mean the team has a blank check to purchase anything they want, but the allocation should be enough to cover reasonable items without going through a potentially lengthy procurement and approval process. For example, if part of the plan is to contact an incident response firm, at least initial consulting charges should be pre-approved. If part of the plan is to put people on planes right away, airfare should be pre-approved. Try to budget for and pre-approve items that are likely to be needed in the first few hours of an incident.
Prioritization is also an important part of incident response planning. You don’t want to respond to an attempted attack in the same way that you respond to someone actively stealing your data. Create at least a few severities of security incidents with some guidelines on what to do in each case. For example, you might list categories for “confirmed unsuccessful attack”, “confirmed successful attack without data loss”, and “confirmed successful attack with data loss”. As incidents move up the scale, the response might change.
You should also have some organization-wide guidance for reporting suspected security incidents and not interfering with investigations. This can be as simple as an item in the employee handbook that says something like, “If you suspect that an unauthorized user is accessing our information systems, please call the following number to report a suspected security incident. You are permitted to shut down affected nonessential systems, but do not delete any systems or destroy any data, and do not attempt to retaliate.”
If you haven’t had a chance to test your plans yet, consider performing a tabletop exercise. You can do this in-house, by inventing a plausible scenario and playing it out in a test environment. There are also firms that make this easier by providing scenarios, fake news bulletins, and other props to help this be successful, and will critique how the plan was executed to help address weaknesses. For example, a likely scenario might be that there’s an attack in progress and you need to go into “lockdown” mode. In a cloud environment, this might involve one or more of the following:
-
A plan to disable all cloud portal and API access other than the minimum required during the incident. For example, you could decide that only four individuals need access in the short term and install scripts to disable all other users’ access.
-
A plan to disable all network access to your cloud environment, or some subset of it. This might disable the application completely, or temporarily disable some functionality.
-
A plan to shut down the entire environment, lock the secret server, and recreate a new environment.
Warning
Part of your plan should involve having backups that you can use to restore data and functionality. Make sure your backups are in a separate account, with separate administrative credentials from the production data. There have been documented cases of attackers wiping not only the production data, but also all of the backups that were accessible from the production account.
It’s important to understand how long restores will take, too. Sometimes you have a perfectly reasonable recovery strategy except that it requires the entire world to stop turning for a week. You don’t have to be able to function at 100% while recovery is taking place — delaying sending out bills or jotting down handwritten notes for entry into the IT systems later may be perfectly reasonable — but you do need to be able to carry out core business functions.
Tools
When developing your plans, you’ll realize that your team will need some tools to implement those plans. In a traditional environment, many incident response tools tend to be physical bags with laptops, cables, and similar baggage. A cloud environment offers virtual cloud equivalents of some of these items.
The tools needed will depend somewhat upon what your environment looks like and what your cloud provider offers, but at a minimum your team should probably have virtual images containing forensics analysis tools and a cloud account to create forensic infrastructure. Cloud accounts typically don’t cost anything to own if nothing is provisioned in them, so you should keep a separate incident response cloud account active that can be connected to your production account. Some cloud providers also offer documentation on performing investigations and digital forensics in their environments that may point to specific tools.
Create detailed, tested procedures for the most common incident response tasks. For example, you may want a procedure for collecting memory and disk forensic information from a compromised Linux virtual machine in a cloud environment. Such a procedure should contain the exact commands to accomplish this, such running LiME to capture a memory dump, generating a hash of the dump, verifying the dump with Volatility, performing a hard poweroff of the compromised machine to prevent any malicious programs from cleaning up prior to reboot, and taking a snapshot of the disks.
Some other tools that may be helpful:
-
Cloud-aware forensic analysis tools, which can help you understand what happened on a particular system.
-
Up-to-date diagrams showing network configuration, data locations, and event logging locations.
-
Tested communications systems. Will you be able to respond to a threat if your instant message platform, e-mail, or telephone systems are down? In an emergency situation, perhaps you will permit people to use personal e-mail and cell phones for work activities, even if that’s normally disallowed. It’s better to think about those decisions ahead of time.
-
Contact lists, for both people internal to the organization and external contacts such as cloud providers, incident response firms, or other suppliers that may be involved in incident response.
-
A “war room”. In cloud environments, you won’t be physically touching the equipment in most cases, but you still need a physical or virtual “war room” where the team can meet, exchange information, and make decisions. If you may have remote attendees, make sure you have meaningful ways for them to participate, such as screen sharing and a reasonable audio system.
-
Checklists. I’m not a fan of “checklist security” at all, where you tick off that you have a firewall, antivirus, and similar items without actually verifying that they’re being used effectively. However, incident response is often performed by panicky, tired people. For these situations, checklists that help you implement plans are essential to ensure you haven’t forgotten something really important. For example, an online checklist suggests a useful set of logs to review during an incident.
-
Forms for documenting incident response activities. For example, the SANS institute offers some forms that can be customized for your organization at.
-
Incident response software, which have components that can track incidents and built-in playbooks for incident response.
Responding to an Incident
Hopefully, you’re not in the middle of an active security incident when you read this. If you are, and you have no incident response team, plan, tools, or checklists yet, your first priority should be on containing the incident as much as possible without destroying evidence. Typically, you do this by some combination of shutting down or quarantining systems, changing passwords, revoking access, and blocking network connections. At the same time, you should probably call an incident response company for help, and take a few seconds here and there to jot down notes on what you need in order to be better prepared next time.
OK, so you’ve found something that looks like a real attack. Now what? Your response will largely be dependent upon what the attacker is doing and what your threat model looks like, but there are a few guidelines what will help.
First, mobilize at least part of your team to do triage. You don’t want to get 30 people out of bed for a malware infection that, after a few minutes’ investigation, appears to be completely contained. It’s easy to both overreact and underreact, so this is where having some pre-defined severity levels and response guidelines for each severity level can be helpful.
Then, start executing the plans you’ve implemented, trying to anticipate what the attacker’s objectives are likely to be from a “kill chain” or “attack chain” as mentioned above.
Cyber Kill Chains
One of the most popular kill chains today is the Lockheed-Martin Cyber Kill Chain:
- Reconnaissance
-
The attacker does research to figure out what to get into and vulnerabilities that may help them. This might involve anything from Google searches, to dumpster-diving, to social engineering, to network port scans.
- Weaponization
-
The attacker comes up with some malware to exploit the vulnerabilties. More advanced attackers may write something custom, but less advanced attacks may use something already available.
- Delivery
-
The attacker gets the victim to execute that malware, either by a network attack, or e-mailing it, or other means.
- Exploitation
-
The malware runs and gains unauthorized access.
- Installation
-
The malware gains “persistence”, or staying power, by installing in some way that the attacker hopes is difficult to find and remove. Often the first piece of malware downloads and installs a second stage for this part. In some cases this persistent malware is better supported and updated than your legitimate programs!
- Command and Control
-
The malware creates some sort of communication channel so that the attacker can remotely control it — a remote shell, an outbound web connection, or even reading commands from a legitimate cloud file storage service. At this point, access to your systems might be sold on the black market at a good price to someone who really wants it.
- Actions on Objective
-
An attacker (which may not even be the original attacker) does whatever he wants — steals your data, defaces your web sites, attacks your customers, extorts money, etc.
There are other popular chains, such as MITRE ATT&CK, that have slightly different steps. Regardless of which you use, it’s a good idea to be familiar with at least one of them so you have some idea what the attacker might have already done and might do next.
The OODA loop
You have your plans, and you may have some idea of the progress and objectives of your attacker. It’s time to respond. A popular concept in incident response is the “OODA loop” — observe, orient, decide, and act.
-
In the observe phase, gather information from your systems such as your cloud provider logs, firewalls, operating system logs, metrics, and other locations to find odd behavior that may indicate an attacker is doing something.
-
In the orient phase, try to understand what is going on and what might happen next. This might involve both internal knowledge of where your most important assets are, and external threat intelligence about who may be behind the attack and why. Not all threat intelligence costs money. For example, US-CERT regularly releases alerts on malicious activities. If you’re seeing suspicious behavior, and US-CERT has released an alert that your industry is being targeted by particular threat actors using particular tactics, techniques, and procedures, that may help you orient yourself.
-
In the decide phase, choose the next tactics you’ll use for minimizing damage or enabling recovery. For example, you may decide to take certain systems offline, revoke access, quarantine systems, or build a new environment.
-
In the act phase, actually execute those tactics. This is where using cloud infrastructure can really be helpful, particularly if you have invested in repeatable methods to build your cloud environments rather than having them grow organically over time. Some examples:
-
Most cloud environments have a stronger division between the compute infrastructure and the storage than traditional environments. It’s much harder — but not impossible — for attackers to persist (retain unauthorized access) just by modifying content in your data stores. Every instance of compute infrastructure contains thousands of executables and configuration entries, but these can typically be rebuilt much more easily than the data can. Given this division, you may be able to apply fixes to your images to close the vulnerability that allowed the attacker in, shut down all compute instances, replace them with fixed instances, and connect the new instances to your data stores with minimal downtime.
-
You may also be able to easily quarantine systems, using scripts to invoke APIs that lock down security groups or network ACLs. In a traditional environment, you might have to manually log into many different routers or firewalls, or start unplugging cables, to get the same effect.
-
After you act, the loop begins again — observe to see what the attacker is doing in response to what you’ve done, orient, decide, and act again. These loops should be relatively quick and should continue until your observations indicate that the incident is resolved.
You will almost never be prepared enough. Each incident will be messy in its own way, even if you’re really well prepared. Take 15 seconds to jot down reminders of lessons learned while you’re going along, because it can be difficult to remember afterwards.
Note
Don’t be afraid to call an incident response firm if things seem to be getting out of hand or if you can’t make progress. Most attackers have a lot more experience attacking than defenders have defending!
Cloud Forensics
This might inspire images of the CSI television show, but unfortunately the reality is a little less exciting. Essentially you just want to make a forensic copy of anything that might be important, and then use tools to analyze it.
It’s important to make the copies in a documented, repeatable fashion so that you can always demonstrate that you have a good copy of the original data that hasn’t been altered. This usually involves generating a verification string (cryptographic hash) that can be used to show that you have a copy of the uncorrupted data. A cryptographic hash, such as SHA-256, is designed to be fast to calculate but nearly impossible to use to create another piece of data that has the same hash. With a copy of the data and a cryptographic hash, anyone can quickly generate a hash and compare it against the original to ensure that their copy is the same as what the initial investigator collected. In addition, nobody can change the data (intentionally or accidentally) without the change being easily discoverable. You could also write the original copy to some read-only media and do a bit-for-bit comparison of the copies every time, but that would take a lot longer!
The sample procedure above in “Tools” showed one way to obtain forensic images for virtual machine memory and disk images, but you may need other forensic artifacts during an investigation. For example, you may want to take snapshots or backups of databases, to compare and see whether the attacker made any database changes. You may also want to look at network packet or flow captures to see what an attacker or malware was doing on the network.
Blocking Unauthorized Access
This may seem like a no-brainer, but it’s often harder than it looks, particularly if an attacker has been in the system for a while and has gotten administrative access. Hopefully you’ve followed the instructions in Chapter 6 and have some internal segmentation, so that the attack may be contained to a particular part of the network.
Some common responses here are to reset everyone’s passwords and API keys (including automation), which can be disruptive to normal operations, blocking inbound and outbound network access.
You should have pre-created tools and processes for blocking access quickly and all at once.
Stopping data exfiltration and command and control
If you didn’t shut down network communications as part of blocking unauthorized access, you may still need to shut down outbound communications in order to stop connections attackers make to command and control servers, or to stop ongoing data loss.
Recovery
You’ve found the attack and you think you’ve stopped it, so now it’s time to clean up and make sure that there are no leftover ways for the attackers to get back into your systems.
Redeploying IT systems
By far, the simplest and most effective way to recover from an IT standpoint is to redeploy all affected systems. Again, this is a little easier in the cloud, because you don’t have to purchase new physical hardware; your cloud provider will have capacity. Any compromised cloud systems should be recreated and the production traffic should be switched over to the new systems. Any affected workstations should be wiped and recreated from known good images. In the immortal words of Ellen Ripley in Alien, “Nuke the entire site from orbit. It’s the only way to be sure.”
If that’s not possible, you need to have executive acknowledgment that you’re accepting a substantial risk in continuing to operate systems that an attacker had control of for a time. You can run malware scanners, keep extra tabs on network and processes for indicators of compromise, and other items, but a single altered registry entry may be enough to let an attacker get back into your system, and a single piece of missed malware may be able to call out and provide an easy way back in.
Notifications
You may have regulatory or contractual obligations to notify your customers or report the breach to law enforcement authorities.
Even if you aren’t required to notify the world, you may want to do so anyway to avoid a PR nightmare if word eventually gets out. For obvious reasons, we don’t have good metrics on how many successful cover-ups there are, but we do have some examples of unsuccessful cover-ups by Yahoo!, Cathay Pacific, and others.
Lessons Learned
As soon as possible, after everyone’s had a good night of sleep, you should look at lessons learned and make any updates to your team composition, plans, procedures, tools, and checklists that will help next time. Hopefully, during the incident, you took the opportunity to jot down some quick notes and reminders that can be used.
Building an entire incident response team and process is a large topic. While I’ve covered the high points for cloud environments here, for further reading, I recommend the AlienVault Insider’s Guide to Incident Response and NIST SP 800-61.
Example Metrics
As with other business processes, if you can’t provide some measurements on your detection, response, and recovery activities, it’s difficult to know whether you’re improving.
Here are a few example metrics that you may want to consider collecting:
- Detection
-
Number of events collected per month, number of alerts triggered per month, percentage of alerts that are confirmed incidents, percentage of alerts that are false positives
- Response
-
Time from when an alert was triggered to a review of the alert, time duration from a confirmed incident to closure of that incident
- Recovery
-
Time required to redeploy affected systems
- Overall
-
Estimated cost of each incident, including time, expenses, and reputational damage
Example Tools for Detection, Response, and Recovery
Just as in Chapter 5, I’m not endorsing any of these tools by including them, or snubbing other tools by excluding them. These are just examples of different tools that are popular as of this writing.
-
Amazon GuardDuty can look for unusual or suspicious activity on your AWS account or systems.
-
AWS CloudWatch Logs, Azure Monitor, Google Stackdriver Logging, and IBM Cloud Log Analytics all allow you to store and search through your logs.
-
AWS CloudWatch, Azure Monitor, Google Stackdriver Monitoring, and IBM Cloud Monitoring provide performance metrics.
-
AWS CloudTrail, Azure Monitor, and IBM Cloud Activity Tracker can monitor privileged user activity on cloud accounts.
-
Azure Security Center can collect security data into a central location, as well as perform file integrity monitoring and other security functions.
-
Cisco, McAfee, and Snort are popular network intrusion detection service providers that have cloud-based appliances available.
-
CloudFlare, Akamai, and Signal Sciences provide cloud-based Web Application Firewall solutions.
-
OSSEC, Tripwire, AIDE, NTT Change Tracker, CloudPassage Halo, Qualys, and others provide traditional or cloud-based file integrity monitoring solutions.
-
SIEMs such as IBM QRadar, Splunk Security Intelligence Platform, LogRhythm, and others collect log events, analyze them, and raise alerts.
-
Many popular forensic toolsets, such as Encase and FTK, now have some cloud capabilities.
Putting it all together in the sample application
Let’s take one last look at our sample application, this time from the point of view of detection and response. Our threat model in this case involves large amounts of data about our customers in our database, and a likely attacker who will attempt to steal this data and sell it on the dark web. Note that our focus would be somewhat different if we were primarily concerned about our brand image, and we thought it was most likely that someone would try to deface our web pages to make us look bad.
Figure 7-2 shows sensitive systems that log security-related events, and how the security team handles them. The blue items run the functional parts of the application, the gray items are cloud provider or orchestration systems used to create the application infrastructure, and the green items run our auditing framework. As a reminder, our detection and response security goals for the application are:
-
Collect logs and metrics that will be useful both for operational troubleshooting and for detecting and responding to security incidents. Each of the blue and gray boxes on the diagram is configured to record security-relevant events and metrics.
-
Store those logs and metrics securely, where they can’t be erased by an attacker. In practice, this means getting them off of the system quickly, to a system that’s under separate administrative control. In this case, the logs are shown as going through log and metrics aggregator systems, which are under separate administrative control, but they might also go directly to a SIEM.
-
Analyze the collected data. This will let us see whether items require further investigation. In this case, the analysis is performed by a combination of the SIEM (using log parsing, correlation rules, machine learning, and other items claimed in most SIEM marketing brochures) and the security operator’s brain.
-
Automatically alert on items that require a human to investigate. In this example, the SIEM is configured to send alerts to people with the security operator role. These alerts might be false positives, there should be a separate feedback loop (not pictured on the diagram) for the security operators to tune out false positives where possible when they get a false alert, without masking any true positives.
-
Run through the incident response and recovery plans if an actual security incident is suspected.
Figure 7-2. Sample application with detection capabilities
Monitoring the Protective Systems
First, let’s look at the logs created by our protective systems during the normal use of the system. In this picture, the IDS/IPS, Web Application Firewall, and firewall systems generate logs, alerts, and metrics as the system is used or abused. Some examples:
-
The IDS/IPS may log that someone appears to be port-scanning or when it sees a known malicious signature.
-
The Web Application Firewall may log that someone is attempting a SQL injection attack or a deserialization attack.
-
The firewall (or a component of the IaaS performing firewall duties) routinely logs accepted/denied connections, as well as track metrics indicating how much data is entering and leaving the network per minute.
Monitoring the Application
Next, let’s look at the logs created by our application and infrastructure during the normal use of the system. These logs will depend highly on what the application does and what components are used to create it. For illustrative purposes, I’ll assume we’ve used many different technologies, although this may or may not be a good design for a real application.
-
The web servers will log each request, including source IP address and the URL requested. In this case, the web servers are simply an object storage instance presenting objects in response to web requests. We configure the object storage service to send its access logs (including when an object is modified) to the log aggregation service, and metrics on how many requests are serviced to the metrics service. With an object storage service, we don’t need to worry about any lower-level items such as operating system logs, because that’s the cloud provider’s job.
-
The application servers in this example are pods hosted on a Kubernetes cluster. The application running in the pods log each request to the standard output (stdout) or standard error file (stderr), with the URL of the component being invoked and what the response is. In this case, the application also allows file uploads, so one component of the application is an antivirus client that scans each upload, quarantines any uploads that contain malware, and sends an alert. A logging agent on the worker node will send the log information from each pod, as well as for the worker node itself, to the log aggregator. We’ll also enable audit logging on the Kubernetes master itself, so that it will tell us when someone authenticates to it or creates pods.
-
The database is an as-as-service offering that will log any denied access attempts to the database or particular tables within the database, as well as any changes to the access settings for the database. It will also record metrics as to how much data it’s sending out at any given time. Given that we’re most concerned about theft of data from the database, we really need to pay attention to these items!
-
The Virtual Private Cloud networking infrastructure (not shown on the diagram) is configured to send network metrics to the metrics aggregator, which can send an alert to the SIEM when network usage is high.
Monitoring the Administrators
We also need to monitor the administrators as they work. As I said before, this doesn’t necessarily mean that we don’t trust our system administrators! It means that we recognize that an attacker might have obtained valid administrative credentials via some nefarious means, and we still have to detect and respond to the attack.
For educational purposes, we’ll assume that:
-
The admins are dealing with a combination of virtual machines and containers in this environment.
-
The admins will use the cloud provider and container orchestration capabilities to run specific commands on VMs and containers where possible, but in emergencies may need to get an interactive session directly on the system.
In the diagram, “toxic” logs (which may contain secret information) and the normal “sanitized” logs are shown stored on separate systems, so that we can control access for the “toxic” logs to as few administrators as possible. If you store both types of logs on the same system, ensure that all administrators of that system are authorized to see the toxic logs, and that access to them is controlled carefully.
Understanding the Auditing Infrastructure
Now let’s look at the green boxes, which represent our auditing infrastructure. In this example application, log aggregation, metrics aggregation, and SIEM are all shown as separate systems, but many products and services overlap in several or even all of these areas.
You may also have additional products or services sending alerts to the SIEM or directly to security personnel. For example, you may use a network traffic analysis system that watches for unusual network traffic patterns, or endpoint detection and response agents that collect information on what your servers or workstations are doing.
-
The log aggregator may either be a cloud service like AWS CloudWatch Logs, Azure Monitor, Google Stackdriver Logging, IBM Cloud Log Analytics, Splunk Cloud, or many others. The aggregator may instead be a separate installed product like Splunk or Logstash.
-
The log aggregator should be under separate administrative control from the systems being monitored, so that an attacker with access to one of the monitored systems can’t also access the aggregator and erase the logs using the same credentials. I recommend putting the audit and logging components in a separate “auditing” cloud account for increased separation.
-
The logs might contain both non-security-relevant information and security-relevant information, but in general only security relevant logs should flow to the SIEM.
-
-
The metrics aggregator is collected by a metrics system, such as AWS CloudWatch, Azure Monitor, Google Stackdriver Monitoring, or IBM Cloud Monitoring, or by a separately installed tool.
-
Both the logging and monitoring systems feed security-relevant items into the SIEM. For example, the logging system might feed all authentication events in, and the monitoring system might push an event any time a metric such as the transfer rate exceeds a threshold for a specific amount of time.
-
The SIEM has parsers to understand the different types of logs coming in, and rules to decide when something is worth telling a human about. In this case, the SIEM rules may alert when there are login failures for multiple accounts in quick succession (password spraying), or when the database and network metrics both show unusual activity, or many other combinations of suspicious or alarming events happen.
Summary
Even after you have put reasonable protections in place, your security isn’t complete until you have confidence that you can detect attacks, respond to them promptly and effectively, and recover.
Detection isn’t just about logging; you can’t just vacuum up every log source available and hope that it’s useful for security. You need to figure out what is important to watch given your environment and your threat model. In almost all environments, you will have some privileged users, and it’s almost always important to watch their activity. Ask yourself, “If some likely bad thing happened, would I see it?” If not, you may need to collect additional information, or make sure the information you’re already collecting gets to the right place to be visible.
Once you have figured out what’s important to watch, make sure that you’re effectively collecting those logs and metrics and looking through them. In larger environments, that often means a SIEM to help go through the large amounts of data. Make sure you have synced your time across systems, and perform some simulated attacks to make sure that you would notice the real thing.
Finally, you need to be prepared to deal with a successful attack when it happens. That means putting together a team, some plans, and some tools ahead of time. When an attack happens, your team needs to understand how attacks often unfold, lock down the environment, and clean up — and needs to know when it’s time to call for additional help.
When you’re performing recovery actions, it’s very risky to attempt to “clean” compute systems. Once someone has had administrative access, you really have no way of knowing you’ve gotten everything out, because there are so many places for malware to hide. The safest option by far is to wipe and restore each compromised system, or throw it away and get a new one. Fortunately, that’s easy to do in the cloud! Don’t underestimate the risk of trying to clean up in place; a single access control permission, a single registry entry on Windows, or some other hard-to-find back door can allow an attacker to walk right back in easily.
1 2018 Cost of a Data Breach Study by Ponemon, published by IBM.
2 This is sometimes also called the “four eyes principle”, the “two-person rule”, or the “two-man rule”.
3 The 2017 Worldwide DDoS Attacks & Cyber Insights Research Report states that, “DDoS attacks were often used in concert with other cyber crime activities,” whereas a Verizon Data Breach Investigations Report states, “we’ve never had a year with more than single-digit breaches in the Denial of Service pattern.” It’s worth noting that the first reference is an anti-DDOS vendor, however.