Table of Contents for
Continuous Delivery in Java
 Continuous Delivery in Java
Published by
O'Reilly Media, Inc., 2018
Continuous Delivery in Java
Published by
O'Reilly Media, Inc., 2018
- Cover
- nav
- Continuous Delivery in Java
- Continuous Delivery in Java
- Forewords
- Preface
- 1. Continuous Delivery: Why and What
- 2. Evolution of Java Development
- 3. Designing Architecture for Continuous Delivery
- 4. Deployment Platforms, Infrastructure, and Continuous Delivery of Java Apps
- 5. Building Java Applications
- 6. Additional Build Tooling and Skills
- 7. Packaging Applications for Deployment
- 8. Working Locally (Like It Was Production)
- 9. Continuous Integration: The First Steps in Creating a Build Pipeline
- 10. Deploying and Releasing from the Pipeline
- 11. Functional Testing: Correctness and Acceptance
- 12. System-Quality Attributes Testing: Validating Nonfunctional Requirements
- 13. Observability: Monitoring, Logging, and Tracing
- 14. Migrating to Continuous Delivery
- 15. Continuous Delivery and Continuous Improvement
- Index
- About the Author
- Colophon
Chapter 12. System-Quality Attributes Testing: Validating Nonfunctional Requirements
You learned in the previous chapter that you must test software for correctness and the delivery of the required business functionality. However, it is equally important to ensure that the system is reliable and scalable, and that the software can be run in a cost-effective manner. Classically, validating the quality of a software system has been divided into testing functional requirements and testing nonfunctional requirements—sometimes referred to as cross-functional requirements or system-quality attributes. In this chapter, you will learn how to test the nonfunctional requirements.
Why Test Nonfunctional Requirements?
Testing nonfunctional requirements is often relegated to the end of a software delivery project, and sometimes completely ignored, particularly within small teams constrained by resources (and expertise). Enterprise development teams can fare somewhat better, partly through access to specialized skills and partly by understanding their customers and associated resource usage better.
Many enterprise organizations conduct capacity and security planning within the feasibility study of a large project. In reality, this is often fraught with uncertainty and danger, as business teams are unsure of the number of customers, usage patterns, and potential threats; and the engineering teams are unsure of the impact and capacity requirements of each unit of functionality offered by the software. The recent trend toward designing functionality within well-bounded services, deploying on flexible and programmatically defined infrastructure, and the embrace of the shared responsibility model (e.g., DevOps, SRE) has dramatically reduced the barrier to entry for this type of testing.
The terms nonfunctional requirements, cross-functional requirements, and system-quality attributes may be used interchangeably throughout this chapter. However, it should be stressed that although the term nonfunctional requirements is the most popular, it is also perhaps the most incorrect—and the potential cause of the lack of priority given to these types of quality attributes. The word “nonfunctional” could imply that not testing these requirements will not affect the functionality of the system. But this could not be further from the truth, especially in the current climate of HackerNews or Twitter-driven customer-thundering herds, the potentially spectacular failure modes of underlying infrastructure platforms, and entire illicit organizations created (that are sometimes state sponsored) with the sole purpose of hacking software systems.
The good news is that with current tooling, methodologies, and access to commodity programmable infrastructure, it is now easier than ever before to conduct this type of testing.
Code Quality
Writing code is an inherently creative act, so there are often many ways to implement each piece of functionality. Nearly every developer has their own personal style (often within each language they know), but when working as part of a team, you must all agree on a baseline for certain code qualities, such as code formatting and use of esoteric parts of the language.
The primary metric of code quality is whether the functionality created meets the requirements specified, and you learned how to verify this in the previous chapter, which focused on testing functional requirements. The “nonfunctional” perspective of code quality consists of reducing time-to-context (how readable is the code for another developer, and can someone else quickly understand the implementation logic) and being free of deficiencies (is the code written in a way that allows the application to scale effectively, or handle faults gracefully).
In Chapter 9, you explored how to implement automated code-style checking as part of the CI process with tooling like Checkstyle and PMD, and in this chapter you will learn how this can be augmented with automated architecture quality assessment.
Architectural Quality
The build pipeline should be the primary location where agreed-upon architectural qualities are codified and enforced. These quality assertions should not replace discussions with your team about agreed-upon standards and quality levels, and should definitely not be used to avoid intra- or inter-team communication. However, checking and publishing quality metrics within the build pipeline can prevent the gradual decay of quality that can otherwise be challenging to notice.
ArchUnit: Unit-Testing Architecture
ArchUnit is an open source, extensible library for checking the architecture of your Java code by using a Java unit-test framework like JUnit or TestNG. ArchUnit can check dependencies between packages and classes, layers and slices, check for cyclic dependencies, and more. It does this by analyzing Java bytecode and importing all classes into a Java code structure for analysis.
To use ArchUnit in combination with JUnit 4, include the dependency shown in Example 12-1 from Maven Central.
Example 12-1. Including ArchUnit within a Maven pom.xml
<dependency><groupId>com.tngtech.archunit</groupId><artifactId>archunit-junit</artifactId><version>0.5.0</version><scope>test</scope></dependency>
At its core, ArchUnit provides infrastructure to import Java bytecode into Java code structures. This can be done by using ClassFileImporter. Architectural rules such as “services should be accessed only by controllers” can be made by using a DSL-like fluent API, which can, in turn, be evaluated against imported classes; see Example 12-2.
Example 12-2. Using the ArchUnit DSL to assert that services should be accessed only by controllers
importstaticcom.tngtech.archunit.lang.syntax.ArchRuleDefinition.classes;// ...@TestpublicvoidServices_should_only_be_accessed_by_Controllers(){JavaClassesclasses=newClassFileImporter().importPackages("com.mycompany.myapp");ArchRulemyRule=classes().that().resideInAPackage("..service..").should().onlyBeAccessed().byAnyPackage("..controller..","..service..");myRule.check(classes);}
A host of ArchUnit examples are available on GitHub, and we’ve included several next so that you are aware of the power of the framework. Extending the preceding example, you can enforce more layer-based access rules, as shown in Example 12-3.
Example 12-3. Enforcing additional layer-based access rules with ArchUnit
@ArchTestpublicstaticfinalArchRulelayer_dependencies_are_respected=layeredArchitecture().layer("Controllers").definedBy("com.tngtech.archunit.example.controller..").layer("Services").definedBy("com.tngtech.archunit.example.service..").layer("Persistence").definedBy("com.tngtech.archunit.example.persistence..").whereLayer("Controllers").mayNotBeAccessedByAnyLayer().whereLayer("Services").mayOnlyBeAccessedByLayers("Controllers").whereLayer("Persistence").mayOnlyBeAccessedByLayers("Services");
You can also ensure naming conventions, such as prefixes, or specify that a class named a certain way must be in an appropriate package (this, for example, can prevent developers from putting controller classes outside controller packages); see Example 12-4.
Example 12-4. Enforcing naming conventions with ArchUnit
@ArchTestpublicstaticArchRuleservices_should_be_prefixed=classes().that().resideInAPackage("..service..").and().areAnnotatedWith(MyService.class).should().haveSimpleNameStartingWith("Service");@ArchTestpublicstaticArchRuleclasses_named_controller_should_be_in_a_controller_pkg=classes().that().haveSimpleNameContaining("Controller").should().resideInAPackage("..controller..");
Finally, you can also enforce that only specific classes can access other classes, fields; for example, only DAO classes can access an EntityManager, as shown in Example 12-5.
Example 12-5. Enforcing class-access patterns
@ArchTestpublicstaticfinalArchRuleonly_DAOs_may_use_the_EntityManager=noClasses().that().resideOutsideOfPackage("..dao..").should().accessClassesThat().areAssignableTo(EntityManager.class).as("Only DAOs may use the "+EntityManager.class.getSimpleName());
Generate Design-Quality Metrics with JDepend
JDepend has been around longer than ArchUnit, and although it potentially offers fewer features, the two frameworks can be complementary. JDepend traverses Java class file directories and generates design-quality metrics for each Java package. JDepend allows you to automatically measure the quality of a design in terms of its extensibility, reusability, and maintainability to manage package dependencies effectively.
JDepend Is Showing Its Age
The last official release of JDepend was in 2005, and in “tech years” (much like dog years), this is a long time. Someone else has forked the codebase and applied a series of bug fixes, but caution is warranted, especially in regards to support for new language features. Our preference is to use a combination of SonarQube for design-quality metrics, and ArchUnit for asserting architectural requirements. However, we have included JDepend here because we often bump into this framework on consulting engagements.
As specified on the JDepend website, the framework generates design-quality metrics for each Java package, including the following:
- Number of classes and interfaces
-
The number of concrete and abstract classes (and interfaces) in the package is an indicator of the extensibility of the package.
- Afferent couplings (Ca)
-
The number of other packages that depend upon classes within the package is an indicator of the package’s responsibility.
- Efferent couplings (Ce)
-
The number of other packages that the classes in the package depend upon is an indicator of the package’s independence.
- Abstractness (A)
-
The ratio of the number of abstract classes (and interfaces) in the analyzed package to the total number of classes in the analyzed package.
- Instability (I)
-
The ratio of efferent coupling (Ce) to total coupling (Ce + Ca) such that I = Ce / (Ce + Ca). This metric is an indicator of the package’s resilience to change.
- Distance from the main sequence (D)
-
The perpendicular distance of a package from the idealized line A + I = 1. This metric is an indicator of the package’s balance between abstractness and stability.
- Package dependency cycles
-
Package dependency cycles are reported along with the hierarchical paths of packages participating in package dependency cycles.
JDepend can be used as a standalone tool, but it is more typical to implement the analysis via JUnit. You can include JDepend in your project as shown in Example 12-6. Note that the original JDepend is no longer maintained, and someone else has forked the codebase in order to apply bug fixes).
Example 12-6. Including JDepend within your Maven pom.xml
<dependency><groupId>guru.nidi</groupId><artifactId>jdepend</artifactId><version>2.9.5</version></dependency>
Example 12-7 shows how to use JDepend to analyze a codebase and ensure that the dependencies asserted are valid.
Example 12-7. A constraint test with JDepend
publicclassConstraintTestextendsTestCase{...protectedvoidsetUp()throwsIOException{jdepend=newJDepend();jdepend.addDirectory("/path/to/project/util/classes");jdepend.addDirectory("/path/to/project/ejb/classes");jdepend.addDirectory("/path/to/project/web/classes");}/*** Tests that the package dependency constraint* is met for the analyzed packages.*/publicvoidtestMatch(){DependencyConstraintconstraint=newDependencyConstraint();JavaPackageejb=constraint.addPackage("com.xyz.ejb");JavaPackageweb=constraint.addPackage("com.xyz.web");JavaPackageutil=constraint.addPackage("com.xyz.util");ejb.dependsUpon(util);web.dependsUpon(util);jdepend.analyze();assertEquals("Dependency mismatch",true,jdepend.dependencyMatch(constraint));}...}
Performance and Load Testing
Understanding the performance characteristics of your application and its individual service components is extremely invaluable. Accordingly, the practice of performance and load testing is a vital skill to master. Load tests can be run at an application level, covering the entire system, as well as at a modular level, covering an individual service or function. Combining the two approaches effectively will allow you to quickly spot performance trends within isolated components and in the overall user experience.
Basic Performance Testing with Apache Benchmark
The Apache Bench ab tool is an extremely easy-to-use performance benchmark tool. This CLI-driven tool works by generating a flood of requests to a given URL and returns performance-related metrics to the terminal. Although it is not a particularly flexible tool, the simplicity means that it is a great tool to reach for when you need to run quick performance tests. You can install this tool through your package manager. If you are using Windows, the alternative SuperBenchmarker can be installed via Chocolately. Once the tool is installed, you can simply type ab at the terminal to get a list of the available parameters. You will find yourself most commonly specifying -n for the number of requests to perform for the benchmarking session, -c for the number of concurrent requests to perform at a time, and the target URL. For example, to benchmark Google with 10 requests that are executed 2 at a time, you can run Example 12-8.
Example 12-8. Using Apache Bench ab to run a performance benchmark test against Google
$ ab -n 10 -c 2 http://www.google.com/
This is ApacheBench, Version 2.3 <$Revision: 1807734 $>
Copyright 1996 Adam Twiss, Zeus Technology Ltd, http://www.zeustech.net/
Licensed to The Apache Software Foundation, http://www.apache.org/

Benchmarking www.google.com (be patient).....done


Server Software:
Server Hostname:        www.google.com
Server Port:            80

Document Path:          /
Document Length:        271 bytes

Concurrency Level:      2
Time taken for tests:   0.344 seconds
Complete requests:      10
Failed requests:        0
Non-2xx responses:      10
Total transferred:      5230 bytes
HTML transferred:       2710 bytes
Requests per second:    29.11 [#/sec] (mean)
Time per request:       68.707 [ms] (mean)
Time per request:       34.354 [ms] (mean, across all concurrent requests)
Transfer rate:          14.87 [Kbytes/sec] received

Connection Times (ms)
              min  mean[+/-sd] median   max
Connect:       13   32  51.6     17     179
Processing:    14   18   3.5     16      23
Waiting:       13   17   3.1     16      23
Total:         28   50  50.4     35     193

Percentage of the requests served within a certain time (ms)
  50%     35
  66%     37
  75%     38
  80%     44
  90%    193
  95%    193
  98%    193
  99%    193
 100%    193 (longest request)
The Apache Bench tool is great for quick load tests, but its lack of configurability for ramping up virtual users (making the requests) and creating more-complex scenarios with assertion can be limiting. It can also be challenging to incorporate ab into a build pipeline and parse the output into a meaningful format. With this in mind, you can reach for alternative, more powerful, tools like Gatling
Load Testing with Gatling
Gatling is an open source load- and performance-testing tool based on Scala, Akka, and Netty. It is easy to run standalone or within a CD build pipeline, and the DSL (“performance tests as code”) and request-recording mechanisms for generating interactions provide a lot of flexibility. Gatling really shines over a basic load-testing tool by providing a lot of configuration in regards to how you simulate the VU interaction with the site, in terms of quantity, concurrency, and ramp-up. The DSL also allows you to specify assertions, such as HTTP status codes, payload content, and acceptable latencies, which means that this is a powerful tool.
Gatling can be downloaded from the project’s website. Core concepts within Gatling include the following:
- Simulation
-
The simulation file includes the various scenarios of a test, its parametrization, and the injection profiles.
- Scenario
-
A scenario consists of a series of requests and can be thought of as a user journey.
- Group
-
Groups can be used to subdivide a scenario. You can also think of groups as a module that has a functional purpose (for instance, the login process).
- Request
-
A request is exactly what you think it is: a user request made against the system under test.
- Injection profile
-
An injection profile is the number of virtual users injected during the test in the system under test and how they are injected.
The O’Reilly Docker Java Shopping example application contains a demonstration of how to run a Gatling-based load test against a Java application that is deployed via Docker Compose. The DSL allows you to write load-testing simulations as a Scala class, but don’t worry, only minimal knowledge is required with this language.
If you look at the simulation in Example 12-9, you will see the protocol being specified, which is simply how the requests will be made. In this case, the protocol is HTTP, and you are running the simulation as if your users were using the Mozilla browser. Next, a scenario is specified and a request execution (exec) is defined against the API. The final part of the simulation specifies the number of virtual users the simulation will run alongside the ramp-up, as well as any assertions you require. In this example, you are asserting that the maximum global response time was less that 50 ms, and that no requests failed.
Example 12-9. DjShoppingBasicSimulation Gatling Scala load test
packageuk.co.danielbryant.djshopping.performancee2etestsimportio.gatling.core.Predef._importio.gatling.http.Predef._importscala.concurrent.duration._classDjShoppingBasicSimulationextendsSimulation{valhttpProtocol=http.baseURL("http://localhost:8010").acceptHeader("text/html,application/xhtml+xml,application/xml;q=0.9,*/*;q=0.8").acceptEncodingHeader("gzip, deflate").acceptLanguageHeader("en-US,en;q=0.5").userAgentHeader("Mozilla/5.0 (Macintosh; Intel Mac OS X 10.8; rv:16.0)Gecko/20100101 Firefox/16.0")valprimaryScenario=scenario("DJShopping website and API performance test").exec(http("website").get("/").check(statusis200,substring("Docker Java"))).pause(7).exec(http("products API").get("/products").check(statusis200,jsonPath("$[0].id")is"1",jsonPath("$[0].sku")is"12345678"))setUp(primaryScenario.inject(constantUsersPerSec(30)during(30seconds)).protocols(httpProtocol)).assertions(global.responseTime.max.lessThan(50)).assertions(global.failedRequests.percent.is(0))}
You can execute the simulation via the SBT build tool, which is shown in Example 12-10.
Example 12-10. Run of Gatling to load-test the Docker Java Shop
$ git clone https://github.com/danielbryantuk/oreilly-docker-java-shopping
$ cd oreilly-docker-java-shopping
$ ./build_all.sh
$ [INFO] Scanning for projects...
[INFO]
[INFO] --------------< uk.co.danielbryant.djshopping:shopfront >---------------
[INFO] Building shopfront 0.0.1-SNAPSHOT
[INFO] --------------------------------[ jar ]---------------------------------
[INFO]
[INFO] --- maven-clean-plugin:2.6.1:clean (default-clean) @ shopfront ---

...

[INFO] --- maven-install-plugin:2.5.2:install (default-install) @ stockmanager ---
[INFO] Installing /Users/danielbryant/Documents/dev/daniel-bryant-uk/
                   tmp/oreilly-docker-java-shopping/
                   stockmanager/target/stockmanager-0.0.1-SNAPSHOT.jar to
                   /Users/danielbryant/.m2/repository/uk/co/danielbryant/
                   djshopping/stockmanager/0.0.1-SNAPSHOT/
                   stockmanager-0.0.1-SNAPSHOT.jar
[INFO] Installing /Users/danielbryant/Documents/dev/daniel-bryant-uk/
                   tmp/oreilly-docker-java-shopping/
                   stockmanager/pom.xml to
                   /Users/danielbryant/.m2/repository/uk/co/danielbryant/djshopping/
                   stockmanager/0.0.1-SNAPSHOT/stockmanager-0.0.1-SNAPSHOT.pom
[INFO] ------------------------------------------------------------------------
[INFO] BUILD SUCCESS
[INFO] ------------------------------------------------------------------------
[INFO] Total time: 12.653 s
[INFO] Finished at: 2018-04-07T12:12:55+01:00
[INFO] ------------------------------------------------------------------------
$
$ docker-compose -f docker-compose-build.yml up -d --build
Building productcatalogue
Step 1/5 : FROM openjdk:8-jre
 ---> 1b56aa0fd38c
...
Successfully tagged oreillydockerjavashopping_shopfront:latest
oreillydockerjavashopping_productcatalogue_1 is up-to-date
oreillydockerjavashopping_stockmanager_1 is up-to-date
oreillydockerjavashopping_shopfront_1 is up-to-date
$
$ sbt gatling:test

(master) performance-e2e-tests $ sbt gatling:test
[info] Loading project definition from /Users/danielbryant/Documents/dev/
                                        daniel-bryant-uk/tmp/
                                        oreilly-docker-java-shopping/
                                        performance-e2e-tests/project
[info] Set current project to performance-e2e-tests
       (in build file:/Users/danielbryant/Documents/dev/daniel-bryant-uk/tmp/
       oreilly-docker-java-shopping/performance-e2e-tests/)
Simulation uk.co.danielbryant.djshopping.performancee2etests
           .DjShoppingBasicSimulation started...

================================================================================
2018-04-07 14:49:00                                           5s elapsed
---- DJShopping website and API performance test -------------------------------
[-----------                                                               ]  0%
          waiting: 768    / active: 132    / done:0
---- Requests ------------------------------------------------------------------
> Global                                                   (OK=131    KO=0     )
> website                                                  (OK=131    KO=0     )
================================================================================


================================================================================
2018-04-07 14:49:05                                          10s elapsed
---- DJShopping website and API performance test -------------------------------
[#####------------------                                                   ]  7%
          waiting: 618    / active: 211    / done:71
---- Requests ------------------------------------------------------------------
> Global                                                   (OK=352    KO=0     )
> website                                                  (OK=281    KO=0     )
> products API                                             (OK=71     KO=0     )
================================================================================
...


================================================================================
2018-04-07 14:49:33                                          37s elapsed
---- DJShopping website and API performance test -------------------------------
[##########################################################################]100%
          waiting: 0      / active: 0      / done:900
---- Requests ------------------------------------------------------------------
> Global                                                   (OK=1800   KO=0     )
> website                                                  (OK=900    KO=0     )
> products API                                             (OK=900    KO=0     )
================================================================================

Simulation uk.co.danielbryant.djshopping.performancee2etests
           .DjShoppingBasicSimulation completed in 37 seconds
Parsing log file(s)...
Parsing log file(s) done
Generating reports...

================================================================================
---- Global Information --------------------------------------------------------
> request count                                       1800 (OK=1800   KO=0     )
> min response time                                      6 (OK=6      KO=-     )
> max response time                                    163 (OK=163    KO=-     )
> mean response time                                    11 (OK=11     KO=-     )
> std deviation                                          8 (OK=8      KO=-     )
> response time 50th percentile                         10 (OK=10     KO=-     )
> response time 75th percentile                         12 (OK=11     KO=-     )
> response time 95th percentile                         19 (OK=19     KO=-     )
> response time 99th percentile                         36 (OK=36     KO=-     )
> mean requests/sec                                 47.368 (OK=47.368 KO=-     )
---- Response Time Distribution ------------------------------------------------
> t < 800 ms                                          1800 (100%)
> 800 ms < t < 1200 ms                                   0 (  0%)
> t > 1200 ms                                            0 (  0%)
> failed                                                 0 (  0%)
================================================================================

Reports generated in 0s.
Please open the following file: /Users/danielbryant/Documents/dev/
                                daniel-bryant-uk/tmp/oreilly-docker-java-shopping/
                                performance-e2e-tests/target/gatling/
                                djshoppingbasicsimulation-1523108935957/index.html
Global: max of response time is less than 50 : false
Global: percentage of failed requests is 0 : true
[error] Simulation DjShoppingBasicSimulation failed.
[info] Simulation(s) execution ended.
[error] Failed tests:
[error]   uk.co.danielbryant.djshopping.performancee2etests.DjShoppingBasicSimulation
[error] (gatling:test) sbt.TestsFailedException: Tests unsuccessful
[error] Total time: 40 s, completed 07-Apr-2018 14:49:34
Gatling produces useful intermediate results when the tool is run via the CLI, and good summary information. When run via a build pipeline tool, it is also possible to generate HTML-based reports that are easy for an entire team to consume.
The Gatling Recorder Can Capture Interactions
The Gatling Recorder helps you to quickly generate scenarios by either acting as an HTTP proxy between the browser and the HTTP server or converting HAR (HTTP Archive) files. Either way, the Recorder generates a simple simulation that mimics your recorded navigation. This can be an invaluable way to generate interaction scripts and tests.
Security, Vulnerabilities, and Threats
Modern criminals are becoming increasingly technically savvy. This, in combination with more and more valuable (and private) data being managed in publicly networked computers, makes for a potential security challenge. Therefore, it is everyone’s job in a software delivery team to think about security, right from the beginning of the project. When attempting to implement continuous delivery, you need to be aware of and plan for many aspects of security. The CD build pipeline is often an effective location in which to codify and enforce security requirements. In this section, you will learn about code and dependency vulnerability checking, platform-specific security issues, and threat modeling.
Code-Level Security Verification
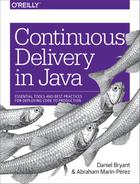
The go-to tool for checking Java code for known security issues is the Find Security Bugs plugin for the FindBugs static analyzer (mentioned previously). It can detect 125 vulnerability types with over 787 unique API signatures. This tool integrates nicely with build tools like Maven and Gradle, and will produce an XML and HTML report based on the findings.
The Find Security Bugs plugin documentation is comprehensive. On the Bug Patterns web page, you can find a full list of security issues that the plugin will find within your code. The following are some examples:
-
Predictable pseudorandom number generator
-
Untrusted servlet parameter or query string
-
Potentially sensitive data in a cookie
-
Potential path traversal (file read)
-
Potential command injection
-
TrustManager that accepts any certificates
-
XML parsing vulnerable to XML external entity (XXE) attack via
TransformerFactory -
Hardcoded passwords
-
Database and AWS query injection
-
Spring CSRF protection disabled
Example 12-11 is a simple Java application that is launched from a main method, and introduces several security bugs on purpose. The first is relatively easy to do, accidentally using Random in an attempt to generate cryptographically secure random numbers. The second is more obvious, and contains an unparsed argument value to a runtime execution (the same principle applies to SQL and other injection attacks)
Example 12-11. Simple Java application with obvious security issues
packageuk.co.danielbryant.oreillyexamples.builddemo;importorg.slf4j.Logger;importorg.slf4j.LoggerFactory;importjava.io.IOException;importjava.util.Random;publicclassLoggingDemo{publicstaticfinalLoggerLOGGER=LoggerFactory.getLogger(LoggingDemo.class);publicstaticvoidmain(String[]args){LOGGER.info("Hello, (Logging) World!");Randomrandom=newRandom();StringmyBadRandomNumString=Long.toHexString(random.nextLong());Runtimeruntime=Runtime.getRuntime();try{runtime.exec("/bin/sh -c some_tool"+args[1]);}catch(IOExceptioniox){LOGGER.error("Caught IOException with command",iox);}}}
A snippet from the project’s Maven POM is included in Example 12-12 that shows the inclusion of the Maven FindBugs plugin alongside the Find Security Bug plugin. You can see the Maven reporting that has been configured to include the generation of a Find Bugs HTML/site report.
Example 12-12. Including findbugs-maven-plugin with findsecbugs-plugin in a project
<?xml version="1.0" encoding="UTF-8"?><projectxmlns="http://maven.apache.org/POM/4.0.0"xmlns:xsi="http://www.w3.org/2001/XMLSchema-instance"xsi:schemaLocation="http://maven.apache.org/POM/4.0.0http://maven.apache.org/xsd/maven-4.0.0.xsd"><modelVersion>4.0.0</modelVersion>...<build><plugins>...<plugin><groupId>org.codehaus.mojo</groupId><artifactId>findbugs-maven-plugin</artifactId><version>3.0.5</version><executions><execution><phase>verify</phase><goals><goal>check</goal></goals></execution></executions><configuration><effort>Max</effort><threshold>Low</threshold><failOnError>true</failOnError><plugins><plugin><groupId>com.h3xstream.findsecbugs</groupId><artifactId>findsecbugs-plugin</artifactId><version>LATEST</version><!-- Auto-update to the latest stable --></plugin></plugins></configuration></plugin></plugins></build><reporting><plugins><plugin><groupId>org.codehaus.mojo</groupId><artifactId>findbugs-maven-plugin</artifactId><version>3.0.5</version></plugin></plugins></reporting></project>
You can now execute this plugin as part of the verify life cycle hook: mvn verify, as shown in Example 12-13.
Example 12-13. Building the insecure project with the FindBugs plugin enabled
$ mvn verify
/Library/Java/JavaVirtualMachines/jdk1.8.0_151.jdk/Contents/Home/bin/java
    -Dmaven.multiModuleProjectDirectory=/Users/danielbryant/Documents/dev/
    daniel-bryant-uk/builddemo "-Dmaven.home=/Applications/IntelliJ IDEA.app/
    Contents/plugins/maven/lib/maven3" "-Dclassworlds.conf=/Applications/
    IntelliJ IDEA.app/Contents/plugins/maven/lib/maven3/bin/m2.conf" "-javaagent:/
    Applications/IntelliJ IDEA.app/Contents/lib/idea_rt.jar=50278:/
    Applications/IntelliJ IDEA.app/Contents/bin" -Dfile.encoding=UTF-8 -classpath
    "/Applications/IntelliJ IDEA.app/Contents/plugins/maven/lib/maven3/boot/
    plexus-classworlds-2.5.2.jar" org.codehaus.classworlds.Launcher
    -Didea.version=2017.2.6 verify
objc[12986]: Class JavaLaunchHelper is implemented in both
    /Library/Java/JavaVirtualMachines/jdk1.8.0_151.jdk/Contents/Home/bin/java
    (0x10f1044c0) and /Library/Java/JavaVirtualMachines/jdk1.8.0_151.jdk/
    Contents/Home/jre/lib/libinstrument.dylib
    (0x10f1904e0). One of the two will be used. Which one is undefined.
[INFO] Scanning for projects...
[INFO]
[INFO] ------------------------------------------------------------------------
[INFO] Building builddemo 0.1.0-SNAPSHOT
[INFO] ------------------------------------------------------------------------
...
[INFO] >>> findbugs-maven-plugin:3.0.5:check (default) > :findbugs @ builddemo >>>
[INFO]
[INFO] --- findbugs-maven-plugin:3.0.5:findbugs (findbugs) @ builddemo ---
[INFO] Fork Value is true
     [java] Warnings generated: 3
[INFO] Done FindBugs Analysis....
[INFO]
[INFO] <<< findbugs-maven-plugin:3.0.5:check (default) < :findbugs @ builddemo <<<
[INFO]
[INFO] --- findbugs-maven-plugin:3.0.5:check (default) @ builddemo ---
[INFO] BugInstance size is 3
[INFO] Error size is 0
[INFO] Total bugs: 3
[INFO] This usage of java/lang/Runtime.exec(Ljava/lang/String;)Ljava/lang/Process;
       can be vulnerable to Command Injection [uk.co.danielbryant.oreillyexamples
       .builddemo.LoggingDemo, uk.co.danielbryant.oreillyexamples.builddemo
       .LoggingDemo] At LoggingDemo.java:[line 20]At LoggingDemo.java:[line 20]
       COMMAND_INJECTION
[INFO] Dead store to myBadRandomNumString in uk.co.danielbryant.oreillyexamples
       .builddemo.LoggingDemo.main(String[]) [uk.co.danielbryant.oreillyexamples
       .builddemo.LoggingDemo] At LoggingDemo.java:[line 16] DLS_DEAD_LOCAL_STORE
[INFO] The use of java.util.Random is predictable [uk.co.danielbryant
       .oreillyexamples.builddemo.LoggingDemo] At LoggingDemo.java:[line 15]
       PREDICTABLE_RANDOM
[INFO]


To see bug detail using the Findbugs GUI, use the following command
"mvn findbugs:gui"


[INFO] ------------------------------------------------------------------------
[INFO] BUILD FAILURE
[INFO] ------------------------------------------------------------------------
[INFO] Total time: 6.337 s
[INFO] Finished at: 2018-01-09T11:45:42+00:00
[INFO] Final Memory: 31M/465M
[INFO] ------------------------------------------------------------------------
[ERROR] Failed to execute goal org.codehaus.mojo:findbugs-maven-plugin:3.0.5:check
        (default) on project builddemo: failed with 3 bugs and 0 errors -> [Help 1]
[ERROR]
[ERROR] To see the full stack trace of the errors, re-run Maven with the -e switch.
[ERROR] Re-run Maven using the -X switch to enable full debug logging.
[ERROR]
[ERROR] For more information about the errors and possible solutions,
        please read the following articles:
[ERROR] [Help 1] http://cwiki.apache.org/confluence/display/
                 MAVEN/MojoExecutionException

Process finished with exit code 1
Because the plugin threshold has been set to low, as well as to fail on error, you will see that the build fails. This behavior can be fully configured—perhaps you want to fail the build only on major issues. When you generate the Maven site, the FindBugs web page in Figure 12-1 will be created.
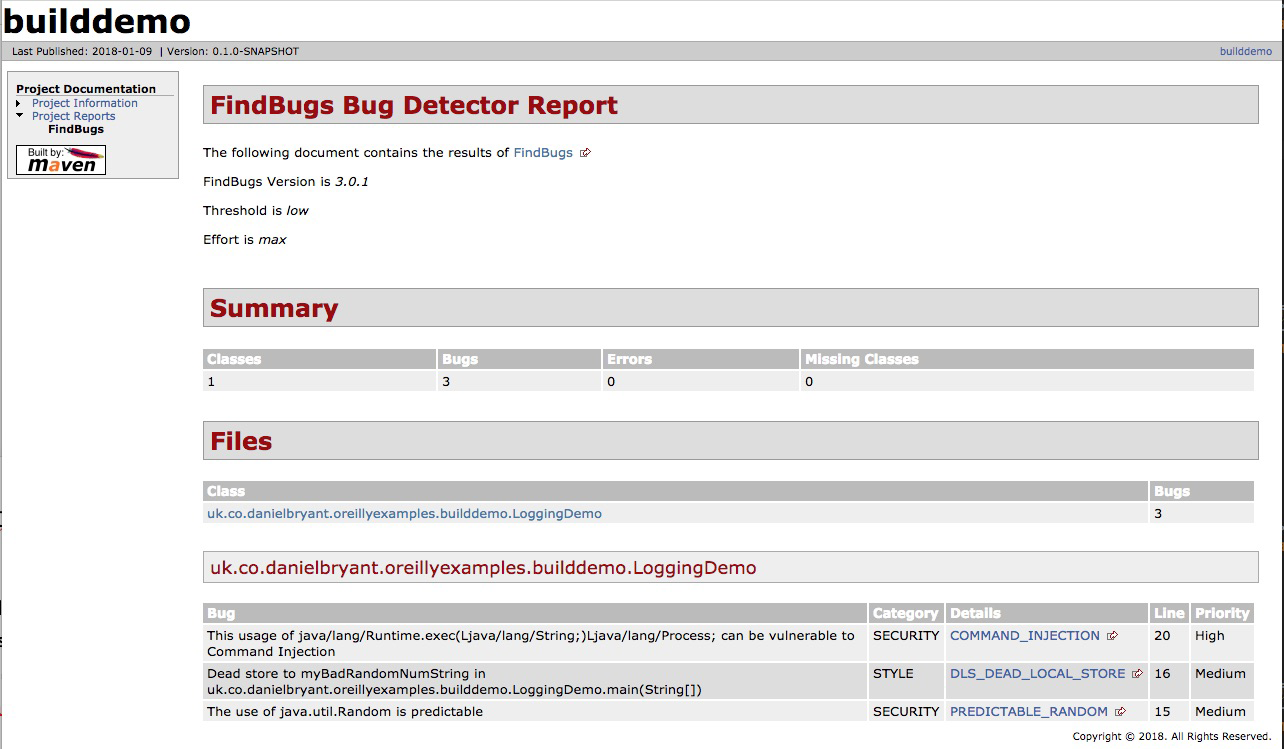
Figure 12-1. Output from the Maven FindBugs plugin with FindSecBugs enabled
Dependency Verification
It is important to verify the security properties of your code, but it is equally important to verify that the dependencies you are including within your project are equally secure. In a high-security environment (perhaps governmental or finance), this may involve scanning the codebases or binaries for all dependencies, and commercial tooling does exist to make this possible.
Depending on your security needs, a good first step (and perhaps solution) to this issue is to use the open source OWASP Maven Dependency Check plugin. This plugin contacts the National Vulnerability Database (NVD) and downloads a list of Java dependencies with known Common Vulnerabilities and Exposures (CVEs), and then examines all of dependencies—and their transitive dependencies—within your project, looking for a match. If you have imported a dependency with a known issue, this will be highlighted for you, and the plugin allows configuration to warn during or to fail the build. A sample Maven POM file is included in Example 12-14 for a project that includes dependencies with several known vulnerabilities.
Example 12-14. Project POM that includes dependencies with known vulnerabilities
<?xml version="1.0" encoding="UTF-8"?><projectxmlns="http://maven.apache.org/POM/4.0.0"xmlns:xsi="http://www.w3.org/2001/XMLSchema-instance"xsi:schemaLocation="http://maven.apache.org/POM/4.0.0http://maven.apache.org/xsd/maven-4.0.0.xsd"><modelVersion>4.0.0</modelVersion><groupId>uk.co.danielbryant.djshopping</groupId><artifactId>shopfront</artifactId><version>0.0.1-SNAPSHOT</version><packaging>jar</packaging><name>shopfront</name><description>Docker Java application Shopfront</description><parent><groupId>org.springframework.boot</groupId><artifactId>spring-boot-starter-parent</artifactId><version>1.5.7.RELEASE</version></parent>...<dependencies><!-- let's include a few old dependencies --></dependencies>...<build>...<plugin><groupId>org.owasp</groupId><artifactId>dependency-check-maven</artifactId><version>3.0.1</version><configuration><centralAnalyzerEnabled>false</centralAnalyzerEnabled><failBuildOnCVSS>8</failBuildOnCVSS></configuration><executions><execution><goals><goal>check</goal></goals></execution></executions></plugin></plugins></build></project>
You can see the sample Maven verify output in Example 12-15.
Example 12-15. Build output when running verify against a project with known vulnerable dependencies
$ mvn verify
[INFO] Scanning for projects...
[INFO]
[INFO] ------------------------------------------------------------------------
[INFO] Building shopfront 0.0.1-SNAPSHOT
[INFO] ------------------------------------------------------------------------
...
[INFO]
[INFO] --- dependency-check-maven:3.0.1:check (default) @ shopfront ---
[INFO] Central analyzer disabled
[INFO] Checking for updates
[INFO] Skipping NVD check since last check was within 4 hours.
[INFO] Check for updates complete (16 ms)
[INFO] Analysis Started
[INFO] Finished Archive Analyzer (0 seconds)
[INFO] Finished File Name Analyzer (0 seconds)
[INFO] Finished Jar Analyzer (1 seconds)
[INFO] Finished Dependency Merging Analyzer (0 seconds)
[INFO] Finished Version Filter Analyzer (0 seconds)
[INFO] Finished Hint Analyzer (0 seconds)
[INFO] Created CPE Index (2 seconds)
[INFO] Finished CPE Analyzer (2 seconds)
[INFO] Finished False Positive Analyzer (0 seconds)
[INFO] Finished Cpe Suppression Analyzer (0 seconds)
[INFO] Finished NVD CVE Analyzer (0 seconds)
[INFO] Finished Vulnerability Suppression Analyzer (0 seconds)
[INFO] Finished Dependency Bundling Analyzer (0 seconds)
[INFO] Analysis Complete (6 seconds)
[WARNING]

One or more dependencies were identified with known vulnerabilities in shopfront:

jersey-apache-client4-1.19.1.jar (cpe:/a:oracle:oracle_client:1.19.1,
com.sun.jersey.contribs:jersey-apache-client4:1.19.1) : CVE-2006-0550
xstream-1.4.9.jar (cpe:/a:x-stream:xstream:1.4.9,
cpe:/a:xstream_project:xstream:1.4.9,
com.thoughtworks.xstream:xstream:1.4.9) : CVE-2017-7957
netty-codec-4.0.27.Final.jar (cpe:/a:netty_project:netty:4.0.27,
io.netty:netty-codec:4.0.27.Final) : CVE-2016-4970, CVE-2015-2156
ognl-3.0.8.jar (ognl:ognl:3.0.8,
cpe:/a:ognl_project:ognl:3.0.8) : CVE-2016-3093
maven-core-3.0.jar (org.apache.maven:maven-core:3.0,
cpe:/a:apache:maven:3.0.4) : CVE-2013-0253
tomcat-embed-core-8.5.20.jar (cpe:/a:apache_software_foundation:tomcat:8.5.20,
cpe:/a:apache:tomcat:8.5.20, cpe:/a:apache_tomcat:apache_tomcat:8.5.20,
org.apache.tomcat.embed:tomcat-embed-core:8.5.20) : CVE-2017-12617
bsh-2.0b4.jar (cpe:/a:beanshell_project:beanshell:2.0.b4,
org.beanshell:bsh:2.0b4) : CVE-2016-2510
groovy-2.4.12.jar (cpe:/a:apache:groovy:2.4.12,
org.codehaus.groovy:groovy:2.4.12) : CVE-2016-6497


See the dependency-check report for more details.


[INFO]
[INFO] --- maven-install-plugin:2.5.2:install (default-install) @ shopfront ---
[INFO] Installing /Users/danielbryant/Documents/dev/daniel-bryant-uk/
                   oreilly-docker-java-shopping/shopfront/target/
                   shopfront-0.0.1-SNAPSHOT.jar to /Users/danielbryant/.m2/
                   repository/uk/co/danielbryant/djshopping/shopfront/
                   0.0.1-SNAPSHOT/shopfront-0.0.1-SNAPSHOT.jar
[INFO] Installing /Users/danielbryant/Documents/dev/daniel-bryant-uk/
                   oreilly-docker-java-shopping/shopfront/pom.xml to
                   /Users/danielbryant/.m2/repository/uk/co/danielbryant/
                   djshopping/shopfront/0.0.1-SNAPSHOT/shopfront-0.0.1-SNAPSHOT.pom
[INFO] ------------------------------------------------------------------------
[INFO] BUILD SUCCESS
[INFO] ------------------------------------------------------------------------
[INFO] Total time: 23.946 s
[INFO] Finished at: 2018-01-09T12:20:47Z
[INFO] Final Memory: 35M/120M
[INFO] ------------------------------------------------------------------------
In addition to the preceding build information, you can produce a report that contains more details, including links to more information on each CVE found; see Figure 12-2.
Once you have identified dependencies with known CVEs, it is up to you to resolve this issue. Often, a newer version of the plugin exists, and you can upgrade (and of course, run your comprehensive test suite to ensure that this upgrade causes no issues or regressions), but sometime it doesn’t. Your alternative options are to find another dependency that offers similar functionality and modify your code to use this, or attempt to fix the vulnerability yourself, by forking the dependency and taking ownership of this codebase. Occasionally, neither of these alternatives is appropriate; perhaps you are maintaining very large legacy codebase that makes extensive use of the vulnerable dependency, or you don’t have the skillset to fork and modify the dependency. This then leaves you with a difficult decision, because although doing nothing may seem appealing, it is also dangerous.

Figure 12-2. HTML report from the Maven Dependency Check plugin
You will need to conduct a thorough audit and analysis of the vulnerability, known exploits, and attack vector. You must communicate the risks within your organization and document the known vulnerability. You can also take steps to mitigate the risk—perhaps for a known vulnerability that requires OS-level access for an exploit to be undertaken, you may increase security around accessing the instances running your application. If there are no known exploits, or the attack vector is extremely obtuse, you may choose to do nothing more. But be warned: this is not simply a technical decision—the business must be consulted about this risk
Mitigating Risks Is a Business Decision: Be a Professional
We cannot stress enough the risks of ignoring security or vulnerability issues. You must inform and work closely with your business team if a problem is identified, because the decision of how to mitigate a risk is not just technical, it is also business related. Simply ignoring issues (or not checking for them in the first place) is at best case unprofessional—and at worst case, potentially criminally negligent.
Deployment Platform-Specific Security Issues
Each of the three deployment platforms you are learning about in this book has specific security properties and practices that it would be wise to learn more about.
Cloud security
The core change in regards to security practices from on-premises infrastructure to public cloud is knowledge of the “shared responsibility model.” Azure has created a short guide, “Shared Responsibilities for Cloud Computing”, that introduces the shared responsibilities across the various service models. Figure 12-3 is taken from this guide, and clearly shows how your responsibilities for security differ as you move from on-premises to SaaS.
Amazon Web Services has also created a useful (although somewhat AWS-specific) whitepaper, “AWS Security Best Practices”, that explains the concept in depth, but in essence the model states that the cloud platform vendor is responsible for ensuring the security of certain parts of the platform, and you, the developer, are responsible for your code and configuration that is deployed onto the platform. Figure 12-4 shows IaaS offerings, such as EC2 compute and virtual private cloud (VPC) networking, and the shared responsibility.
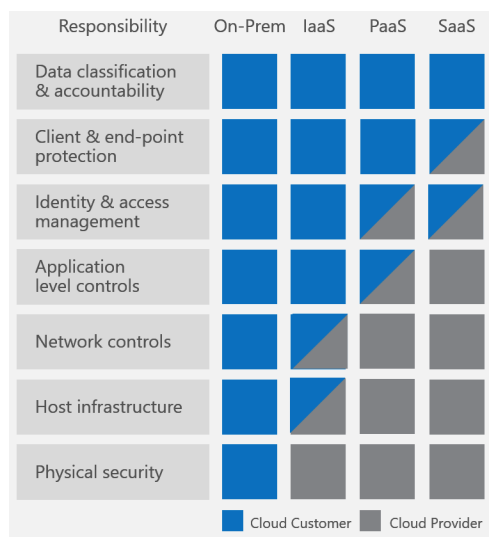
Figure 12-3. Azure shared responsibilities for different cloud service models (taken from the Azure Shared Responsibilities for Cloud Computing document)
Figure 12-4. Shared responsibility model for infrastructure services (taken from the AWS Security Best Practices document)
We strongly encourage you to read the AWS and Azure shared responsibility guides and also the documentation from the other cloud vendors.
Other common “gotchas” for engineers moving to the public cloud include the importance of correctly managing API and SDK keys, which provide secured programmatic access to the cloud. It is all too easy for these keys to end up accidentally stored within code or committed to a DVCS. Once a key is exposed publicly, bad actors can use this to create infrastructure to perform illegal operations, such as DDoS attacks, or mine for cryptocurrency. Not only will you be charged money for the use of the cloud platform resources, but you could be legally liable for damage, too! These keys must be targeted to individual users; use the principle of least privilege (i.e., allow the smallest amount of access to accomplish the intended work); and be audited, well protected, and rotated regularly.
Cloud Security 101: The Shared Responsibility Model and Key Management
If you and your team are moving to a public cloud platform for the first time, the two core security concepts you must learn more about are the shared responsibility model and API/SDK access key management and security.
A public cloud platform often provides a higher level of security than an on-premises solution; after all, the cloud vendor has large, dedicated teams managing this. But you will have to play your part, too. In addition to managing API keys, you need to manage identity access management (IAM) users, group, and roles, as well as network security, often implemented by security groups (SGs) and network access control lists (NACLs). Core security concepts, such as securing data in rest and in transit, also change slightly with cloud usage. Finally, if you are managing your own VMs and operating systems, you will also be responsible for patching the software here.
As with any new technology, there is lots to learn, but there are many good cross-cloud resources like the online A Cloud Guru learning platform. Each cloud vendor also typically offers a security review platform and associated automated tooling, as well as professional services.
Container security
The primary issue with container security is that “with great power, comes great responsibility,” and in particular, this relates to the deployable artifact (the container image), as this now includes an operating system in addition to the Java application artifact. Container technology allows you to quickly deploy your applications and the supporting containerized infrastructure, such as queues and databases. However, the attack surface exposed by this is considerably larger than with traditional application artifacts and sysadmin-managed infrastructure. For this reason, we recommend the use of a static image vulnerability scanner as part of your continuous delivery pipeline.
The open source tool we recommend in this space is Clair from CoreOS. It can be challenging to get Clair working, especially when integrating within your build pipelines. Accordingly, Armin Coralic has created a Docker-based installation of Clair that is well worth exploring. There are also various commercial offerings in this space, and some container registry vendors, like Quay and Docker Enterprise, offer security scanning as part of this. There are also standalone image scanners like that offered by Aqua.
Static Container Image Scanning Is as Important as Code Scanning
Container technology allows convenient packaging of application artifacts, but you must not forget that you are typically including components (such as an operating system and associated tooling) in comparison with traditional artifacts. Accordingly, vulnerability scanning of images should be an essential part of any pipeline delivering applications as container images.
We also recommend learning more about operating systems, and building minimal images in order to minimize the attack surface. For example, instead of using a full Ubuntu distro for your OS, use Debian Jessie or Alpine, and instead of including a full JDK, include a JRE instead. Starting from Java 9, you could also investigate using the module system to build a smaller JRE. This is beyond the scope of a book this size, but we would recommend consulting Java 9 Modularity (O’Reilly) by Sander Mak and Paul Bakker for more information on this process and tooling such as jlink.
FaaS/Serverless security
The security issues for FaaS and serverless platforms are largely aligned with the issues discussed in Cloud Security. This is because the FaaS platforms are typically a subset of the larger cloud infrastructure offerings. Guy Podjarny, CEO of the Synk security company, has created a great InfoQ article that highlights key security issues with serverless technologies, “Serverless Security: What’s Left to Protect”, and the primary issues discussed revolve around the importance of code and dependency vulnerability scanning and function provenance (tracking all of your functions)
Next Steps: Threat Modeling
Threat modeling is a structured approach that enables you to identify, quantify, and address the security risks associated with an application. The inclusion of threat modeling within the design and development process can help ensure that applications are being developed with security built in from the beginning. This is important, as even with modern, flexible architectures like microservices, it can still be difficult (or extremely costly) to retrofit security into a new system that is nearing completion. Baking in security from the start, in combination with the documentation produced as part of the threat-modeling process, can provide a reviewer with a greater understanding of the system, and allows for easier identification of entry points to the application and the associated threats with each entry point. The OWASP Application Threat modeling website states that the concept of threat modeling is not new, but a clear mindset change has occurred in recent years: modern threat modeling looks at a system from a potential attacker’s perspective, as opposed to a defender’s viewpoint.
The threat modeling process can be decomposed into three high-level steps, presented next.
Decompose the application
This involves creating use cases to understand how the application is used, identifying entry points to see where a potential attacker could interact with the application, identifying assets (i.e., items/areas that the attacker would be interested in), and identifying trust levels that represent the access rights that the application will grant to external entities. This information is documented and used to produce data flow diagrams (DFDs) for the application, as shown in Figure 12-5.
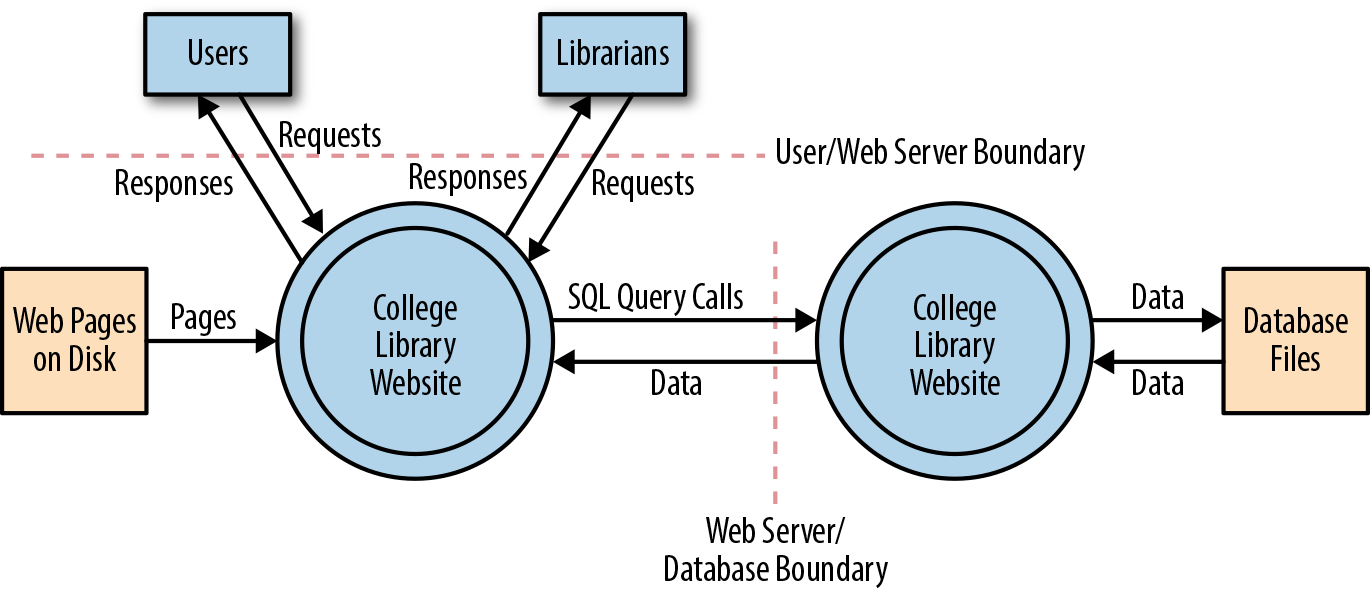
Figure 12-5. Data flow diagram for the College Library Website (image courtesy of the OWASP Application Threat Modeling website)
Determine and rank threats
Critical to the identification of threats is using a threat categorization methodology, such as STRIDE (an acronym for Spoofing, Tampering, Repudiation, Information disclosure, Denial of service, and Elevation of privilege). A threat categorization provides a set of threat categories with corresponding examples so that threats can be systematically identified in the application in a structured and repeatable manner. DFDs produced in step 1 help identify the potential threat targets from the attacker’s perspective, such as data sources, processes, data flows, and interactions with users. Threats can be further analyzed by using a threat tree (shown in Figure 12-6) in order to explore the attack paths, the root causes (e.g., vulnerabilities) for the threat to be exploited, and the necessary mitigation controls (e.g., countermeasures, depicted as third-level leaf nodes).
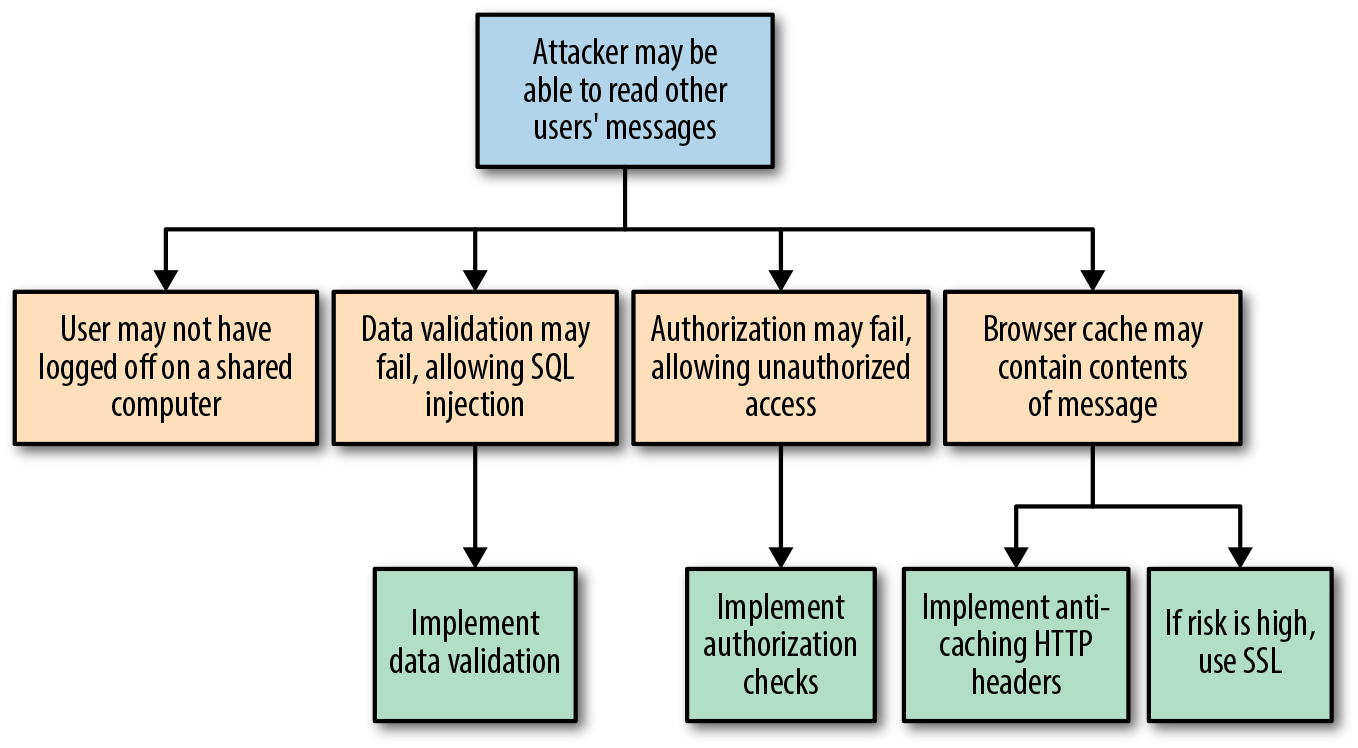
Figure 12-6. Threat tree (image courtesy of the OWASP Application Threat Modeling website)
Threats can be ranked from the perspective of various factors, all depending on the approach and methodology applied. A risk-centric threat model such as PASTA (Process for Attack Simulation & Threat Analysis) focuses on prioritization based on risks to the product, information owners, business, or other stakeholders. A security-centric approach may rank threats based on ease of exploitation or technical impact to the product or application. A software-centric approach may prioritize threats based on the adverse effects they may have against functional use cases and software features.
Determine countermeasures and mitigation
A lack of protection against a threat might indicate a vulnerability whose risk exposure could be mitigated with the implementation of a countermeasure. The purpose of the countermeasure identification is to determine whether there is some kind of protective measure (e.g., security control, policy measures) in place that can prevent each threat previously identified via threat analysis from being realized. Vulnerabilities are then those threats that have no countermeasures. Risk management is used to reduce the impact that the exploitation of a threat can have to the application, and this can be done by responding to a threat with a risk mitigation strategy. In general, there are five options to mitigate threats:
Do nothing (for example, hope for the best)
Inform about the risk (for example, warn user population about the risk)
Mitigate the risk (for example, by putting countermeasures in place)
Accept the risk (for example, after evaluating the business impact of the exploitation)
Transfer the risk (for example, through contractual agreements and insurance)
Terminate the risk (for example, shut down, turn off, unplug, or decommission the asset)
The decision of which strategy is most appropriate depends on the impact an exploitation of a threat can have, the likelihood of its occurrence, and the costs for transferring (i.e., costs for insurance) or avoiding it (i.e., costs or losses due to redesign or reimplementation).
Chaos Testing
The concept of chaos engineering and resilience testing has become increasingly popular over the last year, even though pioneers such as Netflix have been talking about this for quite some time. One of the major concepts of working with infrastructure as code and with cloud and container environments is designing for failure. This is mentioned in nearly all the major cloud vendor best-practice documents, and the main idea behind designing for failure is accepting that things are going to go wrong, and making sure your application and infrastructure is set up to handle that.
However, it is one thing to say that your system is resilient; it is quite another to prove it by running chaos tooling attempts to tear your infrastructure apart and inject all manner of faults. Tooling such as Netflix’s Chaos Monkey (and associated Simian Army collection) are relatively mainstream, and many recent conference presentations feature a mention of chaos. However, use of this technology often requires an advanced level of infrastructure and operational skill, the ability to design and execute experiments, and available resources to manually orchestrate the failure scenarios in a controlled manner.
Chaos engineering is fundamentally the discipline of experimenting on a distributed system in order to build confidence in the system’s capability to withstand turbulent conditions in production, and is not simply about breaking things in production. According to the Principles of Chaos Engineering website, in order to specifically address the uncertainty of distributed systems at scale, chaos engineering can be thought of as the facilitation of experiments to uncover systemic weaknesses. These experiments follow four steps:
-
Start by defining steady state as some measurable output of a system that indicates normal behavior.
-
Hypothesize that this steady state will continue in both the control group and the experimental group.
-
Introduce variables that reflect real-world events such as servers that crash, hard drives that malfunction, network connections that are severed, etc.
-
Try to disprove the hypothesis by looking for a difference in steady state between the control group and the experimental group.
The harder it is to disrupt the steady state, the more confidence we have in the behavior of the system. If a weakness is uncovered, we now have a target for improvement before that behavior manifests in the system at large.
Causing Chaos in Production (Bring in the Monkeys)
Running chaos experiments in production is a relatively advanced pattern, so please apply caution before rushing off to try some of the tooling mentioned in this section! Arguably, chaos engineering began in 2011, with the publication of the Netflix blog post “The Netflix Simian Army”, which properly introduced the Chaos Monkey and assorted friends to the world. Let’s have a look at the various chaos engineering tools available for each platform.
Cloud chaos
If you are working with the AWS platform, the original Chaos Monkey tool is still available as a standalone project on GitHub. You will have to install Golang on your local (or test) machine, but this is easily accomplished by using a package manager. The standalone Chaos Monkey should work with any backend that the Netflix/Google build tool Spinnaker supports (AWS, Google Compute Engine, Azure, Kubernetes, Cloud Foundry), and the documentation states it has been tested with AWS, GCE, and Kubernetes. If you are working with Azure, the Microsoft blog post Induce Controlled Chaos in Service Fabric Clusters is the place to learn about the tooling offered for this platform, of which the primary offering is the Azure Fault Analysis Service.
Container (and Kubernetes) chaos
PowerfulSeal a Kubernetes-specific chaos testing tool written by the Bloomberg engineering team, was inspired by the infamous Netflix Chaos Monkey. PowerfulSeal is written in Python, and is very much a work in progress at the time of writing. It has only “cloud drivers” for managing infrastructure failure for the OpenStack platform, although a Python AbstractDriver class has been specified in order to encourage the contribution of drivers for additional cloud platforms.
PowerfulSeal works in two modes—interactive and autonomous:
-
Interactive mode is designed to allow an engineer to discover a cluster’s components and manually cause failure to see what happens. It operates on nodes, pods, deployments, and namespaces.
-
Autonomous mode reads a policy file, which can contain any number of pod and node failure scenarios, and “breaks things” as specified. Each scenario describes a list of matches, filters, and actions to execute on your cluster.
Each scenario can consist of matches and filters (target node names, IP addresses, Kubernetes namespaces and labels, times and dates) and actions (start, stop, and kill). A comprehensive JSON schema can be used to validate the policy files, and an example policy file listing most of the available options can be found within the project’s tests.
PowerfulSeal can be installed via pip, and the command-line tool is initialized and configured against a Kubernetes cluster as follows:
-
Point PowerfulSeal at the target Kubernetes cluster by giving it a Kubernetes config file.
-
Point PowerfulSeal at the underlying cloud IaaS platform by specifying the appropriate cloud driver and credentials.
-
Ensure that PowerfulSeal can SSH into the nodes in order to execute commands.
-
Write the required policy files and load these into PowerfulSeal.
FaaS/Serverless chaos
As the FaaS paradigm is relatively new, there isn’t much in the way of chaos testing tools for this platform. Yan Cui has written a series of Medium posts on the topic, which demonstrate how to inject latency into AWS Lambda innovations, and the Serverless framework team has built on Ben Kehoe’s work on Monkeyless Chaos. Although both of these sources are interesting, the accompanying work is still in an early stage and is predominantly conceptual.
Causing Chaos in Preproduction
Causing chaos in production may (quite rightly) be too risky for many organizations initially, but this is not to say that you can’t benefit from the principles in a preproduction environment. Using service virtualization tooling like Hoverfly allows you to simulate service dependencies and inject middleware into the tool, which can modify the response. The middleware can be written in any language, or be deployed as a binary, or target an HTTP endpoint. However, it is most common to write the middleware in a scripting language like Python or JavaScript, as these languages have great support for modifying JSON and HTTP headers, and they also execute fast. As shown in Figure 12-7, with middleware active in Hoverfly, each time a request/response is simulated, the middleware is started as a separate (forked) process that has full access to the associated request/response JSON.
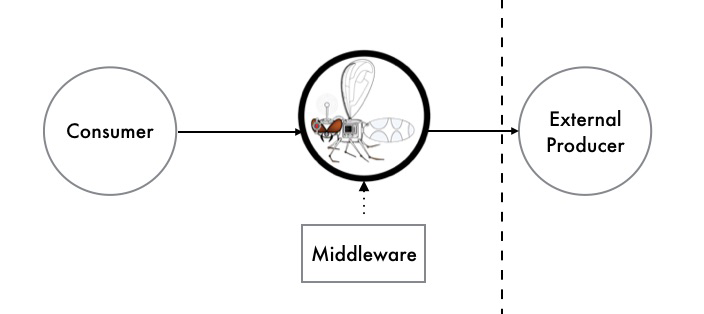
Figure 12-7. Causing chaos with Hoverfly middleware
Using middleware allows you to write simple scripts to modify the response and deterministically simulate the effects of increased latency, corrupted responses, and failures scenarios within the dependency.
This is a relatively low-risk approach to chaos testing, as you can simulate failure within your local development environment by using the Hoverfly JUnit rule, or a CD build pipeline or QA/staging environment by running Hoverfly as a standalone binary with the middleware configuration specified via the CLI parameters.
How Much NFR Testing Is Enough?
Answering the question of how much nonfunctional requirement (NFR) testing is required for a product or project is nearly impossible, or very much like the answer to “How long is a piece of string?” How much effort you choose to invest in this will depend on the stage of your business and the resources and time you have available. If your business does not have product/market fit, experimenting to figure out what functionality to offer is most likely the highest priority. Likewise, if your leadership team has not dedicated (or allowed) any engineering time and energy to this type of testing, then the results will simply be best effort.
There are several “smells” to look for, though, which may indicate you would benefit from more nonfunctional testing:
-
New team members have a difficult time understanding the design and code of the application.
-
You are having difficulty extending the application; or every time you attempt to modify the architecture, everything breaks, and you don’t know why.
-
Your team is undertaking time-consuming manual performance and security verification.
-
Worse, your customers are reporting performance and security issues.
-
You are experiencing frequent production issues.
-
All of your after-incident retrospectives point to the root causes as being very simple (e.g., the application ran out of disk space, the network experienced a small temporary amount of latency, or a user supplied bad data).
Balancing the correct amount of nonfunctional testing is, much like all jobs of a technical leader, about trade-offs. Here it is typically time/expense versus velocity/stability.
Summary
In this chapter, you learned about the key concepts for testing what is commonly referred to as the nonfunctional requirements of a system:
The nonfunctional perspective of code quality consists of reducing time-to-context (how readable is the code for another developer, and can someone else quickly understand the implementation logic?) and being free of deficiencies.
Architecture quality can be maintained by having an experienced developer or architect look at the code once a week, identify violations, and correct them. Realistically, a more practical method is to define the rules and violations in code and then automatically assert the properties as part of your continuous integration build.
Understanding the performance characteristics of your application and its individual service components is extremely invaluable. Load tests can be run at an application level, covering the entire system, and at a modular level, covering an individual service or function.
It is everyone’s job in a software delivery team to think about security, right from the beginning of the project. The CD build pipeline is often an effective location in which to codify and enforce security requirements, from code and dependency issues to other threats.
The concept of chaos engineering and resilience testing has become increasingly popular, primarily driven by pioneers such as Netflix. One of the major concepts of working with infrastructure as code and with cloud environments is designing for failure, and chaos engineering provides an approach to define a hypothesis, run experiments, and determine how failure is handled.
Knowing how much NFR testing is enough is a difficult question to answer. However, there are several “smells” to look for, which may indicate you would benefit from more nonfunctional testing.
In the next chapter, you will learn about how to observe your systems through monitoring, logging, and tracing.