Table of Contents for
Learning HTTP/2
 Learning HTTP/2
Published by
O'Reilly Media, Inc., 2017
Learning HTTP/2
Published by
O'Reilly Media, Inc., 2017
- nav
- Cover
- Learning HTTP/2
- Learning HTTP/2
- Preface
- Foreword
- 1. The Evolution of HTTP
- 2. HTTP/2 Quick Start
- 3. How and Why We Hack the Web
- 4. Transition to HTTP/2
- 5. The HTTP/2 Protocol
- 6. HTTP/2 Performance
- 7. HTTP/2 Implementations
- 8. Debugging h2
- 9. What Is Next?
- A. HTTP/2 Frames
- B. Tools Reference
- Index
- About the Authors
- Colophon
Chapter 8. Debugging h2
Spending nearly 2 decades with a protocol means 20 years of tools for monitoring and debugging. Now HTTP/2 comes along, and your old way of doing things no longer works. This could be a mission-critical blocker until tools are updated or replaced. Regardless, h2 is a different though vaguely similar beast to h1. Much of what worked before will work now, but the differences are important. Fortunately, there is already a rich supply of test and debugging tools available, ranging from things that are specific to HTTP/2 to updates to your current toolsets that you already use.
Web Browser Developer Tools
Most modern web browsers include web developer tools that are useful for debugging h2. The following sections are a few examples of how you can follow an h2 stream, identify h2 priorities and dependencies, and understand Server Push using Chrome and Firefox Developer Tools. Note that similar concepts can be applied to other popular browsers like Safari, Edge, or Opera.
Chrome Developer Tools
Over the past few years the Chrome browser has gained adoption among web developers in part due to the increasing functionality of its Web Developer tools.1 Being familiar with their capabilities can provide you an advantage for solving your next technical snafu. Pull up the developer tool by choosing View → Developer → Developer Tools in the Chrome menu.
Net internals
Chrome net-internals2 can be accessed by typing chrome://net-internals in Chrome’s address bar. These tools provide a look at the network data, including capturing/exporting/importing low-level network data, checking network and DNS logs, and visualizing network activity.
The net-internal tools can be used to capture HTTP/2 traffic, which is useful to illustrate some HTTP/2 concepts like:
-
Stream IDs
-
Priorities
-
Dependencies
-
Server-Push promises
-
Session
PINGs
Here are the steps to do a capture of HTTP/2 traffic:
-
Type
chrome://net-internalsin Chrome’s address bar. -
Select
HTTP/2from the left sidebar. -
Open a new tab and type the your favorite URL in the address bar.
-
Go back to the net-internals tab, where you will see a list of all the active sessions to hostnames that use the HTTP/2 protocol.
-
Click the
IDlink located on the right side of the hostname of the entered URL (see Figure 8-1).
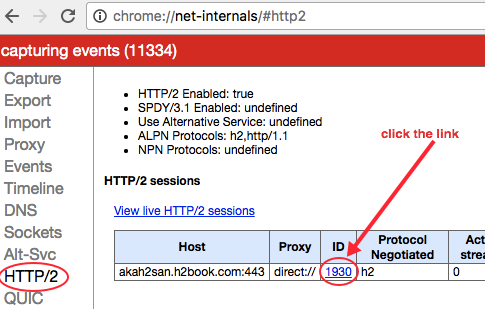
Figure 8-1. Net-internals HTTP/2
-
The context will change to
Events. Click the checkbox located on the left side of the hostname (Figure 8-2).
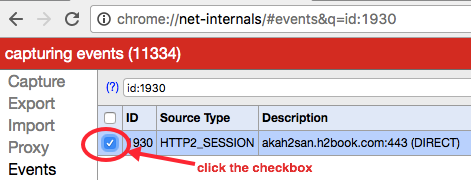
Figure 8-2. Net-internals Events
-
On the right side of this page you should see a capture of all the traffic between the web server and the client.
Let’s review some of the fields used in the capture. Each “event” starts with something like this:
t=timestamp [st= milliseconds] EVENT_TYPE
For example:
t=123808 [st= 1] HTTP2_SESSION_SEND_HEADERS
-
The first field “t” indicates the timestamp, in milliseconds, since the browser session started. For example, a value of 123808 indicates the HTTP/2 session has started 123.8 seconds after the browser’s session started.
-
The second field “st” indicates the relative number of milliseconds since the HTTP/2 session started. For example, a value of 1 indicates the event happened 1 millisecond after the HTTP/2 was started.
-
The third field shows the type of event recorded.
Note
Some of the Chrome h2 events correspond directly to h2 frame types. For example, HTTP2_SESSION_RECV_PUSH_PROMISE indicates a PUSH_PROMISE frame type, an HTTP2_SESSION_PING corresponds to a PING frame, and so on.
Let’s look at a sample capture to give you a feel for how to read them and to see what HTTP/2 information we can pull out:
t=791301 [st= 1] HTTP2_SESSION_SEND_HEADERS--> exclusive = true --> fin = true
--> has_priority = true
--> :method: GET
:authority: akah2san.h2book.com :scheme: https :path: / cache-control: max-age=0 upgrade-insecure-requests: 1 user-agent: Mozilla/5.0 (Macintosh; Intel Mac... accept: text/html,application/xhtml+xml,... accept-encoding: gzip, deflate, sdch, br accept-language: en-US,en;q=0.8 cookie: [30 bytes were stripped] if-none-match: "11168351bd3324ad3e43ed68195063c5:1464989325" --> parent_stream_id = 0
--> stream_id = 1
--> weight = 256
...
Here is the event information line as described previously
fin = trueindicates that there is no additional head frame comingThis request has priorities set
The HTTP headers on the frame start here
The associated parent stream in stream 0
This stream has ID 1 (the first client request)
The relative weight for dependencies is 256
By looking at the net-internal events you can get a clear picture of precisely what is happening when and even look inside the protocol.
Note
If reading this output from Chrome makes you cross-eyed, you are not alone—and there is help. Rebecca Murphy created a brilliant little tool called chrome-http2-log-parser that, as she says, takes the HTTP/2 net-internals output and turns “it into something more useful.” We agree.
Server Push visualization
The Network tab of Chrome’s Developer Tools panel is useful for visually following the communication between the client and the server, while displaying a bunch of useful information in a table format like:
-
Object’s name
-
Object’s size
-
Status code
-
Priority
-
Total load time
-
Breakdown of load times within a timeline
Let’s look at an example. Load the web page https://akah2san.h2book.com/ (a simple page that loads over HTTP/2 and uses Server Push).
In the Network tab, you should see something like Figure 8-3.
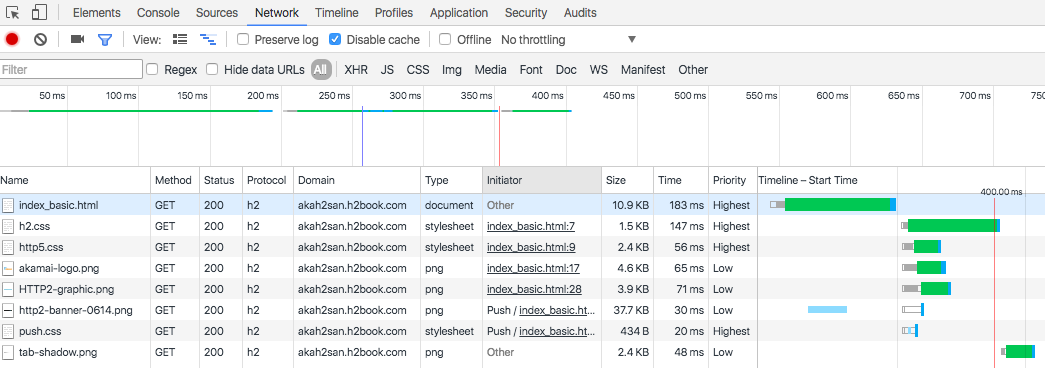
Figure 8-3. Server Push timeline
The Network tab tells us that the HTML loads three stylesheets and four PNG images. From those seven objects, two of them (/resources/push.css and /resources/http2-banner-0614.png) are “pushed” to the client, while the other five load normally.
If we mouse over one of the objects in the waterfall on the righthand side of the pane, we will see a breakdown on the different stages while the object was fully loaded. Here is the explanation of the information displayed (see Figure 8-4):
-
Connection Setup
-
Queueing: Time the request was postponed by the rendering engine or network layer.
-
Stalled: Time the request spent waiting before it could be sent.
-
-
Request/Response
-
Request Sent: Time spent issuing the network request.
-
Waiting (TTFB): Time spent waiting for the initial response, also known as the Time To First Byte. This number captures the latency of a round-trip to the server in addition to the time spent waiting for the server to deliver the response.
-
Content Download: Time spent receiving the response data.
-
-
Total time (labeled Explanation)
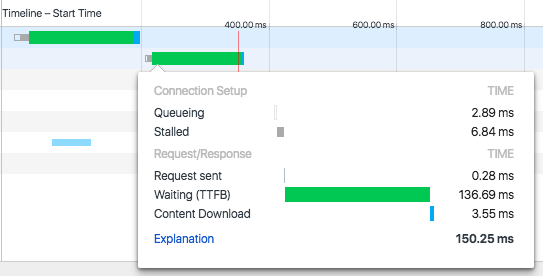
Figure 8-4. Server Push timeline h2.css
If we mouse over one of the objects that are pushed by the server, we will see the information shown in Figure 8-5:
-
Server Push
-
Receiving Push: Time it takes to receive all the bytes for the pushed object
-
-
Connection Setup
-
Queueing: Time the request was postponed by the rendering engine or network layer
-
-
Request/Response
-
Reading Push: Time it takes for the browser to read the bytes pushed from the temporary cache
-
-
Total time (labeled Explanation)
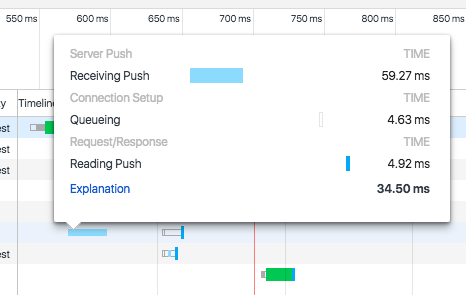
Figure 8-5. Server Push timeline push.css
Chrome session key logging
Both Chrome and Firefox provide the ability to log the TLS session key used for encrypting particular encrypted connections in the browser. It is incredibly useful for using external tools such as Wireshark (see “Wireshark”) to examine the traffic and look at the HTTP/2 frames. This functionality is triggered by setting the appropriate environment variable to the location you want the keys logged before you launch the browser. For example, on OS X you could do:
$ SSLKEYLOGFILE=~/keylog.txt$open /Applications/Google\Chrome.app/Contents/MacOS/Google\Chrome
Mozilla has a good description of this process written up at https://developer.mozilla.org/en-US/docs/Mozilla/Projects/NSS/Key_Log_Format.
Firefox Developer Tools
The Firefox browser provides a variety of tools to help web developers. In the next few sections we’ll describe some of Firefox’s features that are useful to debug web content delivered over HTTP/2.
Logging HTTP sessions
Logging HTTP sessions can be useful for debugging purposes, and Firefox’s HTTP Session logging can provide you a lot of insight into what is going on over the wire. There is no in-browser mechanism for getting those captures from Firefox at this time. A bit of command-line hacking is required.
Let’s use Firefox’s HTTP Session logging to do a capture of HTTP/2 traffic, which will illustrate some HTTP/2 concepts like:
-
Stream IDs
-
Priorities
-
Dependencies
-
Server-Push promises
-
Session
PINGs
To enable logging, use the following commands in the Windows command prompt:
cdc:\setNSPR_LOG_MODULES=timestamp,nsHttp:5,nsSocketTransport:5,nsStreamPump:5, ^ nsHostResolver:5setNSPR_LOG_FILE=%TEMP%\firefox_http_log.txtcd"Program Files (x86)\Mozilla Firefox".\firefox.exe
or MAC OS terminal:
exportNSPR_LOG_MODULES=timestamp,nsHttp:5,nsSocketTransport:5,\nsStreamPump:5,nsHostResolver:5exportNSPR_LOG_FILE=~/Desktop/firefox_http_log.txtcd/Applications/Firefox.app/Contents/MacOS ./firefox-bin
Note
A text file called firefox_http_log.txt will be saved in the directory indicated by the shell variable NSPR_LOG_FILE. If you set the variable GECKO_SEPARATE_NSPR_LOGS=1, each child process will get logged to its own file. Each log file will have the name you specify in the NSPR_LOG_FILE environment variable, but with the string “.child-X” appended to it, where X is a different number for each child process.
You can control the verbosity of the log file by updating the values of the shell variable NSPR_LOG_FILE in a couple of ways:
-
Reducing the number on the right of the module. For example,
nsHttp:3indicates less verbosity thannsHttp:5. See Table 8-1 for a list of debug values. -
Removing a module from the list. For example,
NSPR_LOG_MODULES=timestamp,nsHttp:5is less verbose thanNSPR_LOG_MODULES=timestamp,nsHttp:5,nsSocketTransport:5,nsStreamPump:5. You can get the most verbose logging by usingNSPR_LOG_MODULES=all:5.
Note
See Firefox Log Modules for a more comprehensive list of modules that can be included in the logs.
| Level | Description |
|---|---|
0 |
nothing should be logged |
1 |
important; intended to always be logged |
2 |
errors |
3 |
warnings |
4 |
debug messages, notices |
5 |
everything! |
Firefox session key logging
Firefox, like Chrome, can log the TLS session keys. See “Chrome session key logging” for a description.
Debugging h2 on iOS Using Charles Proxy
Debugging h2 on iOS is not straightforward due to TLS encryption, the iOS security model, and a general lack of visibility. This section explains how to debug iOS devices by using a computer running Charles Proxy.3 Charles Proxy is, as its name implies, a proxy. By configuring your devices to go through this proxy you can see precisely what requests and responses are occurring. This is what you already get in browsers like Chrome and Firefox, but is lacking for browsers like Safari on iOS, and native iOS applications.
Note
You need to use Charles Proxy version 4 (or higher) to ensure HTTP/2 support. Additionally, though an excellent tool worthy of adding to your toolbox, Charles Proxy is not free. For the purposes of trying it out and following along with the book, a time-limited trial version is available. A free alternative would be to use nghttp2 (see “nghttp2”) in proxy mode.
The debugging process consists on installing Charles Proxy on a machine, then installing its root certificate on the device you want to proxy (so Charles Proxy can “man in the middle” and decrypt TLS traffic), and finally configuring the proxy settings on the iOS device to point to the IP and port of the host computer running Charles Proxy. We’ll explain how to do this using an iOS Simulator, and using an actual iOS device.
iOS Simulators
To get Charles Proxy set up to debug h2 in an iOS Simulator running on the same machine, follow these steps:
-
Quit your iOS Simulator.
-
Launch Charles Proxy.
-
Open the Help menu and choose SSL Proxying → Install Charles Root Certificate in iOS Simulators (this will install it into all of your local iOS Simulators).
Now when you start the iOS Simulator, you should be able to access TLS websites with Charles Proxy using TLS Proxying.
iOS devices
In order to debug HTTPS traffic on iOS devices you need to run a proxy on a computer and change the iOS device network settings to use the proxy running on that computer.
Warning
It is best to use a dedicated iOS device for debugging as installing the Charle’s Proxy root certificate may replace any existing configuration profiles on the iOS device.
On the host computer:
-
Start Charles Proxy.
-
On the Proxy menu select Proxy Settings and ensure the port is set to 8888 (you can use Dynamic Port if you have problems connecting to the 8888 port).
-
On the Proxy menu select SSL Proxy Settings, click Add, and type the hostname you want to monitor on the Host field (or use * to monitor any site).
-
On the Proxy menu select Access Control Settings and add the IP of the iOS device (or just 0.0.0.0/0 to allow all devices to connect).
-
On the Help menu select Local IP Address, write down your local IP address, and close the window (you will need to use that IP as a proxy server on the iOS device).
-
On the File menu select New Session to start recording traffic.
For more information on this process, see https://www.charlesproxy.com/documentation/proxying/ssl-proxying/.
Next, on the iOS device:
-
Open the Settings app → “Wifi settings,” and then click the Information icon that looks like (i) located on the right of the WiFi network you are connected to.
-
In the list that appears, scroll down to the HTTP PROXY section and select Manual.
-
In the Server field that appears, put the IP of the host computer, and in the port field put 8888 (or enter a different number if you are using a dynamic port).
-
Click the home button, start Safari, and point the browser to chls.pro/ssl (or http://www.charlesproxy.com/getssl/) to install Charles’s proxy root certificate (needed to decrypt TSL traffic).
Now you should be able to access TLS websites with Charles using SSL Proxying (except for apps that use pinned certificates–like some Apple native apps).
Debugging h2 on Android
You have to do a small amount of setup before you can start debugging h2 on Android. On the Android device open up Settings, find the Developer options section, and enable USB debugging (if you’re running Android 4.2 or later and you can’t find Developer options, you may need to enable it4).
Once you have done that, on your development computer:
-
Open Chrome (and make sure you are logged in to one of your user profiles, as this debugging method does not work in incognito or guest mode).
-
Choose View → Developer → Developer Tools and select More tools → Remote devices from the “…” menu on the right. From here you can see the status of all connected remote devices (make sure that Discover USB devices is enabled).
-
Connect your Android device using a USB cable to a USB port on your development computer (don’t use any USB hubs).
-
Authorize the connection on the Android device the first time you connect it to the computer by tapping the “Allow USB debugging” prompt on your Android device and grant the permissions. Once you authorize the device you will see the Android Device as Connected.
You can now inspect traffic on the device. You can also enable the “toggle screencast” button to view the screen of your Android device from within your DevTools panel.
WebPagetest
WebPagetest is a free web-based performance monitoring tool for measuring various aspects of a website’s performance. It leverages server farms of web browsers distributed around the world, allowing you to test how your site performs under various different network conditions and browser types. Other features that are worth noting are:
-
Ability to script a test in various ways to emulate a full browser session
-
Saving filmstrips and videos of the web page loading for later comparison across runs
-
Getting full packet traces for use in tools like Wireshark (see “Wireshark”)
-
Adjusting various network parameters to limit bandwidth, increase latency, and introduce loss
It is a great way to see how your changes might perform in a wide variety of situations. It is a subject that requires much more detail than can be provided here, and for that detail we recommend checking out the book Using WebPagetest, by Rick Viscomi, Andy Davies, and Marcel Duran (O’Reilly) to learn more.
OpenSSL
OpenSSL5 is an open source implementation of the SSL and TLS protocols in the form of a software library (delivered over Apache and BSD license agreements) that allows applications to secure communications. This section focuses on the command-line tool also known as openssl, and how to use it to debug HTTP/2.
OpenSSL Commands
Since many web browsers only support HTTP/2 over HTTPs, the openssl command is useful for verifying whether a web server’s SSL certificate meets all the requirements for HTTP/2. Here’s how you check (just replace “akah2san.h2book.com” with the hostname you want to check):
$echo|openssl s_client -connect\akah2san.h2book.com:443 -servername akah2san.h2book.com\-alpn spdy/2,h2,h2-14|grep ALPN ... ALPN protocol: h2
Note
The | grep ALPN command at the end filters the output to just a couple of lines. If you omit that, you will see the full output from the openssl s_client command, which has information that is useful for debugging your TLS configuration. It includes your certificate chain, your certificate, what ciphers are negotiated, ALPN negotiation, and a variety of other details. Spend some time with this tool and it will pay you back handsomely.
nghttp2
nghttp2 is an implementation of HTTP/2 and its header compression algorithm HPACK in C.
The framing layer of HTTP/2 is implemented as a form of reusable C library. On top of that, nghttp2 provides the tools listed in Table 8-2.
| Tool | Description |
|---|---|
|
A command-line client |
|
A server |
|
A proxy |
|
A load testing tool |
|
HPACK command-line header decompression tool |
|
HPACK command-line header compression tool |
This section focuses on the command-line client, known as nghttp.
Using nghttp
You can use nghttp to debug an HTTP/2 URL and display HTTP/2 frame information.
Some useful parameters you can pass to nghttp are:
-
-v(prints debug information) -
-n(discards downloaded data like HTML bodies) -
-a(downloads embedded assets indicated on the HTML that are delivered over the same hostname) -
-s(prints statistics) -
-H <header>(adds a header to the request, for example:-H':method: PUT') -
--version(displays version information, and exits)
Note
Use nghttp --help to see a list of all the available parameters.
The following command shows an example of using nghttp with the n and s parameters to discard the downloaded data, and download statistics, respectively:
$nghttp -ns https://akah2san.h2book.com/hello-world.html ***** Statistics ***** Request timing: responseEnd: thetimewhen last byte of response was received relative to connectEnd requestStart: thetimejust before first byte of request was sent relative to connectEnd. If'*'is shown, this was pushed by server. process: responseEnd - requestStart code: HTTP status code size: number of bytes received as response body without inflation. URI: request URI see http://www.w3.org/TR/resource-timing/#processing-model sorted by'complete'id responseEnd requestStart process code size request path2+142.85ms * +35.89ms 106.96ms20064/resources/push.css13+175.46ms +128us 175.33ms200169/hello-world.html
If you examine the preceding output, you may notice a couple of interesting items as a result of HTTP/2 Push:
-
Here, /resources/push.css was downloaded although the parameter
awas not indicated. That was because that asset was pushed by the server as the*on therequestStartindicates. -
/resources/push.css was downloaded before the HTML itself.
A complete example of using nghttp and examining the output can be found in “A Simple GET”.
curl
curl6 is a software project originally authored by Daniel Stenberg providing a library (libcurl) and command-line tool (curl) for transferring data using various protocols. Though it uses the nghttp2 libraries for its HTTP/2 support, it is much more common than nghttp and different enough to merit its own slot in your debugging toolbox. As of the time of writing, curl was available in 261 packages, across 34 operating systems. You can use the curl download wizard7 to help find the right package for you.
Using curl
To use curl with HTTP/2, pass in the --http2 option on the command line. Adding -v will provide some rich debugging data on whatever URL you specify. Much of the information we were able to get using the openssl tool is made readily available in the verbose curl output. Here is an example:
$curl-v--http2https://akah2san.h2book.com/hello-world.html*Trying2001:418:142b:19c::2a16...*Connectedtoakah2san.h2book.com(2001:418:142b:19c::2a16)port443(#0)*ALPN,offeringh2...*SSLconnectionusingTLSv1.2/ECDHE-RSA-AES256-GCM-SHA384*ALPN,serveracceptedtouseh2*Servercertificate:*subject:CN=akah2san.h2book.com*startdate:Aug1217:59:002016GMT*expiredate:Nov1017:59:002016GMT*subjectAltName:host"akah2san.h2book.com"matchedcert's "akah2san.h2book.com" * issuer: C=US; O=Let'sEncrypt;CN=Let'sEncryptAuthorityX3*SSLcertificateverifyok.*UsingHTTP2,serversupportsmulti-use*Connectionstatechanged(HTTP/2confirmed)...*UsingStreamID:1(easyhandle0x7f8d59003e00)>GET/hello-world.htmlHTTP/1.1>Host:akah2san.h2book.com>User-Agent:curl/7.49.1>Accept:*/*>*Connectionstatechanged(MAX_CONCURRENT_STREAMSupdated)!*HTTP1.0,assumecloseafterbody<HTTP/2200<server:Apache<content-length:169...<<html><headlang="en"><metahttp-equiv="Content-Type"content="text/html; charset=UTF-8"><title>HelloHTTP/2</title></head><body>HelloHTTP/2</body></html>*Closingconnection0*TLSv1.2(OUT),TLSalert,Clienthello(1):
ALPN information
TLS information (similar to what we saw with
openssl)Stream data
We used HTTP/2 and we got a 200 response. Life is good.
The page content
Measuring page load times
You can use curl’s w parameter to print useful performance metrics (see the curl man page8 for reference).
By adding the following parameter to a curl request (note that the parameter includes some text formatting):
-w "Connection time: %{time_connect}\t1st byte transfer:
  %{time_starttransfer}\tDownload time: %{time_total}
    (sec)\tDownload Speed: %{speed_download} (bps)\n"
you will see metrics like:
-
Connection time
-
First byte time
-
Download time
-
Total time
-
Download speed (indicating how many bytes you can send per second)
For example:
$curl -v --http2 https://akah2san.h2book.com/hello-world.html -w\"Connection time: %{time_connect}\t \1st byte transfer: %{time_starttransfer}\t \Download time: %{time_total} (sec)\t \Download Speed: %{speed_download} (bps)\n"...omitting a bunch of lines... * Connection#0 to host akah2san.h2book.com left intactConnectiontime: 0.054 1st byte transfer: 0.166 Downloadtime: 0.166(sec)Download Speed: 1016.000(bps)
h2i
h2i9 is an interactive HTTP/2 console debugger created by Brad Fitzpatrick, which allows sending “raw” HTTP/2 frames to the server. It will allow you to interact with an HTTP/2 server directly in much the same way you could do with h1 previously with tools like telnet or openssl.
h2i just requires indicating the hostname of a website that supports HTTP/2. Once you connect you will see an h2i> prompt, which allows sending HTTP/2 frames to the server.
The following example shows using the h2i client to request https://www.google.com/ (note that long lines are truncated with <cut> as needed):
$ h2i www.google.com
Connecting to www.google.com:443 ...
Connected to 172.217.5.100:443
Negotiated protocol "h2"
[FrameHeader SETTINGS len=18]
  [MAX_CONCURRENT_STREAMS = 100]
  [INITIAL_WINDOW_SIZE = 1048576]
  [MAX_HEADER_LIST_SIZE = 16384]
[FrameHeader WINDOW_UPDATE len=4]
  Window-Increment = 983041

h2i> headers
(as HTTP/1.1)> GET / HTTP/1.1
(as HTTP/1.1)> Host: www.google.com
(as HTTP/1.1)>
Opening Stream-ID 1:
 :authority = www.google.com
 :method = GET
 :path = /
 :scheme = https
[FrameHeader HEADERS flags=END_HEADERS stream=1 len=445]
  :status = "200"
  date = "Wed, 01 Mar 2017 00:08:06 GMT"
  expires = "-1"
  cache-control = "private, max-age=0"
  content-type = "text/html; charset=ISO-8859-1"
  p3p = "CP=\"This is not a P3P policy! See <cut>
  server = "gws"
  x-xss-protection = "1; mode=block"
  x-frame-options = "SAMEORIGIN"
  set-cookie = "NID=98=OOy2zBP3TY9GM37WXG9PFtN <cut>
  alt-svc = "quic=\":443\"; ma=2592000; v=\"35,34\""
  accept-ranges = "none"
  vary = "Accept-Encoding"
[FrameHeader DATA stream=1 len=16384]
  "<!doctype html><html itemscope=\"\" itemtype=\"http://schema.org/WebPage\"
   lang=\"en\"> <head><meta content=\"Search the world's information, including
   webpages, images, videos and more. Google has many special features to help
   <cut>
[FrameHeader PING len=8]
  Data = "\x00\x00\x00\x00\x00\x00\x00\x00"
h2i> quit
Wireshark
Wireshark10 is a popular network packet analyzer with a built-in understanding of hundreds of higher-level protocols, including HTTP/2. This means it can not only pull packets off the wire similar to venerable tools like tcpdump, it can reassemble those packets into the higher-level protocol you want to examine. It comes in the form of a GUI as well as a command-line tool called tshark.
The Wireshark website11 has binaries for Windows and macOS for download and simple installation. In addition there are links to port and packages for another 20 or so various Unix/Linux flavors. It is well supported and easy to get.
Using Wireshark to look at h2 is made complicated by the fact that most all HTTP/2 is over TLS. This means in a Wireshark dump you will see TLS packets but the sniffer will not be able to see inside those packets. This is the general idea behind TLS, after all. In “Firefox session key logging” and “Chrome session key logging” we discussed how to get Firefox and Chrome to log the keying material so Wireshark can use it to look inside the TLS packet. That feature plus the HTTP/2 plug-in that currently ships with Wireshark make it possible to see precisely what is going on in an HTTP/2 session.
Using the tshark command you can get output like the following:
$ tshark port 443 and host www.example.com
Capturing on 'Wi-Fi'
  1   0.000000 TCP 78 65277→443 [SYN] Seq=0 Win=65535 Len=0 MSS=1460
       WS=32 TSval=1610776917 TSecr=0 SACK_PERM=1
  2   0.096399 TCP 74 443→65277 [SYN, ACK] Seq=0 Ack=1 Win=14480 Len=0 MSS=1460
       SACK_PERM=1 TSval=2815107851 TSecr=1610776917 WS=128
  3   0.096489 TCP 66 65277→443 [ACK] Seq=1 Ack=1 Win=131744 Len=0
       TSval=1610777007 TSecr=2815107851
  4   0.096696 SSL 264 Client Hello
...
 33   0.386841 TCP 66 65277→443 [ACK] Seq=1043 Ack=7845 Win=128160
       Len=0 TSval=1610777288 TSecr=2815108131
 34   0.386842 TCP 66 [TCP Window Update] 65277→443 [ACK] Seq=1043
       Ack=7845 Win=131072 Len=0 TSval=1610777288 TSecr=2815108131
 35   0.386887 TCP 66 65277→443 [ACK] Seq=1043 Ack=9126 Win=129760
       Len=0 TSval=1610777288 TSecr=2815108131
 36   0.436502 HTTP2 143 HEADERS
 37   0.535887 TCP 1514 [TCP segment of a reassembled PDU]
 38   0.536800 HTTP2 1024 HEADERS, DATA
 39   0.536868 TCP 66 65277→443 [ACK] Seq=1120 Ack=11532
       Win=130112 Len=0 TSval=1610777433 TSecr=2815108271
This example dump gives you visibility into TCP, TLS, and HTTP/2. Other options12 allow you to dig deep into all of those items to see precisely what is going on.
Summary
You can use the tools described in this chapter for quick tasks like verifying if your existing certificate includes the required h2 ciphers, low-level debugging of the HTTP communication, or setting up a simple h2 web server for more advanced testing. Knowing how to do these types of things will help you learn more about h2 and aid you in the transition of your website to the h2 protocol.