Table of Contents for
Learning HTTP/2
 Learning HTTP/2
Published by
O'Reilly Media, Inc., 2017
Learning HTTP/2
Published by
O'Reilly Media, Inc., 2017
- nav
- Cover
- Learning HTTP/2
- Learning HTTP/2
- Preface
- Foreword
- 1. The Evolution of HTTP
- 2. HTTP/2 Quick Start
- 3. How and Why We Hack the Web
- 4. Transition to HTTP/2
- 5. The HTTP/2 Protocol
- 6. HTTP/2 Performance
- 7. HTTP/2 Implementations
- 8. Debugging h2
- 9. What Is Next?
- A. HTTP/2 Frames
- B. Tools Reference
- Index
- About the Authors
- Colophon
Chapter 6. HTTP/2 Performance
One of the goals of HTTP/2 was improved performance. For some, this is the only reason to switch over. Though h2 will generally be faster than HTTP/1.1 for web page delivery, it is not always the case. Understanding the conditions that affect h2’s performance is an important part of tuning your site and understanding end users’ experiences. Many variables need to be taken into consideration when measuring the performance of h2, and this assesment goes well beyond classifications of “slower” or “faster.” This chapter will explore the most important factors that contribute to real-world HTTP/2 performance.
Client Implementations
HTTP/2 is a young protocol and as is often the case, implementations, though spec compliant, can vary in subtle but important ways. For example, browsers like Chrome, Firefox, Safari, and Microsoft Edge all have different quirks that may affect a user’s experience on your site. The performance of the same website using different clients from within the same network connection can show considerable differences in page load times. Understanding these differences can be a critical part of tuning your site for the largest possible audience.
Akamai’s Foundry Team performed a study of HTTP/1.1 versus HTTP/2 performance with a goal of understanding how different browsers compare. It involved looking at billions of Real User Monitoring (RUM) measurements from real devices under real network conditions. The results showed differences between the browsers, and for the most part h2 requests were faster than h1 requests (Figure 6-1).
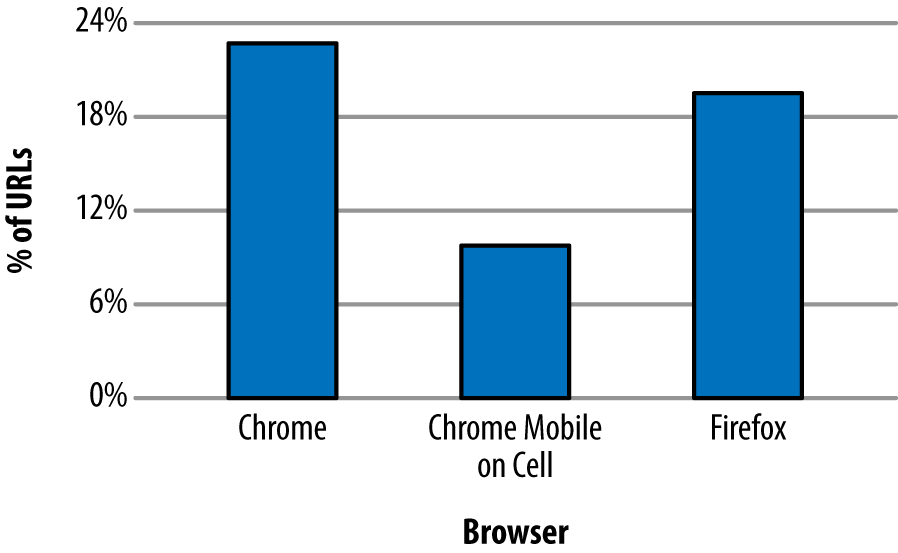
Figure 6-1. Percentage of URLs with a statistically significant performance improvement with HTTP/2
Mission accomplished, right? As it turns out, no. The study also showed that some URLs experienced a drop in performance when running h2 (see Figure 6-2 for details).
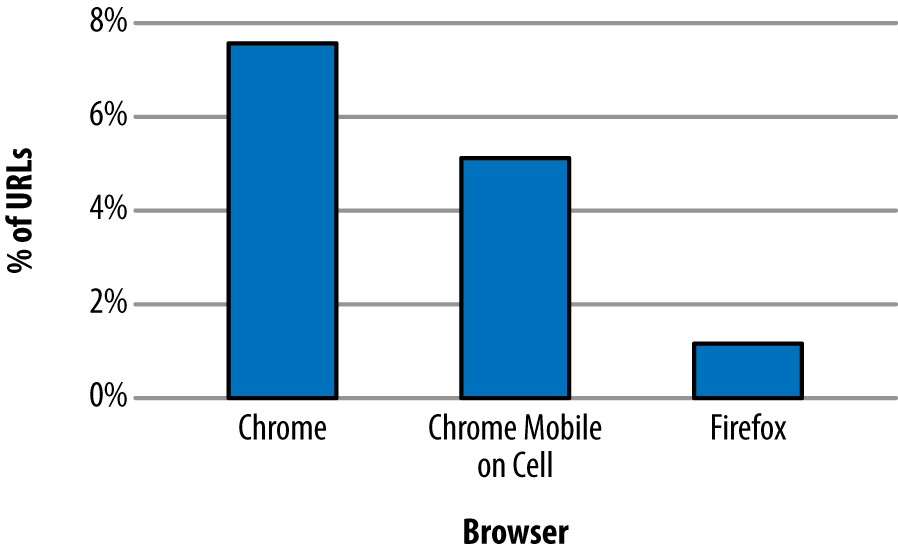
Figure 6-2. Percentage of URLs with a statistically significant drop in performance with HTTP/2
Why would h2 ever be slower? It is important to understand that the study was looking at individual requests, not full page loads. That means the only room for improvement lies in header compression, connection reuse, and an avoidance of head of line blocking. Items such as multiplexing and Server Push, which are more focused on improving the performance of a group of requests on a page, will not have an effect. Even so, many more URLs show a performance improvement with h2 versus a loss. The difference in the data highlights two important points: first, implementations matter, and second, not all requests will benefit from HTTP/2 under all circumstances.
Latency
In computer networks, latency is how much time it takes for a packet of data to get from one point to another. It is sometimes expressed as the time required for a packet to travel to the receiver and back to the sender, or Round-Trip Time (RTT), and it is generally measured in milliseconds (ms).
Many factors contribute to latency, but two of the more influential are the distance between the two points and the speed of the transmission medium used. For wired networks those mediums are generally made of optical fiber and/or copper wires, while mobile/wireless networks leverage radio waves. To determine the theoretical smallest latency between two points, you need to look at the speed of light in those mediums and the length of the lines between them. For example, the speed of light in optical fiber is about 2/3 the speed of light in a vacuum or around 200,000,000 meters per second. So if you stretched a fiber-optic cable straight from San Francisco to London, which is around 8500 km, you would have a lowest possible latency of about 43 ms. The only way to lower that latency would be to bring the endpoints closer together (or develop a faster medium).
Note
Regardless of advances in transmission mediums, the speed of light is a hard limit. Thus, bringing the two endpoints closer together has the most opportunity for improving latency. Continental drift may take care of the SF → London problem in time, but the impatient who prefer to not work in geological timescales may want to deploy servers closer to their end users around the world or leverage a CDN (see “Content Delivery Networks (CDNs)”).
Of course, if you check you will never actually see a latency measurement that low. First, the networks are not laid out in straight lines. Second, delays are introduced by the various gateways, routers, switches, cell towers, etc. (as well as your server application itself), that your data needs to pass through in order to get from A to B.
You can measure the latency between a client and a server easily by using the ping command tool, which is available in most operating systems.
Here’s how to use the ping command to measure the RTT to the Wikipedia website:
$ping -c4www.wikipedia.org PING www.wikipedia.org(208.80.154.224)56(84)bytes of data.64bytes from text-lb.eqiad.wikimedia.org(...):icmp_req=1ttl=50time=70.4 ms64bytes from text-lb.eqiad.wikimedia.org(...):icmp_req=2ttl=50time=70.7 ms64bytes from text-lb.eqiad.wikimedia.org(...):icmp_req=3ttl=50time=70.5 ms64bytes from text-lb.eqiad.wikimedia.org(...):icmp_req=4ttl=50time=70.5 ms --- www.wikipedia.org ping statistics ---4packets transmitted,4received, 0% packet loss,time3002ms rtt min/avg/max/mdev=70.492/70.571/70.741/0.284 ms
Note
The ping command was run from a client computer located in San Jose, California.
According to GEO location data, the server IP 208.80.154.224 that was hosting Wikipedia was located in Ashburn, VA (about 3850 km or 2392 miles apart from the client in California).
Table 6-1 provides sample average latency values, depending on the transport medium.
| Media type | Average RTT |
|---|---|
Fiber |
17–22 ms |
Cable |
15–30 ms |
DSL |
32–52 ms |
Mobile Networks |
40-1000 ms depending on the wireless technology like LTE (fastest), HSPA, or GSM/Edge (slowest) |
Satellite |
600–650 ms |
Warning
Be aware that some mobile devices may turn off the mobile radio for short periods of time to save battery, which can add up to several seconds of latency for new connections if the device has to wake up the mobile radio hardware.
To measure the impact of latencies in h2, we configured a simple website that represents an average web page of the top 1000 websites in terms of size, in bytes, and number of objects. We then used a CDN (see “Content Delivery Networks (CDNs)”) in front of the site so that we could manually hit servers in different areas of the world to get a variety of “real” latencies. Using the free web-based performance testing tool Web Page Test (aka WPT; see “WebPagetest”) we loaded the page over h1 and h2 using Chrome and Firefox agents.
Table 6-2 shows the impact of latency on page load time when using h1 versus h2. The PLT times are the average of repeating the test 20 times over a period of 2 days; each test consists of 9 “First View” WPT runs.
| Origin location | Latency | h1 PLT Chrome (ms) | h2 PLT Chrome (ms) | h1 PLT Firefox (ms) | h2 PLT Firefox (ms) |
|---|---|---|---|---|---|
New York, USA |
15 ms |
4518 |
5064 |
4673 |
4637 |
Montreal, Canada |
39 ms |
4719 |
5325 |
4815 |
4718 |
Dallas, TX, USA |
42 ms |
4728 |
4986 |
4965 |
4995 |
Paris, France |
97 ms |
6248 |
5765 |
5634 |
5402 |
Cairo, Egypt |
129 ms |
6873 |
5272 |
5266 |
5256 |
Rio de Janeiro, Brasil |
142 ms |
7302 |
5932 |
6055 |
6220 |
One thing that should jump out from the data is that generally, as the distance from the origin increases and hence the latency, the performance of h2 relative to h1 improves.
Packet Loss
Packet loss happens when packets of data traveling across a computer network fail to reach their destination; this is usually caused by network congestion. Packet loss is measured as a percentage of packets lost with respect to the number of packets sent. High packet loss has a detrimental impact on pages delivered over h2, mostly because h2 opens a single TCP connection, and the TCP protocol reduces the TCP window size each time there is loss/congestion (see “Inefficient use of TCP”).
A recent study on HTTP/2 performance in cellular networks2 by Montana State University and Akamai’s Foundry team analyzed the effect of packet loss on different types of content (small objects and larger objects).
The study found that:
-
For web pages containing many small objects (365 x 2 KB), page load times over h2 are faster than over h1, because in the case of h1 (with six TCP connections) the server can only send six objects in parallel (due to head of line blocking), whereas in h2 many streams can be multiplexed over one connection. Further, as the network condition becomes poor, the PLTs increase for both h1 and h2—but the effect is more dramatic for h2. This is due to the single connection architecture. When that one connection is hit by loss, the whole works slows down (see the lefthand graph in Figure 6-4).
-
For web pages containing a small number of larger objects (10 x 435 KB), h1 outperforms h2 across all network conditions. This possibly surprising finding is because of the initial congestion window (see Figure 3-4). With six connections opened, h1 effectively has six times the initial congestion window size as h2. That means it can get much more data faster early on in the session as the h2 connection window grows to its optimal size. There is ongoing work to address this limitation as it results in initial congestion windows being too small for h2, yet arguably too large for h1. And again, loss has a bigger effect on h2 than h1 (see the righthand graph in Figure 6-4).
-
For web pages with a couple of extremely large objects, the differences disappear. The h2 initial congestion window disadvantage is mitigated by the length of the overall download, and its multiplexing does not really have an advantage any longer.
The majority of web pages fall into the first bucket (they contain many small objects) where h2 has the biggest advantage. This is no accident as it is precisely the use case the designers were optimizing for. Regardless, packet loss is h2’s Achilles heel.
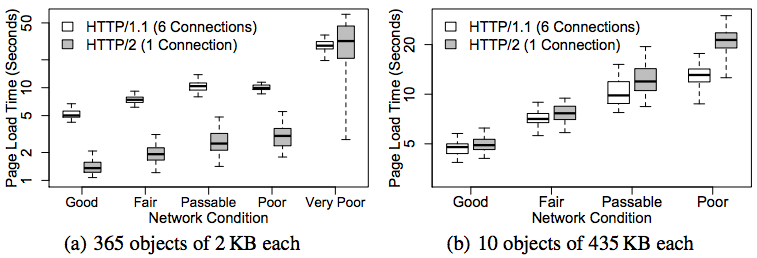
Figure 6-4. HTTP/2 performance in cellular networks
Server Push
As discussed in “Server Push”, Server Push gives the server the ability to send an object to a client before the client requests it. Testing has shown push speeding up page render times by as much as 20% to 50% if used properly.
However, push can also waste bandwidth as the server may try to push objects that the client already has in the local cache, causing the client to receive extra bytes that it does not need. The client can send RST_STREAM frames in order to reject the server’s PUSH_PROMISE frames, but due to the timing of the frames the server generally will end up sending out the unwanted data regardless.
The true value of Server Push is achieved when pushing the critical CSS and JS objects needed for rendering a page the first time someone visits it. The server implementation needs to be smart enough to avoid push promises competing for bandwidth with the delivery of the base HTML page, however. Ideally, the server will push while it is processing the request for the base HTML page. At times, the server needs to do some backend work to generate the HTML. While it is thinking and the client is waiting, there is a perfect opportunity to start pushing down objects that the client will need. See Figure 6-5 for an illustration of how this can improve performance.
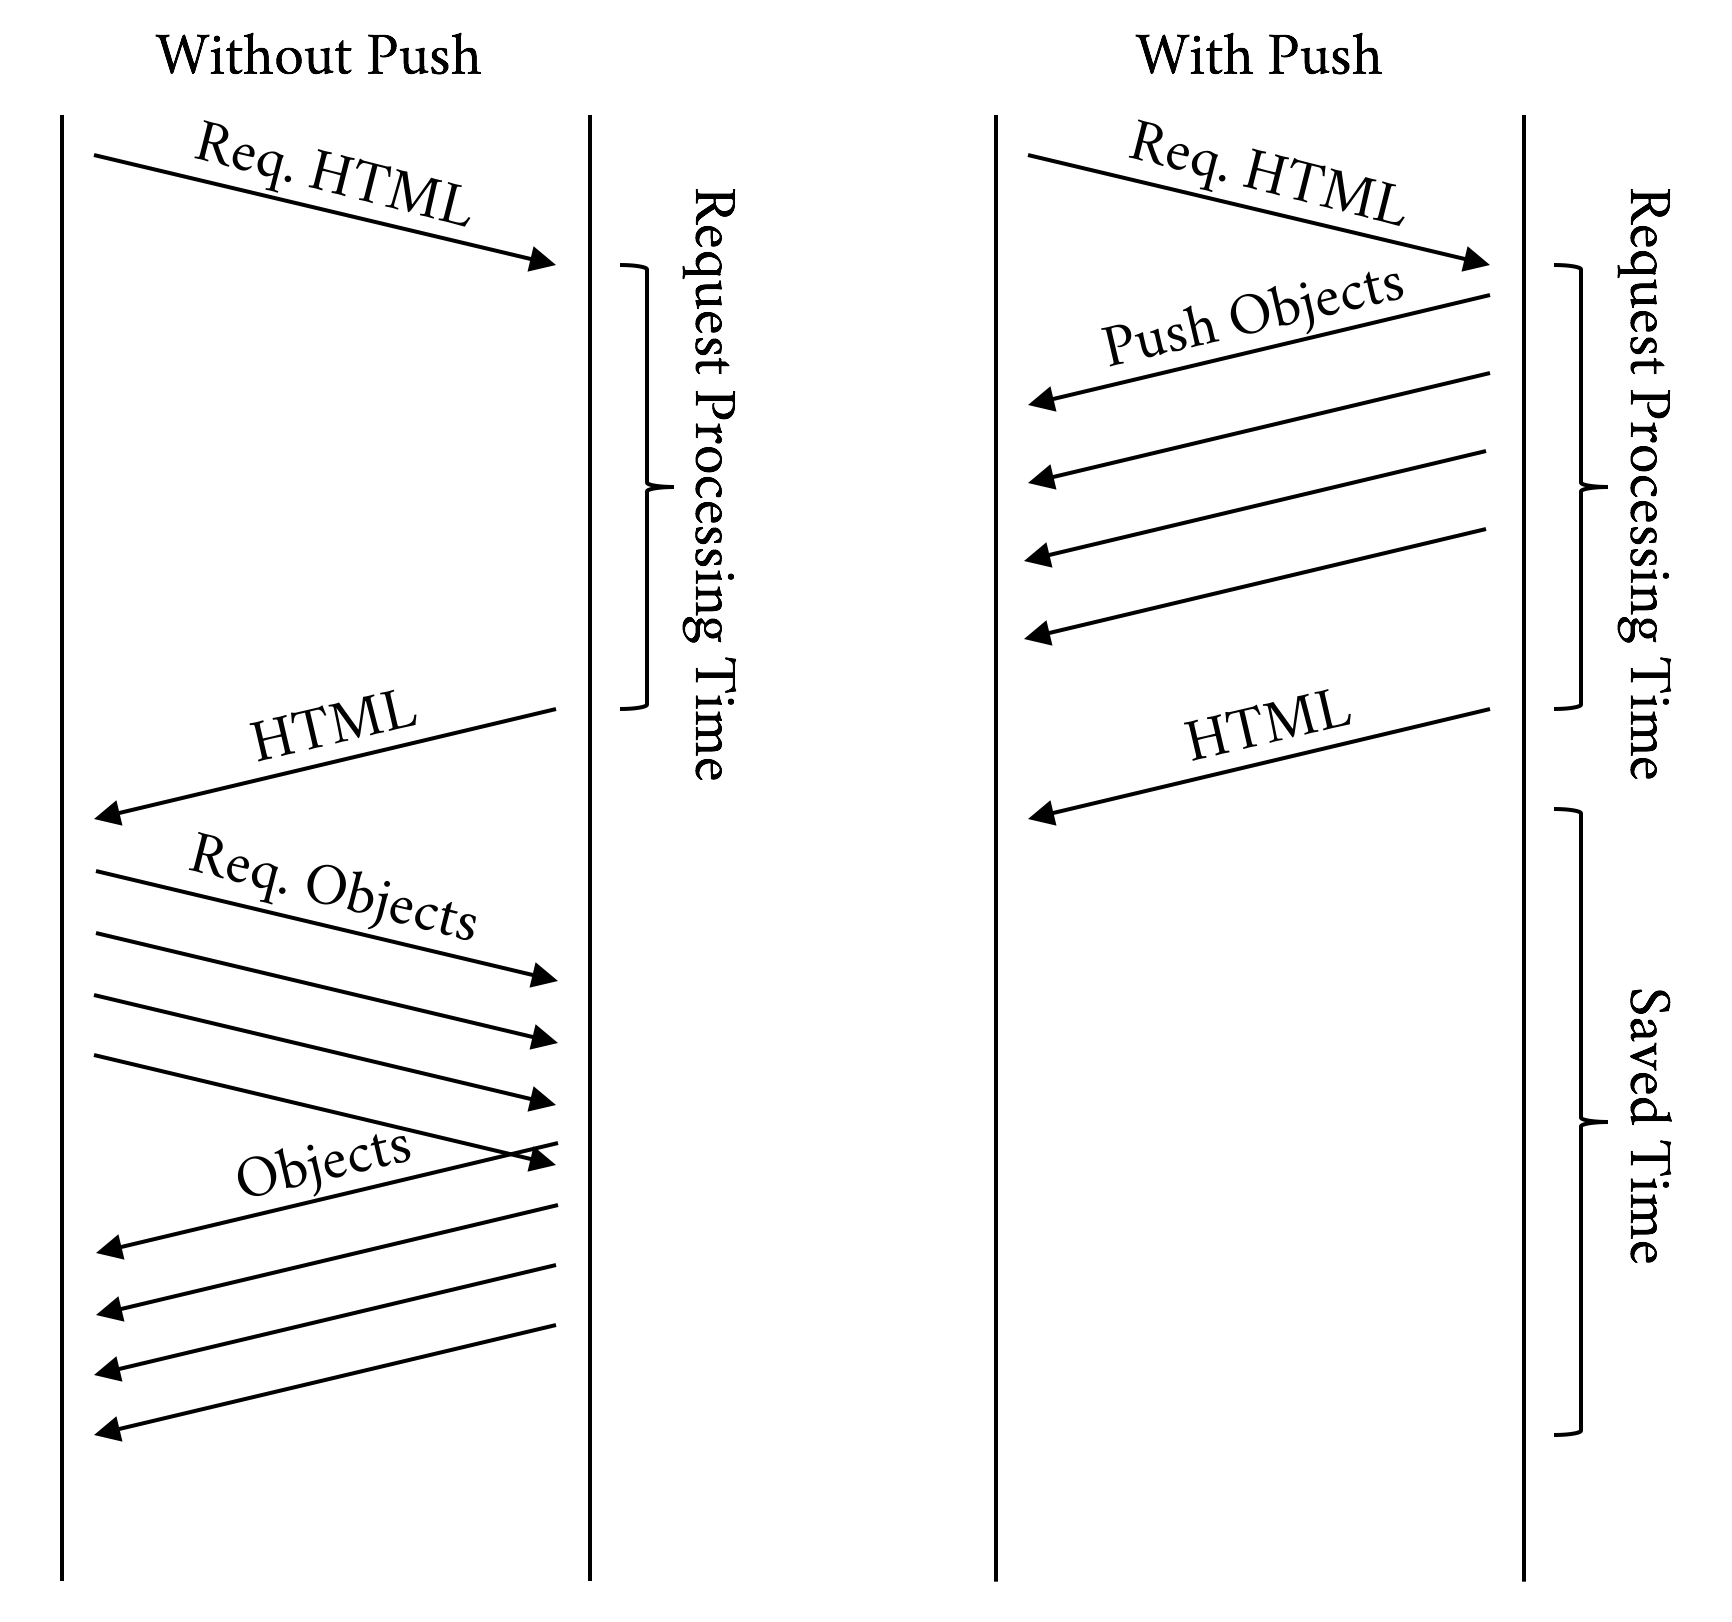
Figure 6-5. Push while processing
Time to First Byte (TTFB)
Time to First Byte (TTFB) is a measurement used as an indication of the responsiveness of a web server.
TTFB measures the duration from the client making an HTTP request to the first byte of the object being received by the client’s browser. This duration is a combination of the socket connection time, the time taken to send the HTTP request, and the time taken to get the first byte of the page. Although sometimes misunderstood as a post-DNS calculation, the original calculation of TTFB in networking always includes network latency in measuring the time it takes for a resource to begin loading.
In h1 the client requests one object at a time per hostname per connection, and the server sends those objects in order, one after the other. Once the client receives all the objects, it requests the next set of objects, and the server sends them, and this process continues until the client receives all the objects needed to render the page.
However, with h2 multiplexing, once the client has loaded the HTML, it will send a much higher number of simultaneous requests to the server as compared to h1. In aggregate these requests will generally return in a shorter amount of time than with h1, but since the clock starts sooner for the requested objects, the TTFB for those will be reported as higher. So, because the mechanics of how the protocols work are different, the meaning of TTFB changes from h1 to h2.
HTTP/2 does do a bit more work than h1, the goal of which is to gain better overall performance. Here are a few of the things h2 does that h1 doesn’t:
-
Adjusting window sizes
-
Building the dependency tree
-
Maintaining static and dynamic tables of header information
-
Compressing and decompressing headers
-
Adjusting priorities (h2 allows a client to adjust the priority several times for a single request)
-
Pushing additional streams not requested yet by the client
Figures 6-6 and 6-7 show a clear picture of the advantage of h2 over h1. To produce the results shown in those figures, the same page was loaded over h1 and h2. Though some of the metrics such as TTFB and “Time to Title” may be comparable or in h1’s favor, the overall experience is better with h2.
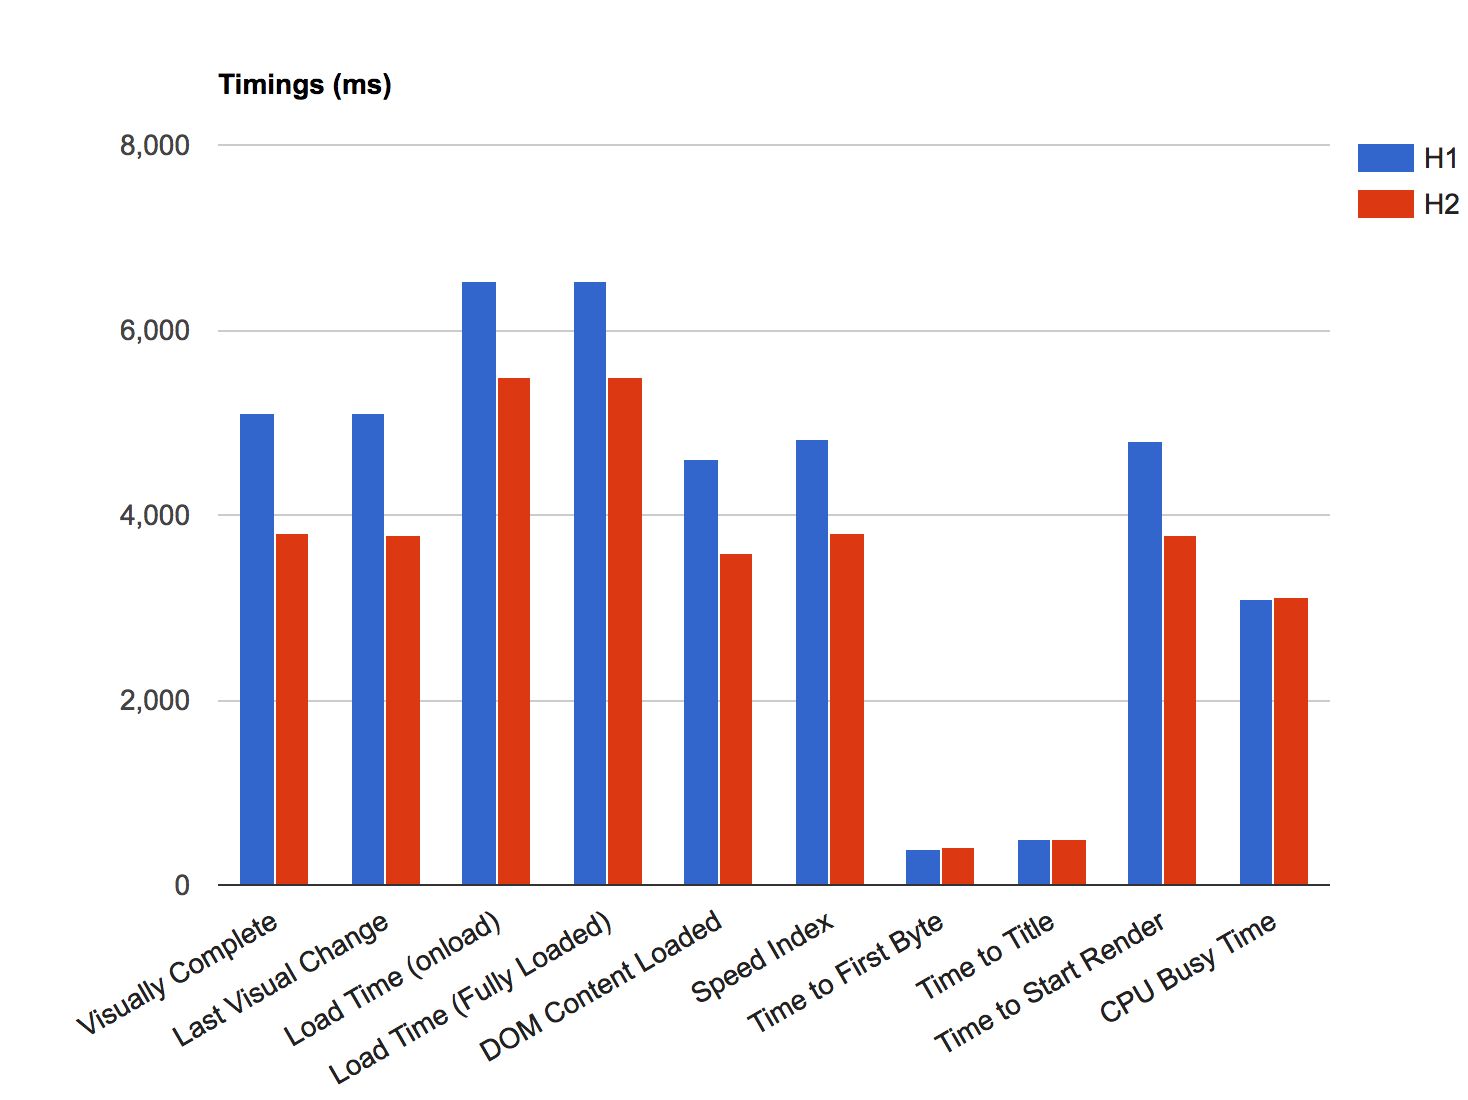
Figure 6-6. Timings h1 versus h2
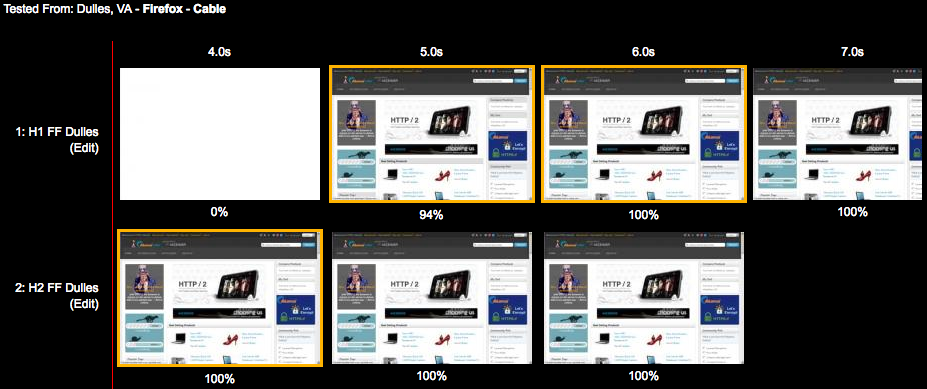
Figure 6-7. Page rendering h1 versus h2
Third Parties
Many websites today use analytics, tracking, social, and advertising platforms that must be added to the website using snippets of code called third-party tags. Third-party tags are snippets of code provided by third-party vendors, and which generate browser calls to external third-party servers.
Numerous studies show that third-party calls can slow down your site, and even cause it to fail like in the case of blocking JavaScript. Pages that have a significant amount of third-party content showed no significant improvement in performance over h2. Third-party content can affect performance in general, but it affects h2 especially because:
-
A third-party request is delivered over a different hostname, which causes a performance hit as the browser needs to resolve DNS, establish a TCP connection, and negotiate TLS.
-
Due to being on a different hostname, the request won’t be able to benefit from h2 features like Server Push, dependencies, and priorities as it is reserved for objects on the same hostname only.
-
You can’t control the performance of the third party or whether the resource is delivered over h2.
Another way to think of it is if third-party content accounts for half of your page’s load time, then h2 can only address half of any performance problems.
Note
In the context of a web page, a Single Point Of Failure, or SPOF, is a resource of a web page that, if it fails, will delay (and even cause to fail) the loading of the entire web page. Pat Meenan, a software engineer and performance expert known for his work on the WebPageTest platform, created a very useful Google Chrome browser extension called SPOF-O-MATIC,3 which easily allows detecting SPOFs as you surf pages and visualize the impact they can cause using WebPagetest. It is yet another great tool to add to your debugging arsenal.
To test the impact of third-party calls on performance, we set up four simple HTML pages, each of them with just five images loading from a given hostname. The HTML body looks like this:
<html><headlang="en"><metahttp-equiv="Content-Type"content="text/html; charset=UTF-8"><title>What is your Ikigai?</title></head><body><imgsrc="https://akah1san.h2book.com/what.png"><imgsrc="https://akah1san.h2book.com/is.png"><imgsrc="https://akah1san.h2book.com/your.png"><imgsrc="https://akah1san.h2book.com/ikigai.png"><imgsrc="https://akah1san.h2book.com/question-mark.png"></body></html>
The hostname of the images is changed to control whether h1 or h2 is used. Test cases were created by varying the following parameters:
-
Whether the base page is on h2 or h1
-
Whether the objects are on h2 or h1
-
Whether the hostnames for the objects are on the same certificate as the base page (hence allowing connection coalescing)
Although the results are pretty similar due to the small number of objects, we can see the images starting to show up 100 ms earlier when using h2 due to only having to open a single connection, as seen in Figure 6-8. The savings will increase as the latency to the server increases.
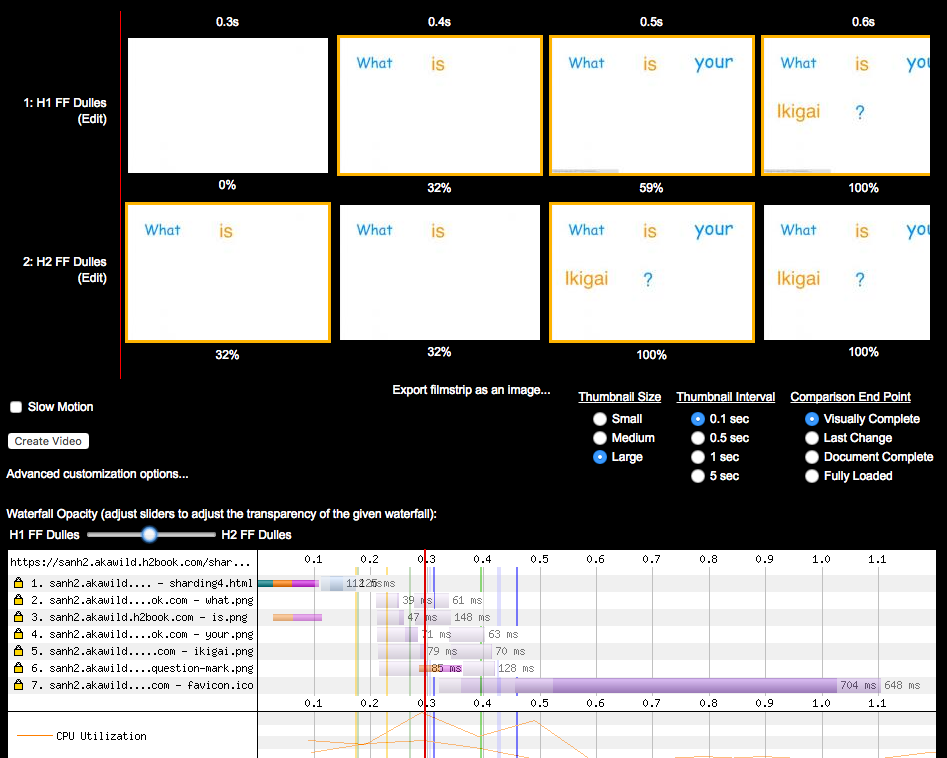
Figure 6-8. WPT filmstrip and timeline comparing loading a page that uses two hostname shards on h1 versus h2
We can see the impact on performance of opening more connections in h1 more clearly if we increase the number of domain shards to four with the same number of objects per domain. The HTML was modified from the previous example to repeat the same five images over three additional hostnames (note that all four hostnames are part of the same SAN certificate):
<html><headlang="en"><metahttp-equiv="Content-Type"content="text/html; charset=UTF-8"><title>What is your Ikigai?</title></head><body><imgsrc="https://akah2san.h2book.com/what.png"><imgsrc="https://akah2san.h2book.com/is.png"><imgsrc="https://akah2san.h2book.com/your.png"><imgsrc="https://akah2san.h2book.com/ikigai.png"><imgsrc="https://akah2san.h2book.com/question-mark.png"><imgsrc="https://akah2san1.h2book.com/what.png"><imgsrc="https://akah2san1.h2book.com/is.png"><imgsrc="https://akah2san1.h2book.com/your.png"><imgsrc="https://akah2san1.h2book.com/ikigai.png"><imgsrc="https://akah2san1.h2book.com/question-mark.png"><imgsrc="https://akah2san2.h2book.com/what.png"><imgsrc="https://akah2san2.h2book.com/is.png"><imgsrc="https://akah2san2.h2book.com/your.png"><imgsrc="https://akah2san2.h2book.com/ikigai.png"><imgsrc="https://akah2san2.h2book.com/question-mark.png"><imgsrc="https://akah2san3.h2book.com/what.png"><imgsrc="https://akah2san3.h2book.com/is.png"><imgsrc="https://akah2san3.h2book.com/your.png"><imgsrc="https://akah2san3.h2book.com/ikigai.png"><imgsrc="https://akah2san3.h2book.com/question-mark.png"></body></html>
Figure 6-9 shows the results of loading the preceding web page. You can see that the page delivered over h2 loads roughly 25% faster.
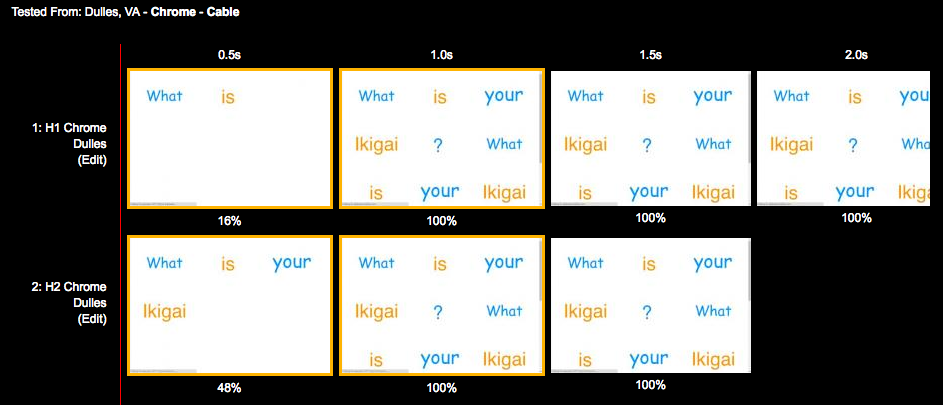
Figure 6-9. WPT filmstrip comparing loading a page that uses four hostname shards on h1 versus h2
If we take a deeper look at the timeline for the page loaded over h1 (Figure 6-10), you will see most of connections loading the embedded images start with indicators of the initial connection and SSL handshake time. This shows the cost of opening multiple connections under h1.
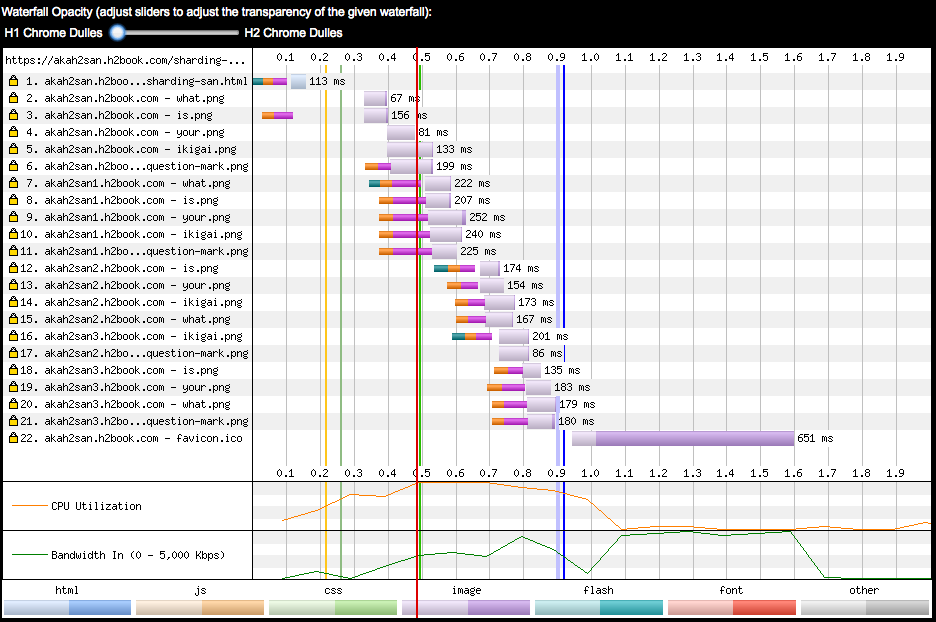
Figure 6-10. WPT timeline comparing loading a page that uses four hostname shards using h1
On the other hand, when the page loads over h2 (Figure 6-11) only the first object is preceded by time spent doing connection and TLS establishment, meaning the rest of objects were sent over the same connection.
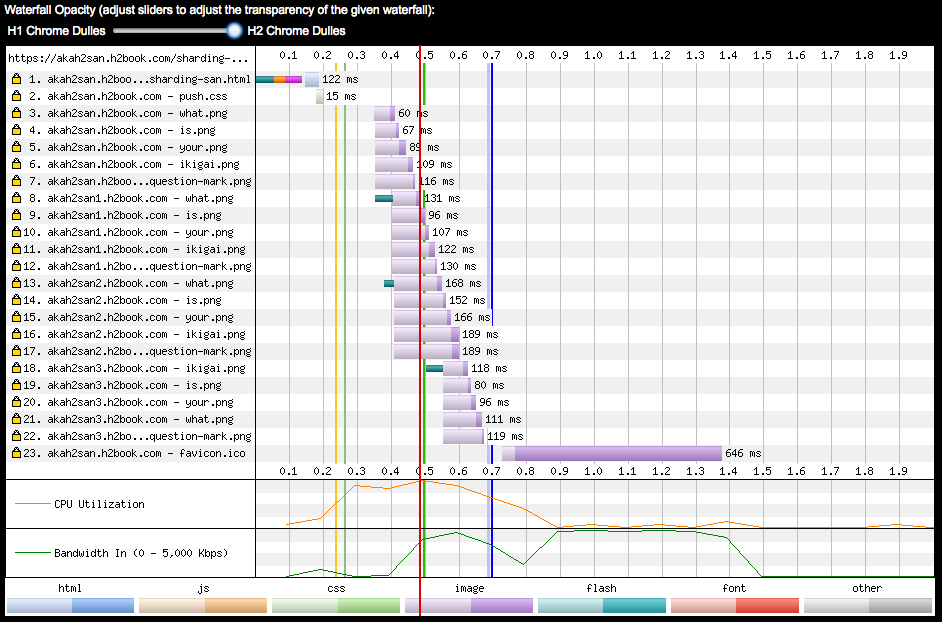
Figure 6-11. WPT timeline comparing loading a page that uses four hostname shards using h2
The exercises described in this section show that it is possible to migrate a website that uses domain sharding to h2 and achieve a single connection by means of grouping different hostnames under a common certificate, and benefiting from the connection coalescence implemented by browsers like Chrome and Firefox.
HTTP/2 Anti-Patterns
As seen in “Undoing HTTP 1.1 ‘Optimizations,’” some of the h1 performance patterns become anti-patterns in h2. This section reviews the more common of those workarounds and describes the performance implications of using them in h2.
Domain Sharding
Sharding aims at leveraging the browser’s ability to open multiple connections per hostname to parallelize asset download and overcome the sequential nature of h1. It is quite common to see sharding on sites with many small objects leveraging the six connections or so that modern web browsers open per hostname. This “tricks” the browser into sending more requests in parallel and makes more use of the available bandwidth. Because of HTTP/2’s use of multiplexing, sharding is unnecessary and defeats the goals the protocol is trying to achieve. Connection coalescing (see “Connection Coalescing”) has the potential to remove the sharding in some browsers under certain conditions, but it is best to not rely on this and instead avoid sharding in h2 altogether.
Inlining
Inlining involves inserting JavaScript, stylesheets, and even images into an HTML page with the aim of saving extra connections and round-trips required to load external resources. Some of the best practices for web performance, however, recommend against inlining, as you lose valuable features like caching that usually help reduce the number of requests (and speed up page render) on repeat visits of the same page. However, in general there can sometimes still be value in inlining small resources needed to render the above-the-fold region. In fact, there is evidence that on weaker devices, the overhead of requests might outweigh the benefits of caching.
The general rule is avoid inlining with h2, but it may not always be without benefit. (See “Your Mileage May Vary” for more info.)
Concatenating
Concatenating means consolidating several small files into a single larger file. It is very similar to inlining as it aims to save round-trips when loading external resources, and device CPU when decoding or evaluating scripts over a fewer number of objects. The same concepts we see for inlining apply for concatenating. Use it to consolidate very small files (1 KB or less), and for the minimum amount of JavaScript/CSS that is critical for the initial rendering.
Cookie-less Domains
Serving static content from a cookie-less domain is a standard performance best practice, especially since in h1 you can’t compress headers, and some websites use cookies that often exceed the size of a TCP packet. In h2, however, request headers are compressed using the HPACK algorithm, which considerably reduces the size of large cookies (especially when they don’t change across requests). Furthermore, cookie-less domains require using additional hostnames, which means opening more connections.
If you are using cookie-less domains, you may consider undoing it next time you have a chance. If you don’t really need them, then best to leave them off. Every byte saved matters.
Spriting
Spriting is yet another technique for avoiding many requests for small objects (you can see a trend in what people do to optimize h1). To sprite, a developer lays out a matrix of smaller images in a larger image and then uses CSS to choose which portion of the image to show. Depending on the device and its hardware graphics capability, spriting can be very efficient or quite slow. With h2, the best practice is to avoid spriting as multiplexing and header compression take a lot of the request overhead away, but there may still be circumstances where you can find spriting beneficial.
Prefetch
Prefetching is a web performance optimization that “hints” the browser to go ahead and download a cacheable object “whenever possible,” and store it on the browser’s cache. However, the browser can ignore prefetch requests if busy, or if the asset takes too long to download. Prefetch consists of inserting a link tag in the HTML:
<linkrel="prefetch"href="/important.css">
or a Link header in the HTTP response:
Link: </important.css>; rel=prefetch
Prefetch is less relevant with h2 with the introduction of Server Push, which can get an object down to the browser faster. One advantage of prefetch over push is that if the object is already in cache, the browser will not waste time and bandwidth requesting it. Think of it as a tool that can complement h2 push as opposed to something that is replaced by it.
Real-World Performance
Theory and tests are great up to a point, but the IETF has a saying that “code speaks and data speaks louder.” Let’s look at a couple of real-world websites using HTTP/2 and see how they perform.
Performance Measurement Methodology
Our performance testing methodology consisted of using WPT (see “WebPagetest”) and running each website through several of the following:
- Test Locations
-
Geographically dispersed test locations (US West Coast, US East Coast, and Europe)
- Browsers
-
Chrome and Firefox (chosen because they allow you to easily disable h2, allowing A/B testing)
- Connections
-
Simulated network connections (Cable and Fast 3G)
- Test runs
-
Each test was run nine times (in order to get a good average)
This means we ran 108 WPT tests (3 x 2 x 2 x 9) against each of the websites. This methodology is far from perfect and conclusive, and it is meant to provide guidance for folks interested in running their own basic performance tests without making a big investment of time and resources.
Study 1: www.facebook.com
The engineers at Facebook manage to get consistent improvements on the tests with h2 versus h1. It is evident that they spent some time tuning their delivery for h2. For example, they configured their servers to undo domain sharding on their home page when the client requests it over h2 to maximize the benefits of multiplexing on a single connection that using h2’s prioritization provides.
In terms of perceived performance, the main Facebook page over h2 started displaying 33% faster, a whopping 1.5 seconds earlier than over h1 (see Figure 6-12). Open http://goo.gl/m8GPYO to see this test.
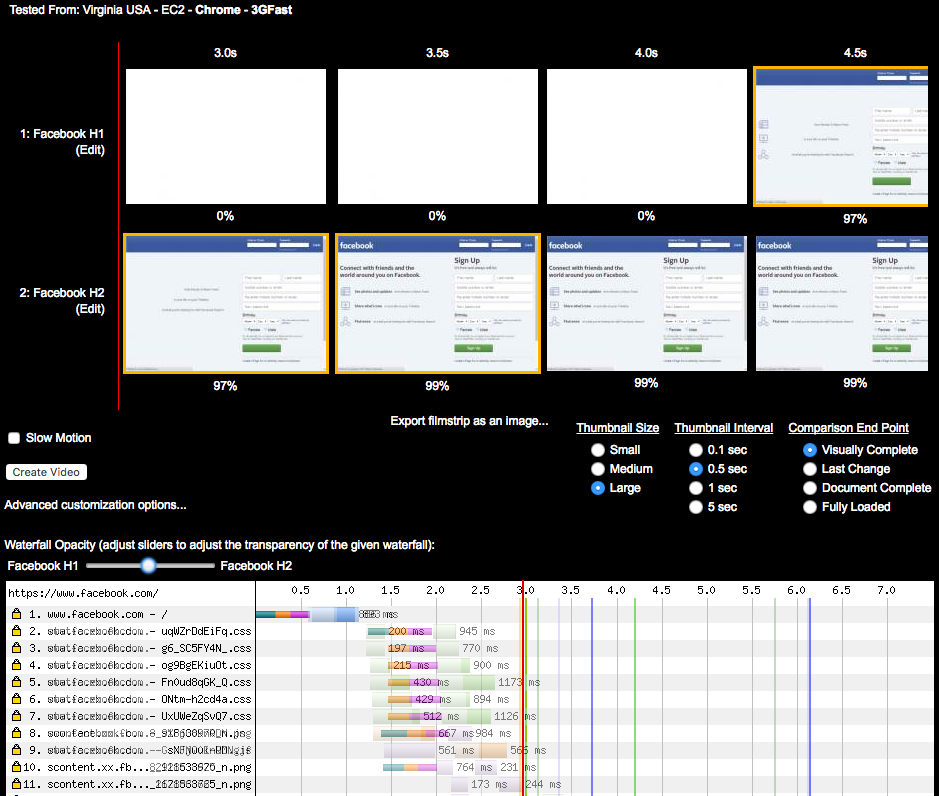
Figure 6-12. h1 versus h2 for www.facebook.com on simulated 3G conditions
If you take a deeper look at the waterfalls in Figure 6-12, you will see the main reason for this difference is the single TCP connection of h2—on the h1 waterfall you can see the performance penalty of opening six extra connections. See the waterfall for h2 (http://goo.gl/w4vSLg) when compared to h1 (http://goo.gl/sWjL3M).
If you inspect the waterfall for the h2 test, you will see that most of the critical objects for rendering are loaded from the same hostname as the one delivering the HTML (www.facebook.com). In the h1 version, the HTML loads from www.facebook.com, but most of the stylesheets and JavaScript load from static.xx.fbcdn.net. Although in this case the performance penalty was caused by h1 opening extra TCP connections, if you click the h2 waterfall on the embedded objects, you will see WPT displaying dependencies and priorities like those listed in Table 6-4. (Note the WPT agent was Chrome. This is important, as at the time of writing, WPT displays stream information differently depending on the selected browser.)
| URL | Priority | HTTP/2 stream information (dependencies) |
|---|---|---|
VeryHigh |
1, weight 256, depends on 0, EXCLUSIVE |
|
High |
3, weight 220, depends on 0, EXCLUSIVE |
|
High |
5, weight 220, depends on 3, EXCLUSIVE |
|
High |
7, weight 220, depends on 5, EXCLUSIVE |
|
High |
9, weight 220, depends on 7, EXCLUSIVE |
|
High |
11, weight 220, depends on 9, EXCLUSIVE |
|
High |
13, weight 220, depends on 11, EXCLUSIVE |
|
Medium |
15, weight 183, depends on 13, EXCLUSIVE |
|
VeryLow |
17, weight 110, depends on 15, EXCLUSIVE |
|
https://scontent.xx.fbcdn.net/t39.2365-6/851565_602269956474188_918638970_n.png |
VeryLow |
1, weight 110, depends on 0, EXCLUSIVE |
https://scontent.xx.fbcdn.net/t39.2365-6/851585_216271631855613_2121533625_n.png |
VeryLow |
3, weight 110, depends on 0, EXCLUSIVE |
https://scontent.xx.fbcdn.net/t39.2365-6/851558_160351450817973_1678868765_n.png |
VeryLow |
5, weight 110, depends on 3, EXCLUSIVE |
VeryLow |
19, weight 110, depends on 0, EXCLUSIVE |
|
… |
Study 2: www.yahoo.com
HTTP/2 looks great on www.yahoo.com. The h2 page for yahoo.com starts being displayed in 4 seconds, while the h1 version starts displaying in 5.5 seconds (see Figure 6-13). Open http://goo.gl/eRUilp to see this test.
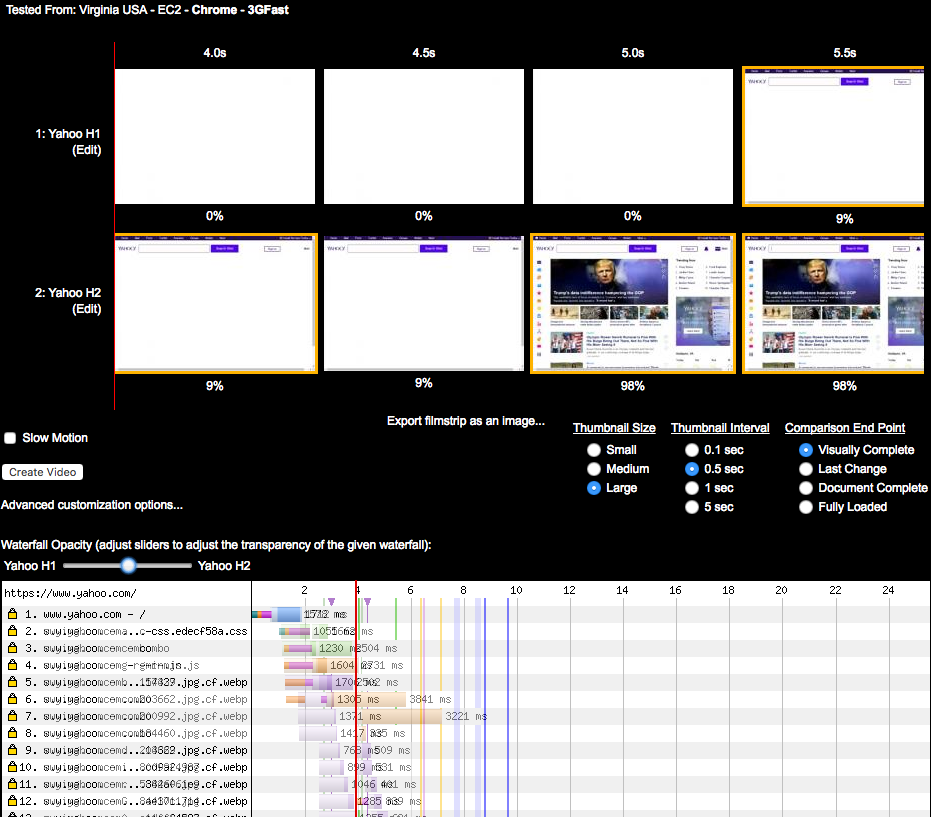
Figure 6-13. h1 versus h2 for www.yahoo.com on simulated 3G conditions in the US
Similar to the Facebook example, www.yahoo.com loads resources differently depending on whether the client negotiates h2 or h1. HTTP/2 delivers the HTML and assets both on www.yahoo.com, while when using h1, the HTML is delivered using www.yahoo.com and the assets using s.yimg.com. With h1 the browser opens six connections for the s.yimg.com hostname, which causes a considerable delay. Also the page elements load in a different order over h2, causing faster DOM complete and PLT, as seen in Figure 6-13. The Yahoo website showed positive improvements when loaded from WPT agents in the US. Interestingly, h1 loads much faster when using a WPT agent in Ireland. The h2 page starts being displayed in 7.5 seconds, while the h1 version starts displaying in 4.5 seconds. See https://goo.gl/GrySYa for details.
You can see in Figure 6-14 that it seems Yahoo’s home page in Ireland is generated slightly differently than its US counterpart. In this case the domain sharding has not been undone when loading the page over h2. Most of the embedded objects (like, for example, http://bit.ly/2pOgTiG) are delivered over a different domain than the one delivering the base HTML. The data shows that a couple of the runs took significantly longer with h2, which skewed the averages.
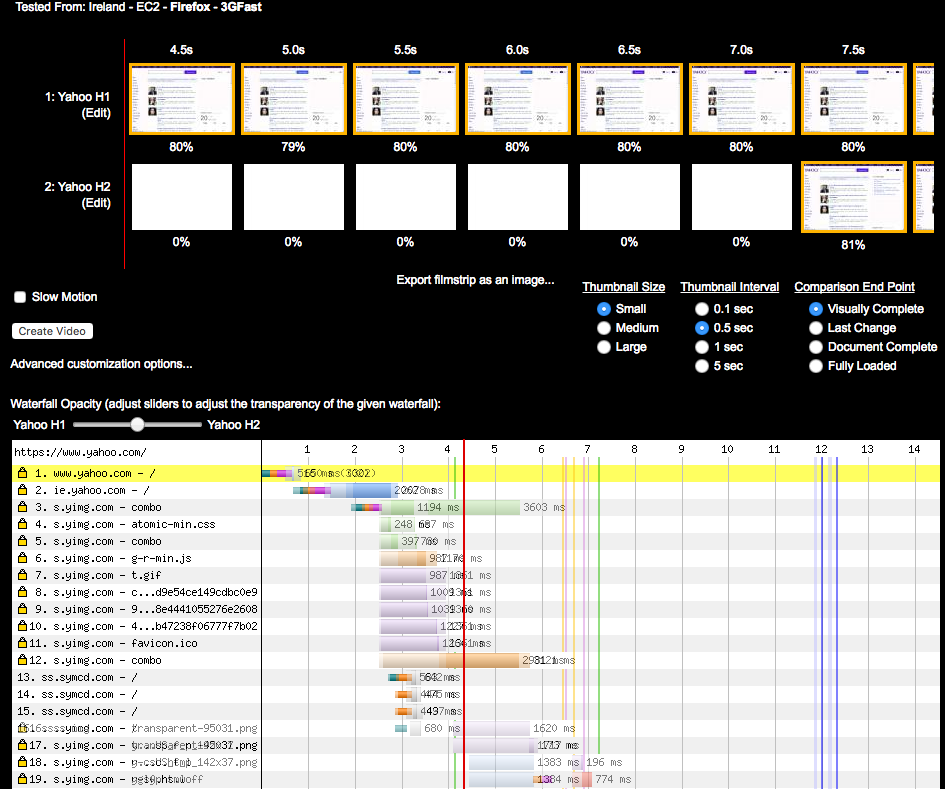
Figure 6-14. h1 versus h2 for www.yahoo.com on simulated 3G conditions in Ireland
But why was h2 slower? It could be dismissed with the wave of a hand and some statistical mumbo jumbo about small data sets and lack of significance, but that would be hiding an extremely important point: h2 will not always be faster in every case. The use of multiple connections (rather than one) and network conditions are the likely culprit in this particular case; a dropped packet could have thrown everything off. Other times the cause will be the makeup of the site. Or, in these early days of h2, it could also be undiscovered implementation bugs. Regardless, seeing performance drop in certain cases is to be expected, and it is almost always addressable.
Summary
It is highly probable that you picked up this book because performance matters to you. HTTP/2 delivers that performance, but it is important to understand why that is, and why you might not be seeing it. Just like any other performance effort, there are likely to be cycles of code, test, analyze, and optimize. Even if you turn on h2 and your site is performing better than ever, a bit of sleuthing might reveal even more performance waiting to be unleashed.