Table of Contents for
High Performance Responsive Design
 High Performance Responsive Design
Published by
O'Reilly Media, Inc., 2014
High Performance Responsive Design
Published by
O'Reilly Media, Inc., 2014
- Cover
- High Performance Responsive Design: Building Faster Sites Across Devices
- High Performance Responsive Design: Building Faster Sites Across Devices
- Preface
- 1. State of the Industry of Responsive Design
- 2. Primer on Performance of Web Applications
- 3. Start with a Plan
- 4. The Backend
- 5. The Frontend
- 6. Continuous Web Performance Testing
- 7. Frameworks
- A. About the Author
- B. High Performance Responsive Design
- Index
- About the Author
- Copyright
Chapter 6. Continuous Web Performance Testing
Maintaining a Steady Course
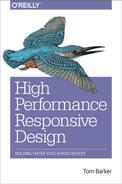
As any student of systems theory knows, when you’ve made a positive change to a system, you can maintain that change via feedback loops to check state and course correct as necessary. This is as true for a thermostat regulating the temperature of an area as it is to keep the web performance metrics of a website within range of an SLA during new feature development.
Essentially, feedback loops are tools used in control systems to assess the output of the system and thus correct the system’s course if needed. At a very high level, they work like the flow shown in Figure 6-1, in which the output of a process is evaluated, giving feedback which becomes input that then feeds the process again.
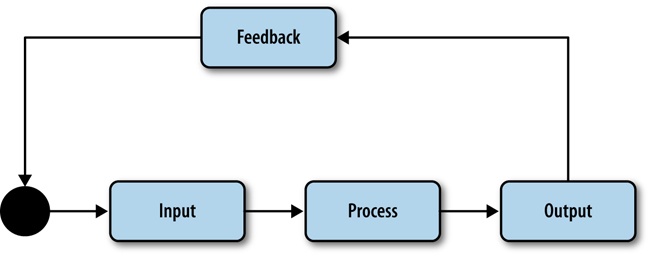
For software engineering, one of the most effective procedural feedback loops is the practice of continuous integration. Continuous integration (CI) is essentially having mechanisms in place that build your code as new code is committed, check for different success criteria, and break the build—effectively putting a stop to check-ins and deployments—until the success criteria is again satisfied. Figure 6-2 depicts the feedback look diagram updated to represent a continuous integration workflow.
At this point, you most likely have a CI environment set up in your department that is running automated tests against your builds. Maybe you use Jenkins or Anthill Pro or any other number of CI tools available. But I would bet that right now your automated test suite does not check for web performance or for web performance at different viewport sizes and different experiences. Let’s change that.
Automating Responsive Web Performance Testing
If we were talking web development 5 to 10 years ago, the concept of web–test-driven development was barely known. But over the last five-plus, years the idea of what is possible and what is mainstream around web–test-driven development has exploded.
Unit testing frameworks such as Jasmine from Pivotal Labs came out, and web developers began unit testing the logic in their JavaScript. Then, headless web browser[12] testing frameworks came out and demonstrated what could be done with integration testing.
For the purposes of responsive web performance testing, headless web browsers are perfect because they do the following:
Allow scripting of a browser from a terminal
Integrate into CI software
Allow automated resizing of the viewport
Allow programmatic User Agent assignment
Give insight into what assets are being loaded on a page
One of the most popular headless browser–testing libraries available is PhantomJS (http://phantomjs.org). PhantomJS is a JavaScript API created by Ariya Hidayat that exposes programmatic access to WebKit (or to be very specific, QtWebKit). Best of all, you can run PhantomJS from a command line, so you can integrate your tests into your CI workflow.
Let’s take a look at how you can use PhantomJS to test website performance at different viewport sizes and with different User Agents.
Automated Headless Browser Testing
First, you need to install PhantomJS. To do this, simply go to the console or terminal and type the following command:
sudo npm inst
all -g phantomjs
This installs PhantomJS at the global level so that we can run it no matter what directory we happen to be in. To ensure that PhantomJS is installed, check the version number from the command line, like so:
phantomjs --version
1.9.7
The core workflow when using PhantomJS is to create a page object and use that page object to load and analyze a web page:
    var page = require('webpage').create();
    page.open('http://localhost:8080/', function (status) {
});
The way to run this with PhantomJS is to save your code to a file and run the file from the command line:
>phantomjs filename.js
Functionality in PhantomJS is broken out into API modules that provide distinct areas of focus. The modules built into PhantomJS include the following:
- The System module
This module makes it possible to, among other things, pull arguments from the command line so that you can make your scripts more generalized and simply pass in parameters such as lists of URLs (or viewport sizes, or paths to User Agent lists) instead of hard coding them in the script. We can also use the system module to access environmental variables and operating system information. To access the System module type the following:
var system = require('system'); console.log(system.args, system.env);- The Web Page module
Using this module, you can download and evaluate web pages. The beauty of the Web Page module is that in addition to giving you the ability to inspect a page and the network transactions that it took to create the page, you can also inject content into the page as well as insert HTTP header information when requesting the page. Here’s how to access it:
var page = require('webpage').create(); page.open('http://localhost:8080/', function (status) { });- The Web Server module
Use this module to listen and proxy transactions between the web page and remote resources. You can also use the Web Server module to output to a local port. Use the following to access it:
var webserver = require('webserver'); var server = webserver.create(); var service = server.listen('127.0.0.1', function(request, response) { });- The File System module
The File System module gives you access to local file system functionality such as reading and writing files and directories. To access this module, type the following:
var fs = require('fs');
var file = fs.open('[local file] ', '[Open mode]')
You can find the full API documentation for PhantomJS at http://bit.ly/13DeMD2.
With this in mind, here are a couple of things you would want to test by using PhantomJS:
Are the appropriate assets being loaded based on the client capabilities?
Are the payloads for each experience within our determined SLA?
Let’s take a look at how you can use PhantomJS to achieve this.
Evaluate experiential resource loading
The first test case we’ll look at is ensuring that our page is loading the correct assets. We’ve already talked at length about why we want to serve only the assets that are appropriate to a given client device (to reduce size payload, account for different bandwidth qualities and levels of availability, and accommodate different viewport sizes), and we’ve looked at ways to accomplish this both from the backend and the frontend, but now we will look at how to programmatically verify that this is happening.
We can do this by spoofing the viewport size and or User Agent of our headless browser and then evaluating specific assets that are loaded on the page. In the example that follows, we will use the Web Page module to create a simulated page, set the viewport property (which accepts a JavaScript Object Notation (JSON) object for width and height values), and assign the userAgent property to make the web page and web server that is serving up the web page think that an iPhone 5 is making the request:
var page = require('webpage').create();
    //simulating an iPhone 5
    page.viewportSize = {
        width: 640,
        height: 1136
    };
    page.settings.userAgent = 'Mozilla/5.0 (iPad; CPU OS 4_3_5 like Mac OS X; en-us) AppleWebKit/533.17.9 (KHTML, like Gecko) Version/5.0.2 Mobile/8L1 Safari/6533.18.5';
    page.zoomFactor = 1;
    page.open('http://localhost:8080/', function (status) {

    });
We want to validate that the page is rendering as it should and with the appropriate content. We can do this several ways:
Take a screenshot of the rendered page to visually confirm, usually in a manual fashion, that the expected layout is rendered. The code snippet that follows opens a web page, checks to ensure it was opened successfully, and saves a screenshot by using the
page.renderfunction:page.open('http://localhost:8080/', function (status) { if(status == 'success'){ page.render('./screenshots/iPhone5.png'); } });Programmatically examine the page elements to see if the assets that we expect to be rendered are actually rendered. In the code snippet that follows, on successful page loading, the
page.evaluatefunction retrieves the URI in thesrcattribute of the element that has anidofdescription-image. Assuming we are still evaluating the iPhone 5 experience, we then check this URI to see if it is being loaded from the directory that we know holds the size-appropriate resources:page.open('http://localhost:8080/', function (status) { if(status == 'success'){ var image_source = page.evaluate(function(s) { return document.querySelector(s).src; }, 'description-image'); if (image_source){ ... } } });Inspect the network requests that the web page makes to validate that the expected resources, and only the expected resources, are being downloaded. In the code snippet that follows, we create callback functions to capture HTTP requests that the page is making. Assuming we are still validating only the iPhone 5 scenario, each request fires off an anonymous function that will inspect the path to the resource to check to see if it is coming from a path that is known to hold images that are device inappropriate; for example, does the path contain the directory /nav/320/?
    page.onResourceRequested = function (request) {
        //check request to see if the requested resource is coming from a known device
// inappropriate directory
    };

page.open(address, function (status) { ... });
Validate web performance
So far, we’ve just looked at validating that what we are expecting to be downloaded and rendered in the page is actually there. Next, we will look at capturing the web performance of our web page in each experience. There are several ways we could do that:
Within Phantom, measure how much time elapses between requesting a page and when the page completes rendering. The following code snippet takes a snapshot of the current time before calling the page. When the page is loaded, it takes another snapshot of the time and subtracts the start time from that to determine the page load time:
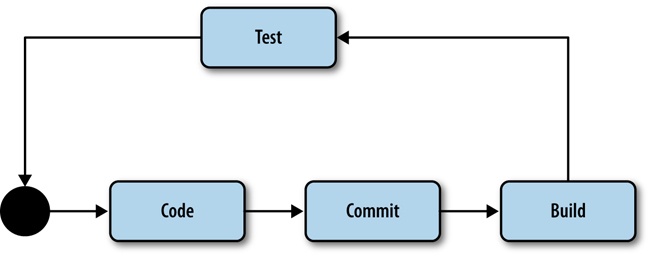
var startTime = Date.now(),
      loadTime;

page.open(address, function (status) {
if (status == 'success') {
    loadTime = Date.now() - startTime;
    console.log("page load time: " + loadTime + "ms")
    }
});
Use YSlow for PhantomJS to generate a YSlow report. Yahoo! has created their own PhantomJS JavaScript file to make their YSlow services available from the command line. It is called yslow.js and is available at http://yslow.org/phantomjs/. Using yslow.js we can pass in specific User Agents to use, as well as viewport sizes. We can also pass in the format that we want the data to be output as well as the level of detail in the data. Figure 6-3 presents a screenshot of the succinct help section for yslow.js.
Figure 6-3 shows all of the arguments that the script accepts and even some example usage. This Help screen is also available at the command line by typing phantomjs yslow.js –help.
To continue with our example of testing our iPhone 5 experience, let’s pass in our User Agent and viewport height and width, as shown in the following example:
> phantomjs yslow.js --info stats --format plain --vp 640x1136 --ua 'Mozilla/5.0 (iPad; CPU OS 4_3_5 like Mac OS X; en-us) AppleWebKit/533.17.9 (KHTML, like Gecko) Version/5.0.2 Mobile/8L1 Safari/6533.18.5' http://localhost:8080
version: 3.1.8
size: 846.4K (846452 bytes)
overall score: B (86)

url: http://localhost:8080/
# of requests: 46
ruleset: ydefault
page load time: 187
page size (primed cache): 10.2K (10290 bytes)
# of requests (primed cache): 1
statistics by component:
    doc:
        # of requests: 1
        size: 10.2K (10290 bytes)
    css:
        # of requests: 8
        size: 154.7K (154775 bytes)
    js:
        # of requests: 20
        size: 617.0K (617056 bytes)
    cssimage:
        # of requests: 6
        size: 32.6K (32694 bytes)
    image:
        # of requests: 10
        size: 14.0K (14095 bytes)
    favicon:
        # of requests: 1
        size: 17.5K (17542 bytes)
statistics by component (primed cache):
    doc:
        # of requests: 1
        size: 10.2K (10290 bytes)
Note the level of detail exposed: we get total payload of the page, the number of HTTP requests, and then a breakdown of number of HTTP requests and total payload by content type.
There are other alternatives to YSlow.js that work in much the same manner (e.g., James Pearce’s confess.js, which you can get at http://bit.ly/1ofAru5).
In both use cases, remember that the intent would be to run through all of the different experiences for which we are accounting. Imagine for a moment that the tests that we just talked about were built in to your CI workflow, and your team was alerted every time a change was made that broke your service-level agreement. Let’s make that a reality by next looking at how we can work these verification steps into a CI workflow.
Continuous Integration
CI is the practice of real-time merging and testing of code check-ins. CI originally started life as a tenet of Kent Beck’s Extreme Programming methodology, but it has spread to become the de facto practice of integrating changes within teams of developers. It follows the same principle as Beck’s other best-known (and equally as ubiquitous) practice—test-driven development—in that moving the feedback loop closer to the resolver (in both cases the developer checking in code) saves both time and effort downstream in the process.
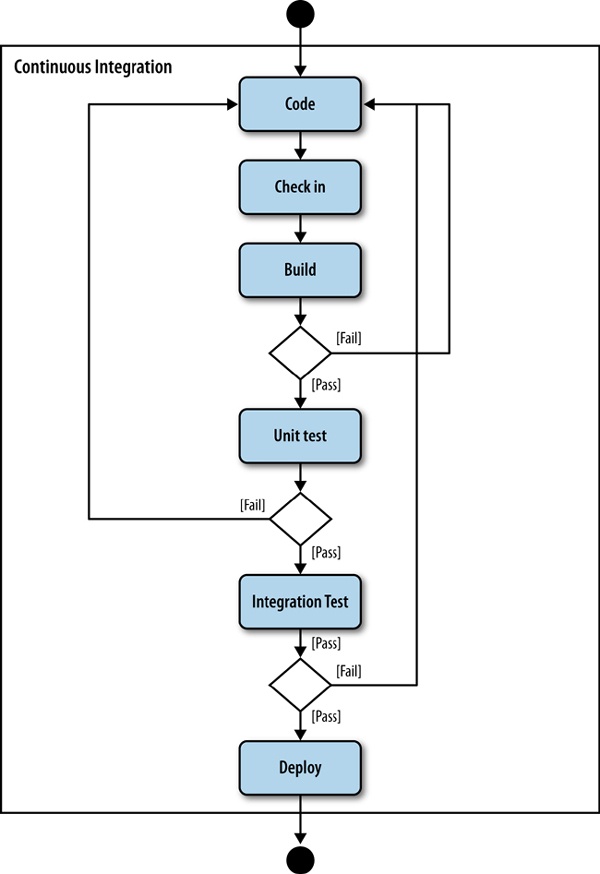
The core workflow of CI is to check in code and then follow these steps:
Confirm that the project builds (ensure that it compiles, or that the static content gets minified and gzipped, or that assets are renamed with a timestamp fingerprint for cache busting); if it does not, the build breaks
Run the integration and unit tests, and if they fail, break the build
Breaking the build should involve messaging out to the team and would require a code check-in to fix the cause of the build breakage. Figure 6-4 illustrates this workflow.
There are a number of software solutions that exist today to manage the workflow shown in Figure 6-4. One of the most popular among them is Jenkins. The beauty of Jenkins is that it is open source and easy to install and configure. A little later in this chapter, we will look at integrating our PhantomJS scripts into the CI workflow by using Jenkins.
First, however, we will take the concepts we just covered and make a script that we can run from Jenkins.
An Example PhantomJS Script
To integrate your performance tests into Jenkins, we need to do several things. To begin, you must create a JavaScript file that will evaluate your performance SLAs. This file will output by using the JSUnit XML format, which Jenkins can easily read in. Jenkins will run this script and generate the XML file during each build, and it will read in the XML file as the test results after each build.
Tip
Before we begin creating the script, we are going to add async.js to our project, which will make it possible for us to run our tests asynchronously. When we try to capture how long a page takes to load while we add up the byte size of each asset as they get downloaded, the act of interfacing with assets as they are downloading would add latency to the overall page load time and give us inaccurate results for that particular test.
To install async.js, go to the project directory and type npm install async.
This creates the directory structure shown in Figure 6-5 within our project and makes async available to our code.
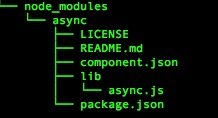
OK, let’s begin. First, we’ll create the variables that we will be using. We will load async into a variable that we will call async. Next, we’ll create an array named testsToRun with the names of the tests that we will be running—for this example, rendertime and payload. Finally, we will create an object named results that will hold the values of each of the tests, including the human-readable display name for each test, the threshold for each test, and the actual results of the tests.
For readability purposes, this example hard codes several items. For an actual production script, you would seek to move all of the hardcoded values to be configurable and read in at runtime. Let’s look at the code:
var async = require('async'),
    testsToRun = ["rendertime","payload"],
    results = {
        testnames:{
            rendertime:"Time to Render",
            payload: "Total Page Payload"
        },

        threshold: {
            rendertime: 500,
            payload: 1000
        },
        actual: {
            rendertime: 0,
            payload:0
        },
        test_results: {
            rendertime: "fail",
            payload: "fail"
        }
    }
Next, create a function called test. This will encapsulate all of the tests that we will be running. We will pass in the test type and a callback function. We pass in the test type so that we can determine which tests to run at a given invocation. We pass in the callback function so that we can call it after our tests are complete; this way, async knows that the function invocation is complete.
Within the test function, first declare some variables and values. We will capture a snapshot of the current time, load the WebPage module into a variable named page, and we will hardcode the viewport as well as the User Agent. Again, the hardcoded values would normally be configurable at runtime, but for the sake of having an example that is easy to follow, they are hardcoded here:
function test(testType, callback){
    var startTime = Date.now(),
        loadTime;
    var page = require('webpage').create();
    page.viewportSize = {
            width: 640,
            height: 1136
        };

        page.settings.userAgent = 'Mozilla/5.0 (iPad; CPU OS 4_3_5 like Mac OS X; en-us) AppleWebKit/533.17.9 (KHTML, like Gecko) Version/5.0.2 Mobile/8L1 Safari/6533.18.5';
        page.zoomFactor = 1;
}
Next, within the test function, create the onResourceReceived event handler for the page object. This executes when remote resources that have been requested are received. Within this function, we will check to see whether any other tests to measure the page payload are under way (so that we don’t add latency to those other tests), and if so, we then increment the payload property in the results.actual object:
page.onResourceReceived = function (resp) {
//increment the payload by the size of the resource received
    if(testType == "payload"){
        if(resp.bodySize != undefined){
                results.actual.payload += resp.bodySize
        }
    }
};
While still within the test function, call the page.open function to load the web page that is being performance tested. For our purposes, we will hardcode a local address, but in reality this should also be configurable at runtime. After the page is loaded, we capture the current time, and subtract the start time from that to establish the actual render time. We then call a function which we will define momentarily that uses the name calculateResults. Finally, we close the page and call the callback function to signal async that the function is complete:
page.open('http://localhost:8080/', function (status) {
if(status == 'success'){
    results.actual.rendertime = Date.now() - startTime;
}
calculateResults()
page.close();
callback.apply();
});
Before we leave the test function, let’s define calculateResults. In this function, we’ll us testType as the index and compare the actual test results with the threshold and then assign a passing or failing grade to the results property:
function calculateResults(){
if(results.actual[testType] <= results.threshold[testType]){
    results.test_results[testType] = "pass";
}
}
OK, returning to the root of our script, let’s add the controller logic. Using async.each, we asynchronously call the test function with each value in the testsToRun array. When the function calls are complete, the anonymous function that we pass in as the third parameter to asynch.each executes. This function calls a function formatOutput that we will define shortly, and then exits PhantomJS:
async.each(testsToRun,test,
  function(err){
      formatOutput();
      phantom.exit();
  }
);
Finally, let’s define a function called formatOutput. This function formats our output to adhere to the JUnit XML format that Jenkins accepts. We can find the XSD for this format at http://bit.ly/Ze98o9.
For the purposes of this exercise, we’ll just create a suite for all of our tests and then a test case for each test that ran. We’ll map a function to the array testsToRun to create test case nodes for each test. After we have the output assembled, we’ll output it to the console:
function formatOutput(){
    var output = '<?xml version="1.0" encoding="utf-8"?>\n'+
    '<testsuite tests="'+ testsToRun.length +'">\n'
    testsToRun.map(function(t){
        output += '<testcase classname="'+ t +'" name="'+ results.testnames[t] +'">\n'
        if(results.test_results[t] == "fail"){
            output += '<failure type="fail"> threshold: '+ results.threshold[t] + ' result: '+ results.actual[t] +' </failure>\n'
        }
        output += '</testcase>\n'
    })
    output += '</testsuite>'
    console.log(output)
}
Following is the complete code for this example (you can also find it on GitHub at https://github.com/tomjbarker/HP_ResponsiveDesign):
//simulating an iPhone 5
var async = require('async'),
    testsToRun = ["rendertime","payload"],
    results = {
        testnames:{
            rendertime:"Time to Render",
            payload: "Total Page Payload"
        },
        threshold: {
            rendertime: 500,
            payload: 1000
        },

        actual: {
            rendertime: 0,
            payload:0
        },
        test_results: {
            rendertime: "fail",
            payload: "fail"
        }
    }

function test(testType, callback){
    var startTime = Date.now(),
        loadTime;

    var page = require('webpage').create();
    page.viewportSize = {
            width: 640,
            height: 1136
        };

        page.settings.userAgent = 'Mozilla/5.0 (iPad; CPU OS 4_3_5 like Mac OS X; en-us) AppleWebKit/533.17.9 (KHTML, like Gecko) Version/5.0.2 Mobile/8L1 Safari/6533.18.5';
        page.zoomFactor = 1;

        page.onResourceReceived = function (resp) {
            //increment the payload by the size of the resource received
            if(testType == "payload"){
                if(resp.bodySize != undefined){
                    results.actual.payload += resp.bodySize
                }

            }
        };

        page.open('http://localhost:8080/', function (status) {
        if(status == 'success'){
            results.actual.rendertime = Date.now() - startTime;
        }
        calculateResults()
        page.close();
        callback.apply();
        });

        function calculateResults(){
            var output = "";
            if(results.actual[testType] <= results.threshold[testType]){

                results.test_results[testType] = "pass";
            }
        }
}

function formatOutput(){
    var output = '<?xml version="1.0" encoding="utf-8"?>\n'+
    '<testsuite tests="'+ testsToRun.length +'">\n'
    testsToRun.map(function(t){
        output += '<testcase classname="'+ t +'" name="'+ results.testnames[t] +'">\n'
        if(results.test_results[t] == "fail"){
            output += '<failure type="fail"> threshold: '+ results.threshold[t] + ' result: '+ results.actual[t] +' </failure>\n'
        }
        output += '</testcase>\n'
    })
    output += '</testsuite>'
    console.log(output)
}

async.each(testsToRun,test,
  function(err){
      formatOutput();
      phantom.exit();
  }
);
Save the script to a file named iphone5test.js and run it from the Terminal. You should see output similar to that shown in Figure 6-6.
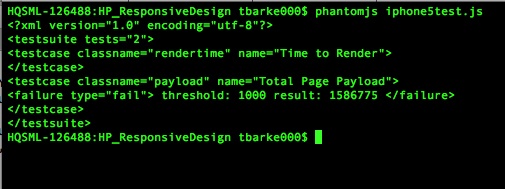
Next, we will install Jenkins and get our script running in the build process for a project.
Jenkins
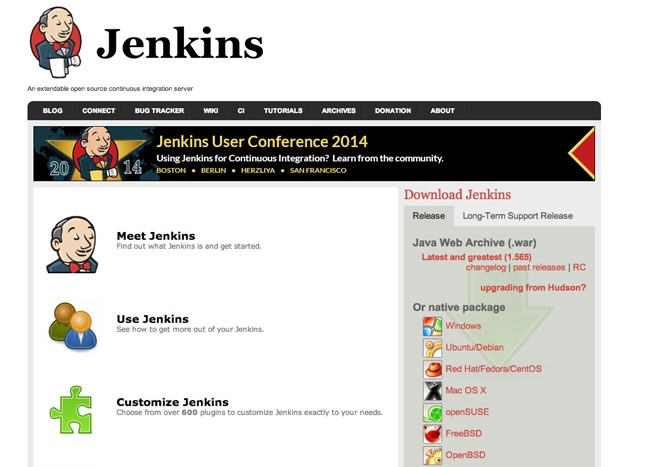
Jenkins started life as Hudson, an open source CI tool created by Kohsuke Kawaguchi while at Sun Microsystems. After Oracle purchased Sun, the Jenkins CI project split off from Hudson. Hudson would continue under Oracle’s stewardship (Oracle eventually transferred the project to the Eclipse Foundation), whereas Jenkins CI would continue on through the contributions of the community.
Jenkins is available from http://jenkins-ci.org/, where you can, among other things, download the latest build, create your own copy, register a bug, or read documentation around Jenkins. Figure 6-7 presents the Jenkins CI home page.
From the Jenkins home page, you can download a native package to install. In Figure 6-8, you can see the installer for Mac OS.
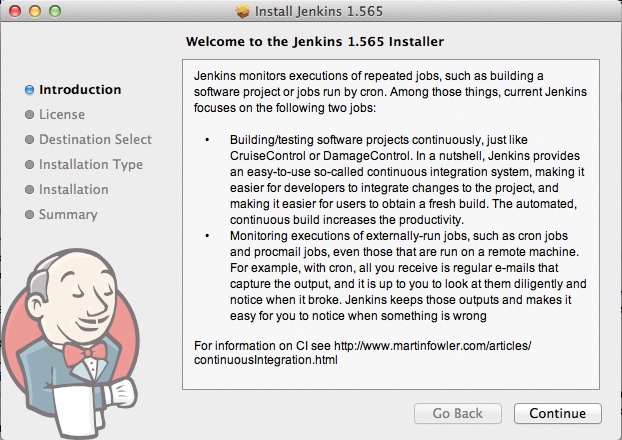
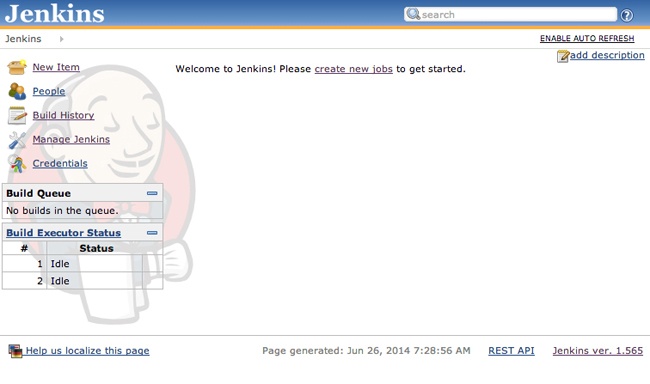
After you’ve completed installation, Jenkins is available locally at http://localhost:8080/, as demonstrated in Figure 6-9.
For this example, we will assume that the GitHub plug-in is installed (if it isn’t, go to Manage Jenkins, click Manage Plugins, and then install it) and that we are using GitHub as our source control.
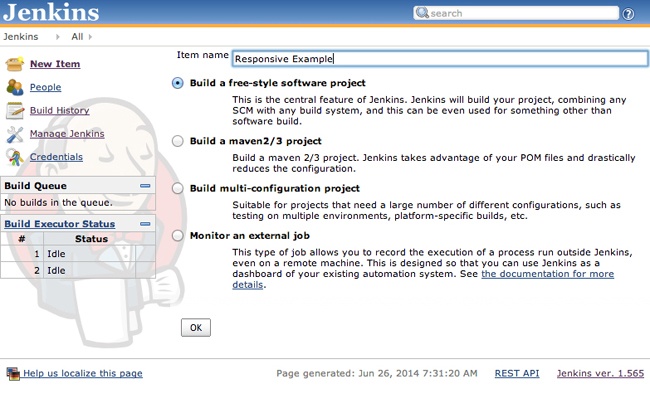
To begin, we need to have a project in Jenkins. To create a new project, on the Jenkins home page, click New Item. A window similar to that depicted in Figure 6-10 opens. For our example, we will create a freestyle project and give it a name.
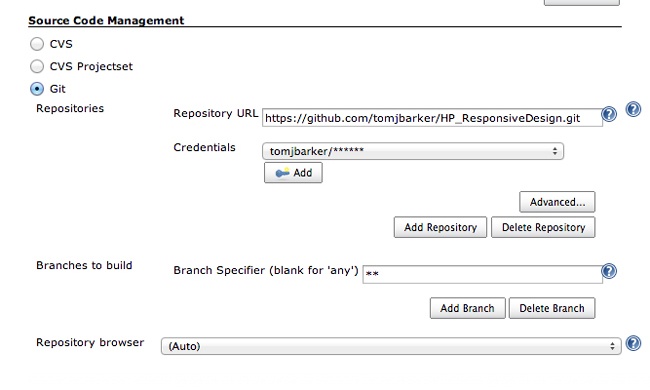
Now, it’s time to configure the new project. On the Source Code Management page, choose Git as the source code management technology and type the location of our project in GitHub, as depicted in Figure 6-11.
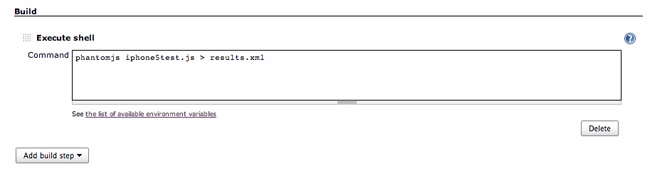
Next, we add a build step to execute our PhantomJS script, with the output piped to an XML file called results.xml (see Figure 6-12). This runs our script and generates a new XML file every time the project is built.
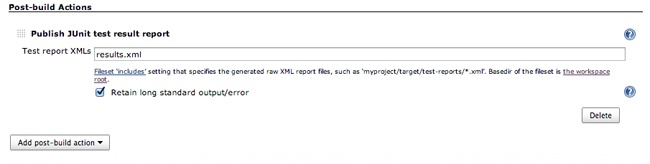
Finally, while still on the Source Code Management page, add a post-build action to publish the JUnit test result report, or specifically the results.xml file that we created with our script (see Figure 6-13).
From here, we can manually kick off builds from Jenkins, and our script is run and the report is generated. If we want our project to build every time we push a change to GitHub, we would need to configure a web hook in GitHub to POST to our Jenkins installation.
After the build runs, we can see the for the web performance test in Jenkins. Figure 6-14 shows the results.
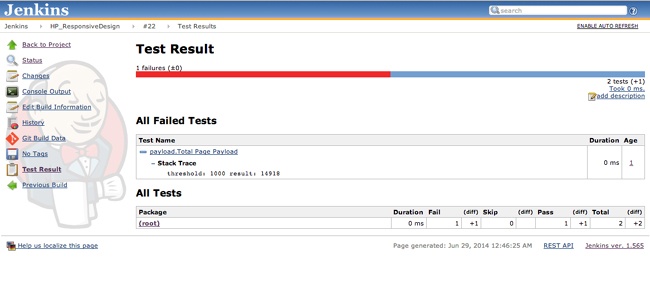
With this flow in place, we can now get real-time feedback as changes we make in the code base impact our web performance.
Summary
This chapter explored continuous web performance testing. We looked at using PhantomJS to create headless browser tests. We talked at length about how to verify that the patterns of best practice that we established in previous chapters were being maintained, from loading only device-specific assets, to maintaining a page payload and render-time SLA.
Finally, we looked at incorporating that logic into a CI workflow using Jenkins.
Chapter 7 takes a survey of the current state of frameworks addressing the issues of performant responsive websites.
[12] A headless web browser is a web browser without a graphical user interface. With a headless web browser we can programmatically access web pages for tasks like testing and automation.