Table of Contents for
Stream Processing with Apache Flink
 Stream Processing with Apache Flink
Published by
O'Reilly Media, Inc., 2019
Stream Processing with Apache Flink
Published by
O'Reilly Media, Inc., 2019
- Cover
- nav
- Stream Processing with Apache Flink
- Stream Processing with Apache Flink
- 1. Introduction to Stateful Stream Processing
- 2. Stream Processing Fundamentals
- 3. The Architecture of Apache Flink
- 4. Setting up a development environment for Apache Flink
- 5. The DataStream API (v1.4.0)
- 6. Time-based and Window Operators
- 7. Stateful Operators and User Functions
- 8. Reading from and Writing to External Systems
- 9. Setting Flink Up for Streaming Applications
- 10. Operating Flink and Streaming Applications
Chapter 10. Operating Flink and Streaming Applications
Streaming applications are long-running and often their workloads are unpredictable. It is not uncommon for a streaming job to be continuously running for months, so its operational needs are quite different than those of short-lived batch jobs. Consider a scenario where you detect a bug in your deployed application. If your application is a batch job, you can easily fix the bug offline and then re-deploy the new application code once the current job instance finishes. But what if your job is a long-running streaming job? How do you apply a re-configuration with low effort and while guaranteeing correctness?
If you are using Flink, then you have nothing to worry about. Flink will do all the hard work so you can easily monitor, operate, and re-configure your jobs with minimal effort and preserving exactly-once state semantics. In this chapter, we present the tools Flink offers for operating and maintaining continuously running streaming applications. We discuss how you can collect metrics and monitor your applications and how you can preserve result consistency when you want to update application code or adjust the resources of your application.
Running and Managing Streaming Applications
One would expect that maintaining streaming applications is more challenging than maintaining batch applications. While streaming applications are stateful and continuously running, batch applications are periodically executed. Reconfiguring, scaling, or updating a batch application can be done between executions which seems to be a lot easier than upgrading an application that is continuously ingesting, processing, and emitting data.
However, Apache Flink has many features to significantly ease the maintenance of streaming applications. Most of these features are based on Savepoints. [Footnote: In Chapter 3 we discussed what savepoint are and what you can do with them.]. Flink exposes different interfaces to monitor and control its master and worker processes, and applications.
-
The command-line client is a tool to submit and control applications.
-
The REST API is the underlying interface that is used by the command-line client and the WebUI. It can be accessed by users and scripts and provides access to all system and application metrics as well as endpoints to submit and manage applications.
-
The WebUI is a web interface that provides many details and metrics about a Flink cluster and running applications. It also offers basic functionality to submit and manage applications. The WebUI was described in a later section of this chapter.
In this section, we explain the practical aspects of savepoints and discuss how to start, stop, pause and resume, scale, and upgrade stateful streaming applications using Flink’s command-line client and Flink’s REST API.
Savepoints
A savepoint is basically identical to a checkpoint, i.e., it is a consistent and complete snapshot of an application’s state. However, the life cycles of checkpoints and savepoints differ. Checkpoints are automatically created, loaded in case of a failure, and automatically removed by Flink (depending on the configuration of the application). Moreover, checkpoints are automatically deleted when an application is canceled, unless the application explicitly enabled checkpoint retention. In contrast, savepoints must be manually triggered by a user or an external service and are never automatically removed by Flink.
A savepoint is a directory in a persistent data storage. It consists of a subdirectory that holds the data files containing the state of all tasks and a binary metadata file that includes absolute paths to all data files. Because the paths in the metadata file are absolute, moving a savepoint to a different path will render it unusable. The structure of a savepoint is shown below.
# Savepoint root path
/savepoints/

# Path of a particular savepoint
/savepoints/savepoint-:shortjobid-:savepointid/

# Binary metadata file of a savepoint
/savepoints/savepoint-:shortjobid-:savepointid/_metadata

# Checkpointed operator states
/savepoints/savepoint-:shortjobid-:savepointid/:xxx
Managing Applications with the Command-Line Client
Flink’s command-line client provides the functionality to start, stop, and manage Flink applications. It reads its configuration from the ./conf/flink-conf.yaml file (see Chapter 9). You can call it from the root directory of a Flink setup with the command:
./bin/flink
When run without additional parameters, the client prints a help message.
The Command-Line Client on Windows
The command-line client is based on a Bash script. Therefore, it does not work with the Windows command-line. The ./bin/flink.bat script for the Windows command-line provides only very limited functionality. If you are a Windows user, we recommend to use the regular command-line client and run it on the Windows Subsystem for Linux (WSL) or Cygwin.
Starting an Application
You can start an application with the run command of the command-line client. The command
./bin/flink run ~/myApp.jar
starts the application from the main() method of the class that is referenced in the program-class property of the JAR file’s META-INF/MANIFEST.MF file without passing any arguments to the application. The client submits the JAR file to the master process which distributes it to the worker nodes.
You can pass arguments to the main() method of an application by appending them at the end of the command as shown in the following.
./bin/flink run ~/myApp.jar my-arg1 my-arg2 my-arg3
By default, the client does not return after submitting the application but waits for it to terminate. You can submit an application in detached mode with the -d flag as shown below.
./bin/flink run -d ~/myApp.jar
Instead of waiting for the application to terminate, the client returns and prints the JobID of the submitted job. The JobID is used to specify the job when taking a savepoint, canceling, or rescaling an application.
You can specify the default parallelism of an application with the -p flag.
./bin/flink run -p 16 ~/myApp.jar
The above command sets the default parallelism of the execution environment to 16. The default parallelism of an execution environment is overwritten by all settings that are explicitly specified by the source code of the application, i.e., the parallelism that is defined by calling setParallelism() on the StreamExecutionEnvironment or on an operator has precedence over the default value.
In case the manifest file of your application JAR file does not specify an entry class, you can specify the class using the -c parameter as shown below.
./bin/flink run -c my.app.MainClass ~/myApp.jar
The client will try to start the static main() method of the my.app.MainClass class.
By default, the client submits an application to the Flink master that is specified by the ./conf/flink-conf.yaml file (see the configuration for different setups in Chapter 9). You can submit an application to a specific master process using the -m flag.
./bin/flink run -m myMasterHost:9876 ~/myApp.jar
The above command submits the application to the master that runs on host myMasterHost at port 9876.
Note that the state of an application will be empty if you start it for the first time or do not provide a savepoint or checkpoint to initialize the state. In this case, some stateful operators run special logic to initialize their state. For example, a Kafka source needs to choose the partition offsets from which it consumes a topic if no restored read positions are available.
Listing Running Applications
For all actions that you want to apply to a running job, you need to provide a JobID that identifies the application. The id of a job can be obtained from the WebUI, the REST API, or using the command-line client. The client prints a list of all running jobs, including their JobIDs, when you run the following command.
$ ./bin/flink list -r Waiting for response... ------------------ Running/Restarting Jobs ------------------- 17.10.2018 21:13:14 : bc0b2ad61ecd4a615d92ce25390f61ad : Socket Window WordCount (RUNNING) --------------------------------------------------------------
In the example above the JobID is bc0b2ad61ecd4a615d92ce25390f61ad.
Taking and Disposing a Savepoint
A savepoint can be taken for a running application with the command-line client as follows:
$ ./bin/flink savepoint <jobId> [savepointPath]
The command triggers a savepoint for the job with the provided JobId. If you explicitly specify a savepoint path, the savepoint is stored in the provided directory. Otherwise the default savepoint directory as configured in the flink-conf.yaml file is used.
In order to trigger a savepoint for the job bc0b2ad61ecd4a615d92ce25390f61ad and store it in the directory hdfs:///xxx:50070/savepoints, we call the command-line client as shown below.
$ ./bin/flink savepoint bc0b2ad61ecd4a615d92ce25390f61ad hdfs:///xxx:50070/savepoints
Triggering savepoint for job bc0b2ad61ecd4a615d92ce25390f61ad.
Waiting for response...
Savepoint completed. Path: hdfs:///xxx:50070/savepoints/savepoint-bc0b2a-63cf5d5ccef8
You can resume your program from this savepoint with the run command.
Savepoints can occupy a significant amount of space and are not automatically deleted by Flink. You need to manually remove them to free the consumed storage. A savepoint is removed with the following command.
$ ./bin/flink savepoint -d <savepointPath>
In order to remove the savepoint that we triggered before, call the command as
$ ./bin/flink savepoint -d hdfs:///xxx:50070/savepoints/savepoint-bc0b2a-63cf5d5ccef8 Disposing savepoint 'hdfs:///xxx:50070/savepoints/savepoint-bc0b2a-63cf5d5ccef8'. Waiting for response... Savepoint 'hdfs:///xxx:50070/savepoints/savepoint-bc0b2a-63cf5d5ccef8' disposed.
Do not delete a savepoint before another checkpoint is taken.
Note that you must not delete a savepoint before another checkpoint or savepoint completed. Since savepoints are handled by the system very similarly to regular checkpoints, operators also receive checkpoint completion notifications for completed savepoints and act on them. For example, transactional sinks commit changes to external systems when a savepoint completes. In order to guarantee exactly-once output, Flink must recover from the latest completed checkpoint or savepoint. A failure recovery would fail if Flink would attempt to recover from a savepoint that was removed before. Once another checkpoint (or savepoint) completed, you can safely remove a savepoint.
Canceling an Application
An application can be canceled in two ways, either with or without taking a savepoint. To cancel a running application without taking a savepoint run the following command.
./bin/flink cancel <jobId>
In order to take a savepoint before canceling a running application add the -s flag to the cancel command as shown below.
./bin/flink cancel -s [savepointPath] <jobId>
If you do not specify a savepointPath, the default savepoint directory as configured in ./conf/flink-conf.yaml file is used (see Chapter 9). The command fails if the savepoint folder is neither explicitly specified in the command nor available from the configuration. In order to cancel the application with the JobId bc0b2ad61ecd4a615d92ce25390f61ad and store the savepoint at hdfs:///xxx:50070/savepoints, run the command as shown below.
$ ./bin/flink cancel -s hdfs:///xxx:50070/savepoints d5fdaff43022954f5f02fcd8f25ef855
Cancelling job bc0b2ad61ecd4a615d92ce25390f61ad with savepoint to hdfs:///xxx:50070/savepoints.
Cancelled job bc0b2ad61ecd4a615d92ce25390f61ad. Savepoint stored in hdfs:///xxx:50070/savepoints/savepoint-bc0b2a-d08de07fbb10.</p>
Canceling an Application might fail.
Note that the job will continue to run if taking the savepoint fails. You will need to make another attempt to cancel the job.
Starting an Application from a Savepoint
Starting an application from a savepoint is fairly simple. All you have to do is to start an application with the run command as discussed before and additionally provide a path to a savepoint with the -s option as show by the command below.
./bin/flink run -s <savepointPath> [options] <jobJar> [arguments]
When the job is started, Flink matches the individual state snapshots of the savepoint to all states of the started application. This matching is done in two steps. First, Flink compares the unique operator identifiers of the savepoint and application’s operators. Second, it matches for each operator the state identifiers (see Chapter 7 for details) of the savepoint and the application.
You should define unique operator ids.
Note, if you do not assign unique ids to your operators with the uid() method, Flink assigns default identifiers which are hash values that depend on the type of the operator and its predecessors, i.e., all previous operators. Since it is not possible to change the identifiers in a savepoint, you will have much fewer options to update and evolve your application if you do not manually assign operator identifiers using uid().
As mentioned before, an application can only be started from a savepoint if it is compatible with the savepoint. An unmodified application can always be restarted from its savepoint. However if the restarted application is not identical to the application from which the savepoint was taken, there are three cases to consider.
- If you added a new state to the application or changed the unique identifier of a stateful operator, Flink will not find a corresponding state snapshot in the savepoint. In this case, the new state is initialized as empty.
- If you removed a state from the application or changed the unique identifier of a stateful operator, there is state in the savepoint that cannot be matched to the application. In this case, Flink rejects to start the application to avoid that the state in the savepoint is accidentally lost. You can disable this safety check by adding the -n option to the run command.
- If you changed a state in the application, i.e., changed the state primitive or modified the data type of the state, the application fails to start. This means that you cannot easily evolve the data type of a state in your application, unless you designed your application with state evolution in mind from the start. The Flink community is currently working on improving the support for state evolution. See the section about “Updating a Stateful Application” in Chapter 7 for details.
Scaling an Application In and Out
Decreasing or increasing the parallelism of an application is not hard. You need to take a savepoint, cancel the application, and restart it with an adjusted parallelism from the savepoint. The state of the application is automatically redistributed to the larger or smaller number of parallel operator tasks. See the section on “Scaling Stateful Operators” in Chapter 3 for details on how the different types of operator state and keyed state are scaled. However, there are a few things to consider.
If you require exactly-once results, you should take the savepoint and stop the application with the integrated savepoint-and-cancel command. This prevent that another checkpoint completes after the savepoint, which would trigger exactly-once sinks to emit data after the savepoint.
As discussed in the section ”Setting the Parallelism” in Chapter 5, the parallelism of an application and its operators can be specified in different ways. By default, operators run with the default parallelism of their associated StreamExecutionEnvironment. The default parallelism can be specified when starting an application, for example using the -p parameter in the CLI client. If you implement the application such that the parallelism of its operators depends on the default environment parallelism, you can simply scale an application by starting it from the same JAR file and specifying a new parallelism. However, if you hardcoded the parallelism on the StreamExecutionEnvironment or on some of the operators, you might need to adjust the source code, recompile and repackage your application, before submitting it for execution.
If the parallelism of your application depends on the environment’s default parallelism, Flink provides an atomic rescale command which takes a savepoint, cancels the application, and restarts it with a new default parallelism.
./bin/flink modify <jobId> -p <newParallelism>
To rescale the application with the jobId bc0b2ad61ecd4a615d92ce25390f61ad to a parallelism of 16, run the command as shown below.
./bin/flink modify bc0b2ad61ecd4a615d92ce25390f61ad -p 16 Modify job bc0b2ad61ecd4a615d92ce25390f61ad. Rescaled job bc0b2ad61ecd4a615d92ce25390f61ad. Its new parallelism is 16.
As described in Chapter 3, Flink distributes keyed state on the granularity of so-called key groups. Consequently, the number of key groups of a stateful operator determines its maximum parallelism. The number of key groups is configured per operator using the setMaxParallelism() method. Please see Chapter 7 for details.
Managing Applications with the REST API
The REST API can be directly accessed by users or scripts and exposes information about the Flink cluster and its applications, including metrics, as well as endpoints to submit and control applications. Flink serves the REST API and the Web UI from the same web server which runs as part of the Dispatcher process. By default, both are exposed on port 8081. You can configure a different port at the ./conf/flink-conf.yaml file with the configuration key rest.port. A value of -1 disables the REST API and Web UI.
You can access the REST API using the command-line tool curl. curl is commonly used to transfer data from or to a server and supports the HTTP protocol. A typical curl REST command looks as follows.
$ curl -X <HTTP-Method> [-d <parameters>] http://hostname:port/<REST-point>
Assuming that you are running a local Flink setup that exposes its REST API on port 8081, the following curl command submits a GET request to the /overview REST point.
$ curl -X GET http://localhost:8081/overview
The command returns some basic information about the cluster, such as the Flink version, the number of taskmanager, slots, and jobs that are running, finished, cancelled, or failed.
{
 "taskmanagers":2,
 "slots-total":8,
 "slots-available":6,
 "jobs-running":1,
 "jobs-finished":2,
 "jobs-cancelled":1,
 "jobs-failed":0,
 "flink-version":"1.5.3",
 "flink-commit":"614f216"
}
In the following, we list and briefly describe the most important REST calls. Please refer to the official documentation of Apache Flink for a complete list of supported calls. Please note that the previous section about the command-line client provides more details about some of the operations, such as upgrading or scaling an application.
Managing and Monitoring a Flink Cluster
The REST API exposes endpoints to query information about a running cluster and to shut it down.
Get basic information about the cluster
| Request |
GET /overview |
| Response | Basic information about the cluster as shown above. |
Get the configuration of the JobManager
| Request |
GET /jobmanager/config |
| Response | Returns the configuration of the JobManager as defined in the ./conf/flink-conf.yaml. |
Get a list of all connected TaskManagers
| Request |
GET /taskmanagers |
| Response | Returns a list of all TaskManagers including their ids and basic information, such as memory statistics and connection ports. |
Get a list of available JobManager metrics
| Request |
GET /jobmanager/metrics |
| Response | Returns a list of metrics that are available for the JobManager. |
In order to retrieve one or more JobManager metrics, add the get query parameter with all requested metrics to the request as shown below.
curl -X GET http://hostname:port/jobmanager/metrics?get=metric1,metric2,metric3
Get a list of available TaskManager metrics
| Request |
GET /taskmanagers/<tmId>/metrics |
| Parameters | tmId: The ID of a connected TaskManager. |
| Response | Returns a list of metrics that are available for the chosen TaskManager. |
In order to retrieve one or more metrics for a TaskManager, add the get query parameter with all requested metrics to the request as shown below.
curl -X GET http://hostname:port/taskmanagers/<tmId>/metrics?get=metric1,metric2,metric3
Shutdown the cluster
| Request |
DELETE /cluster |
| Action | Shuts down the Flink cluster. Note that in stand-alone mode, only the master process will be terminated and the worker processes will continue to run. |
Managing and Montioring Flink Applications
The REST API can also be used to manage and monitor Flink applications. In order to start an application, you first need to upload the application’s JAR file to the cluster. The REST API provides endpoints to manage these JAR files.
Upload a JAR file
| Request |
POST /jars/upload |
| Parameters | The file must be sent as multi-part data. |
| Action | Uploads a JAR file to the cluster. |
| Response |
The storage location of the uploaded JAR file. |
The curl command to upload a JAR file is shown below.
curl -X POST -H "Expect:" -F "jarfile=@path/to/flink-job.jar" http://hostname:port/jars/upload
List all uploaded JAR files
| Request |
GET /jars |
| Response | A list of all uploaded JAR files. The list includes the internal ID of a JAR file, its original name, and the time when it was uploaded. |
Delete a JAR file
| Request |
DELETE /jars/<jarId> |
| Parameters | jarId: The ID of the JAR file as provided by the list JAR file command. |
| Action |
Deletes the JAR file the is referenced by the provided ID. |
Start an application
| Request |
POST /jars/<jarId>/run |
| Parameters | jarId: The ID of the JAR file from which the application is started.You can pass additional parameters such as the job arguments, the entry-class, the default parallelism, a savepoint path, and the allow-non-restored-state flag as a JSON object. |
| Action | Starts the application defined by the JAR file (and entry-class) with the provided parameters. If a savepoint path is provided, the application state is initialized from the savepoint. |
| Response |
The job ID of the started application. |
The curl command to start an application with a default parallelism of 4 is shown below.
curl -d '{"parallelism":"4"}' -X POST http://localhost:8081/jars/43e844ef-382f-45c3-aa2f-00549acd961e_App.jar/run
List all applications
| Request |
GET /jobs |
| Response | Lists the job IDs of all running applications and the job IDs of the most recently failed, canceled, and finished applications. |
Show details of an application
| Request |
GET /jobs/<jobId> |
| Parameters | jobId: The ID of a job as provided by the list application command. |
| Response | Basic statistics such as the name of the application, the start time (and end time), as well as information about the executed tasks including the number of ingested and emitted records and bytes. |
The REST API also provides more detailed information about the following aspects of an application.
- The operator plan of the application
- The configuration of the application
- Collected metrics of an application at various levels of detail
- Checkpointing metrics
- Backpressure metrics
- The exception that caused an application to fail.
Please have a look at the official documentation for details how to access this information.
Cancel an application
| Request |
PATCH /jobs/<jobId> |
| Parameters | jobId: The ID of a job as provided by the list application command. |
| Action | Cancels the application. |
Take a savepoint of an application
| Request |
POST /jobs/<jobId>/savepoints |
| Parameters | jobId: The ID of a job as provided by the list application command.In addition, you need to provide a JSON object with the path to the savepoint folder and a flag whether or not to terminate the application with the savepoint. |
| Action | Takes a savepoint of the application. |
| Response |
A request ID to check whether the savepoint trigger action completed successfully. |
The curl command to trigger a savepoint without canceling the job looks as follows.
$ curl -d '{"target-directory":"file:///savepoints", "cancel-job":"false"}' -X POST http://localhost:8081/jobs/e99cdb41b422631c8ee2218caa6af1cc/savepoints
{"request-id":"ebde90836b8b9dc2da90e9e7655f4179"}
Canceling an application with a savepoint might fail.
A request to cancel the application will only succeed if the savepoint was successfully taken, i.e., the application will continue running if the savepoint command failed.
To check if the request with the ID ebde90836b8b9dc2da90e9e7655f4179 was successful and to retrieve the path of the savepoint run the following command.
$ curl -X GET http://localhost:8081/jobs/e99cdb41b422631c8ee2218caa6af1cc/savepoints/ebde90836b8b9dc2da90e9e7655f4179
{"status":{"id":"COMPLETED"}, "operation":{"location":"file:///savepoints/savepoint-e99cdb-34410597dec0"}}
Dispose a savepoint
| Request |
POST /savepoint-disposal |
| Parameters | The path of the savepoint to dispose needs to be provided as a parameter in a JSON object. |
| Action | Disposes a savepoint. |
| Response |
A request ID to check whether the savepoint was successfully disposed or not. |
To dispose a savepoint with curl, run the following command.
$ curl -d '{"savepoint-path":"file:///savepoints/savepoint-e99cdb-34410597dec0"}' -X POST http://localhost:8081/savepoint-disposal
{"request-id":"217a4ffe935ceac2c281bdded76729d6"}
Rescale an application
| Request |
PATCH /jobs/<jobID>/rescaling |
| Parameters |
|
| Action | Takes a savepoint, cancels the application, and restarts it with the new default parallelism from the savepoint. |
| Response | A request ID to check whether the rescaling request was successful or not. |
To rescale an application with curl to a new default parallelism of 16 run the following command.
$ curl -X PATCH http://localhost:8081/jobs/129ced9aacf1618ebca0ba81a4b222c6/rescaling?parallelism=16
{"request-id":"39584c2f742c3594776653f27833e3eb"}
The application might not be rescaled.
The application will continue to run with the original parallelism if the triggered savepoint failed. You can check the status of the rescale request using
Monitoring Flink Clusters and Applications
Monitoring your streaming job is essential to ensure its healthy operation and early detect potential symptoms of misconfigurations, under-provisioning, or unexpected behavior. Especially when a streaming job is part of a larger data processing pipeline or event-driven service in a user-facing application, you probably want to monitor its performance as precisely as possible and make sure it meets certain targets for latency, throughput, resource utilization, etc.
Flink gathers a set of pre-defined metrics during runtime and also provides a framework that allows you to define and track your own metrics.
Flink Web UI
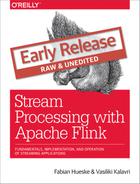
The simplest way to get an overview of your Flink cluster, as well as a glimpse of what your jobs are doing internally is to use Flink’s Web Dashboard. You can access the dashboard by visiting the URL http://<jobmanager-hostname>:8081.
On the home screen, you will see an overview of your cluster configuration including the number of TaskManagers, number of configured, and available task slots, running, and completed jobs. Figure Figure 10-1 shows an instance of the dashboard home screen. The menu on the left links to more detailed information on jobs and configuration parameters and it also allows job submission by uploading a jar.
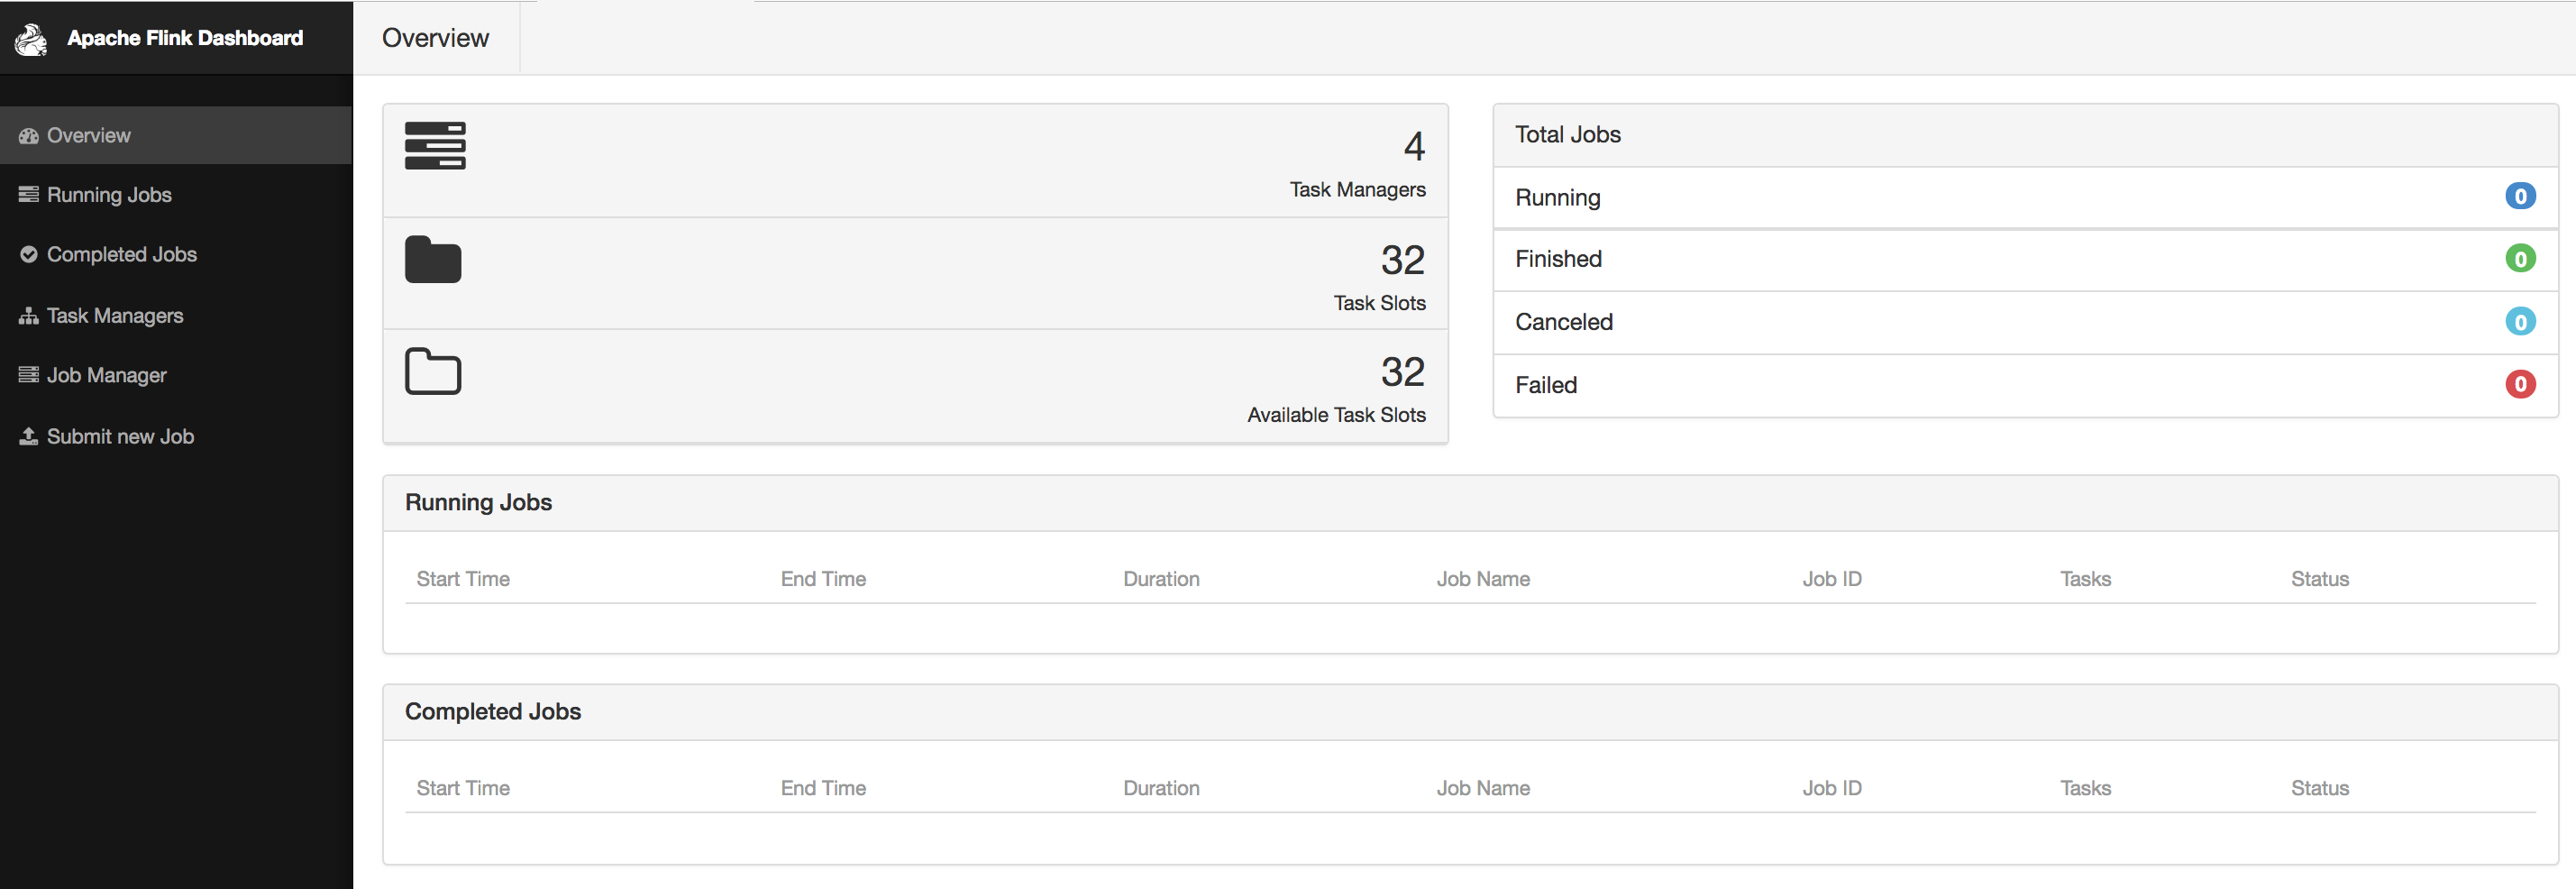
Figure 10-1. Apache Flink Web UI home screen
If you click on a running job, you can get a quick glimpse of running statistics per task or subtask as shown in Figure Figure 10-2. You can inspect the duration, bytes and records exchanged, and aggregate those per TaskManager if you prefer.
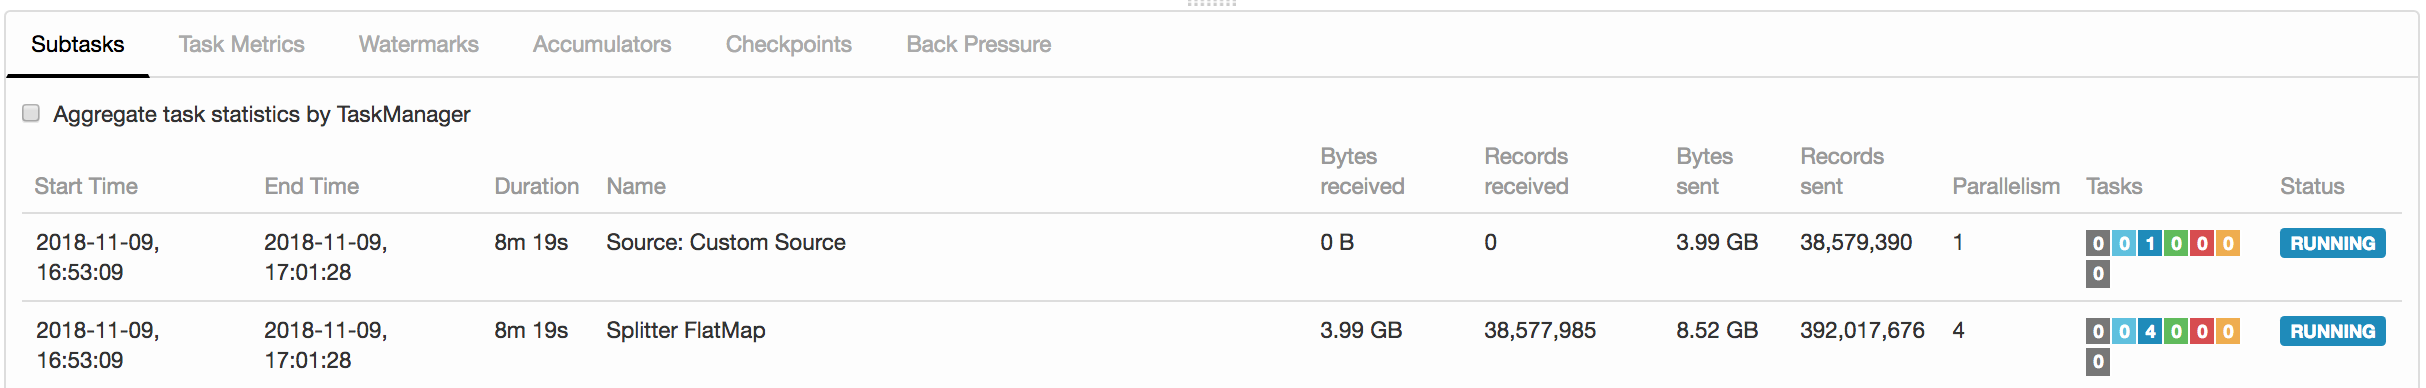
Figure 10-2. Statistics for a running job
If you click on the Task Metrics tab, you can select more metrics from a drop-down menu, as shown in Figure Figure 10-3. These include more fine-grained statistics about your tasks, such as buffer usage, watermarks, and input/output rates.
Figure 10-3. Selecting metrics to plot
Figure Figure 10-4 shows how selected metrics are visualized as continuously updated charts.
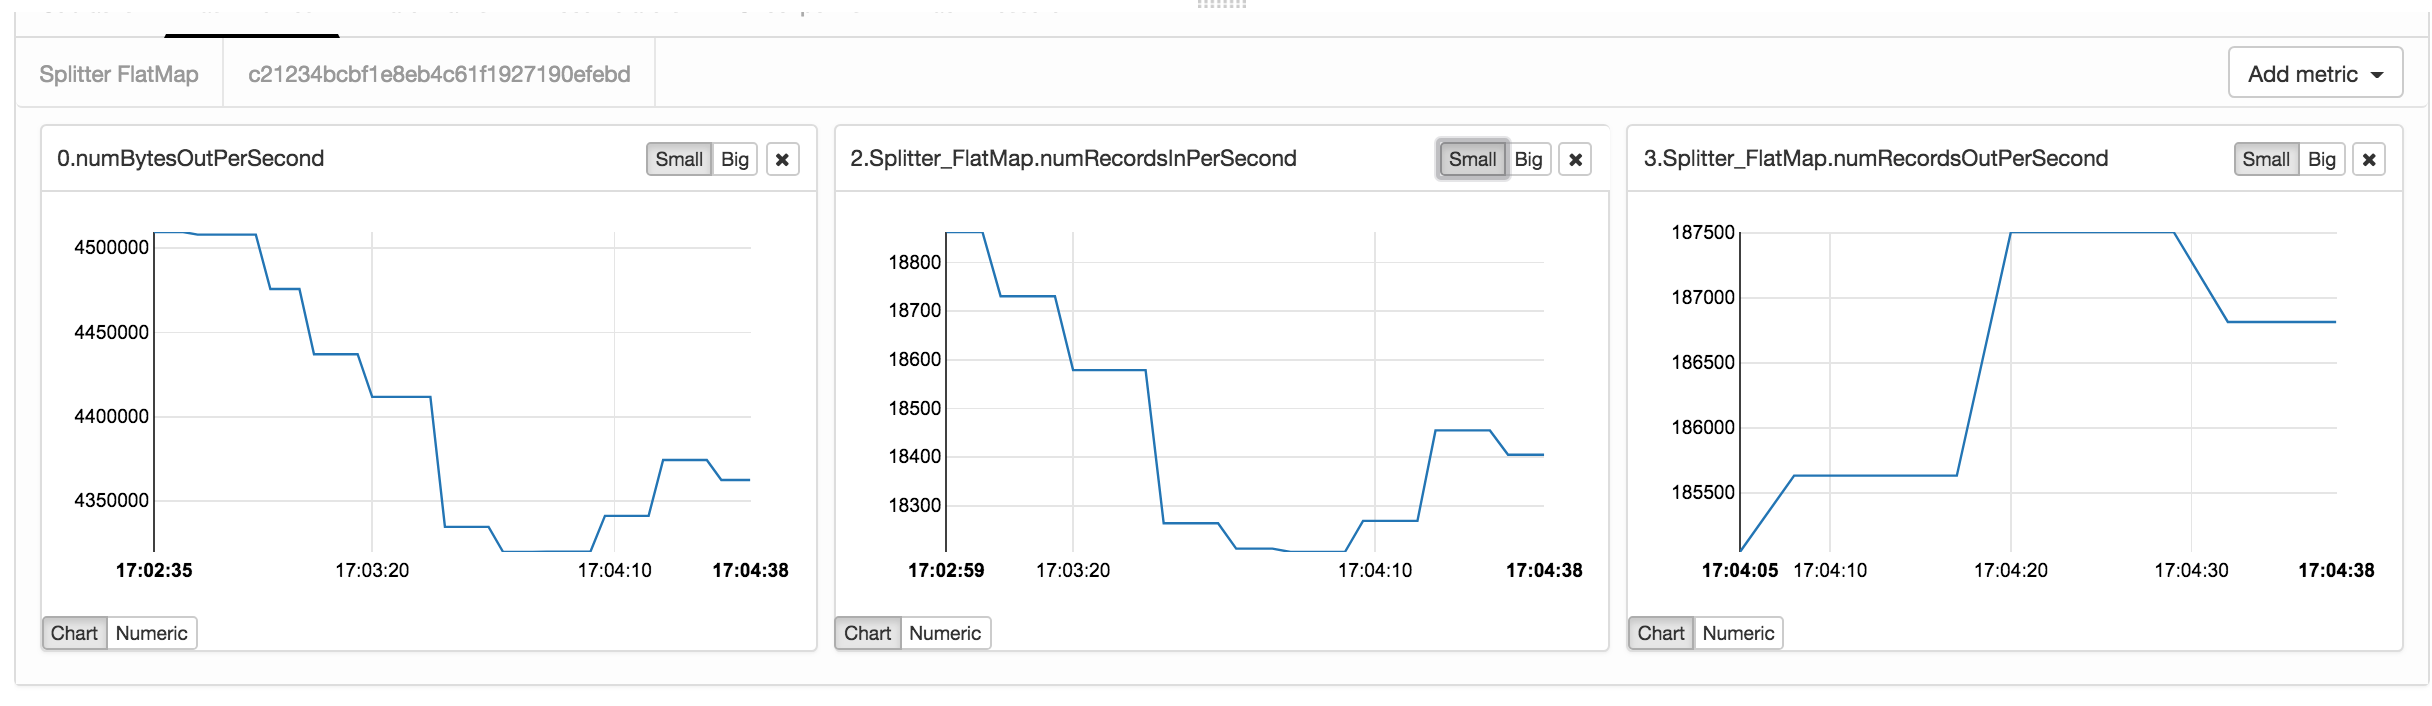
Figure 10-4. Real-time metric plots
The Checkpoints tab (Figure Figure 10-2) displays statistics about previous and current checkpoints. Under Overview you can see how many checkpoints have been triggered, are in progress, have completed successfully, or have failed. If you click on the History view, you can retrieve more fine-grained information, such as the status, trigger time, state size, and how many bytes where buffered during the checkpoint’s alignment phase. The Summary view aggregates checkpoints statistics and provides minimum, maximum, and average values over all completed checkpoints. Finally, under Configuration, you can inspect the configuration properties of checkpoints, such as the interval and the timeout values set.
Similarly, the Back Pressure tab displays back pressure statistics per operator and subtask. If you click on a row, you trigger back pressure sampling and you will see the message Sampling in progress... for about five seconds. Once sampling is complete, you will see the back pressure status in the second column. Back pressured tasks will display a HIGH sign, otherwise you should see a nice green OK message displayed.
Metric System
When running a data processing system such as Flink in production, it is essential to monitor its behavior to be able to discover and diagnose the cause for performance degradations. Flink collects several system and application metrics by default. Metrics are gathered per operator, TaskManager, or JobManager. Here we describe some of the most commonly used metrics and refer you to Flink’s documentation for a full list of available metrics.
Categories include CPU utilization, memory used, number of active threads, garbage collection statistics, network metrics such as number of queued input/output buffers, cluster-wide metrics such as number or running jobs and available resources, job metrics including runtime, number of retries and checkpointing information, I/O statistics including number of records exchanges locally and remotely, watermark information, connector-specific metrics, e.g. for Kafka.
Metric Groups
Flink metrics are registered and accessed through the MetricGroup interface. The MetricGroup provides ways to create nested, named metrics hierarchies and provides methods to register the following metric types:
Counter
A org.apache.flink.metrics.Counter metric measures a count and provides methods for increment and decrement. You can register a counter metrics using the counter(String name, Counter counter) method on a MetricGroup.
Gauge
A Gauge metric calculates a value of any type at a point in time. To use a Gauge you implement the org.apache.flink.metrics.Gauge interface and register it using the gauge(String name, Gauge gauge) method on a MetricGroup.
The code in Example Example 10-1 shows the implementation of the WatermarkGauge metric which exposes the current watermark:
Example 10-1. Implementation of a WatermarkGauge metrics that exposes the current watermark
publicclassWatermarkGaugeimplementsGauge<Long>{privatelongcurrentWatermark=Long.MIN_VALUE;publicvoidsetCurrentWatermark(longwatermark){this.currentWatermark=watermark;}@OverridepublicLonggetValue(){returncurrentWatermark;}}
Metrics are reported as Strings
Metrics reporters will turn the Gauge value into a String, so make sure you provide a meaningful toString() implementation if not provided by the type you use.
Histogram
You can use a histogram to represent the distribution of numerical data. Flink’s histogram is especially implemented for reporting metrics on long values. The org.apache.flink.metrics.Histogram interface allows to collect values, get the current count of collected values, and create statistics, such as min, max, standard deviation, and mean, for the values seen so far.
Apart from creating your own histogram implementation, Flink also allows you to use a DropWizard histogram, by adding the following dependency in pom.xml:
Example 10-2. Importing the DropWizard dependency into your pom.xml
<dependency>
     <groupId>org.apache.flink</groupId>
     <artifactId>flink-metrics-dropwizard</artifactId>
     <version>flink-version</version>
</dependency>
You can then register a DropWizard histogram in your Flink program using the DropwizardHistogramWrapper class as shown in the following example:
Example 10-3. Using the DropwizardHistogramWrapper
DropwizardHistogramWrapperhistogramWrapper=newDropwizardHistogramWrapper(newcom.codahale.metrics.Histogram(newSlidingWindowReservoir(500)))metricGroup.histogram(“myHistogram”,histogramWrapper)…histogramWrapper.update(i)…valminValue=histogramWrapper.getStatistics().getMin()
Meter
You can use a Meter metric to measure the rate (in events per second) at which certain events happen. The org.apache.flink.metrics.Meter interface provides methods to mark the occurrence of one or more events, get the current rate of events per second, and the current number of events marked on the meter.
As with histograms, you can use DropWizard meters by adding the flink-metrics-dropwizard dependency in your pom and wrapping the meter in a DropwizardMeterWrapper class.
Registering and using metrics
In order to register any of the above metrics, you have to retrieve a MetricGroup by calling the getMetrcisGroup() method on the RuntimeContext, as shown in the Example Example 10-4:
Example 10-4. Registering a Counter metric which is incremented every time the filter transformation drops an element.
classPositiveFilterextendsRichFilterFunction[Int]{@transientprivatevarcounter:Counter=_overridedefopen(parameters:Configuration):Unit={counter=getRuntimeContext.getMetricGroup.counter("droppedElements")}overridedeffilter(value:Int):Boolean={if(value>0){true}else{counter.inc()false}}}
Metrics format
Flink metrics belong to a scope, which can be either the system scope, for system-provided metrics, or the user scope for custom, user-defined metrics.
Identifiers
Metrics are referenced by a unique identifier which contains up to three parts:
- The name that the user specifies when registering the metric
- An optional user scope
- A system scope
For instance, the name “myCounter”, the user scope “MyMetrics”, and the system scope “localhost.taskmanager.512”, would result into the identifier “localhost.taskmanager.512.MyMetrics.myCounter”. You can change the default “." delimiter by setting the metrics.scope.delimiter configuration option.
System scope
The system scope declares what component of the system the metric refers to and what context information it should include. Metrics can be scoped to the JobManager, a TaskManager, a job, an operator, or a task. You can configure which context information the metric should contain by setting the corresponding metric options in the flink-conf.yaml file. We list some of these configuration options and their default values in Table Table 10-1:
| Scope | Configuration Key | Default value |
| JobManager | metrics.scope.jm | <host>.jobmanager |
| JobManager and job | metrics.scope.jm.job | <host>.jobmanager.<job_name> |
| TaskManager | metrics.scope.tm | <host>.taskmanager.<tm_id> |
| TaskManager and job | metrics.scope.tm.job |
<host>.taskmanager.<tm_id>.<job_name> |
| Task | metrics.scope.task | <host>.taskmanager.<tm_id>.<job_name>.<task_name>.<subtask_index> |
| Operator | metrics.scope.operator | <host>.taskmanager.<tm_id>.<job_name>.<operator_name>.<subtask_index> |
The configuration keys contain constant strings, such as “taskmanager”, and variables shown in angle brackets. The latter will be replaced at runtime with actual values. For instance, the default scope for TaskManager metrics might create the scope “localhost.taskmanager.512”, where “localhost” and “512" are parameter values. Apart from the ones in the table, the following parameters can also be used:
- JobManager: <host>
- TaskManager: <host>, <tm_id>
- Job: <job_id>, <job_name>
- Task: <task_id>, <task_name>, <task_attempt_id>, <task_attempt_num>, <subtask_index>
- Operator: <operator_id>,<operator_name>, <subtask_index>
Scope identifiers per job must be unique
If multiple copies of the same job are run concurrently, metrics might become inaccurate, due to string conflicts. To avoid such risk, you should make sure that scope identifiers per job are unique. For instance, this can be easily handled by including the job ID.
User scope
You can also define a user scope for metrics by calling the addGroup() method of the MetricGroup, as shown in Example Example 10-5:
Example 10-5. Defining the user scope “MyMetrics”
counter = getRuntimeContext
 .getMetricGroup
 .addGroup("MyMetrics")
 .counter("myCounter")
Exposing metrics
Now that you have learnt how to register, define, and group metrics, you might be wondering how to access them from external systems. After all, you most probably gather metrics because you want to create a real-time dashboard or feed the measurements to another application. You can expose metrics to external backends through reporters and Flink provides implementation for several of them:
- JMX (org.apache.flink.metrics.jmx.JMXReporter)
- Graphite (org.apache.flink.metrics.graphite.GraphiteReporter)
- Prometheus (org.apache.flink.metrics.prometheus.PrometheusReporter)
- PrometheusPushGateway (org.apache.flink.metrics.prometheus.PrometheusPushGatewayReporter)
- StatsD (org.apache.flink.metrics.statsd.StatsDReporter)
- Datadog (org.apache.flink.metrics.datadog.DatadogHttpReporter)
- Slf4j (org.apache.flink.metrics.slf4j.Slf4jReporter).
If you want to use a metrics backend that is not included in the above list, you can also define your own reporter by implementing the org.apache.flink.metrics.reporter.MetricReporter interface.
Reporters need to be configured in flink-conf.yaml. Adding the following lines to your configuration will define a JMX reporter “my_reporter" which listens to ports 9020-9040:
metrics.reporters: my_reporter

Metrics.reporter.my_jmx_reporter.class: org.apache.flink.metrics.jmx.JMXReporter

metrics.reporter.my_jmx_reporter.port: 9020-9040
Please consult the Flink documentation for a full list of configuration options per supported reporter.
Monitoring Latency
Latency is probably one of the first metrics you want to monitor to assess the performance characteristics of your streaming job. At the same time, it is also one of the trickiest metrics to even define in a distributed streaming engine with rich semantics such as Flink. In Chapter 2, we defined latency broadly, as the time it takes to process an event. You can imagine how a precise implementation of this definition can get problematic in practice if we try to track the latency per event in a high-rate streaming job with a complex dataflow. Considering window operators complicates latency tracking even further. If an event contributes to several windows, do we need to report the latency of the first invocation or do we need to wait until we evaluate all windows an event might belong to? And what if a window triggers multiple times?
Flink follows a simple and low-overhead approach to provide useful latency metric measurements. Instead of trying to strictly measure latency for each and every event, it approximates latency by periodically emitting a special record at the sources and allowing users to track how long it takes for this record to arrive at the sinks. This special record is called a latency marker and it bears a timestamp indicating when it was emitted.
To enable latency tracking, you need to configure how often latency markers are emitted from the sources. You can do this by setting the latencyTrackingInterval in the ExecutionConfig as shown below:
Example 10-6. Setting the latency market interval to 500ms
env.getConfig.setLatencyTrackingInterval(500L
Note that the interval is in specified in milliseconds. Upon receiving a latency marker, all operators except sinks forward it downstream. Latency markers use the same dataflow channels and queues as normal stream records, thus their tracked latency reflects the time records wait to be processed. However, they do not measure the time it takes for records to be processed or the time that records wait in window buffers until they are processed.
Operators keep latency statistics in a latency gauge which contains min, max, and mean values, as well as 50, 95, and 99-percentile values. Sink operators keep statistics on latency markers received per parallel source instance, thus checking the latency marker at sinks can be used to approximate how long it takes for records to traverse the dataflow. If you would like to customly handle the latency marker at operators, you can override the processLatencyMarker() method and retrieve the relevant information using the LatencyMarker’s methods getMarkedTime(), getVertexId(), and getSubTaskIndex().
Beware of clock skew
Note that if you are not using any automatic clock synchronization services such as NTP, your machines' clocks might suffer from clock skew. In this case, latency tracking estimation will not be reliable, as its current implementation assumes synchronized clocks.
Configuring the Logging Behavior
Logging is another essential tool for debugging and understanding the behavior of your applications. By default, Flink uses the SLF4J logging abstraction together with the log4j logging framework.
The following example shows a MapFunction that logs every input record conversion:
Example 10-7. Using logging in a MapFunction
importorg.apache.flink.api.common.functions.MapFunctionimportorg.slf4j.LoggerFactoryimportorg.slf4j.LoggerclassMyMapFunctionextendsMapFunction[Int,String]{LoggerLOG=LoggerFactory.getLogger(MyMapFunction.class)overridedefmap(value:Int):String={LOG.info("Converting value {} to string.",value)value.toString}}
To change the properties of log4j loggers, you can modify the log4j.properties file in the conf/ folder. For instance, the following line sets the root logging level to “warning”:
log4j.rootLogger=WARN
You can set a custom filename and location of this file passing the -Dlog4j.configuration= parameter to the JVM. Flink also provides the log4j-cli.properties file used by the command-line client and log4j-yarn-session.properties used by the command-line client when starting a YARN session.
An alternative to log4j is logback and Flink provides default configuration files for this backend as well. To use logback instead of log4j, you will need to remove log4j from the lib/ folder. We refer you to Flink’s documentation and the logback manual for details on how to setup and configure the backend.
Summary
In this chapter we discussed how to run, manage, and monitor Flink applications in production. We explained the Flink component that collects and exposes system and application metrics, how to configure an logging system, and how to start, stop, resume, and rescale applications with the command line client the the REST API.