Table of Contents for
Getting Started with Varnish Cache
 Getting Started with Varnish Cache
Published by
O'Reilly Media, Inc., 2017
Getting Started with Varnish Cache
Published by
O'Reilly Media, Inc., 2017
- nav
- Cover
- Varnish
- Getting Started with Varnish Cache
- Getting Started with Varnish Cache
- Dedication
- Preface
- 1. What Is Varnish Cache?
- 2. Go, Go, Go and Get Started!
- 3. Varnish Speaks HTTP
- 4. The Varnish Configuration Language
- 5. Invalidating the Cache
- 6. Dealing with Backends
- 7. Improving Your Hit Rate
- 8. Logging, Measuring, and Debugging
- 9. What Does This Mean for Your Business?
- 10. Taking It to the Next Level
- Index
- About the Author
- Colophon
Chapter 8. Logging, Measuring, and Debugging
Setting up Varnish, configuring parameters, and tuning your VCL is all fun and games, but how do you know how effective your setup is? You could look at the load statistics of your Varnish servers and your backends. If those are fine, you know your environment isn’t on the verge of exploding. Unfortunately, this gives us little information on the hit rate of the cache—it would be nice to identify the hot spots in your application and whether those hot spots are cached appropriately. If it turns out that certain pages aren’t cached when they should be, you would like to know why, right? Who knows, by optimizing your application or your VCL, the load could further drop and this could lead to a downsize of your infrastructure.
Luckily, Varnish offers ways to debug and measure the HTTP requests, the HTTP responses, and the cache. In this chapter, we’ll cover the following tools:
-
varnishstat -
varnishlog -
varnishtop
These binaries all use the shared memory log, which we talked about in “Shared log memory storage”.
Note
Varnish offers even more tools, but many are beyond the scope of this book. To learn more, you can have a look at the documentation for binaries like varnishhist and varnishncsa.
Varnishstat
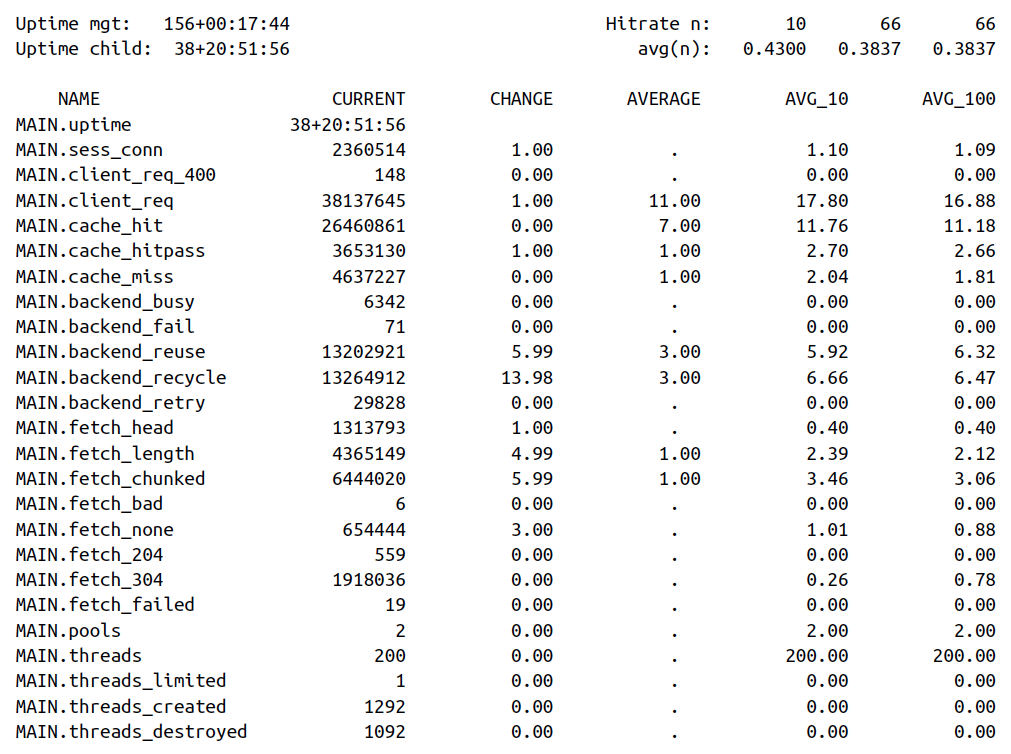
The varnishstat binary displays statistics of a running Varnish instance. These are general statistics about connections, sessions, backends, storage, hit rate, and much more. This is a good dashboard for sysadmins: it shares little information about the application and individual requests, but paints a picture about the state of the Varnish instance. It’s easy to see the number of objects in cache or space left on the storage device. You can even see if Varnish is dropping objects from the cache due to lack of space.
Displaying Specific Metrics
The output you’re getting doesn’t include all the metrics: just execute varnishstat -l to see a full list.
Here’s an example in which we output a limited set of metrics:
-
All the information about the cache (hits, misses, hit-for-passes)
-
The number of backend failures
-
The number of bytes available in the cache
-
The number of objects stored in cache
-
The number of objects that were nuked from the cache due to lack of space
varnishstat -f MAIN.cache_* -f MAIN.backend_fail -f SMA.s0.c_bytes
-f MAIN.n_object -f MAIN.n_lru_nuked
And this could then be the output:
Uptime mgt:   156+00:32:10               Hitrate n:        9        9        9
Uptime child:  38+21:06:23                  avg(n):   0.4551   0.4551   0.4551

NAME                CURRENT     CHANGE     AVERAGE        AVG_10       AVG_100
MAIN.cache_hit     26468969      53.94        7.00         13.74         13.74
MAIN.cache_hitpass  3654504      12.98        1.00          3.00          3.00
MAIN.cache_miss     4638817       4.99        1.00          3.75          3.75
MAIN.backend_fail        71       0.00         .            0.00          0.00
SMA.s0.c_bytes       164.34G     95.51K      51.30K        68.35K        68.35K
MAIN.n_object         48508     -11.99         .        48512.33      48512.33
Varnishlog
Varnishlog is a binary tool that reads the shared memory logs and displays this information in real time. It represents the log as a list of tags and values. Have a look at the extensive list of VSL tags on the Varnish documentation site and learn how to interpret their value.
Example Output
This example is the unfiltered output of a varnishlog execution:
*   << Request  >> 65538
-   Begin          req 1 rxreq
-   Timestamp      Start: 1476957981.431713 0.000000 0.000000
-   Timestamp      Req: 1476957981.431713 0.000000 0.000000
-   ReqStart       10.10.10.1 60358
-   ReqMethod      GET
-   ReqURL         /
-   ReqProtocol    HTTP/1.1
-   ReqHeader      Host: example.com
-   ReqHeader      Connection: keep-alive
-   ReqHeader      Cache-Control: max-age=0
-   ReqHeader      Upgrade-Insecure-Requests: 1
-   ReqHeader      User-Agent: Mozilla/5.0 (Macintosh; Intel Mac OS X 10_12_0)
AppleWebKit/537.36 (KHTML, like Gecko) Chrome/53.0.2785.143 Safari/537.36
-   ReqHeader      Accept: text/html,application/xhtml+xml,application/xml;q=0.9,
image/webp,*/*;q=0.8
-   ReqHeader      Accept-Encoding: gzip, deflate, sdch
-   ReqHeader      Accept-Language: nl,en-US;q=0.8,en;q=0.6
-   ReqHeader      X-Forwarded-For: 10.10.10.1
-   VCL_call       RECV
-   VCL_return     hash
-   ReqUnset       Accept-Encoding: gzip, deflate, sdch
-   ReqHeader      Accept-Encoding: gzip
-   VCL_call       HASH
-   Hash           "/%00"
-   Hash           "example.com%00"
-   VCL_return     lookup
-   VCL_call       MISS
-   VCL_return     fetch
-   Link           bereq 65539 fetch
-   Timestamp      Fetch: 1476957982.211473 0.779760 0.779760
-   RespProtocol   HTTP/1.1
-   RespStatus     200
-   RespReason     OK
-   RespHeader     Date: Thu, 20 Oct 2016 10:06:21 GMT
-   RespHeader     Server: Apache/2.4.10 (Debian)
-   RespHeader     Vary: Accept-Encoding
-   RespHeader     Content-Encoding: gzip
-   RespHeader     Content-Length: 496
-   RespHeader     Content-Type: text/html; charset=UTF-8
-   RespHeader     X-Varnish: 65538
-   RespHeader     Age: 0
-   RespHeader     Via: 1.1 varnish-v4
-   VCL_call       DELIVER
-   VCL_return     deliver
-   Timestamp      Process: 1476957982.211516 0.779804 0.000043
-   RespHeader     Accept-Ranges: bytes
-   Debug          "RES_MODE 2"
-   RespHeader     Connection: keep-alive
-   Timestamp      Resp: 1476957982.211588 0.779875 0.000072
-   ReqAcct        424 0 424 289 496 785
-   End
**  << BeReq    >> 65539
--  Begin          bereq 65538 fetch
--  Timestamp      Start: 1476957981.431787 0.000000 0.000000
--  BereqMethod    GET
--  BereqURL       /
--  BereqProtocol  HTTP/1.1
--  BereqHeader    Host: example.com
--  BereqHeader    Upgrade-Insecure-Requests: 1
--  BereqHeader    User-Agent: Mozilla/5.0 (Macintosh; Intel Mac OS X 10_12_0)
AppleWebKit/537.36 (KHTML, like Gecko) Chrome/53.0.2785.143 Safari/537.36
--  BereqHeader    Accept: text/html,application/xhtml+xml,application/xml;q=0.9,
image/webp,*/*;q=0.8
--  BereqHeader    Accept-Language: nl,en-US;q=0.8,en;q=0.6
--  BereqHeader    X-Forwarded-For: 10.10.10.1
--  BereqHeader    Accept-Encoding: gzip
--  BereqHeader    X-Varnish: 65539
--  VCL_call       BACKEND_FETCH
--  VCL_return     fetch
--  BackendOpen    33 boot.default 127.0.0.1 8080 127.0.0.1 36222
--  Timestamp      Bereq: 1476957981.431879 0.000092 0.000092
--  Timestamp      Beresp: 1476957982.211306 0.779520 0.779427
--  BerespProtocol HTTP/1.1
--  BerespStatus   200
--  BerespReason   OK
--  BerespHeader   Date: Thu, 20 Oct 2016 10:06:21 GMT
--  BerespHeader   Server: Apache/2.4.10 (Debian)
--  BerespHeader   Vary: Accept-Encoding
--  BerespHeader   Content-Encoding: gzip
--  BerespHeader   Content-Length: 496
--  BerespHeader   Content-Type: text/html; charset=UTF-8
--  TTL            RFC 120 10 -1 1476957982 1476957982 1476957981 0 0
--  VCL_call       BACKEND_RESPONSE
--  VCL_return     deliver
--  Storage        malloc s0
--  ObjProtocol    HTTP/1.1
--  ObjStatus      200
--  ObjReason      OK
--  ObjHeader      Date: Thu, 20 Oct 2016 10:06:21 GMT
--  ObjHeader      Server: Apache/2.4.10 (Debian)
--  ObjHeader      Vary: Accept-Encoding
--  ObjHeader      Content-Encoding: gzip
--  ObjHeader      Content-Length: 496
--  ObjHeader      Content-Type: text/html; charset=UTF-8
--  Fetch_Body     3 length stream
--  Gzip           u F - 496 3207 80 80 3901
--  BackendReuse   33 boot.default
--  Timestamp      BerespBody: 1476957982.211449 0.779663 0.000143
--  Length         496
--  BereqAcct      406 0 406 196 496 692
--  End
You see tags like:
-
ReqURL -
ReqHeader -
VCL_call -
VCL_return -
Hash -
TTL
All these tags and their respective values give you very detailed information about the state of a request. It shows you the request information, the different stages of the Varnish Finite State Machine, optional backend connections, the way an object is stored, the time-to-live, and much more.
This is an essential tool for debugging. I admit that it is extremely verbose, and on live systems, impossible to use without the proper filtering.
Filtering the Output
Luckily, varnishlog offers these filtering options:
-g-
Offers different kinds of output grouping
-i-
Allows you to only include certain VSL tags
-I-
Includes tags by regular expression
-x-
Allows you to exclude certain VSL tags
-I-
Excludes tags by regular expression
-q-
Allows you to execute a VSL query
In older versions of Varnish, debugging the shared memory log was difficult due to limitations in terms of filtering. In Varnish version 4, VSL queries were introduced. This feature made a huge improvement when it comes to debugging Varnish behavior.
Here’s an example in which we want to see URLs that aren’t served from cache, accompanied by the flow that is executed to get to that result:
varnishlog -i ReqUrl -i VCL_call -i VCL_return
-q "VCL_call eq 'MISS' or VCL_call eq 'PASS'"
So we’re interested in log entries where the VCL_call tags equal either miss (cacheable, but not in cache) or pass (uncacheable). After filtering requests, we’ll only display the log lines that contain the request URL (ReqUrl), the different stages of the Varnish Finite State Machine (VCL_call), and the actions that were returned for every state (VCL_return).
-   ReqURL         /
-   VCL_call       RECV
-   VCL_return     hash
-   VCL_call       HASH
-   VCL_return     lookup
-   VCL_call       MISS
-   VCL_return     fetch
-   VCL_call       DELIVER
-   VCL_return     deliver
This one request contained the following events:
-
Received by Varnish (
VCL_call RECV) -
Varnish decided it was cacheable and performed a cache lookup (
VCL_return hash) -
The lookup hash was composed (
VCL_call HASH) -
Based on the hash, a cache lookup was performed (
VCL_return lookup) -
The item was not found in cache and triggered a miss (
VCL_call MISS) -
A backend connection was made and the item was fetched (
VCL_return fetch) -
The fetched data is deliverable to the client (
VCL_call DELIVER) -
The response is effectively returned to the client (
VCL_return deliver)
Varnishtop
Varnishtop is a binary that uses the same shared memory log as varnishlog and uses the same concept of tags and values. Even the binary options are nearly the same.
Then what makes it different? Well, the output: instead of outputting log lines as part of a request, it presents a continuously updated list of the most commonly occurring log entries. You can compare it to the top command in Linux.
Because varnishtop orders entries by number of occurences in the shared memory log, it doesn’t make sense to run the command without applying the proper filters. So you’ll use tag filtering and VSL queries to present meaningful output.
Here’s an example in which we apply filters to varnishtop to retrieve a list of URLs with the most cache misses:
varnishtop -i ReqUrl -q "VCL_call eq 'MISS'"
This is the output it could return:
125.25 ReqURL         /page1
10.86 ReqURL         /page2
0.57 ReqURL         /
0.10 ReqURL         /page3
If you look at the output, you’ll notice that /page1 generates 125.25 misses per minute. It’s worth having a look at that page to inspect its behavior. You can use varnishlog to check which VCL_call and VCL_return values it has while executing the flow.
Note
The default sampling rate is 60 seconds. If you want to change that value, you can use the -p option to modify the sampling rate of varnishtop.
Conclusion
If you run Varnish and don’t use any of the tools mentioned in this chapter, you’re vulnerable. You may be under the impression that all is good, but a sudden set of cache misses can come out of nowhere. Use varnishtop to keep tabs on your instances. You can even format the output in several ways. You can use these metrics in your monitoring agents and send alerts when values hit a critical level. You can easily audit the application behavior by issuing varnishtop commands, as they will allow you to see the most common executions of certain tags. If some of those values are out of the ordinary, you can dig deeper and use varnishlog to inspect very specific scenarios. If you really want to optimize your hit rate (as indicated in Chapter 7), you’ll want to know the consequences of your VCL changes—these tools will help you to know for sure.