Table of Contents for
Learning Node
 Learning Node
Published by
O'Reilly Media, Inc., 2012
Learning Node
Published by
O'Reilly Media, Inc., 2012
- Cover
- Learning Node
- Learning Node
- A Note Regarding Supplemental Files
- Preface
- 1. Node.js: Up and Running
- 2. Interactive Node with REPL
- 3. The Node Core
- 4. The Node Module System
- 5. Control Flow, Asynchronous Patterns, and Exception Handling
- 6. Routing Traffic, Serving Files, and Middleware
- 7. The Express Framework
- 8. Express, Template Systems, and CSS
- 9. Structured Data with Node and Redis
- 10. Node and MongoDB: Document-Centric Data
- 11. The Node Relational Database Bindings
- 12. Graphics and HTML5 Video
- 13. WebSockets and Socket.IO
- 14. Testing and Debugging Node Applications
- 15. Guards at the Gate
- 16. Scaling and Deploying Node Applications
- A. Node, Git, and GitHub
- Index
- About the Author
- Colophon
- Copyright
Chapter 14. Testing and Debugging Node Applications
In previous chapters, the only debugging aid used in the examples was printing information to the console. For smaller and less complex applications that are still in development, this is sufficient. However, as your application grows and gets more complicated, you’ll need to use other, more sophisticated tools for debugging.
You’re also going to want to incorporate more formal testing, including the use of test-creation tools that can be used by others to test your module or application in their environments.
Debugging
Frankly, console.log will
always remain my debugger of choice, but its usefulness does degrade as
your application increases in size and complexity. Once you’ve moved
beyond a simple application, you’re going to want to consider using more
sophisticated debugging tools. We’ll go over some options in the sections
that follow.
The Node.js Debugger
The V8 engine comes with a built-in debugger we can use with our Node applications, and Node provides a client that makes it simple to use. We start by adding debugger statements into our code anywhere we want a breakpoint:
// create the proxy that listens for all requests
httpProxy.createServer(function(req,res,proxy) {

   debugger;
   if (req.url.match(/^\/node\//))
      proxy.proxyRequest(req, res, {
        host: 'localhost',
        port: 8000
      });
   else
      proxy.proxyRequest(req,res, {
        host: 'localhost',
        port: 8124
      });
}).listen(9000);
We then run the application in debug mode:
node debug debugger.js
In debug mode, the application stops at the beginning of the file.
To go to the first breakpoint, type cont, or its abbreviation, c. This causes the debugger to stop at the
first breakpoint; the application then sits, waiting for input from the
user (such as a web request):
< debugger listening on port 5858
connecting... ok
break in app2.js:1
  1 var connect = require('connect'),
  2     http = require('http'),
  3     fs = require('fs'),
debug> cont (--> note it is just waiting at this point for a web request)
break in app2.js:11
  9 httpProxy.createServer(function(req,res,proxy) {
 10
 11    debugger;
 12    if (req.url.match(/^\/node\//))
 13       proxy.proxyRequest(req, res, {
debug>
You have several options at this point. You can step through the
code using the next (n) command, step into a function using
step (s), or step out of a function using out (o). In the following code, the debugger stops
at the breakpoint, and the next few lines are stepped over with
next until line 13,
which has a function call. I use step at this point to
step into the function. I can then traverse the function code using
next, and return to the
application using out:
debug> cont
break in app2.js:11
  9 httpProxy.createServer(function(req,res,proxy) {
 10
 11    debugger;
 12    if (req.url.match(/^\/node\//))
 13       proxy.proxyRequest(req, res, {
debug> next
break in app2.js:12
 10
 11    debugger;
 12    if (req.url.match(/^\/node\//))
 13       proxy.proxyRequest(req, res, {
 14         host: 'localhost',
debug> next
break in app2.js:13
 11    debugger;
 12    if (req.url.match(/^\/node\//))
 13       proxy.proxyRequest(req, res, {
 14         host: 'localhost',
 15         port: 8000
debug> step
break in /home/examples/public_html/node/node_modules/http-proxy/lib/
node-http-proxy/routing-proxy.js:144
 142 //
 143 RoutingProxy.prototype.proxyRequest = function (req, res, options) {
 144   options = options || {};
 145
 146   //
debug> next
break in /home/examples/public_html/node/node_modules/http-proxy/lib/
node-http-proxy/routing-proxy.js:152
 150   // arguments are supplied to `proxyRequest`.
 151   //
 152   if (this.proxyTable && !options.host) {
 153     location = this.proxyTable.getProxyLocation(req);
 154
debug> out
break in app2.js:22
 20         port: 8124
 21       });
 22 }).listen(9000);
 23
 24 // add route for request for dynamic resource
You can also set a new breakpoint, either on the current line
setBreakpoint (sb), or the first line in a named function or
script file:
break in app2.js:22
 20         port: 8124
 21       });
 22 }).listen(9000);
 23
 24 // add route for request for dynamic resource
debug> sb()
 17    else
 18       proxy.proxyRequest(req,res, {
 19         host: 'localhost',
 20         port: 8124
 21       });
*22 }).listen(9000);
 23
 24 // add route for request for dynamic resource
 25 crossroads.addRoute('/node/{id}/', function(id) {
 26    debugger;
 27 });
Clear a breakpoint with clearBreakpoint
(cb).
You can add an expression to a watch list and list out current watches, in addition to using REPL to examine variables:
break in app2.js:11
  9 httpProxy.createServer(function(req,res,proxy) {
 10
 11    debugger;
 12    if (req.url.match(/^\/node\//))
 13       proxy.proxyRequest(req, res, {
debug> repl
Press Ctrl + C to leave debug repl
> req.url
'/node/174'
debug>
The backtrace command is
helpful for printing a backtrace (a list of
currently active function calls) of the current execution frame:
debug> backtrace
#0 app2.js:22:1
#1 exports.createServer.handler node-http-proxy.js:174:39
Anytime you want to see which commands are available to you, type
help:
debug> help
Commands: run (r), cont (c), next (n), step (s), out (o), backtrace (bt),
setBreakpoint (sb), clearBreakpoint (cb), watch, unwatch, watchers, repl, restart,
kill, list, scripts, breakpoints, version
The built-in debugger is very helpful, but sometimes you want a
little bit more. You have other options, including accessing the V8
debugger directly by using the --debug command-line flag:
node --debug app.js
This starts up a TCP connection to the debugger, and you enter the V8 debug commands at the prompt. This is an interesting option, but does require a great deal of understanding of how the V8 debugger works (and what the commands are).
Another option is to use debugging via a WebKit browser—through an application such as Node Inspector, covered next.
Client-Side Debugging with Node Inspector
Node Inspector requires a little more setup to begin debugging, but the extra effort is worth it.
First, install Node Inspector globally using npm:
npm install -g node-inspector
To use the functionality, you’ll first need to start the application using the V8 debugger flag:
node --debug app.js
Then you’ll need to start the Node Inspector, in either the background or foreground:
node-inspector
When you start the application, you’ll get the following message:
node-inspector
   info  - socket.io started
visit http://0.0.0.0:8080/debug?port=5858 to start debugging
Using a WebKit-based browser (Safari or Chrome), access the debugging page. My example is running on my server, so I use the following URL:
| http://examples.burningbird.net:8080/debug?port=5858 |
In the browser, the client-side debugger (part of the developer toolset) opens, and stops at the first breakpoint. Now you can use the tools you’re probably already familiar with from your client-side JavaScript development efforts, such as stepping over a couple of lines of code and examining an object’s properties, as shown in Figure 14-1.
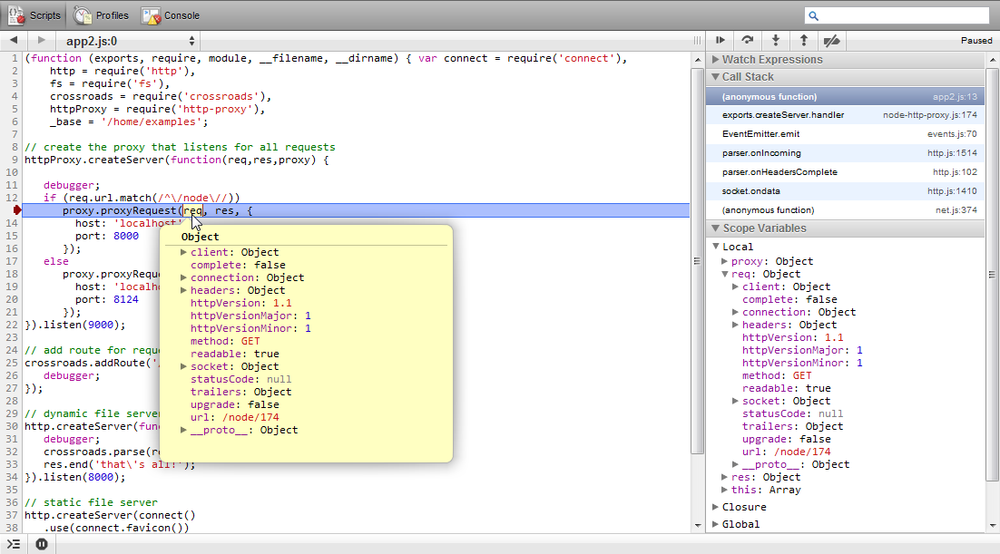
Node Inspector is, by far, a superior approach to debugging the server application. Using the command line is OK, but being able to see all the code at once, and to use a toolset we’re familiar with, more than compensates for the little extra effort necessary to enable the Node Inspector setup.
Unit Testing
Unit testing is a way of isolating specific components of an application for testing. Many of the tests that are provided in the tests subdirectory of Node modules are unit tests. The tests in the test subdirectory of the Node installation are all unit tests.
You can run a module’s test scripts using npm. In the module subdirectory, type:
npm test
This command runs a module test script if one is provided. When I ran the test script in the subdirectory for node-redis (covered in Chapter 9), the resulting output displayed successful test results, such as the portion displayed here:
Connected to 127.0.0.1:6379, Redis server version 2.4.11

Using reply parser hiredis
- flushdb: 1 ms
- multi_1: 3 ms
- multi_2: 9 ms
- multi_3: 2 ms
- multi_4: 1 ms
- multi_5: 0 ms
- multi_6: 7 ms
- eval_1:Skipping EVAL_1 because server version isn't new enough.
 0 ms
- watch_multi: 0 ms
Many of these unit tests are built using the Assert module, which we’ll go over next.
Unit Testing with Assert
Assertion tests evaluate expressions,
the end result of which is a value of either true or false. If you’re testing the return from a
function call, you might first test that the return is an array (first
assertion). If the array contents should be a certain length, you
perform a conditional test on the length (second assertion), and so on.
There’s one Node built-in module that facilitates this form of assertion
testing: Assert.
You include the Assert module in an application with the following:
var assert = require('assert');To see how to use Assert, let’s look at how existing modules use it. The following test is in the test.js script found with the node-redis installation:
    var name = "FLUSHDB";
    client.select(test_db_num, require_string("OK", name));
The test uses a function, require_string, which returns a function that
uses the Assert module methods assert.equal and
assert.stringEqual:
 function require_string(str, label) {
    return function (err, results) {
        assert.strictEqual(null, err, "result sent back unexpected error: " + err);
        assert.equal(str, results, label + " " + str + " does not match " + results);
        return true;
    };
}
The first test, assert.stringEqual,
fails if the err object returned in
the Redis test isn’t null. The second
test using assert.equal fails if
results are not equal to the expected string. Only if both tests are
successful (i.e., neither test fails) does the code fall through to the
return true statement.
What is actually tested is whether the Redis select command succeeds. If an error occurs,
the error is output. If the result of the selection isn’t what’s
expected (a return value of OK), a
message is output to that effect, including the test label where the
test failed.
The Node application also makes use of the Assert module in its
module unit tests. For instance, there’s a test application called
test-util.js that tests the
Utilities module. The following code is the section that tests the
isArray method:
// isArray
assert.equal(true, util.isArray([]));
assert.equal(true, util.isArray(Array()));
assert.equal(true, util.isArray(new Array()));
assert.equal(true, util.isArray(new Array(5)));
assert.equal(true, util.isArray(new Array('with', 'some', 'entries')));
assert.equal(true, util.isArray(context('Array')()));
assert.equal(false, util.isArray({}));
assert.equal(false, util.isArray({ push: function() {} }));
assert.equal(false, util.isArray(/regexp/));
assert.equal(false, util.isArray(new Error));
assert.equal(false, util.isArray(Object.create(Array.prototype)));
Both the assert.equal and the
assert.strictEqual
methods have two mandatory parameters: an expected response and an
expression that evaluates to a response. In the earlier Redis test, the
assert.strictEqual test
expects a result of null for the
err argument. If this expectation
fails, the test fails. In the assert.equal
isArray test in the Node source, if the expression evaluates
to true, and the expected response is
true, the assert.equal method succeeds and produces no
output—the result is silent.
If, however, the expression evaluates to a response other than
what’s expected, the assert.equal
method responds with an exception. If I take the first statement in the
isArray test in the Node source and
modify it to:
assert.equal(false, util.isArray([]));
then the result is:
node.js:201
        throw e; // process.nextTick error, or 'error' event on first tick
              ^
AssertionError: false == true
    at Object.<anonymous> (/home/examples/public_html/node/chap14/testassert.js:5:8)
    at Module._compile (module.js:441:26)
    at Object..js (module.js:459:10)
    at Module.load (module.js:348:31)
    at Function._load (module.js:308:12)
    at Array.0 (module.js:479:10)
    at EventEmitter._tickCallback (node.js:192:40)
The assert.equal and assert.strictEqual
methods also have a third optional parameter, a message that’s displayed
rather than the default in case of a failure:
assert.equal(false, util.isArray([]), 'Test 1Ab failed');
This can be a useful way of identifying exactly which test failed if you’re running several in a test script. You can see the use of a message (a label) in the node-redis test code:
assert.equal(str, results, label + " " + str + " does not match " + results);
The message is what’s displayed when you catch the exception and print out the message.
The following Assert module methods all take the same three parameters, though how the test value and expression relate to each other varies, as the name of the test implies:
assert.equalFails if the expression results and given value are not equal
assert.strictEqualFails if the expression results and given value are not strictly equal
assert.notEqualFails if the expression results and given value are equal
assert.notStrictEqualFails if the expression results and given value are strictly equal
assert.deepEqualFails if the expression results and given value are not equal
assert.notDeepEqualFails if the expression results and given value are equal
The latter two methods, assert.deepEqual and
assert.notDeepEqual,
work with complex objects, such as arrays or objects. The following
succeeds with assert.deepEqual:
assert.deepEqual([1,2,3],[1,2,3]);
but would not succeed with assert.equal.
The remaining assert methods
take differing parameters. Calling assert as a method, passing in a value and a
message, is equivalent to calling assert.isEqual, passing
in true as the first parameter, an
expression, and a message. The following:
var val = 3;
assert(val == 3, 'Equal');
is equivalent to:
assert.equal(true, val == 3, 'Equal');
Another variation of the exact same method is assert.ok:
assert.ok(val == 3, 'Equal');
The assert.fail method
throws an exception. It takes four parameters: a value, an expression, a
message, and an operator, which is used to separate the value and
expression in the message when an exception is thrown. In the following
code snippet:
try {
  var val = 3;
  assert.fail(3, 4, 'Fails Not Equal', '==');
} catch(e) {
  console.log(e);
}
the console message is:
{ name: 'AssertionError',
  message: 'Fails Not Equal',
  actual: 3,
  expected: 4,
  operator: '==' }
The assert.ifError function
takes a value and throws an exception only if the value resolves to
anything but false. As the Node
documentation states, it’s a good test for the error object as the first
argument in a callback function:
assert.ifError(err); //throws only if true value
The last assert methods are
assert.throws and assert.doesNotThrow. The first expects an
exception to get thrown; the second doesn’t. Both methods take a code
block as the first required parameter, and an optional error and message
as the second and third parameters. The error object can be a
constructor, regular expression, or validation function. In the
following code snippet, the error message is printed out because the
error regular expression as the second parameter doesn’t match the error
message:
assert.throws(
  function() {
    throw new Error("Wrong value");
  },
  /something/
  )
} catch(e) {
  console.log(e.message);
}
You can create sophisticated tests using the Assert module. The one major limitation with the module, though, is the fact that you have to do a lot of wrapping of the tests so that the entire testing script doesn’t fail if one test fails. That’s where using a higher-level unit testing framework, such as Nodeunit (discussed next), comes in handy.
Unit Testing with Nodeunit
Nodeunit provides a way to script several tests. Once scripted, each test is run serially, and the results are reported in a coordinated fashion. To use Nodeunit, you’re going to want to install it globally with npm:
npm install nodeunit -g
Nodeunit provides a way to easily run a series of tests without
having to wrap everything in try/catch blocks. It supports all of the
Assert module tests, and provides a couple of methods of its own in
order to control the tests. Tests are organized as test cases, each of
which is exported as an object method in the test script. Each test case
gets a control object, typically named test. The first method call in the test case
is to the test element’s expect method, to tell
Nodeunit how many tests to expect in the test case. The last method call
in the test case is to the test
element’s done method, to tell
Nodeunit the test case is finished. Everything in between composes the
actual test unit:
module.exports = {
   'Test 1' : function(test) {
      test.expect(3); // three tests
      ... // the tests
      test.done();
   },
   'Test 2' : function (test) {
      test.expect(1); // only one test
      ... // the test
      test.done();
   }
};
To run the tests, type nodeunit, followed by the name of the test
script:
nodeunit thetest.jsExample 14-1 has a
small but complete testing script with six assertions (tests). It
consists of two test units, labeled Test
1 and Test 2. The first
test unit runs four separate tests, while the second test unit runs two.
The expect method call
reflects the number of tests being run in the unit.
var util = require('util');

module.exports = {
    'Test 1' : function(test) {
        test.expect(4);
        test.equal(true, util.isArray([]));
        test.equal(true, util.isArray(new Array(3)));
        test.equal(true, util.isArray([1,2,3]));
        test.notEqual(true, (1 > 2));
        test.done();
    },
    'Test 2' : function(test) {
        test.expect(2);
        test.deepEqual([1,2,3], [1,2,3]);
        test.ok('str' === 'str', 'equal');
        test.done();
    }
};
The result of running the Example 14-1 test script with Nodeunit is:
example1.js
✔ Test 1
✔ Test 2

OK: 6 assertions (3ms)
Symbols in front of the tests indicate success or failure: a check for success, and an x for failure. None of the tests in this script fails, so there’s no error script or stack trace output.
Other Testing Frameworks
In addition to Nodeunit, covered in the preceding section, there are several other testing frameworks available for Node developers. Some of the tools are simpler to use than others, and each has its own advantages and disadvantages. Next, I’ll briefly cover three frameworks: Mocha, Jasmine, and Vows.
Mocha
npm install mocha -g
Mocha is considered the successor to another popular testing framework, Espresso.
Mocha works in both browsers and Node applications. It allows
for asynchronous testing via the done function, though the function can be
omitted for synchronous testing. Mocha can be used with any assertion
library.
The following is an example of a Mocha test, which makes use of the should.js assertion library:
should = require('should')
describe('MyTest', function() {
  describe('First', function() {
    it('sample test', function() {
      "Hello".should.equal("Hello");
    });
  });
});
You need to install the should.js library before running the test:
npm install should
Then run the test with the following command line:
mocha testcase.js
✔ 1 test complete (2ms)
Jasmine
Jasmine is a behavior-driven development (BDD) framework that can be used with many different technologies, including Node with the node-jasmine module. The node-jasmine module can be installed with npm:
npm install jasmine-node -g
Note
Note the module name: jasmine-node, rather than the format of
node-modulename (or the shortened form,
modulename) that you’ve seen so far in
the book.
The jasmine-node GitHub repository includes examples in the
specs subdirectory. As with most
other testing frameworks, the Jasmine Node module also accepts a
done function as a callback in order to
allow asynchronous testing.
There are some environmental requirements to using jasmine-node. First, the tests must be in a specs subdirectory. The jasmine-node module is a command-line application, and you’ll be able to specify the root directory, but it does expect the tests to be in specs.
Next, the tests must be named in a specific format. If the test is written in JavaScript, the test filename must end in .spec.js. If the test is written in CoffeeScript, the name of the file must end in .spec.coffee. You can use subdirectories in the specs directory. When you run jasmine-node, it runs all tests in all directories.
To demonstrate, I created a simple test script that uses Zombie (discussed later) to make a request against a web server and access the page contents. I named the file tst.spec.js and placed it in the specs directory in my development environment:
var zombie = require('zombie');

describe('jasmine-node', function(){

    it("should respond with Hello, World!", function(done) {
      zombie.visit("http://examples.burningbird.net:8124",
                                           function(error, browser, status){
        expect(browser.text()).toEqual("Hello, World!\n");
        done();
      });
    });
});
The web server is from Chapter 1, and all it does is return the “Hello, World!” message. Note the use of the newline character—the test will fail if you don’t include it.
I ran the test with the following command line:
jasmine-node --test-dir /home/examples/public_html/node
The result was the following output:
Finished in 0.133 seconds
1 test, 1 assertion, 0 failures
A successful test.
Warning
Jasmine uses path.existsSync, which is deprecated in
favor of js.existsSync in Node
0.8. Again, hopefully a fix will be in soon.
If the script had been in CoffeeScript, I would have added the
--coffee parameter:
jasmine-node --test-dir /home/examples/public_html/node --coffee
Vows
Vows is another BDD testing framework, and has one advantage over others: more comprehensive documentation. Testing is composed of testing suites, themselves made up of batches of sequentially executed tests. A batch consists of one or more contexts, executed in parallel, and each consisting of a topic, which is when we finally get to the executable code. The test within the code is known as a vow. Where Vows prides itself on being different from the other testing frameworks is by providing a clear separation between that which is being tested (topic) and the test (vow).
I know those are some strange uses of familiar words, so let’s look at a simple example to get a better idea of how a Vows test works. First, though, we have to install Vows:
npm install vows
To try out Vows, I’m using the simple circle module I created earlier in the book, now edited to set precision:
var PI = Math.PI;

exports.area = function (r) {
  return (PI * r * r).toFixed(4);
};

exports.circumference = function (r) {
  return (2 * PI * r).toFixed(4);
};
I needed to change the precision on the result because I’m going to be doing an equality assertion test on the results in the Vows application.
In the Vows test application, the circle object is the topic, and the area and circumference methods are the vows. Both are encapsulated as a Vows context. The suite is the overall test application, and the batch is the test instance (circle and two methods). Example 14-2 shows the entire test.
var vows = require('vows'),
    assert = require('assert');

var circle = require('./circle');

var suite = vows.describe('Test Circle');

suite.addBatch({
    'An instance of Circle': {
        topic: circle,
        'should be able to calculate circumference': function (topic) {
            assert.equal (topic.circumference(3.0), 18.8496);
        },
        'should be able to calculate area': function(topic) {
            assert.equal (topic.area(3.0), 28.2743);
        }
    }
}).run();
Running the application with Node runs the test because of the
addition of the run method at the
end of the addBatch method:
node example2.js
The results should be two successful tests:
·· ✓ OK » 2 honored (0.003s)
The topic is always an asynchronous function or a value. Instead
of using circle as the topic, I
could have directly referenced the object methods as topics—with a
little help from function closures:
var vows = require('vows'),
    assert = require('assert');

var circle = require('./circle');

var suite = vows.describe('Test Circle');

suite.addBatch({
    'Testing Circle Circumference': {
        topic: function() { return circle.circumference;},
        'should be able to calculate circumference': function (topic) {
            assert.equal (topic(3.0), 18.8496);
        },
    },
    'Testing Circle Area': {
        topic: function() { return circle.area;},
        'should be able to calculate area': function(topic) {
            assert.equal (topic(3.0), 28.2743);
        }
    }
}).run();
In this version of the example, each context is the object given
a title: Testing Circle
Circumference and Testing Circle
Area. Within each context, there’s one topic and one
vow.
You can incorporate multiple batches, each with multiple contexts, which can in turn have multiple topics and multiple vows.
Acceptance Testing
Acceptance testing differs from unit testing in that the former’s primary purpose is to determine if the application meets user requirements. Unit tests ensure that the application is robust, while acceptance tests ensure that the application is useful.
Acceptance testing can be accomplished through the use of predefined scripts that users actually design and implement in a coordinated setting. Acceptance testing can also be automated—again through the use of scripts, but scripts that are implemented by tools rather than people. These tools don’t completely satisfy all aspects of acceptance testing because they can’t measure subjective perspectives (“This web page form is awkward to use”), nor can they pinpoint those difficult-to-find bugs that users always seem to drive out, but they can make sure program requirements are met.
Selenium Testing with Soda
If you want a higher level of sophistication in your testing, using actual browsers rather than emulators, and you’re willing to pay for a subscription to a testing service, then you might want to check out Selenium, Sauce Labs, and the Node module Soda.
Selenium emerged out of a desire to automate testing tools. It consists of a core library, a Selenium remote control (RC), and a Selenium integrated development environment (IDE). The Selenium IDE is a Firefox plug-in, while the RC is a Java .jar file. The first version of Selenium (Selenium 1) is based in JavaScript, which was also one of the problems with the tool suite: whatever limitations JavaScript had, Selenium shared. Another effort to provide an automated test suite is WebDriver, a project that came about because of an interest in working around Selenium’s limitations. Work is currently under way for Selenium 2 (Selenium WebDriver), which is a merge of Selenium 1 and WebDriver.
Sauce Labs provides a host for Selenium 1 testing. It offers a way of testing your application with various web browsers in various environments, such as Opera on Linux, or IE9 on Windows 7. It does have two major limitations: no Mac OS X support, and no mobile test environment. However, it is a way of testing an application with multiple versions of browsers, such as IE, which is difficult (if not impossible) if you have only one machine.
Sauce Labs provides various subscription plans, including a basic, free subscription plan for trying out the service. The basic plan allows for two concurrent users, and provides 200 OnDemand minutes a month and 45 Scout minutes a month—more than sufficient for a developer trying things out. The site is geared toward Ruby developers, but there is a Node module, Soda, that you can use.
Soda provides a Node wrapper for Selenium testing. An example of using Soda, included in the module documentation, is the following:
var soda = require('soda');

var browser = soda.createClient({
    host: 'localhost'
  , port: 4444
  , url: 'http://www.google.com'
  , browser: 'firefox'
});

browser.on('command', function(cmd, args){
  console.log(' \x1b[33m%s\x1b[0m: %s', cmd, args.join(', '));
});

browser
  .chain
  .session()
  .open('/')
  .type('q', 'Hello World')
  .end(function(err){
    browser.testComplete(function() {
      console.log('done');
      if(err) throw err;
    });
  });
The code is actually quite intuitive. First, you create a browser
object, specifying which browser to open, the name of the host and port,
and what website is being accessed. Start a new browser session, load a
web page ('/'), and type a phrase
into an input field with a given identifier of q. When finished, print done to the console.log, and throw any error that
occurs.
To run a Soda application, you’ll need to ensure that Java is installed. Then, copy the Selenium RC Java .jar file to your system and run it:
java -jar selenium.jar
The application expects Firefox to be installed, since this is the browser specified in the application. While I didn’t have it on my Linux box, I did on my Windows laptop and was able to easily get the application running. It’s rather fascinating but a little disconcerting to see windows pop up and suddenly disappear as the Selenium RC does its thing.
Another approach is to use Sauce Labs as a remote testing environment, specifying which browser to use for a given test. You’ll need to create an account first, and then find your account username and application programming interface (API) key. The username is displayed in the top toolbar, and you can find the API key under the Account tab, after clicking the “View my API Key” link. This is also where you can track your remaining OnDemand and Scout minutes (the testing applications we’re creating use OnDemand minutes).
To try the remote testing out, I created a simple test for a login
form that we’ll build in Chapter 15. The
login form has two text fields and two buttons. The text field values
are username and password, and one of the buttons has a value
of Submit. The test script is testing
failure, not success, so the testing script (scenario) would be:
Access web application (http://examples.burningbird.net:3000).
Open login (/login).
Type
Sallyinto the username field.Type
badpasswordinto the password field.The page should display “Invalid Password.”
These are the steps encoded into Example 14-3.
var soda = require('soda');

var browser = soda.createSauceClient({
    'url': 'http://examples.burningbird.net:3000/'
  , 'username': 'your username'
  , 'access-key': 'your access key'
  , 'os': 'Linux'
  , 'browser': 'firefox'
  , 'browser-version': '3.'
  , 'max-duration': 300 // 5 minutes
});

// Log commands as they are fired
browser.on('command', function(cmd, args){
  console.log(' \x1b[33m%s\x1b[0m: %s', cmd, args.join(', '));
});

browser
  .chain
  .session()
  .setTimeout(8000)
  .open('/login')
  .waitForPageToLoad(5000)
  .type('username', 'Sally')
  .type('password', 'badpassword')
  .clickAndWait('//input[@value="Submit"]')
  .assertTextPresent('Invalid password')
  .end(function(err){
    browser.setContext('sauce:job-info={"passed": ' + (err === null) + '}', function(){
      browser.testComplete(function(){
        console.log(browser.jobUrl);
        console.log(browser.videoUrl);
        console.log(browser.logUrl);
        if (err) throw err;
      });
    });
  });
In the test application, a browser object is created with a given
browser, browser version, and operating system—in this case, Firefox 3.x
on Linux. Note also the different browser client: soda.createSauceClient, not soda.createClient. In the browser object, I’m
restricting testing time to no more than five minutes; the site accessed
is http://examples.burningbird.net:3000; and we’ve
just covered where to get the username and API key.
As each command is issued, it’s logged. We want to have a log so we can check responses and look for failures and abnormalities:
// Log commands as they are fired
browser.on('command', function(cmd, args){
  console.log(' \x1b[33m%s\x1b[0m: %s', cmd, args.join(', '));
});
Last is the actual test. Typically, the tests would have to be
nested callbacks (since this is an asynchronous environment), but Soda
provides a chain
getter that greatly simplifies adding tasks. The
very first task is to start a new session, and then each separate item
in the testing script is encoded. In the end, the application prints out
the URLs for the job, log, and video of the test.
The output from running the application is:
setTimeout: 8000
open: /login
waitForPageToLoad: 5000
type: username, Sally
type: password, badpassword
clickAndWait: //input[@value="Submit"]
assertTextPresent: Invalid password
setContext: sauce:job-info={"passed": true}
testComplete:
https://saucelabs.com/jobs/d709199180674dc68ec6338f8b86f5d6
https://saucelabs.com/rest/shelleyjust/jobs/d709199180674dc68ec6338f8b86f5d6/
results/video.flv
https://saucelabs.com/rest/shelleyjust/jobs/d709199180674dc68ec6338f8b86f5d6/
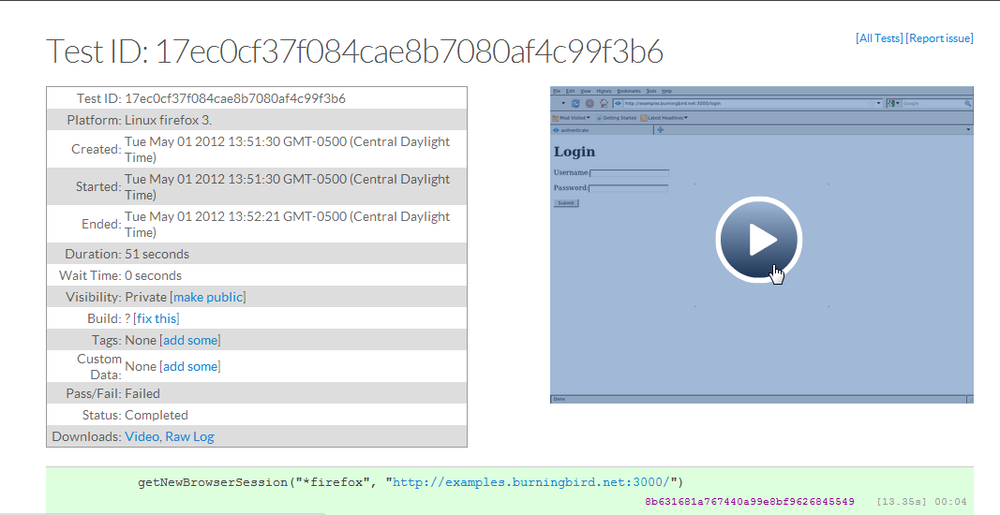
results/selenium-server.logYou can access the results directly, or you can log into Sauce Labs and see the results of all your tests, as shown in Figure 14-2.
As mentioned earlier, Soda is a Selenium wrapper, so there’s little documentation of the Selenium commands in the module. You’ll need to find these at the Selenium website and extrapolate how they’d work with Soda.
Note
Access the Selenium website at http://seleniumhq.org/.
Emulating a Browser with Tobi and Zombie
Rather than using any specific browser, you can do acceptance testing with Node modules that emulate a browser. Both Tobi and Zombie provide this capability. The primary advantage to these modules is that you can run the applications in an environment that doesn’t have a browser installed. In this section, I’ll briefly demonstrate how you can use Zombie for acceptance testing.
First, install Zombie using npm:
npm install zombie
Zombie resembles Soda in that you create a browser and then run tests that emulate the actions of a user at a browser. It even supports chained methods to circumvent the issues with nested callbacks.
I converted the test case against the login form in Example 14-3 to Zombie, except this time the test uses the proper password and tests for success rather than failure (the user is redirected to the /admin page). Example 14-4 has the code for this acceptance test.
var Browser = require('zombie');
var assert = require('assert');

var browser = new Browser();

browser.visit('http://examples.burningbird.net:3000/login', function() {
   browser.
   fill('username', 'Sally').
   fill('password', 'apple').
   pressButton('Submit', function() {
      assert.equal(browser.location.pathname, '/admin');
  });
});
The test is silent, since the assert at the end is successful—the browser
location is /admin, which is the page that
should open if the login works, signaling a successful test.
Performance Testing: Benchmarks and Load Tests
A robust application that meets all the user’s needs is going to have a short life if its performance is atrocious. We need the ability to performance test our Node applications, especially when we make tweaks as part of the process to improve performance. We can’t just tweak the application, put it out for production use, and let our users drive out performance issues.
Performance testing consists of benchmark testing and load testing. Benchmark testing, also known as comparison testing, is running multiple versions or variations of an application and then determining which is better. It’s an effective tool to use when you’re tweaking an application to improve its efficiency and scalability. You create a standardized test, run it against the variations, and then analyze the results.
Load testing, on the other hand, is basically stress testing your application. You’re trying to see at what point your application begins to fail or bog down because of too many demands on resources, or too many concurrent users. You basically want to drive the application until it fails. Failure is a success with load testing.
There are existing tools that handle both kinds of performance testing, and a popular one is ApacheBench. It’s popular because it’s available by default on any server where Apache is installed—and few servers don’t have Apache installed. It’s also an easy-to-use, powerful little testing tool. When I was trying to determine whether it’s better to create a static database connection for reuse or to create a connection and discard it with each use, I used ApacheBench to run tests.
ApacheBench works against web applications, which means you provide a URL rather than an application name. If we prefer a Node solution, or an application that can run applications (not just query websites), there’s another combination command-line tool/module: Nodeload. Nodeload can interact with a stats module, output graphics of results, and provide real-time monitoring. It also supports distributed load testing.
Note
In the next couple of sections, the test applications are working with Redis, so if you haven’t read Chapter 9, you may want to do that now.
Benchmark Testing with ApacheBench
ApacheBench is commonly called ab, and I’ll use that name from this point forward. ab is a command-line tool that allows us to specify the number of times an application is run, and by how many concurrent users. If we want to emulate 20 concurrent users accessing a web application a total of 100 times, we’d use a command like the following:
ab -n 100 -c 20 http://somewebsite.com/It’s important to provide the final slash, as ab expects a full URL, including path.
ab provides a rather rich output of information. An example is the following output (excluding the tool identification) from one test:
Concurrency Level:      10
Time taken for tests:   20.769 seconds
Complete requests:      15000
Failed requests:        0
Write errors:           0
Total transferred:      915000 bytes
HTML transferred:       345000 bytes
Requests per second:    722.22 [#/sec] (mean)
Time per request:       13.846 [ms] (mean)
Time per request:       1.385 [ms] (mean, across all concurrent requests)
Transfer rate:          43.02 [Kbytes/sec] received

Connection Times (ms)
              min  mean[+/-sd] median   max
Connect:        0    0   0.1      0       4
Processing:     1   14  15.7     12     283
Waiting:        1   14  15.7     12     283
Total:          1   14  15.7     12     283

Percentage of the requests served within a certain time (ms)
  50%     12
  66%     14
  75%     15
  80%     16
  90%     18
  95%     20
  98%     24
  99%     40
 100%    283 (longest request)
The test ran 15,000 times, with 10 concurrent users.
The lines we’re most interested in (in bold text) are those having to do with how long each test took, and the cumulative distribution at the end of the test (based on percentages). According to this output, the average time per request (the first value with this label) is 13.846 milliseconds. This is how long the average user could expect to wait for a response. The second line has to do with throughput, and is probably not as useful as the first.
The cumulative distribution provides a good look into the percentage of requests handled within a certain time frame. Again, this indicates what we can expect for an average user: response times between 12 and 283 milliseconds, with the vast majority of responses handled in 20 milliseconds or less.
The last value we’re looking at is the requests per second—in this case, 722.22. This value can somewhat predict how well the application will scale, because it gives us an idea of the maximum requests per second—that is, the upper boundaries of application access. However, you’ll need to run the test at different times, and under different ancillary loads, especially if you’re running the test on a system that serves other uses.
The application tested consists of a web server listening for requests. Each request triggers a query to a Redis data store. The application creates a persistent connection to the Redis data store that it maintains throughout the lifetime of the Node application. The test application is shown in Example 14-5.
var redis = require("redis"),
    http = require('http');

// create Redis client
var client = redis.createClient();

client.on('error', function (err) {
    console.log('Error ' + err);
});

// set database to 1
client.select(1);

var scoreServer = http.createServer();

// listen for incoming request
scoreServer.on('request', function (req, res) {

  console.time('test');

  req.addListener("end", function() {

     var obj = {
          member : 2366,
          game : 'debiggame',
          first_name : 'Sally',
          last_name : 'Smith',
          email : 'sally@smith.com',
          score : 50000 };

     // add or overwrite score
     client.hset(obj.member, "game", obj.game, redis.print);
     client.hset(obj.member, "first_name", obj.first_name, redis.print);
     client.hset(obj.member, "last_name", obj.last_name, redis.print);
     client.hset(obj.member, "email", obj.email, redis.print);
     client.hset(obj.member, "score", obj.score, redis.print);

     client.hvals(obj.member, function (err, replies) {
        if (err) {
           return console.error("error response - " + err);
        }

        console.log(replies.length + " replies:");
        replies.forEach(function (reply, i) {
          console.log("    " + i + ": " + reply);
        });
     });

     res.end(obj.member + ' set score of ' + obj.score);
     console.timeEnd('test');
   });
});

scoreServer.listen(8124);

// HTTP server closes, close client connection
scoreServer.on('close', function() {
   client.quit();
});

console.log('listening on 8124');
I was curious about performance if I changed one parameter in the application: from maintaining a persistent connection to Redis to grabbing a connection when the web service was accessed, and releasing it as soon as the request was finished. That led to the second version of the application, shown in Example 14-6. The changes from the first are in bold text.
var redis = require("redis"),
    http = require('http');

var scoreServer = http.createServer();

// listen for incoming request
scoreServer.on('request', function (req, res) {

  console.time('test');

  // create Redis client
  var client = redis.createClient();

  client.on('error', function (err) {
    console.log('Error ' + err);
  });

  // set database to 1
  client.select(1);

  req.addListener("end", function() {

     var obj = {
         member : 2366,
         game : 'debiggame',
         first_name : 'Sally',
         last_name : 'Smith',
         email : 'sally@smith.com',
         score : 50000 };

     // add or overwrite score
     client.hset(obj.member, "game", obj.game, redis.print);
     client.hset(obj.member, "first_name", obj.first_name, redis.print);
     client.hset(obj.member, "last_name", obj.last_name, redis.print);
     client.hset(obj.member, "email", obj.email, redis.print);
     client.hset(obj.member, "score", obj.score, redis.print);

     client.hvals(obj.member, function (err, replies) {
        if (err) {
           return console.error("error response - " + err);
        }

        console.log(replies.length + " replies:");
        replies.forEach(function (reply, i) {
          console.log("    " + i + ": " + reply);
        });
     });

     res.end(obj.member + ' set score of ' + obj.score);
     client.quit();
     console.timeEnd('test');
   });
});

scoreServer.listen(8124);

console.log('listening on 8124');
I ran the ab test against this second application, and the relevant test results are as follows:
Requests per second:    515.40 [#/sec] (mean)
Time per request:       19.402 [ms] (mean)
...
Percentage of the requests served within a certain time (ms)
  50%     18
  66%     20
  75%     21
  80%     22
  90%     24
  95%     27
  98%     33
  99%     40
 100%    341 (longest request)
The tests give us a fairly good indication that maintaining a persistent connection enhances performance. This is further borne out, in rather dramatic fashion, with a second test.
When I ran the test 100,000 times, with 1,000 concurrent users, the Node application that maintained a persistent connection to Redis finished the test, while the other option actually failed; too many concurrent users backed up at Redis, and it started rejecting connections. Exactly 67,985 tests completed before the application went toes up.
Load Testing with Nodeload
Nodeload provides a command-line tool that performs the same type of testing as ab, but with the addition of some nice graphics of the results. It also provides a module you can use to develop your own performance testing applications.
Warning
Another application also goes by the name Nodeload, and is responsible for building and delivering Git repositories as .zip files. To ensure that you’re accessing the correct Nodeload, install it with the following:
npm install nodeload -g
When Nodeload is installed globally, you can access the command-line version (nl.js) of the module application anywhere. The command-line arguments it takes are similar to what we’ve used with ab:
nl.js -c 10 -n 10000 -i 2 http://examples.burningbird.net:8124
The application accesses the website 10,000 times,
emulating 10 concurrent users. The -i
flag alters how frequently the statistics are reported (every 2 seconds
rather than the default 10 seconds). Here is the complete set of
flags:
-n --numberNumber of requests to make
-c --concurrencyNumber of concurrent users
-t --time-limitTime limit for the test
-m --methodHTTP method to use
-d --dataData to send with
PUTorPOSTrequest-r --request-generatorPath to module for
getRequestfunction (if a custom one is provided)-q --quietSuppress display of progress
-h --helpHelp
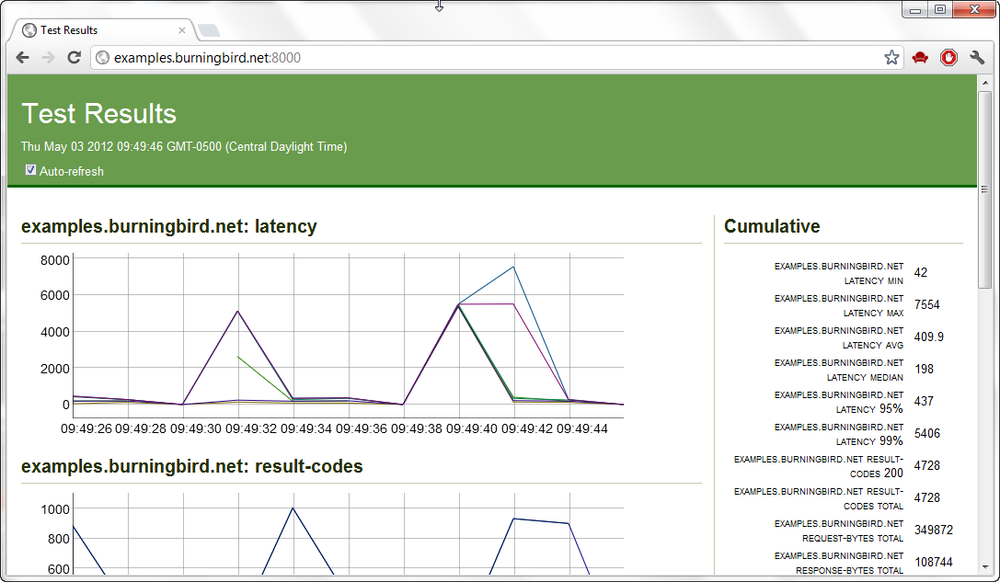
What’s fun about Nodeload is the live graphics that are displayed while the test is running. If you access port 8000 of the test server (http://localhost:8000 or via domain), you can see a graphic display of the results as they are happening. Figure 14-3 shows a snapshot of the display during one test.
The graphics file is also persisted for later access, as is a logfile of the test results. At the end of the test, summary results are given that are very close to ab in nature. An example of one output is the following:
Server:                                 examples.burningbird.net:8124
HTTP Method:                            GET
Document Path:                          /
Concurrency Level:                      100
Number of requests:                     10000
Body bytes transferred:                 969977
Elapsed time (s):                       19.59
Requests per second:                    510.41
Mean time per request (ms):             192.74
Time per request standard deviation:    47.75

Percentages of requests served within a certain time (ms)
  Min: 23
  Avg: 192.7
  50%: 191
  95%: 261
  99%: 372
  Max: 452
If you want to provide your own custom test, you can use the Nodeload module to develop a testing application. The module provides live monitoring, graphics capability, statistics, as well as distributed testing capability.
Refreshing Code with Nodemon
Before leaving this chapter, I want to introduce one more module: Nodemon. Though not technically related to either testing or debugging, it is a handy development tool.
First, install it with npm:
npm install nodemon
Nodemon wraps your application. Instead of using Node to start the application, use Nodemon:
nodemon app.js
Nodemon sits quietly monitoring the directory (and any contained directories) where you ran the application, checking for file changes. If it finds a change, it restarts the application so that it picks up the recent changes.
You can pass parameters to the application:
nodemon app.js param1 param2
You can also use the module with CoffeeScript:
nodemon someapp.coffee
If you want Nodemon to monitor some directory other than the current
one, use the --watch flag:
nodemon --watch dir1 --watch libs app.js
There are other flags, documented with the module. The module can be found at https://github.com/remy/nodemon/.
Note
Chapter 16 demonstrates how to use Nodemon with Forever, which restarts your application if it shuts down for some reason.