Table of Contents for
Network Security Through Data Analysis, 2nd Edition
 Network Security Through Data Analysis, 2nd Edition
Published by
O'Reilly Media, Inc., 2017
Network Security Through Data Analysis, 2nd Edition
Published by
O'Reilly Media, Inc., 2017
- Cover
- nav
- Praise for Network Security Through Data Analysis, Second Edition
- Network Security Through Data Analysis
- Network Security Through Data Analysis
- Preface
- I. Data
- 1. Organizing Data: Vantage, Domain, Action, and Validity
- 2. Vantage: Understanding Sensor Placement in Networks
- 3. Sensors in the Network Domain
- 4. Data in the Service Domain
- 5. Sensors in the Service Domain
- 6. Data and Sensors in the Host Domain
- 7. Data and Sensors in the Active Domain
- II. Tools
- 8. Getting Data in One Place
- 9. The SiLK Suite
- 10. Reference and Lookup: Tools for Figuring Out Who Someone Is
- III. Analytics
- 11. Exploratory Data Analysis and Visualization
- 12. On Analyzing Text
- 13. On Fumbling
- 14. On Volume and Time
- 15. On Graphs
- 16. On Insider Threat
- 17. On Threat Intelligence
- 18. Application Identification
- 19. On Network Mapping
- 20. On Working with Ops
- 21. Conclusions
- Index
- About the Author
- Colophon
Chapter 6. Data and Sensors in the Host Domain
This chapter is concerned with the practical problem of collecting data from a host. The host domain refers to any information that can be collected on the host without the moderation of a service; this includes information about the processes running on the host, the host’s filesystem, its configuration, and to some extent information that overlaps the network and service domains.
Given the complexity of hosts, and the varieties of operating systems and configurations available, it is not possible to address all the information that can be collected from hosts in a single book, let alone a chapter. Rather, the network analyst needs a focused approach to determine what information is required to supplement the network data. For our purposes, this focused approach is comprised of four questions:
-
What hardware is behind this IP address?
-
How is it messing up my network?
-
Who owns this hardware?
-
Who do I yell at about it?
This chapter is predicated around figuring out how to answer those questions. Unfortunately, this requires navigating a maze of complicated and proprietary configuration data. Compared to service and network domain data, host domain data is all over the place. Windows and Unix systems have radically different ideas of where to keep this information, and even individual Unix variants can keep the same information in very different locations.
Note that host collection is intimately tied up with host configuration and inventory. The wider the variety of hosts you manage, the larger the number of different configurations that exist, the more legacy systems you have, the harder the problem of data collection will be. Automated provisioning and management, especially if you’re navigating over to a cloud-based infrastructure, will save you an enormous amount of pain and effort. Host data collection is a last-mile problem in network security.
In order to address this problem, I have broken hosts into a collection of relevant data buckets. Figure 6-1 shows how these buckets are interrelated, and how we will link them together to answer questions. The remainder of this structure is broken into the major data domains discussed previously.
A Host: From the Network’s View
Figure 6-1 shows a representation of the data I consider useful when talking about a host. Throughout this chapter, I will refer to elements of this abstraction as buckets of useful data—the information that I feel is most useful for security analysis that can be extracted from this abstraction. In the following chapter, I will discuss a portfolio of utilities that can extract this information from a host.
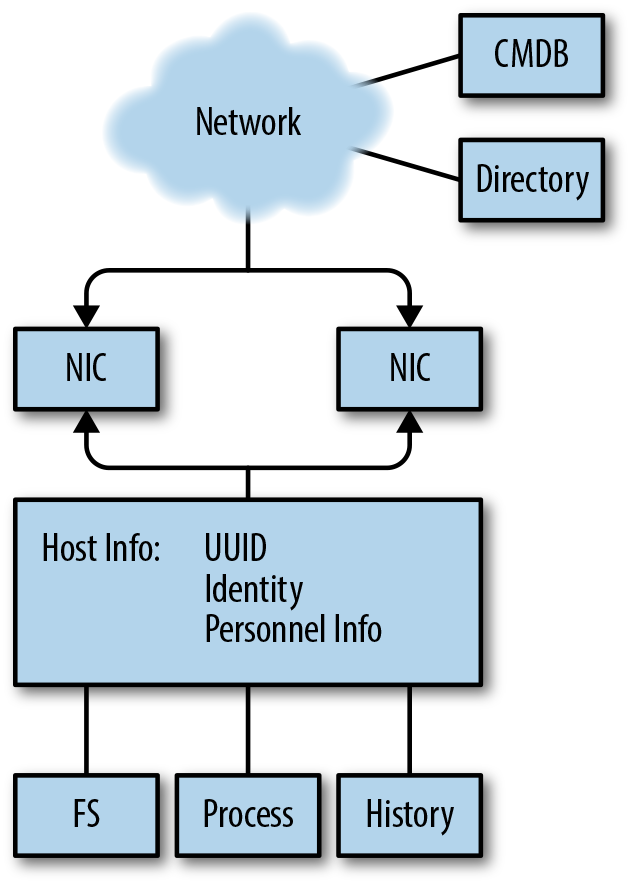
Figure 6-1. Host domain data
As Figure 6-1 shows, the host, in abstract, is composed of several discrete elements:
- Network interfaces
-
The host communicates with the network through one or more network interfaces. Modern hosts will have multiple interfaces, making them effectively mini-routers: laptops have WiFi and wired interfaces, mobile devices will have cellular radios and WiFi available.
- Host
-
For our purposes, the host information refers to any unique identifiers you have for the host. This includes tags such as UUIDs, inventory management, users who actively touch the host, etc.—any information that will help you identify who is responsible for the host and what the host has done over time.
- Filesystem
-
The files that make up the host. This is a list of all the files and their locations in the filesystem, as well as potential indicators of tampering such as access times, ownership, and hashes of file contents.
- Process
-
The processes that are running on the host. This includes the host processes’ IDs, their parent process IDs running back to the startup process, the ownership of the processes, and the processes’ current state.
- History
-
The history of a host is a log of all the commands that have been executed by a host: the start time of every process, the end time, the command-line parameters, and every command at the shell prompt.
The breakdown in Figure 6-1 is intended to model how a network analyst will generally progress through a host. As network security people, we generally begin with a network-based trigger—traffic. From the traffic, we attempt to get an identifier such as the IP address. From the IP address, we can associate the IP/port combination (hopefully) with a distinct process. From the process, we can figure out what is running on the port, which tells us where to look on disk and who is responsible. This information should all be available, on Unix systems, through common command-line tools.
The Network Interfaces
Hosts communicate with a network through one or more network interfaces (NIs). From the network’s vantage, an NI is a distinct set of addresses it forwards packets to—the physical device is invisible to the network. From a host’s vantage, the NI is a stream to which the host reads and writes information—the network addresses are an attribute of that stream.
Note that an NI does not have to be a device, and it may only exist as a process. Loopback addresses should not connect to the network, and most virtual machines will create a virtual interface to communicate with their host.
There are two core tools for checking network processes on a host:
ifconfig and netstat. ifconfig provides information on the
interfaces, netstat on the currently used ports; there is a fair
amount of functional overlap between the two.
ifconfig, as the name implies, is actually a tool for configuring
network interfaces. ifconfig is old but omnipresent; most modern
Unixes provide their own configuration and setup tools, including ip
for Linux variants and networksetup on macOS. The advantage of
ifconfig is that it’s available on almost all Unix variants and will
provide you with an inventory of network interfaces and their
status. Note that on modern systems you can expect to have many
more interfaces than you have devices. Some of these are there for
basic networking support (e.g., the loopback interface), while others are
set up for specialized services (virtual machines have virtual
interfaces, VPNs will have their own). The standard output from
ifconfig is a block of network interface controller information, an example of which is shown
here:
en1: flags=8863 UP,BROADCAST,SMART,RUNNING,SIMPLEX,MULTICAST mtu 1500
  ether fe:1c:29:33:f0:00
  inet6 fe80::407:d8a1:7085:f803 en1 prefixlen 64 secured scopeid 0x5
  inet 192.168.1.13 netmask 0xffffff00 broadcast 192.168.1.255
  nd6 options=201 PERFORMNUD,DAD
  media: autoselect
  status: active
In this example, the first field is the interface’s name. Each unique active network interface on the system will have a unique name. Device names in Unix systems are heavily encoded with different information about the interface type. Table 6-1 provides a list of common interface names across different Unix flavors. Unfortunately, there is no real registry or central source for device names—it’s a matter of convention, and the same type of device can have radically different names even in different versions of the same operating system.
| Name | Description |
|---|---|
|
Generic Ethernet interface names |
|
New Ethernet names on Linux systems |
|
Wireless interfaces |
|
Loopback interface |
|
VPN interfaces |
ifconfig output will differ somewhat based on the version of the OS
you’re using. The preceding example is fairly standard for BSD variants
(such as the macOS terminal I cribbed it from). You can expect to see
variations that show packets transmitted and received, and different
address fields.
So, this brings up the other fields. Most of the information that
ifconfig dumps is addressing data—how the particular interface
connects to a network. This is where you can find the NIC addresses
(which you should be able to see from network vantage). In our
example, you can see that the interface has three addresses: a 48-bit MAC address (ether), an IPv6 address (inet6), and an IPv4
addresses (inet). The additional fields are
for neighbor discovery (part of IPv6), and a description of the
interface’s media (the type of device) and the current status
(whether or not it’s active).
Over time, ifconfig output tends to get messier—in a Unix system, interfaces are often
added, rarely deleted. Consequently, when you look
at a long-standing system, you’re likely to see multiple legacy
interfaces. Also, keep in mind that ifconfig is an interface on top
of the actual configuration system used by your Unix variant.
Whereas ifconfig is about what the interfaces are, netstat is what
about what the interfaces are doing. The best way to start with
netstat is with a per-interface dump, such as netstat -i:
$ netstat -i
Name  Mtu   Network       Address            Ipkts Ierrs    Opkts Oerrs  Coll
lo0   16384 <Link#1>                        166486     0   166486     0     0
lo0   16384 127           localhost         166486     -   166486     -     -
lo0   16384 localhost   ::1                 166486     -   166486     -     -
lo0   16384 localhost   fe80:1::1           166486     -   166486     -     -
en0   1500  <Link#4>    10:dd:b1:ab:cc:fb        0     0        0     0     0
As with ifconfig, outputs will be operating system–specific, but
the basic breakdown here illustrates what kind of information nestat will
generally dump.
As this example shows, there’s some overlap with the information from
ifconfig—each interface is listed by its separate addresses, and the
device name is present. In addition, this netstat implementation
shows traffic to the various interfaces—in this case incoming and
outgoing packets, as well as errors.
To find the status of individual sockets, use netstat -a. This
yields output like the following:
$ netstat -a
Proto Recv-Q Send-Q  Local Address          Foreign Address        (state)
tcp4       0      0  192.168.1.13.62856     iad30s08-in-f14..https ESTABLISHED
tcp4       0      0  192.168.1.13.62676     50.57.31.206.http      FIN_WAIT_2
tcp4       0      0  192.168.1.13.62461     cdn-208-111-161-.https FIN_WAIT_2
tcp4       0      0  192.168.1.13.62381     75.98.58.181.https     FIN_WAIT_2
The output from this -a dump is a list of active sockets; -a
should dump all active sockets, as opposed to just the ones associated with
the current user. The fields are the protocol (Proto) queue sizes
(bytes in the send and receive queues), the addresses, and the state.
Note that the foreign addresses are actually FQDNs—netstat
versions will automatically look up domain names and port numbers.
This behavior is, in my experience, largely useless—the process
takes time, and the port/service assignments are usually less useful
than the straight port numbers. Look for an option to avoid looking
up names (usually -n) and use that instead.
Note the (state) column. For TCP sockets, this column will
correspond to the state of the TCP state machine (see Figure 13-3
for further information). Of note for us are sockets in the LISTEN
state, which are waiting for connections from the
outside world. netstat output will wildcard IP addresses in the
output for servers, indicating that the socket will accept incoming
connections from anywhere:
$netstat -an | grep LISTEN
tcp4       0      0  *.8000                 *.*                    LISTEN
tcp6       0      0  *.53                   *.*                    LISTEN
tcp4       0      0  *.53                   *.*                    LISTEN
tcp4       0      0  *.445                  *.*                    LISTEN
tcp6       0      0  *.445                  *.*                    LISTEN
tcp4       0      0  127.0.0.1.8021         *.*                    LISTEN
The *.8000 here means that the TCP socket on port 8000 will
accept connections from any working interface pointing to the host—in this case that includes 127.0.0.1 (localhost) and 192.168.1.13 (the
address for the host). Conversely, the 127.0.0.1.8021 listener will
only accept connections through the localhost interface.
Note that UDP is stateless—if there is an open UDP port on your
system, it will be listed in the netstat output, but it won’t have a
value in the LISTEN column. A UDP listener, however, should list
. in the Foreign Address column.
Once you have a port, the next question is what process is running it
and who owns the process. Depending on your version of netstat,
there may be a -o or -p command that will provide this
information. Alternatively (as in macOS), you can find this information
using lsof -i; lsof is a command that lists open files, and
interfaces in Unix’s “everything is a file” philosophy, are files.
lsof -i lists open interfaces, providing information like in this
dump:
$ lsof -i | grep 8000
python2.7 51121 mcollins 3u IPv4 0x7c0d6f5bfcc7ff3b 0t0 TCP *:8000 (LISTEN)
The Host: Tracking Identity
The host itself refers to the process that ties network interfaces to disks, files, memory, and users. For the network analyst, the host is a handle all the other data hangs on. Practically speaking, what we really need when we refer to a “host” is a mechanism to distinguish hosts from each other. Since any serious enterprise network runs on top of an ocean of virtual images, old handles for identity such as MAC IDs have basically become useless. Instead, I think it’s preferable to grasp the nettle and deal straight with universally unique identifiers (UUIDs).
A UUID1 is a 128-bit integer intended to serve as a distinct and unique identifier for the host. UUIDs are an old idea, and there are consequently a number of different techniques for generating them. The intent of the UUID is to remain unique throughout the lifetime of a host, regardless of changes in the name, the IP address, or any other shift. Implementation of this uniqueness is a mechanical task, and different manufacturers address the problem differently.
RFC 4122 specifies five different UUID versions:
-
Version 1 combines the 48-bit MAC address, the time of creation (60 bits), and a 14-bit click sequence value. This version will generate similar UUIDs on the same host, and encodes the MAC address. Encoding the MAC address is, in my opinion, of limited value with multi-interface hosts.
-
Version 2 is intended to provide a more secure version of the Version 1 UUID, but in practice isn’t implemented. Most UUID generators will skip this version.
-
Versions 3 and 5 generate a UUID by hashing a namespace (examples include DNS, URLs, OID, and X.500) and a name. The intent is that the UUID should be consistent for hosts with the same name. Version 3 uses a truncated MD5, Version 5 uses a truncated SHA1.
-
Version 4 generates the UUID randomly.
The 128-bit UUID has structure, and you will often see UUIDs
(particularly Microsoft and Apple ones) provided in an
XXXXXXXX-XXXX-AXXX-BXXX-XXXXXXXXXXXX format, where each X is a
hexadecimal digit. This format follows the structure of the original
Version 1 UUID, although the separators are meaningless outside of
Version 1—with one notable exception. UUIDs encode their version
in the digits specified as A and B in this format. A is the
UUID version, and the high three bits of B are the variant of that
version. B should always be 8 or higher.
For Linux installations, the UUID is usually found in
/etc/machine_id/; BSD may use /etc/hostid, but you should check the
installation. UUIDs are generated on installation; an important
caveat when working with virtual images is that duplicates of the same image
will have the same UUID. macOS provides a hardware-generated UUID. You
can find it in the Hardware Overview panel of the System Information app,
or at the command line by invoking the system_profiler command; it’s
in the SPHardwareDataType field.
All of this is convention, and prone to operating system, platform, and designer fiat. For analysis, the point of the UUID is to provide you with a universal handle—a way of connecting other inventory information while things that might change (software configuration, domain name, versions) shift around you. However, unless the UUID is tied to other data sources, the UUID serves no purpose.
Which brings us to the other problem. What you really need is a way to tie all of this information into an inventory. What you really want is a way to go from network observable (e.g., IP address) to UUID to software profile. This type of information is generally best handled by a configuration management database (CMDB); even if all you have is a spreadsheet containing UUIDs, operating systems, and IP addresses, it will save you a lot of pain later on.
Processes
A host’s process information refers to the processes that are running on the host at sample time. As with most information in the host domain, process information is most useful for ascertaining damage done by changes to system state. If new processes appear, or standard processes (such as AV) stop running, that’s an indication of anomalous behavior. If a system is under DDoS attack, then processes will react to that.
Structure
On Unix and Windows systems (considering macOS to be a Unix variant), processes are organized in a tree descending from a root processes. Every process posseses a unique process ID (PID), a numeric ID identifying the process during the time of execution. PIDs are assigned sequentially, beginning with an ID of 0 (for the system idle process in Windows) or 1 (for most Unixes). Every process except the root process has a parent process ID (PPID), which is the PID of the process that spawned it. By using the PID/PPID relationships, you can plot out processes as a tree and trace each back to its origin at the root process.
On Unix systems, the basic application for checking process status is
ps. ps is a command-line utility that prints a list of current
processes controlled by the invoking user’s UID at the time of
invocation. This is, on any system, the smallest and least
interesting set of processes to look at.2
An example ps dump for a macOS system is shown here (formatted to fit the page):
$ ps -faxcel | head -10
  UID   PID  PPID   C STIME   TTY           TIME CMD
    0     1     0   0 16Feb17 ??        46:46.47 launchd
    0    51     1   0 16Feb17 ??         1:01.35 syslogd
    0    52     1   0 16Feb17 ??         2:18.75 UserEventAgent
    0    54     1   0 16Feb17 ??         0:56.90 uninstalld
    0    55     1   0 16Feb17 ??         0:08.61 kextd
    0    56     1   0 16Feb17 ??         2:04.08 fseventsd
   55    61     1   0 16Feb17 ??         0:03.61 appleeventsd
    0    62     1   0 16Feb17 ??         0:07.72 configd
    0    63     1   0 16Feb17 ??         0:17.60 powerd

        F PRI NI       SZ    RSS WCHAN     S             ADDR                  0
     4004  37  0  2537628  13372 -      Ss
     4004   4  0  2517212   1232 -      Ss                  0                  0
     4004  37  0  2547704  40188 -      Ss                  0
     4004  20  0  2506256   5256 -      Ss                  0
     4004  37  0  2546132  13244 -      Ss                  0
  1004004  50  0  2520544   6244 -      Ss                  0
     4004   4  0  2542188  11320 -      Ss                  0
     400c  37  0  2545392  13288 -      Ss                  0
     4004  37  0  2540644   8016 -      Ss
Table 6-2 summarizes the type of information that I generally find useful when monitoring processes.
| Name | Type | ps options | Notes |
|---|---|---|---|
PID |
Integer |
The process ID for a process |
|
PPID |
Integer |
|
The parent process ID of a process; i.e., the PID of the process that spawned it |
UID |
Integer |
|
The ID of the user who spawned the process |
Command |
String |
The name of the process |
|
Path |
String |
|
The path of the process’s executable |
Memory |
Integer(s) |
|
The memory used by the application |
CPU |
Numeric |
|
The amount of CPU consumed |
Terminal |
String |
|
The ID of the terminal the process is attached to |
Start Time |
Date |
|
The time the process was invoked |
Because the default ps invocation is so limited, you will invariably
invoke it with a number of switches. The major switches are listed in
Table 6-2, but be wary that ps options are
platform-specific. For that reason, I’ll talk about the provided
options in more depth, and the corresponding fields.
PID and PPID
The PID is the most basic identifier available for a process. Operating systems organize processes into a tree, with a root process spawning children, those children spawning children, and so on. Process IDs are assigned linearly, in increasing order, but will loop if you reach whatever the maximum PID is for the operating system. Consequently, it’s possible but rare that you’ll see a process with a PID lower than its parent process ID (PPID).
During bootup, systems spawn an enormous number of processes for I/O, disk management, and other housekeeping tasks. As a result of this, you can expect any system to run a number of long-lived processes in the lower ranks.
For the network security analyst, particular attention should be paid to network-facing processes (such as servers) and their spawn patterns. If a long-lived server process recently respawned, why did this happen? What are the children of network-facing processes? What processes are spawning command-line interfaces, shells, or other administrative tools?
UID
A process’s UID is the numeric ID assigned to the user owning the
process. Classically, Unix systems maintain this information in
/etc/passwd, and depending on configuration issues, it may still be
possible to find that information there. However, odds are that’s not
going to be less valuable on any modern system. If you’re running a
system using LDAP for management, you can find the UID using
ldapsearch; for macOS, it’s currently managed by id.
For the network security analyst, UID questions often involve going back to identifying the history of a particular user. Is this user expected to administer the process? (I prefer to see daemons run by dedicated, chrooted daemon accounts, not individual users.) Is the user new?
Command and path
The command and the path refer to the command-line options used to invoke the process, and the path to the process’s executable. This information is particularly critical for checking the links between a process, the filesystem, and the users.
For the network security analyst, command and path questions often involve checking to see if any unusual or unexpected commands have been called. Unusual commands may include evidence of an anomalous location for the command—if a command that is normally located in /usr/bin has been executed from a local directory, for example. It may also include evidence of a command that the user does not normally execute based on past command history. Particular attention should be paid to administrative and network commands—anything that can access a socket or reconfigure a host.
Memory, CPU, terminal, and start time
Memory and CPU refer to the amount of memory and CPU resources consumed by a process, respectively. Keeping track of this information can help an analyst identify whether the process is going berserk (e.g., due to trying to process a DDoS attack). The terminal information refers to what terminal a process is connected to, and the start time is when the process started.
Filesystem
File information refers to the files on disk, and includes the following information:
-
Path—the path to the file (i.e., the directory containing the file)
-
Filename—the name of the file
-
Creation time
-
Modification time
-
Size
-
Hash—an MD5 hash of the file’s contents
-
UID—the ID of the owner of the file
-
Permissions—the permissions on the file
Filesystem monitoring is usually about change notification, in particular whether protected system files have changed for no discernible reason (e.g., outside of system updates or, in some cases, ever).
Fallback for file comparisons: check the creation time, check the modification time, check the file size, check the permissions, check a hash. Hashing, in particular, is critical for working with threat intelligence, and given the diversity of indicators of compromise (IOC) information out there, you should expect to have a bunch of hashes on hand.
A hash is a mathematical function that converts data of arbitrary size into a fixed-length representation. This fixed-length representation is ideally much smaller—the ones we’ll talk about here are intended to reduce files from megabytes down to dozens of bytes.
There’s an extensive taxonomy of hashes with different attributes, so the cryptographic hashes we’re interested in here are just a subcategory with specific properties. In particular, these hashes show an “avalanche effect”: a small change in the data hashed results in a large change in the hash value. The point of using a secure hash, for filesystems, is to make tampering difficult—an attacker trying to alter a file without changing the hash will have to spend a lot of effort to do so undetectably.
The basic hash algorithms to know of are MD5, SHA-1, and SHA-256.
On most systems you’ll have command-line tools available to invoke
them. Almost all IOCs are going to use one of these three, and you
can always call them straight from Python (with hashlib, specifically).
Of the three, MD5 is the shortest and SHA-256 the longest, and MD5 is the least and SHA-256 the most secure.
Historical Data: Commands and Logins
When tracking lateral movement, you will often cross-reference network activity with user activity—specifically, actions like when a particular user connected to a particular service, when users logged on to the same system multiple times, or when users logged on to multiple services. This requires keeping track of the history of a server.
We’re really talking about two separate pieces of information here: user logins and command history.
On Unix systems, the basic information on user logins and logouts is
maintained in three files: utmp, wtmp, and btmp. utmp
maintains current system status—uptime, logged-in users, and the
like. wtmp is a historical record, and btmp is a list of failed
logins. The standard interface to this file is the lastlog command,
which when invoked will read the contents of the file and dump a
chronological list of logons.
As for command history, that’s basically maintained only in the individual user directories. This is maintained in a _history file specific to the user’s shell (e.g., bash_history, tcsh_history).
Other Data and Sensors: HIPS and AV
Host-based data collection can be simplified through the use of various endpoint collection tools and host-based agents. The granddaddy of these systems is the antivirus (AV) systems, and the odds are good you’re running one of those right now.
A caveat as we discuss what these systems are: the end state of almost all security companies is as a threat intelligence provider (more on this in Chapter 17). While there are some open source tools in this domain (notably ClamAV), most tools for data loss prevention, host intrusion prevention, and the like are proprietary. What you are really buying is a subscription to a threat intelligence feed, moderated through the tool.
Host intrusion prevention system (HIPS) is the general term for any system that monitors local host behavior and takes remedial action in the case of compromise or policy violation. A HIPS is effectively a boosted form of AV system, the workhorse of host-based defense. For the analyst, a HIPS is a new event feed focused on the endpoint—the HIPS will provide events based on a combination of signatures and heuristics, which it then feeds back into the console.
When considering HIPSs, keep track of the following issues:
-
How deep into an endpoint can the HIPS go? With a HIPS, you’re looking for something that will provide you with deeper information than you can quickly cobble together with a script. Does the HIPS hook into OS calls? Does it monitor memory, or is it just monitoring the filesystem?
-
When considering that, note that these systems will have their own vulnerabilities and modify fundamental capabilities of your system. Disabling and manipulating AV has been a fundamental malware task for a very long time.
-
How are updates delivered? In particular, will you have to deal with uneven updates (e.g., where half your system gets signature updates on Monday and half on Tuesday, so all of a sudden you get a spike in alerts on Monday afternoon)?
-
How configurable is the HIPS? In particular, can you write custom signatures, and can you turn off irrelevant signatures?
-
What constraints can you impose on the system? Is the HIPS going to come down on every violation like a meat-axe, or can you stage up or down detection?
-
How does the HIPS differentiate assets? Is it going to provide its own ID? Can you map it to UUIDs? Does the HIPS require you to individually identify each asset?
-
How much coverage will the HIPS provide? If you run a network consisting of heterogeneous assets (some Macs, some PCs, the occasional BeBox…), you need to keep track of which systems are running the HIPS and which systems aren’t supported.
Further Reading
-
For host-based analysis, the most fundamental resources are good books on system administration for the individual operating systems. These include the Apple Pro training series (published by PeachPit), Microsoft’s training manuals (from Microsoft Press), and the Windows Internals series (by Pearson).
-
S. Garfinkel, G. Spafford, and A. Schwartz, Practical UNIX and Internet Security, 3rd ed. (Sebastopol, CA: O’Reilly Media, 2011).