Table of Contents for
HTML5 Geolocation
 HTML5 Geolocation
Published by
O'Reilly Media, Inc., 2011
HTML5 Geolocation
Published by
O'Reilly Media, Inc., 2011
Chapter 2. Geolocation: Latitude, Longitude, and More
In Chapter 1, we covered the basics of geolocation, including what geolocation means, how geolocation information is gathered from different sources depending upon the device, and some common applications that implement geolocation today. Several key terms have also been mentioned, like latitude, longitude, and altitude; yet no definition has actually been given for any of these terms. Perhaps you are already well-versed in the GIS vernacular, but in case you are not, this chapter is meant to give a better understanding about exactly what information the W3C Geolocation API will be giving the developer. Recognizing exactly what information you are being passed and how to manipulate it properly will allow you to build better applications, if for no other reason than so that you will not misinform the end-user about the data.
What Are Coordinate Systems?
We have discussed the location (position) for a device, found using GPS or some other location method, given in latitude and longitude. These are called the coordinates of the particular device. In order to locate a device on the Earth, it is given a set of numbers which represents its place on the globe. These numbers make up the system by which we can then extrapolate positions.
There are many types of coordinate systems used in mathematics and everyday life—in fact, the most basic of coordinate systems was most likely taught to you when you were first learning to add and subtract: the number line. Other types of coordinate systems that should be familiar to those who took other mathematics classes are the Cartesian coordinate system (x, y, and z) and the polar coordinate system (r, θ). For geolocation, it is a geographic coordinate system that is used. With a geographic coordinate system, coordinates are expressed in latitude, longitude, and elevation.
Latitude and Longitude
To understand how latitude and longitude works, picture a globe with lines running both horizontally and vertically at (roughly) equal spacing between them, as shown in Figure 2-1. I mention roughly because, as we will see in The Earth’s Shape, the Earth is not a perfect sphere, and there will be small variations in the spacing of the horizontal lines. This system of latitude and longitude was probably first created in Egypt, but Eratosthenes may have been the first person to draw these lines in the third century B.C.E. It was a later Alexandrian scholar who divided up the Earth into an orderly grid using degrees (degree, “step”).[6]
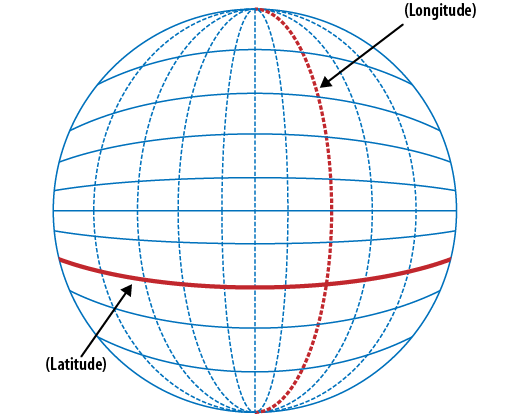
The horizontal lines on the globe are the lines of latitude, and are spaced about 69 miles (111.04 kilometers) apart from one another. The degrees of latitude are numbered from “zero degrees” at the Earth’s equator, to 90° in both the northern and southern hemispheres. The North Pole corresponds to 90° North, while the South Pole corresponds to 90° South. Latitude is expressed by φ, or the lower-case Greek letter phi.
The vertical lines on the globe are the lines of longitude. These lines converge at the North and South Poles, and run their widest (again, about 69 miles or 111.04 kilometers) at the equator. Lines of longitude are also known as meridians. The Prime Meridian, “zero degrees” longitude, was established in 1884 at Greenwich, England. From the Prime Meridian, the lines of longitude are numbered to 180° in both the eastern and western hemispheres. Longitude is expressed by λ, or the lower-case Greek letter lambda.
Note
Prior to 1884, any seafaring nation could set its own “zero” longitude when it issued navigational charts. This happened quite often over the centuries. In fact, this practice dates back to that first Alexandrian scholar who selected the Egyptian city of Alexandria as the first “zero” longitude.
Decimal Degrees versus Degrees Minutes Seconds
In order to gain the necessary precision when locating a point
on the Earth, the degrees of latitude and longitude are actually
broken down into degrees (°), minutes ('), and seconds (“). Every
minute is made up of 60 seconds, and every degree is made up of 60
minutes. An example coordinate point would be the St. Louis Arch,
which can be found at 38°37'29"N,
90°11'7"W—this is 38 degrees, 37
minutes, and 29 seconds north of the equator and 90 degrees, 11
minutes, and 7 seconds west of the Prime Meridian.
When you read about coordinates that are in degrees, they will generally be found in one of these three forms:
Degrees, minutes, and seconds (plus fractions of a second)
Degrees and minutes (plus fractions of a minute)
Decimal degrees
The coordinates of the Arch were of this first form, degrees, minutes, and seconds (DMS). The second form (degrees and minutes) is not as common, but still available to use. The third form, decimal degrees, converts the minutes and seconds of a DMS coordinate into a fraction of a degree. Decimal degrees differ from the other two types in that they do not indicate the direction of the latitude and longitude with cardinal directions (north, south, east, west), but instead simply display a positive or negative number. For example:
| 38°37’29"N | 38.624722 |
| 56°12’13"S | -56.203611 |
| 124°11’7"W | -124.185278 |
| 12°57’24"E | 12.956667 |
Conversion: DMS to Decimal Degrees
Converting from a DMS coordinate to a decimal degree coordinate is straightforward, following these steps:
Calculate the total number of seconds.
Take this total and divide it by 3,600 (the number of seconds in a degree).
Add this fraction to the whole number of degrees.
If the coordinate is a South latitude or West longitude, negate the result.
We will follow these steps to convert the longitude part of the
Arch’s coordinate, 90°11'7"W, to
see these steps in action:
Calculate the total number of seconds: 11’7” = ((11 * 60) + 7) = 667.
Take this total and divide it by 3,600: (667 / 3,600) ࣈ 0.185278.
Add this fraction to the whole number of degrees: 90 + 0.185278 = 90.185278.
It is a West longitude, so negating it gives us: -90.185278, as it is West of Greenwich.
Conversion: Decimal Degrees to DMS
Simple enough, right? Converting from a decimal degree coordinate to a DMS coordinate is just as straightforward, following these steps:
Subtract the whole degrees from the whole coordinate, leaving the fraction.
Multiply the fractional part by 60 (this is the number of minutes).
Subtract the whole minutes from the full minutes, leaving the fraction.
Multiply the fractional part by 60 (this is the number of seconds).
If the original coordinate was negative and a longitude, then keep the sign of the whole degree, or remove the sign and add a W, otherwise add an E. Likewise, if the original coordinate was negative and a latitude, then keep the sign of the whole degree, or remove the sign and add an S, otherwise add an N.
Perhaps slightly more confusing as far as directions go, but
following an example should make it much clearer. Let us take -90.185278 (a longitude):
Subtract the whole degrees from the whole coordinate, leaving the fraction: 90.185278 – 90 = 0.185278.
Multiply the fractional part by 60: (0.185278 * 60) = 11.11668.
Subtract the whole minutes from the full minutes, leaving the fraction: 11.11668 – 11 = 0.11668.
Multiply the fractional part by 60: (0.11668 * 60) = 7.0008 (drop the 0.0008 to get 7).
The original coordinate was negative and a longitude, so we will drop the sign and add a W: 90°11’7"W.
If at this point you are unsure why we went through all of this, all will become clear in Chapter 3 when we look at what the W3C Geolocation API returns after a location request is made. This stuff matters, trust me!
Geodetic Systems and Datums
If everything were simple, the geographic coordinate system would be enough to describe where points fall on the Earth. Because of the Earth’s irregular shape, however, things are not quite so simple and a system was needed to translate positions indicated on maps to their real positions on the Earth. This system is called a geodetic system. The references used in the geodetic system to translate coordinates are called datums—a geodetic datum is a reference used in surveying and geodesy.
Note
Geodesy is the branch of geology that studies the shape of the earth and the determination of the exact position of geographical points. Geodetic, geodesic, or geodesical refer to these measurements.[7]
Geodetic datums are used to orientate the geographic coordinate system, fix its origin, and define the shape of the Earth. For geolocation, the geodetic datums that interest us are those that model the Earth as a flat surface—it is not easy to display a three-dimensional Earth as a map, especially on the Web. To use Google as an example, going to http://maps.google.com/ will display a map of the Earth that is modeled as a flat surface, while going to http://earth.google.com/ shows the Earth in three-dimensions. Each of these maps uses different datums to display the same data.
The Earth’s Shape
I have been making a big deal about the shape of the Earth, how it affects the geographic coordinate system and latitudes, and it being the cause for needing geodetic datums. So what gives?
We were probably all taught that the ancient Greeks, as far back as the sixth century B.C.E., had at least the rough belief that the Earth was round—a sort of Pythagorean sphere. Mathematicians and philosophers refined their theories and experiments over the centuries, coming closer and closer in approximation to the shape we know the Earth to be today. What is sometimes omitted from our curriculum, however, unless we take more advanced science classes as we get older, is that the Earth is not a true sphere.
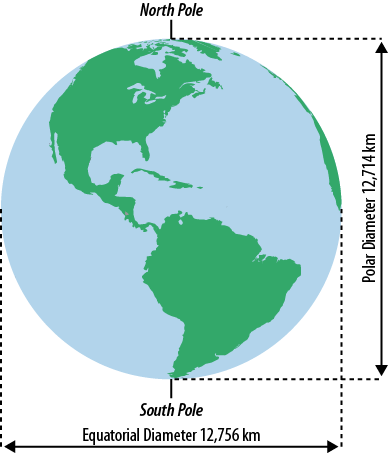
Sure, a sphere is a close approximation to the shape of the Earth, and will work as a mapping model for many applications (including Google Earth). However, as we have discovered through advances in the study of gravitational fields and better geographic data (satellites aided greatly here), the Earth bulges around the equator and is flattened at both poles. A better definition for the shape of the Earth would be an oblate spheroid, as shown in Figure 2-2. Because of the elliptical shape of the Earth, datums are used to satisfy simplifying the Earth into simpler two- and three-dimensional models everyday users can consume.
Common Datum
As Mathematicians modified and recalculated their ideas of the Earth’s shape and size, the datums that they used had to be modified as well. There have been many different datums over time, and these datums have evolved from ones that described the Earth as a sphere, to today’s more modern datums that describe the oblate spheroid we now know the Earth most closely approximates.
Since the Earth is not a perfect spheroid, using a more localized datum will yield a better representation of that area than using a globally encompassing datum. The following are a few of the more common “global” datums in use today:
World Geodetic System (WGS 84)
North American Datum (NAD 83)
European Datum (ED 50)
By contrast, the following are a sample of the many more localized datums in use around the globe:
Ordinance Survey of Great Britain (OSGB 36)
Swiss Datum (CH 1903)
Japanese Datum (TOKYO)
Pulkovo Datum (S-42)
The differences in the coordinates between any two datums is called the datum shift, and is an important consideration when looking at a map. The shift between datum depends on many factors, including the elevations of the datum in question. For example, while the difference between WGS 84 and NAD 83 is very small (less than 70 meters on average), the difference between WGS 84 and OSGB 36 is roughly double (around 140 meters). Considering the size of the Earth, both of these differences may seem small, but when attempting to place a coordinate in a smaller, “local” environment, 140 meters (459 feet) could mean a few city blocks.
WGS 84
The World Geodetic System is a global datum that was first created in 1960 (WGS 60) by the United States Department of Defense and scientists around the world. Several factors led to the need of a consolidated world system by which more localized datums could be referenced. Most importantly, the large geodetic datums in existence at the time (NAD 27, ED 50, etc.) were not sufficient to create a global system with sufficient accuracy. Also, there was a growing need for global maps, due to growth in global trade, growth in global tourism, and the burgeoning space science programs. World Geodetic System has seen several revisions, including WGS 66 and WGS 72. The latest revision is WGS 84, a datum that dates from 1984 and was last revised in 2004.
WGS provides three key components that are used for any geodetic measurements: a framework for placing coordinates on the Earth, a geoid which defines a Mathematically idealized likeness of the Earth’s surface (the global mean sea level), and a reference spheroid. The reference spheroid for the WGS is, of course, an oblate spheroid over which the latitude and longitude coordinate system can be placed. WGS 84 began using a geoid based on calculations from the Earth Gravitational Model of 1996 (EGM 96) when it was revised in 2004. Prior to this, it was using EGM 84.
Note
It is necessary to update the geoid for a global datum occasionally, as natural physical changes in the Earth modify its gravitation and rotation. For example, based on calculations by Richard Gross of the NASA Jet Propulsion Laboratory, the M9.0 2011 Honshu earthquake raised the sea level by 0.22 meters and shifted the ocean floor enough to shorten the length of a day by 1.8 microseconds, while the M8.8 2010 Chile earthquake raised the sea level by 0.16 meters.
Map Projections
To produce a map of the Earth, either a physical map or a map displayed in a browser, it must be projected from its three-dimensional form to a two-dimensional representation. For smaller areas of the Earth, this is not such a big deal, but when producing a map of the entire globe, it becomes more challenging. Using a datum as a reference, a map is projected to display certain aspects of the Earth—scale, distance, area, shape, etc. No map can, unfortunately, protect every aspect and there will have to be compromises on some aspects in order to preserve others.
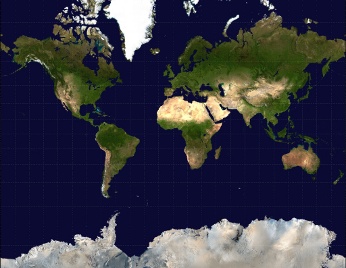
On the Web, all major vendors in map data (Esri, Google, Microsoft, etc.) use a map projection based on the Mercator projection. The Mercator projection is named after the Belgian cartographer Gerardus Mercator, who created the cylindrical map projection in 1569. With this projection, all latitudinal and longitudinal line cross at right angles (90 degrees), which keeps geographical aspects of the Earth normal near the equator, but greatly skews those near the poles, as shown in Figure 2-3—Greenland is not actually nearly the same size as Africa.
Web Mercator Auxiliary Sphere is the projection that has become industry accepted on the Internet for web-based mapping. Simply put, it is a Mercator projection used across the Web, using WGS 84 as the reference datum.
Altitude, Course, and Speed
If you had to rank geolocation properties by importance, the latitude and longitude of a position would obviously be the most important. As I explained earlier, however, there is a third component that makes up every point in a geographic coordinate system: altitude, also known as elevation or height. Beyond this, there are additional components that, though not strictly necessary, can be very useful pieces of data for a geolocation application. These components are related to one another and are useful when the object being located is moving—course and speed.
Geodetic Height
Without an elevation, a point cannot be pinpointed exactly on a topographic feature. This height, when discussed in reference to a geolocation, is generally understood to be above sea level, though it does not have to be defined this way. As our technologies advance and more diverse environments open up to us, it is quite possible that we will find uses for geolocation below the ocean’s surface as well as above it. In fact, there are two ways that elevation can be defined in a datum—either by sea level or by geodesy.
Vertical Datum
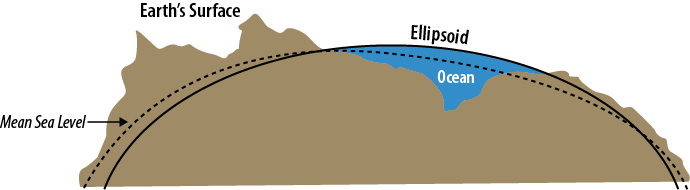
The usual method for measuring a height on land is based off the Mean Sea Level (MSL) of the Earth, seen in Figure 2-4. By measuring the height of the ocean’s surface over a long period of time, an average sea level can be calculated to remove tides and other oceanic effects. Local gravitational differences on the Earth, however, will still have an effect on the mean sea level in relation to the vertical datum. Because of this, individual countries choose a mean sea level at a particular point which they designate as their standard and use this for reference when doing localized mapping. In Canada, the United States, and Mexico, the localized point is in Quebec, Canada.
There are circumstances when using mean sea level does not provide the optimal reference for a vertical datum, and this comes into play when the topographical elements being plotted are of an historic nature. Sea levels do not remain constant with time, therefore a different vertical datum is usually referenced when dealing with this type of data. A geodetic datum arbitrarily assigns an elevation on the Earth’s surface as “zero”, without using the ocean as a guide. This point usually coincides with the localized point assigned by countries when defining mean sea level, but due to variations across the globe, the two “zeroes” will not coincide anywhere else. NAVD 88, used in North America, is an example of a geodetic vertical datum (and happens to have the same localized point in Quebec as the mean sea level point).
Course
An object’s course is the proposed direction that it will take to get from one point to another. It can be defined as a planned route between two points, or it can be defined as the necessary path an object must take to get from one point to the next. A course is constructed out of straight lines between points, with each segment of the course being called a leg.
The heading of an object describes the direction that it is pointing in at any given time. The direction is measured as an angle, in degrees, relative to a fixed reference point which in most cases is True North. The angle is measured from 0° in a clockwise direction to 360°, where 0° is North, 90° is East, 180° is South, and 270° is West.
Course and heading are sometimes used interchangeably, though they do have slightly different meanings. The heading, as I just described, is the direction an object is facing, but not necessarily moving in. The course, meanwhile, is the intended direction of movement (think “plotting a course on a map” when traveling). Then there is the term track, which is another term you will hear when talking about heading and course. The track is the direction in a line between the point of origin (where you were when you started moving) and the present location. Another way to put it is that a track is a realized course.
Speed
Looking at everything we have discussed thus far in this chapter, speed may be the most obvious. As soon as I say speed, I am sure you are thinking. “how fast something is going?” That is exactly what I am talking about with respect to geolocation. Speed is simply the rate of motion of an object. I know this is an easy concept, so I do not want the physics that follows to distract from that—I hope it does not.
From a physics or mathematics perspective, a better definition for speed is the magnitude of an object’s velocity, where the velocity of an object is a measurement of the rate of change in the position of the object in a given direction. Speed and velocity both consider the length the object travels and the time it takes to travel that distance, measured in meters per second (this is the standard unit declared by the International System of Units (SI)).
The average speed of an object (V) is defined as:
V = d / t
where d is the total distance traveled and t is the total time taken.
This should not be confused with the instantaneous speed, or speed at any given time, of an object (v), which is calculated as the time derivative of s, where s is the length of the path traveled until time t:
v = ds / dt
Though the SI unit of speed is meters per second, more familiar units of measure (ones used in cars every day) are units like miles per hours and kilometers per hour.
Accuracy
In a perfect world, the location you are given when requesting geolocation information would be exactly right—meaning where it says you are is where you actually are. Well, the world is not perfect (I apologize if I burst someone’s bubble there). The reality of the situation is that the accuracy of the data will fluctuate each and every time a geolocation request is made. There are so many factors that go into giving a location that when you stop and think about the mechanisms behind geolocation, it is pretty amazing that we have the accuracy we do.
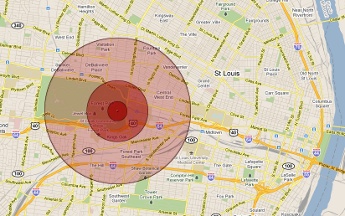
Before I go any further, let me define accuracy—the accuracy of a geolocation is how close a location measures to its actual location. A common way to use accuracy in GIS is to state that “a point is accurate within 20 meters,” meaning that the actual location of the point is no more than 20 meters away from the location we are showing for that point. Figure 2-5 gives an example of a point with different radii of accuracy surrounding it.
One of the main factors for a geolocation’s accuracy is the way in which the location was gathered. An IP address is less accurate than a Cell ID, which is less accurate than GPS. Why? The most obvious reason for the inaccuracy of an IP address is that the location could be gathered from the IP address of a router or firewall that is miles away from the computer browser that the geolocation was requested from. This type of situation would be fairly common in a large corporate environment. Cell IDs are generally more accurate than IP addresses as a triangulation must be calculated from cell towers in order to get a geolocation. GPS is generally more accurate than Cell IDs because there are more complex calculations going on to get a geolocation from more satellites.
Of course, hardware glitches, radio interference, weather, and so on can degrade signals and decrease the accuracy of any geolocation request at any time. That is why it is important to gather accuracy information whenever a geolocation request is made, so that the user can be made aware of potential errors in their location in an application. The accuracy of geolocation information will get better as technology continues to get more sophisticated, but even the most technologically sound implementations will be subject to things outside of the manufacturer’s hands.
[6] Garrison, Tom. Oceanography: an invitation to marine science. Cengage Learning, 2007.
[7] Princeton University “About WordNet.” WordNet. Princeton University. 2010. http://wordnet.princeton.edu/.