First Edition

Why Map Librarianship and Geoliteracy?
Chapter 1: Introduction to Maps and Librarians
1.3 Historic Progression of Maps and Cartographers
1.4 What Are NeoGeography and NeoCartography?
1.5 Historic Progression of Map Librarianship
1.6 What Is NeoMap Librarianship?
Chapter 2: Spatial Thinking and Geo-Literacy
2.1 Geo-Literacy: Location-Based Spatial Thinking
2.3 Reference and Thematic Maps
2.4 Mapping Data—Map Symbology Techniques
2.7 The Proportional Symbol Map
2.14 Coal, Oil, and Natural Gas Investigation Maps
2.24 Globes and Raised-Relief Models
Chapter 3: Basic Map Concepts—The Science of Cartography
3.8 Universal Transverse Mercator Coordinate System
3.9 State Plane Coordinate System
3.10 Public Land Survey System
Chapter 4: Geographic Information Systems and Remote Sensing
4.1 What is a Geographic Information System?
4.4 The Difference Between Vector and Raster Data
4.6 Web GIS as a Component of NeoGeography
4.7 Volunteered Geographic Information
Chapter 5: Terrain Mapping Meets Digital Data
5.1 Digitally Representing Terrain
Chapter 6: Map and Geospatial Librarianship
6.2 Academic Preparation and Continuing Education
6.3 History and Transitions in Map and Geospatial Librarianship
6.4 GeoWeb and Geospatial Librarianship
6.5 Historical Beginnings—ALA and MAGIRT
6.6 Core Competencies: ALA and MAGIRT
6.7 History of Academic Curriculum to Support Map Librarianship
6.8 Transitions in Academic Curriculum to Support Map Librarianship
6.9 Job Opportunities and Challenges in Map and Geospatial Librarianship
6.10 Map Library Work Space and Equipment
Chapter 7: Geospatial Resources and Instruction Services
7.2 Navigating the Labyrinth—Legal Considerations
7.3 Navigating the Labyrinth—Where to Go to Get What?
7.4 Guide Through GIS and Remote Sensing Software
7.5 Guide to Finding Maps, Data, and Other Geospatial Resources
8.3 Reference Librarian Duties
8.5 Support Groups for Map Librarianship
8.6 Citing and Referencing Maps and Geospatial Data
Chapter 9: Collection Development
9.2 Knowing Users and Use of Map and GIS Resources
9.3 Collection Development Policy
Chapter 10: Cataloging and Classifying
10.2 A Brief History of Cataloging Maps
10.3 A Brief History of Classifying Maps
10.4 Classification Systems and Maps
10.5 Cataloging Cartographic Resources
Chapter 11: Promotion and Summary of Map and GIS Resources and Services
11.2 Promotion of Library Resources
11.3 Geography Awareness Week, GIS Day, and Earth Science Week
University of Illinois Library School 1951
LS 306 Readings: Introduction to Maps and Map Libraries
LS 306 Readings: Cartobibliographic Aids
LS 306 Readings: Physical Care, Classifying, Cataloging, and Rare Maps
Chandos Publishing is an imprint of Elsevier
50 Hampshire Street, 5th Floor, Cambridge, MA 02139, United States
The Boulevard, Langford Lane, Kidlington, OX5 1GB, United Kingdom
Copyright © 2017 Susan Elizabeth Ward Aber and Jeremy Ward Aber, Published by Elsevier Ltd. All rights reserved.
No part of this publication may be reproduced or transmitted in any form or by any means, electronic or mechanical, including photocopying, recording, or any information storage and retrieval system, without permission in writing from the publisher. Details on how to seek permission, further information about the Publisher’s permissions policies and our arrangements with organizations such as the Copyright Clearance Center and the Copyright Licensing Agency, can be found at our website: www.elsevier.com/permissions.
This book and the individual contributions contained in it are protected under copyright by the Publisher (other than as may be noted herein).
Library of Congress Cataloging-in-Publication Data
A catalog record for this book is available from the Library of Congress
British Library Cataloguing-in-Publication Data
A catalogue record for this book is available from the British Library
ISBN: 978-0-08-100021-2 (print)
ISBN: 978-0-08-100045-8 (online)
For information on all Chandos publications visit our website at https://www.elsevier.com/

Publisher: Glyn Jones
Acquisition Editor: Glyn Jones
Editorial Project Manager: Lindsay Lawrence
Production Project Manager: Omer Mukthar
Cover Designer: Victoria Pearson
Typeset by SPi Global, India
James S. Aber, a caring husband/father. He is the one who started us on the journey of using, collecting, and creating maps as we traveled the U.S. and beyond. Throughout the process of writing this book, we had the opportunity to learn from him and benefit greatly from his expert editorial guidance and steadfast encouragement.
Amy A. Harris-Aber, a loving wife/daughter-in-law. She was always there with constant support, help, and advice, and put up with the long hours of writing and editing.
Jay T., a one-of-a-kind son/brother, Lauren R. and Rose E. Aber, completing this amazing family. The travelers who keep us busy simply finding all the wonderful places they visit and explore by foot, bicycle, car, train, boat, and plane.
R. Kenneth Aber, the best father-in-law/granddad in the world. For continually orienting and inspiring us to travel both physically and intellectually.
In memory of parents/grandparents, Marian M. and Henry A. Ward, and Sarajane S. Aber. You gave us unconditional support, artistic direction, and so much more.
Finally, we hereby dedicate this book to all of the past and present map librarians, who perform their jobs quietly with efficiency and care, fighting to retain and catalog the map and geospatial data collections, which are often relegated to basements or outsourced beyond imagination.
This book was inspired by teaching an elective reference resources and services course focused on maps and Geographic Information Systems (GIS) offered in a large university library and information science (LIS) program. The syllabus stated that no prior knowledge of geography and geoscience or maps and GIS was needed or assumed. Furthermore, all students were welcomed whether they navigated the world with landmarks or maps, geography-bee winners or not. Through informal observations about one-fourth of all students had some geography course work or degree; of those degree holders, approximately half of the geography majors stated they never had a geography course that was specific to maps. This surprised us, yet we know geography programs in universities may be aligned with geoscience or social science departments.
Students were sent into the field to meet map/GIS users and librarians. The first assignment asked students to engage in a 5- to 10-minute informal conversation and get to know some people who used maps in personal or profession life. Participants described occupational duties and named the map and data resources used to accomplish tasks as well as identified where the resources were acquired. The latter resulted in the second surprising observation, an overwhelming majority of participants were unaware that libraries had any cartographic resources or services and that these maps and data might be useful to them.
For the second assignment, some students found that librarians assigned to maps were sometimes reluctant to speak and repeated that they were not real map librarians. In contrast, other students found map and geospatial librarians who were knowledgeable, confident, and encouraging as well as ready to show off the collection and give valued advice to students on their career direction. Unfortunately, the exemplary map librarian was a bit harder to find and this was another surprise to both teacher and student.
This is why we identified the need for this book in addition to the fact that there was no single source that focused on geoliteracy and map librarianship. We designed the book to be a practical guide for students and librarians, who may want to build confidence and enhance their geoliteracy knowledge so as to apply it to traditional librarian skills. As map librarians, they have to not only promote resources and services to clients, but also to library colleagues and administration. Yet, we were asked why maps and why us?
Maps are everywhere. We carry them digitally in our phones and vehicle dashboards. We have them physically on the book shelf, and folded or bound slipped into glove box of the car. Maps have scale and compass direction, and as such they provide the best hiking and biking paths. They can also show the movement of hurricanes in order to detour and direct traffic during evacuations. Anyone navigating land, air, and water depends upon the most accurate and current maps and charts. Do you know how to maximize success through reading your map? Map librarians provide instructional services. Although navigation is primary, it is only one purpose for maps.
Reading and following a map could lead to adventures and problem solving. Old and new maps help in visualizing patterns and documenting change over time. Old maps show former channels in the river, which help archeologists today find buried treasure among sunken paddle boats. Medical researchers may map particular genes among generations of families or follow disease outbreaks tracking infestations of insects. Maps have assisted astronomers, attorneys, business owners, climatologists, collectors, criminologists, doctors, drivers, engineers, entrepreneurs, firefighters, genealogists, geoscientists, historians, librarians, pilots, pirates, police, politicians, soldiers, teachers, and writers, to name a few.
Maps are created to define the extent of solar system and galaxies, observe election results, or depict contours in an agricultural field. Maps identify flood-prone areas or demonstrate underserved regions where city services such as parks and public libraries are needed. Interpreting maps is contingent upon data defined in the legend and once reviewed may clarify solutions. It follows then that maps may be thought of as works of art or tools of the trade, which originally were the exclusive domain of cartographers and geographers. The shift from a physical to digital world of maps happened at the end of the 20th century and a geospatial revolution took hold early in the 21st century.
Yet, both maps and librarians seem to be in the middle of the print and digital worlds. We have followed the explosive use of maps and applications for GIS and mapping programs, which have grown phenomenally in the last two decades. Librarians are perfectly situated with valuable collections in place. The library could play a huge role in the geospatial revolution, but instead seems to be content to let this opportunity pass by. LIS programs briefly recognized their chance in the 1980s, but with little recruiting effort for science majors the programs seemed easy to cut from the budget. This misstep has resulted in map users bypassing the library and allowing Internet searching and mapping to become the norm. Libraries are valued institutions, but need to recognize that the geospatial revolution includes maps, data resources, and services in their libraries.
Our lives are intertwined with maps and depend upon geoliteracy, whether we are aware of it or not. Like the fish that is ignorant of water or the bird the wind, people define boundaries, prove ownership, and navigate Earth using maps and depend on geoliteracy, whether by tacit knowledge or physical guidance of mapping programs. Maps scale to the size we need and vary in topic or subject to cover every imaginable situation. We have watched maps evolve as a combination of art and science over millennia.
Many people associate books and libraries. However, the global WorldCat library catalog added new information records for nearly 5 million unique maps held in libraries in 2015 alone. Libraries are more than a repository of books. In addition to adding maps into the collection, map librarians care and preserve for these physical and digital resources. One of the first cartographers to create a map of the world in the 3rd century AD was also one of the earliest map librarians at the great Library of Alexandria. Eratosthenes created maps and curated geographic information for future generations. Besides preserving maps, the Library of Congress now has about 17,000 maps available online from its collection of 5.5 million maps. Stanford University has been the recipient of major donations through digital philanthropy. There are 71,000 maps viewable online as well as 150,000 in donations overall.
The public's ignorance of map collections in libraries may come as no surprise, as not all map collections are included in library catalogs, essentially rendering maps invisible to electronic searching. In addition, map collections are physically hidden when outsourced to other buildings or stored in basements of main library building. Maps may be cared for by grumpy librarians who are quick to explain their position was inherited. This indifferent attitude toward a map collection is easily explained, as few library schools offer any course on maps and GIS resources and services. Finally, visual information presents another conundrum to librarians who are steeped in textual literacy; that is, the need for citing maps is misunderstood and the procedures for referencing maps, aerial imagery, and geospatial data are difficult to find among the numerous referencing styles. Hence, map collections remain as gems in the rough until user-driven demand for access and improved services prevail.
Jeremy is a geography/GIS teacher and researcher. Susie is a teacher and researcher with an insatiable curiosity and appreciation for maps and librarianship. We have a common bond and compass in that our entire family shares a passion for traveling to new and unfamiliar places, immersing in different cultures and peoples, for exploring landscapes and natural resources, and preserving a balance between natural and human constructions. We value maps and geospatial data and want to help turn map resources in libraries from problem children to treasured collections. We want to make a difference and give back to the professions showing geography students a new career direction and ensuring library students and librarians that a text resource exists. Our goal is to enhance geoliteracy as well as reference and instruction skills by providing details on finding, downloading, delivering, and assessing map, remotely sensed imagery, and other geospatial resources and services, primarily from trusted government sources.
The authors wish to thank many colleagues, librarians both map and generalists, and students, who over the years have contributed content, photographs, editorial help, and inspirational ideas in preparation and completion of this endeavor. Some of them are listed here: James Aber, Jay Aber, Amy Harris-Aber, Mary Larsgaard, Eva Dodsworth, Beth Hanschu, Zada Law, Wade Bishop, Cara Bertram, Julie Sweetkind-Singer, Cynthia Karpa McCarthy, Igor Drecki, Benjamin Jones, Joyce Monsees, Linda Koistinen, Kathleen Weessies, Pete Reehling, Patrice A. Day, Meagan Duever, Jennifer Ann Haegle, G. Salim Mohammed, Jon Jablonski, Angie Cope, Jennifer Davis, Katherine Weimer, Linda Main, Debbie Faires, Irene Owens, Chad Morgan, George Knott, Harriet Clayton, Julie Hallmark, Julie Williams, Linda Zellmer, Patrick McGlamery, Hallie Pritchett, Tassanee Chitcharoen, Suzanne Harter, Sandra Hirsh, Linda Lillard, Linda Musser, Paige Andrews, Marcy Bidney, Emily Prince, Susie Oh Quinn, Andrew Carlos, Jeffrey Franks, Trish Garcia, Mary Fran Griffin, and Earle McCartney.
Support was given during the writing of this book by the following institutions: Middle Tennessee State University (MTSU), North Carolina Central University (NCCU), San José State University (SJSU), and Emporia State University (ESU).
Maps serve to orient lives and navigate landscapes. The historic progression of map-making cultures and collectors may date back as far as 12 millennia. Map librarianship as a career track is a mid-20th century phenomenon. Librarians managing cartographic collections must be geo-literate and have adequate academic library school coursework to design effective map and geospatial services. 21st century cartographers and geographers have gained new importance in documenting natural disasters through the use of global social media channels, maps, and geographic information systems. For librarians to be essential liaisons they must assure maps and geospatial data are freely available. As NeoGeography and NeoCartography have become commonplace, it is time library school programs support NeoMap Librarianship and join the Geospatial Revolution.
Geography; NeoGeography; Cartographer; NeoCartography; Crisis mapping; Compass; Spatial; NeoMap Librarianship; Maps; Crowdsourcing; Participatory cartography; Geo-literacy; Geo-literate; Geospatial Revolution.
Maps are ubiquitous and can record a sense of place in life. Maps situate the reader to a location on Earth through cardinal points of a compass providing the direction in space. Stephen Hall (2004) assumed that we travel with maps “neatly folded and tucked away in the glove compartment of memory”; we orient ourselves back and forth between time and landscapes, emotion and geography, and it all happens in the span of a few moments (p. 15). In fact, three-dimensional compass cells have been identified in bats, used to perform complex flight without disorientation (Finkelstein et al., 2015, p. 159). Costandi (2014) summarized research that suggests all mammals, which likely include humans, have head-direction cells or an internal global positioning system used to create these mental maps of the environment. Aber (2012) found that with short exposures to a novel place, individuals can recall the spatial layout of an environment to some degree, with a few capable of creating an incredibly accurate mental map of the space. Consequently, maps play a role in the place in which we were raised and reside, serving as our internal spatial compass.
Maps are pervasive and people rely on numerous types of maps daily. Maps are produced in print or electronic formats, accessed in print books and single sheets or via mobile phone and computer devices. Planimetric or topographic maps may be used for navigation. Reading and interpreting maps help to create a route to travel from point A to B, whether driving unfamiliar roads or hiking over new trails. Likewise, interpreting digital data via electronic maps in real-time helps to anticipate traffic delays and predict changing weather conditions. Professional politicians might study past voting patterns on choropleth maps or cartograms while observing data on electronic maps showing present election results as polling stations report. Geologic maps are used to locate and interpret rock layers and tectonic structures when prospecting for valuable natural resources from coal to diamonds.
More recently, humans in the wake of natural disasters have benefited with quicker disaster response when participating volunteers come together to monitor social media channels and share information regarding infrastructure destruction and human-injury levels. These efforts result in maps, which provide emergency aid officials with valued current, yet ephemeral, information for a focused response. Subsequently, maps have become second nature. This is especially true when accessing and displaying mobile, electronic versions.
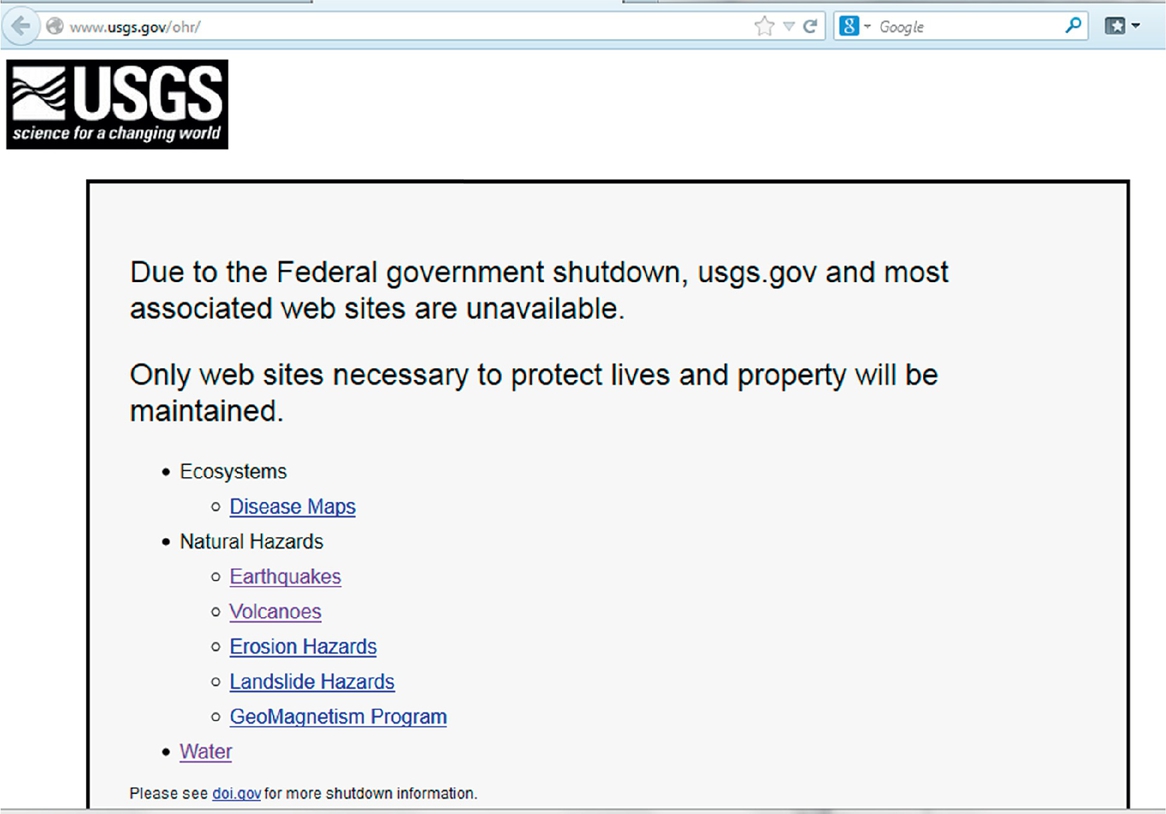
In Oct. 2013, American politicians disrupted our traditional spatial compass. The Legislature forced a Federal Government shutdown by refusing to pass a national budget for 16 days in order to stop implementation of legislation that created affordable health care insurance opportunities (The White House, Office of Management and Budget, 2013; Roberts, 2013). This political tactic cut off the world’s access to one of the primary sources for maps and geospatial data by closing nearly all of the United States Geological Survey (USGS), the National Oceanic and Atmospheric Administration (NOAA), National Aeronautics and Space Administration (NASA), National Geospatial-Intelligence Agency (NGA), and other federally funded science groups (Rosenberg, 2013). The only USGS web sites remaining online were those deemed necessary to protect lives including maps of disease, earthquakes, volcanoes, erosional hazards, landslide hazards, geomagnetism, and water, see Figure 1.1. Likewise, NOAA maintained some capability for weather forecasts and warnings, while NASA satellites currently in orbit were allowed to operate (Freedman, 2013).
These same legislators went even further and restricted access to information and data at the Library of Congress in Washington, D.C. However, in the nation’s capital, the mayor declared public libraries and librarians as essential, and the District of Columbia libraries defied the restrictions and remained open (Chant, 2013; DeBonis, 2013). In addition, some private companies, such as the Environmental Systems Research Institute (Esri), continued to provide access to existing federal government geospatial data resources through ArcGIS Online (Szukalski, 2013). Although our use of maps is so natural, the right to free access of maps, information, and data is in fact a privilege, which can be taken away.
Nevertheless, the value of mapping natural disasters by volunteers using social media has driven change in access and map making. In the past, printed or electronic maps were created using traditional geographic methods, where one map maker or professional cartographer created the finished map used by many. Now, maps may be produced with crowdsourced, shared data, and a new geographic method (Goodchild & Glennon, 2010). This participatory cartography, or NeoCartography, is where many come together to create one map.
These grassroots efforts and the need to bypass disruptions in the public’s access to maps and data have reinforced the value of libraries and the role librarians can play. Many libraries serve as Federal Depositories of print maps and may have created resource collections and services that included access to electronic maps and spatial data. However, not all librarians have map and geography educational backgrounds and may benefit by gaining a higher level of geo-literacy to be effective. If librarians have content knowledge, then they can adopt a collection development policy that promotes geography and cartography resources and creates effective instructional services.
Geography as a word has its origins in the Greek scholar Eratosthenes' writings (Roller, 2010). It combines "geo," meaning Earth and "graphy," which refers to art or science and the process or form of representing and describing, or in other words, writing about the Earth. While some assume that geography is a field concerned with memorizing political capitals, in reality it is a holistic approach to studying Earth and the people living there. Geography is considered to have four traditional areas of study: the spatial tradition, analyzing where things are; the area studies tradition, looking at what makes regions distinct; the earth science tradition, which covers many natural topics of geology, hydrology, atmospheric studies, etc.; and the man-land tradition, which looks at links between the natural and human-built environments (Pattison, 1990). This last tradition has become more and more important in recent decades as we increasingly come to understand the impact our actions have on the environment.
These four traditions together cover a great deal of human understanding of the world, which suits geography’s holistic approach to knowledge well. For example, a geographer would not look at the natural component of a mountain without considering how those elements are affected by those who live on the mountain; likewise, a geographic study of the people living on the mountain would be incomplete without considering the impact of the natural environment on their lives. These traditional geographic approaches are visible through the multitude of techniques and topics on display in maps.
Cartography is the study and tradition of map making. A cartographer makes maps by combining geographic data with scientific, technical, and artistic principles of that time period to model and communicate visual, spatial information. Although traditional map making is being superseded by digital technologies, crowd-sourcing methods, and cloud storage/retrieval, there is merit in reviewing the early tangible map-making techniques using formats from rock to paper. A brief historic summary follows. For more information, refer to: The History of Cartography Series, a definitive collection of articles with global coverage (Harley & Woodward, 1987, 1992, 1994; Woodward & Lewis, 1998; Woodward, 2007; Monmonier, 2015). Two additional volumes are forthcoming in The History of Cartography Series, Cartography in the European Enlightenment, volume 4, by Edney & Pedley (Eds.) and Cartography in the Nineteenth Century, volume 5, by Kain (Ed.). Other bibliographies include Ristow (1997) and Karrow (1997).
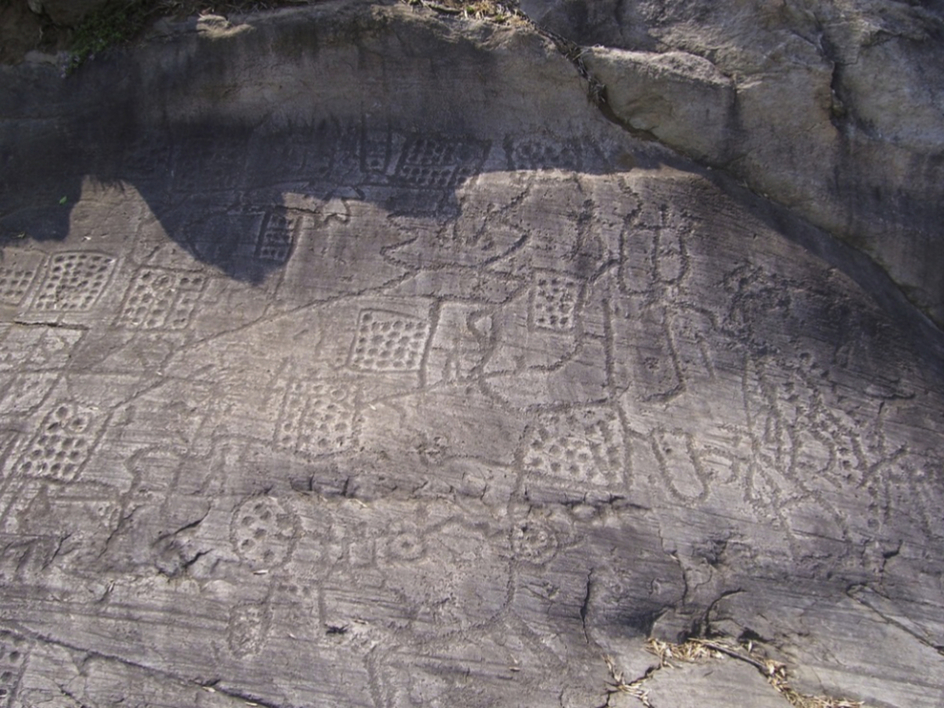
Discussions on the history of maps and cartography usually begin with ancient civilizations some 4 millennia in the past when maps were preserved on Babylonian clay tablets (Dilke, 1987). Yet, some consider the earliest map examples to be traced back 8–12 millennia and are those carved on rock or painted murals on walls (Barras, 2013; Choi & Brahic, 2009; Clarke, 2013; Meese, 2006; Siebold, n.d.; UNESCO, 1979; Utrilla, Mazo, Sopena, Martínez-Bea, & Domingo, 2009) (see Fig. 1.2). Regardless of the age, dissemination of the map was limited given fixed geographic locations of rock outcrops and buildings. As map making progressed from carvings on rocks to etchings on clay tablets, cartographers also advanced from hand-carved or hand-drawn maps to reusable map printing methods. Thus, printing techniques and lighter-weight formats increased dissemination as materials used for making maps went beyond a fixed stone or wall.
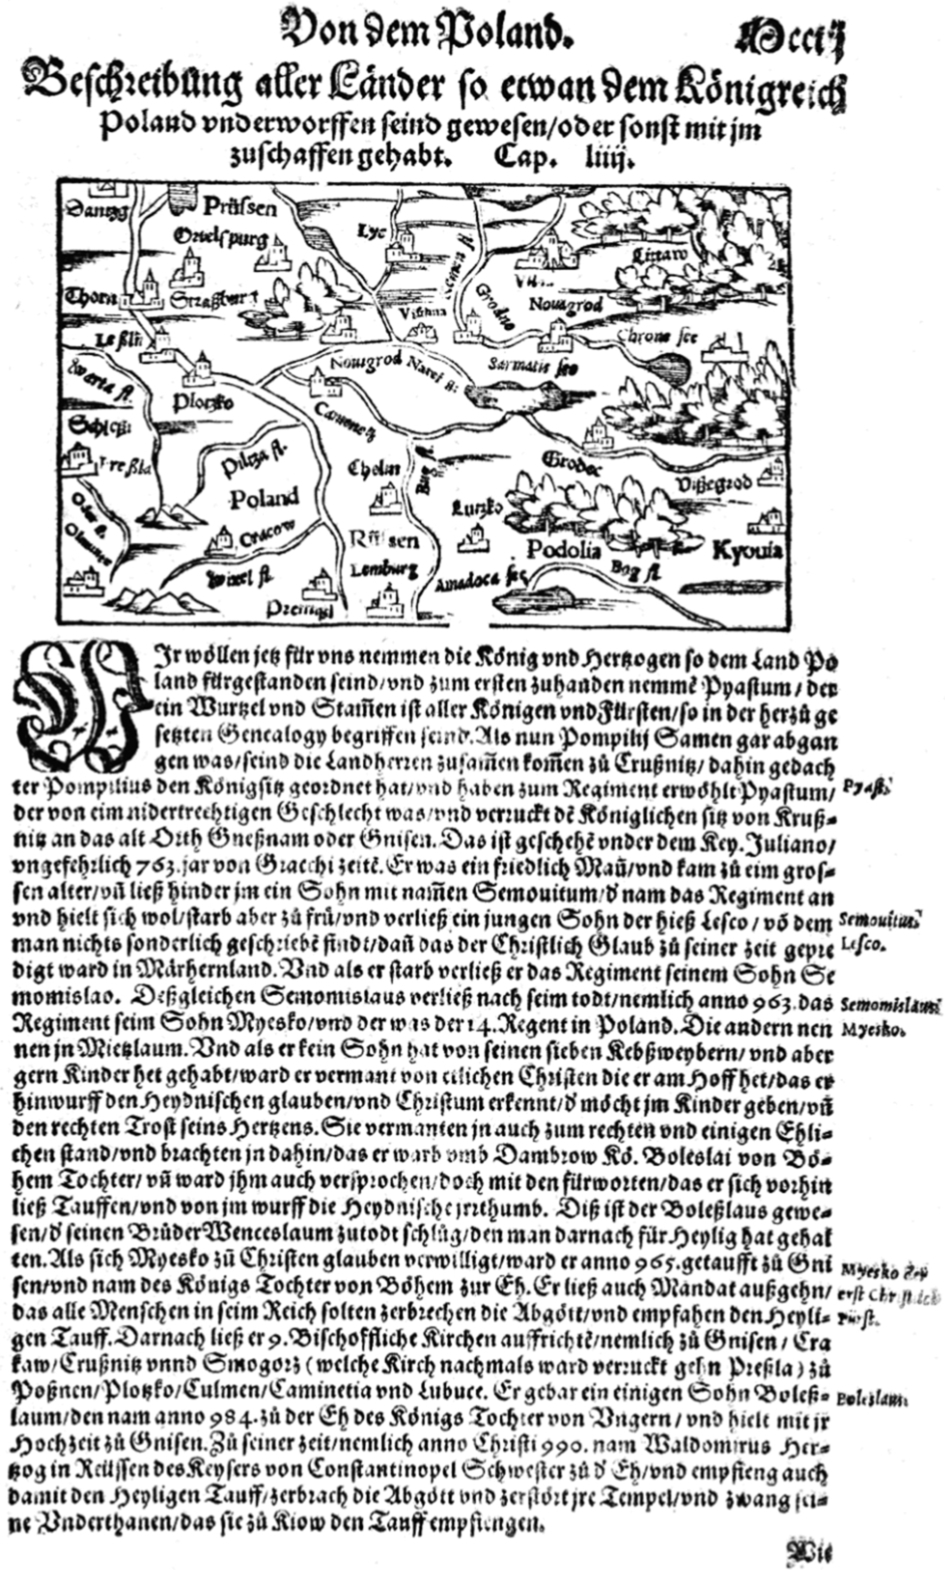
Woodblock printing was introduced in China as early as the 8th century, and the movable type printing press began in Europe by the 15th century; both of these are effective techniques for printing and reproducing text and images, see Figure 1.3 (Klooster, 2009; Temple, 2007). These improved methods for creating and printing maps were obvious advantages for dissemination, over rock and clay. Woodblock printing, common by the 13th century, gave way to copper-engraved sheets and plates by the 16th century, see Figure 1.4. This modification allowed maps to be more detailed and easier to reprint from the reusable metal sheets that could be hammered and re-engraved if changes were needed (Woodward, 1975, 2007). In fact, the copper-engraved plate for map printing was state-of-the-art for some 300 years until recently (Fitzgerald, 2002; Evans & Frye, 2009; Woodward, 2007).
The trend today is moving from print-based map making to film or digital-based cartographic methods. In fact, the main American mapping agency, USGS, discarded their historic copper and steel engraving sheets and plates in 2014, in favor of digital map making, storage, and printing (Newell & Domaratz, 2015; Morais, 2014).
As each method for map printing changed, the materials used evolved as well, from papyrus, parchment, silk, linen, hand-made or machine-made paper to synthetic film and on to digital data images (Brandt-Grau & Forde, 2000). Just as map-making methods and materials evolved, so did the role of cartographer, who was both the map-making professional as well as the printer, who engraved metal plates and combined ink with moveable metal type using a mechanical press.
According to the Occupational Outlook Handbook, the job of a cartographer today is primarily a profession in teaching and research (Bureau of Labor Statistics, U.S. Department of Labor, 2014a). The cartographer role as map maker works with surveyors and photogrammetrists (Bureau of Labor Statistics, U.S. Department of Labor, 2014b). The entry for printer is no longer a specialized profession, but as a print worker technician who can “operate laser plate-making equipment that converts electronic data to plates”; the worker is expected to “calibrate color settings on printers, identify and fix problems with printing equipment” (Bureau of Labor Statistics, U.S. Department of Labor, 2014c). Just as the cartography professional has changed focus, the printer usually refers to an electronic machine, not a person in a professional career.
The advent of digital map making and printing arrived in the latter half of the 20th century, with the last decade being the tipping point. In “early 1990s, nearly all maps were distributed on paper,” and by the end of the decade, more maps were transmitted through the Internet than printed on paper (Peterson, 2014, pp. 1, 12).
In the early 2000s, web development advances created the Geoweb Revolution (Dangermond, 2009; Haklay, Singleton, & Parker, 2008). The GeoWeb led Goodchild (2007) to propose the term Volunteered Geographic Information when describing nonexpert citizens who create, assemble, and disseminate geographic information using web services and digital sources without the use of Geographic Information Systems or GIS. By 2010, Penn State Public Broadcasting summarized the power of digital mapping with the online project, Geospatial Revolution (PennState, 2010). Penn State offered a free, online course, Maps and the Geospatial Revolution (PennState, 2016). These rapid changes herald a new perspective on map formats and map-making methods or a new geography and cartography that expanded the definition of geo-literacy.
NeoGeography is a recent term that describes the divisions between traditional geographic roles of subject, producer, communicator, and consumer blurring together (Goodchild, 2009). Where traditional geographic work involved a more regimented hierarchy between these factors, NeoGeography leverages technological and social changes since the turn of the century to allow consumers to be subjects, producers, and communicators all at once. This movement has been made possible largely by the power of the Internet, where most NeoGeographic activity takes place (Rana & Joliveau, 2009). The empowering of users through geospatially enabled technologies such as Global Positioning Systems (GPS), the Internet, and user-friendly cartography tools has allowed for those without formal training to become involved in a broad range of NeoGeographic activities (Clark, 2008). One factor that sets NeoGeography apart from traditional geography is that its practitioners are often not geographers by training; instead, they come from technology and engineering fields which are already deeply involved in online and mobile development. This has created a discrepancy or disconnect, as traditional geographers come from an academic world built on peer-review, whereas many NeoGeographers come from a more entrepreneurial technology background (Rana & Joliveau, 2009).
NeoCartography technologies are the flip side of the NeoGeography coin, providing a visual platform for individuals to present and analyze their work (Monmonier, 2013). Like NeoGeography, many individuals involved in Neocartography lack a background in cartographic work. Their efforts often involve open-source data and GIS/cartography technologies (Commission on Neocartography, 2011–2015). These include platforms such as OpenStreetMap, Google Maps and Earth, Mapbox, and more coding-centric web platforms like D3, jQuery, and Leaflet. Other data sources include social media content, such as public Twitter and Facebook feeds.
One example of this divide between traditional geography and cartography and their Neo- equivalents can be seen in Google’s Earth and Maps products. Traditionally, maps are treated as arbiters of truth and reality, serving as authoritative sources of knowledge about topics like borders and place names. With a global audience, Google’s products pragmatically deviate from this tradition by inviting users to participate in knowledge production and tailoring knowledge to local audiences rather than presenting one single vision of the world (McLaughlin, 2008). In practice this means that borders and place names may change on the map depending on where they are accessed. For example, the boundaries of the contested Kashmir region located between India, Pakistan, and China are drawn differently in Google Maps depending on the origin of a user’s IP address (Dominguez, Hurt, Wezerek, & Zhu, 2014). The Crimean peninsula is another contested territory whose borders change depending on whether you are viewing Maps from the United States, Russia, or Ukraine.
The existence of multiple truths for different audiences may be a pragmatic move on Google’s part in terms of not upsetting local populations, and therefore being allowed to continue to do business in nations such as China, but it deviates from geographic and cartographic convention. It also leads to tensions between nations and in some cases has inflamed existing international conflicts (Gravois, 2010). Naturally, this issue is larger than Google’s specific practices and speaks to the interconnected nature of human existence today, but it also highlights some of the modern challenges that NeoGeography, NeoCartography, and their practitioners face.
A good example of the positive influence of NeoGeography and NeoCartography is what is known as crisis mapping. In online crisis mapping, volunteers search and process data collected from individuals via mobile phone, e-mail, and social networks such as Facebook and Twitter; then place the information into an online mapping interface. The information presented as a map mashup of multiple data sources could be produced a continent away, yet still communicate what is most urgent for local responders. The immediate consumers of this geographic information are disaster-relief workers, provided with exact coordinates to direct them where to go and images to prepare them for what to expect. An example is the rapid response teams from the GIS Corps who mapped the human impact of a massive 2013 typhoon on islands in the Philippines (Joyce Monsees, personal communication, Nov. 11, 2013).
These practices have had a direct, positive impact on human lives through disaster response. Our past and present reliance on print and digital maps, as well as geospatial technology to navigate and communicate, extends locally to globally in both scope and purpose. This underscores the fact that we are immersed in a global geospatial revolution that is ubiquitous and invaluable. Crisis mapping efforts exemplify NeoGeography, the blending of communicator and consumer.
Given the long history of cartography, map caretakers likely existed for millennia. However, map librarianship as a professional Library and Information Science (LIS) career track is a 20th-century phenomenon. The demand for map library collections and librarians was evident with improved map making and printing techniques as well as greater interest in geography given two World Wars, ease of travel, and globalization of information and business. What really filled most library collections was the plethora of military maps created by 1945. This was followed by an enormous volume of print maps resulting from the USGS program to map the nation with large-scale maps at a 1:24,000 scale produced from 1947 to 1992 (Cooley, Davis, Fishburn, Lestinsky, & Moore, 2011). This U.S. topographic map series was distributed for free to all designated libraries participating in the Federal Depository Library program (Federal Depository Library Program, 2013). Knowledgeable map librarians were needed to classify and catalog these collections and help patrons, since public access to maps in depository libraries is required by the government (Federal Depository Library Program, 2014). Although there were exceptions of some academic libraries, these map collections were rarely classified and cataloged, which was primarily due to a scarcity of LIS map courses and librarians who were trained in map cataloging.
Without geo-literacy, librarians lack experience and have treated maps as the problem children of the collection. This was the belief of Walter Ristow who passed away in 2006 at age 97. He has been called the most influential figure in U.S. map librarianship. While Ristow was a prolific map librarian scholar and did much to advance the field, librarians were slow to provide needed technical, reference, and instructional services in the library. Historically, Larsgaard (1998) explained that "in the early 1900s, most spatial-data collections were administered by persons with varied academic and professional backgrounds, few of whom had any professional training in library science" (p. 297). Larsgaard believed that these librarians became caretakers who were expected to develop, describe, classify, and catalog map and geospatial collections that refused to conform to the traditional procedures in cataloging and filing for text-based books and journals, with the exception of an atlas.
Ristow (1980) suggested difficulties in processing and promoting did not lie with the maps but rather a lack of parental understanding. Larsgaard (1998) affirmed this when she described how librarians often gained the title of map librarian in the late 20th century, as “anyone who became ‘stuck with the maps’ (and it was often so expressed) either was lowest on the totem pole, or had made the mistake of not being at the meeting where the issue was decided" (p. 298). These fortuitous map librarians were tasked with caring for spatial-data collections, but likely had neither geoscience educational background nor a formal introductory course specific to map resources and services as library students.
Today, the demand is for the geo-literate librarian who would combine knowledge of basic map and spatial-data concepts with a solid background in instruction services, reference services, collection development, classification schemes, and cataloging systems. This is NeoMap Librarianship. It would include both traditional map and the new geospatial librarians who vary in the level of geo-literacy, but coexist in the 21st century. Librarians are living the global geospatial revolution as they interact with the world of geospatially enabled technologies, the Internet, and user-friendly cartography tools. As such, in spite of some librarians lacking formal background in geography and cartography, these NeoMap Librarians may be proficient using web-mapping tools, open-source data, and GIS technologies. Virtual globe, map, satellite imagery, and aerial photography are being heralded as poster children of Web 2.0 by Patrick McGlamery, a seasoned academic map librarian, who used Google Map and Google Earth as examples (as cited in Abresch, Hanson, Heron, & Reehling, 2008, p. ix). It is the NeoMap Librarian who may turn map resources from problem children to valued resource collections.
NeoMap Librarianship is defined in part through job advertisements. Job descriptions can be specific to map cataloging or acquisitions specialist for Sanborn Fire Insurance maps. However, other job announcements call for a geospatial librarian, listing qualifications such as a graduate degree in a geoscience-related discipline and academic background plus demonstrated abilities in GIS. These qualifications are in addition to or in lieu of the Master in Library Science (MLS) from an American Library Association or ALA-accredited LIS degree program.
Prior to 1945, approximately 30 libraries had full-time map librarians (Hanson & Heron, 2008, p. 96). Today, the Map and Geospatial Information Round Table (MAGIRT), a professional map librarian organization under the ALA has nearly 300 members as of Dec. 2014 (MAGIRT, 1996–2016; J. Clemons, personal communication, Feb. 26, 2015). In 2008, the first technical textbook devoted to integrating GIS into academic library services was written by Abresch et al. (2008), all of whom are librarians with geography and cataloging specialty backgrounds. Like-minded, Eva Dodsworth (2012) believed that library professionals should upgrade geo-literacy skills; she wrote the first book to teach GIS and mapping skills to non-GIS librarians. She described her book as a “training package for all library staff interested in gaining the most up-to-date and relevant mapping skills” (Dodsworth, 2012, p. xi).
This book strives to provide a pragmatic guide written for the community of LIS students and working librarians who want to reach a higher level of geo-literacy. This book may inform the community of geography and geospatial savvy graduates to better understand how their knowledge could be enhanced with library skills to meet the job description expectations for working in libraries. As NeoGeography and NeoCartography have become commonplace, it is time library school programs support NeoMap Librarianship and join the Geospatial Revolution.
Spatial thinking is a type of reasoning or literacy that can be used for navigating the world. In this context, it is referred to as geospatial thinking or geo-literacy. Maps are the graphical tools that convey this location-based information and geo-literacy, an essential concept for interpreting and using maps. Being geo-literate goes beyond traversing points A to B, and cartographers create many different map types that broadly fall into two categories of reference or thematic maps. Reference maps show where things are and thematic maps communicate a specific message about the world. Some of the mapping techniques and map types that librarians will encounter are defined and illustrated in this chapter.
Spatial thinking; Geo-literacy; Geospatial; Thematic maps; Reference maps; Choropleth; Cartogram; Terrain; Mapping data; Aeronautical charts; Cartogram; Raised relief model; Atlas; Gazetteer; Geologic maps; Historic maps; Physiographic maps; Topographic map; Planimetric; Globe.
What does it mean to think spatially? Our days are filled with thoughts in a variety of domains, some focused on using numbers, some with words, and others with music or the visual arts. But we also think spatially every day. The National Research Council (2006) describes spatial thinking as a way that “…uses representations to help us remember, understand, reason, and communicate about the properties of and relationships between objects represented in space, whether or not those objects themselves are inherently spatial.” [Emphasis preserved] (p. 27). These skills include “concepts of space, tools of representation, and processes of reasoning” (p. 12). Concepts of space are the components that separate spatial thinking from other domains such as mathematic or language-focused reasoning skills. Obviously, spatial thinking plays a role in our navigational activities, but in reality it goes much further as many of our other modes of thinking are influenced by spatial elements. For example, driving to work is clearly related to thinking spatially, but so is interpreting a spreadsheet on a computer. Working on mechanical problems, organizing your desk, and moving through the menu of a computer program are all tasks that require the ability to think spatially. It is an important skill in our lives, and one that directly concerns the field of geography.
What about geo-literacy then? We know what literacy is in the context of the written or spoken word, but what does it mean in the context of spatial thinking? Certainly there is an element of knowing where things are, but geography involves so much more than memorizing state capitals. The term geo-literacy is used by the National Geographic Society to “describe the level of geo-education that we believe all members of 21st-century society will need to live well and behave responsibly in our interconnected world” (Edelson, 2014). It is broken down into three separate components, starting with interaction or “how our world works.” This component relates to modern science’s descriptions of the functioning of natural and human systems. Secondly, implications or “how our world is connected” deals with the myriad links between these systems and how they affect one another. Finally, “how to make well-reasoned decisions” describes a process of decision-making that factors in these systems and their connections to make intelligent choices that benefit humanity while minimizing the potential negative impacts of the decision.
In today’s world, being geo-literate and having the ability to think geospatially has become more crucial than ever before. The level of understanding regarding our impact on the natural world is much greater than in decades past, and leveraging geo-literacy is essential to effective decision-making. This will help to improve the quality of lives around the world while reducing waste and protecting environmental conditions. Fortunately, geography is well-suited to help in this regard. With geography’s holistic approach to study, it projects a big-picture view of the interconnected nature of the world. Tools such as GIS, remote sensing, and maps are core components of how librarians can instruct and empower geo-literacy to these ends.
Maps are graphical tools for conveying spatial knowledge. They are a cartographer’s attempt to communicate information about the geographic milieu to an audience (Robinson & Petchenik, 1975). In this way maps provide consistency to our world view, attempting to unify our vision of the spatial configuration of features. A broad definition of the map is that they are graphical scale models of spatial concepts (Merriam, 1996). These concepts might represent physical or cultural features, or they might be abstractions that have no physical presence (Dent, Hodler, & Torguson, 2009). The format may be physical or virtual such as a paper road map vs. a digital GPS unit. Regardless, by connecting data to locations, we can communicate information about spatial patterns, track changes on the landscape, and even predict the outcomes of our decisions.
Colloquially, the term map can be used to describe many different objects, but traditional maps are required to include a few elements to differentiate them from figures, diagrams, or drawings. Different sources discussing cartography will disagree as to what specifically is required to make a complete map, but the most essential are a notation of scale, an indication of the direction of north, a legend, and citation information. If someone were to draw a map of their neighborhood, it would probably lack these elements, but it would still be acceptable to refer to it as a mental map, or just a map. Other map-like information lacking these essential components might be better described as figures or diagrams, but keep in mind that not all maps will fit the popular conception of what a map looks like.
Some maps, such as atlases or road maps, can be described as reference maps. These are general maps concerned with describing a broad overview of the location of features on Earth. While all maps are concerned with the spatial layout of phenomena, many maps fall into a different category, known as thematic maps. These maps explore specific topics or themes of data. Reference maps exist to tell us where things are, while thematic maps exist to communicate a specific message about the world. Thematic maps use general reference information to frame their messages, but only inasmuch as it is useful for putting thematic information in its appropriate context. For example, a map showing population density per county in the state of Tennessee will include county boundaries, but likely will not show every city, waterway, and road in the state. An overload of information can make things visually confusing, potentially to the point of obscuring the intended message. Therefore, on a thematic map, information not directly related to the message is generally not included.
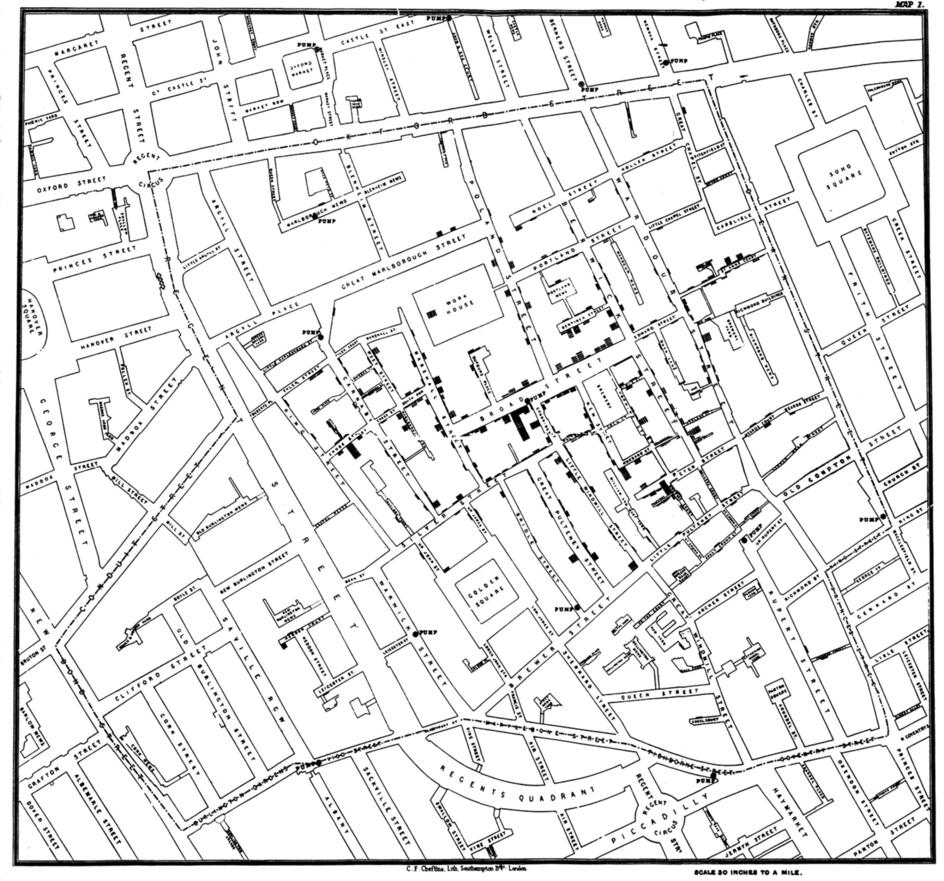
One of the most famous examples of a thematic map is the cholera map based on John Snow’s research during an 1854 outbreak in London, see Fig. 2.1. Snow was convinced that contaminated water was the vector by which the disease was being spread, and his geographic analysis is credited with helping to end the outbreak, as well as giving rise to the field of epidemiology (Vinten-Johansen, 2003). While the map in Fig. 2.1 uses general reference information in the form of London streets, the primary purpose is to present medical data in support of the contaminated water theory. Many thematic maps follow this approach, and can be considered tools for answering questions about the nature of the world. A more modern example could be a thematic map exploring poverty rates at the county level in the United States. This map would not only answer questions such as “where does poverty exist?,” but would also act as a tool for confronting the issue. Just as Snow’s cholera map indicated a public well to be the source of the outbreak, analyzing patterns of poverty could help to better understand how spatial factors may play into poverty and how we might confront the issue in an effective manner.
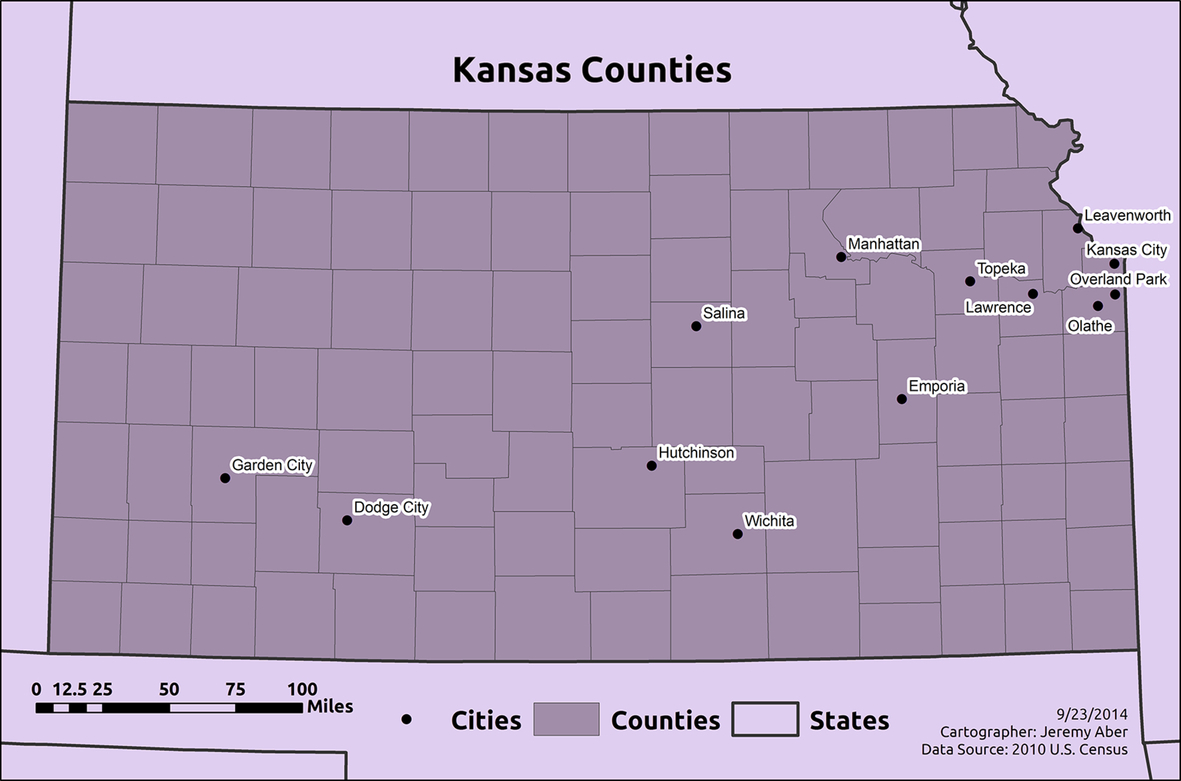
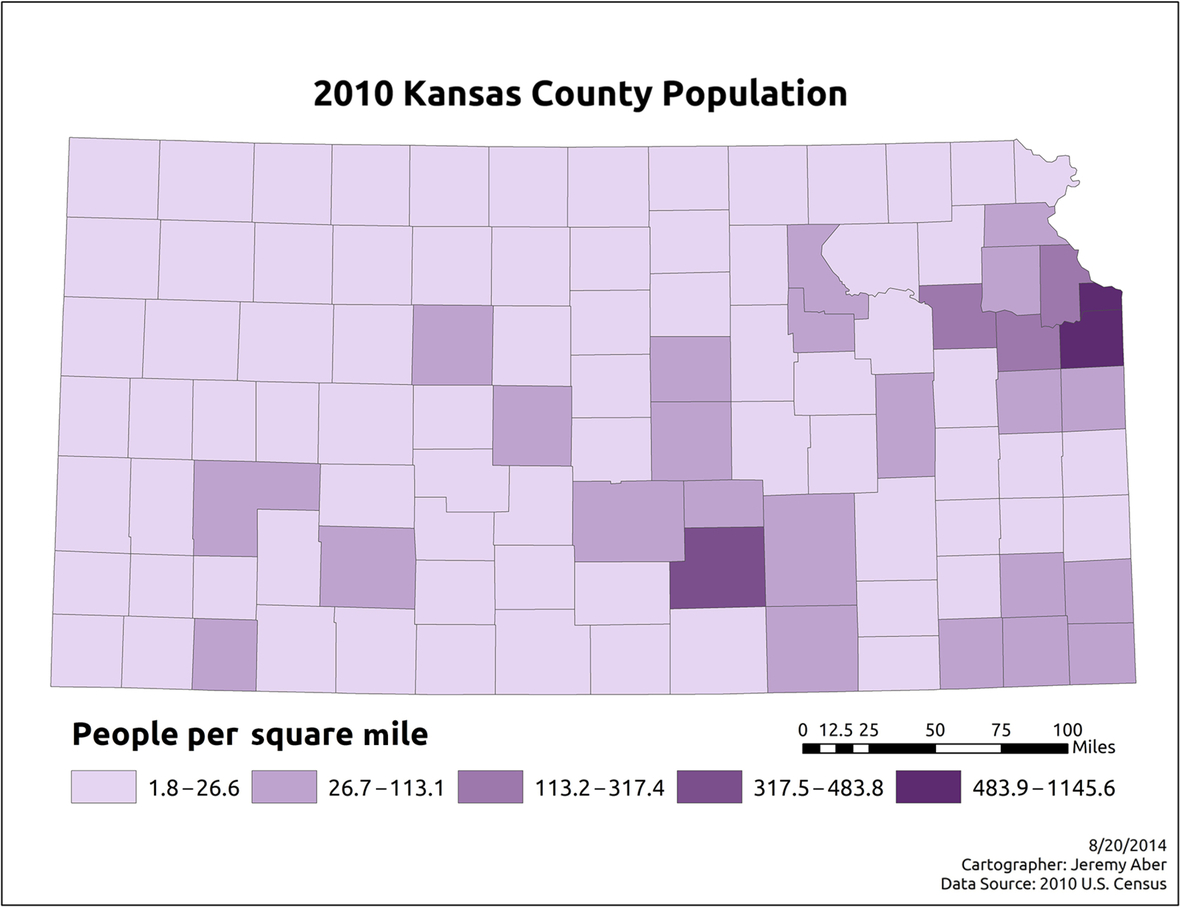
Cartography has developed many approaches to visually representing spatial information over the past few thousand years. Both reference and thematic maps use various techniques for presenting spatial information, although thematic maps often use visualization techniques that deviate from a typical reference map. Some of the more commonly used thematic mapping techniques are described here. In order to explore these visualization approaches, the 2010 U.S. Census Bureau’s county population figures for the state of Kansas are employed. By using the same data in each map, the different symbology techniques can be more easily compared to one another. Fig. 2.2 shows a reference presentation of the state, with counties and major cities represented, but without any population data included. While visualization techniques are discussed here, a more detailed look at cartography and map conventions can be found in Chapter 3.
The name “choropleth” may sound intimidating, but it is a commonly used approach to representing spatial data that is intuitive for map readers. Other names for choropleth include shaded maps or enumeration maps. A choropleth symbology is a two-dimensional (2D) representation of a three-dimensional (3D) histogram, or statistical surface, of data. Imagine that our county boundaries are represented in two dimensions, while the height of each feature represents the number of people found in each county. Fig. 2.3 shows an example of this 3D data visualization. Note that while this may be a visually interesting image, it is somewhat difficult to interpret, as county boundaries are not always visible and high value counties obscure information behind them.
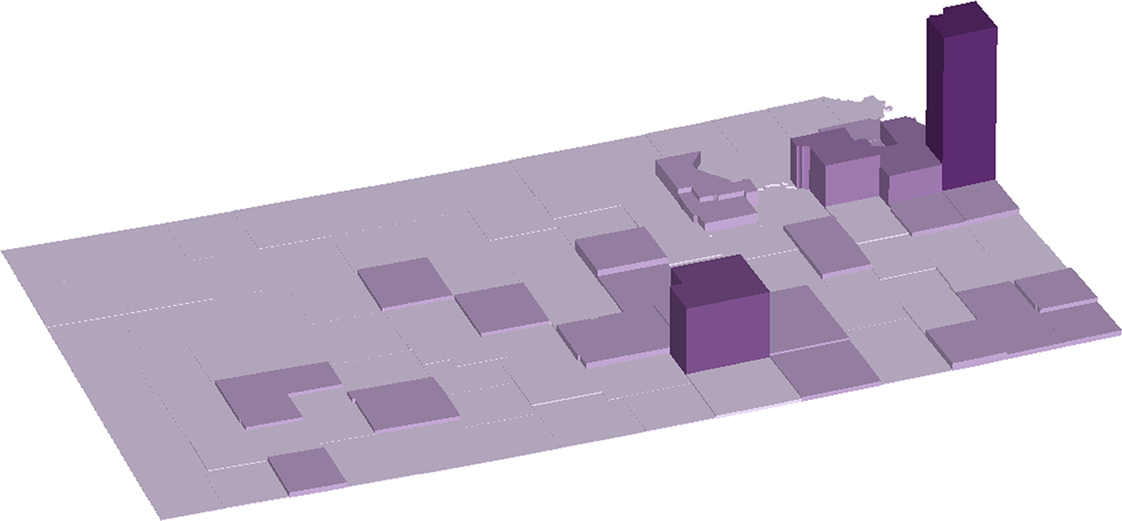
Fig. 2.4 shows a traditional choropleth symbology, with county populations broken down into five classes. In this case, a natural breaks approach has been used to generate the class breaks. While the classes still obscure some variability in the data, the patterns in population distribution are easier to read in this view. Choropleth symbology is popular for many thematic maps, as it is easy to interpret, can quickly expose spatial patterns in data, and is visually appealing. One word of note regarding choropleth symbology though, the data represented must always be a derived value, such as the people per square mile ratio in Fig. 2.4. Using an absolute values approach can give outlier values much more influence on the visual result and therefore a faulty impression of the actual data. For a longer description of the many ways in which data and map symbology can be manipulated, accidentally or intentionally, see Mark Monmonier’s excellent How to lie with maps (1996).
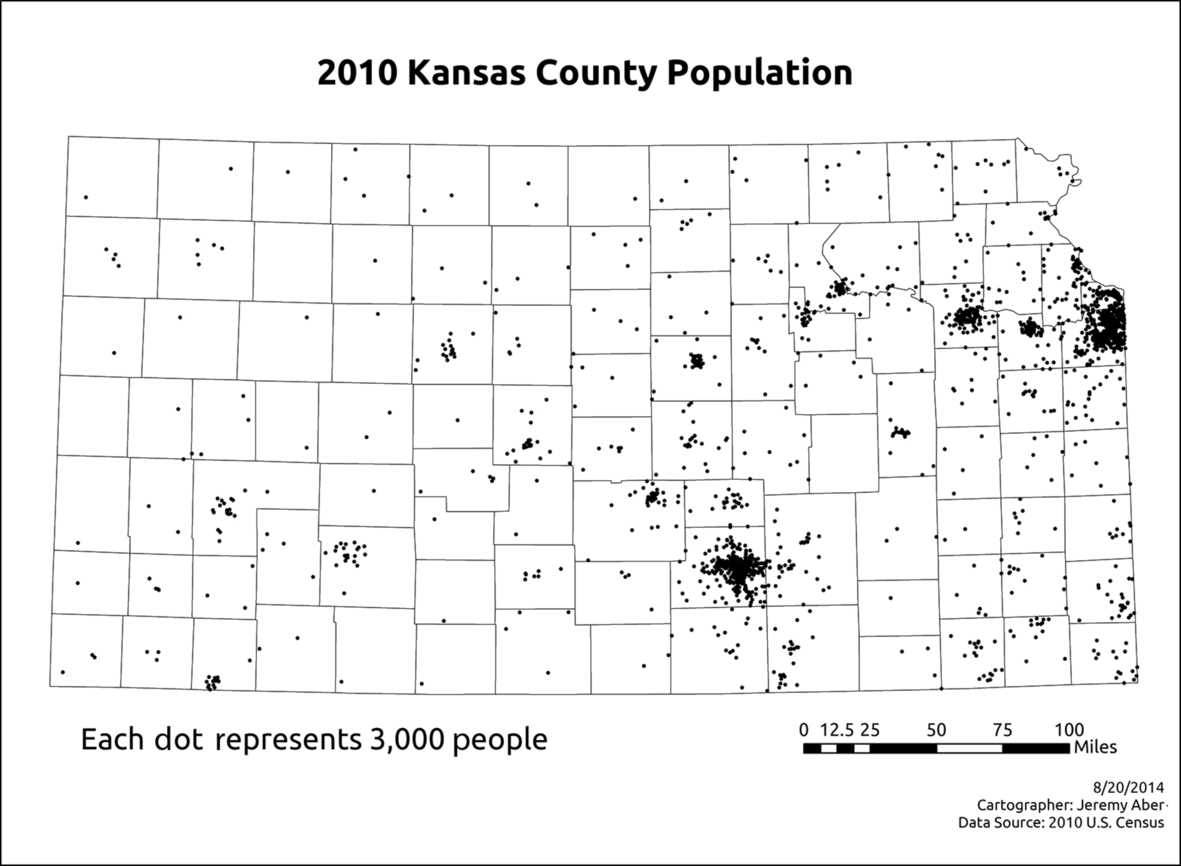
Another common map symbology approach is the dot density map. Instead of using colors to represent different classes of data, the dot density map simply puts a dot on the page for each unit of value. This has the benefit of not obscuring data points quite as much as the classes in a choropleth symbology, but it can also be misleading. The visual size of the dots is a major concern, as overlapping dots can coalesce into unreadable blobs. This is oftentimes unavoidable, but does decrease the map’s readability. Dot placement is also important. In an ideal dot density map, each dot would be positioned directly over the location of the feature represented, but this is typically not possible. In the example found in Fig. 2.5, U.S. Census blocks were used to give a relatively accurate approximate dot location, but the dots may not accurately represent the location of populations, especially in some of the more sparsely populated counties.
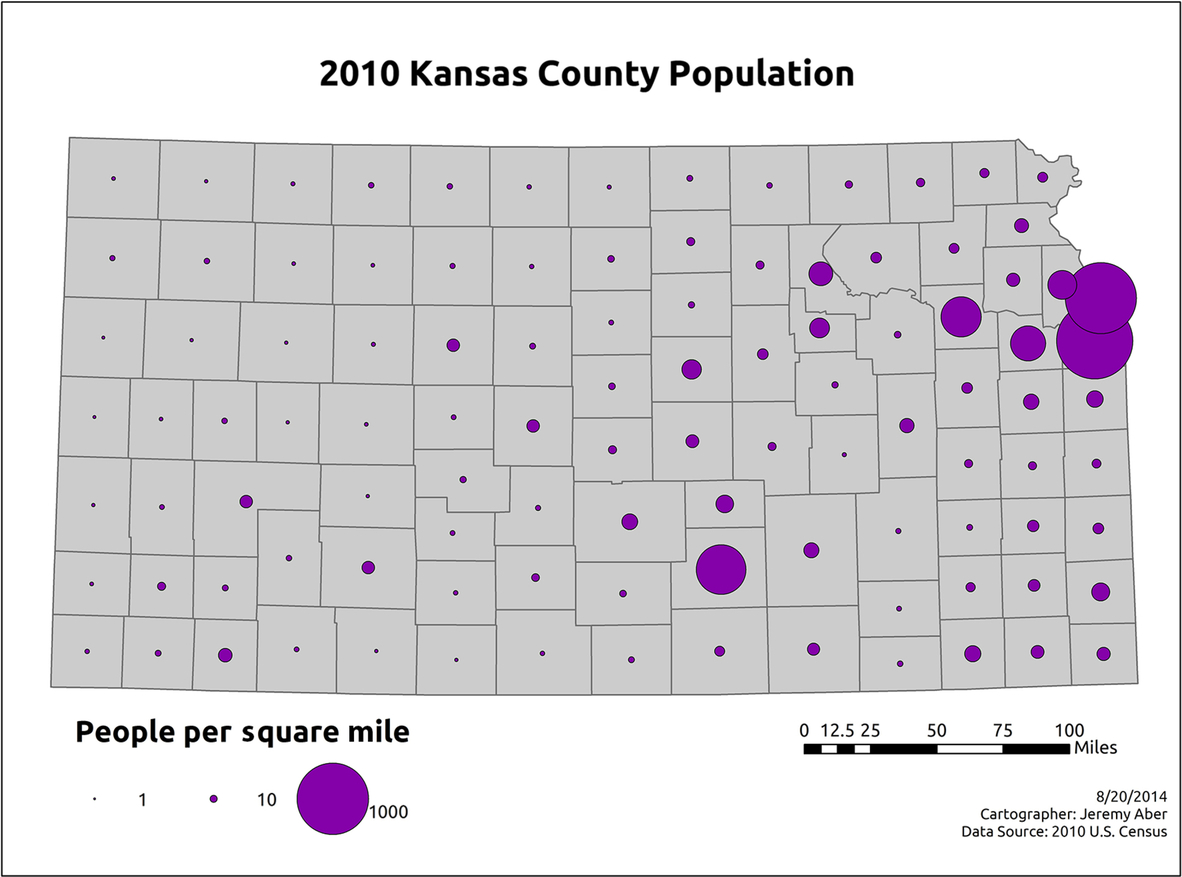
The proportional symbol map takes our population data and instead of changing colors, creates symbols with sizes that vary based on their values. These maps are relatively simple to interpret, but symbol overlap can be confusing at times. Fig. 2.6 shows an example of a proportional symbol map.
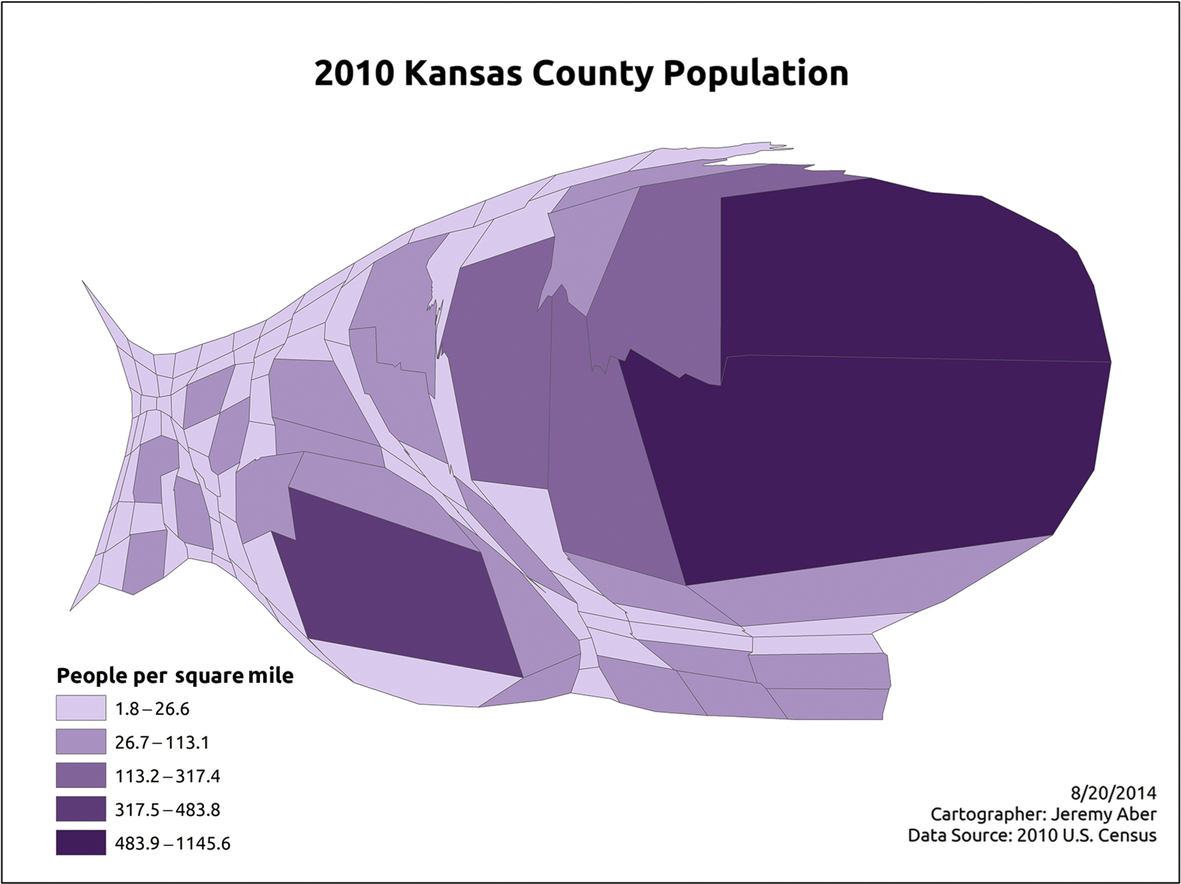
The cartogram is unique as a symbology approach, as it actually distorts the geometry of the underlying features in its representation of data. Cartograms can be visually dramatic, but they can also be difficult to interpret. For example, in Fig. 2.7 some of the smallest Kansas counties also have the largest population densities, so they dominate the layout. Other counties in the west with smaller populations become so tiny that they are difficult to read. Obviously, this approach to visualizing data renders the map useless as a source of navigational information, but at the same time it can also be a powerful method of presenting information. This technique is particularly good at showing disparities in values between areas.
Many maps represent geographic surfaces, often the physical elevation above sea level. This can also be a virtual elevation representing data values. Map surface information can be quite valuable, from topographic maps representing physical elevation to weather maps showing the distribution of barometric pressure in the atmosphere. Since maps are two-dimensional and elevation is three-dimensional by nature, multiple approaches to symbolizing elevation have been created over the years. Perhaps the most common is the use of isolines, referred to as contour lines in the context of surface elevation. Each line represents an elevation that is consistent across every point on the line. It is common to only label some of the contour lines and to have a declaration of the contour interval described in the legend; elevation can be found by counting the contours. Actual surface elevation at any point on the map exists somewhere within a range defined by the values of the two surrounding contour lines. The closer contour lines are to each other on the page, the steeper the slope of the terrain represented; anyone who has used a topographic map for hiking can attest to this valuable map information. An example of contour lines can be seen in Fig. 2.8A.
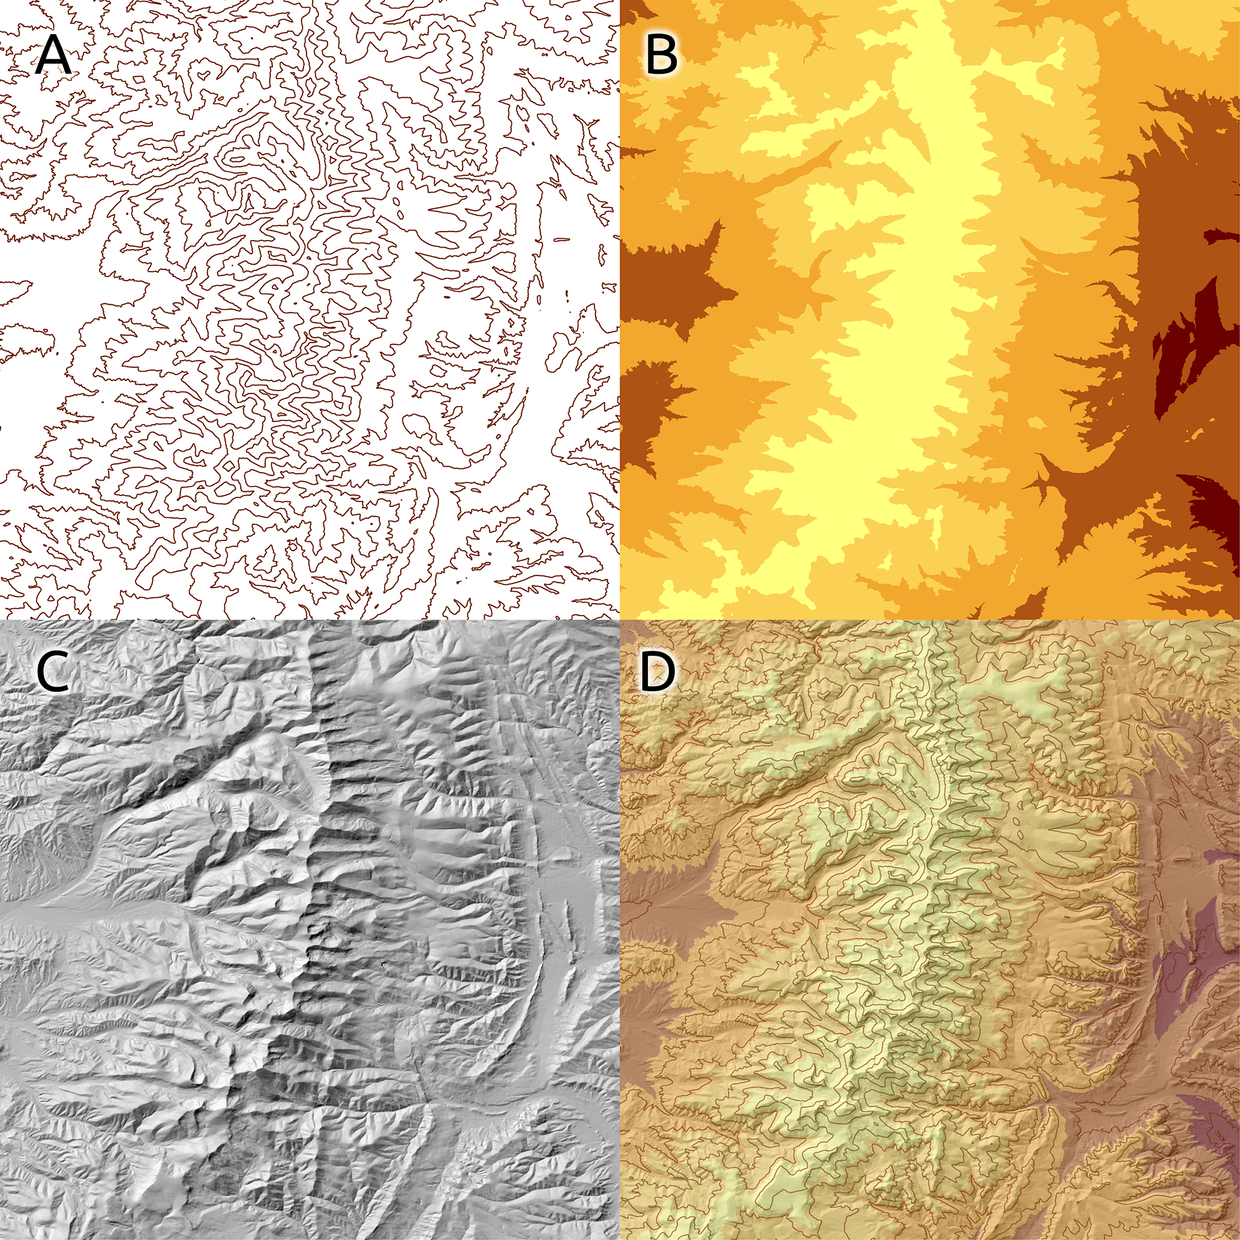
The use of color can also be applied in what is called a hypsometric tint. The elevation of the surface is broken down into ranges, and a unique color is applied to each range, as seen in Fig. 2.8B. A shaded-relief approach can be used to generate a sense of dimensionality to a flat surface. For this technique, a virtual light source is used to generate shadows based on the elevation of the surface, an example of which can be seen in Fig. 2.8C. Finally, multiple approaches are often combined to give a better sense of the terrain. This can be quite effective, as the reader will get the specificity of the contour line technique in addition to the more visually appealing and “three dimensional” approaches of the hypsometric tint and the shaded relief. An example of this combined approach can be seen in Fig. 2.8D.
While most maps inherently have a location-based component, there are many different types of maps to serve specific industries and messages or themes. Snow’s cholera map was both a location-based reference and thematic map that served a specific public health message and purpose. Some explorations within a particular field employ thematic maps combined with change over time; for example, comparing topographic maps over the decades could show the growth of an urban area. These maps may also use various symbology techniques to further emphasize their message. In any case, different map type examples are discussed below. While this is in no way an exhaustive list, it will describe some of the more common map applications in the natural, political, and social sciences. Knowing about these types of maps will help in managing collections and pointing patrons to resources that fulfill their needs.
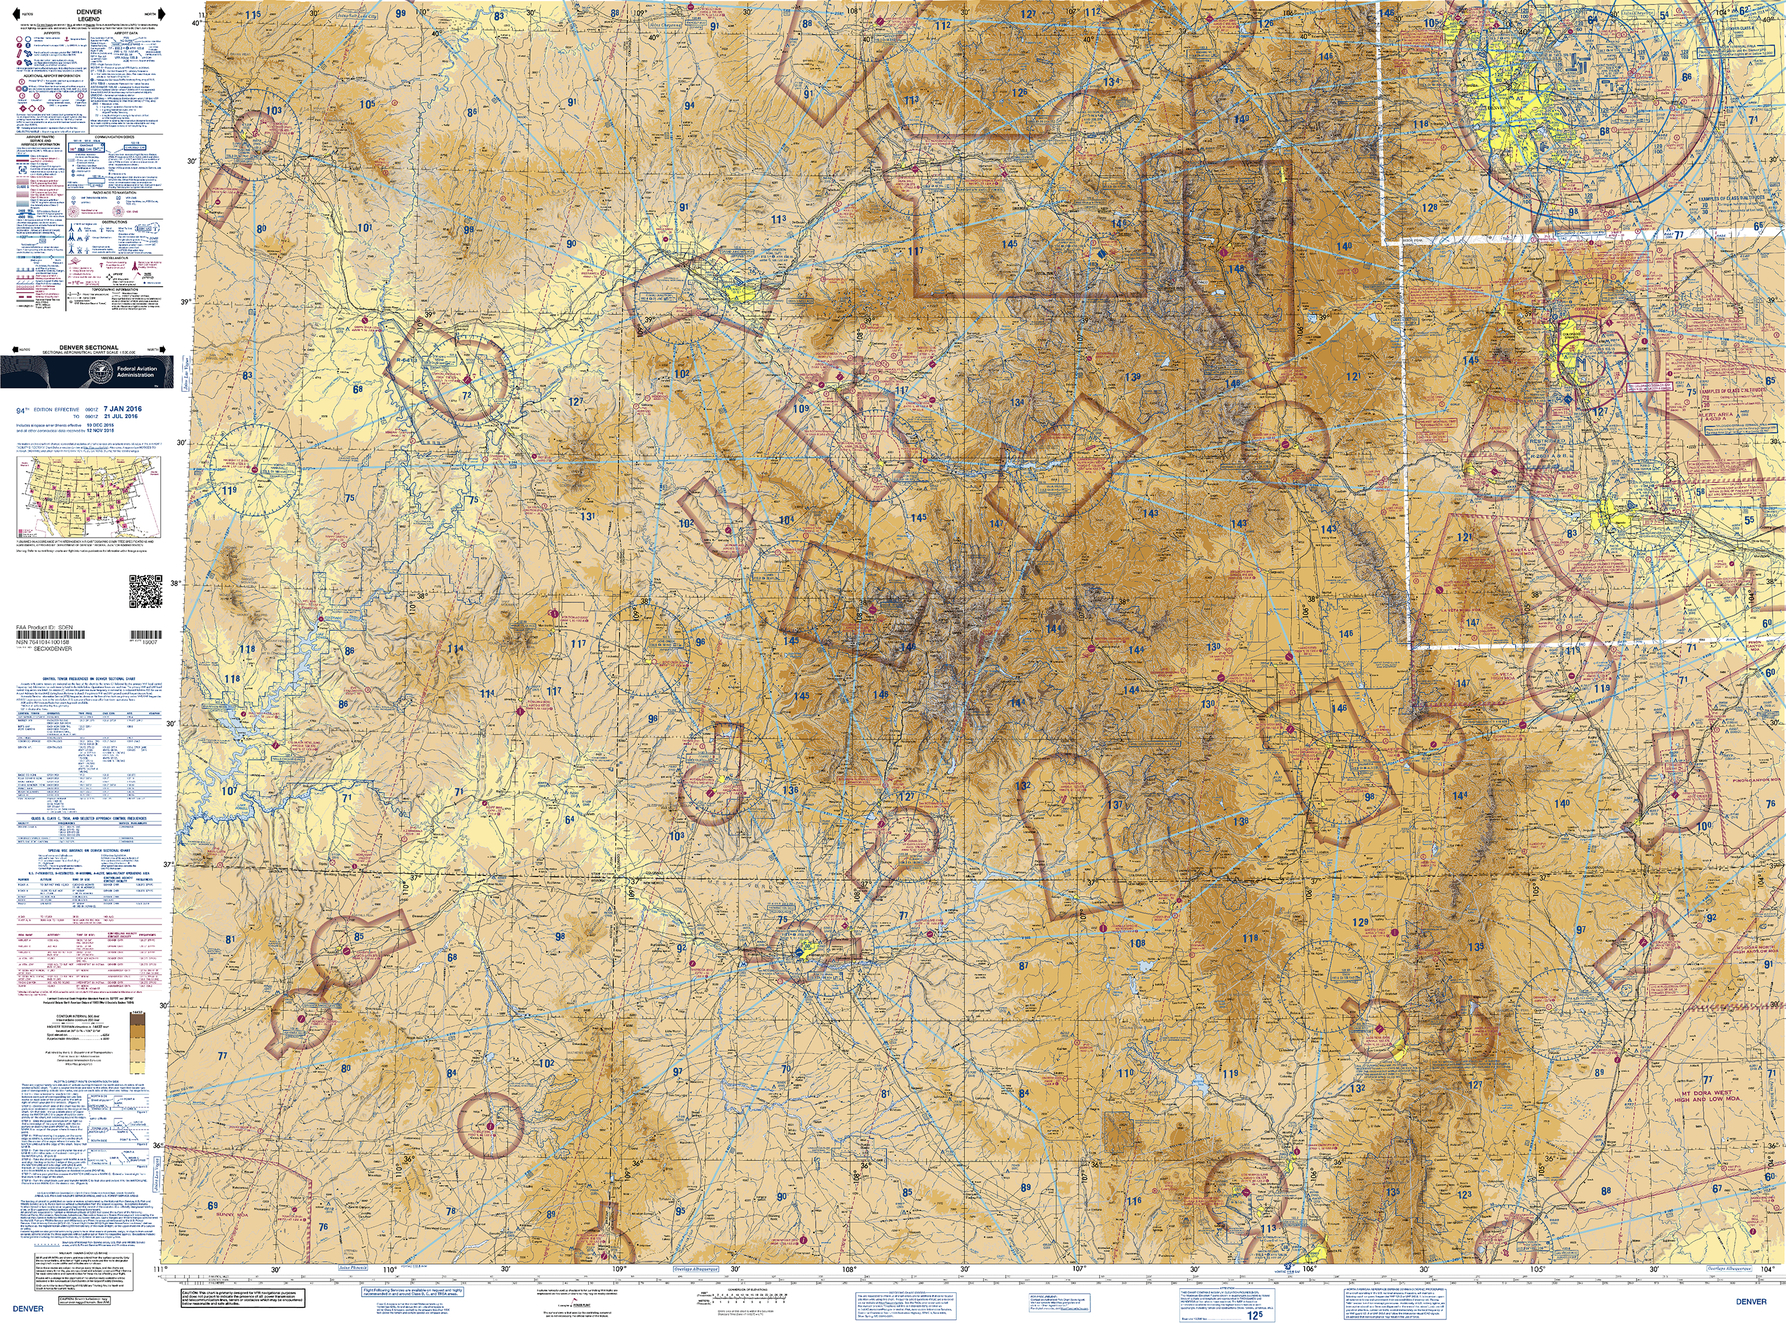
An aeronautical chart focuses on the information necessary for the navigation of aircraft. In the United States, the Federal Aviation Administration (FAA) produces multiple maps showing information such as terminal procedures and airport diagrams. These charts are used for flying both under Instrument Flight Rules (IFR) and Visual Flight Rules (VFR), an example of which can be seen in Fig. 2.9. FAA charts can be freely downloaded in a digital format from their website (Federal Aviation Administration, 2016a).
An atlas is a collection of maps, and countless atlases have been produced over the years. Library collections are likely to have an atlas or two on hand, and in the United States, that atlas may well be one or more of the editions of the National Atlas of the United States. This atlas series was first published as a print edition in 1874 covering the 1870 census (Internet Archive, 2014; U.S. Geological Survey, 2015a). Later editions covered the census through 1920. After a fifty year gap, it was again printed in 1970, this time as a 400 page edition with maps covering all manner of topics. In 1997, the National Atlas was re-envisioned as a digital edition overseen by the U.S. Geological Survey (USGS), with all maps available through a web interface. This version was retired in 2014, but digital maps from this collection are still available on The National Map Small-Scale Collection website (U.S. Geological Survey, 2015b). At this time, the National Atlas has merged with The National Map (Newell, Donnelly, & Burke, 2014). As such, The National Atlas data can be accessed and downloaded from The National Map (U.S. Geological Survey, 2015c) and Earth Explorer (U.S. Geological Survey, 2016a).
The gazetteer is the counterpart to the atlas, providing an index to the features included in an atlas, cross-referenced so that the reader can find which map contains a specific feature. Gazetteers often include information regarding features such as location and relevant demographic information. An essential service in a print era, the gazetteer has become less prominent in today’s paradigm of digital searching. With a printed atlas, finding a geographic feature was often impossible without prior knowledge or the use of a gazetteer; now locations are a quick Google search away. Despite this, the gazetteer survives in multiple forms, both print and digital. Modern printed atlases still contain gazetteer information, and online versions exist as a source of authoritative place names. Examples of online gazetteers include digital files describing features in the United States available for download via websites at the U.S. Census Bureau (2015) and the U.S. Board of Geographic Names (U.S. Geological Survey, 2015d). One worldwide gazetteer is the U. S. National Geospatial-Intelligence Agency’s GEOnet Names Server (GNS), which provides both text and map search options (National Geospatial-Intelligence Agency, 2016). Other national gazetteers include the Canadian Geographical Names (Natural Resources Canada, 2014), Gazetteer of British Place Names (The Association of British Counties, n.d.), the Gazetteer for Scotland (University of Edinburgh & Royal Scottish Geographical Society, 2016), The National Gazetteer of Wales (2001), Gazetteer of Ireland (Haug, 2007), as well as an Antarctic gazetteer (U.S. Geological Survey, 2013).
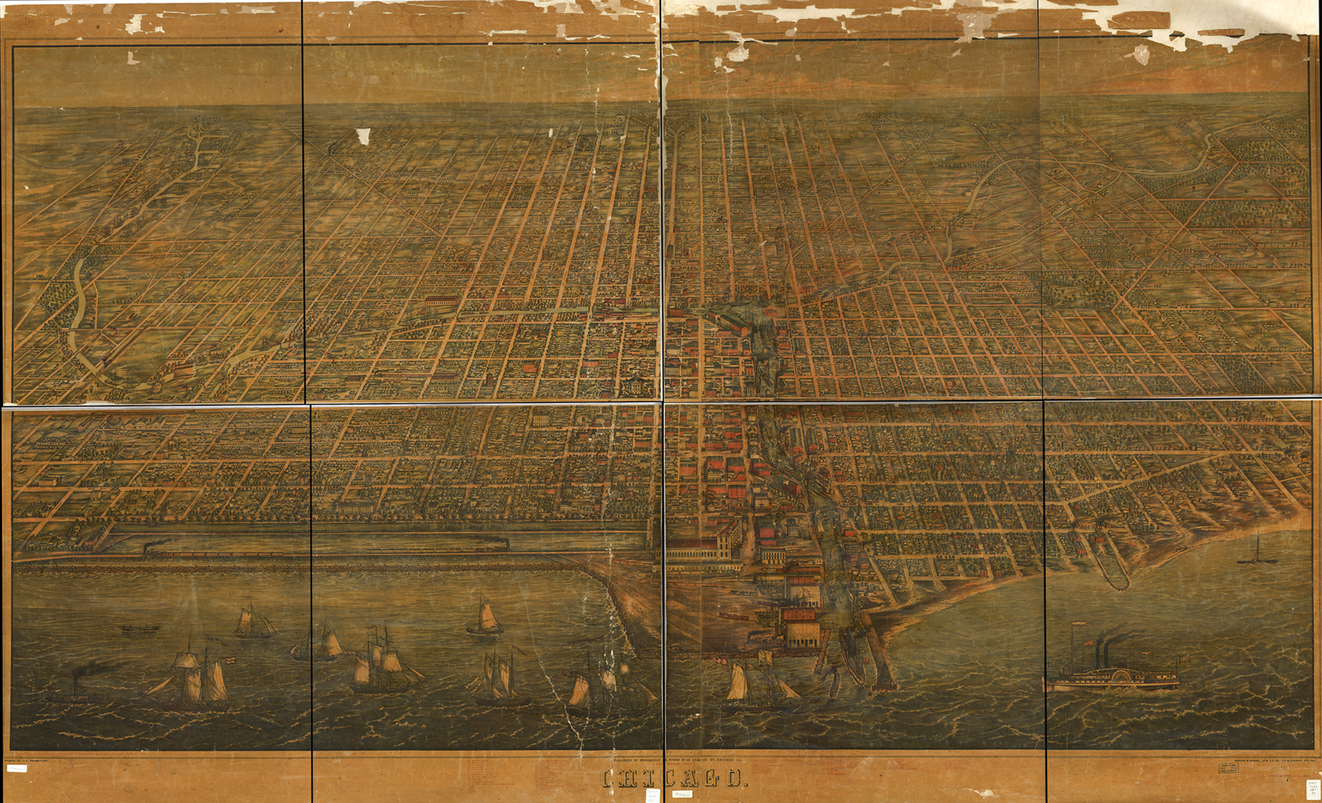
A bird’s-eye view map represents the land as if viewed from the panoramic vantage point of a bird mid-flight. This map style was quite common in the United States and Canada during the 1800s for representing cities of all sizes (Short, 2003). Traditionally, these maps were produced by an artist working from street plans. Road layouts would be drawn in perspective then filled in with details of the buildings and features found in the city. Because this map style was so popular, many of these maps exist today as records of what cities and towns were like at the time. Fig. 2.10 shows an example of this style of bird’s-eye view map of Chicago, circa 1857. Today, the bird’s-eye view survives in digital form. Platforms such as Google Earth, Google Maps, Bing Maps, and others provide perspectives similar to the traditional bird’s-eye view map, albeit interactive ones. These services typically combine aerial imagery and three-dimensional models of buildings and other structures to allow users to explore urban areas from the bird’s-eye perspective.
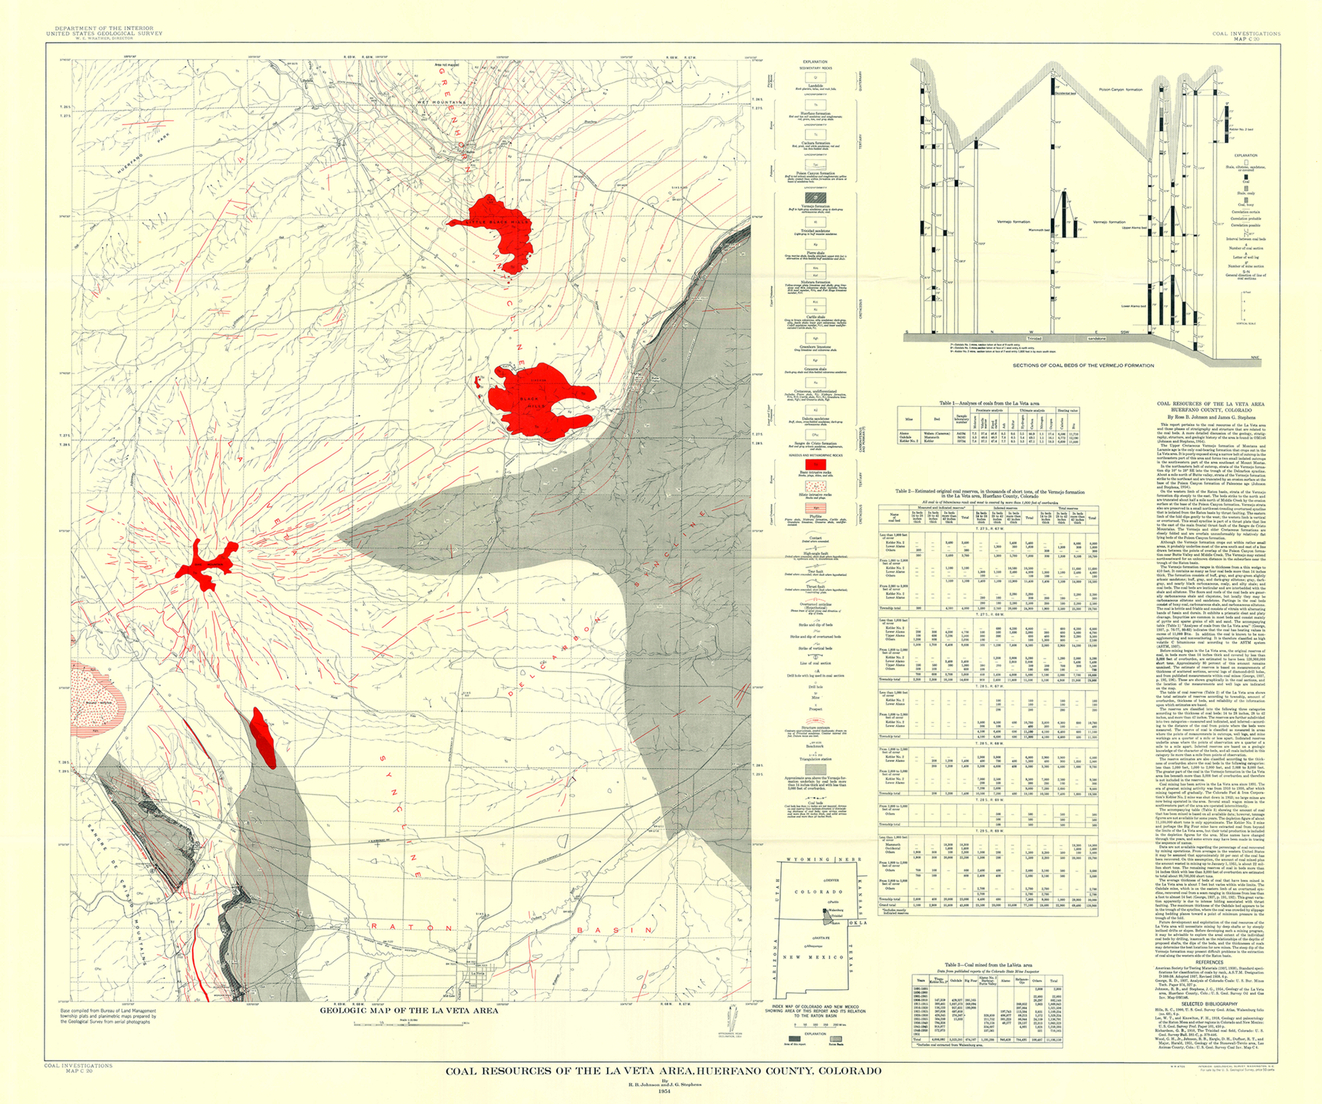
The USGS has long mapped fossil fuel resources and reserves in the U.S., with oil and gas map series beginning in the 1940s, and coal maps in 1950 (U.S. Geological Survey, 2016b). Today the USGS Energy Resources Program is responsible for tracking the state of energy resources in the U.S., including coal, oil, and natural gas quantities and quality. Current information can be downloaded in report or digital GIS formats via the USGS Energy Data Finder (U.S. Geological Survey, 2016c). However, older paper map data can still be found digitally online and in some collections as hard copy including a folder and supplementary information (U.S. Geological Survey, 2016b). An example of one of these older paper maps showing a coal investigation in Colorado can be seen in Fig. 2.11.
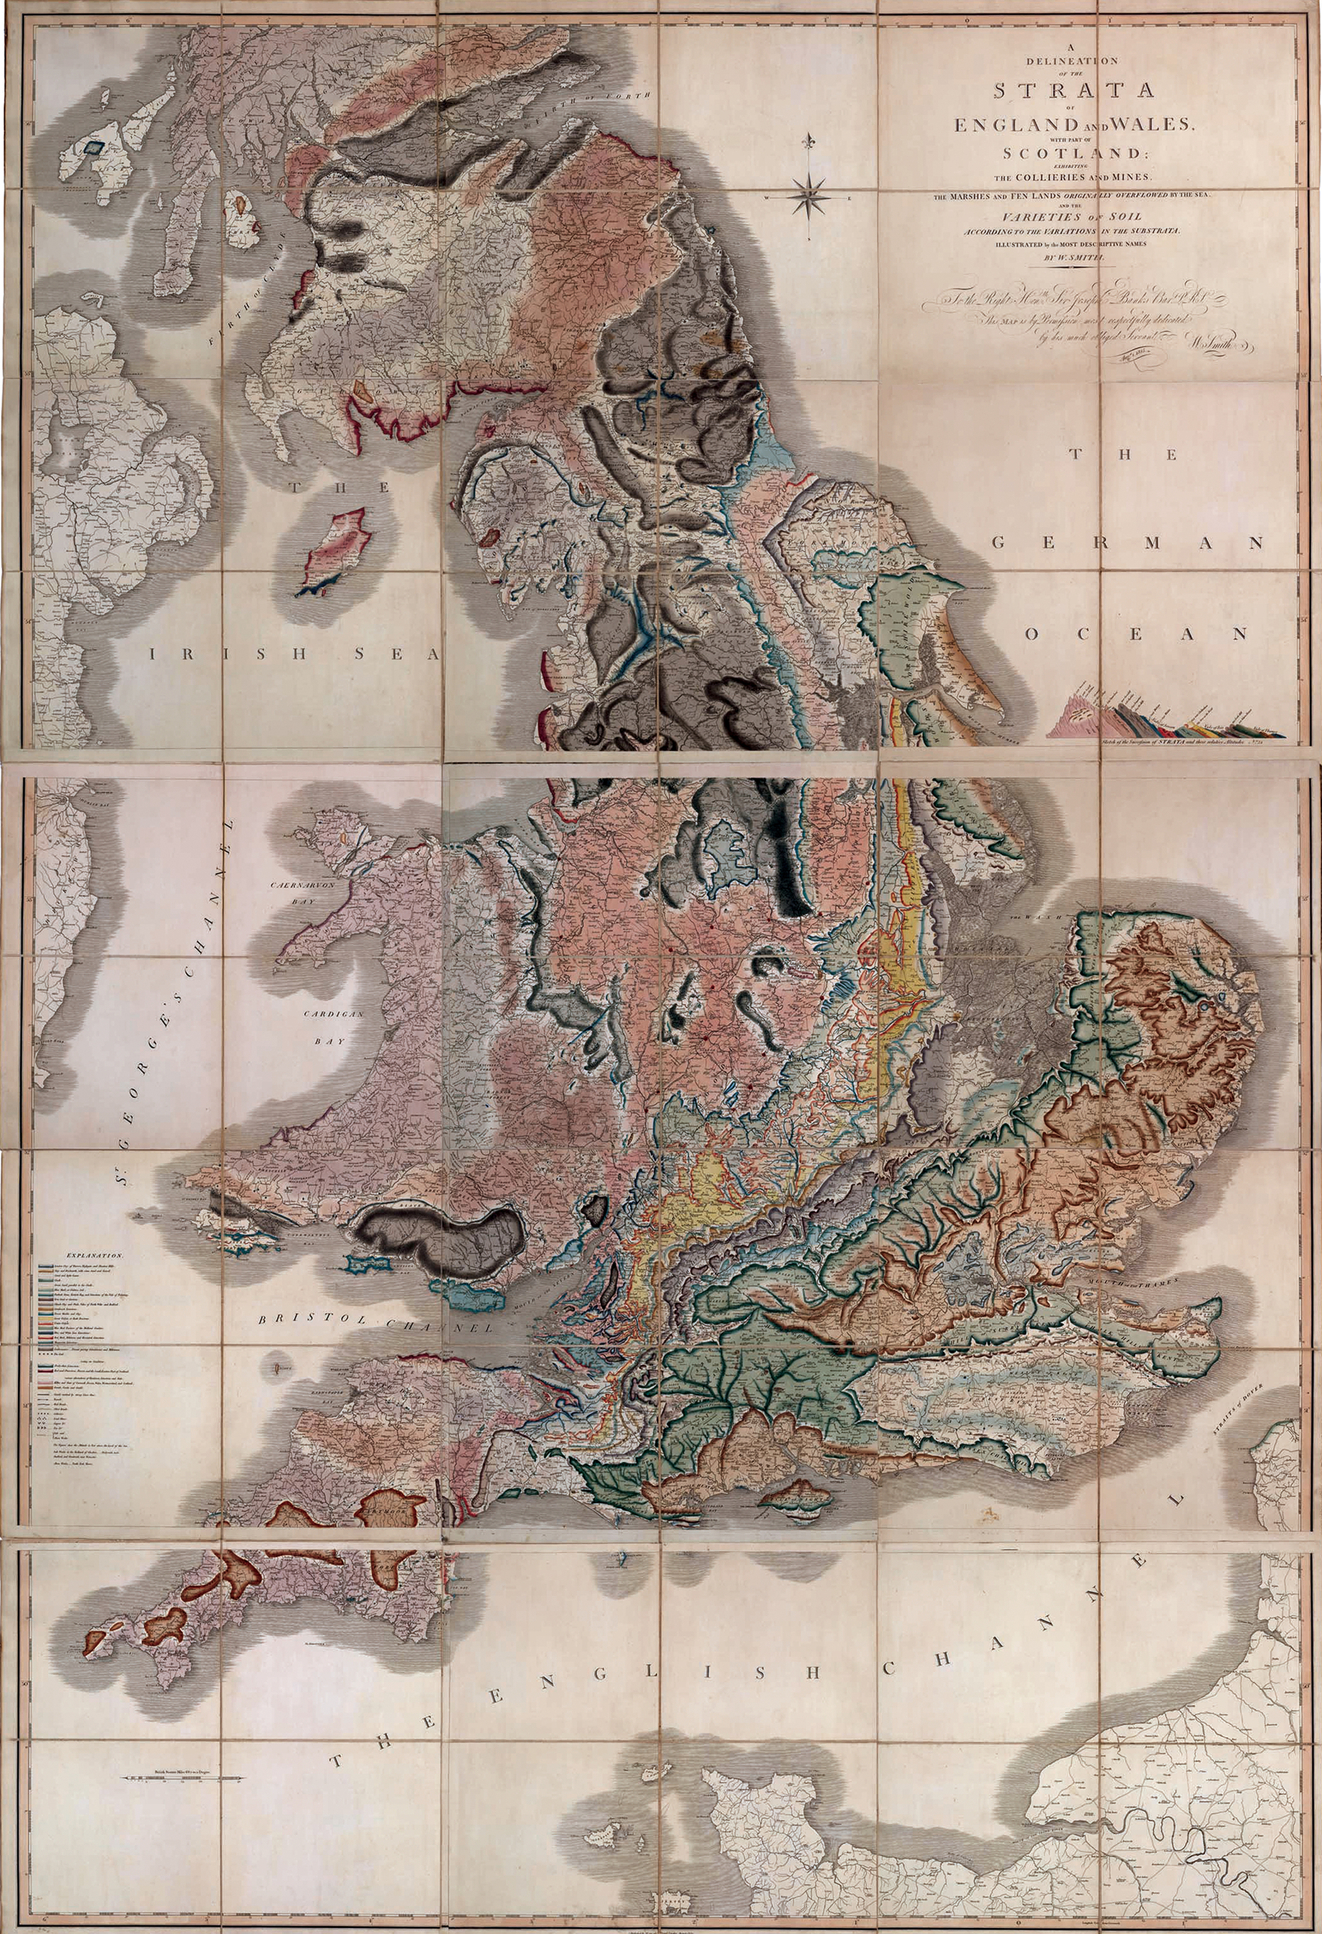
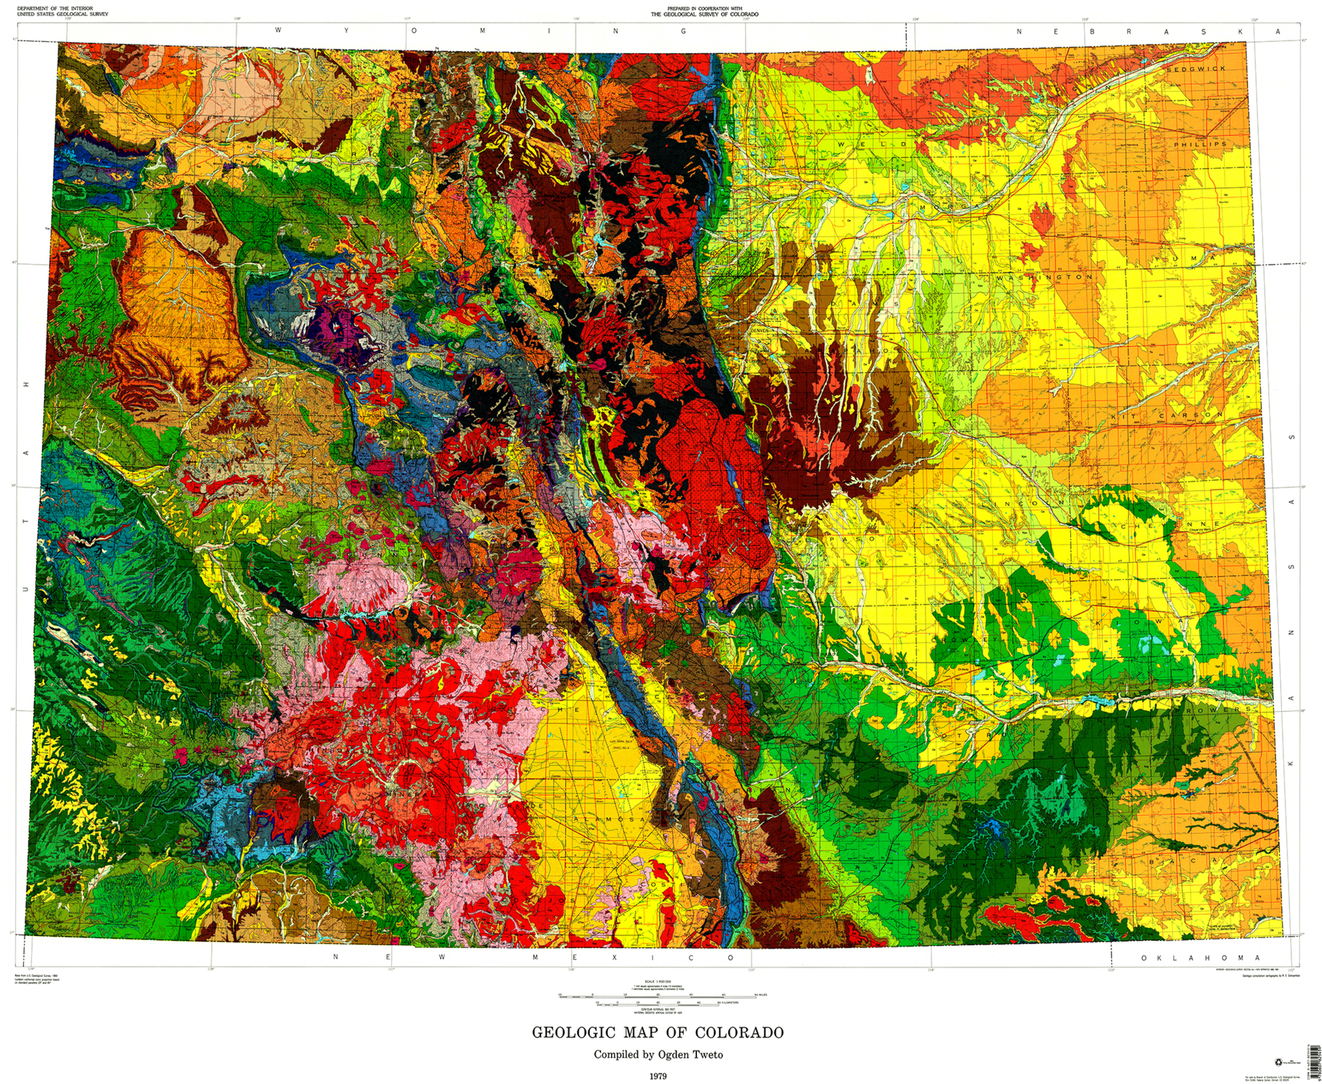
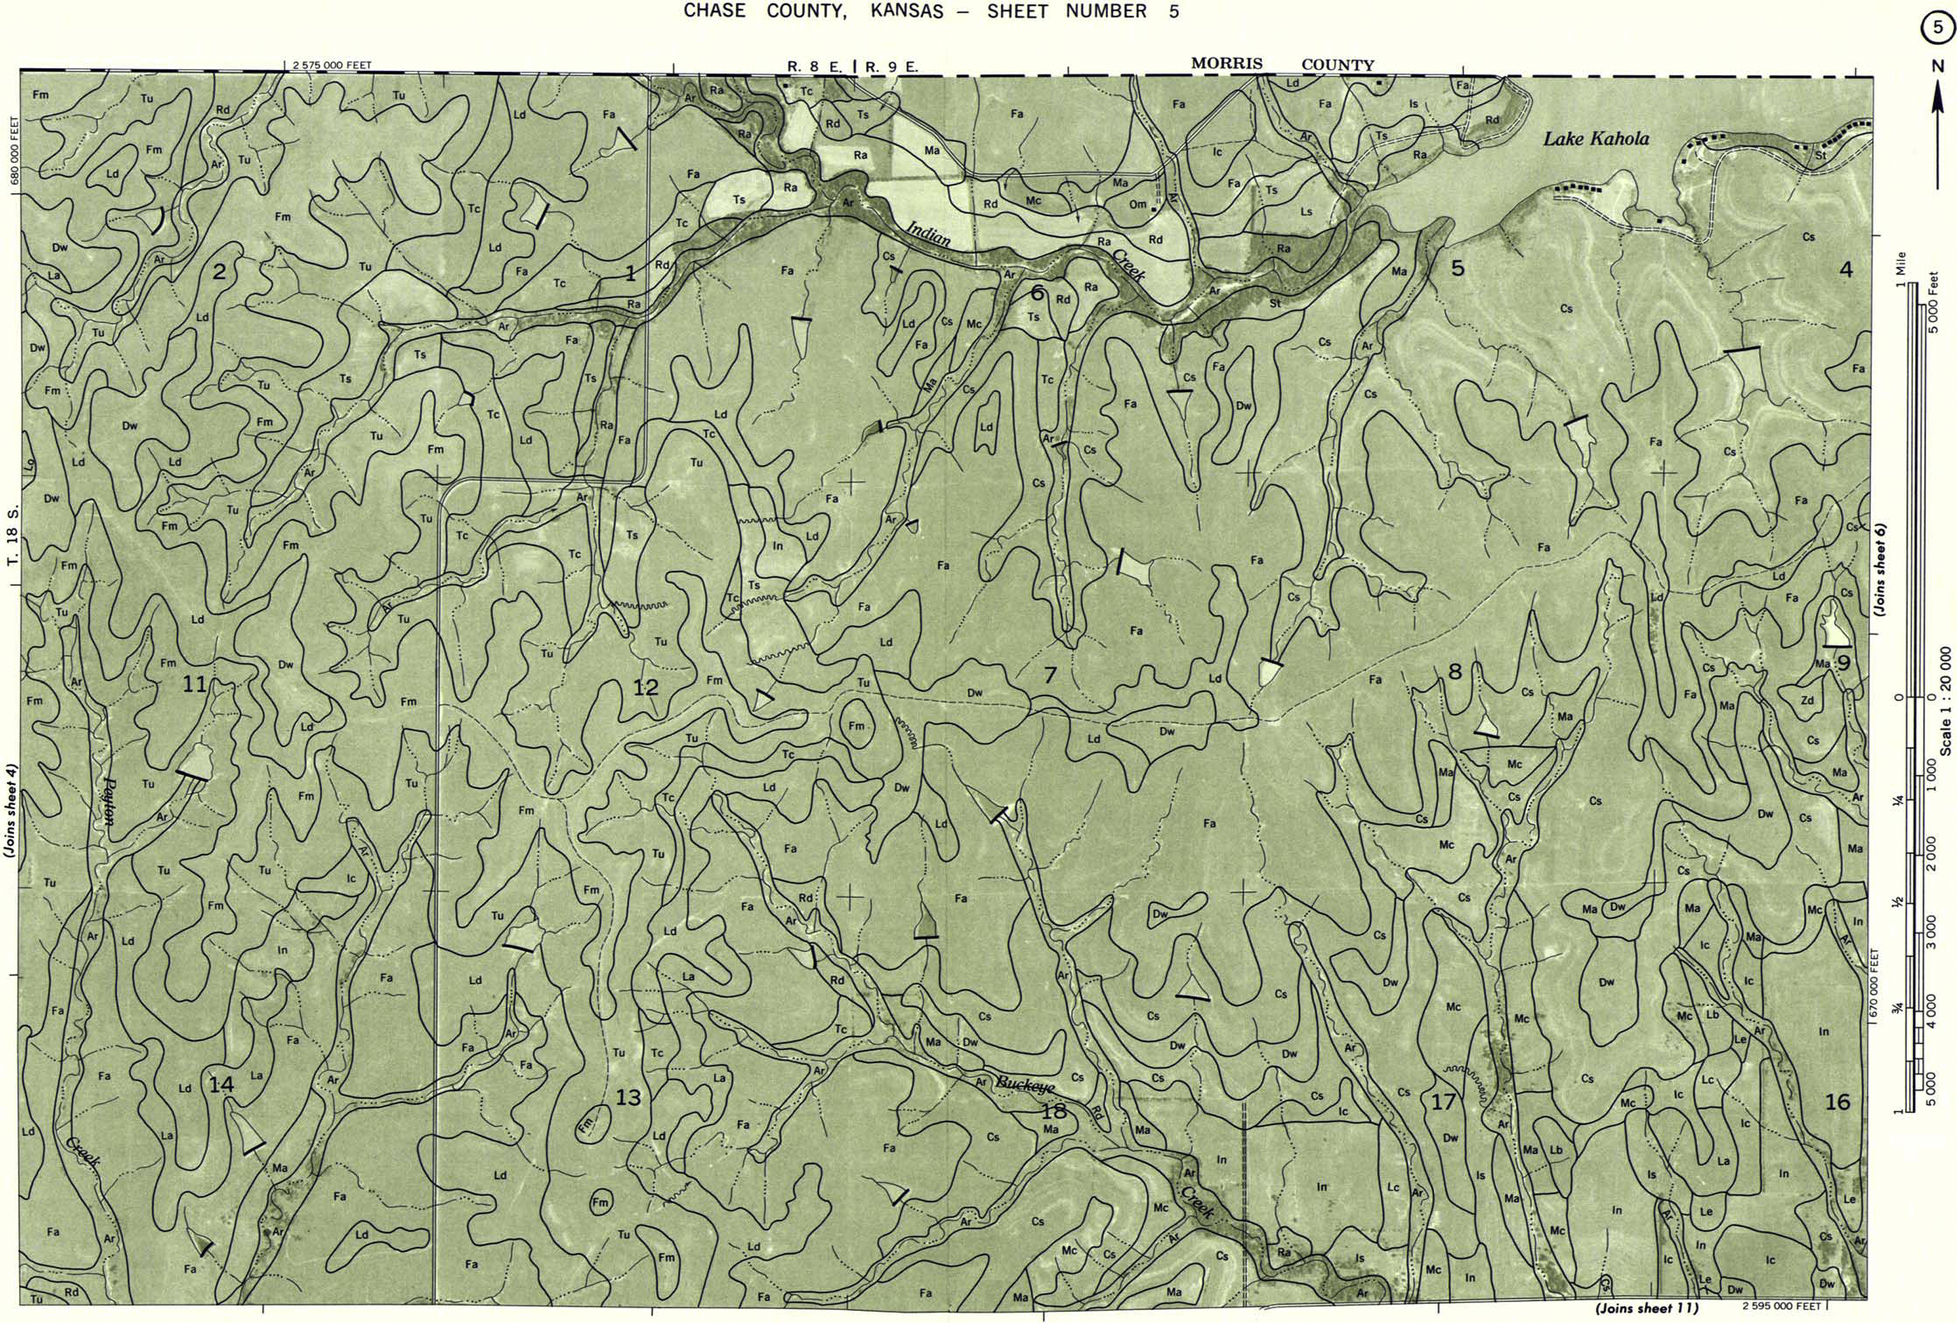
Geologic maps show the distribution of different types of rock and surface materials. They often include the structural relationships between the different materials in the ground such as strata, faults, and folds. The first modern geologic map was created by William Smith in 1815, which can be seen in Fig. 2.12 (Winchester, 2001). Today’s geologic maps are not much different from Smith’s work. Many kinds of geologic maps exist including surficial bedrock and sediment, subsurface rocks, fluids, and structures, and geophysical phenomena such as magnetism, heat flow, and gravity. In most environments vegetation, soils, water bodies, and human structures cover the surface, so that underlying rocks and sediments are not directly visible or exposed. Typically for geologic mapping purposes, the materials directly beneath the soil are depicted. This means the rocks or sediments that exist at shallow depth, usually 1 m in Europe or 5 ft in North America. An example of a generalized geologic map showing the state of Colorado can be seen in Fig. 2.13.
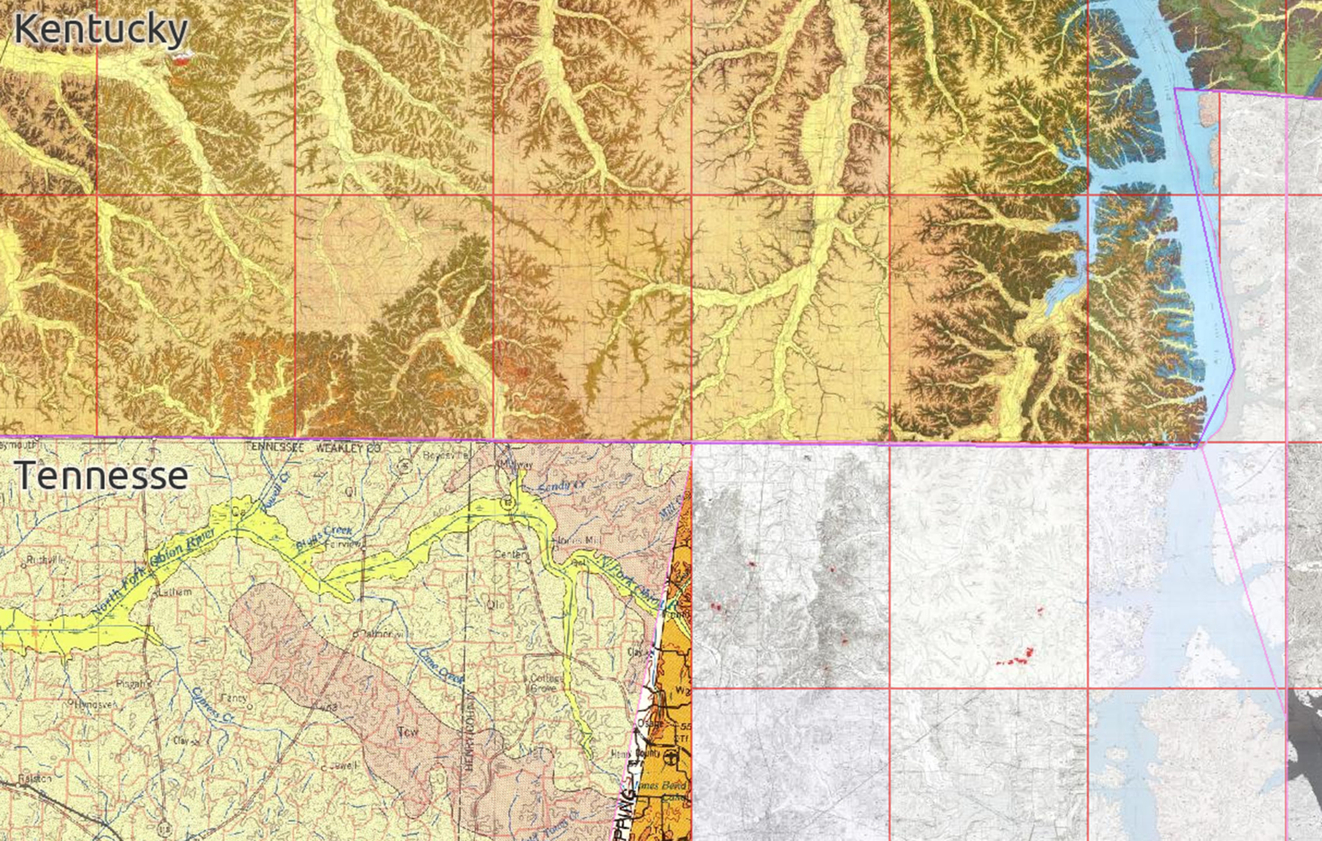
The USGS has standardized colors and geologic time symbols for maps of surficial geology according to age of strata so that a given geologic layer will have the same color and pattern across the map, keeping interpretation consistent. However, this scheme is not always followed at state and local levels for various reasons. The geologic maps available through USGS mapView are a patchwork of quadrangles, counties, and larger regions, with some portions missing (U.S. Geological Survey, 2016d). Maps of different vintages are juxtaposed, which leads to visual clutter and confusion, see Fig. 2.14. Component maps were created by various geologists using different working methods; in some cases they use different stratigraphic classification and terminology, which have changed through time. Cartographic style and graphic design also display conspicuous differences.
Coverage in mapView includes all western and central states, as well as Hawaii, but not Alaska. A few east-coast states, such as Florida and Virginia are included, but many other eastern states remain to be added. It is apparent that standardization of geologic mapping at the national level is a long-term goal that will take considerable additional effort to accomplish. Nonetheless, the current version is invaluable for public access to and display of surficial geology for many states using mapView from The National Geologic Map Database (NGMD) portal (U.S. Geological Survey, 2016e).
In the past, mining was largely unregulated and little attention was paid to long-term hazards or environmental consequences. Among the most highly polluted places in the United States is the Tri-State lead-and-zinc mining district, including Kansas, Missouri, and Oklahoma, which began operating in the 1850s, see Fig. 2.15. The last mines closed in 1970, leaving a legacy of serious soil and water pollution, poor economic conditions, and scarred landscapes (Manders & Aber, 2014). Such contamination led to the establishment of Environmental Protection Agency (EPA) Superfund sites, and many federal and state agencies along with several universities and private foundations have cooperated for environmental investigations and remediation efforts.
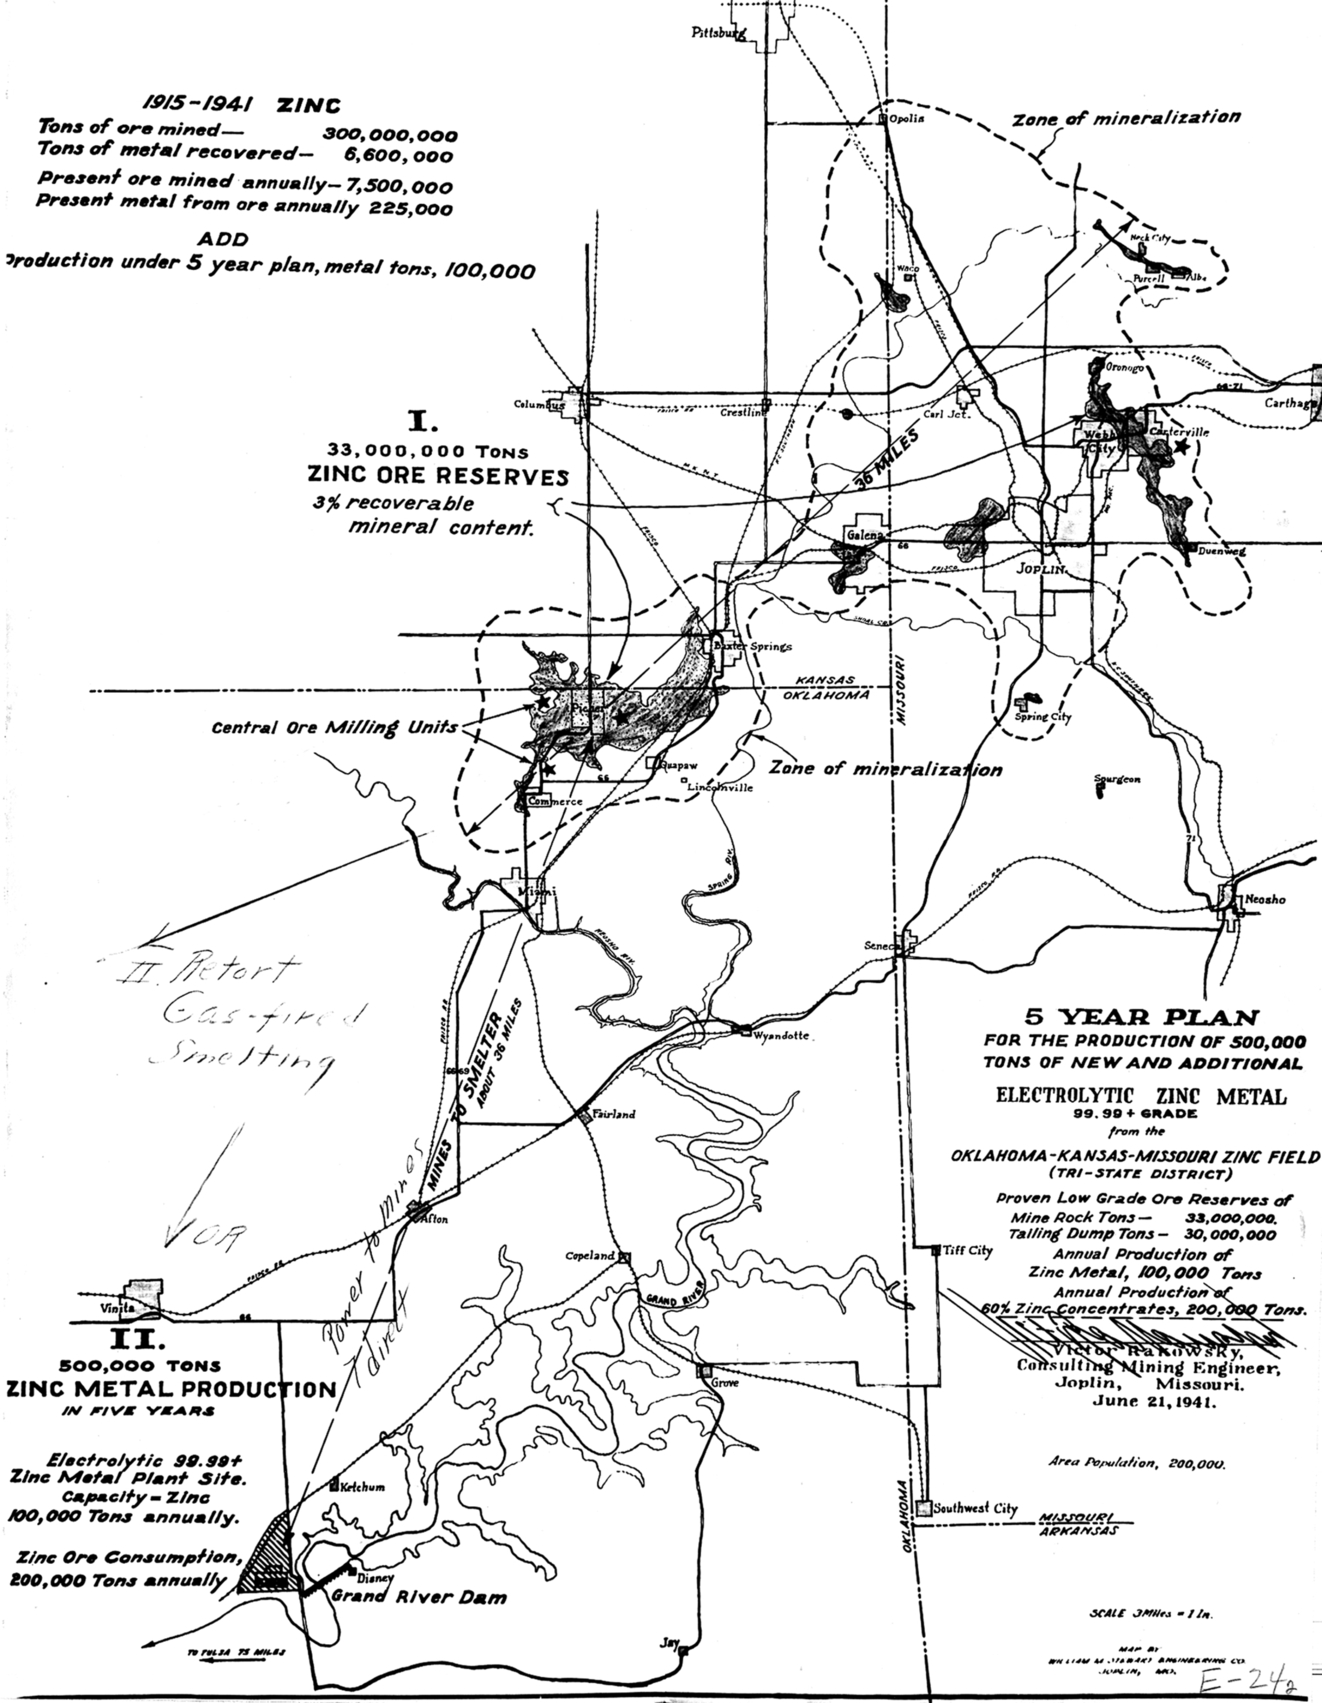
Public interest in such sites is extremely high in many cases. As there is no one single repository of mining-related map information, map librarians should be prepared to conduct considerable research among diverse public, commercial, and private sources to locate relevant GIS databases and historical maps. A good example of this approach is the Tri-State Mining Map Collection at Missouri Southern State University, which is available in digital format at the Missouri Digital Heritage (2007–2014). The collection includes more than 5000 maps of all types related to past mining activities in the region, such as the mineral resource map shown in Fig. 2.15.
The phrase “historic map” brings to mind ancient maps of the world, or perhaps European maps describing explorations into unknown regions of the Americas. Despite this conception, we can consider any map that is not current to be an historic map. While they may or may not be old chronologically speaking, if they are not the most currently available version of the map information, they can be considered historic. This is a broad definition, but it avoids the subjectivity of individuals’ conceptions of the word historic. For example, USGS topographic maps were produced until 2006, but these maps are now considered to be a part of the Historic Topographic Map Collection. Even though these topographic maps are not particularly old when compared to the larger history of cartography, they do not reflect the most current knowledge, which is available today in the digitally updated US Topo Quadrangle series.
This is not to say that historic maps’ dated information makes them valueless. Given that maps typically represent knowledge of place at a specific time, historic maps can be an incredible record of the world. Library collections often include historic maps produced over many decades or even centuries. Whether they are months or centuries old, historic maps may contain knowledge not found in any other format, and are a valuable part of a collection. This is especially true of maps produced locally to describe the region or city where the collection resides. Unfortunately, maps that may not be considered old enough to be historic by the colloquial definition of the word are often discarded to free up space, destroying information that is quite possibly unique and found in no other collection.
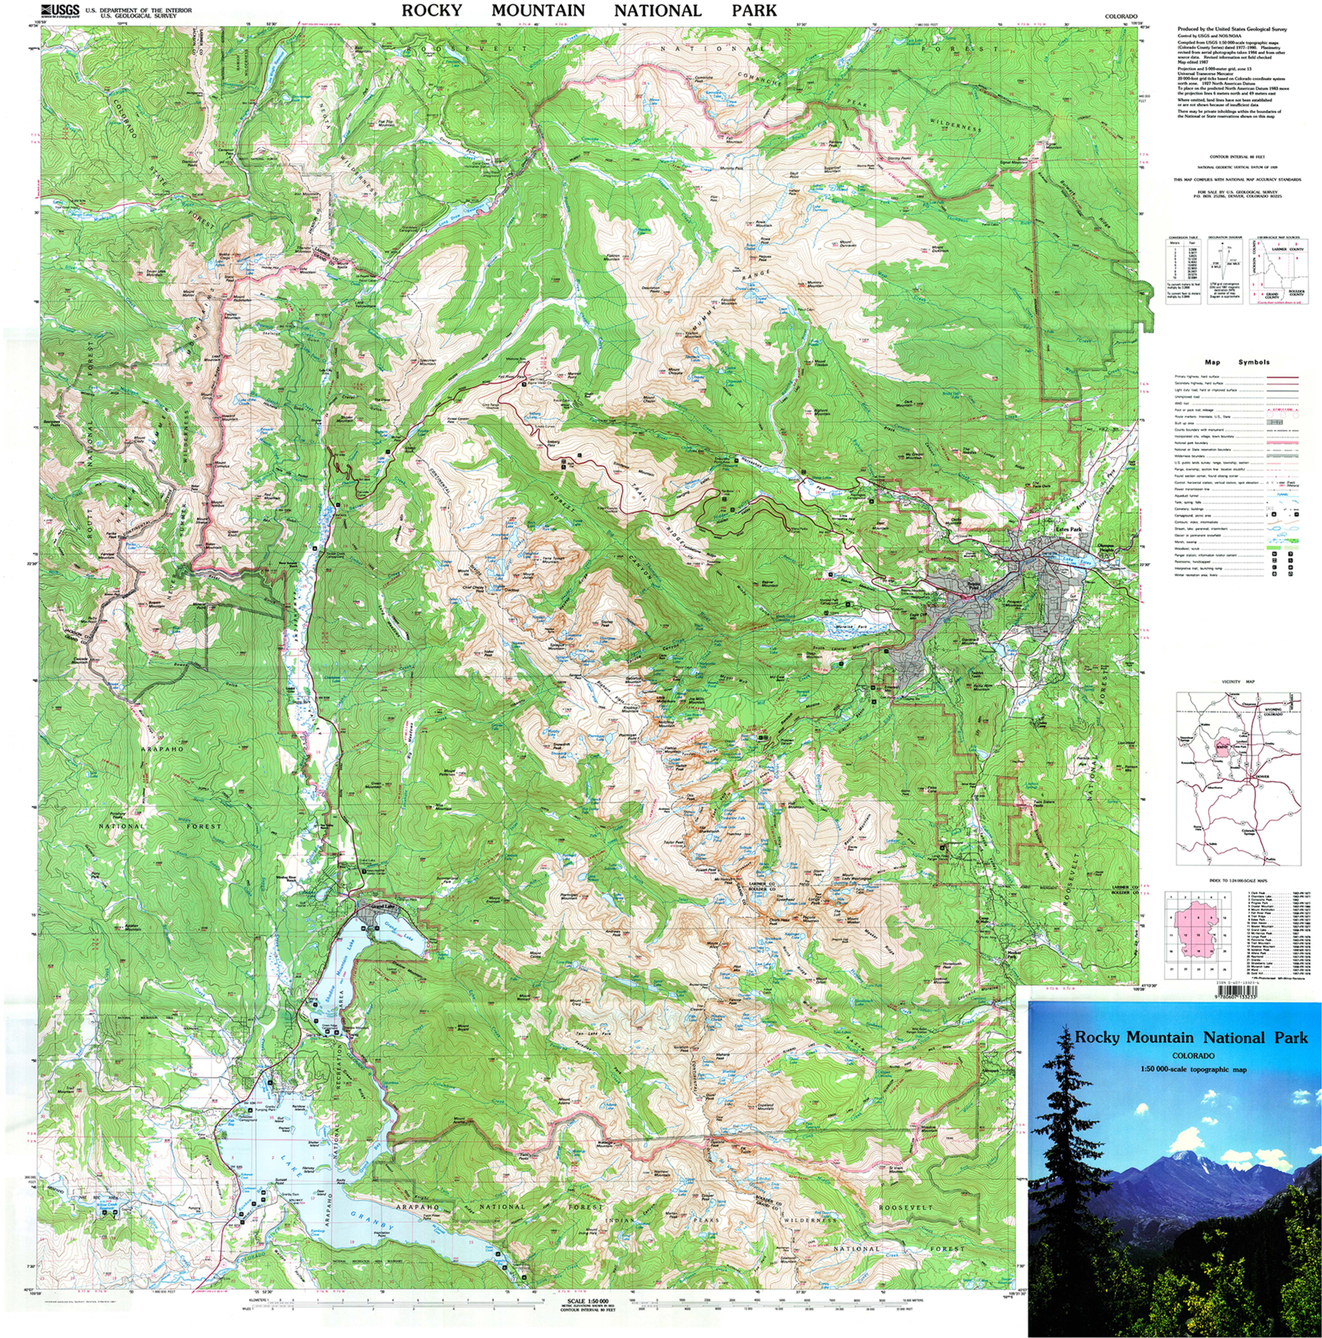
Maps representing U.S. National Park Service (NPS) lands exist in multiple formats, but the most prominent is the topographic map created by the USGS. These maps are similar to the standard USGS topographic maps, but they have a special focus on the features related to national parks. Since there are large size differences from one park to the next park, the corresponding maps range in scale from large to small, 1:960–1:250,000. The largest scale map represents the Franklin D. Roosevelt National Historic Site in New York and the smallest, Denali National Park in Alaska (U.S. Geological Survey, 2005). Fig. 2.16 shows an example of one of these maps representing Rocky Mountain National Park in Colorado. USGS topo maps of National Parks can be purchased or downloaded through the USGS online store (U.S. Geological Survey, 2012a).
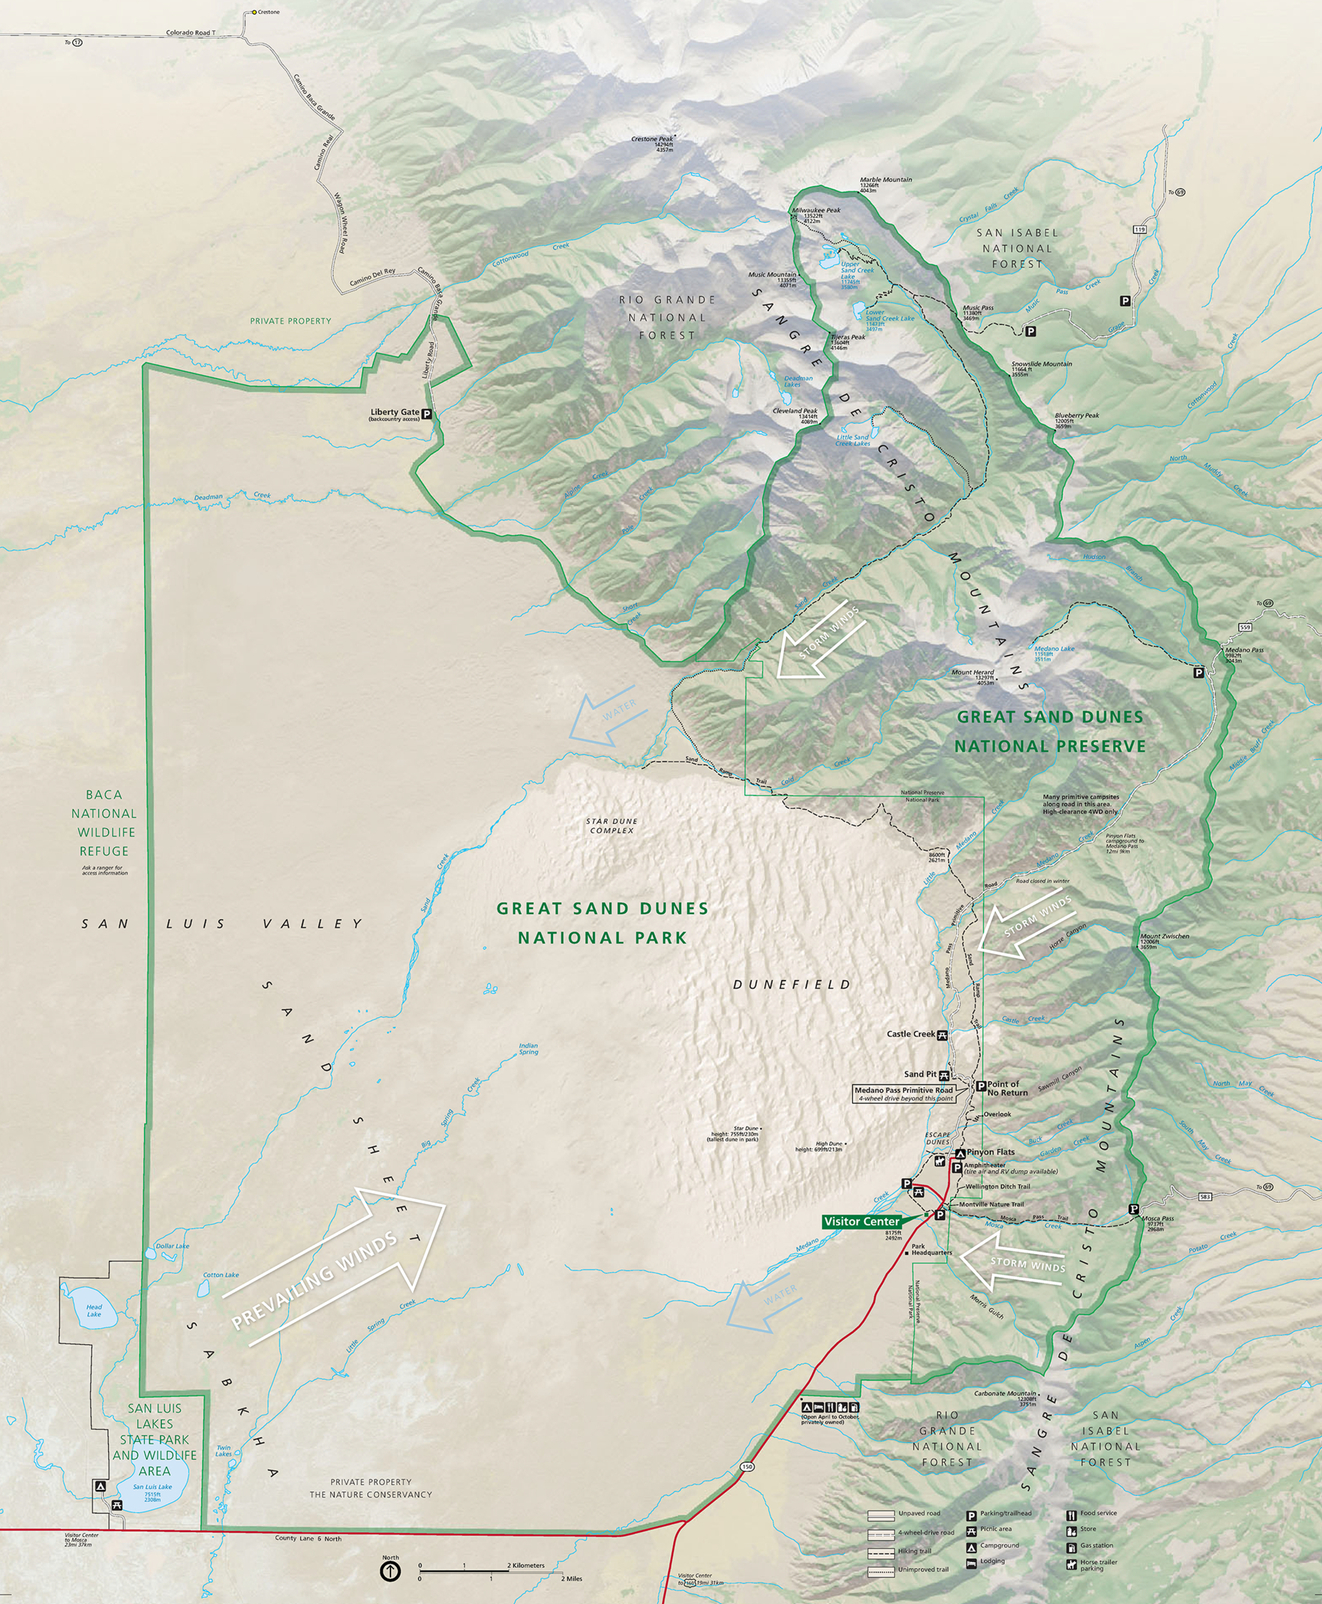
The NPS also produces service maps for each park, monument, and trail in the system. Rather than terrain, these maps are designed primarily to aid in navigation and general reference for visitors. The NPS recommends using USGS topo maps for outdoor activities such as hiking and mountaineering. Service maps are produced using a variety of data sources and cartographic techniques, although more recent maps are produced using GIS data sources and digital cartography techniques (National Park Service, 2016a). Since each park has different attractions, these maps cater to site-specific needs, including features such as parking and visitor’s center locations. An example of one of these service maps showing Great Sand Dunes National Park and Preserve in Colorado can be seen in Fig. 2.17. Service maps for individual National Parks, National Historic Sites, and the National Trails system can be found at the NPS’s website (National Park Service, 2016b).
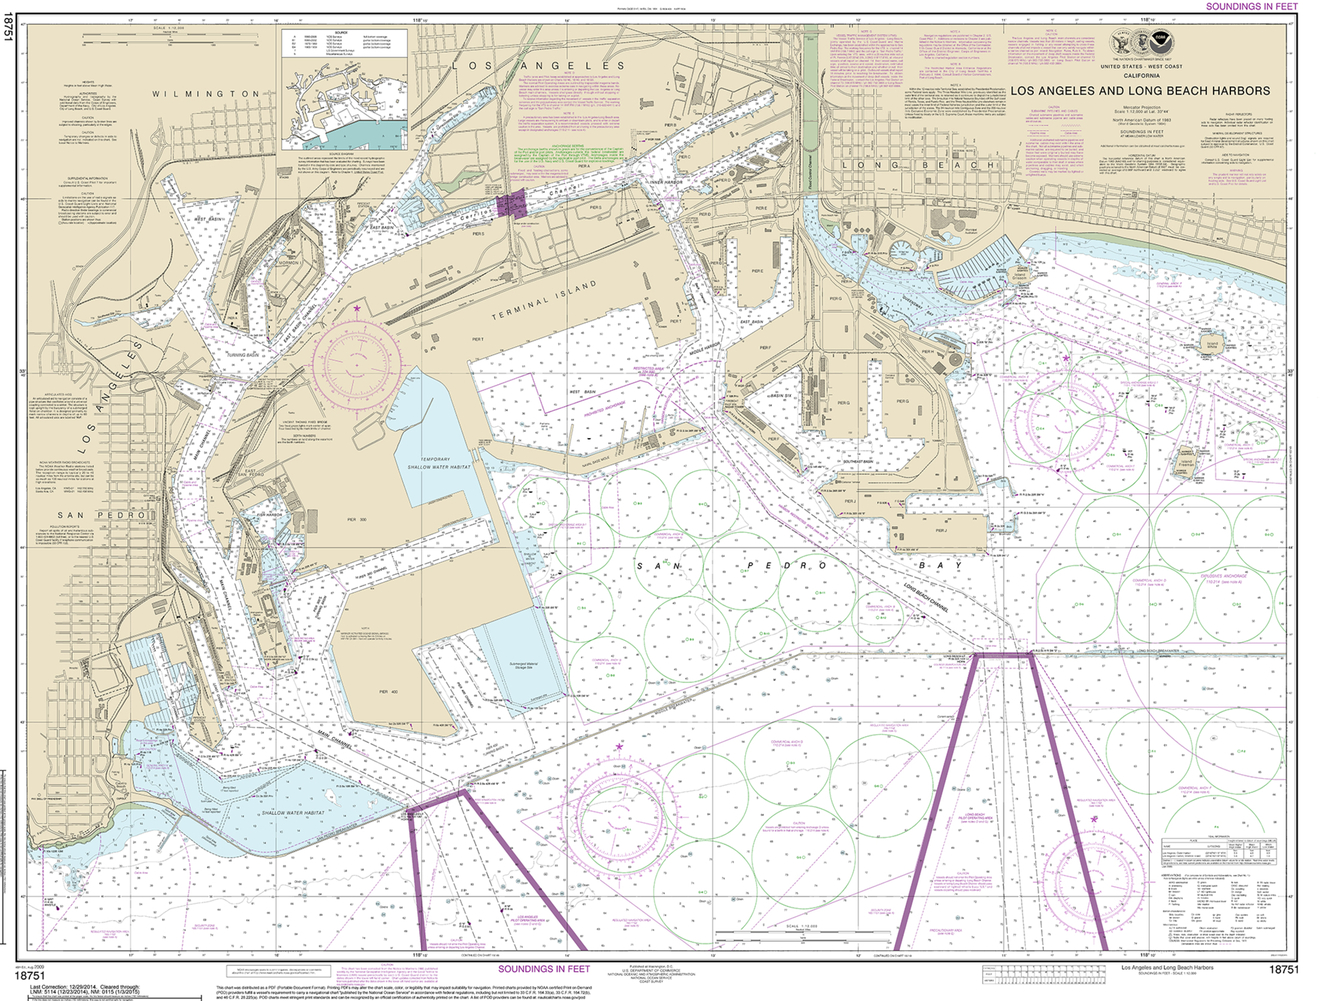
Nautical charts have been used for centuries to assist sailors in maritime navigation. Modern charts often include water depth, local magnetic declination, paths for entering and exiting harbors, and structures such as piers and relevant buildings. In the United States, the National Oceanic and Atmospheric Administration (NOAA) produces both digital charts as free downloads or paper editions for purchase (National Oceanic and Atmospheric Administration, n.d.). The agency has its origins in the United States Survey of the Coast, founded in 1807, and although today’s NOAA has changed quite a bit, the Coast Survey continues to produce weekly updated nautical charts for maritime use (National Oceanic and Atmospheric Administration, 2012). Types of maps produced include sailing charts for navigation in open coastal water, general charts for visual and radar navigation by landmarks, coastal charts for nearshore navigation, harbor charts, and other specialized chart types for various sailing uses (Thompson, 1988). An example of a modern nautical harbor chart showing the Los Angeles and Long Beach harbors can be seen in Fig. 2.18.
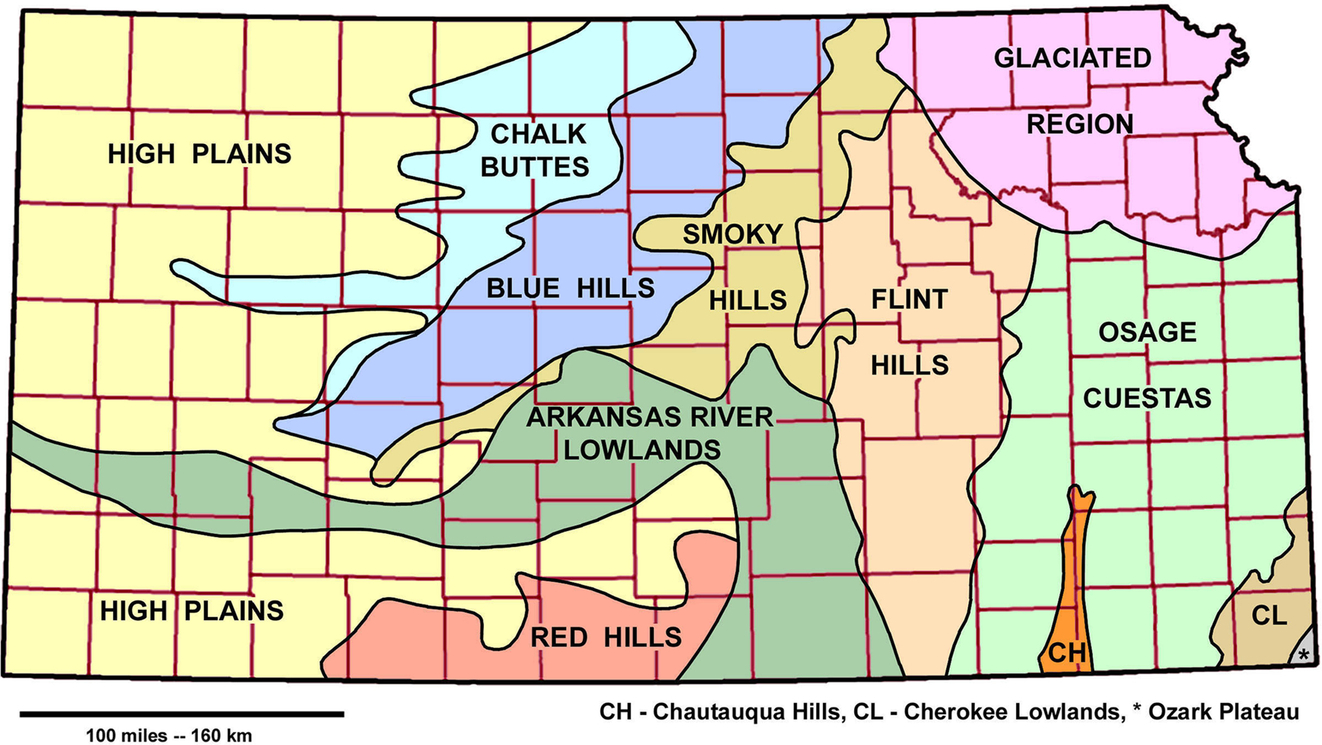
Physiographic maps show generalized regions based on shared land forms rather than vegetation or other factors. Many physiographic boundaries are therefore based largely on the underlying geology of a region. The general system in use today for classifying these regions was laid out in “Physiographic Subdivision of the United States” and has three orders referred to as major divisions, provinces, and sections (Fenneman, 1916). A modern example of a physiographic map showing generalized regions of Kansas can be seen in Fig. 2.19.
Planimetric maps are any maps that show the horizontal positioning of ground features without representing elevation information. These maps are used for a variety of purposes, including base or outline maps, cadastral maps, and line-route maps (Thompson, 1988). Base maps include features such as roads, waterways, or political boundaries that are used as a base, or background, for the presentation of other data. Outline maps are similar, but are generally limited to features such as political or physical boundaries. For example, many thematic maps include base map information, such as county boundaries or highways in addition to their thematic map content. See Fig. 2.4 for an example of a thematic map that involves county boundaries as a base. Cadastral maps represent the division of land for the purposes of ownership. These maps, including plats, are commonly used for legal descriptions of land ownership, as well as taxation purposes. Line-route maps are similar to base maps, but they are specific to utilities, representing the locations of all manner of pipes and cables, along with the facilities that support these vectors of transmission. A good example that can be used to map anything to do with energy, from electric transmission lines to hydrocarbon gas liquids pipelines, is the U.S. Energy Mapping System (U.S. Energy Information Administration, n.d.).
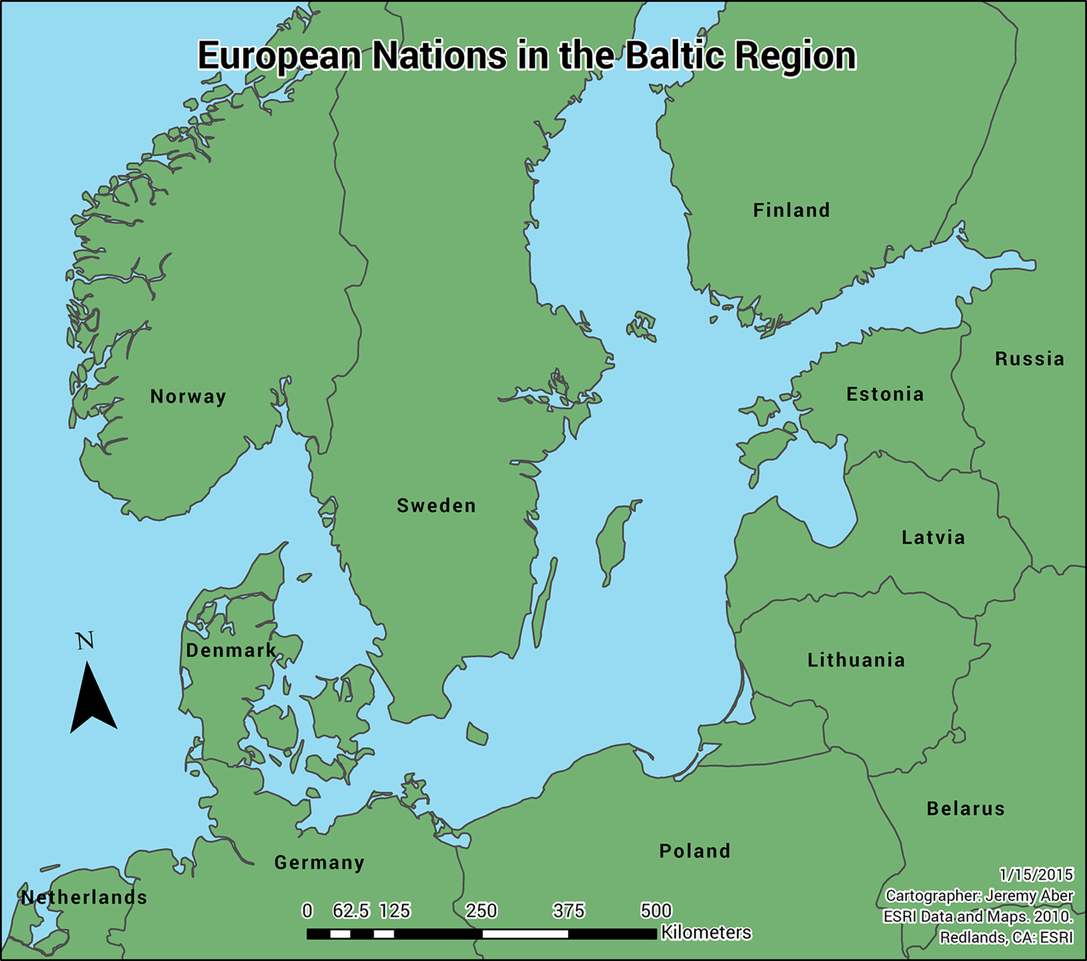
Political maps focus on the administrative boundaries defining nation-states and other political regions, internal political divisions, and the locations of cities. They may contain other information, such as natural features like rivers and mountains, but the primary focus is on political borders. An example of a simple political map showing national borders can be seen in Fig. 2.20. Political maps often act as base maps, giving context to natural and cultural phenomena that overlay the political information. In an educational context, they may take the form of traditional classroom pull-down wall maps.
Soil maps are one component of a general soil survey, and they show the location and nature of different types of sediments on the ground. Soil surveys began in 1899 under the title of the National Cooperative Soil Survey; today the Soil Survey is under the USDA’s Natural Resources Conservation Service division. Paper maps included soil regions marked on top of aerial photographs, an example of which can be seen in Fig. 2.21. These maps were just one component of a regions’ soil survey, which could be more than 100 pages of detailed information about the soil, its composition, and what this meant for various agricultural practices. Today, these historic documents can still be accessed through the NRCS website, but more up to date information is downloaded through the Online Web Soil Survey (Natural Resources Conservation Service, 2013). This interactive map interface allows users to generate custom soil maps for their specific needs.
A topographic map is any map that represents horizontal planimetric data in combination with a representation of vertical elevation data. There are multiple approaches to representing elevation in maps, but contours are the most commonly used technique today. See Fig. 2.8 for examples. Topographic maps are generally considered reference maps, as opposed to thematic maps, and are distinct from planimetric maps, which do not include relief information (Jones et al., 1942). These maps are used for many purposes related to the natural world, including recreation activities such as hiking, hunting, and fishing, but they are also used for activities like highway and utility development, construction planning, and flood management.
While many nations have mapping programs that create topographic maps, the most well-known series in the United States are produced by the USGS in a program stretching back to 1884 (Usery, Varanka, & Finn, 2013). While the technologies used to produce and distribute the maps have changed over the years, the basic map content remains more or less the same as it was in the late 1800s. After decades of labor, the original series of 7.5-minute topographic maps was declared complete in 1992 (Moore, 2011). Following the 1992 completion of the series, digital GIS approaches to mapping have been the focus of the program. Topo maps were produced with print as the target medium until 2006, and today these older paper maps are now referred to as the Historic Topographic Map Collection (HTMC). Since 2006, all new maps have been produced in a native digital form in what is known as the US Topo Quadrangle series (U.S. Geological Survey, 2016f). Hardcopy prints of this newer series can still be purchased through the USGS store, but the emphasis rests on distributing the maps digitally. Both digitized copies of the HTMC and US Topo Quadrangles are freely available for download through the Map Products at the USGS Store (U.S. Geological Survey, 2012b), The National Map Viewer (U.S. Geological Survey, n.d.), and The USGS topoView interface for current and historic maps (U.S. Geological Survey, 2016g).
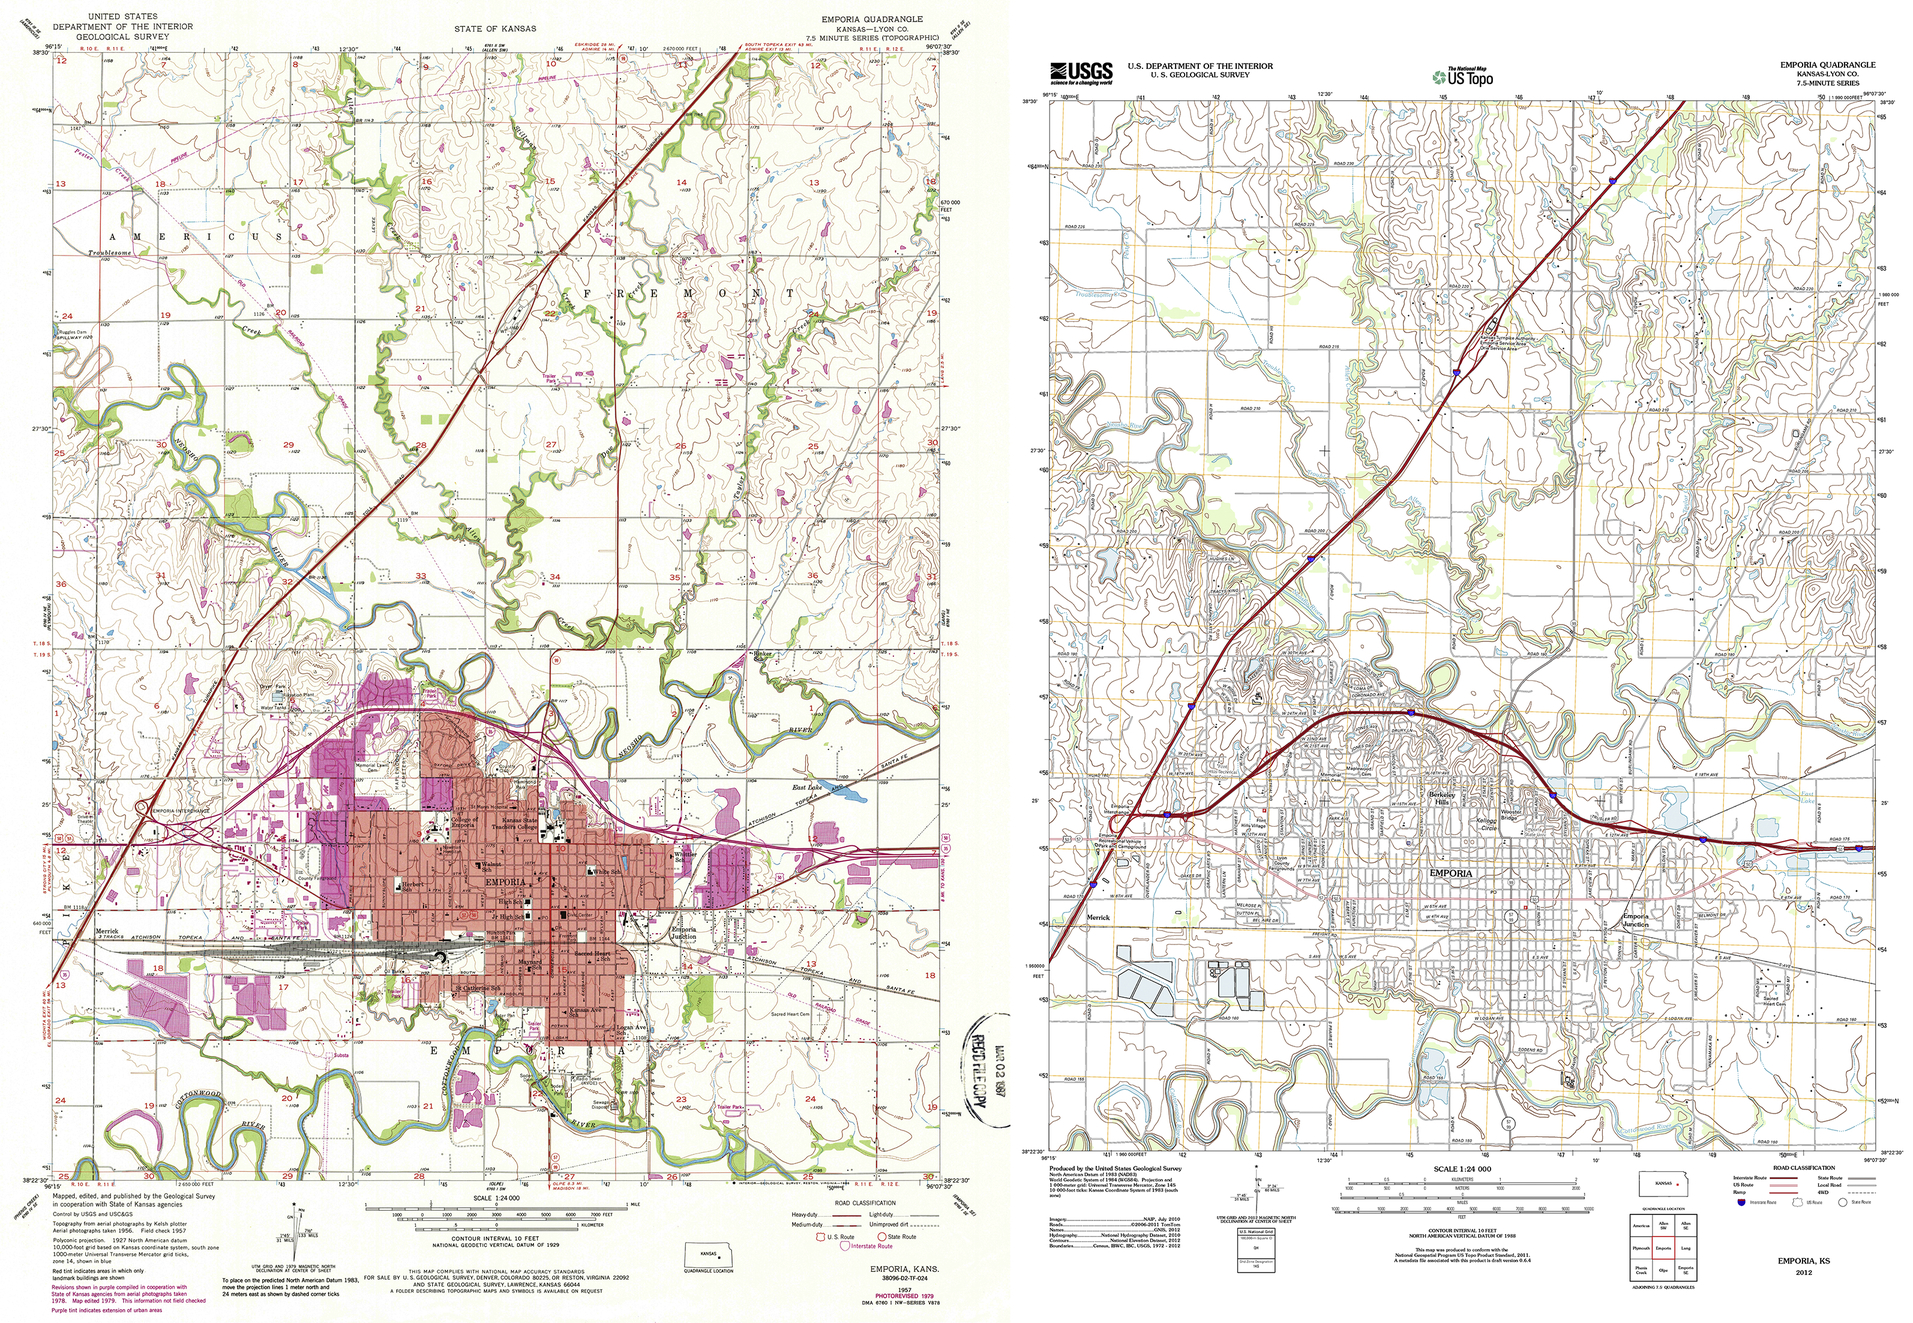
There are differences between the two USGS topo series beyond their medium of distribution. Maps in the newer Topo Quadrangle series lack some of the information that was routinely presented in the HTMC maps, including features such as “recreational trails, pipelines, power lines, survey markers, many types of boundaries, and many types of buildings” (U.S. Geological Survey, 2015e). The reasoning behind these omissions is that USGS no longer verifies these features in the field, and as of 2016 no other current GIS data source exists to fill the gap. As data for these types of features becomes included in The National Map, it will be added to the Topo Quads. Two topo maps can be seen in Fig. 2.22, one showing an older HTMC version of the information, the other the modern Topo Quad version.
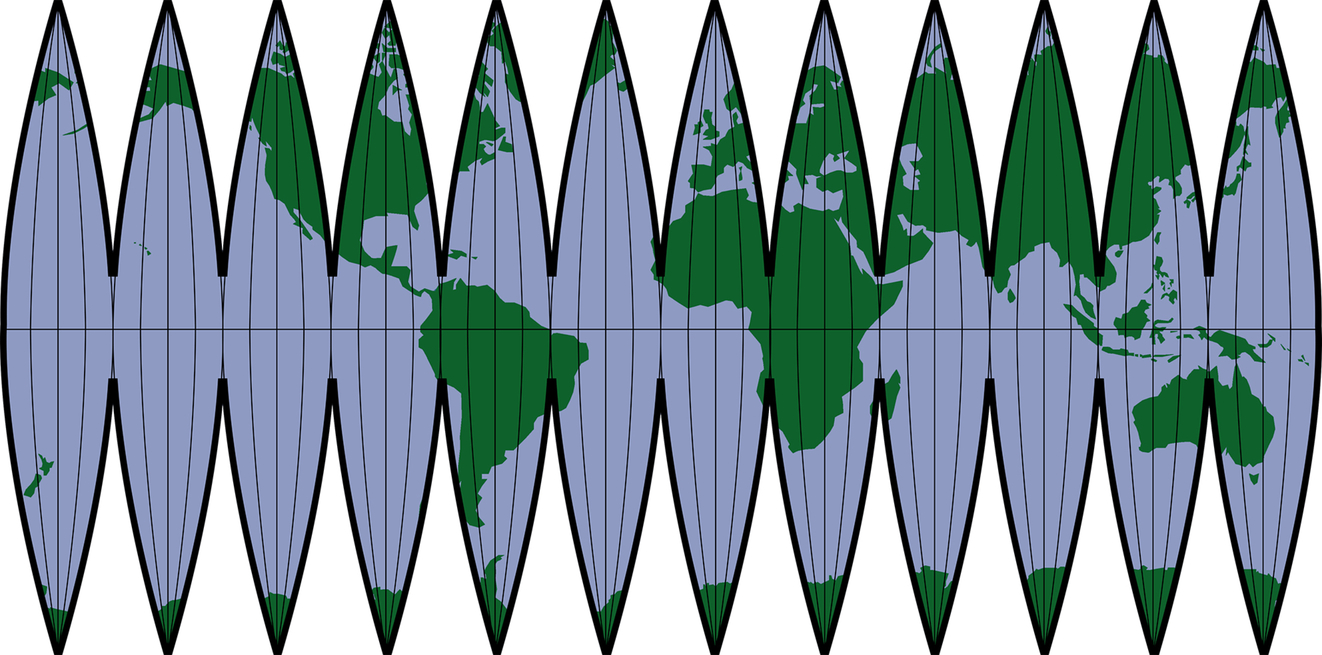
Globes have been made for thousands of years, as evidenced by the fact that the ancient Greek geographer Strabo discussed the use of globes some 2000 years ago in his Geographica (Strabo, 1903). Most globes have not survived the years in physical form though, and our oldest surviving globe was created by Martin Behaim in 1492 (Menna, Rizzi, Nocerino, Remondino, & Gruen, 2012). Early globes were used for aiding calculations and astronomy, while later the lack of conformal distortion in shapes was appealing for its accurate representation of land masses (Dahl & Gauvin, 2000). Globes have acted as status symbols, with a globe bestowing an air of wisdom and wealth to the owner. Early globes were one-offs, made of engraved metal or wood, and were expensive, but later printing technology allowed for globes to be mass produced through the use of paper globe gores. These gores were a flat print of the world that could be cut out and glued to the globe surface in order to cover the whole earth, an example of which can be seen in Fig. 2.23.
Unlike two-dimensional projected maps, globes do not suffer from geometric distortions; however, their lack of portability makes them poor candidates for replacing maps. Nevertheless, the globe lives on today in the digital realm, with free software packages such as Google Earth (n.d.), Esri ArcGlobe (Esri, 2003), and NASA World Wind (National Aeronautics and Space Administration, 2011) all allowing for visualization and manipulation of spatial data on a digital globe.
Raised-relief models are somewhat of a hybrid of flat maps and three-dimensional globes. They are based on flat, projected maps, but are extruded to show elevation in the third dimension. These maps are typically pressed or vacuum formed into shape on a mold in a rubber or plastic medium. There is no one single source of these relief maps, but they are usually based on USGS geospatial data and topographic maps. Today these models are generally intended for public display, but in the past relief models served a more functional purpose.
Before easy access to accurate maps and detailed aerial photography, creating a scale-relief model of landscapes with major geographic landmarks and transportation infrastructure helped in civil engineering plans and in some cases, war efforts (Kelly, 2013). In the Second World War, military leaders used relief models in strategic, defense preparation and troop training for unfamiliar terrains (University of Edinburgh & Royal Scottish Geographical Society, 2016). After Germany invaded and annexed Poland, the Polish military continued to fight as they moved west. Some reconvened in Scotland where they were tasked with creating a defense for the east Scottish coast, which was aided by creating a large terrain map (Mapa Scotland, 2013a).
Thirty years later, the Great Polish Map of Scotland, a large cartographic sculpture, was built on the same grounds of Barony Castle, now hotel, to commemorate Polish peoples’ contributions to the war effort and can be seen in Fig. 2.24 (Barony Castle LLP, 2015). The concrete terrain model is an accurate raised relief map of Scotland, designed by Polish cartographer Dr. Kazimierz Trafas and created by Jan Tomasik in the mid-1970s at the Hotel Barony, near Pebbles, Scotland (Mapa Scotland, 2013a). The 1979 map model measures approximately 50 × 40 m (160 ft × 130 ft) (University of Edinburgh & Royal Scottish Geographical Society, 2015). Funding was obtained and most of the needed restoration was completed from 2013 to 2015 (Mapa Scotland, 2013b). When finished, rivers will flow into the ocean and concrete will be tinted to mimic rock to vegetation cover (Little, 2014).
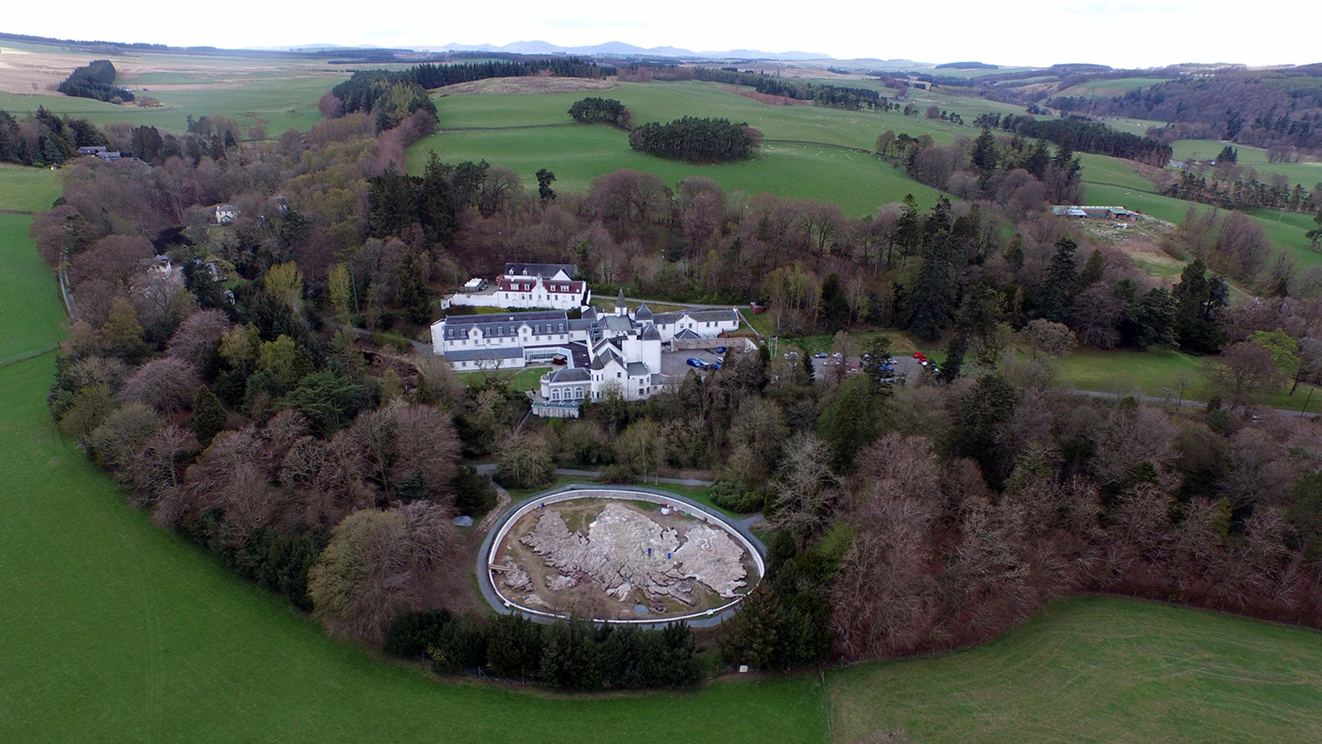
While aerial images are described in more detail in the remote sensing discussion in Chapter 4, it is worth mentioning aerial photos and images in this section as well. Given that aerial photographs have been collected regularly for more than a hundred years, physical paper copies of local imagery are likely to be found in library collections. In some cases, this is a necessity, as images like stereo pairs used for image interpretation may be more effective as paper copies than digital versions. Historical imagery has been collected over the years by multiple public agencies at the city, county, and state government levels. Because of the volume of these images, it is likely that some of them may not have been digitized yet, and only exist as paper copies. Local imagery such as this can be quite valuable as an historic record of land cover. Additionally, the federal government has an enormous collection of aerial imagery covering the U.S. that is available for digital download. An example of one of these images can be seen in Fig. 2.25.
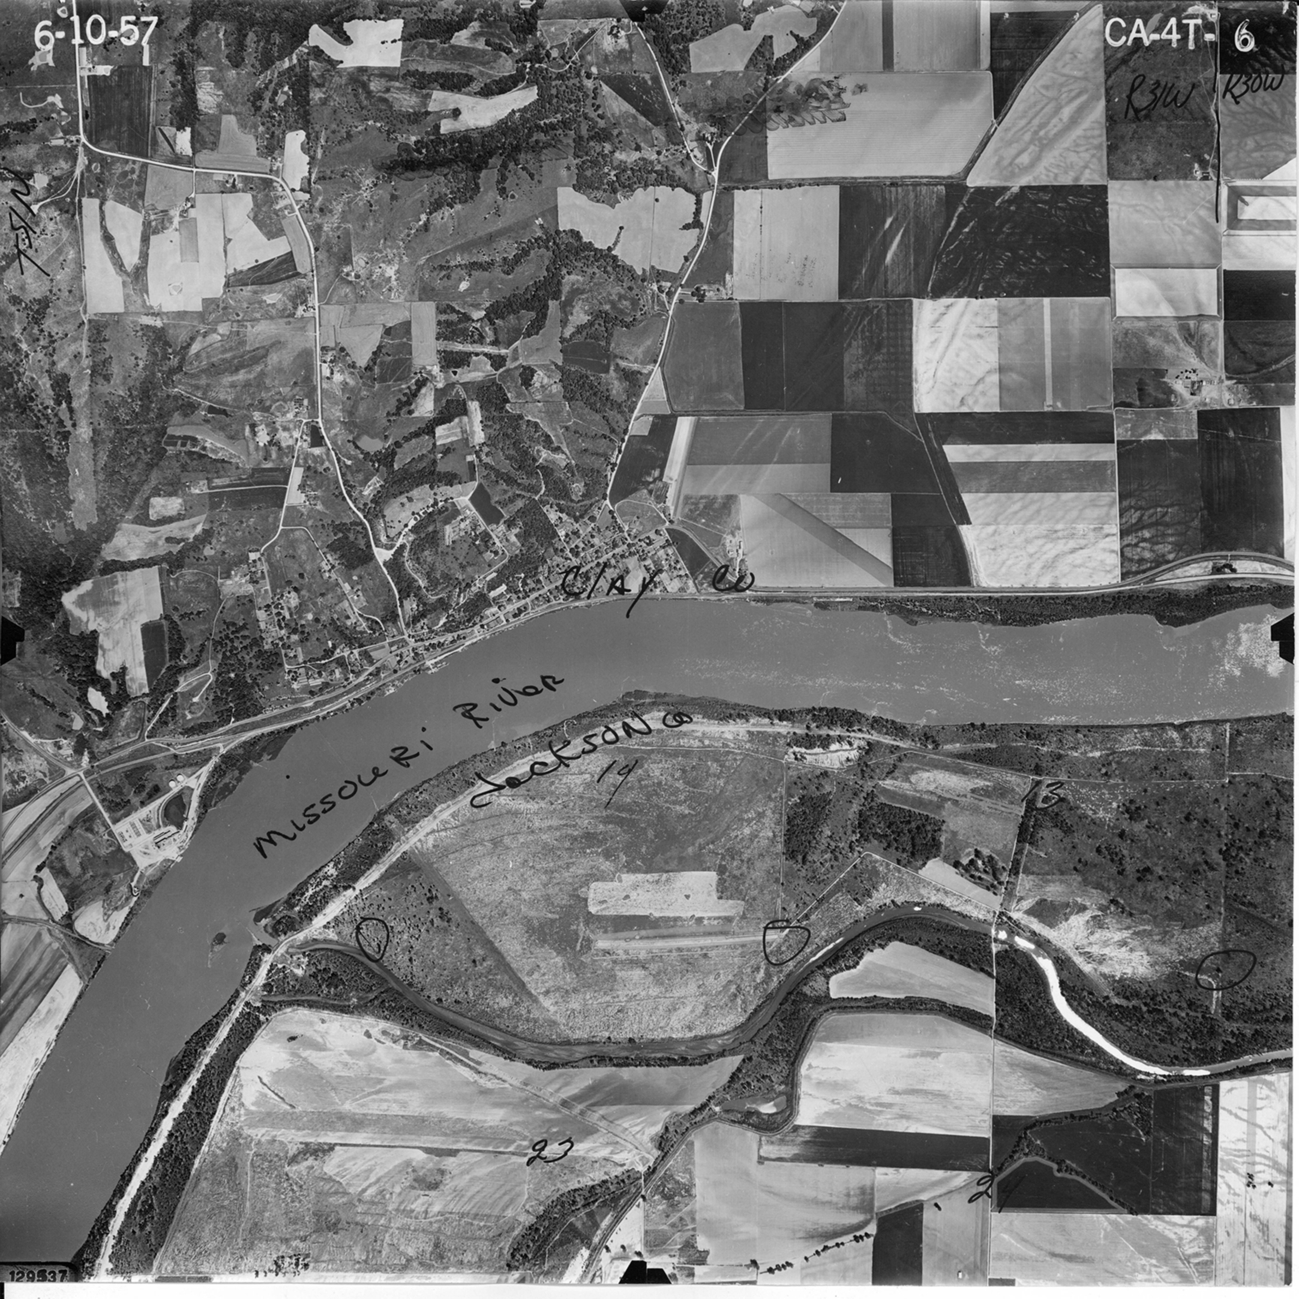
It should be clear by now that maps can take many different forms and serve a wide variety of purposes. Library collections are quite likely to have many different maps serving disparate populations. This chapter should provide a sense of how maps function, and how they can be used in many different ways. Chapter 7 will look more specifically at map and data resources, but the map examples here should give some idea of the types of map data that are available to serve library patrons’ needs.
Maps are a valuable component of our day-to-day lives, helping us navigate and understand the world that we live in. They are a combination of art and science, using visual approaches to describe measurements of location and place. They are also central to the work of map librarians, both in physical and digital forms. Regardless of the context of use, it is important to have a broad understanding of how they are constructed and how they function. Maps do not all serve the same needs, and therefore may not all employ the same techniques, but they all share basic map concepts or the common underlying ideas about how we measure and represent the world. Some of the main components behind the science of cartography include map scale, resolution, grid and coordinate systems, projections, symbols, and legends. The most important of these is the concept of scale.
Scale; Resolution; Datum; Geodesy; Grid; Ellipsoid; Projection; Large-scale; Small-scale; Azimuthal; Cylindrical; Conic; Conformal; Mercator projection; Magnetic declination; Coordinate system; Public land survey system.
The concept of scale underlies all maps. As we know from the discussion of maps in Chapter 2, most maps are graphical representations of the environment that show the world in a smaller format than the reality. The environments and objects that we map are almost always never the same size as the pieces of paper or computer screens that represent them, and scale refers to “the amount of reduction that takes place in going from real-world dimensions to the new mapped area on the map plane” (Dent, Torguson, & Hodler, 2009). This reduction is referred to as map scale, which can be defined as Map Distance/Earth Distance. This equation is generally presented on maps in a ratio format, so the representative fraction 1/24,000 becomes 1:24,000. In this case, the ratio 1:24,000 can be interpreted as one unit of measure on the map representing 24,000 units on the ground.
Maps are often referred to as large-scale or small-scale based on the size of this ratio. The usage of these terms can be confusing. A 1/24,000 scale map shows a smaller surface area with more detail than the 1/1,000,000 scale map, but since the fraction itself is a larger number, it is considered a large-scale map (Foote, 2000). Fig. 3.1 shows an example of how a map of the same area will appear different at different scales.
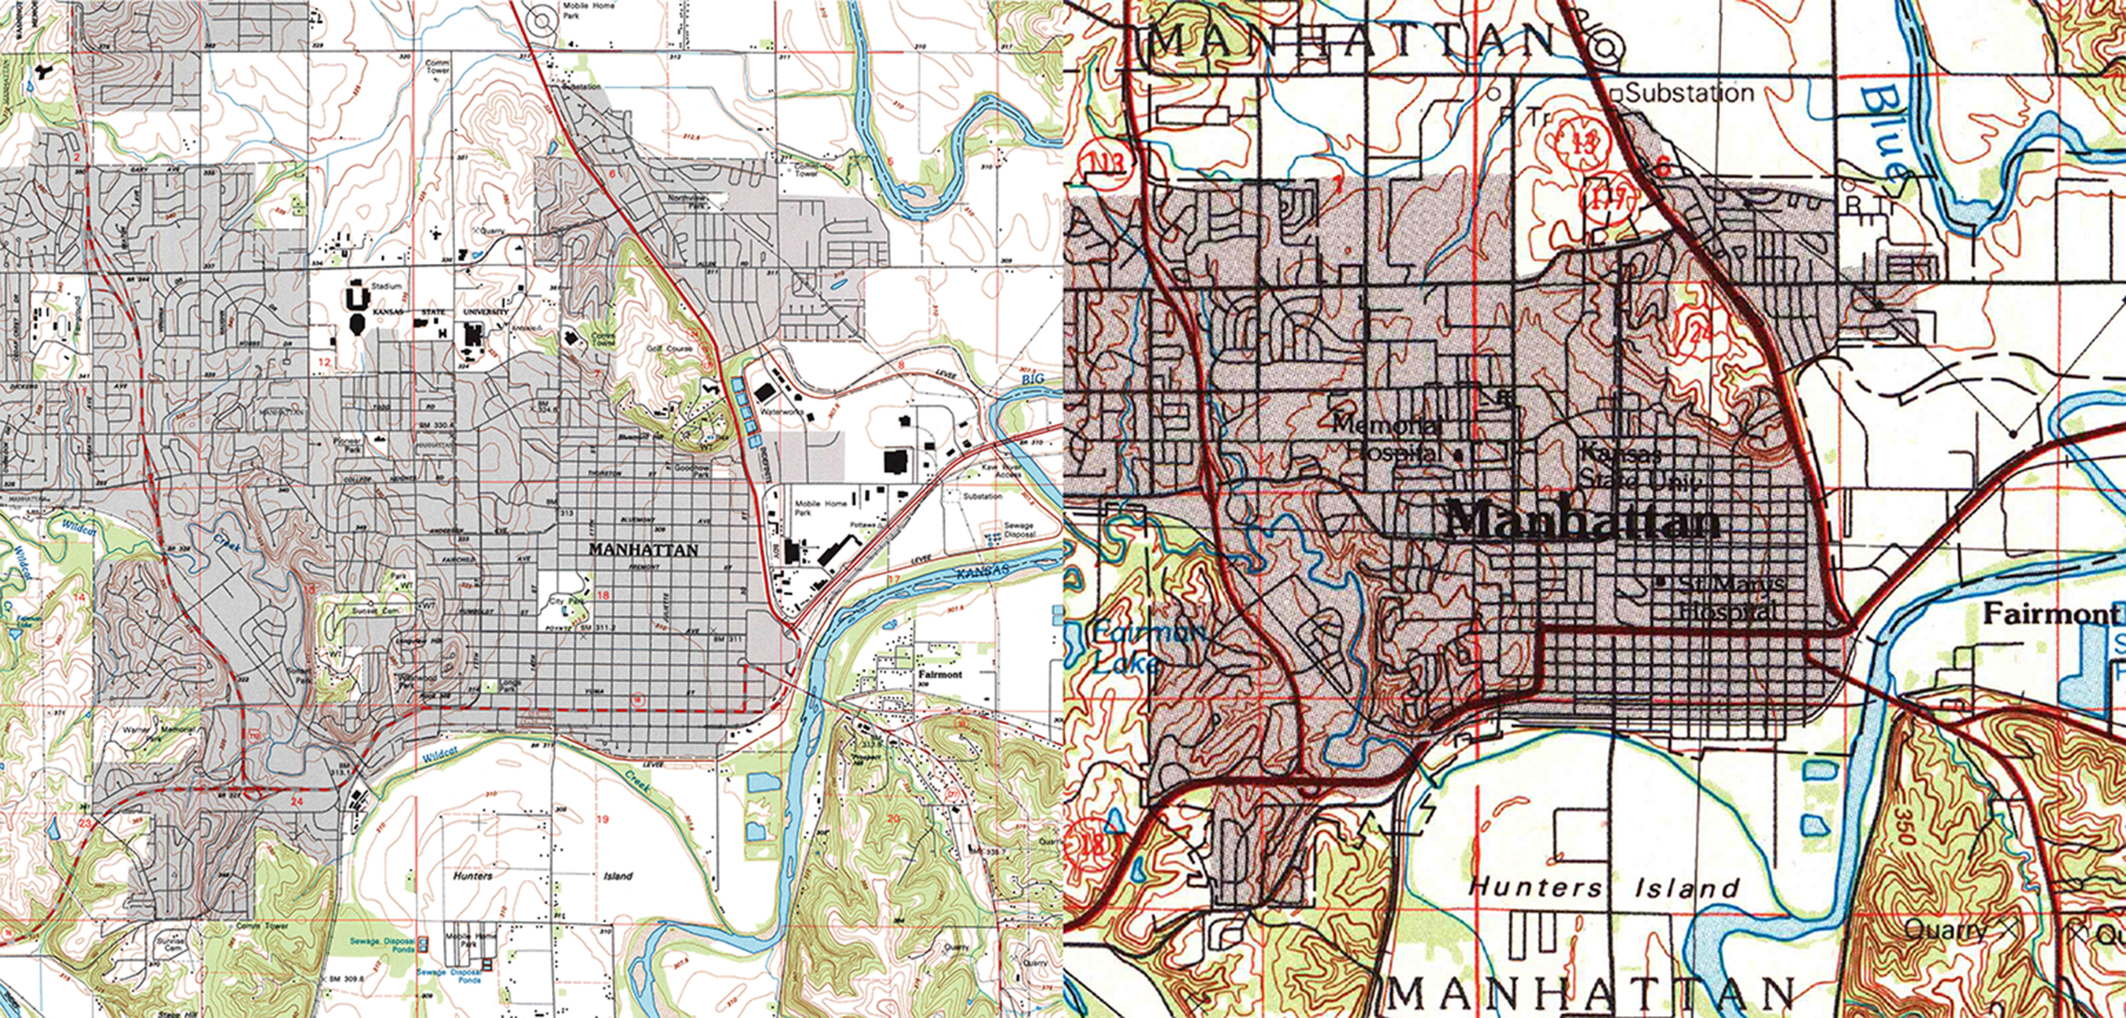
Scale is central to understanding and interpreting maps. Often map readers are familiar with the area being mapped, and some feature on the map gives context to the scale being represented. In the absence of familiar places or features, the scale declaration on a map is essential to correct interpretation. Fig. 3.2 gives an example of how this functions. Both maps appear visually identical, yet the change in scale leads to a completely different understanding of the pattern that we see.
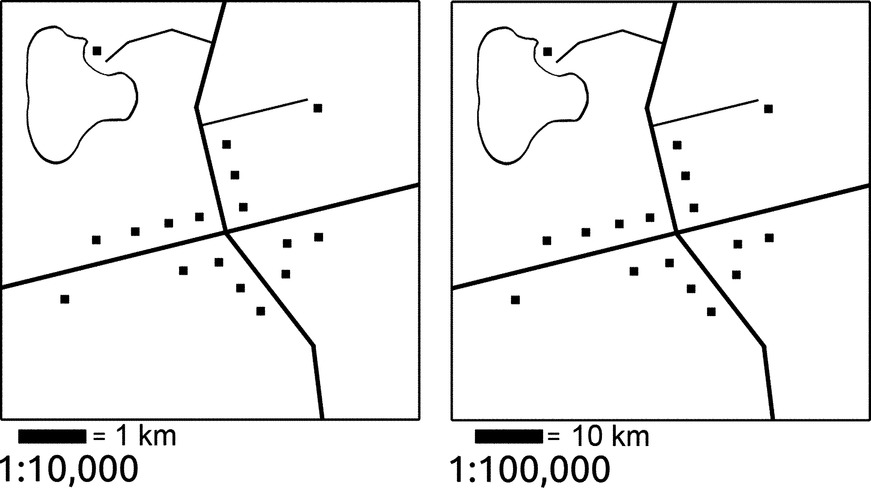
A concept related to scale is resolution, which comes into play most often in a digital context. Resolution can refer to a few different things, but in a geospatial context it commonly refers to the size in ground units of the pixels found in a raster image.1 Aerial photography and satellite imagery are commonly described by their spatial resolution, with a higher resolution indicating that each pixel represents a smaller piece of the Earth’s surface.2 For example, NASA’s Landsat 8 imaging satellite has multiple sensors that record the Earth’s surface at different resolutions (Garner, 2013). One sensor, the Operational Land Imager, records portions of the electromagnetic radiation spectrum, discussed in Chapter 4, that include visible light at a spatial resolution of 30 m or roughly 100 ft, meaning that each pixel in a Landsat image recorded by this sensor represents 900 m2 of surface area. The Thermal Infrared Sensor, a different sensor on the Landsat 8 satellite, has a spatial resolution of 100 m or roughly 330 ft, meaning that each pixel in these images will represent 10,000 m2 on the ground. Generally speaking, higher resolutions, meaning smaller pixels, are preferable when it comes to imagery, but it depends on the scale of the features being represented. For example, land cover at the global scale could be represented with 1 km2 pixels, while imagery with a resolution of 30 m might be better suited to observing land cover for an individual state. Knowing the resolution of raster imagery is an essential component to correct interpretation.
Resolution can also refer to the precision at which a paper map has been scanned into a digital format. A map that is scanned at 100 dots per inch (dpi) will have a lower resolution than one scanned at 600 dpi. A map scanned at a low resolution will have less detail, much like how a small-scale map will contain less detail than a large-scale map. Fig. 3.3 shows how scanning at different resolutions can affect the quality of the final product.
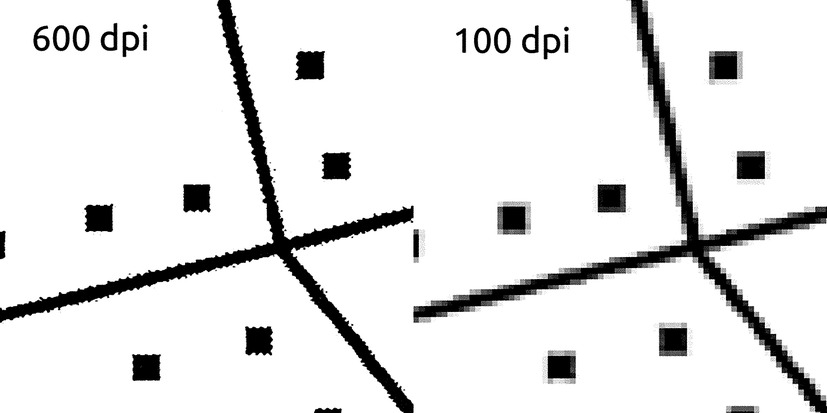
Geodesy refers to the study of the size and shape of the Earth (Robinson, Morrison, Muehrcke, Kimerling, & Guptill, 1995, p. 116). Calculating an accurate measurement of the circumference of the Earth has been a challenge to scholars for millennia. The ancient Greek scholar Eratosthenes, who around 240 B.C. used seasonal changes in the sun’s angle to estimate the size of the Earth, came within 15% of today’s precise modern measurements (Brown & Kumar, 2011). Eratosthenes’ circumference assumed that the Earth was spherical, but today we know this is not the case. Rotation along the Earth’s axis causes the poles to be flattened and the Equator to be stretched outward, leading to an ellipsoidal shape. Beyond that, we know today that the surface contains depressions and bumps, which creates a shape described as a geoid. The difference between the three reference shapes can be seen in Fig. 3.4. The differences in these three shapes do not generally affect maps at small scales. Yet, for large-scale maps that require high levels of precision and accuracy, the way the shape of the Earth is defined can be essential.

A datum combines a reference shape, typically an ellipsoid, with a tie point that fixes the reference shape to a position on the Earth. As an example, the North American Datum of 1927 (NAD27) uses the Clarke 1866 ellipsoid and puts its tie point at Meades Ranch, Kansas, Untied States, 39°13′26.68″N, 98°32′30.51″W, see Fig. 3.5. This provides the map creator with a surface to work with and a point of reference from which to start. The updated North American Datum of 1983 (NAD83) uses the Geodetic Reference System 1980 (GRS80) ellipsoid, and uses the center of the Earth as its tie point. In a digital GIS context, it is important to select the correct datum for the data used, as an incorrect datum can lead to reduced locational accuracy in the data, particularly on large-scale maps. This can lead to misalignment when multiple datasets are viewed simultaneously and errors in analysis output.
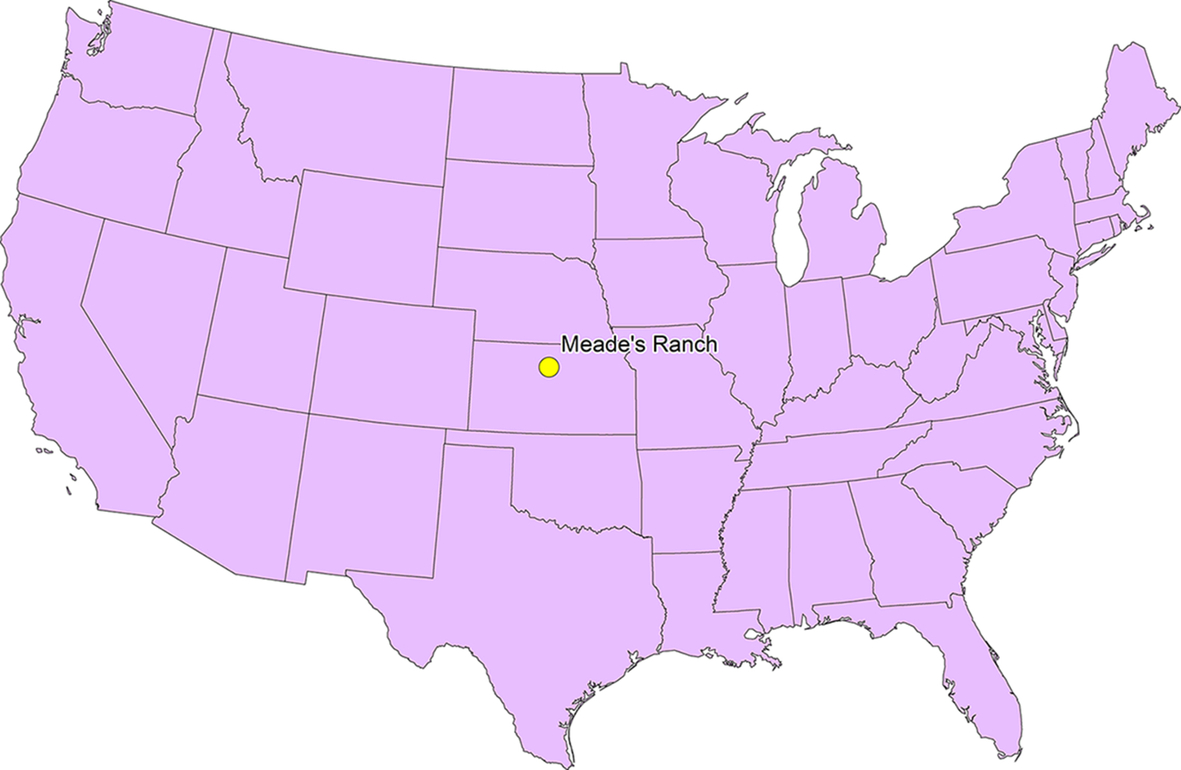
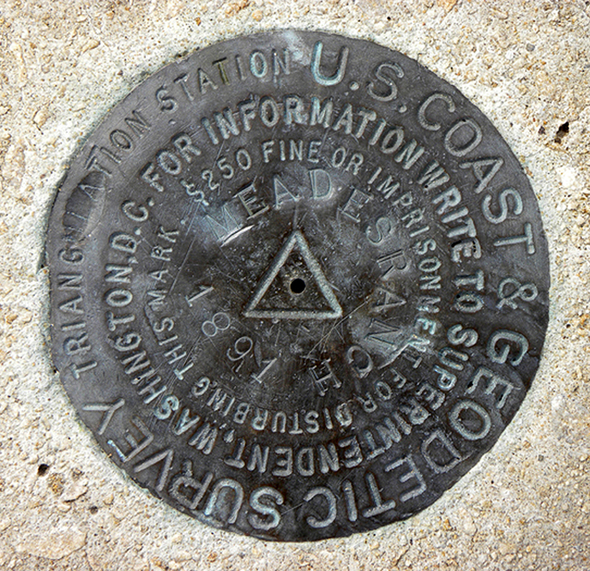
Maps are two-dimensional representations of three-dimensional space. Typically, they show a portion of the Earth’s surface, and as we have seen, the surface is rarely, if ever, flat. Projections are the tools that cartographers use to take the curved surface of the Earth and transform it to a two-dimensional map representation. Much like peeling an orange, the curved surface of the Earth cannot be made flat without distorting it in one way or another. Different projections have different approaches to how they mathematically transform earth-surface geometry to map geometry, but all projections create distortion in one or more geometric measures.
Projections begin with a datum, which is the combination of reference surface and tie point; then, an appropriate geometric developable surface is chosen. Developable surfaces are the “flat” surfaces that maps are projected onto, and can be planes, cylinders, or cones. These surfaces also have the option of being either tangent or secant to the surface of the earth. On a tangent surface, the developable plane touches the Earth once, at either a standard point or standard line. In the secant case, the developable surface cuts through the Earth and creates either one or two standard lines. These standard points and lines are important, as they represent the portions of the map with the least amount of distortion. The further away on the map from a standard point or lines one gets, the more geometric distortion exists. A visual example of the three types of geometric developable surfaces and their standard points/lines can be seen in Fig. 3.6.
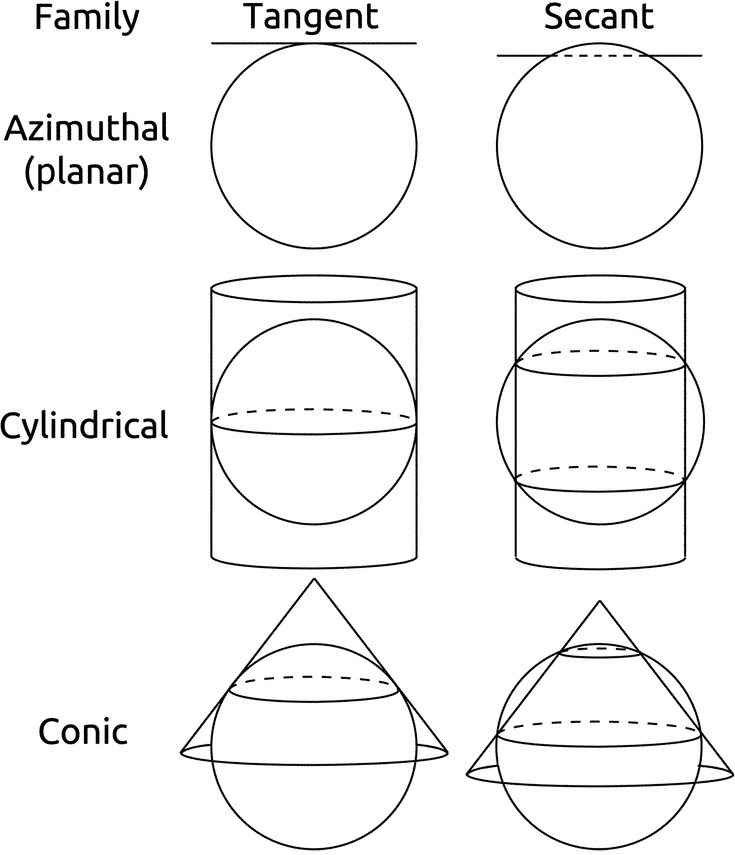
Purely mathematical projections not based on a geometric developable surface are also possible. Some resemble the geometric forms and are referred to as pseudocylindrical, pseudoconic, and pseudoazimuthal. The Mollweide projection is a pseudocylindrical projection, which can be seen in Fig. 3.7.
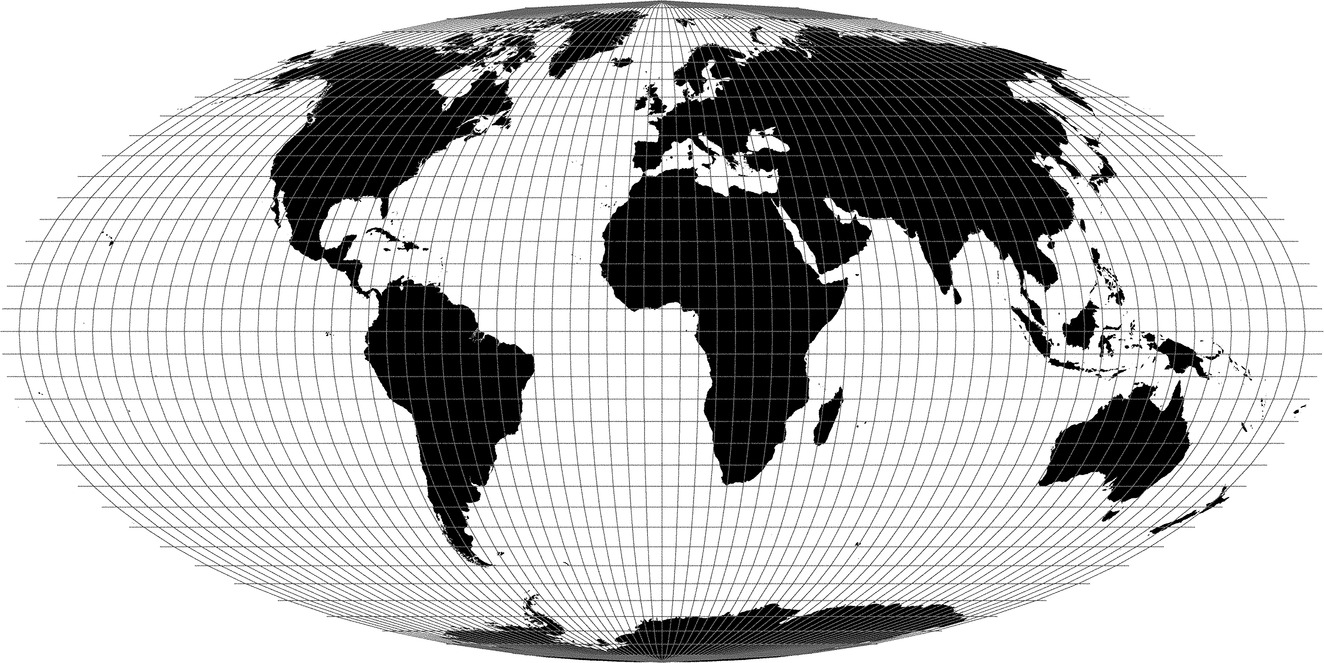
Next, the geometric properties of a projection must be considered. Equal-area projections, also known as equivalent projections, ensure that surface area is correctly preserved following transformation, but often at the expense of preserving correct shapes. The Hammer-Aitoff projection is an example of an equal-area projection, seen in Fig. 3.8A.
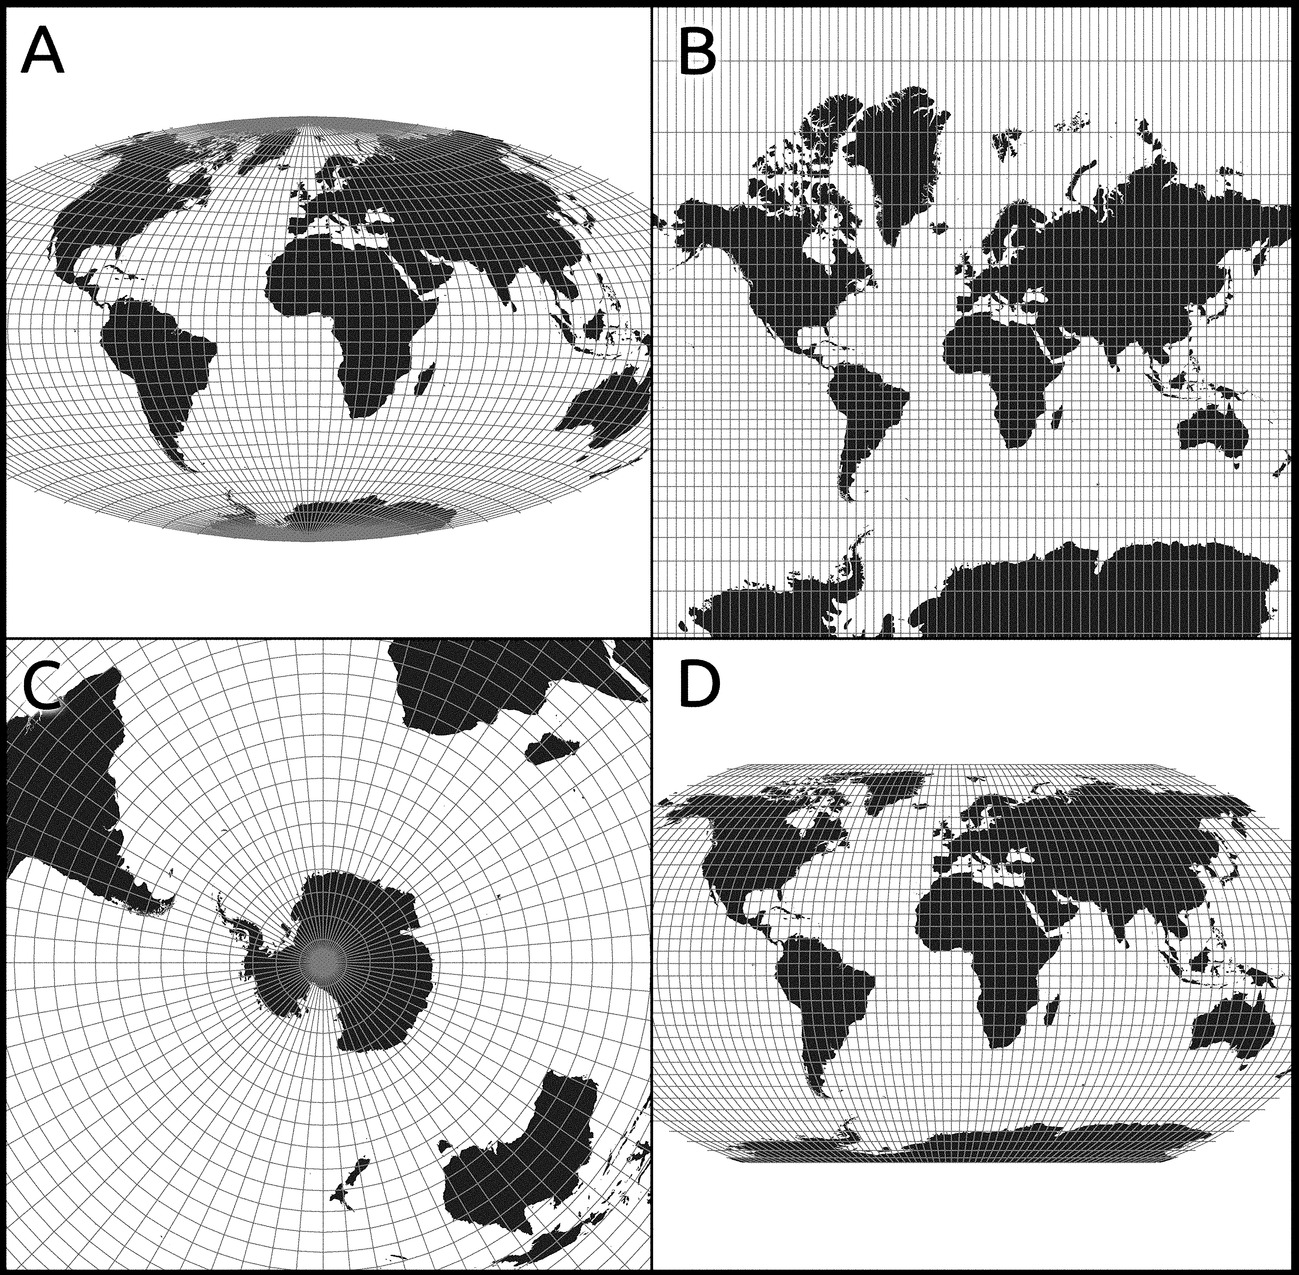
Conformal projections, known as orthomorphic projections, preserve the shapes of small areas around standard points or lines, while larger shapes such as continents may be highly distorted. The Mercator projection is an example of a conformal projection. Shapes are preserved close to a standard line on the Equator, but become more distorted farther away as seen in Fig. 3.8B.
Equidistant projections preserve distances of great circles, which are lines that converge at the poles. Distances in these projections are true from one or a few standard points to all other points, but they are not true between all points to all other points. Azimuthal projections can be equidistant and show true directions from a central point to all other points. Directions from noncentral points will not be accurate. Azimuthal approaches are not exclusive and can coexist with equivalent, conformal, and equidistant on the same map, although not all at once. An example of the South Pole Lambert Azimuthal Equal Area projection can be seen in Fig. 3.8C.
An attempt to find a good balance between the approaches can be found in minimum error or compromise projections that attempt to minimize error in all geometric factors. Error will exist in terms of shape, area, distance, and directions, but they are made to be as small as possible. These projections can be useful when a map does not need to have any one specific property preserved and does not wish to have the large distortions that can occur with other approaches. A compromise example can be seen in the Robinson projection in Fig. 3.8D.
The choice of a “correct” projection depends entirely on the goals of the map. If visual appearance is important, a compromise approach may be desirable, as it does not distort the map much in any measure. However, if a map is to be used for a specific purpose, the correct projection makes all the difference. For navigation, the preserved angles and compass bearings of the Mercator projection would be quite useful. Likewise, if measuring surface area was the purpose of a map, an equivalent projection would be called for. Many projections are used beyond this brief introduction, but it is important to remember that there is no one “correct” projection, only a toolbox of different projections that are appropriate for different circumstances.
One convention of mapmaking is that the top edge of the map points northward, although this is not always true particularly for older maps. This makes map interpretation easier, as readers are not required to reorient their mental orientation. North arrows are an essential component of maps, especially for maps where north is not at the top of the page. To assume the north arrow will always point up is an over-simplification though. For one, on small-scale maps, north may not be a consistent direction on the page. A single north arrow may point toward the top of the page, but this is not always accurate, as can be seen in Fig. 3.9.
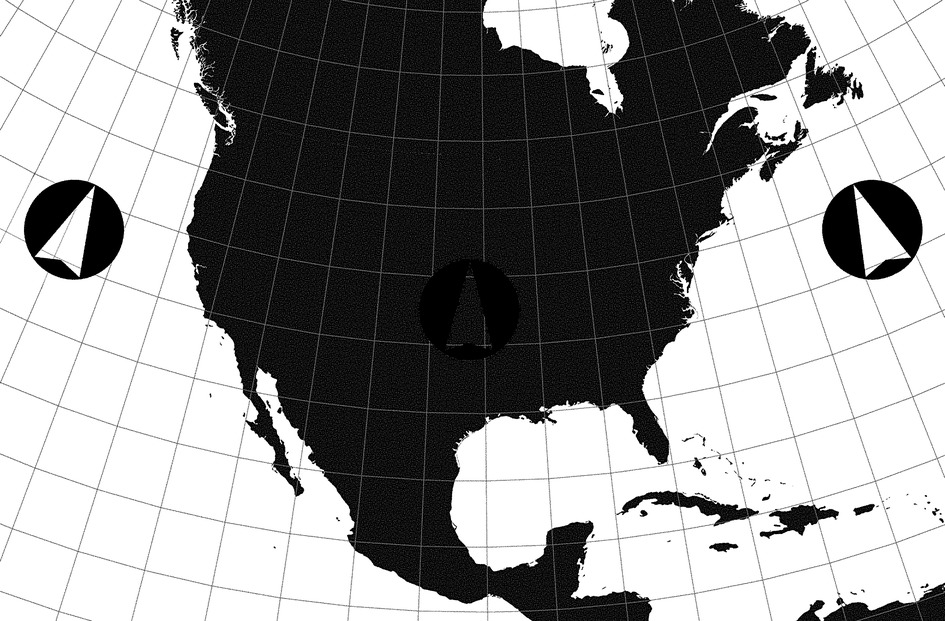
Also, differences exist between the locations of geographic north and magnetic north. Geographic north represents the place where the Earth’s axis of rotation exists. Magnetic north represents the location near geographic north where the Earth’s magnetic field points vertically downward. The difference between the two is called magnetic declination, and the difference changes depending on both the location of a map and when the map is set, as the Earth’s magnetic field is constantly shifting. USGS topographic maps will include the magnetic declination for each quadrangle. Knowing the magnetic declination of a place is essential to navigation via compass, particularly as one travels longer distances via compass bearing.
Fig. 3.10 shows an example of a statement of magnetic declination on a USGS topographic map. An excellent online resource shows past and present magnetic declination for any place in the world, displayed on the National Geophysical Data Center’s, Historical Declination Viewer (National Oceanic and Atmospheric Administration, 2015).
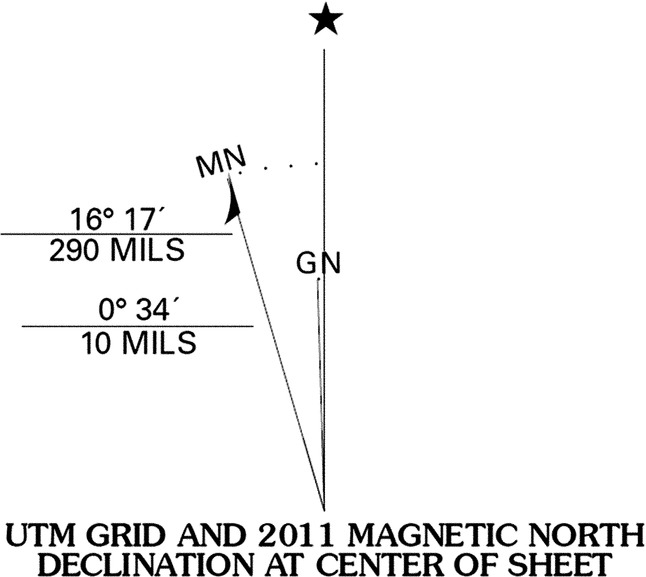
Cartographers use visual symbols to represent features on a map, and legends exist as a way to decode these markers. Some symbols may be labeled or otherwise self-evident on the page, but a mapmaker cannot assume that all readers will be familiar with the visual shorthand employed, and legends exist to explain what all the symbols on the page mean.3 For general reference maps, these might be dots, squares, triangles, or stars that might represent different human-built features on the landscape. For thematic maps that display a distribution of a variable, or the results of an analysis, the legend allows the reader to interpret the different colors, shading, or size of symbols on the page. Legends may also include ancillary information regarding data distributions or methods for maps that involve statistical analyses. One common way that information in a legend can be useful is describing how maps symbolize terrain, as described in Chapter 2.
In order to keep track of the location of places and objects on the Earth, grids are often employed. These grids, or coordinate systems, are at their most basic no more complicated than simple Cartesian planes, with a starting origin and X, Y measurements to represent a location within the grid. The grid will have uniformly spaced lines with intersections having right angles without regard to the curvature of Earth (Larsgaard, 1998, p. 261).
Some coordinate systems use +/− notation to indicate locations in relation to the origin. Other coordinate systems apply a false origin, arbitrary numbers added to the coordinates, to ensure that no coordinate numbers will ever be negative within the system. It is coordinate systems, along with a datum that gives reference to the surface, that allow us to make the geometric transformations necessary for projections.
Although similar in appearance, the graticule is not equivalent to a coordinate system. Rather, graticules are spherical indicators of the imaginary network of parallels and meridians representing latitude and longitude on a map. While useful as a reference to location, a graticule cannot be used for computational purposes in the same way that coordinate systems can (Iliffe, 2000). Examples of graticules can be seen in Figs. 3.8 and 3.9.
As an example of grids and graticules, many map librarians may be familiar with historic USGS large-scale topographic quadrangles that show one graticule and two grids. Again, the graticule is the latitude/longitude system; whereas, grids are Universal Transverse Mercator (UTM) and U.S. Public Land Survey System.
One of the most commonly used methods of referencing locations on the Earth is the latitude and longitude system. Latitude is the angular measure of a location north or south of the Equator. It can be easily measured using the angle above the horizon of either the Sun or a Pole Star. In the northern hemisphere and near the Equator, Polaris, known as the North Star, is the pole star. In the southern hemisphere, the pole star is the faint South Star or Sigma Octantis, but navigators have long relied upon two stars in the Southern Cross constellation that point in the direction of the South Pole. The fact that we are measuring in angles is a hint that latitude and longitude are measures of a spherical Earth, whereas the coordinate systems described later in this chapter are two-dimensional representations. While the measurement of latitude has a straightforward physical basis in the Equator, longitude is based on an arbitrary starting point known as the Prime Meridian located in Greenwich, England. Historically several prime meridians were in use by different countries, but the current accepted Prime Meridian is the one in Greenwich, see Fig. 3.11.
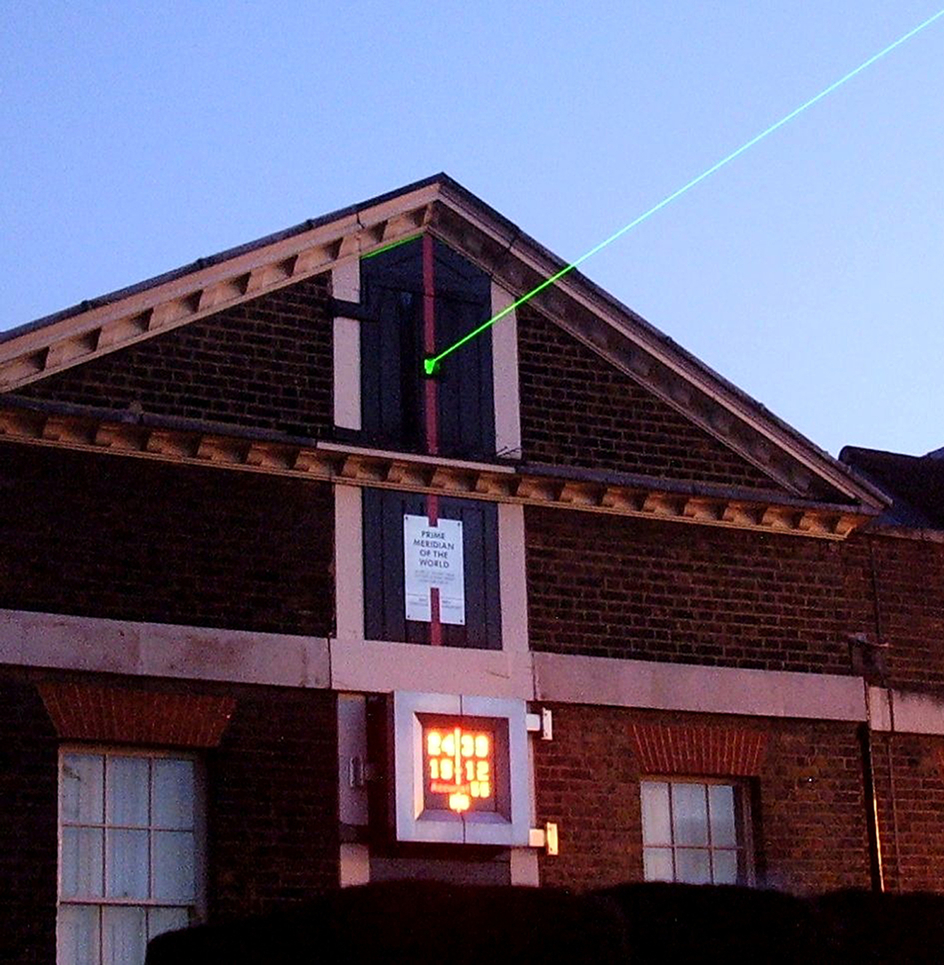
Longitude was a more challenging measurement in historic times, with a reliable solution not appearing until John Harrison’s Marine Chronometer was invented in the 18th century. Harrison’s sea-worthy timepiece was an answer to the British Board of Longitude’s challenge, for which he received the Longitude Prize, a considerable cash sum of more than £15,000 (Brown, 1949). Today, latitude and longitude are most commonly measured using global positioning systems (GPS) such as the U.S.’s NAVSTAR system or Russia’s GLONASS system.
Lines of latitude are referred to as parallels, as the surface distance of one degree is always a consistent 111 km. Lines of longitude are referred to as meridians, and the distances from one to the next are 111 km at the Equator, but become shorter as they approach the poles where the meridians converge. Measures of latitude/longitude can be notated as either degrees-minutes-seconds (DMS) or decimal degrees (DD) and can use either a cardinal direction or +/− symbols to indicate direction from the Equator or Prime Meridian, as seen in Table 3.1.
The Universal Transverse Mercator (UTM) system was created by several allied nations following World War II (Dracup, 2006a). This system was an attempt to have a unified, projected two-dimensional coordinate system as opposed to sharing information between nations in multiple disparate formats. The system covers from 80°S to 84°N, and divides the Earth into 60 six-degree sections east-west. It uses a secant Transverse Mercator projection with a base unit of the meter, and is accurate to one part in 2500. UTM is commonly used in a GIS context, as it covers, and is consistent, across most of the Earth’s surface. The Polar Regions not covered by the UTM system are covered by the Universal Polar Stereographic System.
The State Plane Coordinate System (SPCS or SPC) was created in the 1930s in the United States as a way to allow engineers and others to work within a system of two-dimensional plane geometry as opposed to having to use more complex spherical calculations (Dracup, 2006b). Accuracies are one part in 10,000, as the different SPC zones are small enough that they can reduce geometric distortion more so than the larger zones found in the UTM system.
The original SPC system relied on the NAD27 datum and the foot as a unit of measure, but today SPC uses the NAD83 datum, and the meter as the unit of measure. Some states have only one SPC zone, but many have two or more zones of coverage. SPC zones that are elongated east-west use a secant Lambert Conformal Conic projection, while north-south elongated zones use a secant Transverse Mercator projection. A secant Oblique Mercator projection is used for one section in Alaska. Zones use a false origin to ensure that all coordinates within the zone will be positive values, the exact specifics depending on the zone in question.
In the United States, the Public Land Survey System (PLSS) is one the of the most important grid systems in use for managing land ownership and infrastructure. It differs from UTM and SPC in that its basic unit is the acre, and it is defined from the ground, not from a virtual grid (Robinson et al., 1995). It establishes a series of origins, known as principal meridians and base lines, from which further measurements are based. These origins are visible in Fig. 3.12.
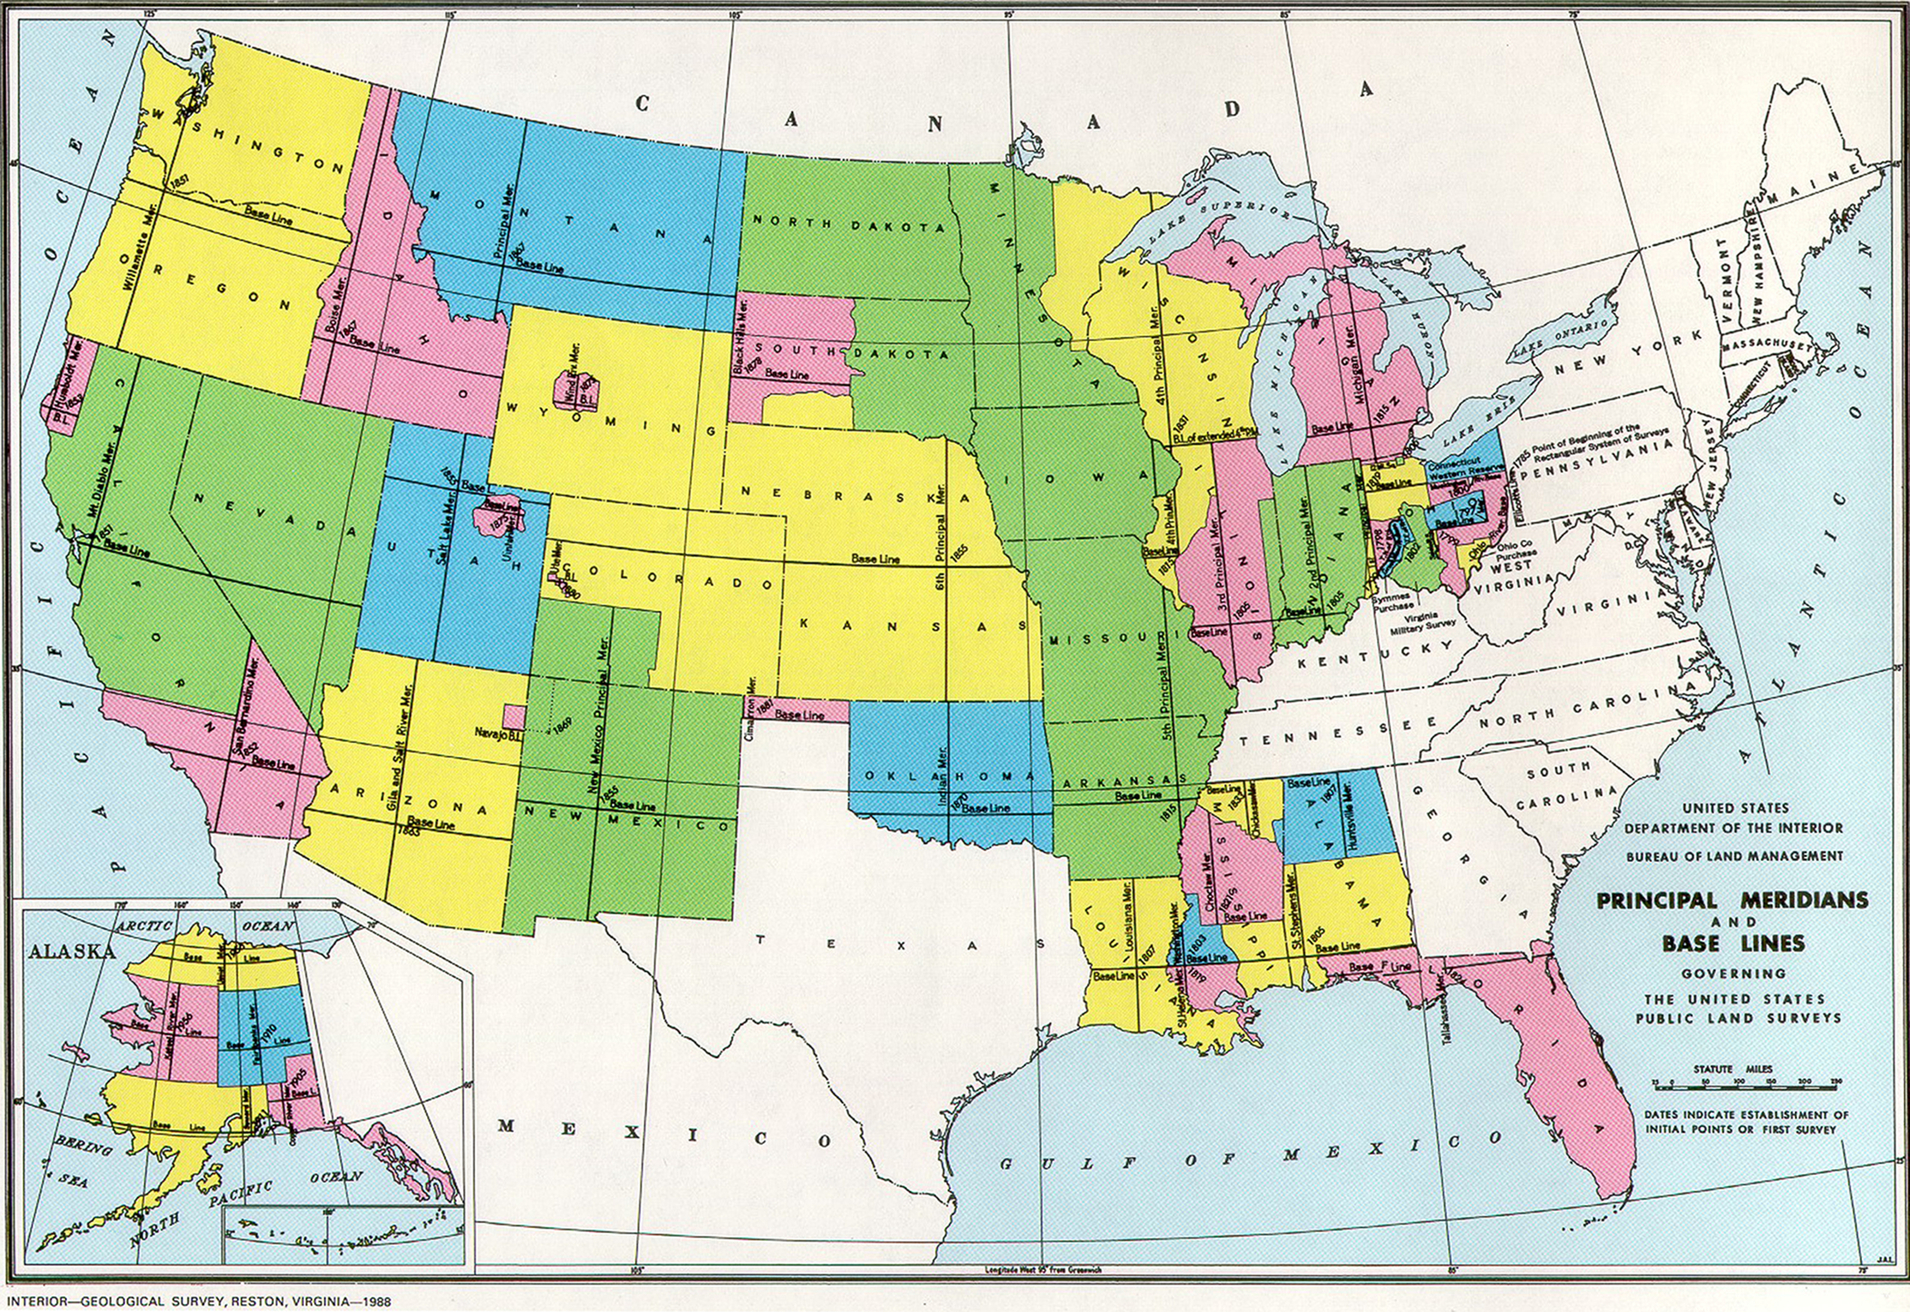
In the PLSS, land is partitioned into six-mile squares, identified by a township number N/S of the base line, and a range number E/W of the principal meridian. These six-mile squares are further divided into 36 sq mi sections. Each of these 36 sections may be subdivided into quarters, which can be further subdivided into quarter-quarters. A subsection’s location might be described as the northeast quarter of the northwest quarter of section 4, township 18 south, range 9 east, Sixth meridian, Kansas. The layout of township and range can be seen in Fig. 3.13.
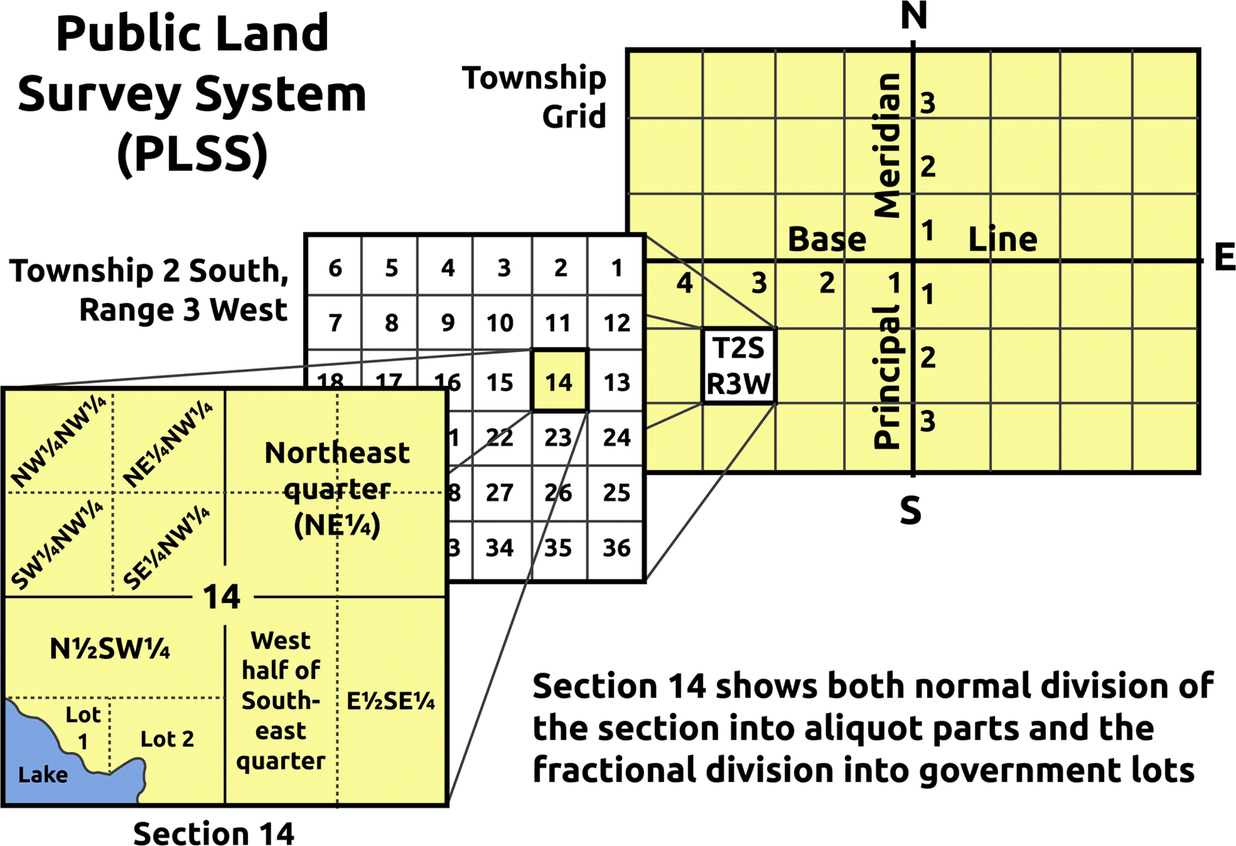
While the PLSS dominates the landscape of most states west of the Appalachian Mountains in the United States, an older system of land surveying can be found in the metes and bounds system. The system is interpreted as measure of the limits of a boundary. This system describes land parcels by beginning with a landmark as an origin and giving a verbal description of the boundaries “walking” around the edges. This survey system does not adhere to any grid, and therefore tends to describe more irregular shapes than the neat, rectilinear layout of the PLSS.
There are 19 Eastern states settled before the Land Ordinance of 1785 and Northwest Ordinance of 1787, which were the beginnings of the PLSS (U.S. Geological Survey, 2016). The survey system used in Hawaii is Kingdom of Hawaii native system and in the others, the British system of metes and bounds or some combination of PLSS with the British system or Spanish and French Land Grants. Legal land descriptions regardless of the system are used for identifying ownership and taxation. It can be confusing integrating the methods used in different states and countries and adjusting for the three-dimensional Earth, represented in a two-dimensional plane of a map.
Cartography is a complex subject, marrying the visual graphic arts and the sciences of data visualization and Earth measurement in equal parts to create coherent, informative maps. Today, our digital culture is adding factors of location tracking and navigation through global positioning systems, real-time map modification, and interactive maps to the toolbox. Despite these changes in the field of cartography, the underlying structure of maps remains similar to that of the maps created in antiquity. Understanding some of the basic concepts used to create maps will allow librarians and library users to better interpret and use them, as well as find maps that serve their specific needs.
As Chapter 2 illustrated, maps describe a wide variety of themes and employ many different visualization techniques to display them. While they have historically been drawn by hand, maps are often created today using a modern geographic contribution, geographic information systems (GIS). This field of study includes a broad collection of tools, techniques, and ways of thinking about spatial data and how it can be analyzed and displayed. Technicians collect field data with a GPS unit, analysts use desktop computers to make sense of spatial data, cartographers use GIS technology to visualize information, and policy-makers base decisions on map service providers engaged in the practice of GIS. With GIS, we can not only visualize spatial data, we can also analyze it for patterns to gain a better understanding of the natural and human world. Remote sensing (RS) is an overlapping field that centers on the use of raster imagery for monitoring and analyzing the world. Remotely sensed data are often used as a component of a GIS analysis. It is imperative that librarians be familiar with geospatial analysis and RS to assist clients in finding geospatial resources and creating instructional services for online mapping programs. This chapter defines and describes GIS and RS and how they can be used to study, monitor, and manage both natural and cultural factors in the world.
Geographic information system; Geospatial data; Remote sensing; Vector; Raster; Aerial photography; Orthophoto; Georectification; Landsat; Multispectral; Resolution; Electromagnetic radiation; False color
A geographic information system (GIS) is generally described as a collection of various tools and practices that work together to analyze spatial data. At its root, the power of GIS comes from the fact that it combines both spatial and attribute data allowing us to not only see where things are, but also describe what they are in great detail. This spatial database approach helps to expose patterns and links that might otherwise not be visible in a nonspatial context. Esri, the creators of the industry-standard ArcGIS software, describes a GIS as:
An integrated collection of computer software and data used to view and manage information about geographic places, analyze spatial relationships, and model spatial processes. A GIS provides a framework for gathering and organizing spatial data and related information so that it can be displayed and analyzed.
(Law & Collins, 2015, p. 770)
You may have noticed that we have described GIS as a geographic information system in the singular, as opposed to describing the field as geographic information systems in the plural. This distinction comes in part from the early days of GIS in the 1960s and 1970s, when computer-aided spatial analysis necessarily relied on mainframe computer hardware and often proprietary command-line software for analyzing data (Coppock & Rhind, 1991). An individual setup could be referred to as a geographic information system. Most spatial analysis carried out today does not rely on the mainframe model, although a specific collection of hardware, software, and data can still be referred to as a geographic information system. Goodchild (1992) described a growing disconnect between the practice of using a GIS and the science that drives GIS technology. He coined the term geographic information science (GISci) as both a way of making a distinction between the two and pointing a spotlight on some of the major theoretical hurdles facing the GIS world.
Today a GIS is most often a combination of a desktop or notebook computer using GIS software with a graphical user interface, while accessing data stored locally, on a centralized server, or in the cloud. The GIS software is often Esri’s ArcGIS, although other commercial and open-source packages such as QGIS are in use, see Chapter 7 for a discussion of available software packages. Data are frequently combined with locally hosted information collected in the field via Global Positioning System (GPS) units for analysis. If all the talk of definitions and distinctions is confusing, do not panic! Colloquially, the software is simply referred to as GIS software, while the practice of working with a GIS is commonly known as doing GIS. While GISci is an important component to the field, many users never come into contact with this element of GIS in their day-to-day activities.
GIS is powerful because it can tie spatial vector data to nonspatial database information, allowing us to visualize this information. Spatial vector data are the locational infrastructure; nonspatial database information, or attribute data, refers to features in a table such as schools or types of crime within a particular city. Each database feature corresponds with a coordinate-based vector feature and is mapped within a geographic coordinate space. This results in separate maps or layers of information. While looking at one layer of information can expose spatial patterns not visible from the ground, one of the ways that GIS lets us explore more complex questions is by layering multiple sources of information. By taking multiple layers of data representing natural and human-built features, GIS can create a model of portions of the Earth’s surface, see Fig. 4.1.
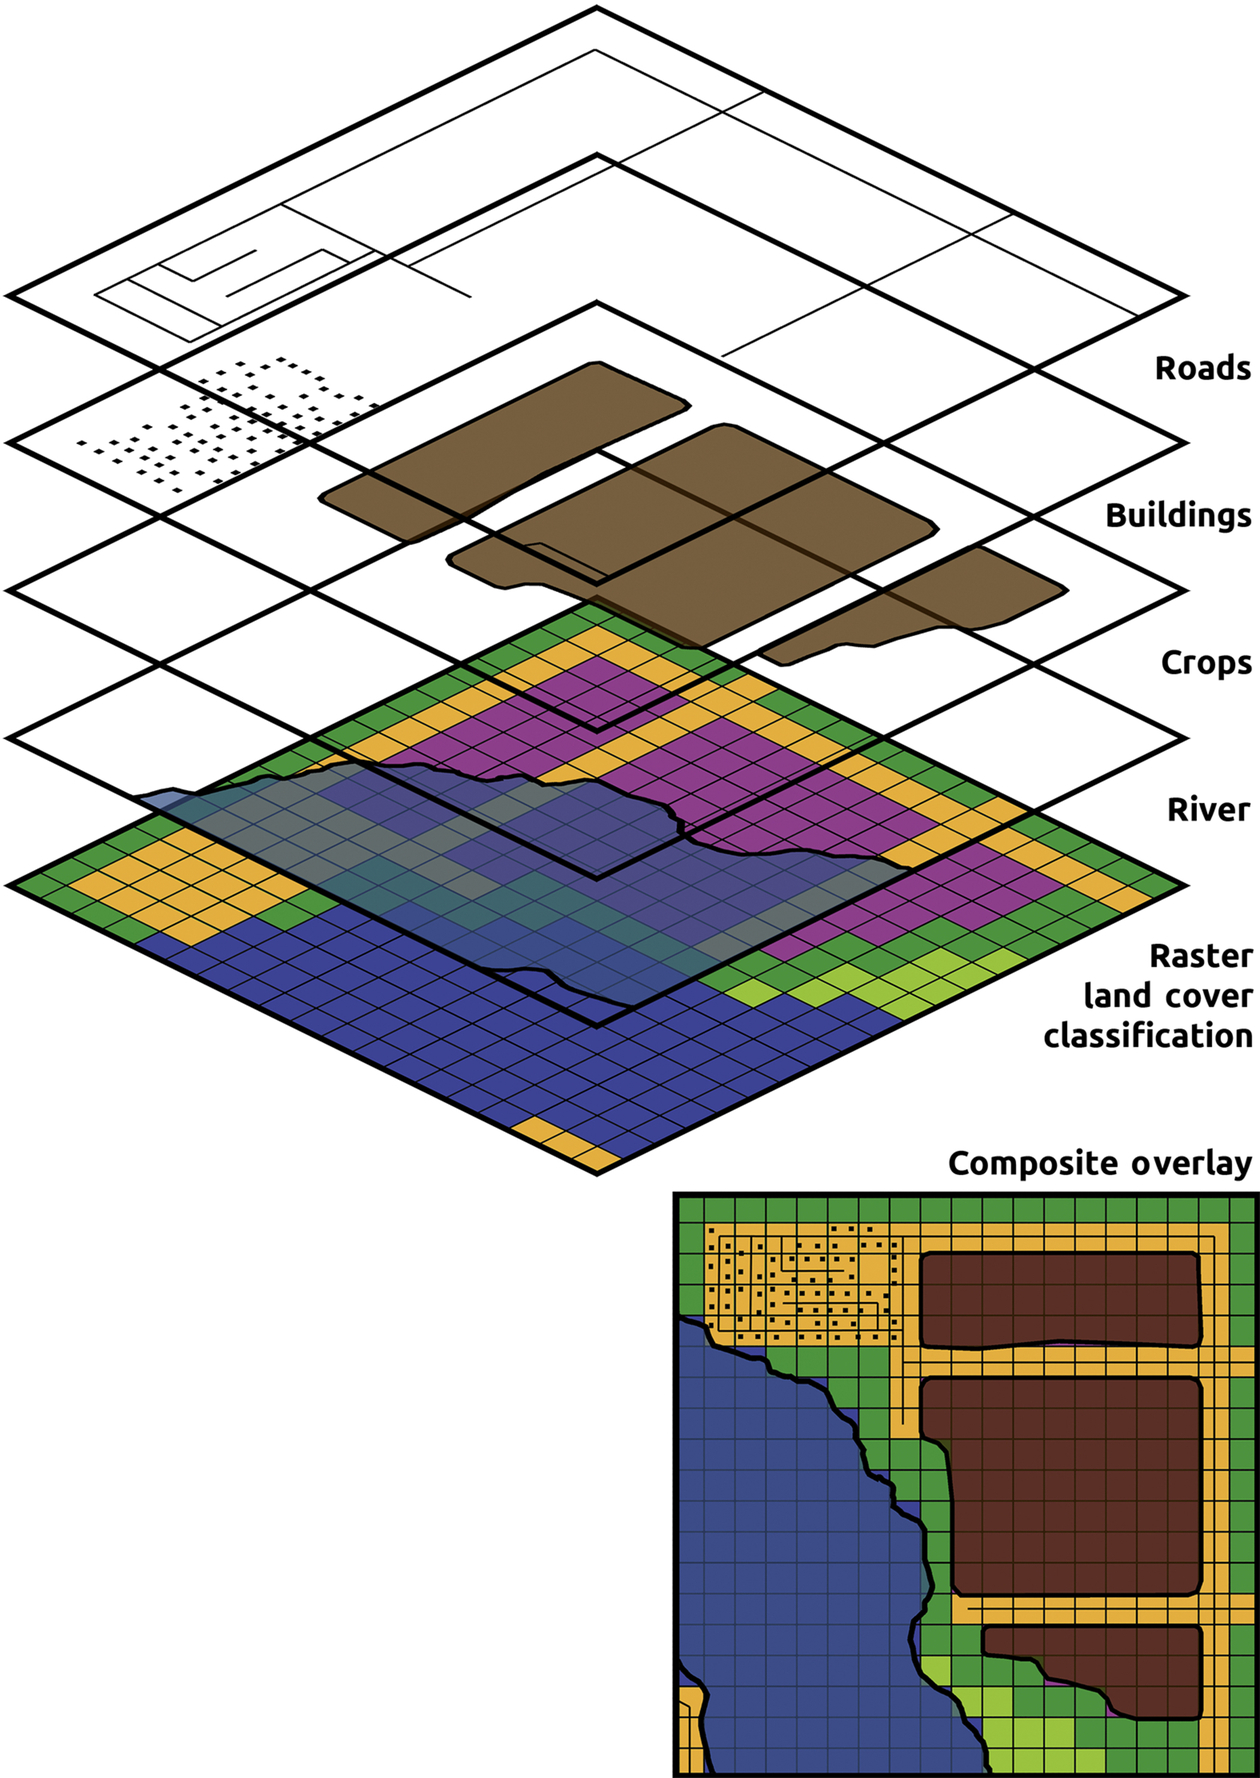
These models can be incredibly powerful, allowing us to see previously unknown connections between disparate systems and predict how changes in human behavior may affect the natural environment. Some models only require a few layers of information while others can be quite complex, factoring in many layers of information. One model might show the location of schools in a city relative to crime events. Another example could layer data describing elevation, soil, surface cover, and precipitation information to explore urban flooding. By modifying the data in the surface cover layer we could then determine what impact a proposed parking lot for a new shopping center might have on flash flooding in a city.
Another example of how layering data can be used to answer complex questions is a site suitability scenario. Imagine that you have been tasked with finding areas where an endangered species lives in order to better protect it. This species has certain requirements for life, including the presence of particular plant types for food, a specific type of soil, average temperature range, and amount of annual rainfall. Finding the possible habitat would involve four different layers of information, each describing the requirements above. When the four layers are overlaid, some areas will meet only some of this species’ habitat needs, but other locations will meet all four. In this way, you have discovered the suitable sites for this species to live, see Fig. 4.2. A similar example based in the human world would be choosing a site to build a new factory. The factory would need to be close to major transportation routes, large enough population centers to gather employees, and have suitable terrain for the building. By layering information about the natural and human environments, suitable locations for the factory could be discovered.
These examples describe relatively simple GIS operations, but by layering GIS data, we can discover a great deal of information. Combining this layering approach with more advanced techniques, such as spatial statistical analyses, the power of GIS has made exploring and understanding the world more accessible and manageable.
“Remote sensing describes the collection of data about an object, area, or phenomenon from a distance with a device that is not in contact with the object” (U.S. Army Corps of Engineers, 2003, p. 2-1). This is a broad description, but it generally refers to the use of aerial platforms such as planes, drones, kites, blimps, and satellites for gathering raster imagery. Raster data define space with a continuous series of rows and columns of cells or pixels each with its own attribute value. While remote sensing (RS) is its own field, it often acts as a complement to GIS analyses, adding unique information and analysis techniques to the GIS toolbox. For example, most GIS software packages contain common RS tools for working with raster imagery.
There are two types of RS, active and passive, and they are generally used for different applications. Active RS involves sending out a signal and waiting for its return to the sensor. RADAR and LIDAR are examples of active RS, as they send out energy, microwave and laser pulses respectively, and record the signals as they bounce back (Derr & Little, 1970). Since this effectively measures the distance between the sensor and the target, one of the major uses of active RS is to generate three-dimensional models of surfaces and elevation. RADAR RS also has the advantage that it passes through cloud cover, allowing for imaging even in cloudy atmospheric conditions (ESA Earthnet Online, 2014).
Passive RS does not send out a signal to be returned; rather, it records information using energy already present in the environment. This means that passive imagery is generally collected during the day, when the sun provides plenty of incoming radiation to reflect off the Earth’s surface. This type of RS can be in the form of aerial photographs, but like the active approaches, it can go beyond what we think of as pictures. One of the most powerful elements of remotely sensed imagery is that it lets us see information outside the visible spectrum. Human eyes can see only a narrow portion of the electromagnetic radiation (EMR) spectrum, see Fig. 4.3, but wavelengths that fall outside our range of vision can tell us a great deal about the natural world.
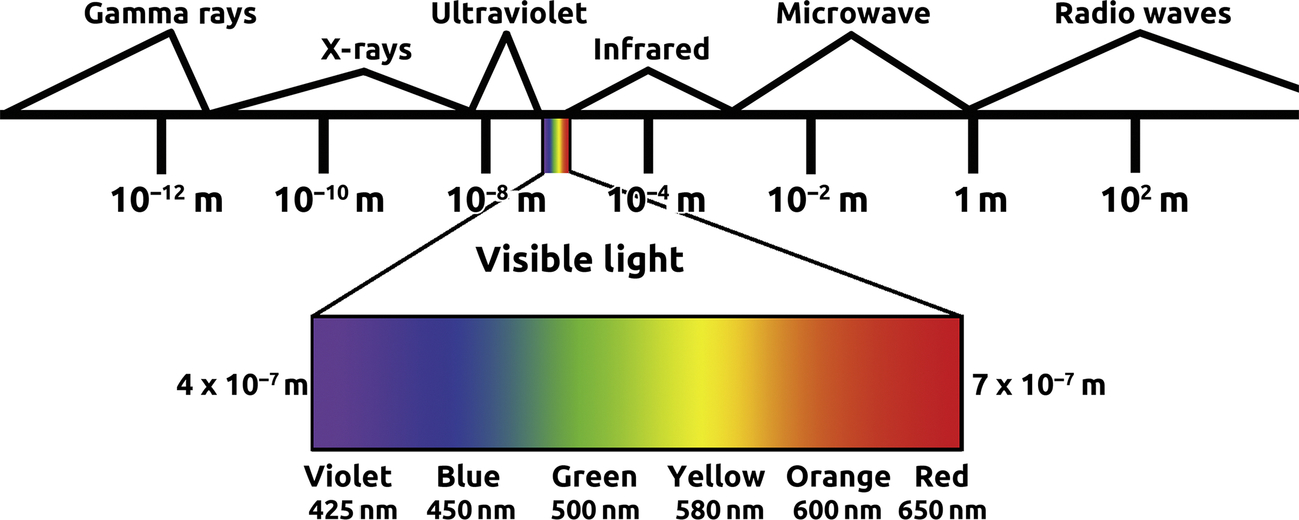
Using information from multiple bands of the EMR spectrum, remotely sensed imagery can help us to identify objects and materials on the surface of the Earth. Every material will respond uniquely to incoming solar radiation, absorbing, transmitting, and reflecting EMR in differing amounts depending on the physical properties of that material and the incoming radiation’s wavelength (Natural Resources Canada, 2015). Using this knowledge, we can look at an image showing the volume of different wavelengths reflected back from a surface, known as the spectral response, and know that one portion of the surface is covered in asphalt while another is a field of grass. That example may sound a bit obvious to the point of not needing a satellite, but RS can also help us to distinguish between much subtler features, differences that oftentimes cannot be determined using our eyes.
One classic example is the use of the infrared portion of the EMR spectrum to monitor vegetation. Not only will different species of plants have different spectral responses at a given time in their lifecycle, the health of a particular species can also be determined based on its spectral response (Tucker, 1979). Because vegetation monitoring often uses a nonvisible portion of the spectrum, it is displayed using false color imagery. This shifts the primary colors of the visible spectrum into the nonvisible portion, allowing us to see how intense the infrared response is in the case of vegetation. An example of false color imagery can be seen in Fig. 4.4; in this example, the colors pink and red indicate healthy green vegetation. This kind of information has a variety of practical uses, from monitoring for drought conditions, tracking responses to climate change, and following the health of individual fields for precision agriculture.

Digital geospatial data are generally stored in two different forms: raster or vector. The two formats are fundamentally different from one another in their structures, and each one has strengths and weaknesses regarding their ability to represent the world. Vector data are good at representing discrete objects and features with high levels of precision. A vector file is made of a series of points, lines, and polygons existing on a Cartesian coordinate system, typically a coordinate system tied to the Earth’s grid, as discussed in Chapter 3. Points are quite simple, consisting of a set of X/Y coordinates defining the location, while lines are made up of a series of points that are connected. Polygons are a series of lines that form an enclosed feature; examples of vector data can be seen in Fig. 4.5.
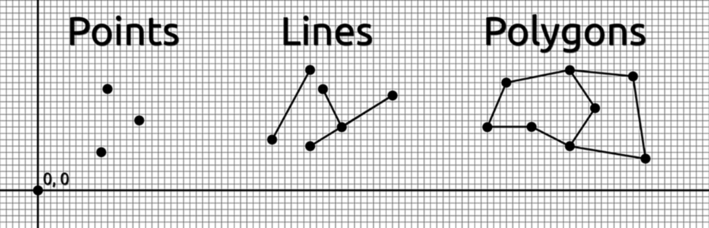
Individual vector features are tied to tabular attribute data representing information about the feature, and each vector feature can be connected to any amount of tabular data. For example, a single point in a vector file might represent a city; querying the point would show a table with fields representing the city name, the population, the demographic breakdown, economic information, or any number of pieces of information tied to that particular point object. In this way, vector data allow us to take advantage of the spatial database structure of GIS. However, because of the discrete nature of vector geometry it is not particularly good at representing continuous features such as elevation. Additionally, the math involved in vector spatial analysis tends to be more complex than that employed in raster analyses.
The structure of raster data is one that most people are likely familiar with, as it is the basis for most of the electronic displays that we use today. Rasters operate in the same way that a cell phone, computer, or television screen does: they are a continuous grid of cells (or pixels), each with its own single attribute value. In the case of a digital photograph, these values represent the colors that form the overall image. Rasters can be photographs, but they can also display nonphotographic information. Fig. 4.6 shows an example of a nonphotographic raster conception of the world where the Earth’s surface has been classified into land-cover categories. Each cell has a single value representing what is on the ground in that grid space and no empty cells exist in the grid. Because of this continuous nature rasters are good for representing data such as elevation or surface temperature.
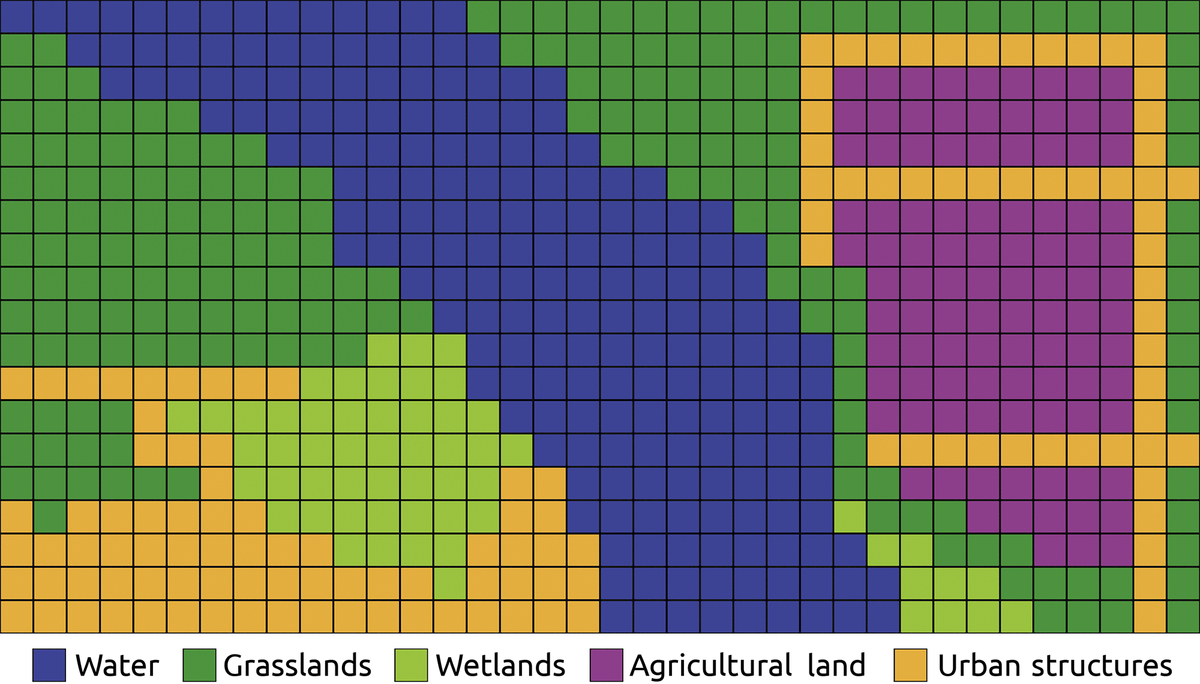
The single variable per cell is an obvious limitation of the raster format, as natural features are rarely if ever laid out in neat, evenly distributed square cells of material. In reality, nature is not grid-friendly, with uneven distributions of materials and fuzzy boundaries between land-cover types. Related to the issue of the artificially imposed grid is the question of resolution. As illustrated in Chapter 3, the resolution of a raster image indicates how much surface area is described by an individual cell. The lower the resolution, the more generalization is being made about the surface. Higher resolutions are generally preferable, as an image with 1-m resolution will show much greater detail in the scene than one with 1-km-sized cells. Unfortunately, as the resolution increases, so too do storage requirements, and large, high-resolution raster datasets can be slow to display and analyze, not to mention how quickly they can fill computer storage.
A great deal of raster data comes from the remote sensing field, in the form of aerial photographs and satellite imagery. Aerial photographs have been taken nearly as long as the photographic process has existed. Today air photos can be found in black and white, color, and color infrared, see Fig. 4.4. Although it might seem simple, aerial photography is not as straightforward as taking a picture from a plane or kite. The surface of the Earth is not flat, and all camera lenses introduce distortion to the images they collect. Orthophotos are aerial images that have been corrected to remove these distortions from the photo, thus representing ground features in their accurate locations from a vertical perspective (Southard, 1958). The process of this transformation is known as image rectification or georectification. By taking photos and digitally georectifying them to remove distortion and apply geographic coordinates, it allows a RS or GIS user to make accurate measurements from the photo, making them suitable for advanced spatial analysis techniques.
Satellite imagery comes from a variety of sources, some public, others private. The topic of choosing appropriate satellite imagery involves many factors; chiefly, these revolve around cost and resolution. Some satellite data are freely available, such as that generated by the Landsat program, while other sources charge for access to imagery. Ideally, freely available data can be used, but sometimes it may not meet all the needs of a particular project, necessitating a purchase of data. As previously mentioned, resolution refers to the scale at which data are collected, and in the context of satellites, it could be in reference to cell size, scene size, return time, or spectral coverage. The cell size is the ground area covered by an individual cell in the image. For example, imagery in the red/green/blue visible spectrum collected by the GeoEye-1 sensor has a resolution of 1.84 m meaning each cell in the raster covers 3.4 m2, while Landsat 8’s imagery in the visible spectrum has a resolution of 30 m, covering 900 m2 (e-geòs, n.d.; Garner, 2013). If a project needs high levels of detail, the GeoEye imagery would likely be better suited to the task.
Related to resolution is the scene size, or how much surface area is covered in a single image. Generally speaking, satellites with higher cell resolution will cover less surface area in a single scene than those with lower spatial resolutions. Looking at GeoEye and Landsat 8 again, the swath widths of their imaging sensors are 15.2 km and 185 km, respectively. Satellites with smaller scenes will require more images to be combined to cover larger areas, whereas lower resolution imagery can cover the same ground in a single image. Regarding return time, imaging satellites orbit the Earth in such a way that they will be able to return to the same piece of ground every few days or weeks. GeoEye’s return time is less than 3 days, while Landsat 8’s is 16 days. Some projects may require frequent data updates, while others may have no problem waiting a few weeks or months between images for comparison. Keep in mind that cloud cover can render a satellite pass useless if it is heavy enough, so not every return pass will generate usable imagery.
While those factors are important to consider, one of the most crucial elements to understand is the spectral range and resolution of a satellite. The imagery collected by satellites is a record of the EMR that was reflected from the Earth’s surface at the time of the satellite’s pass. Satellite sensors classify specific wavelengths of reflected EMR energy, see Fig. 4.3, into segments and measure their intensity, generating multispectral data. For example, band 2 of Landsat 8’s Operational Land Imager sensor collects information between 436 and 528 nm, corresponding to blue visible light (Taylor, 2016). Multiband imagery is created using this multispectral data by combining different bands to create a composite image. As an example, if one were to display bands 2, 3, and 4 from a Landsat 8 image and display them as blue, green, and red respectively, they can be combined to create a so-called true color image. We can also generate false color images, as bands outside the visible spectrum may also be displayed. Fig. 4.7 shows both true color and false color images of the Murfreesboro, Tennessee (TN) region derived from Landsat 8 OLR data side-by-side. The left image shows true color data (bands 2, 3, and 4) while the image on the right displays a false color near-infrared image (bands 3, 4, and 5). Much like Fig. 4.4, the near-infrared portion of the EMR spectrum is displayed in red in the false color image, indicating healthy green vegetation.
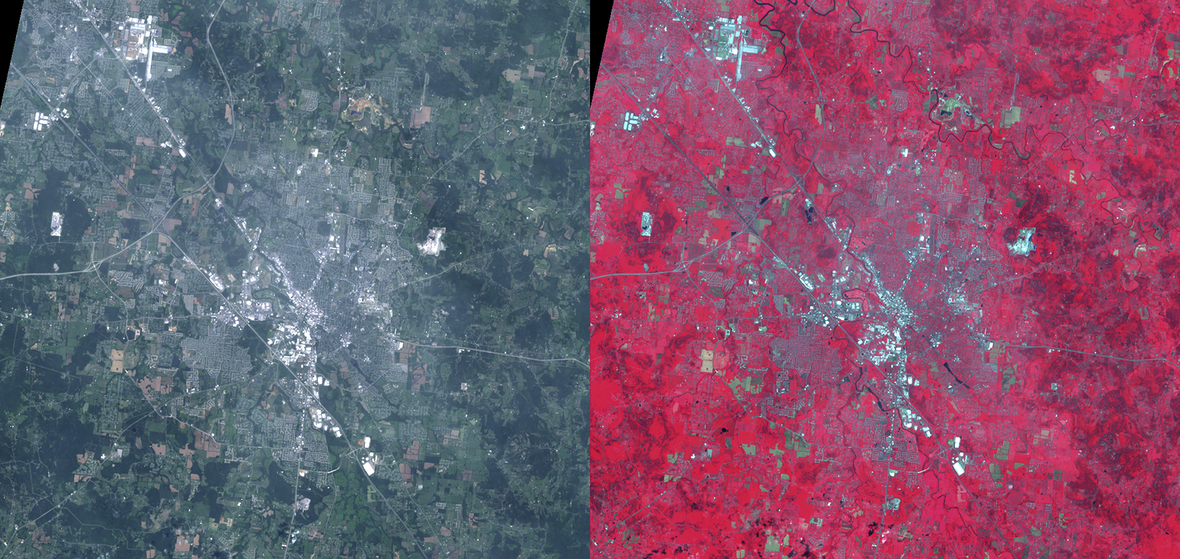
Multispectral imagery has allowed us to learn a great deal about the Earth and its natural processes, but the spectral resolution of satellite sensors can be increased to create what is known as hyperspectral data. Instead of breaking down the EMR spectrum into a dozen bands, hyperspectral data take the same total range of the spectrum and divide it into as many as hundreds of bands (Landgrebe, 2003). This higher spectral resolution allows for a much more precise knowledge of the surface, to the point of being able to distinguish between different mineral content in exposed rock material based on spectral response. Just like the consideration of spatial resolution, spectral resolution is important to consider when choosing a source of RS imagery. Hyperspectral imagery may be needed, but it often provides far more precision than is actually necessary to answer research questions.
The Internet has changed many aspects of our daily lives, and GIS has not been immune to its influence. At its simplest, Web GIS is similar to any other web application: it involves a server hosting content and an end user who accesses the content via hypertext transfer protocol (HTTP) (Fu & Sun, 2010). What distinguishes Web GIS from other websites or Internet-enabled applications is that the content served is geospatial in nature. Web GIS does not necessarily look like desktop GIS software, in part because it tends to operate either through a web browser or a mobile application format (e.g., Android, iOS, etc.). In general, Web GIS is more limited in capabilities when compared to a desktop GIS software package, but this is by design. Most Web GIS users need a fairly small range of tools, most commonly the ability to query locations, create navigation routes, and take simple measurements of distance. All the major commercial mapping applications provide these tools, including Google Maps, Microsoft’s Bing Maps, Yahoo Maps, and MapQuest.
While these services may be invaluable to many, they generally do not provide any specialized GIS tools to end users, particularly analysis-related functions. Many businesses, government agencies, and research organizations have a need for more advanced GIS capabilities in their Web GIS applications, and these are provided by software such as Esri’s ArcGIS for Server. ArcGIS for Server can host interactive map services resembling the interfaces of the large commercial map outfits while also providing some GIS analysis capabilities. For example, a map server may be hosting a raster layer representing elevation. Using one of these advanced tools, an end user can click on a location and the server will analyze the elevation layer, then draw the boundaries of the watershed in which the point resides. While still limited when compared to the capabilities of desktop GIS, this is a step beyond the analysis capabilities of most online mapping applications. Many organizations have Web GIS applications built including tools related to the needs of their field. These services are often for internal use rather than public facing, but some organizations use specialized applications to display data to the public, such as the U.S. Geological Survey’s Earthquake Hazards Program, which displays the locations of detected seismic activity (U.S. Geological Survey, 2016). These web platforms are one component of NeoGeography, discussed in Chapter 1.
While today’s Web GIS applications may not have the same level of analysis capability as a desktop GIS package, they do have one major feature that desktop GIS lacks: the ease of participation for the public. Desktop GIS can be quite daunting to the novice user, and a good deal of training is generally required to gain the level of knowledge necessary to successfully carry out GIS analyses. Not only are they more user friendly, platforms such as Google Maps, OpenStreetMap, and Wikimapia invite users to assist with data collection and quality control, by adding points of interest, photos, and reporting errors in data throughout the world. Many geospatially enabled mobile apps rely on this user participation as a core component to their operation, such as Yelp, Foursquare, and countless other GPS-enabled services. This kind of interactivity is called volunteered geographic information or VGI (Goodchild, 2007). VGI is not limited to restaurant reviews and vacation photos; it can involve natural hazard warnings and response, scientific data collection, and up-to-the-minute reporting of global events. For example, geotagged Twitter content is commonly mined for event-tracking purposes, both commercial and scientific, although data from these sources are typically analyzed in a more traditional desktop GIS environment. Just as the web enables NeoGeography, VGI is an essential social component to the mix providing a source of data.
Not only are Web GIS applications designed with user friendliness and interactivity in mind, they often take advantage of open-source technologies and focus on software extensibility and data interoperability. By allowing users to freely modify and embed Web GIS technology and spatial data into websites and apps, these services have expanded far beyond their original functionality. Google Maps and Google Earth are good examples of this. The application program interfaces, or APIs, provided for both Maps and Earth have allowed countless users to take advantage of interactive spatial data who would otherwise not be involved in Web GIS. Other open-source technologies like the JavaScript-based D3 library (Bostock, 2013) and the GeoJSON format (Butler et al., 2008) have empowered users to explore and embed geospatial data on the web with an ease unthinkable at the turn of the century.
One of the factors that has enabled this high level of public participation is the broad reach of GPS technology. Today, anyone with a smartphone can get highly accurate location information about the world around them, enabling the use of geospatial applications. It is difficult to stress just how transformative GPS technology has been for the human experience, but it has changed virtually every aspect of our lives from the supply chain of food we consume to our day-to-day navigational behavior. Although some individuals still consult paper maps for navigation today, the ubiquity of handheld navigation units and GPS-enabled cell phones has changed our entire mode of transport. While there is an argument that reading a paper map is becoming a sadly lost activity, the benefits that GPS has provided to our lives are undeniable, and many would be lost without GPS navigation and restaurant reviews, both literally and figuratively. Between the explosion of GPS usage and the open-source, extensibility-focused software movement, user involvement in Web GIS and VGI has never been greater than today.
For all the benefits that Web GIS, VGI, and NeoGeography have given us, the field still faces some challenges. On the VGI side of things, volunteered information circumvents traditional Old Media quality barriers. Using Wikipedia as an example, it is clear that user-generated content can be incredibly useful but must be approached with a skeptical eye. Both innocent mistakes and outright vandalism occur in VGI, and because this is a spatial context, the added factor of positional accuracy of data can become a serious issue. The idea of a gatekeeper to knowledge also comes into play in regards to GIS and GISci education. NeoGeography practitioners may have little or no background in geography or GIS, and mistakes can unintentionally render data misleading or even dangerous. For example, issues related to coordinate systems and projections can distort spatial data, such as misregistration of aerial imagery in Google Earth, as described by Goodchild (2007). Poorly applied data generalization or classification approaches can lead, intentionally or otherwise, to faulty conclusions about data (Monmonier, 1996). Remember that much like Wikipedia, users often look to Web GIS applications as a source of authority, and errors can quickly propagate thanks to the ease of sharing that the Internet enables.
Additionally, VGI can become embroiled in issues of privacy and power imbalances. Google has a procedure for removing or obscuring personal information in their street view application, but many may not be aware of this ability, or even that their personal information may be publicly available in this format (Google Maps, n.d.). On a broader level, NeoGeography remains largely in the realm of those with access to technology and education. While technology access and VGI participation is often strong, albeit uneven, in developed parts of the world, other regions may be lacking in access, participation, and educational opportunities. This can lead to the misrepresentation and skewed perspectives of events and places provided through VGI. In many ways, NeoGeography has increased the number of voices involved in GIS activities to previously unimaginable levels and helped to level social and political powers, but uneven access to technology and spatial education remains a serious concern of GIScience and Web GIS (Elwood, 2006). Given that public participation in GIS can help alter major public policy decisions, these issues of access and education are quite concerning.
Over the past half-century, GISs and RS have completely changed the way we track, manage, and make decisions about spatial information. These technologies assist us in countless ways, yet knowledge of them remains somewhat limited amongst the general public. In part, this is due to the complexity of the systems and their operation. Library patrons have often heard of these technologies and are interested, but may not have much understanding of what terms like GIS actually describe. It is imperative that librarians be familiar with geospatial technologies in order to assist clients in finding resources and creating instructional services for online mapping programs. While learning to use GIS may be daunting, the broad overview of geospatial technology described in this chapter should help provide a context for their uses.
While cartography, GIS, and remote sensing typically operate in a two-dimensional environment, the data they represent are usually three-dimensional in nature. This chapter describes some of the ways that the third dimension can be stored and displayed in a digital context, particularly, in regards to the topographic map. Some of these methods are simply digital recreations of traditional cartographic techniques, but others are fully digital affairs that could not be easily represented without the use of computers.
Terrain; Topographic maps; TIN; NED; RADAR; LIDAR; Digital raster graphics (DRGs); GIS tools; Digital line graphs; DEM
Representing the Earth’s terrain is an important role that many maps have played throughout history. Chapter 2 discussed some of the visual techniques used to represent a three-dimensional surface on a two-dimensional page, including the use of isolines, shaded relief, and hypsometric tinting. Maps have used these approaches for a long time, but with computers taking over the bulk of map production, new techniques have been developed to present three-dimensional surfaces, and old maps have been adapted to function in a digital context. This chapter begins with a description of how old map data have been moved into the digital age, and then talks about recent technologies that have improved and enhanced our ability to model the Earth’s surface for use in analysis and mapmaking.
Digital raster graphics, or DRGs, are scanned USGS standard series topological maps, including all information in the map collar (the space “outside” the map). See Fig. 5.1 for an example of a DRG. Since all the information that would be present on a typical USGS topo map is visible in the DRG, it looks visually identical, albeit on a computer screen rather than a sheet of paper. The USGS began a program of scanning topo maps in 1995 as a way of digitizing their paper resources (U.S. Geological Survey, 2013a). Standard topo maps were scanned at 250 dpi and the resulting raster images were georeferenced with the UTM coordinate system.
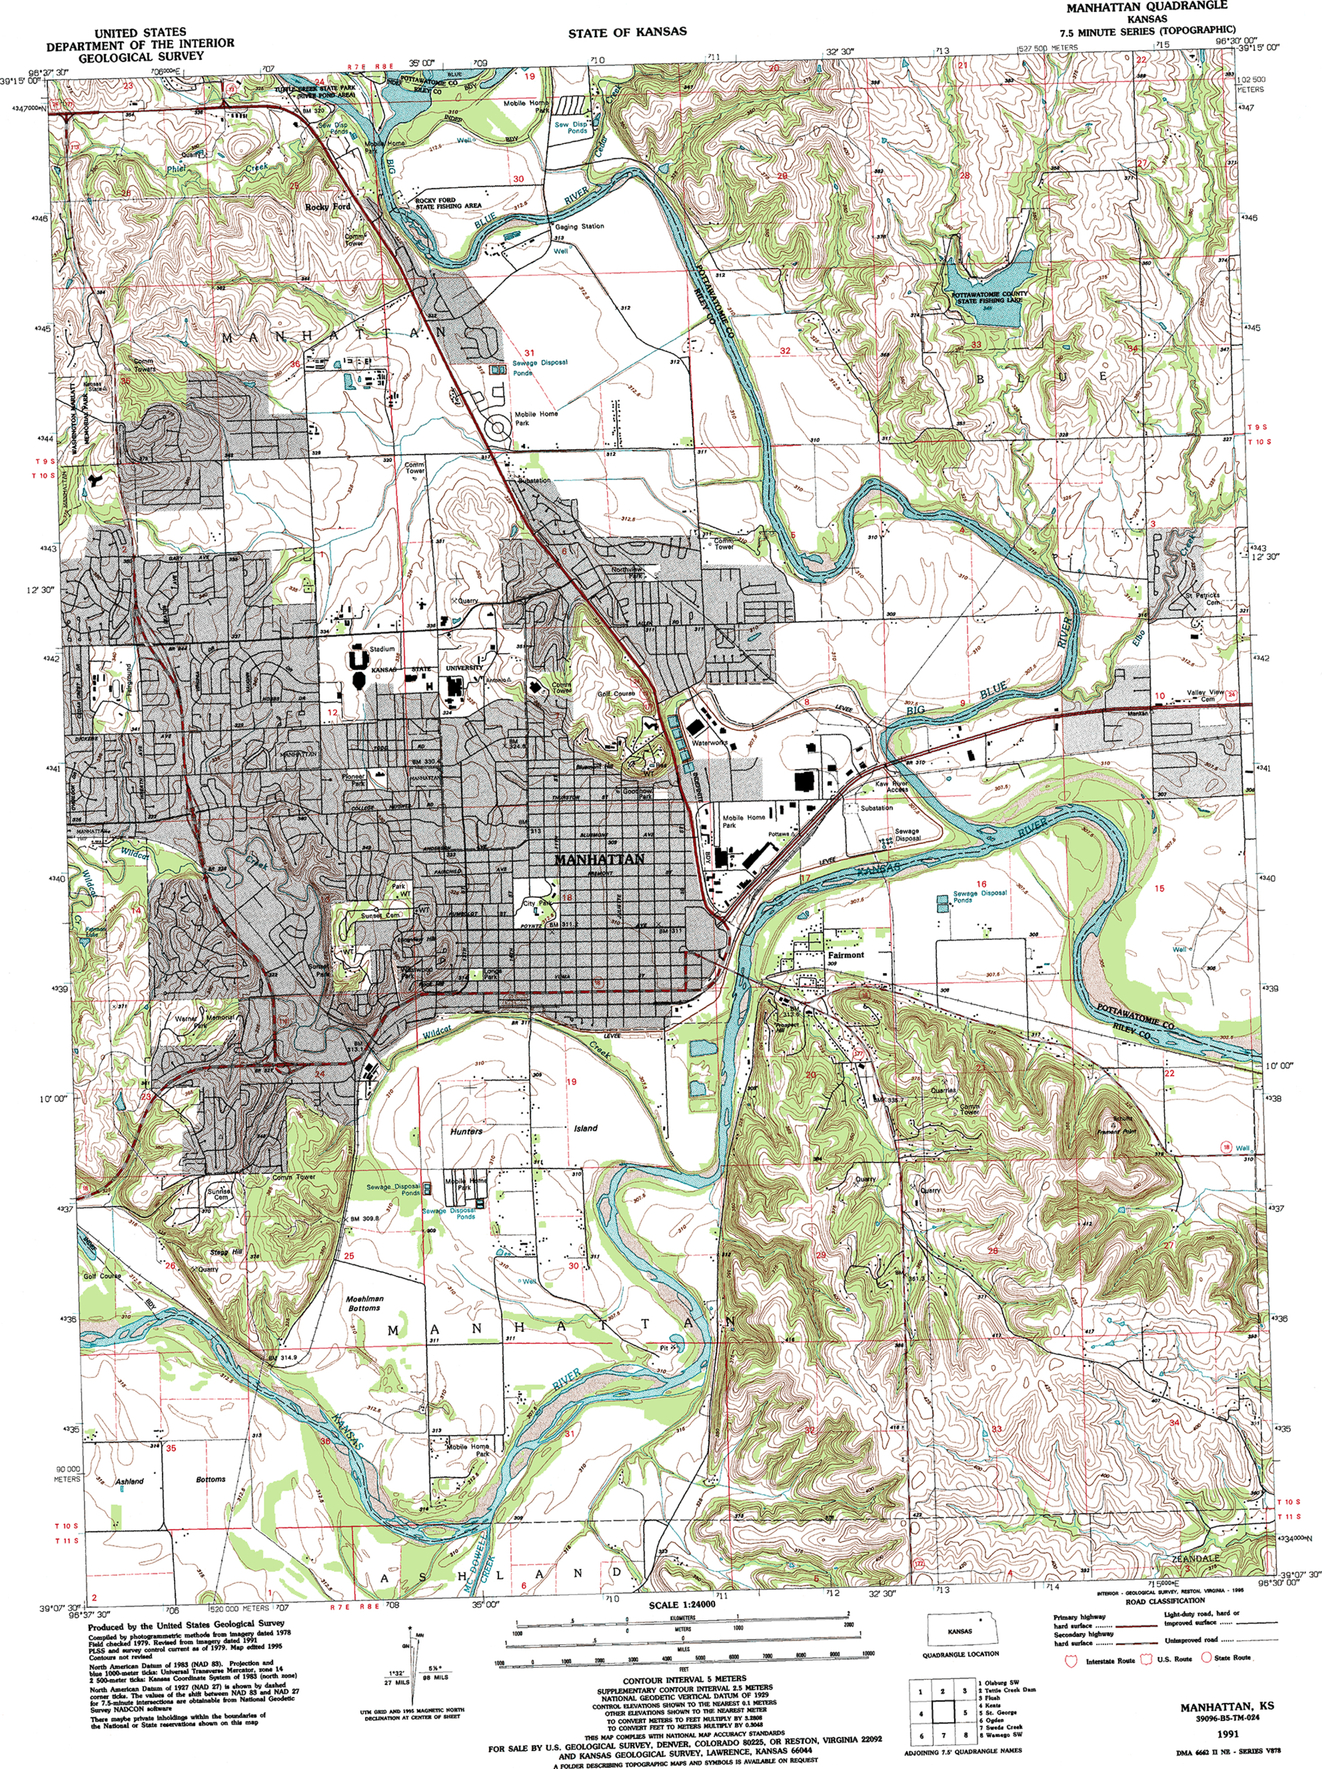
Georeferencing is a process that takes known ground control points and connects them to the raster in order to apply a coordinate system and projection to the image. Without a projection, GIS software has no way to know where a raster should exist on the globe, and because of that, it cannot analyze it correctly. By giving a coordinate system and projection to the raster, a great number of quantitative GIS tools can be applied to analyze the raster data. Essentially, the georeferencing process takes what was a picture and turns it into geospatial data that can be scientifically analyzed.
In 2001, the standards for DRGs were updated and all scans from then on were captured at 500 dpi (U.S. Geological Survey, 2013b). Under the old standards, colors were limited to 13 different hues to reflect the conventions present in printed topographic maps; the updated standards allow for up to 256 colors to be stored in a DRG to account for more colorful maps added later to the program. Given the long history of the USGS topographic mapping program, these DRGs can be quite valuable as they put historical information into a digital context that can then be included as part of a GIS analysis. DRGs can be downloaded through the USGS EarthExplorer website, and historic topographic maps can be downloaded as GeoPDF files through The National Map’s Historic Topographic Map Collection (U.S. Geological Survey, 2014a, 2016).
As you may have suspected, scanning historical maps is not limited to USGS topologic sources. As humans have been making maps for some time, we have many centuries worth of cartographic sources to work from, and converting them to a digital format has allowed us to apply our GIS analysis abilities to the past. In the subfield of Historical GIS, large-format scanners are often used, or in the case of maps too fragile to be scanned, more traditional photography techniques. Once these maps have been converted to a raster format, the georeferencing process prepares them for GIS analysis. This unlocks an enormous volume of historical data that can be analyzed to study topics as diverse as land cover change, demographics, economies, or any topic that has been previously mapped.
Digital line graphs, or DLGs, are also derived from USGS sources of data but are stored in a vector format as opposed to raster. An example of a DLG can be seen in Fig. 5.2. They are generated using both automated and manual techniques, pulling information from both aerial photos and map sources. DLG data are provided at three scales: large, intermediate, and small scale (U.S. Geological Survey, 1996). The large-scale DLGs are derived from USGS 7.5 minute topographic maps (1:20,000, 1:24,000, or 1:25,000 scale depending on the specific map) and primarily use the UTM coordinate system, although some use SPC. Intermediate-scale data exist at the 1:100,000 scale in UTM and is derived primarily from 30 × 60 minute USGS quadrangles. If a USGS quadrangle does not exist, Bureau of Land Management planimetric maps are used as sources. The data in small-scale DLGs come from USGS 1:2,000,000-scale sectional maps from the National Atlas of the United States. Not all layers of data are available in all scales, but DLGs include a variety of thematic content. Table 5.1 shows the available layers with descriptions used by the USGS’s DLG resources website (U.S. Geological Survey, 2012).
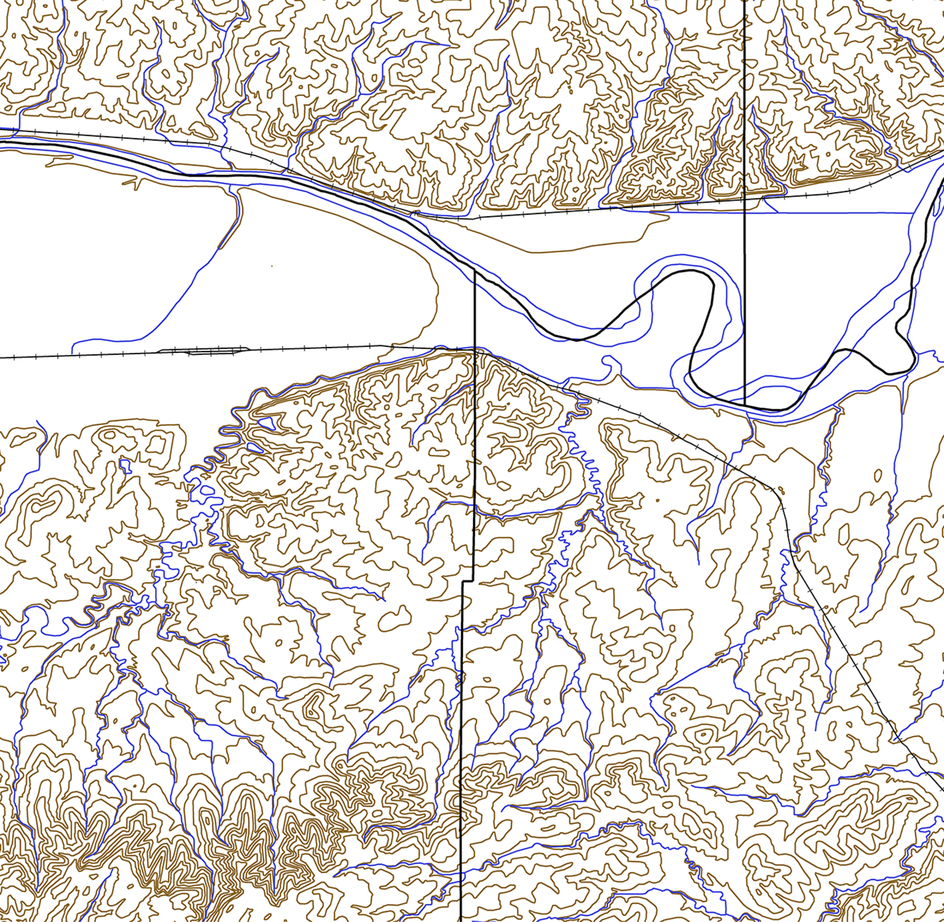
Table 5.1
List of layers available in digital line graphics format
| Layer | Feature type |
| Public Land Survey System (PLSS) | Township, range, and section lines |
| Boundaries (BD) | State, county, city, and other national and state lands such as forests and parks |
| Transportation (TR) | Roads and trails, railroads, pipelines, and transmission lines |
| Hydrography (HY) | Flowing water, standing water, and wetlands |
| Hypsography (HP) | Contours and supplementary spot elevations |
| Non-vegetative features (NV) | Glacial moraine, lava, sand, and gravel |
| Survey control and markers (SM) | Horizontal and vertical monuments (third order or better) |
| Man-made features (MS) | Cultural features, such as buildings, not collected in other data categories |
| Vegetative surface cover (SC) | Woods, scrub, orchards, and vineyards |
Digital elevation models are a more recent, purely digital source of elevation data. The term “Digital Elevation Model” does not refer to a specific data source or file format, but is rather an umbrella term that describes multiple approaches to collecting and representing elevation data on a computer. Some related terms are digital surface model, which represents the heights of all features including man-made structures, and digital terrain model, which only represents the bare surface of the Earth (See Fig. 5.3). DEMs are stored and displayed in two formats: as raster images where cell value represents elevation, or as a vector-based triangulated irregular network (TIN). Raster-based DEMs have similar advantages to rasters in general in that the mathematics involved in analyses tends to be simpler and faster to calculate than the vector-based TINs. However, TINs are much smaller in file size, and known benchmarks and breaklines (known features such as roads or streams) can be easily added to increase the overall accuracy of the surface. As with any analysis, which format is best depends on the needs of the project, see Fig. 5.4. Raster DEMs do have a distinct advantage in that generally speaking they have more support in GIS software packages.
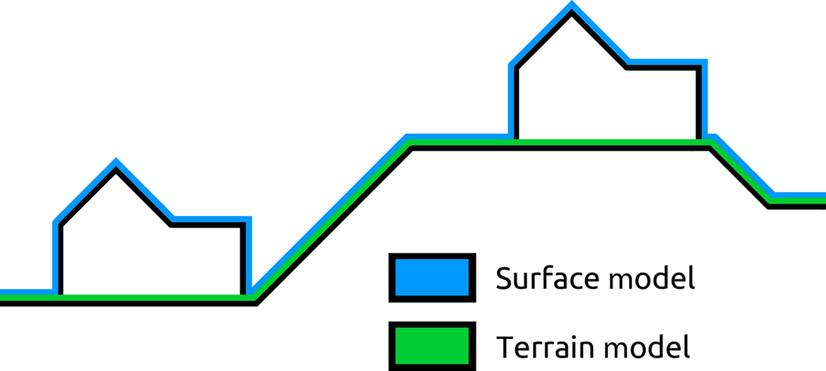
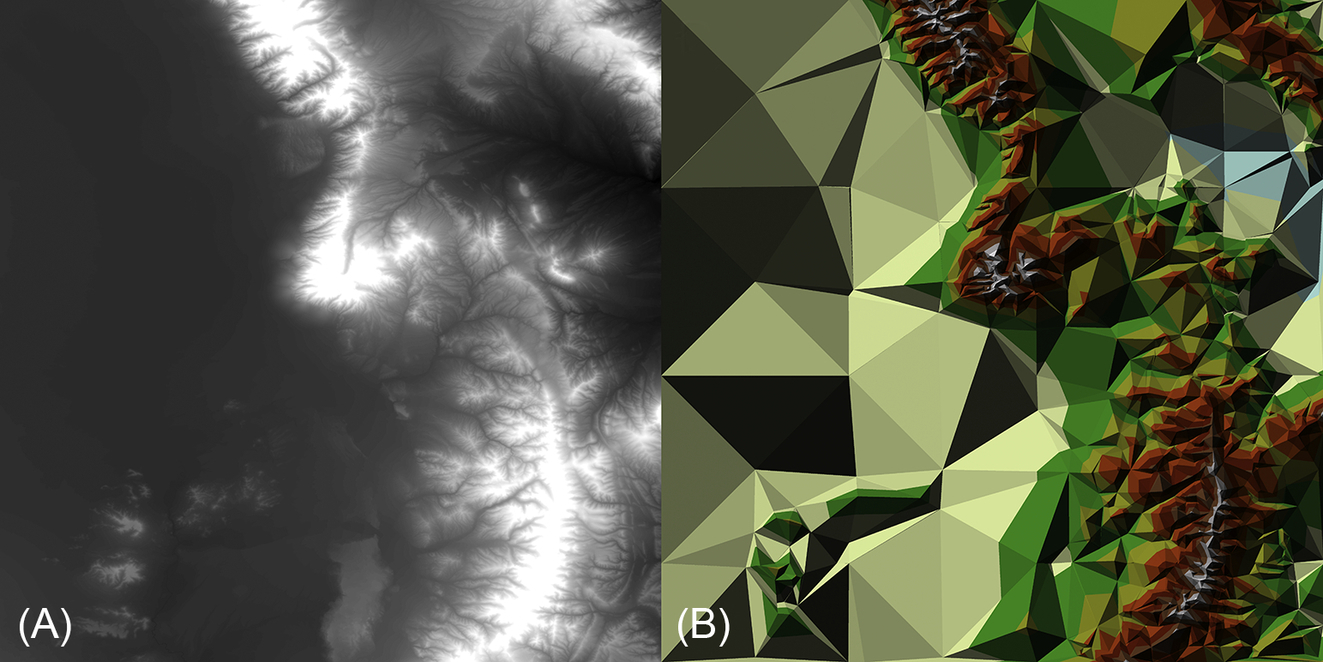
DEMs are used in a variety of applications, including, but not limited to, viewshed analyses, erosion and flood modeling, precision agriculture, and archaeology. It is also common for aerial or satellite imagery to be draped over DEMs, producing realistic three-dimensional visualizations of the landscape. The source of DEM data most often comes from remotely sensed platforms, including satellite- and plane-based RADAR and aerial LIDAR. An example of LIDAR data representing surface elevation can be seen in Fig. 5.5. These technologies are examples of active remote sensing, as both RADAR and LIDAR send out pulses of energy and measure the amount of time it takes for the energy to return.
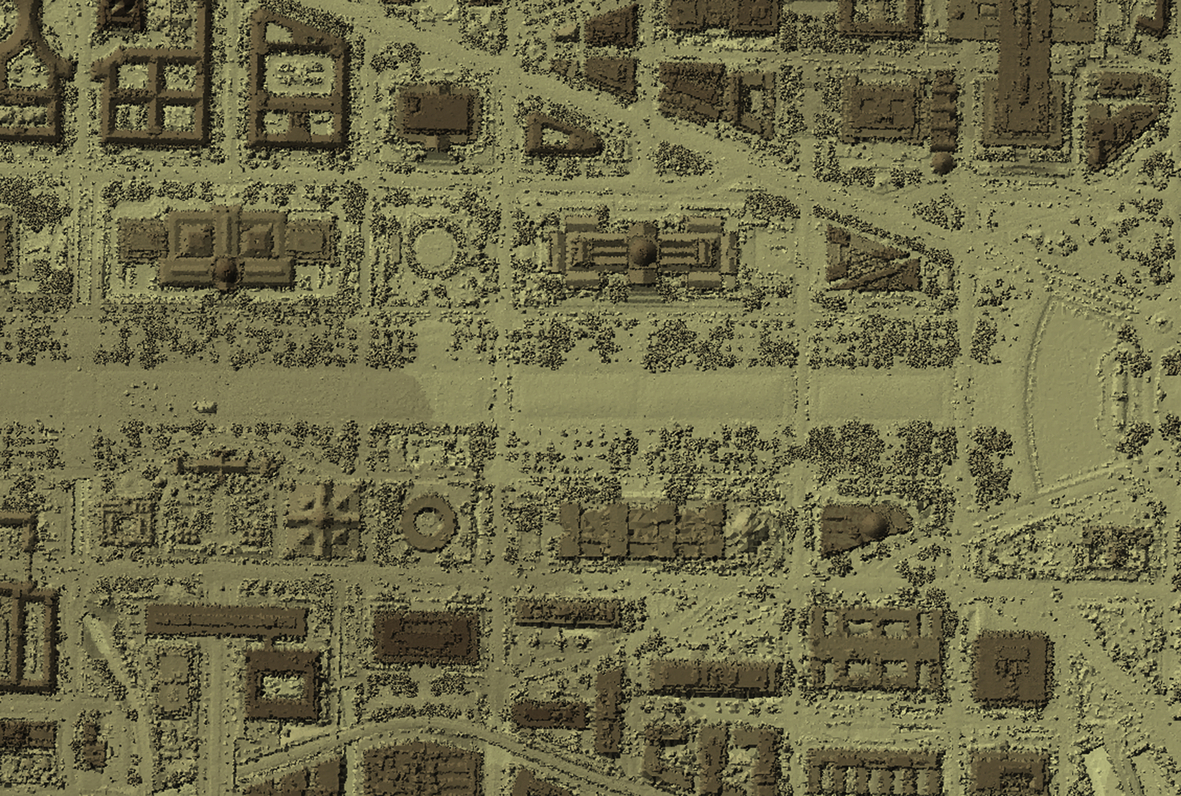
Conceptually this is similar to the Microsoft Kinect sensor, the video game peripheral that works with the Microsoft Xbox 360 and Xbox One. In fact, the Kinect device has been used in some research circumstances as a low-cost stand-in for more expensive professional LIDAR setups (Mann, 2011). The Kinect was designed for use in living rooms and only works in small environments, but the process remains similar.
While planes and satellites are commonly used to cover large amounts of ground quickly, the use of unmanned aerial vehicles has grown dramatically in recent years. The availability of these relatively inexpensive platforms has allowed both aerial imagery and elevation data to be collected more easily and affordably than ever before. Small-format aerial platforms such as UAVs, blimps, and kites also typically offer a higher spatial resolution than data collected from satellite sources, making them useful for monitoring specific locations with a high level of precision.
Currently, the most complete global source of DEM data comes from the Advanced Spaceborne Thermal Emission and Reflection Radiometer (aka ASTER) satellite platform. The ASTER Global Digital Elevation Model (GDEM) version two was released in October of 2011, and covers 99% of all land surface on Earth, with data from 83°N to 83°S (ASTER GDEM Validation Team, 2011). This dataset can be downloaded freely for use at the Global Data Explorer or Reverb | ECHO websites (Mitchell, n.d.; U.S. Geological Survey, 2015a). For the United States, a widely used source of DEM data is the National Elevation Dataset (NED) provided by the USGS. The NED dataset is a seamless layer of raster elevation data, although not all data resolutions are available for the entire coverage area. Data within the NED are derived from a variety of sources and can be found in 1/9 arc-second (approximately 3 m), 1/3 arc-second (approximately 10 m), 1 arc-second (approximately 30 m), and 2 arc-second (approximately 60 m) spatial resolutions (U.S. Geological Survey, 2014b). The three-meter resolution data are only available for approximately one-third of the United States at this time. NED data are available through The National Map website (U.S. Geological Survey, 2016). More precise elevation data provided by LIDAR sensors are discussed at greater length in Chapter 7.
Mapping the terrain of the Earth has long been an important component of our cartographic history. Modern technology has allowed us to unlock the analysis potential of older map resources as well as provided more accurate measurements for a larger land coverage than ever before. Thanks to the Internet, many of these resources are freely available for anyone to use. This access has provided us with more information than ever before, enhancing our ability to study the world and plan for future developments.
This chapter focuses on the roles and duties for map librarianship. Introduction to the history of map librarianship is followed by transitions in expectations, resources, and skill sets for geospatial librarianship, also known as the neomap librarian. Librarianship preceded formal academic programs, and the evolution of map librarian course work and degree opportunities are described. Job announcements highlight required qualifications and expected duties. Formal academic preparation for map and geospatial librarianship remains problematic, but cartographic and geospatial data resource agencies and map librarian professional organizations have created guidelines to assist students and professionals. Special considerations will be presented such as work space and map storage equipment that is unique to map and geospatial resources.
GEOWEB; Geospatial consultant; Curator; Librarianship; Digital preservation; Storage; Special librarianship; Map librarian; Geospatial librarianship; Cartography; Jobs
The importance of map librarianship is obvious. There is an incredible history of maps and map-making in addition to the changing nature of cartography as seen through the geospatial revolution today. Neogeography has accelerated the widespread need for and use of maps. Neocartographers are using the plethora of online map-making programs and specialty geographic information software systems. For the library to play a significant role, relevant geospatial and cartographic resources and services must be offered.
Map and geospatial librarianship has preceded both formal academic preparation in library schools and support from professional map librarian organizations. This chapter begins with a historic perspective to demonstrate the 19th century foundations for academic map librarian course work, which finally appeared in the mid-20th century. Core competencies provided the formal acknowledgement of map librarian duties, which were adopted in the early 21st century. Research literature and map librarian job announcements are reviewed to help define the profession today and demonstrate the need for trained map and geospatial librarianship.
Past and present academic course offerings are considered in this chapter. If accredited library school programs provide a balance of content information with librarian skills, then librarians could be a relevant part in the explosive demand for maps today. Creating or reestablishing dual degree pathways and encouraging internship opportunities would help to gain geoliteracy skills and confidence among students. A robust research agenda focused on map and geospatial librarianship could then inform and inspire new professionals in the field. In addition to map and geospatial data collection management, reference and research work using maps requires adequate work space with large map-case and computer-server storage. This practical side of equipment needs must be considered in order to welcome people into the physical and digital world of maps and remotely sensed images in the library.
The historic progression of academic preparation for map librarians is reviewed, and a summary of an early map librarian course outline is included, see Appendix A. The purpose and significance of course work today is highlighted. Librarians need the tools and skills to preserve and curate cartographic products from the past and understand how to navigate the present maze of digital options.
Cartographic accomplishments of Eratosthenes, a 3rd century Greek scholar, were presented in Chapter 3. In addition to his many accomplishments, he created the first map of the world as known at that time to include parallels and meridians (Roller, 2010). Of equal or more importance was that Eratosthenes curated geographic information for future generations through his job as chief librarian at the Library of Alexandria. Maps were primarily commissioned by governments and collected by wealthy private individuals before the 20th century. It was only when maps were donated to libraries and museums that others knew of their existence. A transition occurred with the ease of map creation and reproduction in the 20th and 21st centuries, which provided greater recognition, affordability, and demand for maps. Maps in print and as digital images continue to be valued by these original stakeholders. In addition, new uses of maps have expanded the demand by professionals who need quick response times for informing disaster-relief workers, tracking pandemic illness, and many other applications. Others who rely on maps include teachers, historians, genealogists, attorneys, engineers, bioscientists, geoscientists, military strategists, and more.
Greater demand created the need to organize, store, preserve, and make accessible maps in both print and digital collections. This is the hallmark and legacy of libraries and librarians. These collections and demand for accessible geospatial data and information define the role and expectations of librarians, which have expanded to stewards and clearinghouses for map and spatial data collections.
While some map collections continue to be privately owned, other collections are publicly available, archived, and curated for viewing and lending at museums, libraries, and government agency websites, see Fig. 6.1. In addition to traditional map collection development, today libraries build collections through donations. Recent efforts in digital philanthropy allow for private collections to be publicly available in a library by a donor’s gift of digital surrogates; one example is the case of the David Rumsey collection gifted to Stanford University (Cartographic Associates, 2009, 2016; Gorlick, 2009; Stanford University Libraries, 2016).
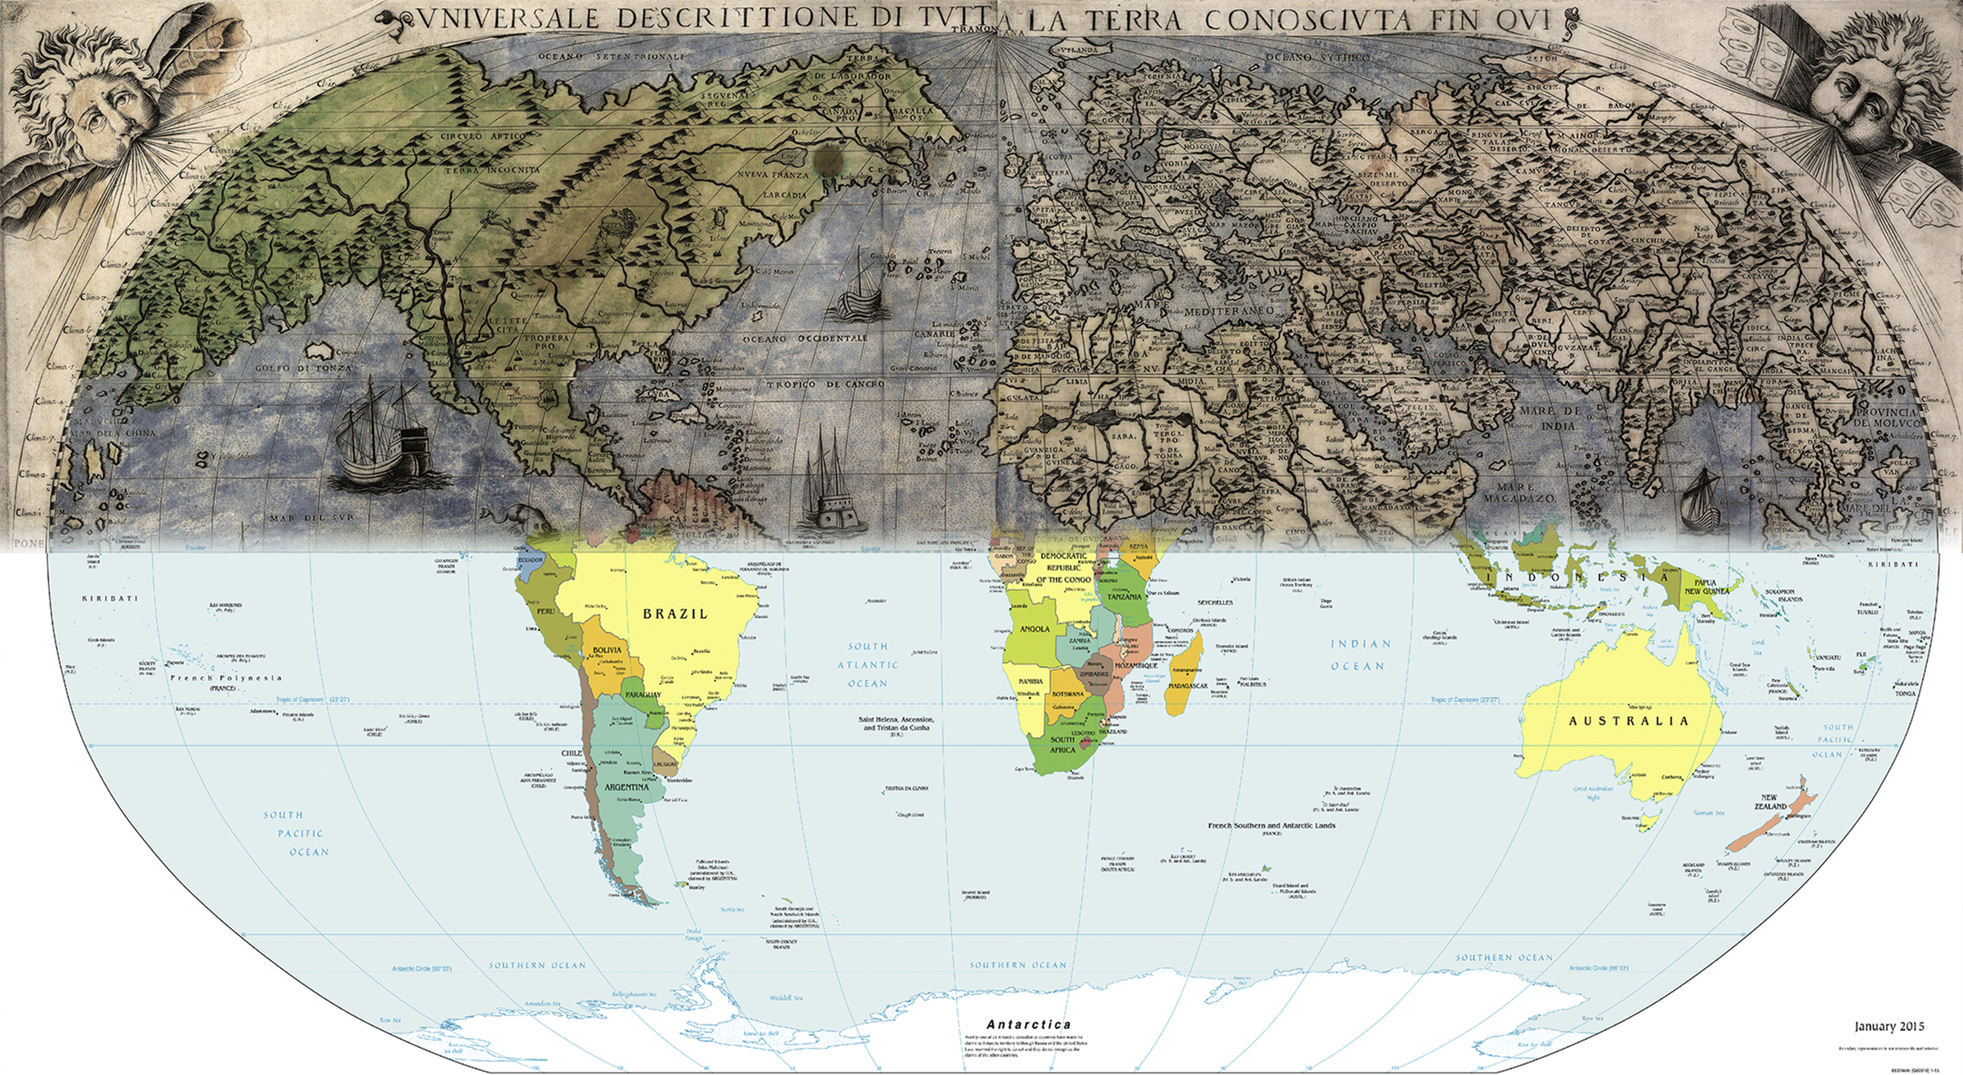
It is clear that the historic progression of maps and cartography has shifted from print to digital, yet this does not mean print maps are obsolete. A change in format and delivery did not change the need for interpreting this visual information and making it accessible. Peterson (2014), a geography professor, called maps mirrors on civilization; he summed up the importance of having map collections freely available in libraries and the value in training map and geospatial librarians with the following salient points (p. 11, 12, 44, 76). First, while it is impossible to know when the oldest map was made, maps do predate writing, and as such are valuable, visual information. Second, digital map products are often distributed freely, except for costs associated with computers, phones, and Internet connections. Third, it is estimated that more than half of the population lack basic map reading skills when given print maps. Fourth, many people have trouble using Internet maps, computer mapping, and maps on mobile phones. Finally, online maps could be thought of as a large, disorganized atlas where search engines may be tedious and unproductive. As Peterson suggested, map libraries and librarians are liaisons between maps and people, offering solutions through resources and services.
Libraries must house cartographic resources and protect, promote, and circulate maps in a manner equal to any text-based resources. Trained librarians preserve the past and provide free access to computers or print maps, offer instructional services, and create subject guides. Shared cartobibliographies provide location information for unique, historic digital and print collections. However, this is best accomplished with strong support from library administration in hiring qualified map and geospatial librarians, as well as with accredited Library and Information Science (LIS) degree-granting programs that offer map and geospatial resource curriculum opportunities.
Bishop, Grubesic, and Prasertong (2013) explained GeoWeb as the junction of Web 2.0 with geospatial technologies and geographic information (p. 296). This digital platform enhances online opportunities for users to interact, collaborate, and generate geospatial content via location-based tools and data (p. 297).
Therefore, GeoWeb is the thoughtware and technological platform, which taken together are the reason neogeography and neocartography are evolving in the 21st century. Today, print maps and atlases physically reside in individual libraries, but their digital versions are shared among a global library community. This is equivalent to e-books coexisting with their print ancestors. However, the significance of the GeoWeb is the opportunity for the creation of natively digital cartographic resources. These maps do not coexist with a single tangible product and as such present the greatest challenge in organization and preservation for libraries and librarians.
Access and preservation of data needed to display maps depend upon trained geospatial map librarians and specialized technicians. The critical detail is to retain metadata and all necessary files for natively digital data to successfully transfer to new media in order to display it through the most recent, compatible technologies (Erway, 2010). In an interview, Sweetkind-Singer identified this critical concern for librarians and described the goal for long-term digital data preservation and access as threat mitigation or the act of lowering the threat to information loss in as many ways as possible (Library of Congress, 2009). Bishop et al. (2013) reiterated this data curation challenge as the main duty for geospatial librarians, to “… maintain and add value to geospatial data over its lifecycle—well beyond their original purpose” (p. 298).
The growth of the GeoWeb necessitated geospatial data services in libraries. In the past, librarians merely amassed cartographic material in the physical media, stored, cataloged, circulated, and preserved. Digital data storage, retrieval, and preservation have depended upon functional hardware and software, which means obsolescence of either could make the resource inaccessible. Thus, digital resource migration is critical to ensure preservation and access to the original media when it becomes defunct technology (OCLC Research, 2014).
The field of map librarianship is in transition, evolving and blending duties to account for existing print and natively digital geospatial resources. For example, cataloging print maps may use Anglo-American Cataloging Rules (AACR) standards, but cataloging geospatial resources becomes “metaloging” as the metadata are vital to create a record for geospatial data that supports searching and accessing data created through remote sensing, image processing, and using geographic information systems (GIS) software (Bishop et al., 2013, p. 300). Mandel and Weimer summed the problems for librarians that “not surprisingly, library and information science education did not react with curriculum additions or changes covering these skills as quickly as the emergence of the large-scale projects” (as cited in Bishop et al., 2013, p. 300). New academic course work must add to traditional librarian skills to prepare the geospatial librarian.
Professional map organizations and on-the-job training exist to support geospatial librarians. The formation of the American Library Association (ALA) preceded the world’s first academic library school. The Map & Geospatial Information Round Table (MAGIRT) followed map librarianship, yet it still provides constructive guidance and continuing educational opportunities for both map and geospatial librarians. A brief review follows.
The ALA is a nonprofit organization founded in 1876 to promote libraries and general librarian education (Thomison, 1978; Weimer, 2011). Formal education for librarians began in 1887 when the world’s first library school was established by one of the founding members of ALA, Melvil Dewey. Some consider Dewey the “Father of Modern Librarianship” in the U.S. (Library of Congress, n.d.; White, 1961; Wiegand, 1996). The need for specialized librarianship training was recognized by 1909, and the Special Libraries Association (SLA) was created (Dana, 1914; Weimer, 2011). Customized training workshops in libraries began in 1919 and by the 1940s, some Library and Information Studies schools offered courses in reference resources and services specific to fields of study such as law, business, medicine, and music (Woods, 1952).
In 1941, the first organized professional map librarian group was founded, the Geography and Map Division (G&M), a subgroup of SLA. In 1950, map librarianship courses began in one LIS degree-granting university program. Regional map professional groups formed, and finally the Map & Geography Round Table (MAGERT) was formed in 1979. This group had many members in common with the SLA G&M. A name change, substituting an “I” for “E” and geospatial for geography, occurred Jun. 28, 2011. With these changes, Map & Geospatial Information Round Table organization (MAGIRT) was founded (Weimer, 2011). The changes were initiated as symbolic to better articulate the goals of the group to include the increasing demand for digital geoliteracy.
ALA is the oldest and largest library association in the world with a mission to provide leadership for developing, improving, and promoting library services and the overall profession of librarianship (American Library Association, 1996–2016a). As of 2016, ALA had a membership of more than 60,000, which can be seen in an online global membership map (American Library Association, 1996–2016c; MAGIRT, 2016). The ALA is responsible for accrediting academic master’s degree programs in library and information studies; in 2016, “ALA accredited 63 programs at 58 institutions in the United States, Canada, and Puerto Rico” (American Library Association, 1996–2016b). A complete listing is available online at a Searchable Database (American Library Association, 1996–2016e).
Accreditation is a process and condition for the profession to assess academic quality and integrity, and is based on self-evaluation coupled with peer-assessment. Complete accreditation is granted to library programs for seven years or three-year conditional status. In the latter case, a degree program must change to meet Standards for Accreditation of Master’s Programs in Library and Information Studies (American Library Association, 1996–2016f). In addition to monitoring degree programs, the ALA organization has a policy manual with position statements in regard to special skills needed for quality librarianship. Professional Core Competencies of Librarianship define “… the basic knowledge to be possessed by all persons graduating from an ALA-accredited master’s program in library and information studies” and apply to librarians working in public, educational, special, and government libraries (American Library Association, 1996–2016d).
ALA is governed by an elected Council which makes policy and an Executive Board that administers established policy and programs. There are 11 membership divisions devoted to a library type or function; for example, divisions include American Association of School Librarians (AASL), Public Library Association (PLA), Association of College & Research Libraries (ACRL), Association for Library Collections &Technical Services (ALCTS), and Reference & User Services Association (RUSA). Map librarians would likely join their library type association as well as ALCTS and RUSA, to stay current on cataloging and reference services. Additional ALA subdivisions are based on specialties and called “Round Tables,” with two examples being Government Documents (GODRT) and Map & Geospatial Information (MAGIRT). Before the formation of MAGIRT, many map librarians joined GODRT, as maps are an abundant resource among Government Documents. However, it is MAGIRT that supports map and geospatial librarians with the group’s purpose and specific Core Competencies summarized as follows.
There is a growing demand for skilled professionals equipped with specialized knowledge of maps, geographic information systems (GIS) and all other cartographic resources, whether in hardcopy or digital form, and the cataloging of, or metadata creation for these same resources. These Core Competencies outline and articulate the special skills needed to provide high quality professional support to users of cartographic and geospatial materials.
American Library Association (1996-2016d)
The full core competencies document is available online (Weimer, Andrew, & Hughes, 2008). These competencies are divided into three sections specific to map librarianship, GIS librarianship, and map cataloging and metadata creation to accommodate the different jobs needed. These jobs are sometimes accomplished by one or multiple librarians, depending on the size of the library and collection. Common competency areas include managerial and marketing, collections and facility equipment, reference and instruction services, and technology. Within these, content knowledge and librarian skills are ranked in three levels from beginner to expert.
Professional groups support librarians, but it is LIS programs that create career pathways and the curriculum to prepare students. Authors of the two comprehensive and pivotal books on map and geospatial librarianship, Larsgaard (1998) and Abresch, Hanson, Heron, and Reehling (2008) emphasized the importance of library school preparation and continued educational opportunities to meet current standards. The next section provides the historic progression of curriculum specific to map librarianship and identifies the ALA-accredited universities in the United States and Canada with coursework today.
In the early 1900s, most map collections were administered by map caretakers or curators who learned map library skills via personal experience, observation, and investigation (Larsgaard, 1998, p. 297). In January 1950, the Library School at the University of Illinois, Urbana-Champaign added a map librarian specialization course, LS 306: Maps and Cartobibliographic Aids, for advanced undergraduates or graduates (C. Bertram, personal communication, September 11, 2014). The course was first taught by James Ranz, a university map librarian. Ranz had several positions at the University Library, starting as Map Librarian, and then adding Bibliographer and Cataloger titles, all in 1949; by 1953, he worked in Library Administration (C. Bertram, personal communication, August 11, 2014). Ranz held the title of Instructor, yet only taught the map course once (Woods, 1952, p. 88). Woods (1971) stated that in 1950, this was the only “accredited course in map librarianship available anywhere in the world.” Larsgaard (1998) remarked that at least one LIS school had finally recognized that “training persons for map librarianship before, not after, they became map librarians” was a good idea (p. 298).
After Ranz, Bill M. Woods took over teaching LS 306 from 1951 until 1958 (C. Bertram, personal communication, August 11, 2014). Woods had an undergraduate degree (1947) and Master’s degree (1953) in library science from the same university where he worked from 1949 to 1958 as a map librarian, an instructor, and later, an assistant professor (C. Bertram, personal communication, September 4, 2014). The original LS 306 course covered the unique concerns for map librarians in cataloging, classification, and care of map resources. Woods (1952) built on this foundation by adding and reorganizing the map course into three units: introductions to maps and libraries; describing map resources, the cartobibliography; processing maps including classifying, cataloging, care, and preservation (p. 88, 102). Woods’ course outline is summarized in Appendix A. The course was promoted for geography and library students alike, and his basic outline is still viable for a map librarianship course today with the addition of geospatial collections in electronic formats, data, and software (Woods, 1954, 1956). While there were brief gaps in the catalog listing after 1958, a map course was offered again in 1961 through 1980 at the same university. Woods (1959, 1970, 1971) continued to promote all aspects of education for map librarianship through his writings.
From 1969 until 1980, a total of four library schools offered map librarianship courses. Three were in the United States and one in Canada: Columbia University, Western Michigan University, Catholic University, and University of Toronto (Larsgaard, 1998, p. 299). In the past, Kollen, Linberger, Wassetzug, and Winkler (1998) provided results of a 1996 ALA survey of U.S. library schools and found that five programs offered courses on map librarianship: University of Arizona; University of Maryland, College Park; University of Wisconsin, Madison; University of Wisconsin, Milwaukee (UWM); and Catholic University of America (p. 5). Other schools in 1996 that included concepts of map librarianship in other coursework were: University of Southern Florida; University of Illinois, Urbana-Champaign; Wayne State University; University of Hawaii; and University of Michigan (p. 5). Two library schools offered a course in GIS in 1996: University of Pittsburgh and University of California, Berkeley (p. 5).
Over the years, several schools had courses that included sections on maps and cartography; for more modern examples, map or cartography is mentioned in the course listings at University of Missouri, Columbia, and again, at University of Illinois, Urbana-Champaign. According to online catalog course listings and personal communications, in the 2014–15 academic year, 10 out of 59 accredited LIS schools in Canada and the United States offered specialized coursework specific to map librarianship, resources, and services (see Table 6.1).
Table 6.1
Universities and course titles
| University, Location | Map and GIS courses offered |
| 1. University of Toronto, Toronto, Ontario Canada | INF2102 Geographic Information Systems in Libraries |
| 2. University of Western Ontario, London, Ontario Canada | LIS 9767 Geospatial Data |
| 3. University of Wisconsin, Milwaukee, Wisconsin | L&I Sci 683 Cartographic Resources in Libraries |
| 4. University of Tennessee, Knoxville, Tennessee | INSC 516 Geospatial Technologies; INSC 543 Geographic Information in Information Sciences; INSC 522 Cataloging of Nonprint Materials |
| 5. Drexel University, Philadelphia, Pennsylvania | INFO 555 Introduction to Geographic Information Systems |
| 6. University of Pittsburgh, Pittsburgh, Pennsylvania | INFSCI 2801 Geospatial Information Systems (GIS); INFSCI 2802 Mobile GIS and Location-Based Services; INFSCI 2809 Spatial Data Analytics; LIS 2695 Geographic Information Systems for Librarians |
| 7. University of Michigan, Ann Arbor, Michigan | SI 513-COM 840 The Geospatial Web: Participatory maps, location-based services and citizen science—2014 |
| 8. University of Hawaii, Honolulu, Hawaii | LIS 693 Cartographic and Geographic Issues for Librarians |
| 9. San José State University, San José, California | INFO 220 Resources and Information Services for Professionals and Disciplines-Maps and GIS |
| 10. Pratt Institute, Manhattan, Brooklyn, New York | LIS 688 Institute on Map Collections |
Beginning in 1980, the UWM offered a novel map librarianship graduate Coordinated Degree Program with a dual M.A. in geography and MLIS (School of Information Studies, 2016). A similar dual-graduate-degree program, Geography/Library & Information Systems (GELS), existed at the University of Maryland-College Park from 2005 until 2014 when no more applications were accepted for this career direction (University of Maryland, n.d.).
Interestingly in 2016, of the 59 ALA-accredited LIS programs in the United States and Canada, 38 offered dual/joint/double degree programs. These are combinations of LIS with history (42%), law (39%), business (16%), health-related (16%), English (8%), music (8%), and anthropology (6%), as well as 26 other fields of study. However, only one of the ALA LIS programs today offered the dual-graduate-degree program between geography and LIS for Map & Geospatial Librarianship, the UWM (School of Information Studies, 2016).
One of the newest library programs is a Master of Management in LIS from the University of Southern California. This graduate degree has GIS Librarian as a specialty, which “… entails the acquisition and maintenance of map collections, GIS databases and other geospatial resources” (USC Marshall, 2016). This MMLIS degree was announced in May 2013 and is the first library program in the United States to be associated with a business school (Blumenthal, 2013; Marshall News, 2013). The school is currently in the final phase of accreditation with ALA, and a decision is expected in 2017 (USC Marshall, 2016). The GIS librarian concentration may become a model for other programs.
Considering the few map librarianship educational opportunities for library students, it is not surprising that Larsgaard’s advice mimicked that of Woods from some 30 years earlier. In addition to the MLIS, Larsgaard (1998) suggested that students wanting to be map librarians should have a strong geography or geology background with many courses in cartography, map and aerial photography interpretation, management, and computer programming, as well as a reading knowledge of foreign languages for cataloging and reference purposes such as English, French, German, Italian, Japanese, Portuguese, Russian, and Spanish (p. 301).
Early map librarians dealt exclusively with print maps and black-and-white aerial photography. The USGS began producing maps in 1879, and in 1884, the U.S. Congress authorized the funds to begin systematic topographic mapping of the nation (U.S. Geological Survey, 2013; U.S. Geological Survey, n.d.). While other countries use metric units and map at 1:25,000 scale (i.e., 1 cm equals 250 m), the United States did not adopt metric and instead produced maps at 1:24,000 scale (i.e., 1 in. equals 2000 ft). Using this scale, the best known maps were the print 7.5-minute quadrangles or 1:24 k topographic map series, a mainstay of U.S. map libraries. More than 55,000 were produced from 1945 to 1992, covering the 48 conterminous states; they are the only uniform map series to cover the entire United States in detail (U.S. Geological Survey, 2016). Topographic maps are abundant, familiar cartographic products that are trustworthy, used for a variety of purposes, and define the national socially constructed landscape (Kent, 2009, p. 132).
In the 1990s, libraries began to adopt GIS software and geospatial data sets as well as digitize existing map collections (Deckelbaum, 1999; Stone, 1999). The early adopter GIS librarians spent time instructing patrons on how to use the software, whereas some years later, more time was devoted to collection development; managing geospatial portals; building unique collections of geospatial data; and helping patrons to find, open, and manipulate the data (Hindmarch, 2011).
Pivotal years with rapid changes for map librarians were in the first decade of the 21st century. In 2000, the USGS announced that the 7.5-minute national map series that was completed in 1992 would no longer be revised because of budget constraints; the series would be replaced with a digital quadrangle map series named US Topo (Moore, 2000). In 2009, the USGS stopped sending print versions of these maps to depository libraries, and while paper maps remain available for sale at the USGS, the map series was placed online for free download and replaced by The National Map (Moore, 2011, 2013; U.S. Geological Survey, 2012). Some libraries responded by discarding print map collections since they were available online and reassigning duties for map librarians. Few LIS programs recognized the potential for this transition either.
Since 1950, only a few LIS degree-granting universities have offered any course curriculum related to map and geospatial librarianship as noted earlier. This slow growing LIS career track is a conundrum given that we are in the midst of a map and geospatial revolution (PennState Public Broadcasting, 2010). Popular online courses with enrollments as large as 48,000 and geospatial webinars exist for professionals and the public to learn about spatial information with various widely accessible mapping technologies including military and consumer Global Positioning System (GPS) devices, interactive web maps, and map-application enabled smart mobile phones and tablets (Directions Magazine, 2014; PennState, 2016; Robinson et al., 2015).
The demand for knowledgeable librarians and robust map and geospatial collections in libraries should be at an all-time high, yet library school faculty and library administrators have not seized this opportunity. Weimer and Reehling (2006) proposed a Geographic Information Librarianship specialization, considering the significance for this expertise in the LIS profession and outlined curriculum. Furthermore, Weimer and Reehling suggested that student recruitment would succeed best in an academic interdisciplinary setting with strong geography-GIS and LIS programs. Likewise, Abresch, Hanson, and Reehling (2008) stressed the demand for trained geospatial librarians would only be met if LIS schools would provide the necessary training. Researchers from two different LIS programs are working to implement needed changes.
In 2012, a two-year Geographic Information Librarianship (GIL) project by Drs. Wade Bishop and Tony Grubesic was funded through a Laura Bush 21st Century Librarian Program grant via the Institute of Museum and Library Services. The research collaboration was between the University of Tennessee, Knoxville and Drexel University, Philadelphia, PA. The overall purpose was to introduce GIL education into LIS curricula and, in turn, increase GIS-related research in LIS (University of Tennessee Knoxville, n.d.). Bishop presented the study at a webinar sponsored by MAGIRT (Clemons, 2014). In order to design the GIL courses, researchers surveyed practicing GIS and map librarians to determine the most important MAGIRT competencies (Bishop, 2014). Bishop explained that out of 75 core competencies, 23 were identified as most important, which led the researchers to devise 13 student-learning outcomes (SLO) for curriculum, see Appendix B. After courses were created, students were recruited for participation; classes were given SLO pre- and post-test questions falling in four major categories: (a) geography/cartography, (b) collection development/maintenance, (c) reference/instruction, and (d) metadata/cataloging. The Geographic Information (GI) classes demonstrated on average, 13% student improvement (Bishop, 2014). Specifically, test score improvement for SLO categories given above was (a) 15%, (b) 8%, (c) 12.6%, and (d) 18% (Bishop, 2014).
Bishop, Cadle, and Grubesic (2015) expanded on the grant findings by doing a validation survey. Interestingly, the survey revealed only 45% of the map and geospatial librarians had a master’s degree in LIS; the 55% without the MLIS had graduate degrees in geography, geology, and urban planning, among others (p. 72). The results of the survey identified the most important knowledge, skills, and abilities within the extensive core competencies listing. As this was generated by current practicing map and geospatial librarians, it informs future LIS curricula on which courses best prepare students for map and geospatial librarianship jobs in the 21st century (Bishop et al., 2015). After identifying the map and geospatial data courses and programs offered at ALA-accredited LIS programs and considering the results from the research by Bishop et al., it is appropriate to review recent job postings and research to identify challenges students and practitioners may still encounter.
In 2005, the Association of Research Libraries (ARL) Spatial Data and Collections report documented transitions and progress for libraries that offered GIS resources and services since digital mapping first appeared in their libraries 15 years earlier (Salem & Association of Research Libraries, 2005, p. 11). This was a follow-up survey from a 1999 report from the ARL regarding the 1992 GIS Literacy project (Association of Research Libraries, 1999). As an example of what the 2005 report revealed, librarians were asked to indicate the level of GIS use and the disciplines involved among students, faculty, or researchers. The overall demand for spatial data support had grown, but disciplines using GIS most frequently were geography, architecture, and geology. It was somewhat surprising to Salem and Association of Research Libraries (2005) that social and health sciences had emerged as medium to heavy GIS users, and other disciplines utilizing GIS library data and services were city/regional/urban planning, agriculture, forestry, and ecology/environmental studies (p. 13, 14).
This report contained library job descriptions in the form of job postings. Job titles for librarians working with GIS varied from Map Librarian to Geology Library Head, and other titles included Public Service Librarian, Data Service Librarian, Assistant Head of the Map & Imagery Laboratory, Map/GIS Librarian, etc. The librarian’s job expectations were often in management, but otherwise followed the traditional library divisions of collection development, acquisition, reference, and instruction. In addition, some map librarians may have been assigned classifying, cataloging, and indexing. Another primary duty was to coordinate with the map copy cataloger in technical services. One way for promoting collections was the expectation for developing map library webpages, and one director was tasked with creating a map gift acceptance policy (p. 74, 75).
What follows are some of the transitions and challenges for library students and librarians more than 30 years after digital geospatial resources and services were first added to map library collections. Research findings and selected job postings are used to highlight duties and expectations today, which can be negative and positive factors for pursuing map and geospatial librarianship.
Larsgaard (1981) described map librarianship as “an intense and isolated occupation” in an edition of Library Trends journal that was devoted to articles of good and bad news involving the profession (p. 371). She argued that the lack of interest in developing a map librarian career track at universities was no surprise given the ludicrously low librarian salaries in the 1980s. Decades later, Brown (2006) noted the discrepancy in salaries between science librarians and scientists in industry. This negative recruitment point was reiterated when Forbes magazine ranked the master’s degree in LIS as the number-one worst degree based on mid-career median pay and projected employment growth (Smith, 2012). A Library Journal editorial rebuttal suggested “librarians aren’t in it for the money,” which is sentiment that could apply to others on Forbes worst graduate degrees for jobs list including education and history (Annoyed Librarian, 2012).
Low salary for high job expectations may be a negative factor in recruiting for map and geospatial librarianship positions. According to Occupational Outlook 2015 median pay for a librarian was $56,880 U.S. per year; the expected entry-level education for librarians is a graduate degree in LIS as well as a secondary graduate degree in a content or teaching area (U.S. Bureau of Labor Statistics, 2015). Excerpts from an actual job description follow with a salary range from $43,000 to $60,000 U.S., depending upon experience and qualifications. As an example, this library opportunity was posted in 2014 for a large university in the Midwest.
Job Title: Geospatial Information Systems Specialist
1. Master’s degree in LIS with advanced coursework in GIS; or an advanced degree in geography or geographic information science; or a geoinformatics certificate in combination with an informatics degree.
2. A high degree of computer literacy, experience using ArcGIS, teaching GIS, and building GIS web services; knowledge of programming and the script languages of Python or PHP, Federal Geographic Data Committee (FGDC)-endorsed metadata standard as well as map and geospatial resources.
3. Demonstrated excellent communication skills, ability to work independently and collaboratively.
Responsibilities
1. Managing the geospatial library collection and curating geospatial datasets.
2. Design and delivery of a geographic-based portal for downloading data owned, licensed, produced, and curated by the Libraries; enhance access to digitized collections of historic maps and atlases.
3. Provide geoliteracy through instruction, research assistance, subject liaison, and campus-wide educational outreach.
Similar jobs posted in 2007 listed a salary of $40,000 U.S. and in 2009, a salary of $52,731–$65,361 Canadian. These locations were also mid-continent with job titles of Map and Data Services Librarian, Assistant Professor level, and GIS Librarian, respectively.
As early as 1948, the debate began on whether it is better to hire a geography-cartography subject specialist with an interest in libraries or a library specialist with an interest in geography-cartography (Woods, 1952, p. 88). Faculty and administrators might argue that the lack of courses for map librarianship in library school curriculum is a result of low student demand. In contrast, Hallmark and Lembo (2003) suggested that library schools simply fail to recruit students from the sciences and engineering in general and geography or other geosciences in particular. Mount (1985) noted in a 1983 survey of academic science librarians that 32% had undergraduate degrees in the sciences or engineering. Winston (2001) surveyed to find that 35.5% of science and engineering librarians had undergraduate degrees in the areas of biology, physics, chemistry, or engineering.
Doctoral candidates in library schools may have history and foreign languages educational backgrounds, but few LIS schools provide any course work specific to cartographic collections and preservation. Excerpts from an actual job description follow that involve cartographic resources with an interest in history and curation. This large academic library is on the east coast, and the job posting was in 2016.
Job Title: Curator of Maps and Prints
1. Ph.D. or extensive curatorial or scholarly experience in history of cartography.
2. Demonstrated ability for teaching, public speaking, and grant writing; experience in special collection libraries and a strong aptitude for foreign languages.
3. Interest in “linking” study of historic maps and atlases with emerging technologies; ability to manage projects effectively and independently.
Responsibilities
1. Promote the use of map and print collections, physically and digitally through engagement, outreach, and collection management.
2. Conduct individual and collaborative research.
3. Acquisitions and collection development, assisting the director.
While it appears that library schools may not be offering courses or recruiting students for map librarianship, academic libraries may be adding to the problem by not hiring qualified personnel. For example, here is an anonymous anecdote about an applicant with a geology undergraduate degree and LIS doctorate degree from an accredited library school. This person applied for a nationally advertised geoscience librarianship position at a large academic library and was not granted an interview. After a casual inquiry about the success of the search, the unsuccessful applicant was told that the job was filled by a person who had no geoscience background but had worked in the library for the previous year and was liked by other staff members. Ironically, when Hallmark (1998) interviewed geoscience library managers from government, academic institutions, and the corporate world on their views of ideal education for practitioners, these library managers stated that “they would prefer to hire a geologist and train that person in library and information science than vice versa” (p. 84). This finding is valid today as Bishop et al. (2015) noted 55% of the practicing map and geospatial librarians did not have the MLIS degree.
Library job descriptions requesting high school educational background and specialized cartographic and cataloging knowledge is a negative factor in recruiting students to map librarianship. Excerpts from an actual job description follow. This library job was posted in 2014 at a large university in the south. The salary was $41,000.
Job Title: Senior Library Specialist—Cartographic Resources Coordinator
1. High school and 4 years of library experience; ability to learn rapidly, to read complex visual information, and to use PC-based office applications proficiently.
2. Theoretical knowledge of cataloging, following Resource Description and Access (RDA), AACR2, Machine Readable Catalog (MARC) Bibliographic, Holdings, and Authorities formats.
3. Demonstrated ability to recognize, define, and analyze problems; high level of comfort in digital environments; strong interpersonal skills with effective oral and written communication skills.
Responsibilities
1. Develop and maintain map cataloging/metadata policy and practices in Cataloging and Metadata Services.
2. Provide descriptive metadata for maps and atlases in MARC and/or non-MARC in all languages; serves as a cartographic metadata liaison and assess/prioritize/coordinate map metadata projects among three major collections.
3. Work collaboratively with the Coordinator of Digital and Monographic Resources Unit to develop and train staff in cataloging.
A similar cataloging position at a large, private university on the west coast did require a university degree, the MLIS or a related Bachelor’s Degree. Additional responsibilities were for grant writing and reference work, plus creating “crosswalks for metadata transformations” and a willingness to work directly with the public in a personable, friendly manner.
Requiring a high school diploma and library experience to conduct cataloging, may or may not be typical. That being said, the scenario for hiring outside LIS closely aligned with the recommendations of Kollen et al. (1998) and Larsgaard (1998), who seemed to suggest that the best candidate to enhance map reference services, better publicize map collections, and knowledgeably communicate with clients would be one with a strong background in both geography or some other aspect of geoscience. They also recommended library studies.
Kuruppu (2006) summarized the literature on the pros and cons of hiring a science subject specialist librarian versus a generalist librarian who gains subject specialty on the job. She concluded that while subject specialization is expected and ideal, candidates with adequate backgrounds were not always available in an applicant pool. Although this is no substitute for a subject specialist, Brown (2006) found 60% of ALA-accredited schools did offer a course in general scientific reference service (p. 46). This does not make up for the point that fewer than 20% of ALA-accredited LIS universities offered a specific map and geospatial reference course in 2014. Although the answer for preparing librarians to work with map and geospatial resources is in part adding and improving LIS coursework, some suggested effective recruiting of students with the content background would suffice (Jeong, 2006; Smith, 2006). Beck and Callison (2006) argued that successful science librarians who initially did not have the subject background knowledge could not be called accidental science librarians; instead, serendipity and sagacity play a part in success when combined with sound training in LIS principles and core competencies (p. 73).
Just as Hallmark and Lembo (2003) had found, other researchers (Kellsey, Alexander, Ascher, & Brower, 2010; Roland, 2000) concluded that fellowships and internships where students work directly with mentoring librarians demonstrated great promise as a viable way to recruit students to science and engineering librarianship. Martindale (2004), a Map/GIS Librarian, suggested if students were interested in “rewarding career of GIS librarianship,” they must pursue independent study, fieldwork, and internships because the likelihood of gaining exposure to GIS or the concept of GIS librarianship in graduate LIS programs was low (p. 67). Martindale based her comments on survey results from 56 ALA-accredited LIS masters programs. Martindale concluded that most LIS curricula did not address GIS or digital geospatial data management issues and that academic library literature regarding maps and GIS had declined since the 1990s. This was a conundrum, given that cartographic professionals and academic geography faculty were realizing the potential of neogeography and neocartography.
This example was for a paid internship offered in 2015 from a company located on the west coast of the United States. Finding suitable internships is one way to influence a student wanting to have a GIS career track for librarians.
Job Title: Summer Internship Opportunity: GIS company library
1. Currently enrolled in MLIS program and completed at least one graduate cataloging/bibliographic skills course.
2. Demonstrated excellent spelling and typing, desire to work in a team, and familiarity with concepts of GIS.
3. Knowledge of digital asset management, digital rights management, and digital copyright expertise.
Responsibilities
1. Organize and catalog library archival material; enter citations and abstracts into a GIS bibliographic database with original key wording; and identify copyright for significant papers.
2. Conduct library operations including reference, circulation, and shelf management; continue ongoing controlled vocabulary project.
3. Learn about GIS and the importance of GIS in map librarianship.
Somewhat surprising is that the idea of incorporating GIS services in academic libraries is not new. Envisioning the need for geospatial librarianship led the ARL to create a GIS Literacy Project in 1992. ARL partnered with Esri and invited ARL member libraries to send librarians for free training on Esri’s ArcGIS software. By 1999, ARL measured the impact of the project and found that of those responding to the survey, the majority of librarians offered GIS services through map libraries and government documents sections; 81% of the GIS librarians had MLS degrees, 51% were trained in the ARL GIS Literacy program, and 39% had some academic GIS course work (Abresch, Hanson, & Reehling, 2008, pp. 245–246).
A decade ago, Weimer and Reehling (2006) noted GIS librarianship differed from a traditional map librarian’s job in that the information format was “digital geodata” (p. 295). They urged LIS faculty to offer course work and proposed curricula in part by examining library job posting requirements. Job titles then ranged from map to spatial data collections and services librarians and requirements common among the postings were to deliver spatial and numeric data resources and services, while also providing GIS- and map-related reference.
Below is a 2016 job announcement from a university library on the east coast. Note the position posting did not require the MLIS degree. Being qualified as GIS consultant and librarian is not common; it is a factor in for students considering map librarianship.
Job Title: Geospatial Consultant
1. Master’s degree in geospatial discipline; experience in public service, university setting.
2. Experience in supporting academic uses of GIS and in administering ArcGIS Server.
3. Excellent communication skills and effective teaching of complex technical knowledge.
Responsibilities
1. Develop research and information services that support use of geospatial data on a university-wide scale and that guide faculty and student in using geospatial data for research and scholarship.
2. Develop spatial delivery environment, specifically using ArcGIS server, Portal, Online and offer training with other GIS and data experts.
Contrasting job postings over the past several years demonstrate that in spite of the high demand for digital resources and services, print cartographic formats remain relevant. Additionally, the consequence for not preparing students for map and geospatial librarianship is that employers are hiring the best qualified applicants, with or without the MLS degree.
As described earlier, map and geospatial librarians have numerous responsibilities. Adding to that list is designing and managing the physical space and appropriate equipment. Just as print resources have transitioned to digital, map storage cases have shifted to computing servers and the cloud.
Map and geospatial resource collections present a challenge in that these resources are oversized in paper or electronic file formats, which necessitates adequate work space, specialized equipment, software licensing, and large dedicated computer-server space. Flat, folded, and rolled print maps need care and preservation, while digital collections must be migrated without loss of metadata to the newest storage mediums and current hardware specifications (Sweetkind-Singer, 2009). Digital collections require computer-server storage, but print collections depend on proper storage cases and solid floors.
In 1998, by the way of an introduction to map libraries and librarian duties, Kollen et al. provided an outline of map library work space and equipment. At that time, print maps were common, and to accommodate large map sheets, sizeable work tables were important adjacent to stacked map storage cases and hanging files all in an open room appropriate to the size of collection. Besides a variety of maps, it was suggested that oversized atlases and globes should be displayed on top of the map cases or in book shelves and folded or small maps were in book shelves or filing cabinets.
Hardcopy print map storage could be straight up in vertical case or sideways in horizontal map cases. Vertical cases hold maps in racks or troughs hung from hooks or suspended folders that slide on rails fixed to the side of the cabinet. These cases vary in size, but open on top and pull out from the front. Advantages to vertical files are they hold more maps in about half the space of filing flat, and individual vertical cases have wheels. Disadvantages are that nothing can be placed on top meaning units cannot be stacked, and they cost more than horizontal cases. Horizontal storage cases may be stacked and fixed in place or placed inside compact shelving, which are rolling, movable units. See Pritchett (2014) for a short video that shows compact shelving units in operation.
Map cases in the past and today are available in wood or steel, see Fig. 6.2. Steel is stronger, lighter in weight, and less expensive, making it the choice more often than wood. Assuming the drawer size is 50 × 38 × 3 in., this would hold two separate stacks of the 7.5-minute topographic map or most thematic maps, unfolded. Units may be various sizes though, containing three to five drawers, with the ability to stack each individual unit. The best recommendation is to go no higher than about 50 in. This allows maps to be laid on top of the case and most filing could be accomplished without the need for ladders. The size and height of the storage case are dependent upon limitation of the strength of the floor. Fully loaded, five-drawer map cases stacked three units high could weigh more than 1700 pounds (Larsgaard, 1998, p. 219; Lage, 2007). This is often the argument for placing map library space in the lowest level of the building. While compact shelving saves space, it is much heavier and the load-bearing recommendation for flooring must be investigated. March (2009) cautioned against assuming floor stability is uniform as channels exist under flooring to accommodate electrical wiring and other infrastructure.
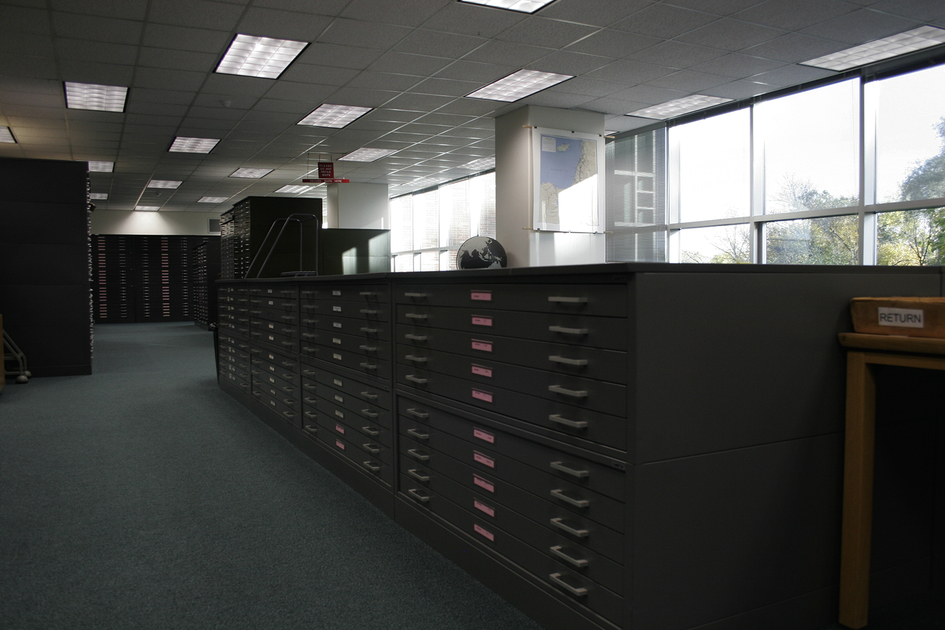
If horizontal map cases are fixed in rows, the width of a double-facing aisle is an important consideration. According to ADAAG-United States Access Board (2002), the minimum space in library stacks is a width of 42 in. However in map libraries, aisle spacing must allow for a person to move back with the open drawer, as well as for accessing maps and completely removing a drawer without being restricted by the opposite case. Space is nearly always a problem with map collections, but ideally, spacing might be determined by figuring 1.5 times the depth of the deepest storage case (e.g., for a 38 in. deep case, ideal aisle spacing would be 54 in.). March (2009) made a strong case for utilizing AutoCAD software to create a blueprint plan for map-room equipment. The purpose was a new configuration to fit the room after moving the collection, but no mention was made for how to determine aisle spacing. In the 1980s, SLA G&M developed standards for university map collections that may be useful to review to review for print map collections (Selmer, 1988; Special Libraries Association, 1985; Special Libraries Association, Geography and Map Division Committee on Standards, 1986, 1987). In addition to map storage, light tables, overhead and slide projectors, microfilm and microfiche reader printers, and photocopy machines were suggested. Some libraries might have a desktop electronic magnifier designed for people with low vision. An assortment of small equipment that was available included calculators, rulers, drafting compasses, magnifying glass, stereoscope, and paper cutter.
While much of the equipment and tools listed earlier may not be in the map library today, a stereoscope might still be available. Stereoscopes were used since the 1930s as a fundamental tool of topographers; mirror stereoscopes reduced distortion and are preferred for aerial photo interpretation (Haren, n.d.). Although stereoscopes seem more of a historic relic, modern technology is now being employed to reinvestigate older stereo photos, see Fig. 6.3. At the University of Auckland’s map library, two cartographic and geospatial librarians have been experimenting to replicate the 3D effect in a digital format in order to showcase the potential of using older aerial photographs in a different way (Jones & Drecki, 2015).
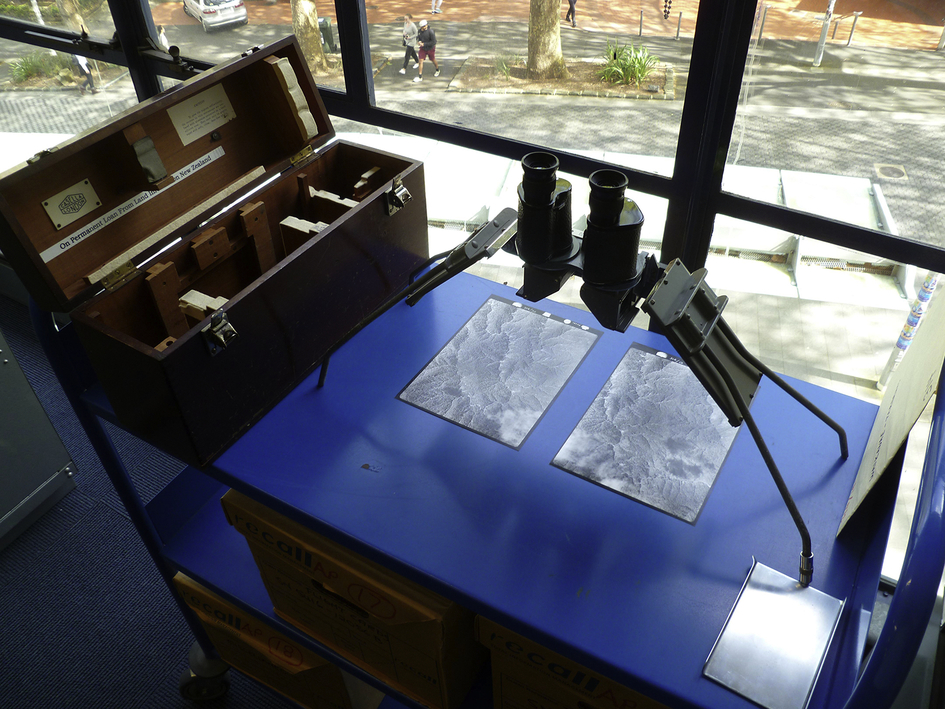
A modern map library work space room may or may not contain print maps in storage cases. Instead, the room might have large tables with equipment such as color scanners and color photocopier as well as workstations with GIS and graphics software. Individual carrel desks or tables would be configured with electrical power outlets and available extension cords. GPS units may be available for checkout with an orientation session. While print maps in cases may still be available, many print collections have been moved off-site or weeded in favor of digital map collections.
Map librarianship is a profession that has arisen out of necessity. The large-scale map production and collection that occurred during the 20th century created a need for specialized librarians with one foot in the library and one in the world of geography. However, formal training is a relatively recent phenomenon and today remains less common than more traditional LIS career paths. Preparing for and finding jobs in this field may be more difficult than other career paths due to the small number of educational programs to prepare students. The map and geospatial or neomap librarian must also have skillsets beyond those needed for traditional librarian positions, as specialized equipment and technology knowledge is necessary to properly handle geospatial information, in both analog and digital forms. The next chapters go into some detail with the expectations for the neolibrarian in resource and instruction services, reference, collection development, cataloging, and classifying.
Cartographic materials are important components of library collections, but the volume of data that exists can be overwhelming. Copyright laws put restrictions on reproduction of original materials, including maps, and assign the right to copy to copyright holders. Copyright, fair use, and the relatively new Creative Commons licenses are discussed. Hardcopy geospatial resources can be found in most library collections, but the trend today is toward digital distribution and the use of specialized software to display and interpret these materials. A discussion of available software packages lists the most popular commercial and open-source software, both for the desktop and mobile platforms. An enormous volume of digital data is available, much of it considered a part of the public domain; a list of some of these resources, what they provide, and how they can be used are included in this chapter.
Copyright; Fair use; Creative Commons; Geospatial data resources; Maps; Software
Libraries and librarians are needed more than ever in today's information landscape. Informed map librarians can create reference services that identify authoritative, credible cartographic sources and note whether the resource is free or fee-based. Map librarians can design instruction services related to maps and geospatial data that describe copyright law and elaborate on what fair use is and is not, with examples for citation and attribution. One major advantage today is the ever-increasing number of cartographic resources and mapping software shared online that may complement existing print map library collections. The challenges are navigating the labyrinth of available cartographic resources and knowing how software, maps, and data can be found and used in a legal manner.
In the past, obtaining cartographic resources meant physically walking through the doors of library, government, and commercial buildings. Today, these resources are more often obtained electronically. As noted in Chapter 1, both the physical and electronic doors can slam shut on governmental agencies and libraries at the whim of politicians, including the closure of the Library of Congress, see Fig. 7.1.
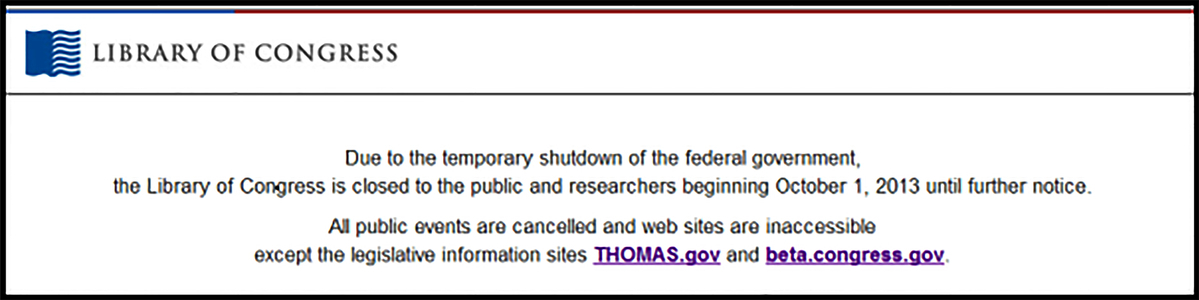
Closing the Library of Congress (LOC) had far-reaching consequences for librarians, publishers, and citizens. For example, Fister (2013), a librarian, had to turn patrons away when access to and use of the LOC resources were denied and The American FactFinder was shut down. Fister commented on the Congress-initiated closure as, “this is what happens when people who do not believe in government are elected to government… they took an oath to defend the constitution…but they don't believe in the system for which the constitution is a blueprint.” Publishing companies experienced delays when it was not possible to obtain Library of Congress Classification Numbers (LCCN) before going to press (G. Knott, personal communication, November 1, 2013). Moreover, tens of thousands of citizens were delayed in applying for and recording copyright claims of authorship, trademarks, and patents to the U.S. Copyright Office, a department within the LOC (U.S. Copyright Office, n.d.g). Copyright is the legal foundation of libraries, and librarians must provide instructional services to inform the public on copyright protection, fair use, public domain, and citation of sources (Association of Research Libraries, n.d.).
Copyright is a legal means to protect original works of authorship created in a tangible medium, whether published or unpublished; this includes cartographic, pictorial, and graphic creations, but excludes ideas, procedures, process, and systems (U.S. Copyright Office, n.d.d). Thus, maps and geospatial data fall under copyright protection; yet, the process of mapping such as using geographic information systems to produce maps is not covered under the laws of copyright. This is in part why open-source GIS, such as QGIS or GRASS, may be used without permission or fees.
In a literal sense, copyright means the right to copy. In a legal sense, copyright becomes the exclusive right to copy, which belongs only to the author or copyright holder. According to the U.S. Copyright Office (n.d.b), copyright law identifies the author as not only the “…creator of the original expression in a work” but also “…the owner of copyright unless there is a written agreement by which the author assigns the copyright to another person or entity, such as a publisher.” If the author creates the works for hire, authorship belongs to the employer or commissioning agent.
Copyright laws assigning rights of ownership were created to prevent piracy. Piracy or copyright infringement “…occurs when a copyrighted work is reproduced, distributed, performed, publicly displayed, or made into a derivative work without the permission of the copyright owner” (U.S. Copyright Office, n.d.b). According to U.S. Copyright Office (2010), they serve as an office of record and do not provide legal advice, but the website has a complete how-to account of defining infringement, explaining enforcement options, and accessing litigation resources. In the past, it was easy to know whether a work was protected by copyright, because a copyright notice was evident. Copyright notice consists of the symbol © followed by the date of first publication and the copyright owner's name (U.S. Copyright Office, n.d.b). However, copyright exists automatically in the United States today whether or not the author included the copyright notice. A brief history of copyright law follows.
Writers of the Constitution addressed copyright for scientists, artists, and authors in order to promote creativity and innovation in the United States. A Federal Copyright Law was passed in May 1790, 2 years after the U.S. Constitution was ratified with a provision submitted by James Madison, “to secure to literary authors their copyrights for a limited time” (U.S. Copyright Office, n.d.c). The resulting law protected books and maps for a period of 14 years, with one renewable 14-year time period. Less than 3 weeks after the Federal Copyright Law was enacted, the first cartographic resource was registered to John Churchman for his Magnetic Atlas and Variations Chart (U.S. Copyright Office, n.d.c). Given the resource's age, the fact that the cartographer is deceased, and LOC inclusion in the online catalog, use of this resource is now considered in the public domain and has fair-use status, see Fig. 7.2.
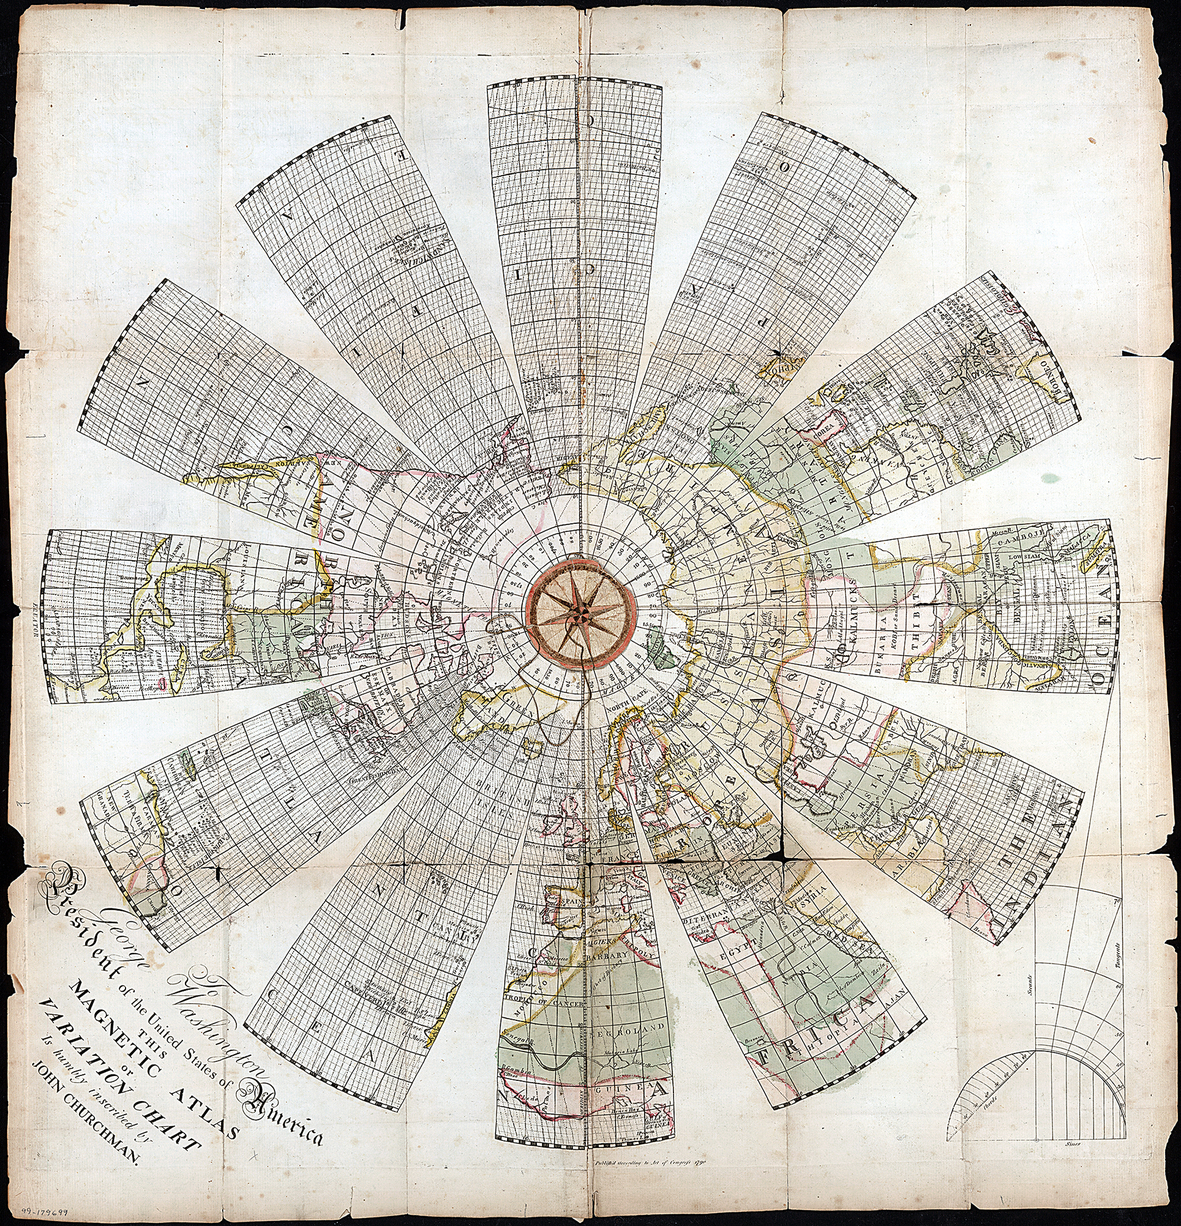
The original 1790 federal law only applied to U.S. domestic copyright protection. This isolated position in the world meant there was no legal recourse for global intellectual piracy; for example, foreign publishers could translate and reprint U.S. citizens' works, from books to maps, without requesting permission or providing payments. This was a worldwide problem that many countries recognized could be solved by crafting and agreeing to international copyright provisions. A convention was held in Berne, Switzerland in 1886 to address the protection of works and rights of authors. If countries signed the Berne Convention, all contracting parties or signatory countries would recognize copyrights held by citizens of other signatory countries. Subsequent conventions expanded the scope of the Berne Convention. Links are online to a Berne Convention summary, including the complete treaty from September 9, 1886 through numerous revisions and amendments ending on September 28, 1979 as well as a list of contracting parties (World Intellectual Property Organization, n.d.a). While this treaty for international protection of literary, scientific, and artistic works became effective in 1887, the United States did not initially participate in the Berne Union of member states. Instead, the U.S. Congress passed the International Copyright Act of 1891, which empowered the President to extend copyright protection to works of foreign nationals of select countries that reciprocated the arrangement for U.S. citizens (U.S. Copyright Office, n.d.c).
When the copyright law was enacted in 1790, district courts were the first to handle copyright registration (U.S. Copyright Office, n.d.e). Congress removed the process from the courts and created the U.S. Copyright Office and Administrator, Register of Copyrights, as a separate department within the Library of Congress in 1897 (U.S. Copyright Office, n.d.e). While the Copyright Office provides expert, impartial assistance to the three branches of the federal government on law and policy, it serves primarily as a place where claims to copyright are registered and documents related to copyright are recorded. The copyright catalog has records back to 1891 and today the catalog can be searched online (U.S. Copyright Office, n.d.f).
On March 1, 1989, the United States signed on as a member state of the Berne Convention, adhering to the 1971 Paris Act (U.S. Copyright Office, n.d.c). A quick summary of this treaty is that copyright protection is equally recognized among all signatory states and is independent of copyright law in the country of origin of the author's work. One of the significant changes for the United States was accepting the concept that a copyright does not require registration application and approval in each country, but rather it is an automatic right that exists the moment a work is written, drafted, or recorded (World Intellectual Property Organization, n.d.b). Even though registering works for copyright protection has no longer been mandatory since March 1989, the Copyright Office still processed more than 700,000 registration claims in the fiscal year 2011 (U.S. Copyright Office, n.d.e). In addition, the registration and records systems together form the largest database of copyright works and ownership information in the world (U.S. Copyright Office, n.d.e).
In the 18th century, federal law granted a copyright holder's exclusive rights lasting a maximum of 28 years; today, the duration of protection is longer but more complex because of the Copyright Act of 1976 and subsequent to joining the Berne Convention. Despite this, copyright has never precluded the use of a creative work; if permission for use was granted by the copyright holder or if protection had expired, then the work may be considered fair use. Fair use is the legal right to use copyright material without requesting permission, if all restrictions are understood and adhered to by the public. Nevertheless, the 21st century has seen a shift whereby the creator, or copyright holder, can assign the work to a Creative Commons license, which helps further define its fair use and delineate its copyright status.
When images, maps, or other original creative works display the Creative Commons notice, the author has chosen to retain some of the restrictions granted with copyright, see Fig. 7.3. Creative Commons is a U.S. nonprofit organization with global affiliates who help individuals to legally share personal works of creativity using free copyright licenses. The CC empowers creators by allowing them to more deeply participate in the sharing-friendly nature of the Internet, while staying aware of the need to protect creative works from abuse, particularly unauthorized commercial use. There are different levels or conditions to choose from when applying a CC license to a work, and the CC website has an interactive page that helps users to determine what license is right for them (Creative Commons, n.d.a). It is important to understand that a work licensed with the CC is not the same as a work being in the public domain; most CC licenses have use restrictions, the most common being the need for attribution. A CC license may allow users to share adaptations of a work freely, stipulate that adaptations are acceptable as long as the end product is released under the same or equivalent CC license, or allow free reproduction while prohibiting adaptations of the work. The CC also allows a user to grant or prohibit the ability to use their work in a commercial endeavor. While most CC licenses seen online are not the equivalent to public domain, the CC does have a version, CC0, that is “…a public domain dedication for rights holders who wish to put their work into the public domain before the expiration of copyright” (Creative Commons, n.d.b).

Unsurprisingly given the complexity of copyright laws, the breadth of potentially copyrightable materials, and international legal considerations, the CC has gone through several revisions. According to the Creative Commons (n.d.c), “…in November 2013, Creative Commons published the version 4.0 license suite… the most up-to-date licenses offered by CC, and are recommended over all prior versions.” Materials that continue to use an older version of the CC license are still protected, although in some cases the 4.0 license can add clarity, particularly in regard to sui generis database rights (Creative Commons, n.d.d).
Fair use has a simple definition, but unfortunately a complex determination as to whether the concept applies in any given situation. This is an especially relevant topic to be familiar with given the ease of access the Internet provides to text, images, maps, code, software, and other resources. Fair use refers to transforming, reproducing, and/or distributing copyrighted material for purposes of personal, educational, and commercial use and “…a defense against a claim of copyright infringement” (Stanford University Libraries, 2005–2016c). The Copyright Statute includes four factors that judges consider to determine fair use, mainly “…the purpose and character of your use, nature of the copyrighted work, amount and substantiality of the portion taken, and the effect of the used upon the potential market” (Stanford University Libraries, 2005–2016a). Since it is difficult to predict how a judge might rule, being familiar with past rulings may help; this information can be accessed through the U.S. Copyright Office website. This website offers a Fair Use Index that tracks “…judicial decisions to help both lawyers and non-lawyers better understand the types of uses courts have previously determined to be fair—or not fair” (U.S. Copyright Office, n.d.a). For each indexed decision, a summary of the facts, relevant questions, and court decisions are given.
Two U.S. university libraries at Stanford and Columbia have excellent copyright and fair-use resources and serve as examples for other libraries. At Stanford, the overview webpage provides links to all materials on the copyright and fair-use website (Stanford University Libraries, 2005–2016b). The source for much of the online information and blog at Copyright & Fair Use are from the book Getting Permission by Stim (2010). The Copyright Advisory Office was founded by Columbia University Libraries to support faculty and students as well as to provide awareness and education about copyright as it applies to teaching, researching, and publishing (Columbia University Libraries, n.d.a).
If fair use is contested by the copyright holder, the courts will weigh circumstances to determine the outcome. The following scenarios are paraphrased from two copyright advisory offices' webpages at Columbia University Libraries (n.d.b) and Stanford University Libraries (2005–2016a). Courts favor nonprofit educational use where the work is transformed into something new vs. commercial use and a direct reproduction of the copyright work. Courts are more protective of fiction and creative works including art, music, and films vs. nonfiction; courts do not accept correspondence or unpublished work as fair use, because copyright owners should have rights to first publication. Although quantity limits are not set, the more of a work used, the less often it is considered fair use. This has implications for commercial maps and aerial photography since the user would likely need the entire image, which is less likely to be fair use; however, cropping out a portion of the map or reusing low-resolution or thumbnail images for educational and research purposes may be fair use. It is not fair use if the works in question can be purchased or licensed; this directly affects mapping software and videos.
Resources that fall under public domain are fair use. With regard to copyright, public domain is a designation whereby works can be freely used without permission from the author. Among the reasons work is considered public domain status include the expiration of copyright protection or public property works that are produced by the U.S. government and as such do not meet requirements for copyright (U.S. Copyright Office, n.d.b). Lastly, an author may voluntarily give up copyright to dedicate the work in the public domain or release it under a Creative Commons license.
New print maps are becoming increasingly rare. Many agencies that used to print maps have either switched to a print-on-demand model, gone purely digital, or have quit entirely. This trend follows user demand, as many of today's map users expect digital maps or raw GIS data to create their own maps. Some agencies and private companies still produce paper maps, but the shift to a digital cartographic paradigm has opened up maps to a larger audience. This has allowed for much more participation in the creation and production of map information, see the discussions of NeoGeography and NeoCartography in Chapters 1 and 4. While this is generally positive, it changes the nature of the librarian's role in regard to map resources, as knowledge of the software used to create and analyze maps and geospatial data becomes more important. Patrons will likely have heard of the analytical abilities of GIS and remote sensing and want to tap in. It may not be possible for all facilities to have on-demand GIS technicians, although many universities may have a GIS lab that does consulting work, but knowledge of how to use the technology and where to find data remains an important skill to have. The remainder of this chapter serves as a guide to geospatial software and sources of data and maps that are available.
The desktop GIS and remote sensing fields are dominated by a few large players, although many smaller specialized and open-source software packages exist. In terms of cost, they range from free to fairly expensive. Generally speaking, these software packages demand powerful computer hardware and require relatively new Windows PCs to operate. Some software is available for the Mac and Linux platforms, but Windows is the home of the biggest players in GIS. This list is certainly not exhaustive, but rather focuses on the most prominent packages in use today. Other programs exist in the GIS market and may be good alternatives or helpful supplemental programs to have available. This section is not designed to make recommendations on which packages are the best; any of the programs described here would be useful and offer a good amount of support for users.
Let's start with an important free program that is widely used, Google Earth. It has played a large role in increasing spatial awareness and spatial thinking in the popular culture. Google Earth is used in education at all grade levels, as a leisure activity by individuals, and by professionals creating visualizations of the world. Despite this, Google Earth is not a true GIS software package. It is an excellent tool for visualizing data, but lacks database and analysis capabilities beyond measuring distances and surface area. This is not to downplay the quality or usefulness of the program, but rather to counter popular misconceptions of what GIS is. It is likely that well-intentioned patrons will have used Google Earth. That personal experience combined with fictional media representations of GIS, similar to the “science” employed in popular television crime procedurals, might lead them to expect that the technology could accomplish impossible things quickly and with little effort.
Google Earth is currently available in a few versions, the standard package and Google Earth Pro. The Pro version was formerly a paid product, but is now free for anyone to use. It adds more advanced capabilities such as the ability to print at high resolutions and export movies at full 1080p HD resolution. It also includes more advanced measurement tools, extra data layers, the ability to import Esri shapefiles, MapInfo .tab files, and more addresses in a spreadsheet simultaneously. A commercial version still exists, Google Maps for Work, although it is primarily oriented to developers in businesses. An image showing the main Google Earth Pro window can be seen in Fig. 7.4.
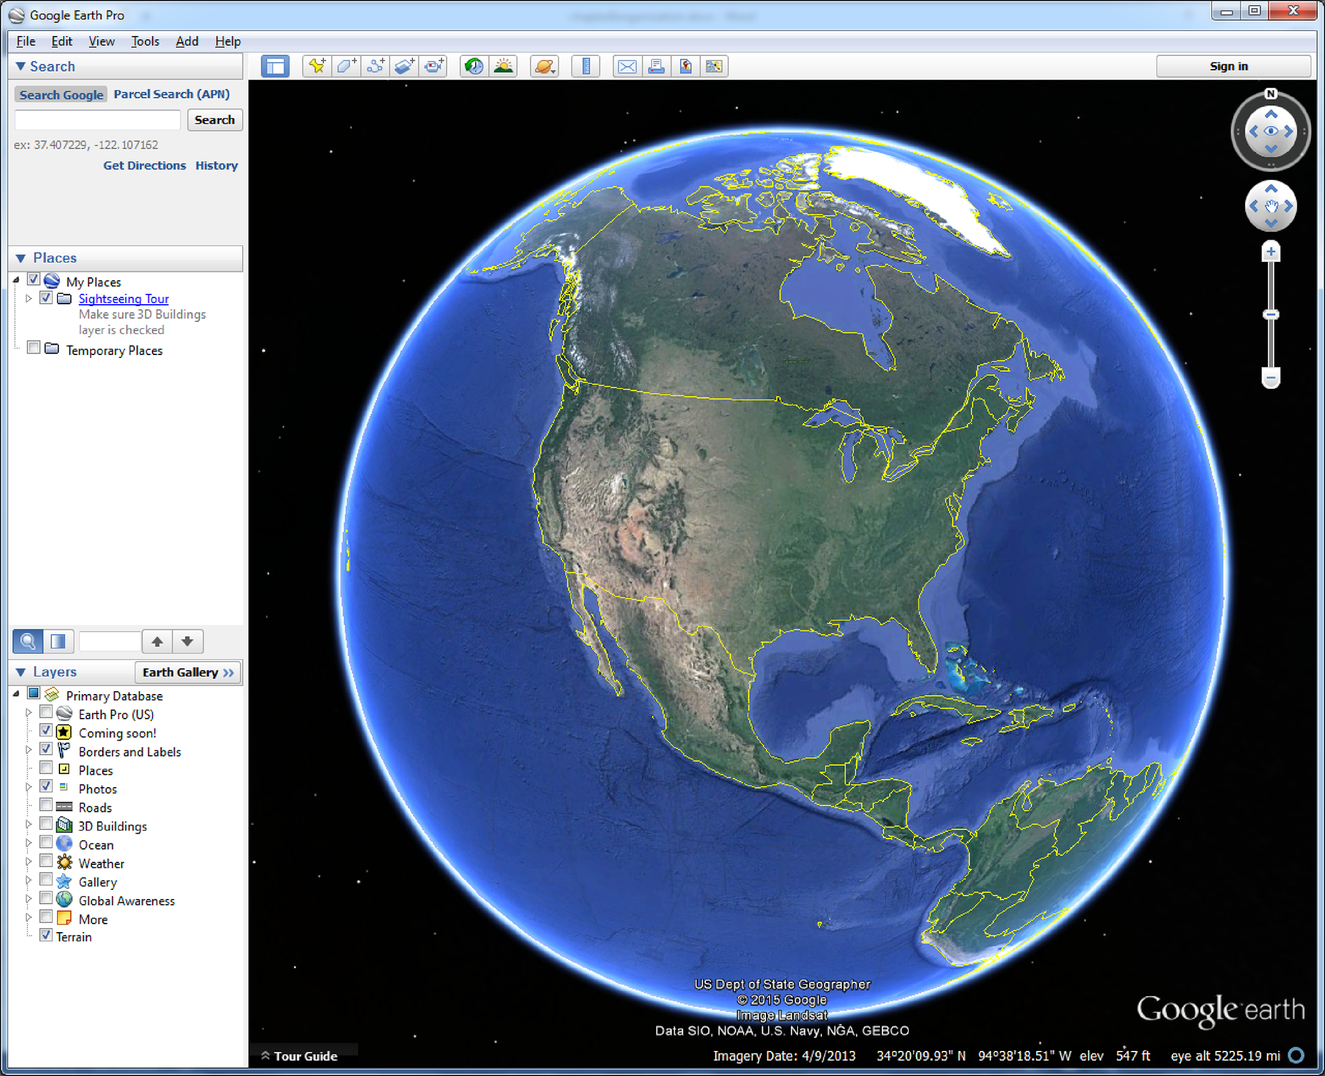
ArcGIS from Esri, an acronym for Earth Systems Research Institute, dominates the market and is considered the industry standard for GIS software. Esri began as a consulting firm, and first made its software commercially available as ARC/INFO in 1980. It has evolved over the decades, beginning in a mainframe context with work occurring exclusively at the command line. In 1992, ArcView was released adding a mouse-driven graphical user interface (GUI); this is not to be confused with the current ArcView, which is the name given to the entry-level version of ArcGIS for Desktop. The older ArcView version 3 is still in use in some places, especially internationally, in part due to the high cost of current ArcGIS offerings. Since ArcGIS 8 was released in 1999, Esri's flagship desktop GIS software has remained more-or-less the same, although new capabilities and improvements continue to be added. The largest change has come with ArcGIS Pro, released in January of 2015, which adds a new ribbon-style interface, similar to that introduced to the Microsoft Office suite in the 2007 edition. ArcGIS Pro also adds some modern updates, including 64-bit, hyperthreaded, multicore processor support, the ability to have multiple 2D and 3D views displayed simultaneously, and many other updates. Currently it does not support all of the functionality of ArcMap, but more tools and features continue to be added.
The primary program in the ArcGIS suite is ArcMap, where much of the analysis and map making occurs. Other components of the ArcGIS suite include ArcCatalog for managing data, ArcScene for 3D visualization of data, and ArcServer for hosting maps and GIS services online. While it is not official, it is quite likely that ArcGIS Pro will replace ArcMap as the primary Esri GIS application in a few years in a transition not unlike that between ArcView and ArcGIS. A screenshot of ArcMap 10.3 can be seen in Fig. 7.5.
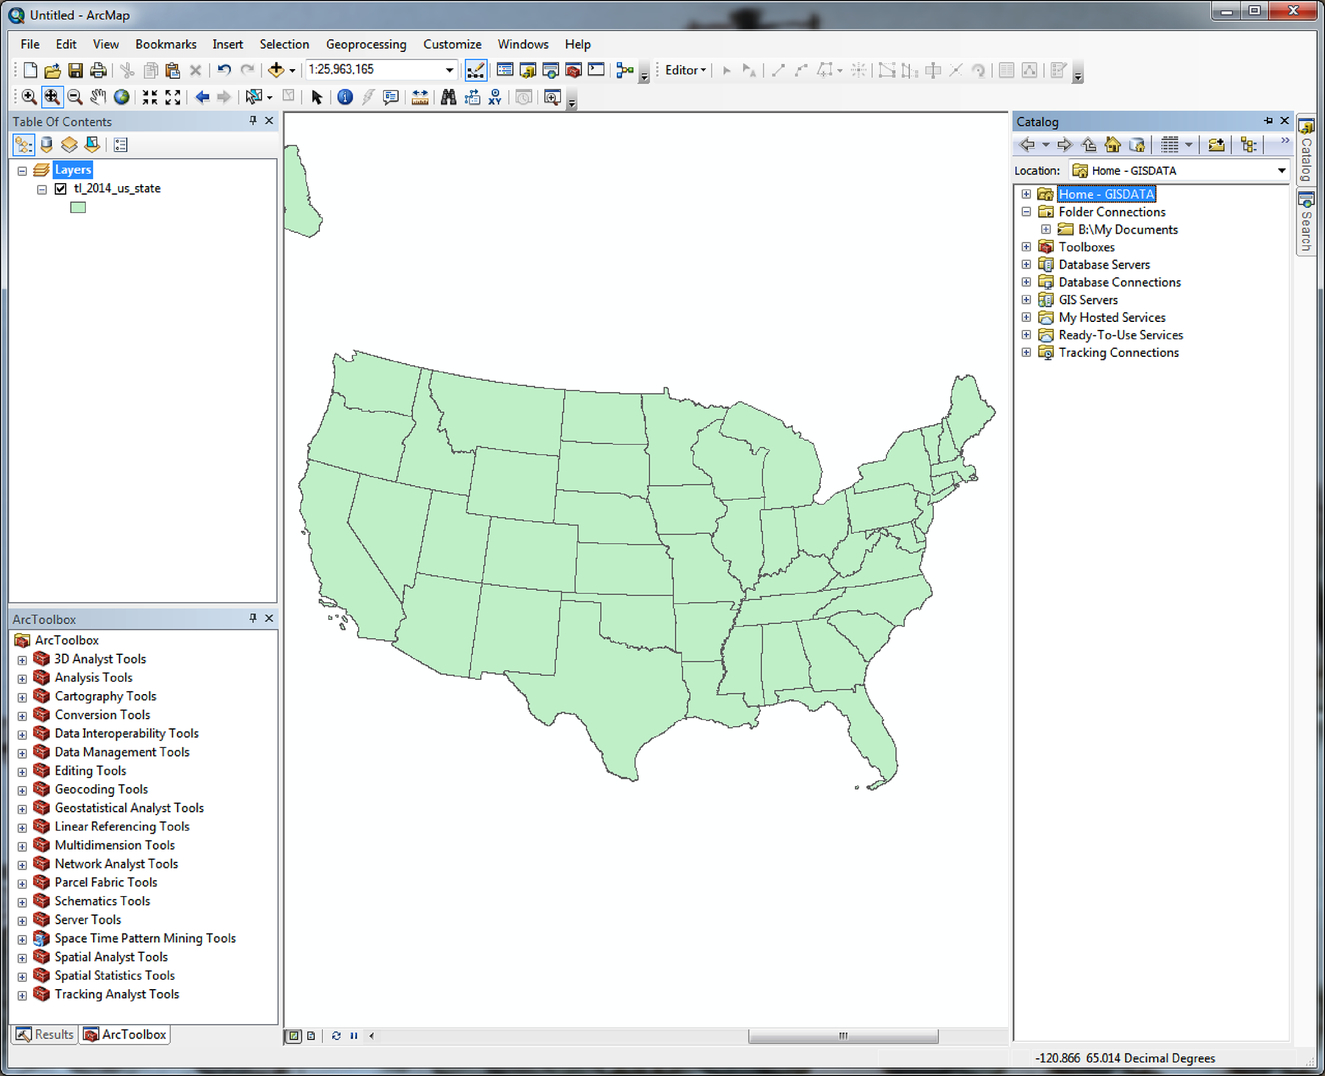
Despite being the industry standard for GIS software, ArcGIS is generally considered to be frustrating to work with at times. The software includes a great number of tools and options, and can be quite daunting to a novice user. While the program has improved greatly in speed and reliability over the years, it also retains a reputation for crashing regularly, and some tools require conditions that seem strange by current standards. These conditions include things such as having short character limits for file names or crashing due to spaces in file paths. Even with these issues, the fact that the software has been used commercially for more than 35 years means that an enormous amount of support exists, both via the extensive official documentation and through online support forums. Esri also hosts large annual conferences including the User Conference every summer in San Diego, California, and the Developer Summit every March in Palm Springs, California. Esri also hosts many smaller conferences all over the world on a variety of topics. These conferences offer a mix of training, product announcements, and networking opportunities.
MapInfo is another commercial GIS product that has been around for many decades. It beat Esri to the punch by releasing the first desktop GIS package then known as the Mapping Display and Analysis System (MIDAS) in 1986. For some time, the 3D toolset that MapInfo offered was considered superior to those offered by Esri, and MapInfo found a home with geologists doing subsurface work. Today owned by Pitney Bowes Software, it is a fully functional GIS package offering tools comparable to other large GIS packages. While it does not enjoy the same size market share as ArcGIS, it is still commonly used by GIS professionals. Fig. 7.6 shows a view of the software.
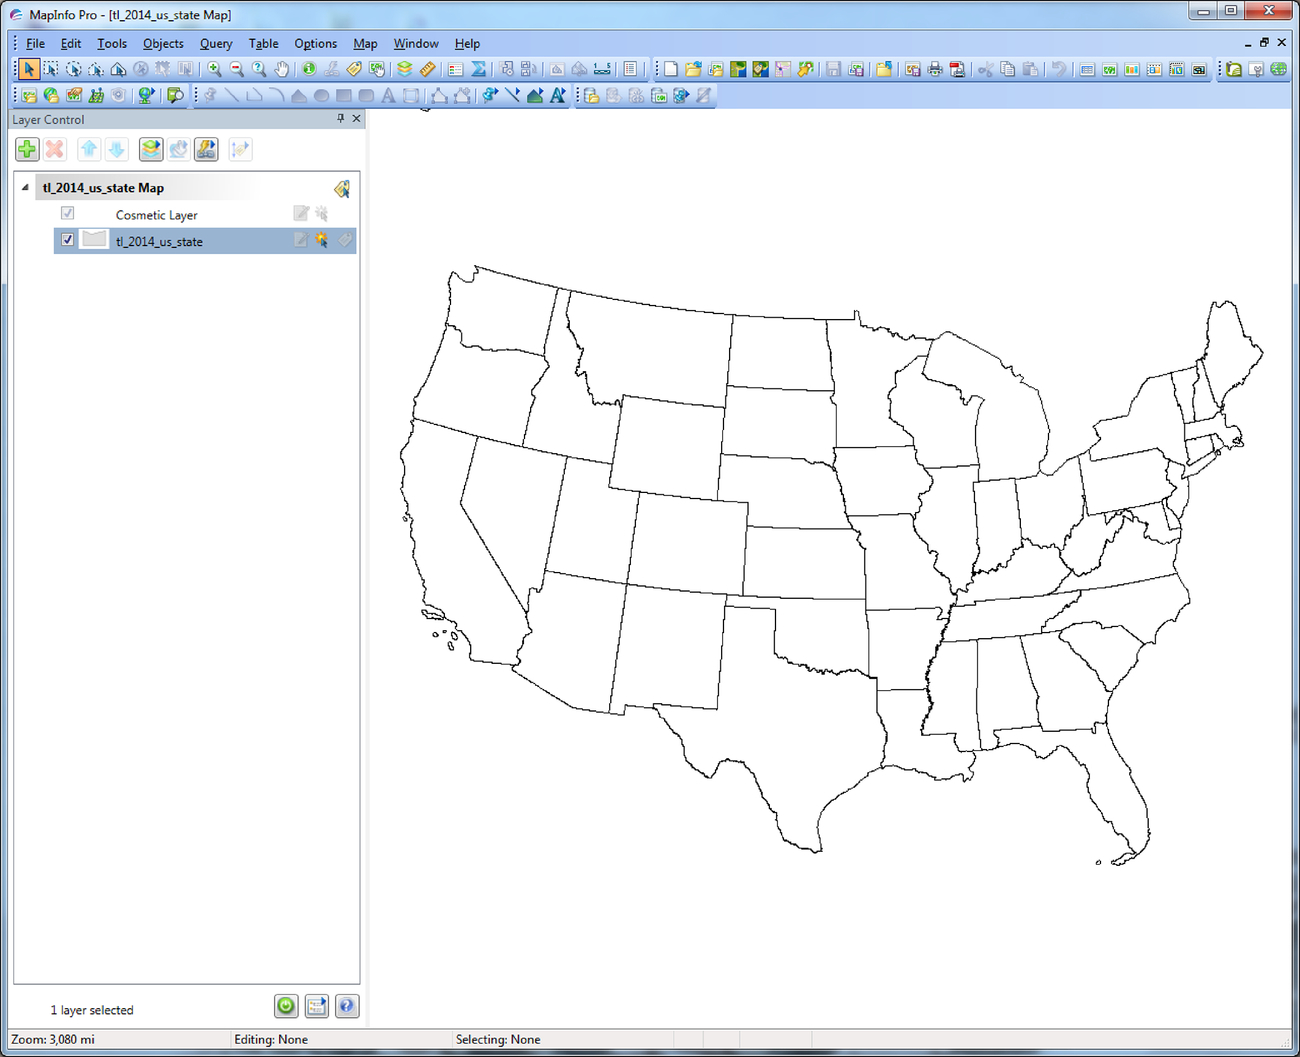
Open-source GIS software packages are often used as an alternative to ArcGIS. Since 2006, the nonprofit Open Source Geospatial Foundation has existed to support open-source developers creating geospatial free and open-source software (FOSS) (OSGeo, 2015). They have helped to support several widely used desktop platforms, in addition to server and client web mapping packages. Open-source software has some distinct advantages over Esri's ArcGIS: it is free, often available not just on Windows, but also on Mac and Linux platforms, and the code can be freely and legally modified to create custom analyses or tools. The major downsides are that they are often not quite as polished as commercial software, tend not to offer the same breadth of functionality, and may not have as much support available to end users. That being said, many open-source packages are quite impressive, and can be used as everyday GIS tools.
QGIS began life as Quantum GIS in 2002 led by developer Gary Sherman. As of 2016, it is a mature, powerful desktop package with an extensible design, meaning that it is easy to add plugins and connect to other toolsets. Since QGIS is open-source, a number of free tools exist to meet specific needs whether they be analysis or visualization related. A view of the QGIS environment can be seen in Fig. 7.7.
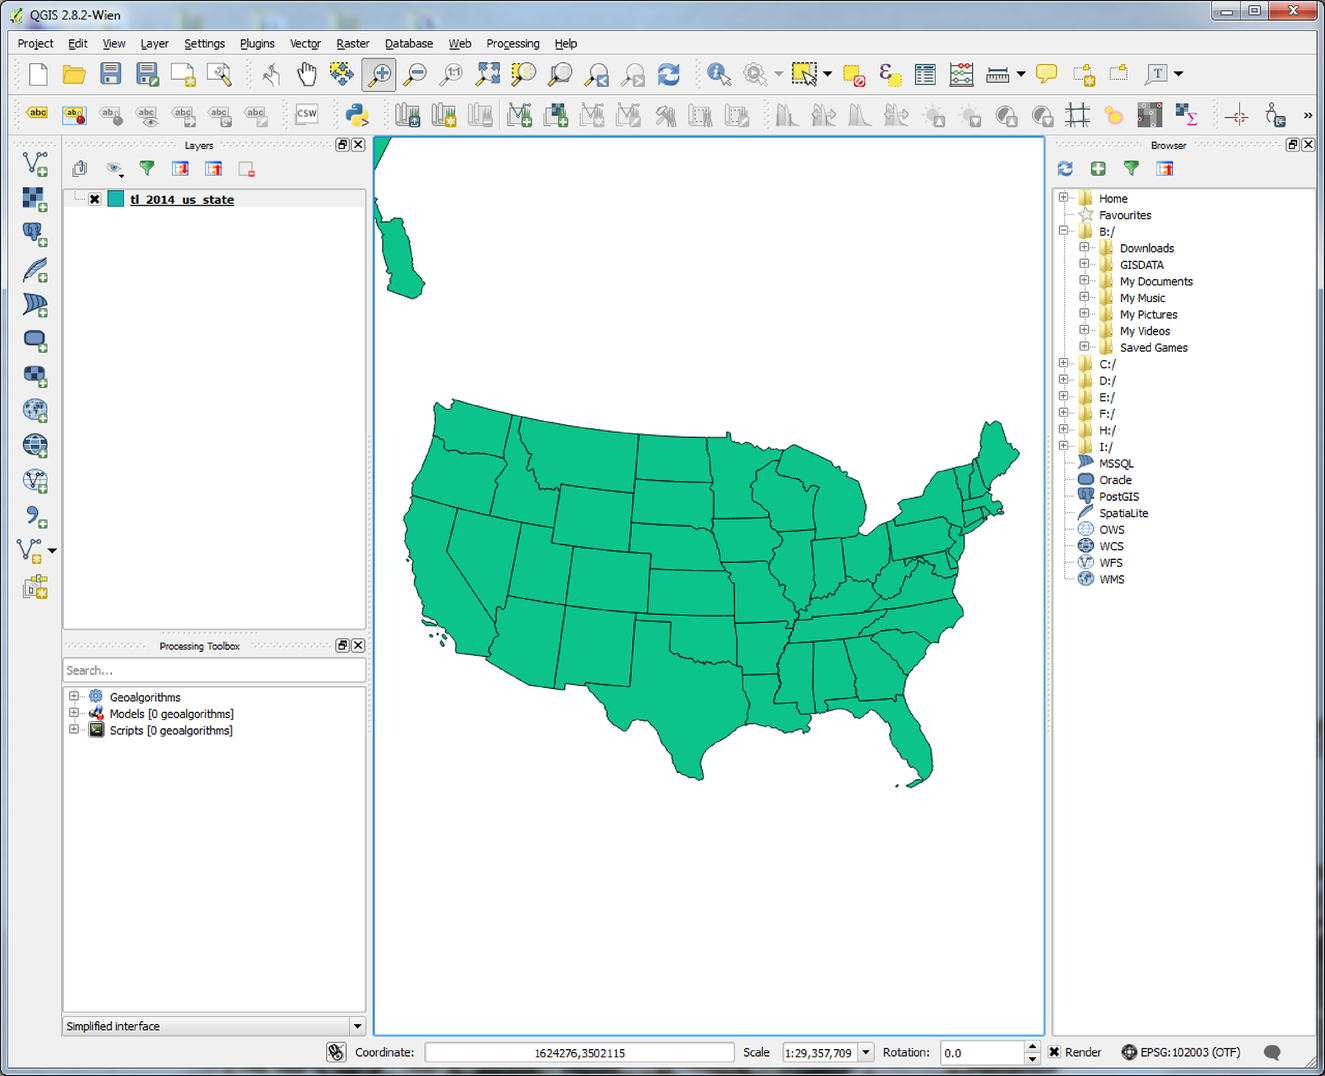
GRASS GIS is an older project, with its development beginning in 1982. As such, the interface is somewhat less friendly to today's typical computer user, see Fig. 7.8, and it still uses a command-line functionality for some operations. The software can be used on its own, or it may act as a backend for packages like QGIS or the statistical package R. Primary development was overseen by the U.S. Army Corps of Engineers' Construction Engineering Research Laboratory, although since then many different partners have assisted in development, including other federal agencies, private companies, and universities (GRASS Development Team, 2014). Due to the long relationship with academic institutions, GRASS has frequently been used in research contexts.
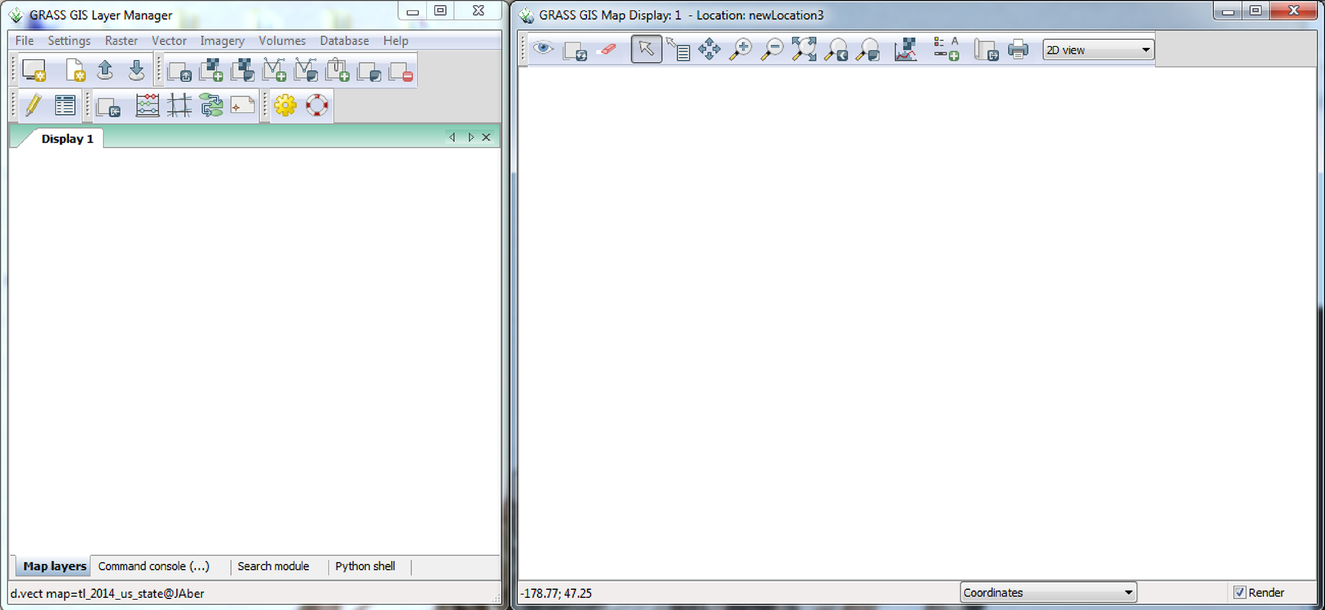
While many mature desktop GIS applications exist in the open-source community, there are fewer options for free GIS software used for other purposes (Steiniger & Hunter, 2012). This makes sense, as the desktop is the primary location where GIS work occurs. A couple of other notable open-source GIS packages include PostGIS, which provides spatial components to the PostgreSQL database software for online GIS, and GeoDa, which allows users to explore spatial datasets through different data visualizations, see Fig. 7.9. More open-source GIS software, including software libraries for development and web-mapping packages can be found through http://www.freegis.org, http://www.opensourcegis.org, and the Open Source Geospatial Foundation at http://www.osgeo.org (Steiniger & Hunter, 2012).
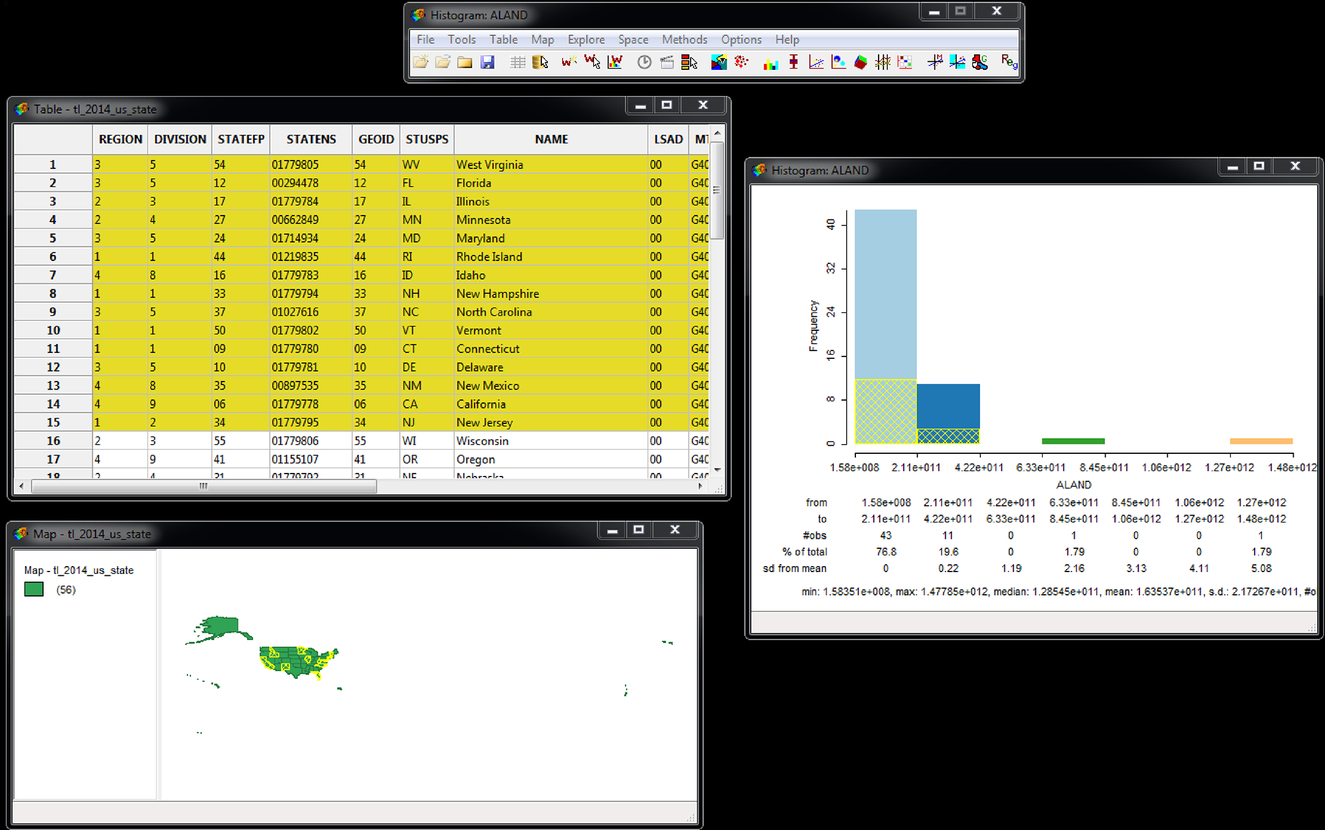
While there may not be as much open-source activity for remote sensing software as there is for GIS, there are several commercial remote sensing packages that are commonly used. ERDAS IMAGINE from Hexagon Geospatial is the largest of them, occupying a spot in the remote sensing world much like that of ArcGIS in the GIS world. The software also has a history similar to ArcGIS, beginning in 1979 with the desire to create a user-friendly system that could integrate Landsat and SPOT imagery with other sources of GIS data (Finlay, Brantley, & Skelton, 1984). Over the years the software evolved along with changing hardware and interface contexts. The first version, ERDAS 4, supported 8-bit Z80 processors and command-line functionality. Beginning in the mid-90s, IMAGINE has operated in a Windows PC environment (Beaty, 2009). Since the 2010 version, it has used a ribbon-style interface. Fig. 7.10 shows the main IMAGINE window displaying a Landsat 8 scene in false-color.
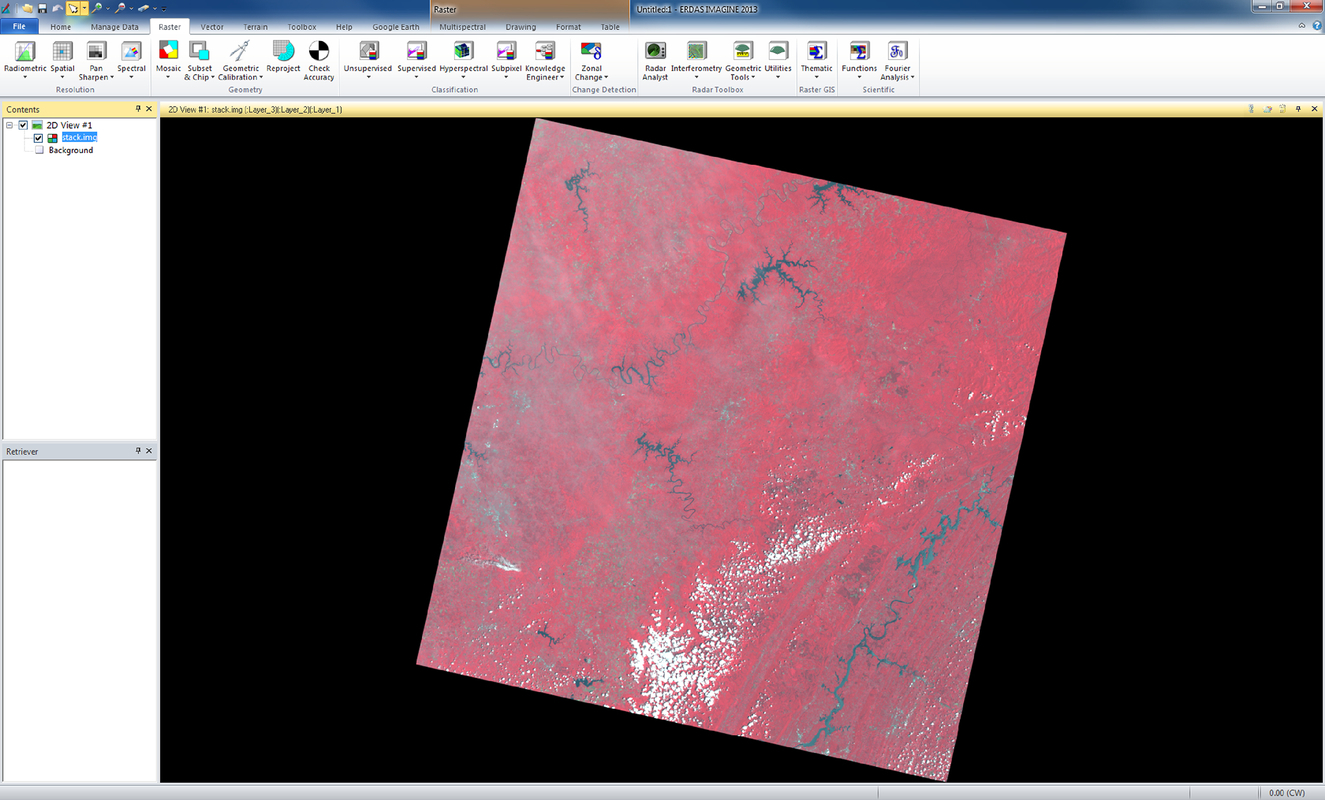
Exelis Visual Information Solutions' ENVI (ENvironment for Visualizing Images) is another commercial remote-sensing package. It evolved from the Interactive Data Language (IDL) originally created by David Stern in 1977 to work with data from the Mariner Mars 7 & 9 space probes (Exelis, 2015). The ENVI program as it is known today was first released in 1994 as a hyperspectral image-processing package. While it does not hold as large a market share as IMAGINE, ENVI is a complete remote-sensing package, and is popular in research environments. Fig. 7.11 shows the main program window displaying a Landsat 8 scene in false-color.
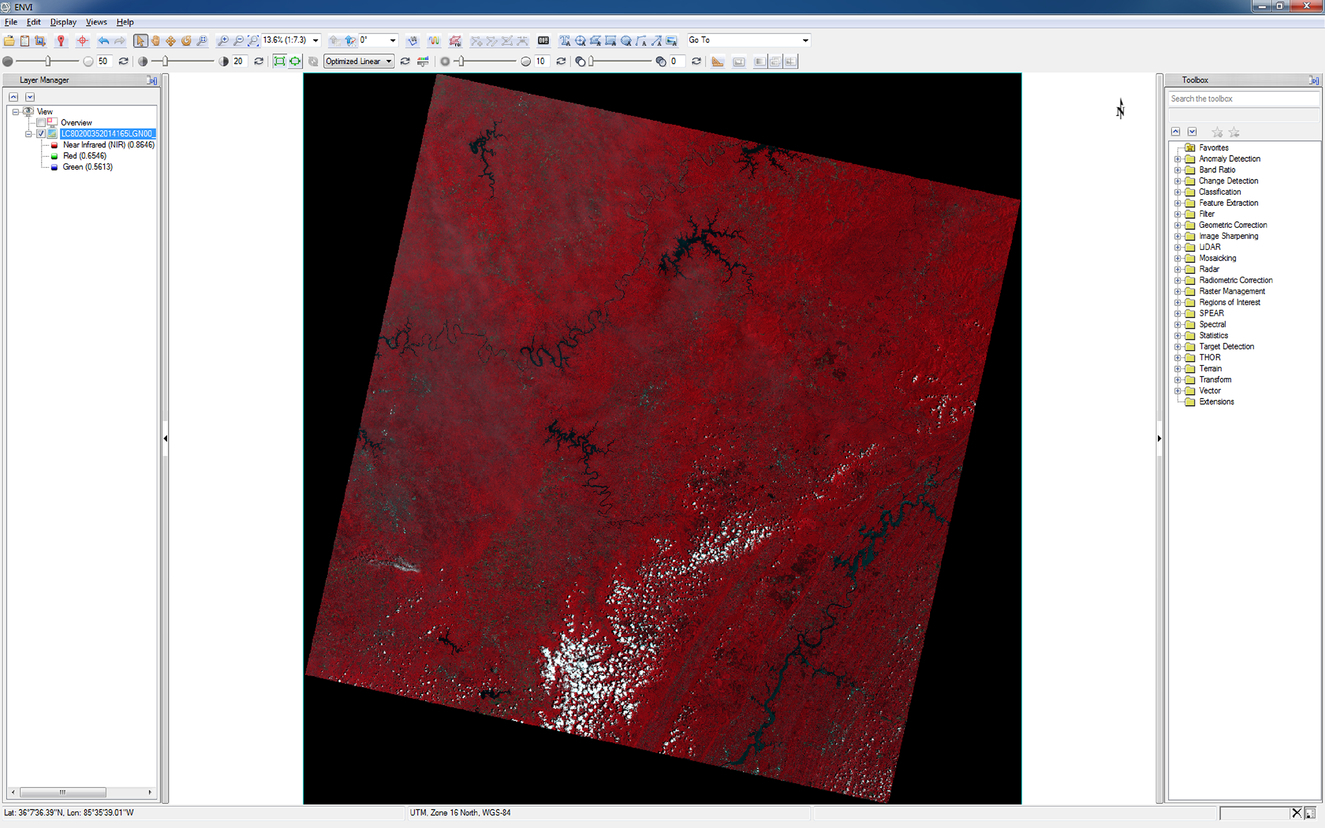
TerrSet is a commercial geospatial software package produced by Clark Labs. The software was originally created by J. Ronald Eastman in 1987 as a raster-based remote-sensing package, then known as IDRISI. The latest release integrates the IDRISI GIS Analysis and IDRISI Image Processing tools into a larger framework for geospatial modeling and analysis (Clark Labs, 2015a). Despite being a fully featured raster analysis package with vector capabilities, TerrSet's market share is miniscule when compared to IMAGINE and ENVI. However, due to low cost and an easy-to-use interface, it has been popular in educational environments. Fig. 7.12 shows the main TerrSet program displaying a Landsat scene.
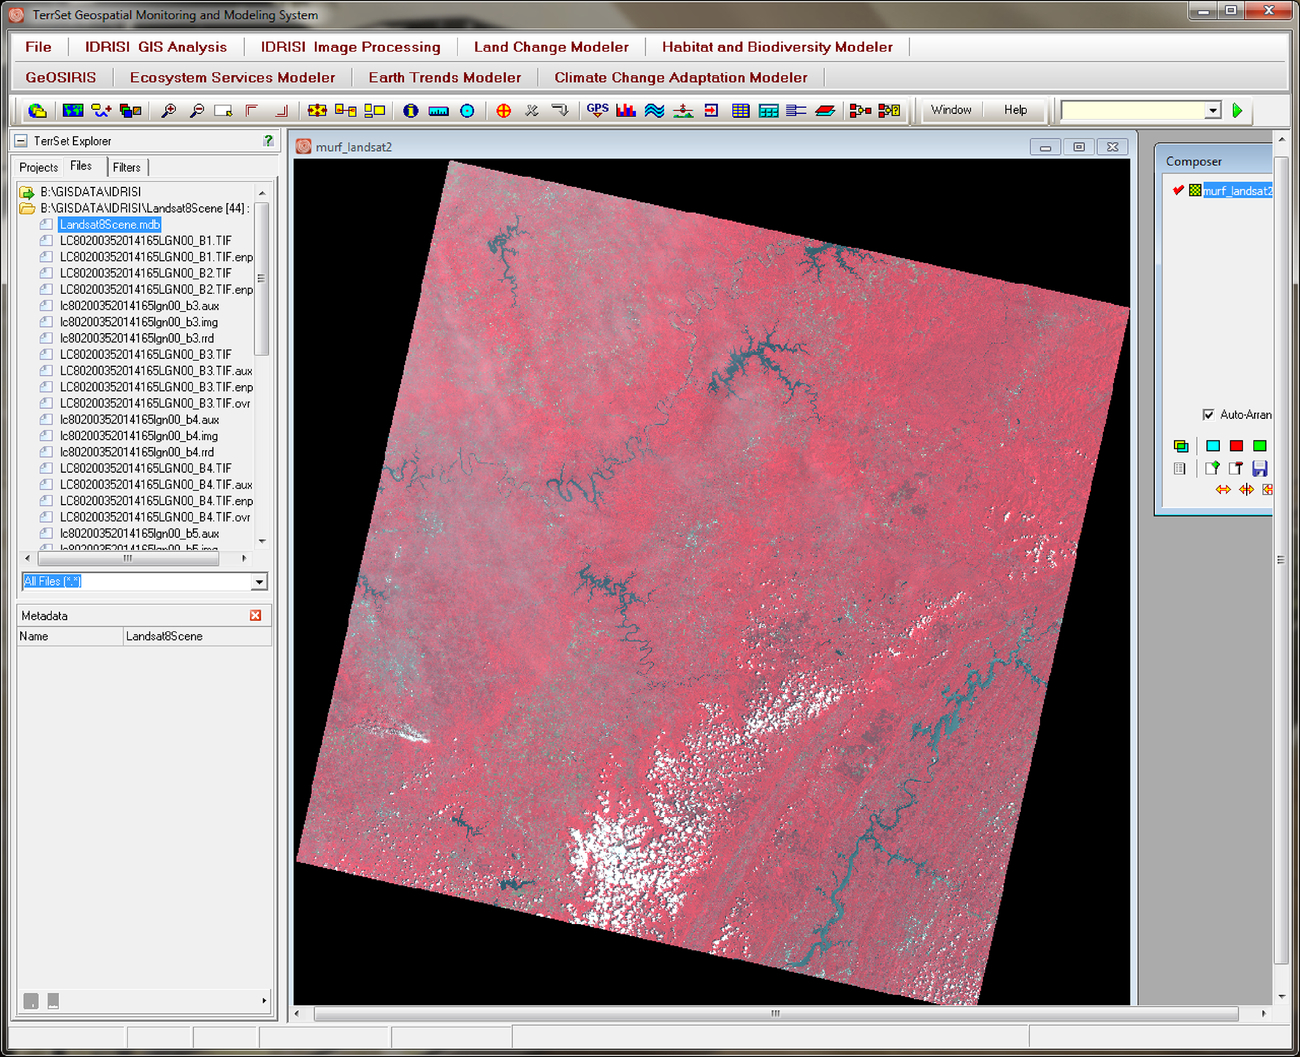
The world of mobile GIS is changing quickly. This area may have lagged a bit when compared to desktop and online GIS, but has been growing rapidly due to the explosion of GPS-enabled mobile devices in the market. Much of the use of mobile devices revolves around viewing maps and the collection of data in the field rather than analysis, largely thanks to GPS integration in most mobile devices. Anyone with a GPS-enabled mobile device may collect spatial data, and many apps exist on all the major platforms to accomplish this. Unsurprisingly, Esri is a large player in this area with their ArcPad program. ArcPad only runs on the Windows Mobile platform versions 5 through 6.5 which are lacking by today's standards, and Windows 8 tablets. However, a great number of devices today use either Apple's iOS or Google's Android platforms and cannot run ArcPad. Esri used to offer a single ArcGIS app for these platforms, but it has been retired from the iOS App Store and Android Google Play store as of August 2015. Replacing it are multiple apps designed to focus on specific functionality rather than one single app covering everything. Explorer for ArcGIS is designed to view cloud-shared map content; crowdsourcing functionality can be handled by a few different apps including Crowdsource Reporter; and field data collection and editing are handled primarily by Collector for ArcGIS, seen in Fig. 7.13.
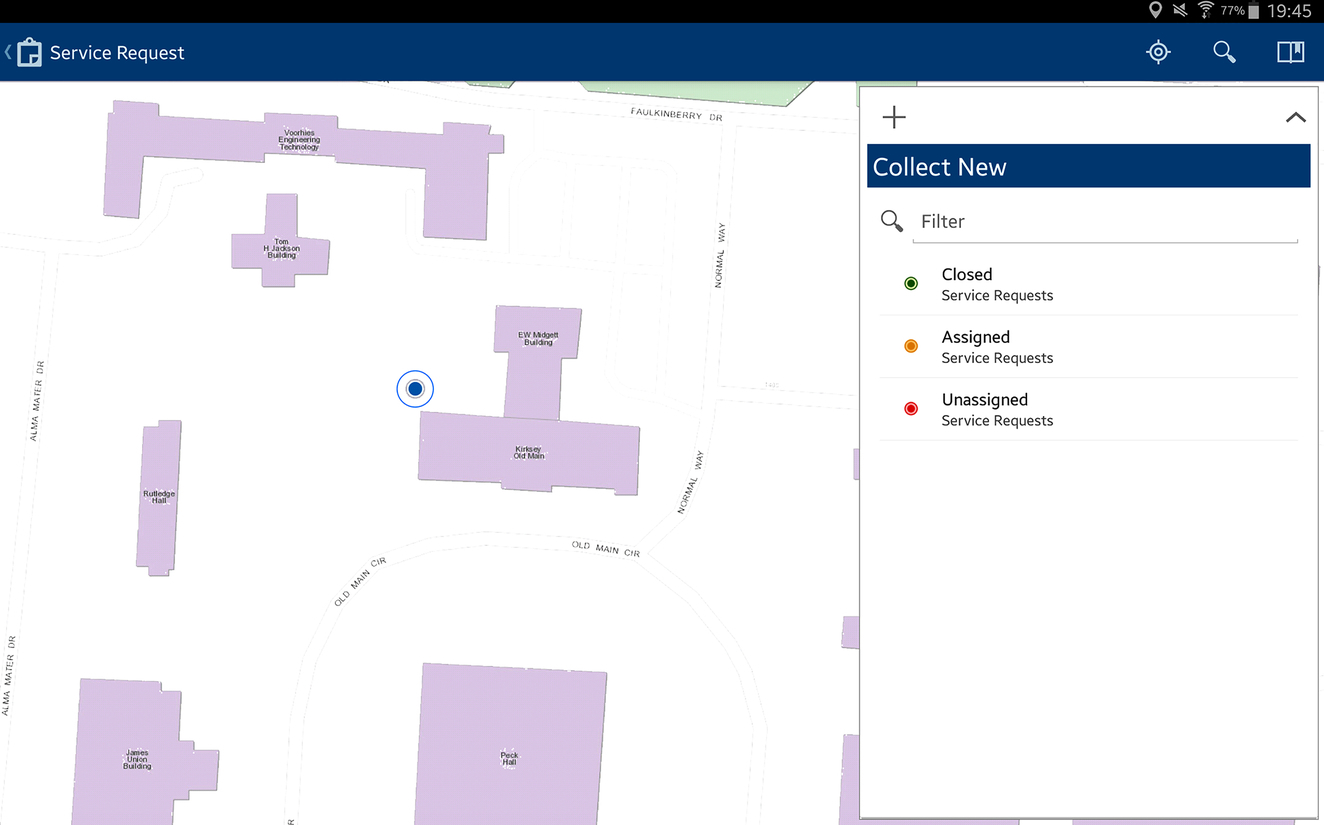
There are other applications for Android and iOS that offer GIS functionality on mobile platforms beyond Esri's offerings. Although it is still early in development, the QGIS project's QField is freely available for Android devices and can open and edit QGIS project files. On the iOS side, GIS Kit and GIS Pro are commercial apps that have field data collection capabilities. Unfortunately, they come with hefty price tags of $99.99 for Kit and $299.99 for Pro.
There are far too many other apps that offer some amount of GIS functionality to discuss here, but keep in mind that many are not full GIS solutions. No mobile app is going to replace the capabilities of a desktop GIS program entirely. In fact, quite a few apps that advertise themselves as GIS offer no more than the ability to stream preexisting map content via Google Maps, ArcGIS Online maps, or another map service, locate the user via GPS, and make some simple measurements of distance and area. When looking for mobile solutions be aware of these limitations: read the feature list carefully and try any available demos before committing to a paid mobile app. That being said, the speed with which the overall mobile space has grown and changed in the past few years means that it is likely that mobile GIS apps will continue to improve in the future, with more options and greater capabilities found in both commercial and FOSS packages.
The remainder of this chapter deals with sources for maps and data and how to use them. Almost everything is now accessed through a web interface, which makes finding and downloading data and maps a largely straightforward process. Some sources are broad in terms of the content they provide, while others are explicitly designed to serve the needs of specialized topics. One thing that should become apparent is the volume of information provided by U.S. federal agencies. The U.S. federal government is one of the largest and best sources of information about the natural and cultural world; while some of those data are global in scope, their focus tends to be on the United States. Many other nations provide data for users beyond the United States, although there may be some barriers to the data in these cases such as language and rights issues when browsing the European Union's INSPIRE Geoportal.
For cultural and demographic information about the United States, the U.S. Census Bureau is the largest and best source of information. Mandated in the Constitution in Article I, section II, the decennial census records the population of the nation, and over the past 22 censuses a great number of other demographic factors have been added to the count. Data from the 1790 through 1940 censuses are available through the U.S. National Archives and Records Administration; 1950 to present data are hosted by the U.S. Census Bureau.
The Census Bureau also runs continuous surveys in addition to the decennial census, including the American Community Survey (ACS), the American Housing Survey, the Current Population Survey, and many others. These provide data updates between the decennial censuses and address additional facets of American life. For example, the ACS provides a constantly updated source of information about the U.S. population used by policy makers, planners, members of the business community, and many other organizations to direct federal funds and prepare for changing demographics (U.S. Census Bureau, 2015b).
All of the post-1940 information is available via the Census Bureau's website, specifically using the American FactFinder. The FactFinder interface allows users to specify locations and programs from which to pull data, making it possible to find specific tables representing places, the term used to describe cities or towns, counties, states, regions, or the entire nation for individual or multiple datasets such as the decennial census, ACS, etc. However, this interface may be daunting and confusing for new users to access.
For the newest data releases, one website that can help users more easily browse census data is CensusReporter.org. The site is not officially associated with the Census Bureau, but rather it is a Knight News Challenge-funded project that acts as a third party front-end to make decennial and ACS data more accessible (Census Reporter, n.d.a). Not only does the site allow users to easily search for data by location or by topic, it also provides interactive charts and maps that may be embedded in webpages, as well as GIS versions of the data. Any available census table can be downloaded through Census Reporter in the tabular formats CSV or Excel, or as spatial data formats GeoJSON, Google Keyhole Markup Language (KML), or Esri Shapefile.
The interface is straightforward, and the options for downloading or embedding the data online are impressive and easy to use. Fig. 7.14 shows an example of the visual profile for a location, in this case, the city of Murfreesboro, Tennessee. The only downside is that while the data comes straight from the Census Bureau, it only shows the most recent information, from either ACS estimates or the decennial census. Accessing older data can still be done through the American FactFinder, or for pre-1940 information, the Historical Census Browser via the University of Virginia Geospatial and Statistical Data Center or the National Historical Geographic Information System hosted by the Minnesota Population Center at the University of Minnesota (Regents of the University of Minnesota, 2010; University of Virginia, 2004). The 1940 decennial census is available online through the 1940 Census website hosted by the U.S. National Archives and Records Administration (2015).
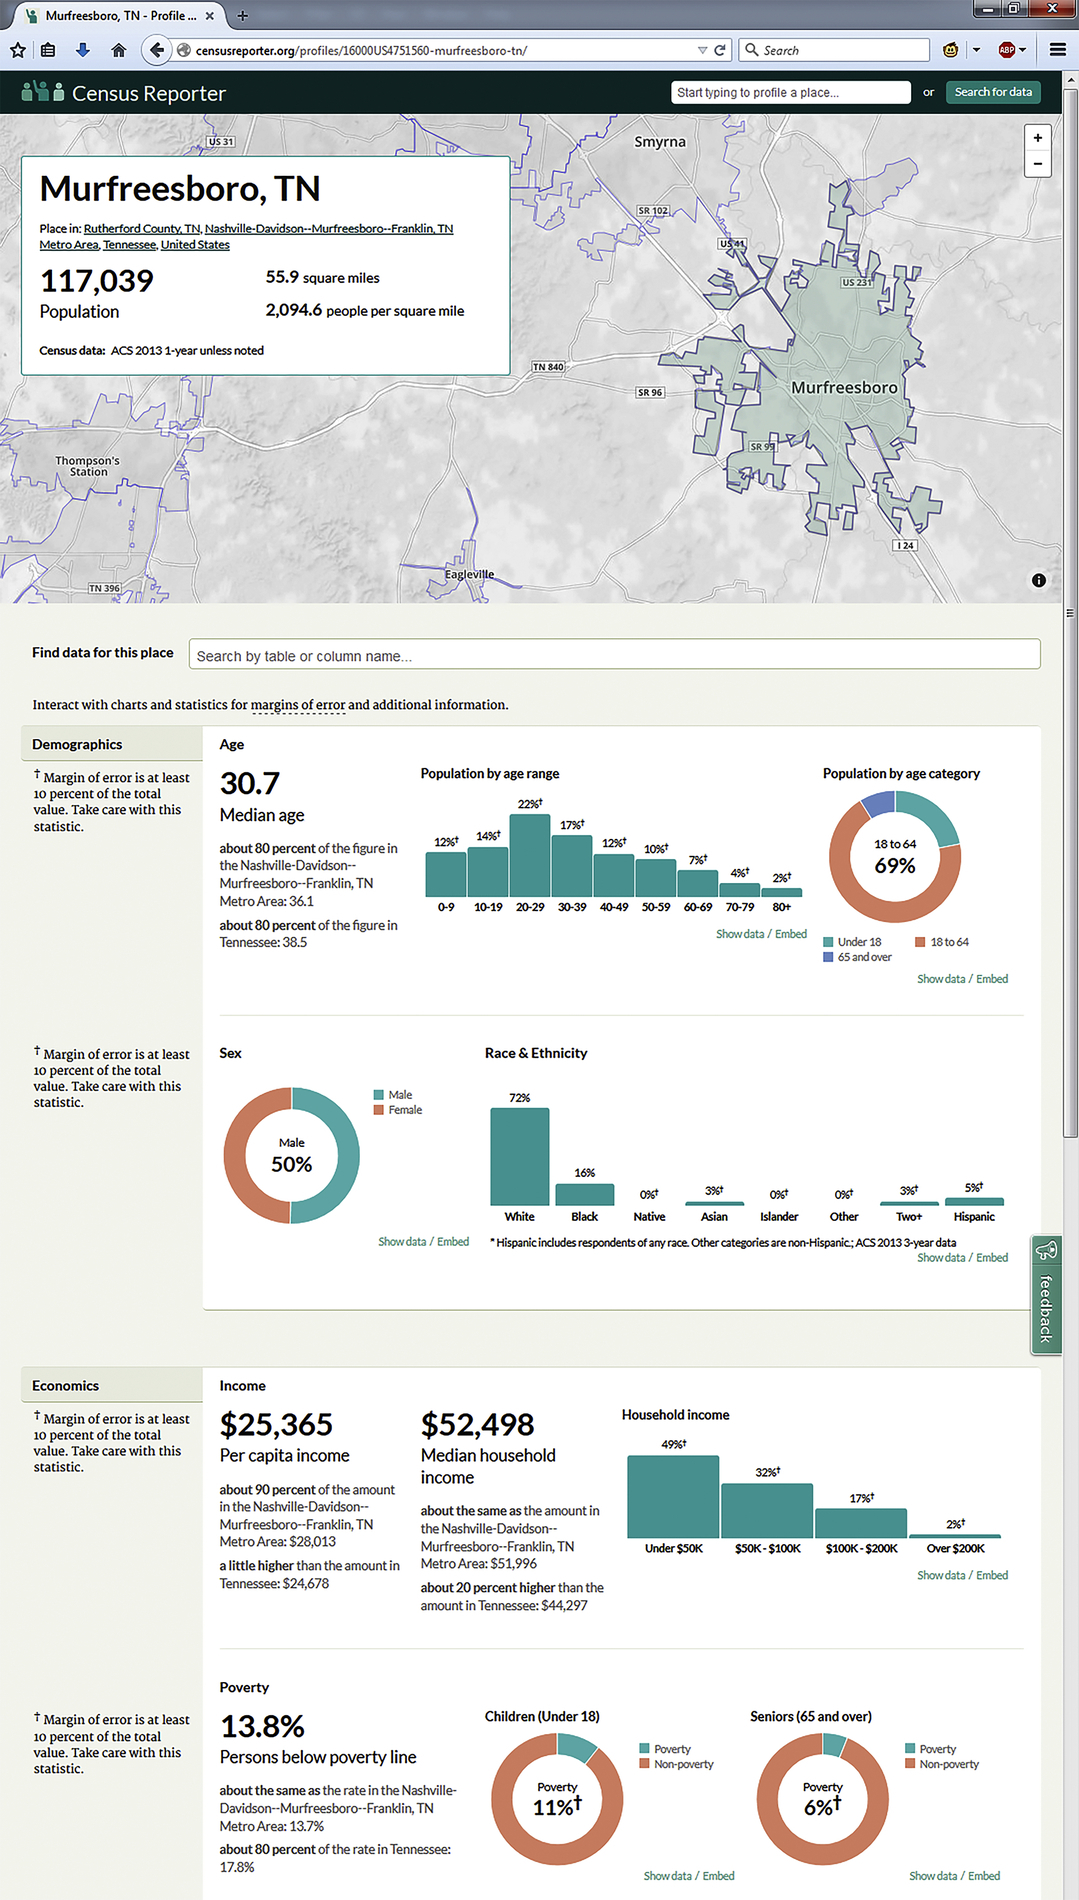
With the Census Bureau's need for storage and tabulation of data, the bureau has been at the cutting edge of computing and spatial methods since the early days. The 1890 census utilized a mechanical system invented by Herman Hollerith that relied on punch cards for data entry and storage (Pretzold, 2000). Hollerith's machine allowed the volume of information collected to be doubled while reducing processing time by about a third compared to the 1880 census. The company Hollerith set up to produce and sell the machine was known as the Tabulating Machine Company and still exists to this day, although it has gone through a few changes since, not least of which includes a 1924 name change to International Business Machines, or IBM.
With that legacy in mind, the Census Bureau has been a heavy user and driver of GIS technology, and some of the major products they provide are GIS datasets. While the bureau hosts multiple types and sources of data, the Topologically Integrated Geographic Encoding and Referencing, or TIGER, program is one of the most prominent. It began in the 1970s and was officially first used in the 1990 census as a way of modernizing data collection and storage (U.S. Census Bureau, 2015a). TIGER files provide a backbone to the modern census as well as countless GIS professionals by officially defining geographic areas and providing a spatial component to census data. This allows census data to be mapped, visualized, and analyzed using modern GIS techniques. These data are updated regularly and much like tabular census data, are used by a variety of agencies and individuals to help monitor and analyze trends in the United States. Datasets can be downloaded in multiple formats, including Esri shapefiles and geodatabases, Google KML files, and via an online GIS server for streaming data to GIS software. An example of TIGER data is the U.S. states shapefile shown in Figs. 7.5–7.7.
CIESIN is a research unit within the Columbia University Earth Institute focused on providing data on a broad variety of interdisciplinary topics (The Trustees of Columbia University, 1997–2016a). CIESIN's homepage can be seen in Fig. 7.15. The Information Network is the hub of many international research collaborations including projects like hosting the socio-economic data and scenarios used for Intergovernmental Panel on Climate Change (IPCC) assessments and the Africa Soil Information Service, which works with African scientists to create detailed digital soil data for sub-Saharan Africa. The CIESIN website is also a portal to data available on a large number of topics, including agriculture, biodiversity and ecosystems, climate change, data preservation and access, economic activity, environmental assessment and modeling, environmental health, environmental treaties, indicators, land use/land-cover change, natural hazards and vulnerability, population, poverty, and remote sensing for human dimensions research (The Trustees of Columbia University, 1997–2016b). The Information Network also places an emphasis on education and outreach to decision makers, the educational sector, and the general public. It has resources for GIS training and a number of undergraduate and graduate courses that are regularly offered at Columbia University in New York City on various Earth Science topics.
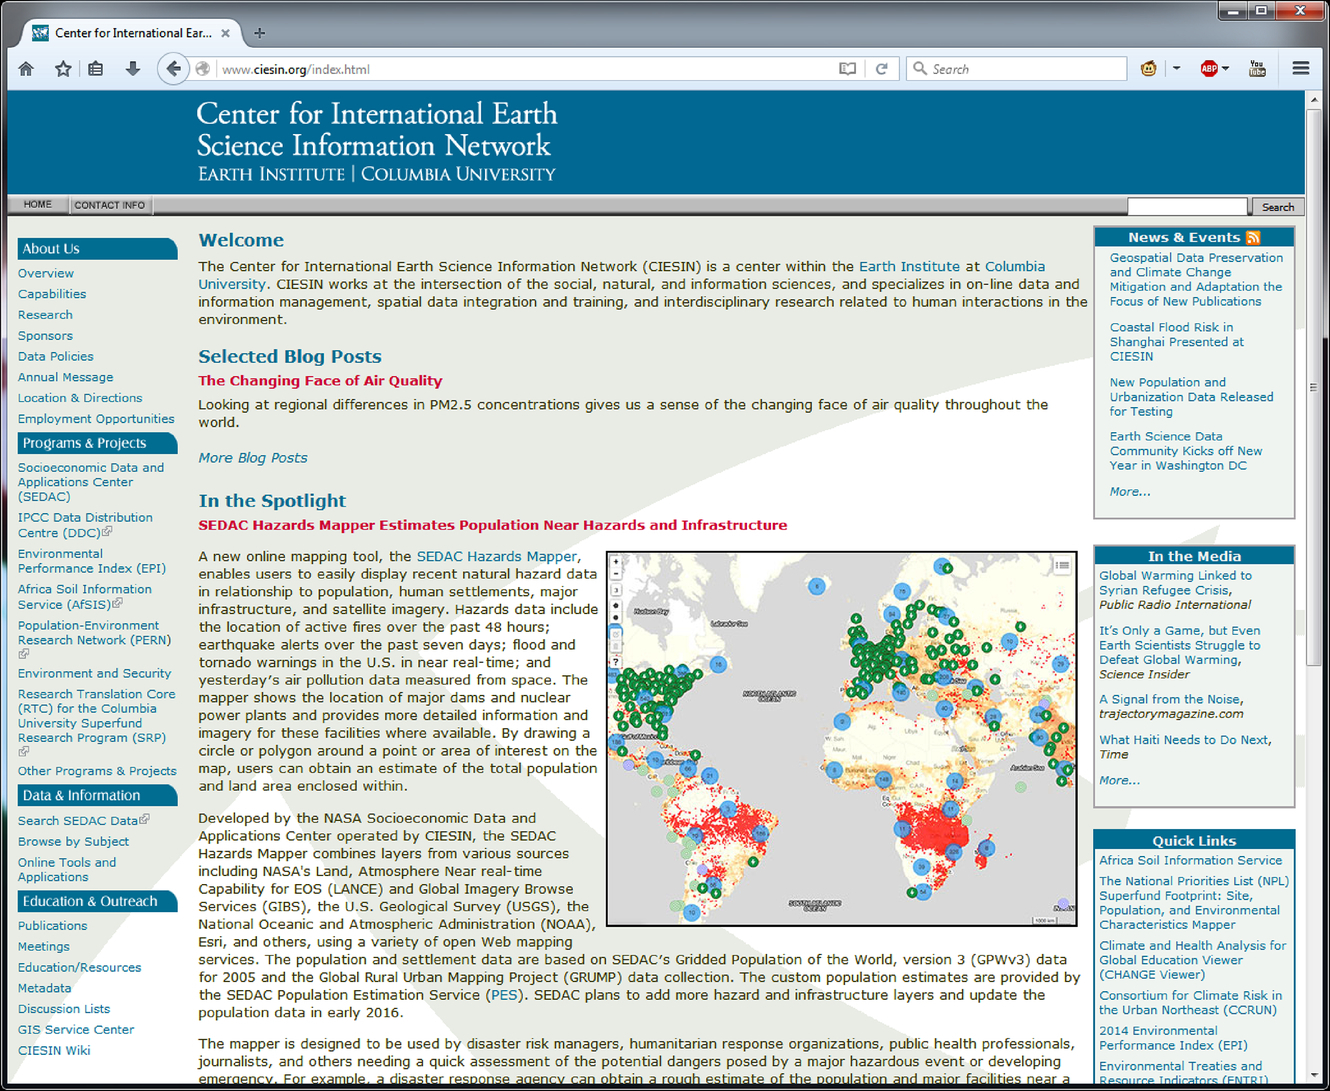
Realizing the need for intelligence about the world during World War II ultimately led to the creation of the Central Intelligence Agency (CIA) in 1947 (Central Intelligence Agency, n.d.a). The World Factbook is a product of the CIA, including “information on the history, people, government, economy, energy, geography, communications, transportation, military, and transnational issues for 267 world entities.” (Central Intelligence Agency, n.d.b). This publication was first released in 1962 as a classified document, and has been published in an unclassified format since 1971. Today it is published online and is updated weekly as new information is gathered, see Fig. 7.16. It may also be purchased in an annual hardcopy edition via the Government Printing Office. It is intended to be used by U.S. policymakers, but as a federal product is freely accessible for anyone to utilize. The CIA also publishes the Chiefs of State and Cabinet Members of Foreign Governments on a weekly basis.
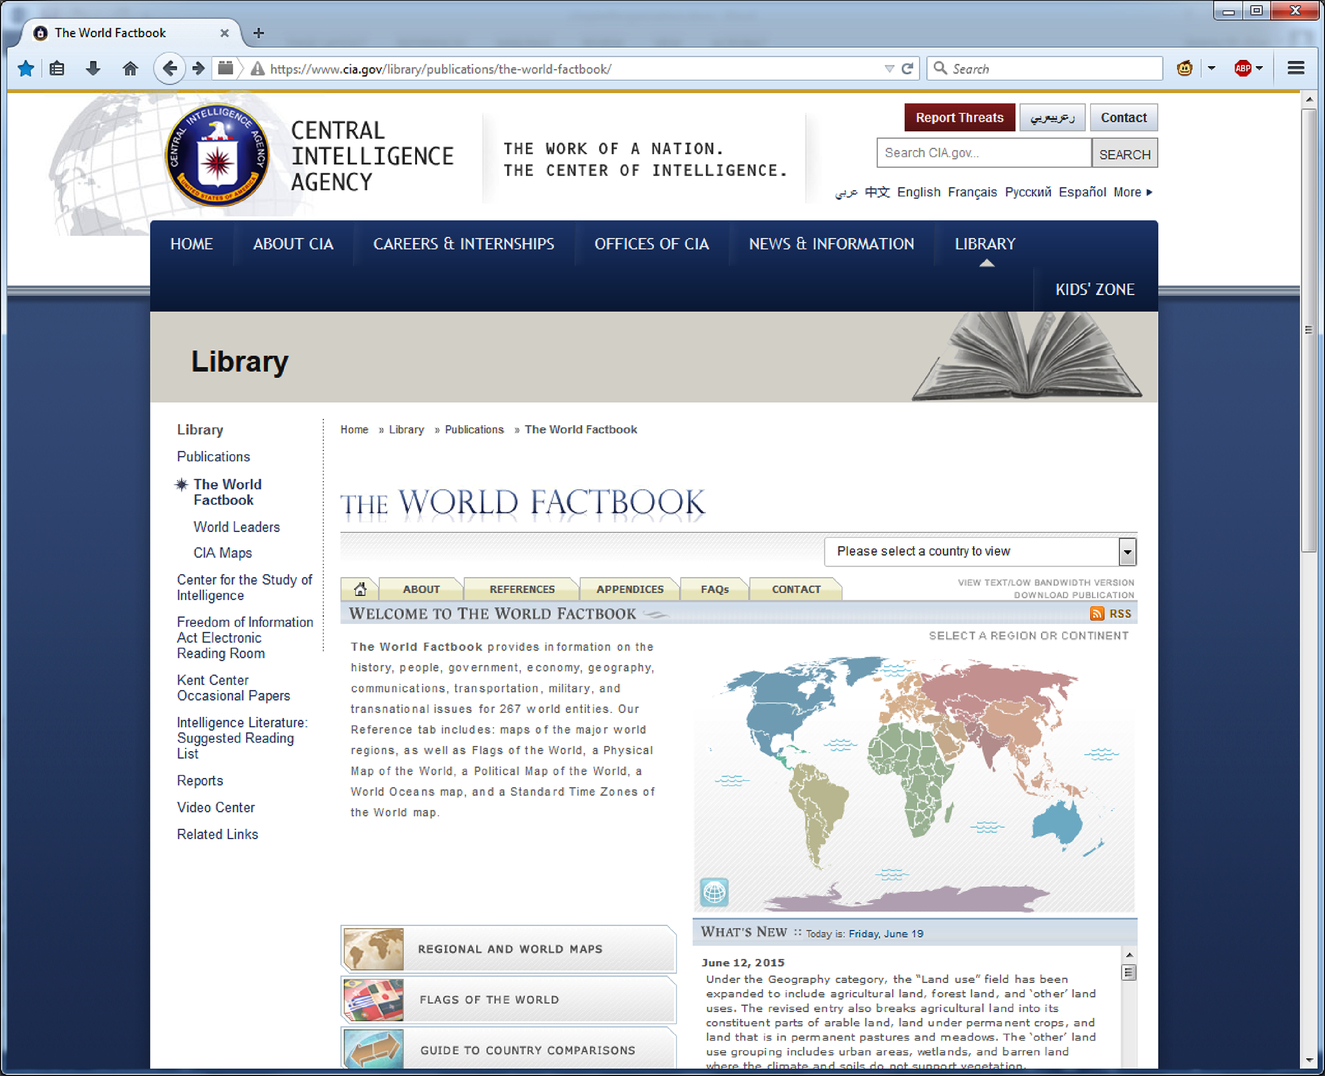
In addition to these sources, the CIA digitally distributes maps showing world physiographic features and political boundaries. Some countries are available as stand-alone maps showing administrative boundaries, physiography, and transportation, but not every world country gets this treatment. An example of one of these maps can be seen in Fig. 7.17. Regional and world maps are also available showing political and physical features. The CIA previously sold paper versions of these maps, but publishing of paper maps has ceased and they are now available in digital form only.
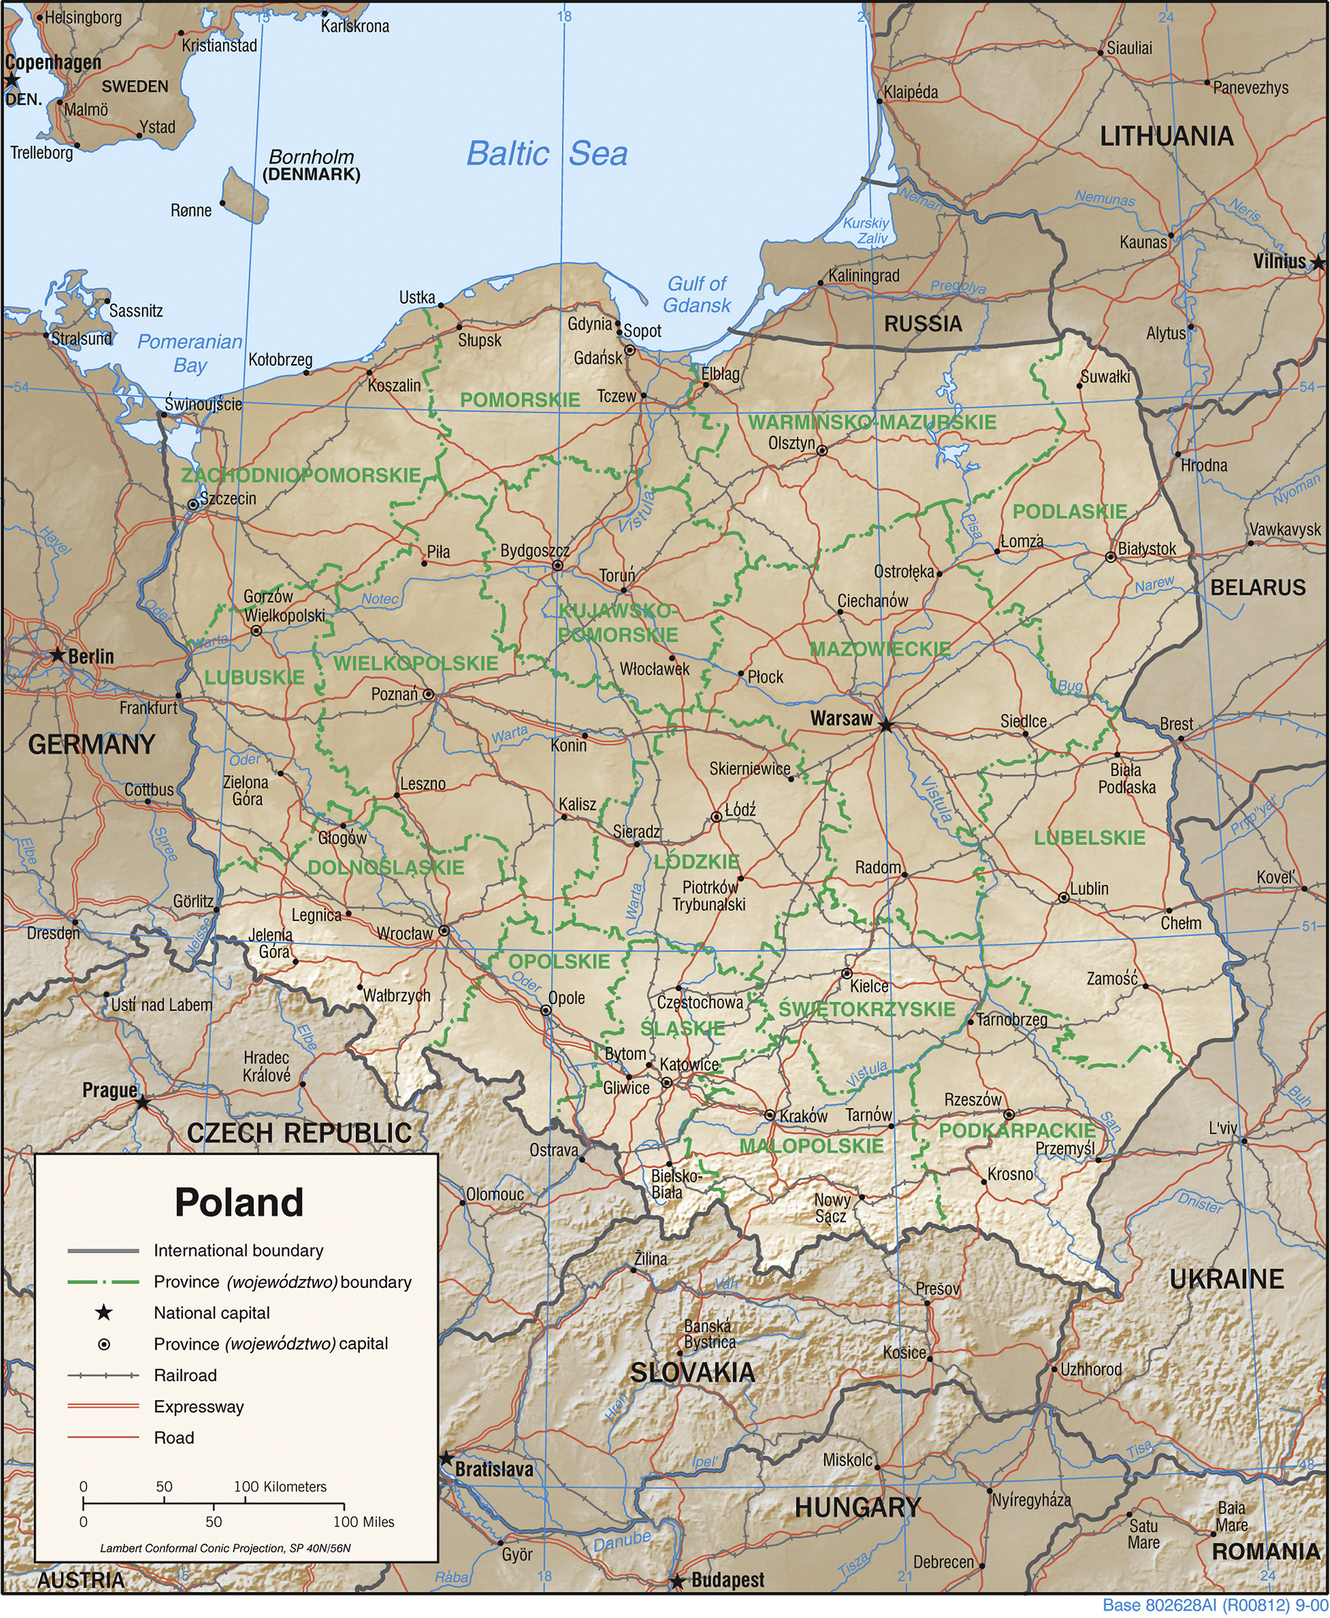
The European Environment Agency, consisting of 33 member states, is tasked with providing environmental information to be used by policy makers and the general public in the European Union, as well as coordination of the European environment information and observation network (European Environment Agency, 2015). The EEA's website hosts a variety of products on different environmental topics, including maps and data. Reports, articles, and video content are available on topics such as air pollution, soil, agriculture, and others. Published content is generally written at a level that is accessible to a lay audience. Geospatial data are also available to download for some topics and are provided in a few different file formats. In other cases, data are available in a nonspatial tabular form. Premade maps can also be found on the website to view or download.
The Infrastructure for Spatial Information in Europe is an ambitious effort dictated by the INSPIRE Directive 2007/2/EC put in place by the Council of the European Union and the European Parliament (INSPIRE, n.d.b). It is designed to create a standardized infrastructure for the geospatial data resources of the 28 participating EU member states. This helps to address inconsistencies in spatial data collection, fill gaps in spatial data documentation, address compatibility issues between datasets and local spatial data infrastructures, and remove barriers of all kinds that may be preventing or delaying the sharing of geospatial data (Craglia, 2010). Not surprisingly, this is an ongoing challenge since variation exists in geospatial data and available data services from one EU member state to the next. Beyond that, practical challenges are also presented by factors such as language barriers and funding disparities. The INSPIRE Directive lays out 34 themes including administrative boundaries, geology, hydrography, land use, soil, and others. These themes were chosen to cover the information required for environmental applications (INSPIRE, n.d.a). Ultimately, INSPIRE will host data related to all of these themes for each member state in formats that are interoperable, providing scientists and policy makers access to information that is not truncated by national borders. Given the relatively small physical size of many member states, this will provide a much more holistic perspective on some of the environmental challenges the EU faces.
For those seeking geospatial data, the INSPIRE Geoportal is an important resource. The Discovery/Viewer tool allows users to search for data based on thematic content or location via an interactive map interface, as seen in Fig. 7.18. Individual search results can be expanded to show the metadata and formats available for download, and the footprint of the data layer is simultaneously displayed on the map viewer. For data that are stored in a language foreign to the user, an embedded Microsoft Translator is available to assist. Unfortunately, like most automated translators this solution is not perfect, and the language may be confusing. Technical terms in particular may cause problems and remain untranslated. Some layers that are returned in a search may also have usage restrictions, depending on the country of origin and the nature of the data represented. That being said, this is still a valuable resource for searching data across national and language barriers within Europe.
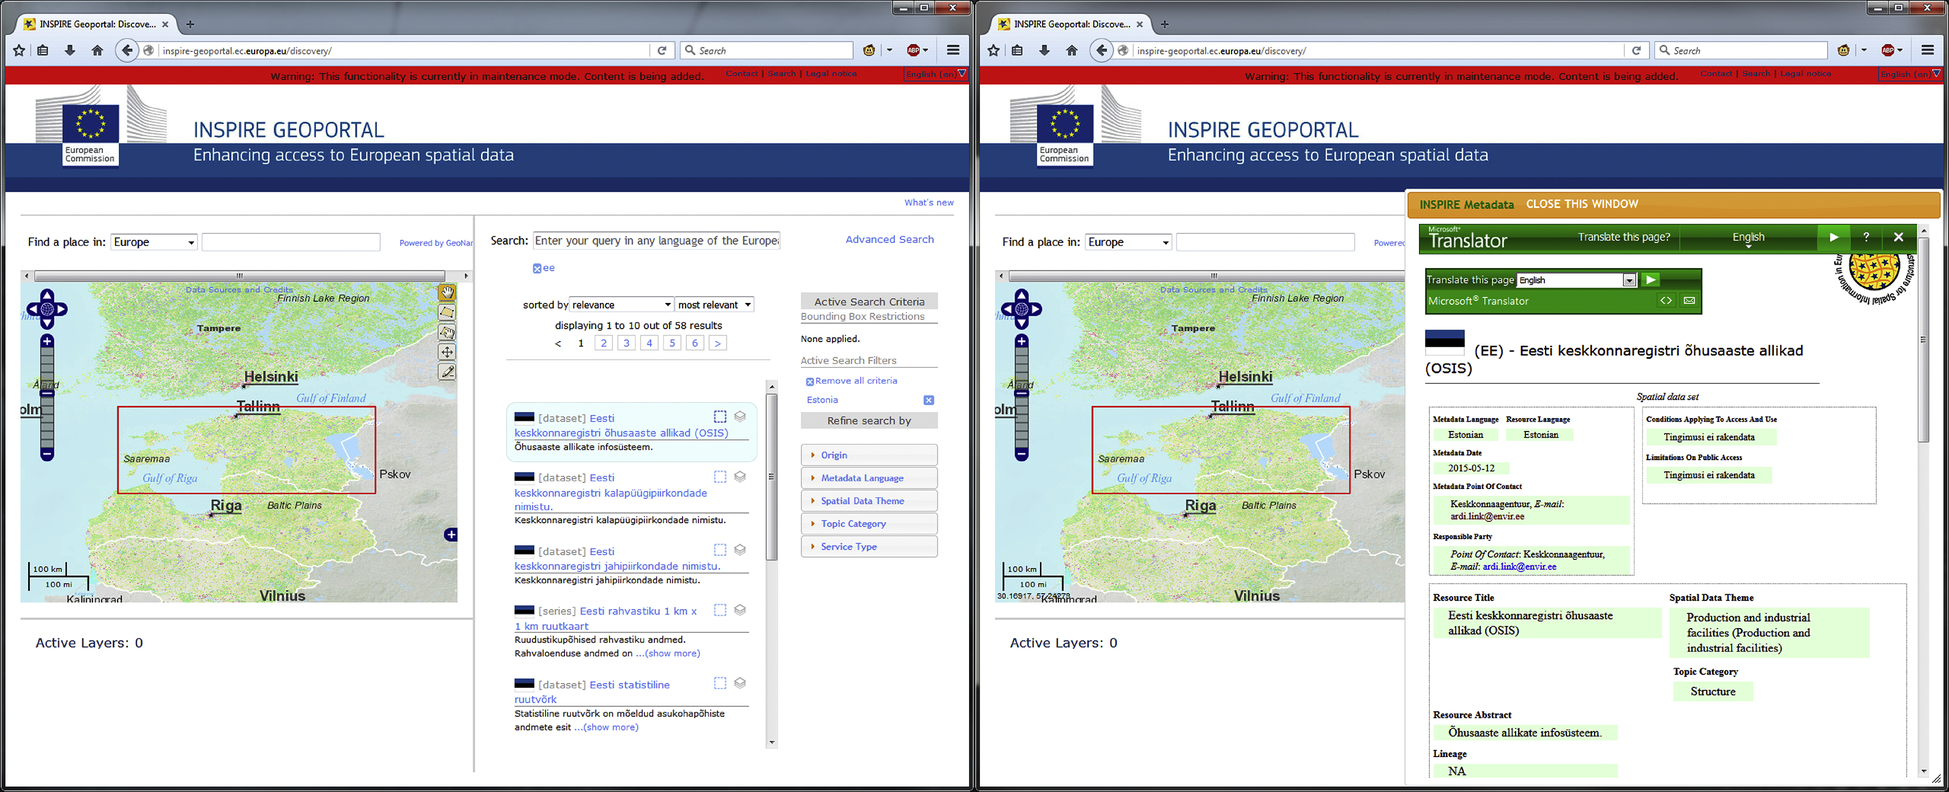
The INSPIRE Geoportal also provides metadata tools that help users meet the INSPIRE standards. A validator exists that will scan existing metadata and report back any omissions or mistakes in the metadata. An editor also exists that allows users to input information and generate metadata that is up to the required standards.
The Gateway to Astronaut Photography of Earth website collects all of NASA's manned photos taken from space, beginning in 1961 with Mercury 3, the first manned mission (Stefanov, n.d.). These primarily focus on photographs of the Earth's surface, but other astronomical features and images of astronauts are included in the collection as well. The collection is distinct from the imagery generated by NASA's satellites, probes, and rovers; photos here are all taken by astronauts in space rather than unmanned or remotely controlled platforms. They can be easily searched using a few different methods, including the ability to use a Google Maps-based interface to find photos of specific areas of interest (AOI) on the surface. Fig. 7.19 shows an example of a photo housed in this collection.
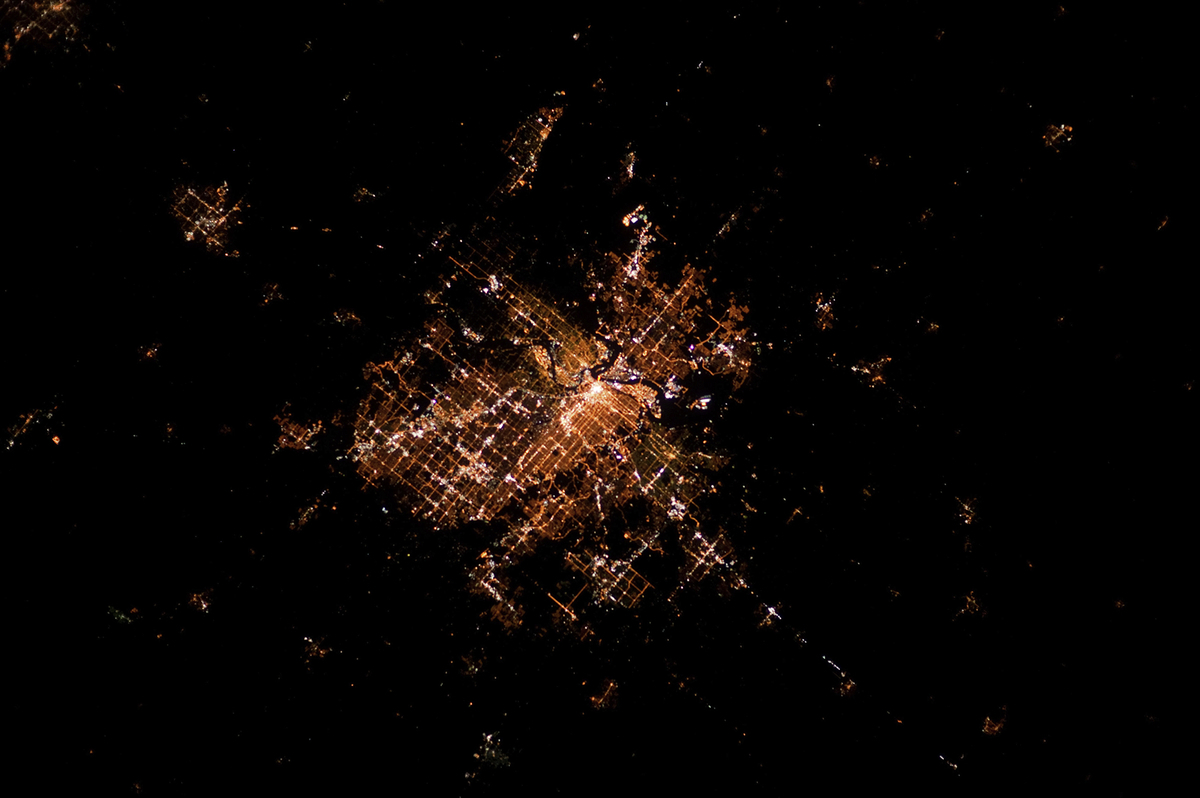
Gazetteers record the names and some demographic or contextual information about places. They come in different styles, with some including not much more than location and place names, and others having longer, encyclopedia-style descriptions of the locations recorded. Some gazetteers will have an accompanying map series, and list the specific page and location on the map where the place can be found. Many library collections have physical copies of gazetteers with local, regional, and global scopes, some quite old, others more recent in their publication. Governments often use gazetteers as a way of recording and standardizing place names in an official capacity. For example, the U.S. Census Bureau makes a yearly updated digital gazetteer available as a record of officially recognized places and names (U.S. Census Bureau, 2015c).
Online, a large number of gazetteers are accessible as well, and a quick search will uncover dozens that are available for browsing for information. Some of the larger ones include the aforementioned U.S. Census Bureau Gazetteer Files, the U.S. Board on Geographic Names Information System (GNIS), and the National Geospatial-Intelligence Agency's GEOnet Names Server (National Geospatial-Intelligence Agency, 2016; U.S. Census Bureau, 2015c; U.S. Geological Survey, 2015e). Naturally, other countries also host gazetteer information online as well, such as the Geographic Names Board of Canada's online Geographical Names Search (Natural Resources Canada, 2014). While these represent current names, historic gazetteers can also be found online. The American Association of Geographers hosts one list of online historic gazetteers on their website (American Association of Geographers, n.d.).
Given that geospatial data are often updated regularly, older versions of data may be at risk of being overwritten in the update process if an archival plan is not in place. In the world of purely paper-based documents, this was less of an issue, as the creation of a newer version of a map did not hinge on the destruction of the older versions of the data. In a digital context however, it is entirely possible that updates to a dataset over time could effectively erase the original data.
To help raise awareness and combat this, the GeoMAPP project focused on the topic of preserving data considered at-risk and temporally significant (North Carolina Office of Archives and History, 2011). It ran from 2007 to 2011 and partnered with archives departments in North Carolina, Kentucky, Montana, Utah, and the Library of Congress' National Digital Information Infrastructure and Preservation Program (NDIIPP). One of the outcomes of the project was the creation of guidelines for how best to identify and preserve historic geospatial data of value. The GeoMAPP website does not host any geospatial data. Instead, it provides valuable information on how to assess the state of an institution's geospatial data, and how to build and implement a plan for the archival of geospatial data. This information can be found in the GeoMAPP Geoarchiving Business Planning Toolkit, a zip file containing documents and a spreadsheet for calculating costs. Based on these documents, an institution can more effectively determine how to meet its needs for data archiving.
GloVis and EarthExplorer are two platforms hosted by the U.S. Geological Survey (USGS) for downloading satellite imagery and many other types of geospatial data. Originally, the USGS’s Earth Resources Observation Systems (EROS) provided online data through a system called the Global Land Information System (GLIS). This system was released in 1991 and remained in service until September 2003. Both the GloVis and EarthExplorer platforms that have replaced GLIS have some overlap in their functionality, as they provide some of the same data, but their interfaces are built on different technology and have different methods of searching for data. GloVis focuses mostly on satellite imagery, with products from the Landsat, ASTER, EO-1, MODIS, and TerraLook platforms, recent aerial photography, and other data (U.S. Geological Survey, 2015a). It was developed at USGS and went live in April of 2001. GloVis has a custom Java-based front-end that runs in a web browser seen in Fig. 7.20, although a major update to the system is planned (B. Van Keulen, personal communication, February 18, 2016).
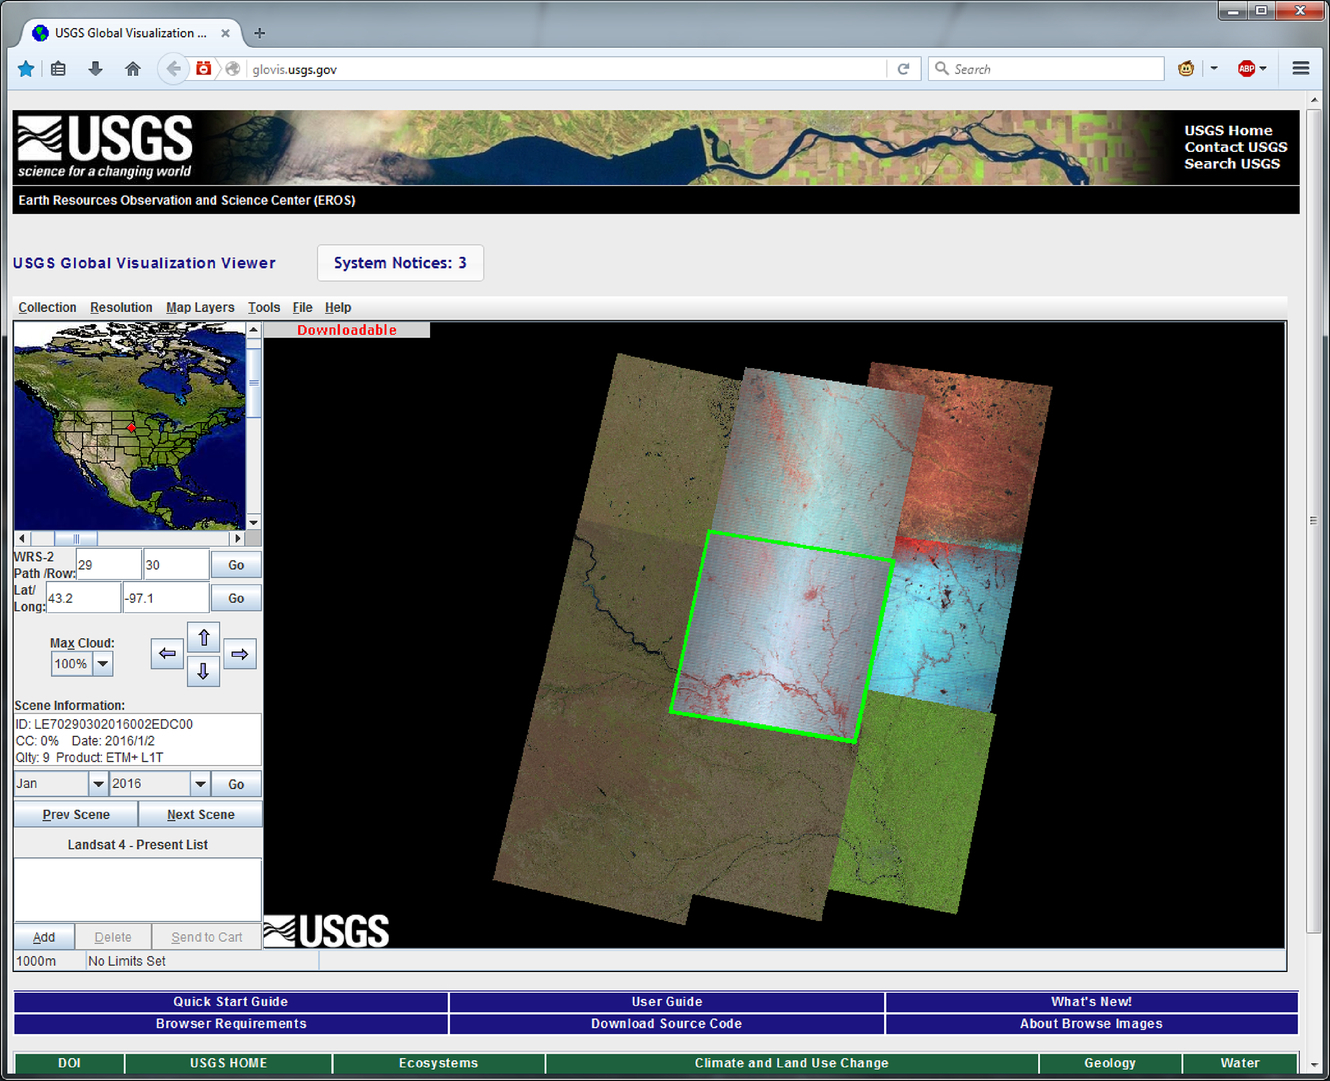
EarthExplorer first began operations in 1999 to support Landsat 7 data, and used software provided by the Canadian company Compusult (B. Van Keulen, personal communication, February 18, 2016). In 2011, the EarthExplorer platform was updated to use a Google Maps-powered interface that uses both Oracle and Postgres databases for managing data, see Fig. 7.21. EarthExplorer has a larger breadth of data available to download from over 180 collections. These include the satellite platforms that GloVis provides, along with other products such as USGS aerial photography both recent and historic, elevation, land cover, Digital Line Graphs (DLGs), Digital Orthophoto Quadrangles (DOQs), and other layers. It also has some commercial satellite imagery, such as data from the French SPOT program, IKONOS-2, and ORBVIEW 3. Other data include declassified satellite imagery from early U.S. programs like CORONA, ARGON, and LANYARD. The search capabilities also provide more advanced options than those of GloVis, allowing users to search by address, place names, satellite path and row, a user-defined polygon, shapefiles or KML files, and by date range. Both the EarthExplorer and GloVis platforms may be used to download or order data in bulk, and the same user account can be used to login to either as well.
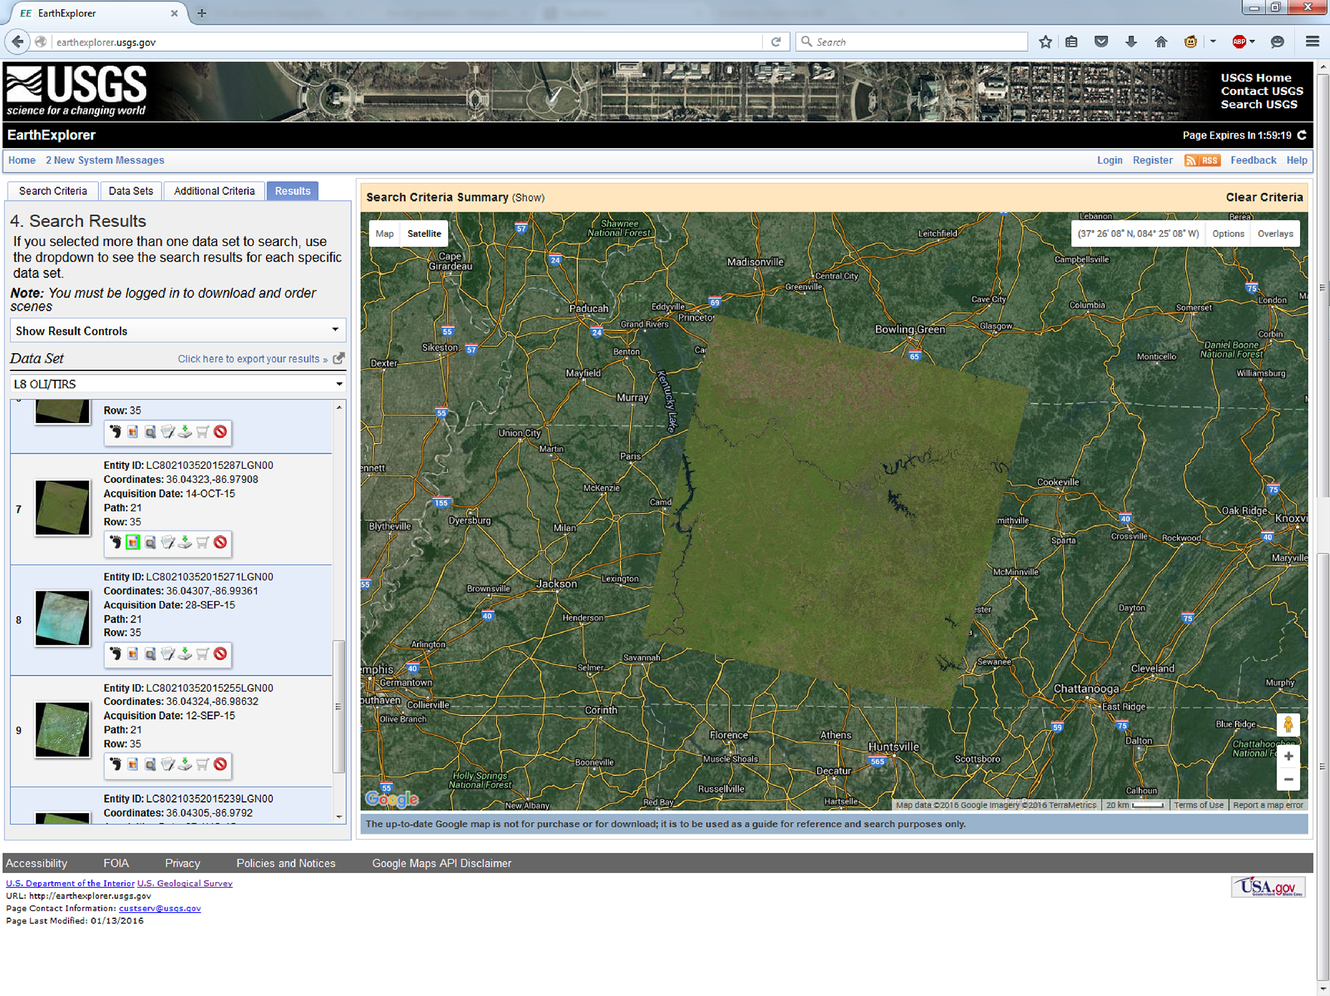
The HDDS is a USGS-hosted service that provides data related to areas that have suffered natural hazards (U.S. Geological Survey, 2015b). The data come from other sources, such as Landsat satellite images, and are organized by event. Using the same interface and user login account as the USGS EarthExplorer website, users can search by year and hazard event to find and download data that cover affected regions. The HDDS also provides GIS servers that can be accessed by ArcGIS and other GIS software to load pre- and post-event imagery and data layers directly into a desktop GIS environment. The HDDS is not limited to U.S.-based events, as some international hazard events are listed along with domestic ones. See Fig. 7.22 for a view of the HDDS interface.
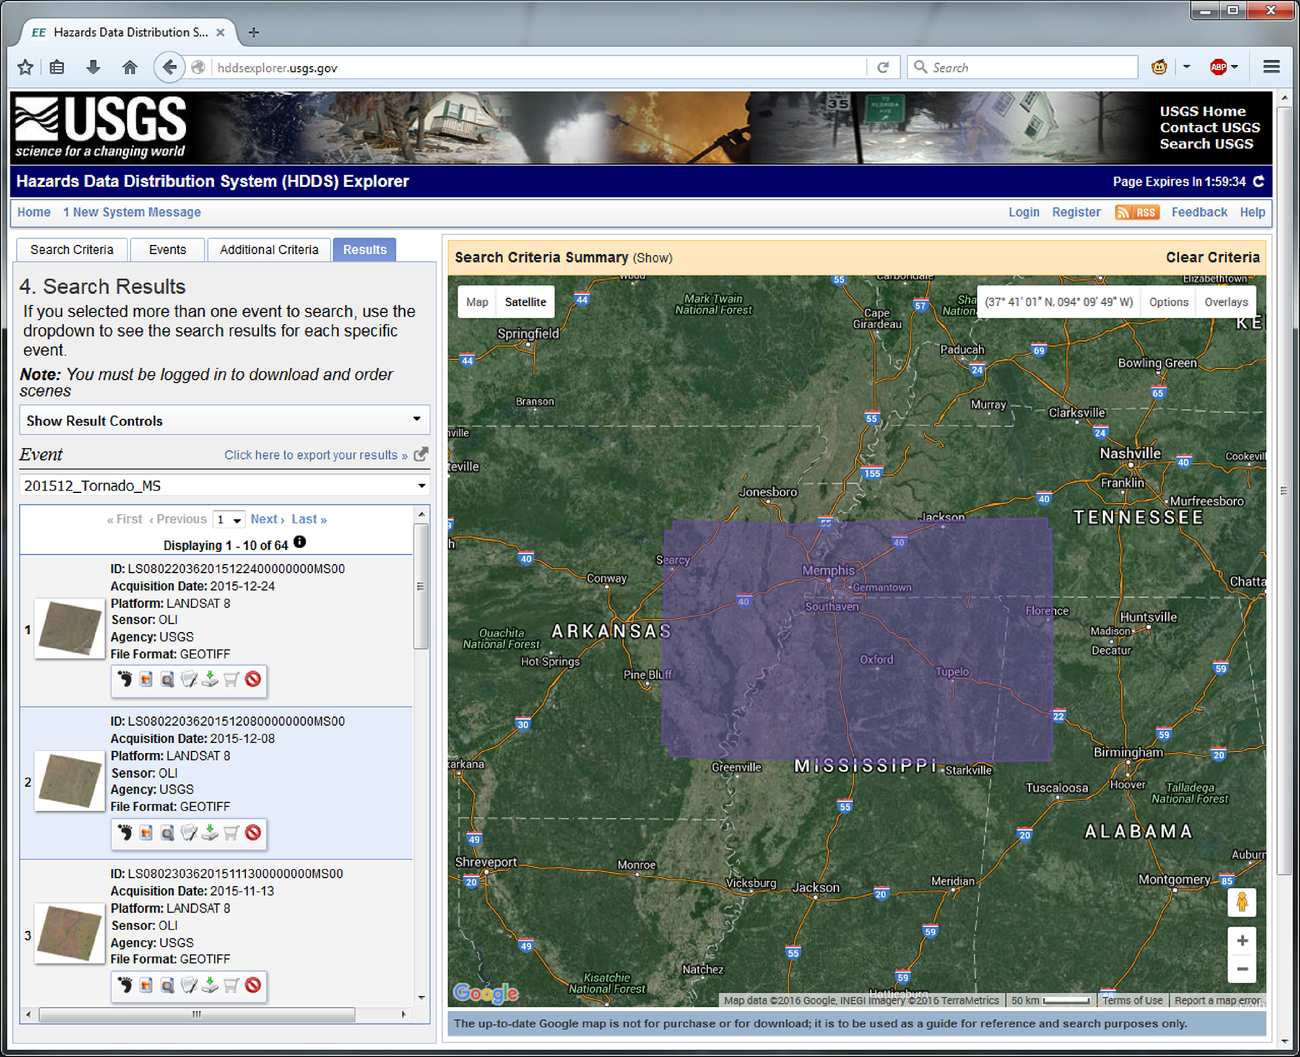
The Library of Congress is the national library for the United States, but has foreign-language materials in more than 460 languages (Library of Congress, 2008). It was established by an act of Congress in 1800 and while open to the public, the LOC continues to serve the U.S. Congress in a research capacity (Library of Congress, n.d.). Among the first items acquired were cartographic resources, and by 1897 the collection had 47,000 maps and 1200 atlases (Library of Congress, 2011). Today, the Geography and Map (G&M) Division of the LOC has the largest cartographic library collection in the world, with over 5.5 million maps, 80,000 atlases, 38,000 CDs/DVDs, 6000 reference works, 3000 raised relief models, 500 globes, and more (Library of Congress, 2016). The majority of these resources are located in closed library stacks, but examples of the map collection are illustrated online if copyright has expired or the resources were in the public domain such as the atlas displayed in Fig. 7.23.
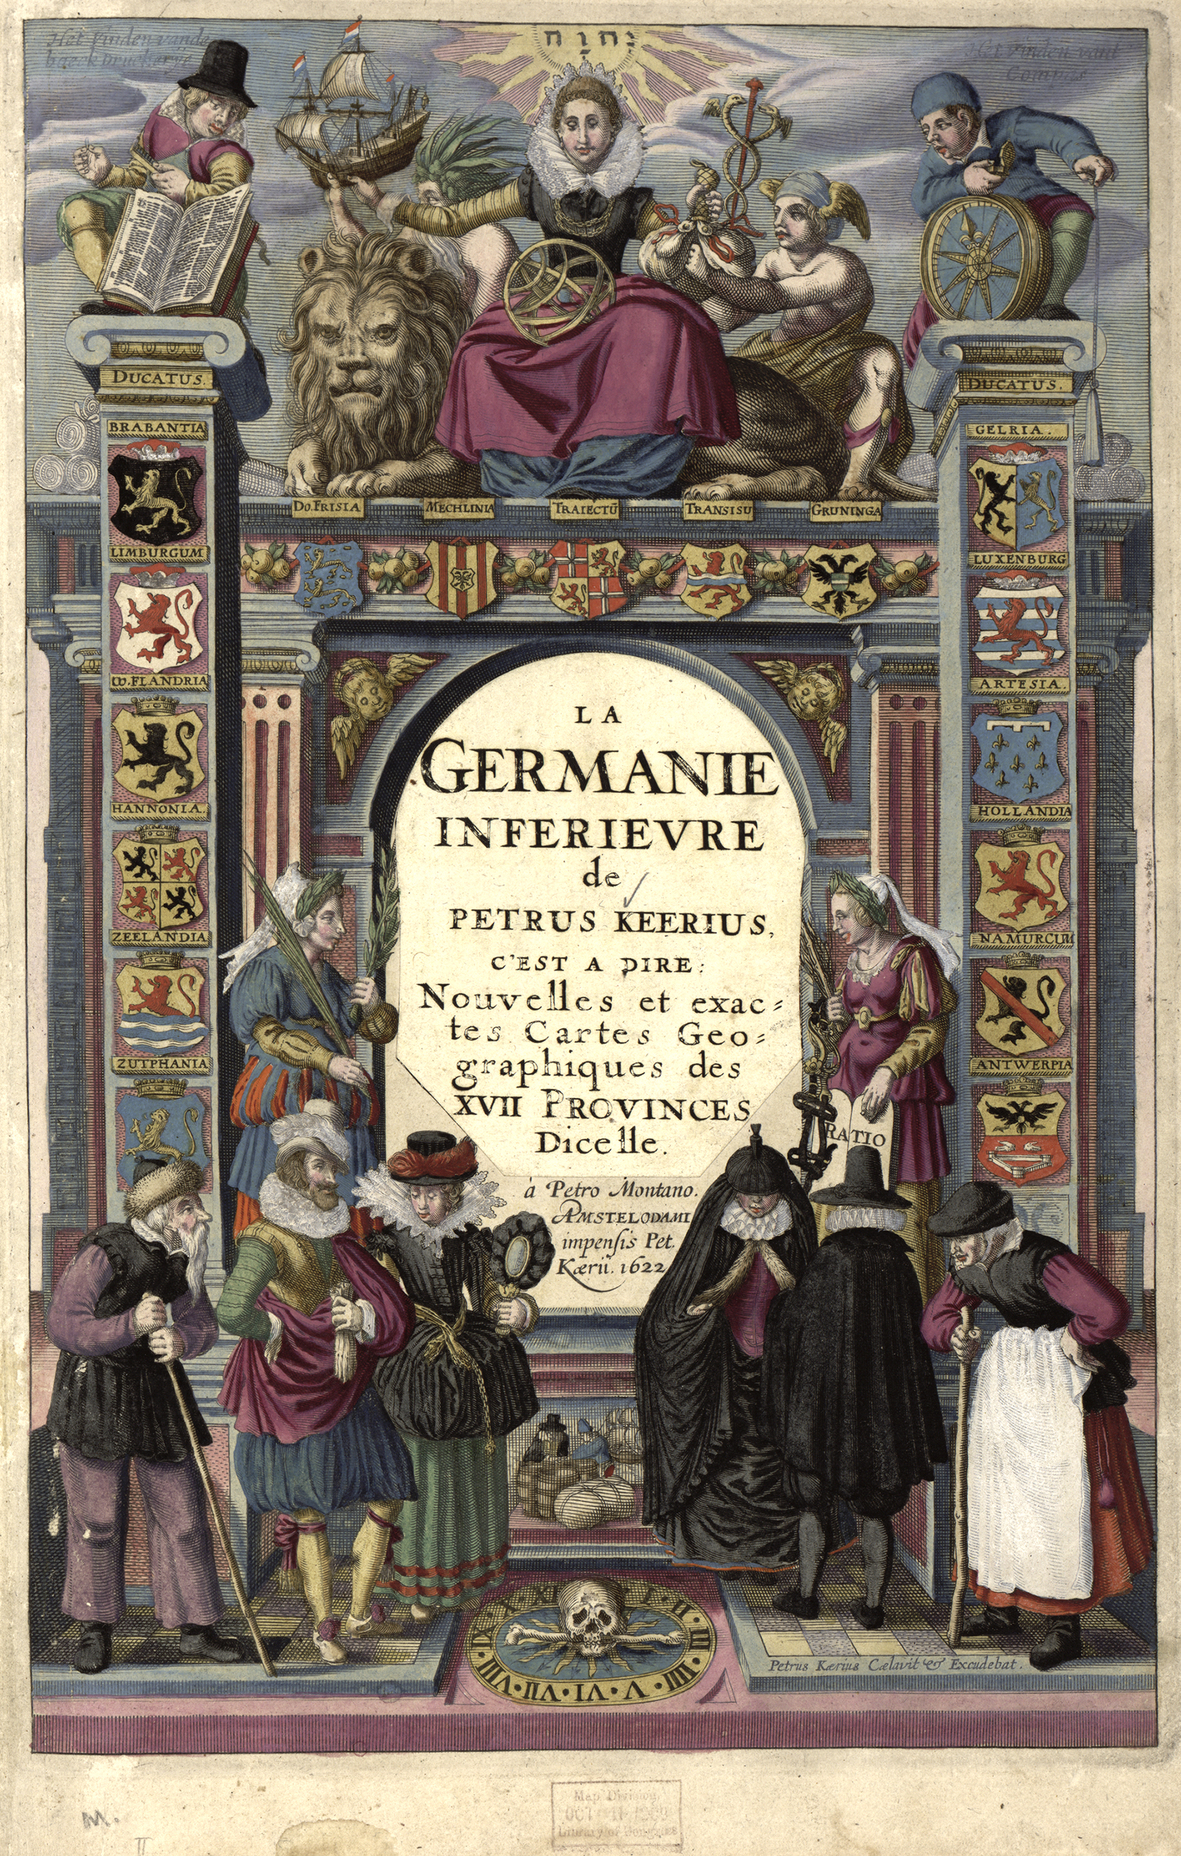
Some library staff and patrons may remember using map data provided by the National Atlas in the past. The Atlas integrated data from multiple federal agencies, but it has been retired as of September 2014 (U.S. Geological Survey, 2015d). The 1997–2014 edition can be downloaded via Data.gov. Current small-scale map data and web services can still be accessed via The National Map. These data include both raster and vector GIS layers in multiple formats. For more information, see the section detailing The National Map, later in the chapter.
In 1992, the National Geologic Mapping Act was passed in the United States, which mandated the National Cooperative Geologic Mapping Program, or NCGMP (U.S. Geological Survey, 2016c). This program is still active today and involves partnerships between the USGS and the Association of American State Geologists, with the aim of creating standardized digital geologic maps for the United States (U.S. Geological Survey, n.d.b). One important part of the NCGMP is the creation of guidelines for standardized geologic map symbology. As discussed in Chapter 2, current geologic maps employ a variety of colors and symbologies to represent geologic features. While geologic features do not end at administrative boundaries, the way they are symbolized may vary from one state to the next, or even from county to county on currently existing maps. These standards will eventually lead to a consistent symbology for the entire United States, making it easier to work with geologic maps. The primary portal for accessing and downloading U.S. geologic maps is the USGS-hosted mapView. This tool, seen in Fig. 7.24, uses an intuitive, interactive map interface to find more than 90,000 geologic maps from the past 200 years (Data.gov, 2015). This system is relatively new, with mapView going live in late 2012 and undergoing upgrades since then, improving the interface and technology to be more accessible for users (U.S. Geological Survey, 2012). Once a user has selected a desired map, extra information pops up in a new browser tab or window, including an interactive preview and options for download. Maps can be downloaded in multiple formats depending on the user's needs, see Fig. 7.25.
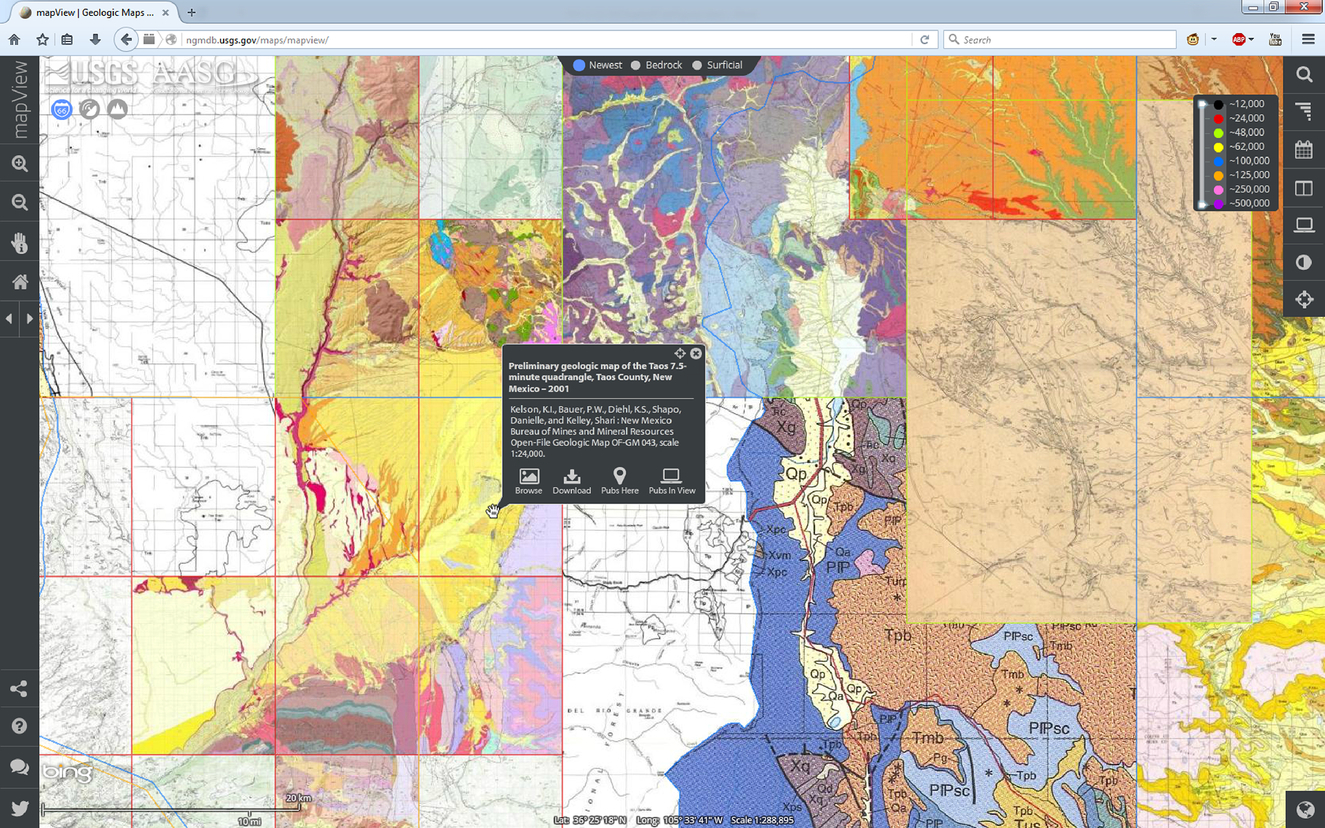
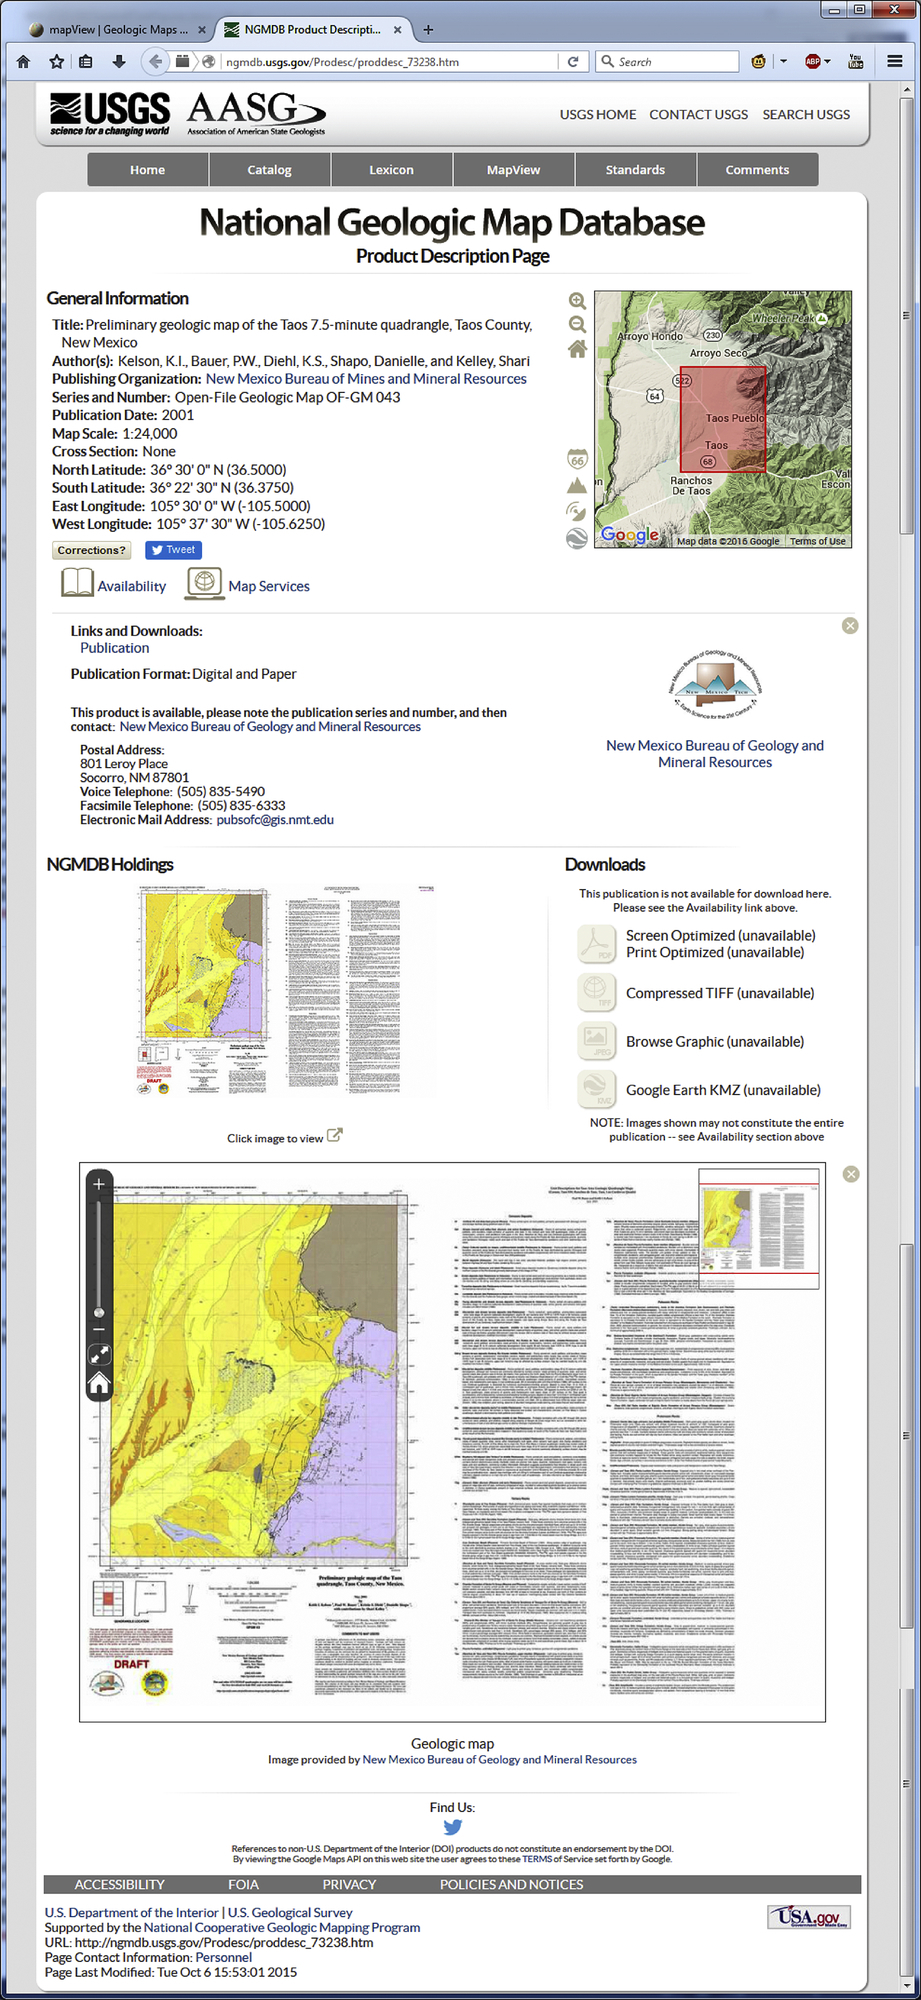
Much like the GeoMAPP program, the NGDA was a project focused on preserving and archiving geospatial data partnered with the Library of Congress' National Digital Information Infrastructure and Preservation Program (University of California, Santa Barbara, 2009). The project also involved groups at Stanford University, University of California Santa Barbara, University of Tennessee Knoxville, and Vanderbilt University. Unlike the GeoMAPP program, which focused on generating plans for preservation of historic geospatial data, the NGDA project created a tool for accessing said data. The Globetrotter geospatial data search tool provides access to data based on spatial location, the date of publication, and the digital format of the data. Globetrotter is housed and accessible via the UCSB's Alexandria Digital Library, specifically the Map & Imagery Laboratory (University of California, Santa Barbara Library, 2010). At the time of writing, Globetrotter is undergoing a move and is not currently available, but should return.
The National Map (TNM) is the primary U.S. resource for geographic information that describes the United States (U.S. Geological Survey, 2013). TNM products and geospatial data are used in a number of industries, research, and recreational capacities. TNM is responsible for the creation of the current US Topo series of maps and data, as well as providing the Historic Topographic Map Collection, but it also houses quite a few other products as well, all freely available in multiple formats (U.S. Geological Survey, 2016d). The National Land Cover Database (NLCD) is a Landsat-based land-cover dataset that covers the entire nation. These data are used for a variety of environmental and planning applications across the country. Elevation data are provided in raster format through the National Elevation Dataset (NED), including layers at multiple resolutions, and the 3D Elevation Program (3DEP) is currently improving and updating the nature of the elevation data that are available. The 3DEP is a USGS partnership with multiple federal, state, and tribal agencies concerned with generating a high-resolution LIDAR (LIght Detection And Ranging) dataset for the country. LIDAR elevation data are significantly of higher resolution than the older data in the NED, to the point that now objects as small as individual trees and automobiles can often be distinguished in the data. This level of resolution can provide a significant advantage in terms of modeling and analysis. Currently, the 3DEP program is ongoing, collecting data one segment of the United States at a time.
The National Map also houses water-related data: The National Hydrography Dataset (NHD) and the Watershed Boundary Dataset (WBD). Both datasets store information as vector data. The NHD includes streams and lakes at the 1:24,000 and 1:100,000 scales. Some areas even have supplemental data at a scale larger than 1:24,000 (U.S. Geological Survey, 2014). The WBD represents watersheds in the United States at multiple scales with the country being divided and subdivided by Hydrologic Unit Codes (HUC). The number of digits in a HUC defines the scale of the hydrologic unit, with two-digit codes representing the largest watersheds, and twelve-digit codes the smallest. It is common to refer to this watershed data as HUC two or HUC eight as a way of describing the spatial scale involved. Fig. 7.26 shows how these different scales of watershed data are nested within each other.
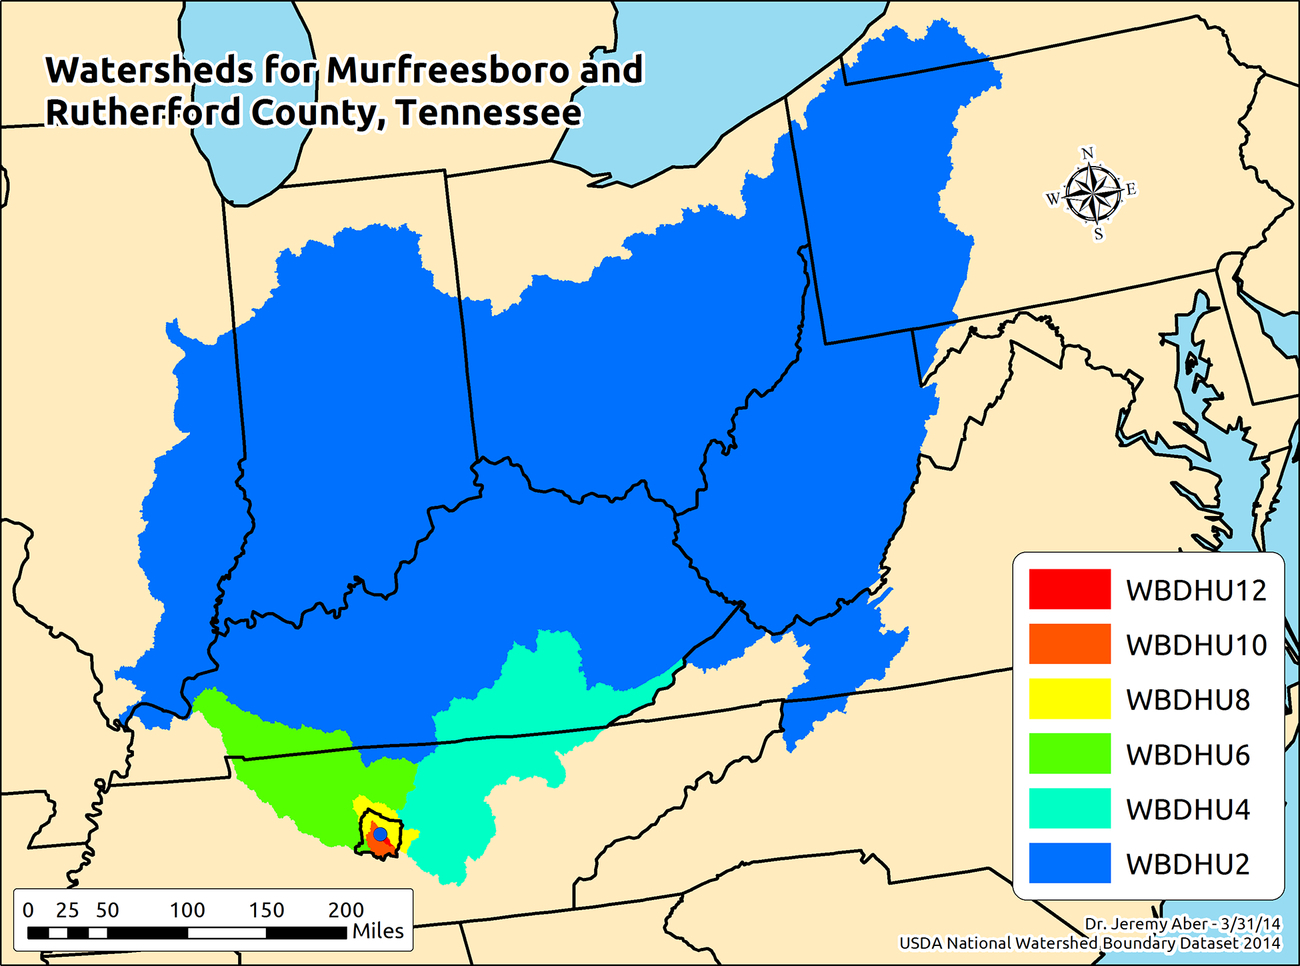
The National Map also houses orthoimagery. This is aerial photography that has been orthorectified to remove the distortions inherent to camera angle and lens distortion, see Chapter 4 for more discussion on this type of imagery. All the imagery for the United States has at least a 1-m spatial resolution, but many urban areas have a higher resolution of two feet or less. Data may also be found through TNM on transportation features like roads, airports, railroads, etc.; structures such as human-built facilities, inclusion largely based on the needs of disaster planning; and boundaries including administrative units such as states, counties, Native American lands, etc. All of the various thematic data mentioned is available to download through The National Map Viewer. Both map products and GIS data are available to browse using the viewer's interactive map interface. Fig. 7.27 shows an example of 2011 NLCD data being previewed for the Kansas City region. The viewer allows users to preview the data on the right and easily select from the various datasets with the menus on the left.
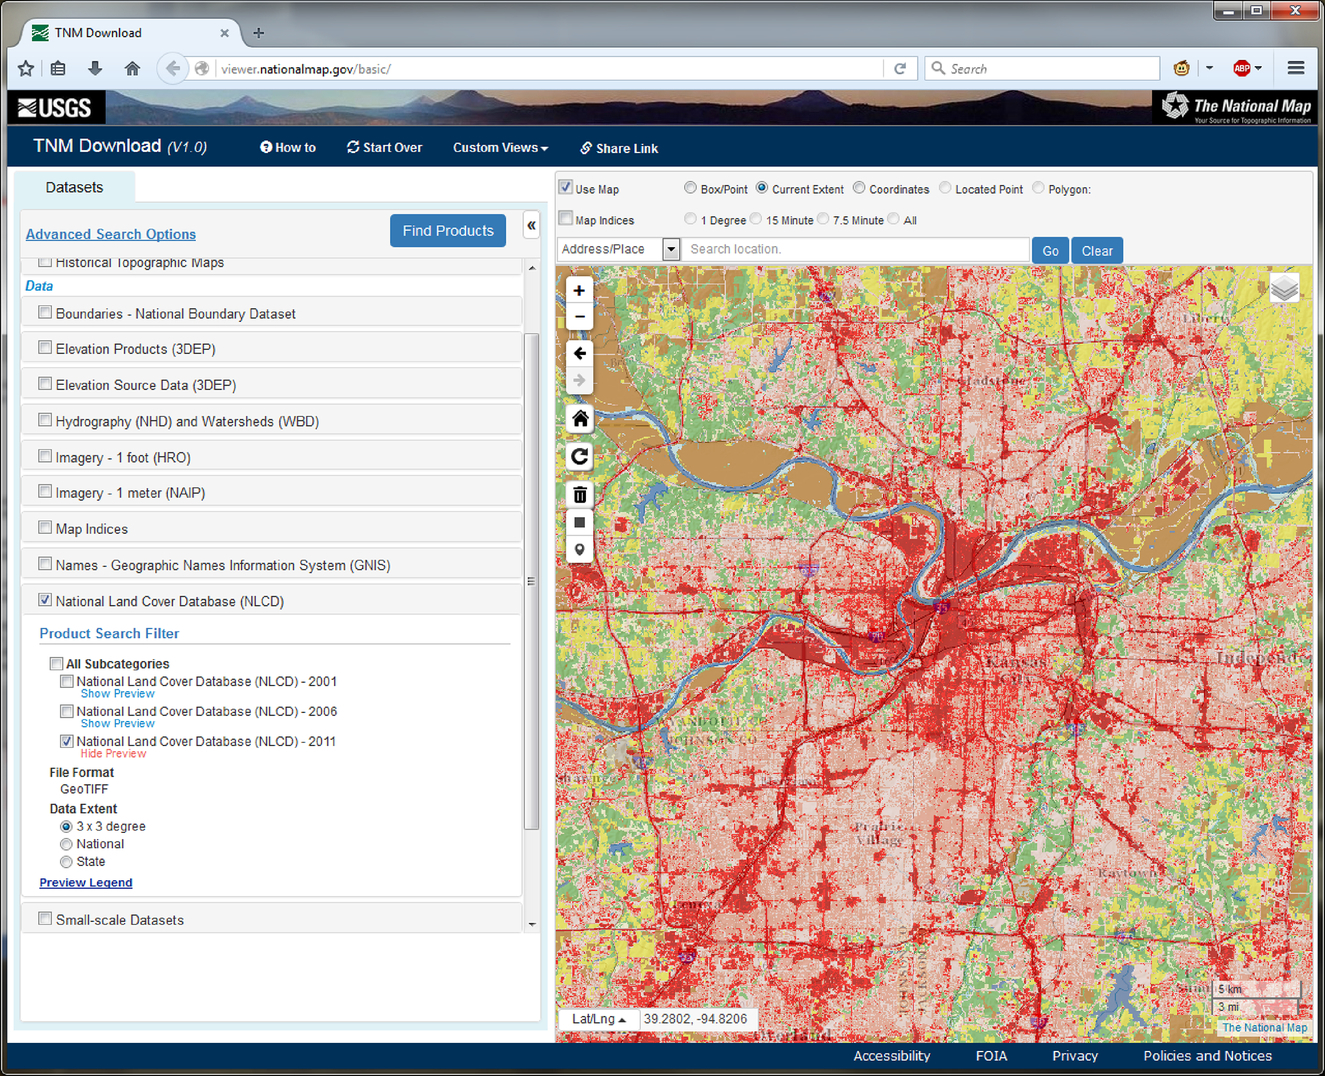
The first true GIS implementation was created in Canada in the 1960s by Roger Tomlinson, who is credited as the father of GIS (University Consortium for Geographic Information Science, 2015). It is only natural then that the Canadian government would have publicly available geospatial data hosted online. The current collection combines what used to be three separate data sources, GeoPub, Mirage, and GeoGratis (Natural Resources Canada, 2015). Together, these data include satellite imagery, scanned topographic maps, Geologic Survey of Canada (GSC) maps, vector files representing a variety of thematic content, and written publications from the GSC and the Canada Centre for Remote Sensing. The search functionality is straightforward, allowing users to search via text by spatial location, subject keywords, and product types. The advanced search also allows users to define a spatial bounding box in lat/long, and use an embedded map to define the location of interest, see Fig. 7.28. Geospatial data are available for download in multiple formats, and can be freely used under the Open Government License for Canada (Government of Canada, 2015).
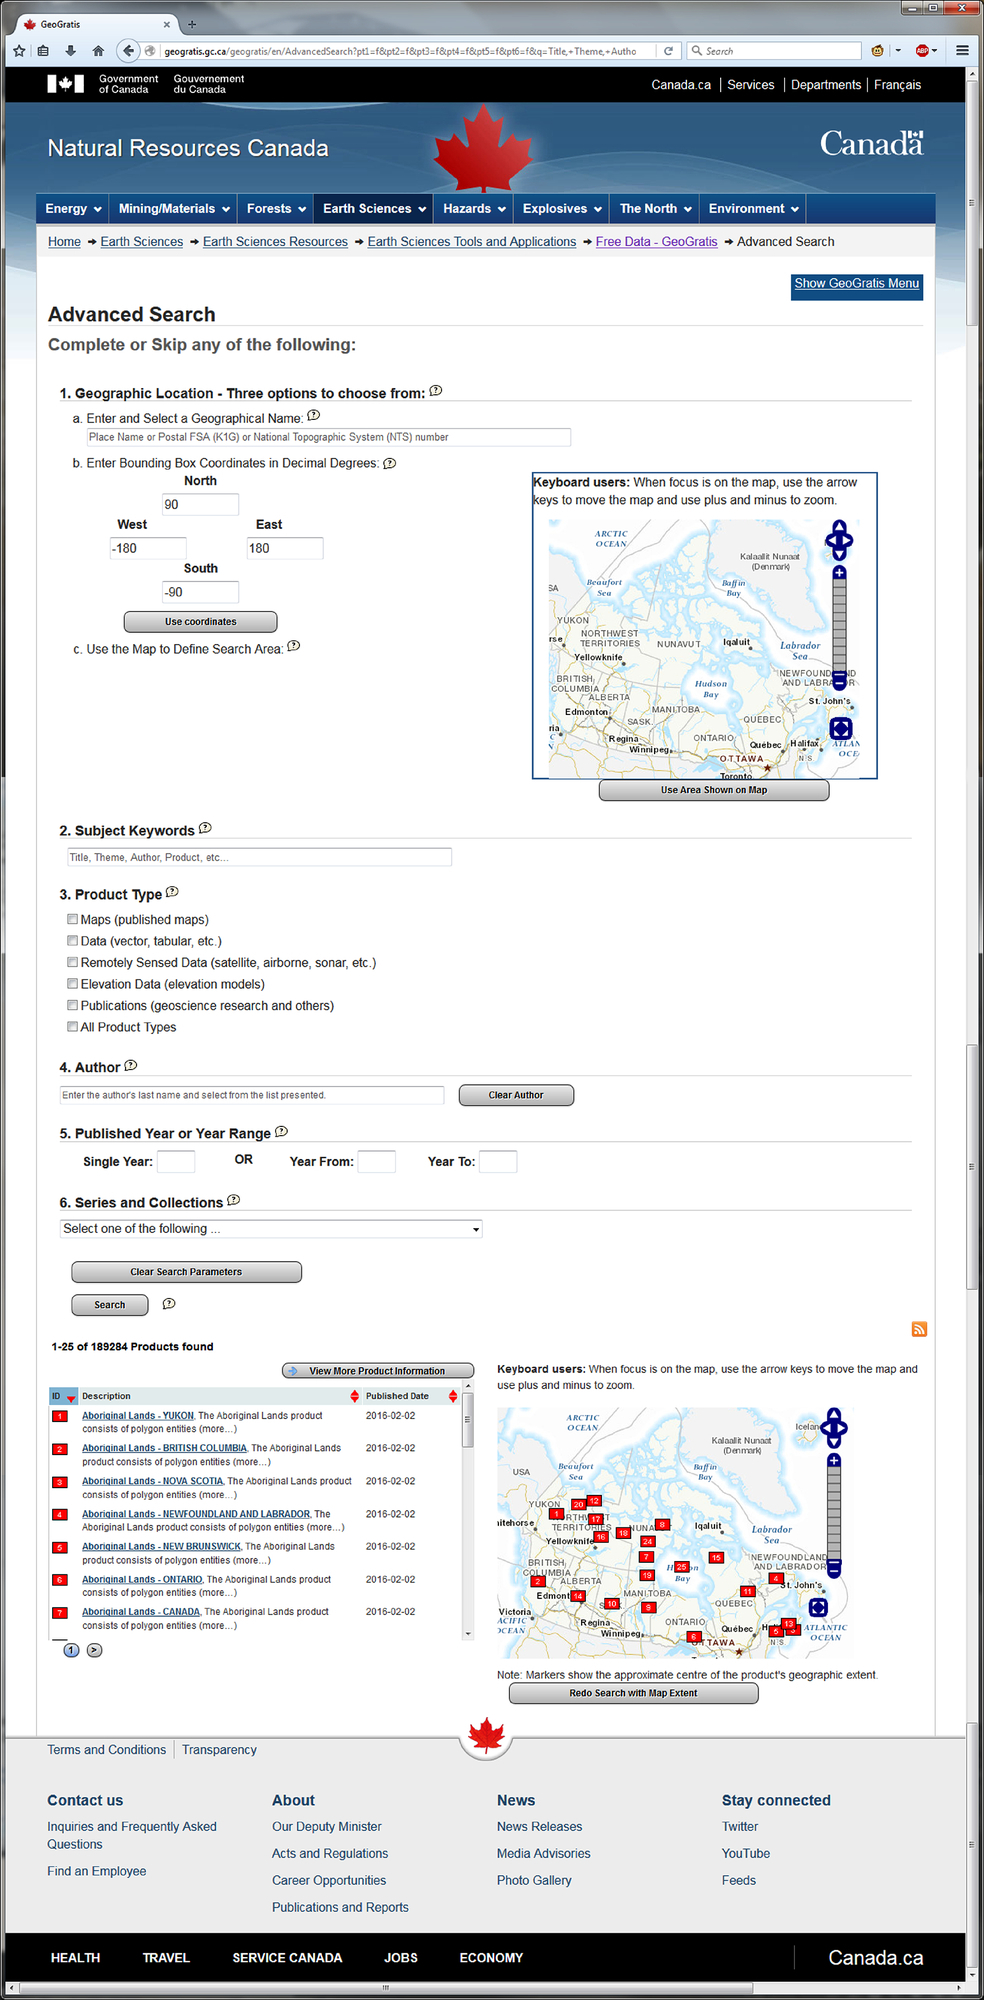
Within the boundaries of the former Soviet Union, cartography was a sensitive subject. Access to accurate maps was a tightly controlled commodity limited largely to the military and Soviet planners. The maps available to the general public were of a low spatial accuracy with inconsistencies and mistakes intentionally added as both a method of information control and a way to prevent accurate spatial data from falling into enemy hands (Miller, 2015). However, the maps produced by the state for military and planning uses were highly accurate and covered virtually the entire globe, a larger reach than any other national mapping initiative at the time or since. The quality was so high that maps they produced are often still the best available source of spatial information in some parts of the world (East View Geospatial, 2015).
After the Soviet Union collapsed into its constituent nation-states, many of these maps found their way onto the market and are available for purchase from resellers. While these maps have not been updated since the late 1980s at best, they remain highly accurate views of the world at that time. They may be desirable as historical documents, present-day references for some areas, particularly developing nations, or as curios of the Cold War. Some library collections house physical copies of Soviet maps, such as the University of Georgia Libraries' Map and Government Information Library, which holds Soviet maps covering most of Africa, Asia, the Middle East, and the former Soviet Union (University of Georgia Libraries, 2015). Companies may be found online that sell Soviet topographic maps as paper copies or in digital format as raster or vector files. A good list of sources for Soviet topo maps, including websites where digital copies can be downloaded freely, is available at the website of John Davies, who has studied the Soviet mapping program and the map products they created for more than two decades (Davies, n.d.).
While we have seen that the USGS hosts an enormous amount of geoscience data for the U.S. federal government, it is not the only federal agency that serves important geospatial information. The U.S. Department of Agriculture's Natural Resources Conservation Service (USDA NRCS) hosts data as well, perhaps most importantly their soil data collections. The SSURGO and STATSGO2 soil databases provide generalized soil information for the United States along with territories, islands, and commonwealths associated with the NRCS (USDA Natural Resources Conservation Service, n.d.a). STATSGO2 maps soils at a smaller scale, with the continental United States being represented at 1:250,000 scale, and is designed primarily for broader-planning use (USDA Natural Resources Conservation Service, n.d.b). SSURGO works at a larger scale, with data presented at 1:12,000 to 1:63,360 scales and is better suited for detailed local soil information (USDA Natural Resources Conservation Service, n.d.a).
The two ways in which data can be downloaded from the NRCS are the Geospatial Data Gateway and the Web Soil Survey (USDA Natural Resources Conservation Service, n.d.c; USDA Natural Resources Conservation Service, n.d.d). The Geospatial Data Gateway has a broader range of data, including layers that are available from other sources, like Census TIGER data. The interface lets users search data by region through a few different methods. The default search type is to select a state, then select any or all of the counties within the state. Other search methods involve selecting entire states at once, individual places, setting a lat/long bounding box, or using an interactive map interface to choose a location. Once the place selection has been made, a list of data sources can be checked on or off to indicate which layers the user wants. These layers include TIGER data, precipitation data in both vector and raster formats, air temperature data, NRCS conservation easement information, NED elevation rasters, geographic place names, surface geology, administrative boundaries, NHD hydrography data, hydrologic units, NLCD land-cover data, topo map indices, orthographic imagery from the National Agricultural Imagery Program, soil data, digital raster graphics (DRGs) of topo maps, and TIGER transportation data (USDA Natural Resources Conservation Service, n.d.c). After selecting the desired data layers, any existing options regarding data formats are presented to the user, then a choice of delivery format. Data can be provided in physical form on CD-ROM or DVD-ROM at a price, or the data can be downloaded for free. Regardless of the delivery format selected, the user must then enter contact info; for digital deliveries, an FTP link is sent to the email address provided by the user.
The Web Soil Survey (WSS) has a narrower focus on soil information and it uses a different search interface. In some ways the WSS search is more powerful, as it allows the user to specify more precise AOI. Rather than providing premade layers that overlap with that AOI, the data provided match the exact boundaries of the user-defined AOI, even if the boundary is an irregular polygon, see Figs. 7.29 and 7.30. This allows users to specify precise AOIs without having to deal with extraneous data that they might not find useful. GIS data for SSURGO information can be downloaded based on the defined AOI, and comes in Esri shapefile format, see Fig. 7.30. Since STATSGO2 data is recorded at a smaller scale, it is not defined by user AOI, but can be downloaded for individual U.S. states.
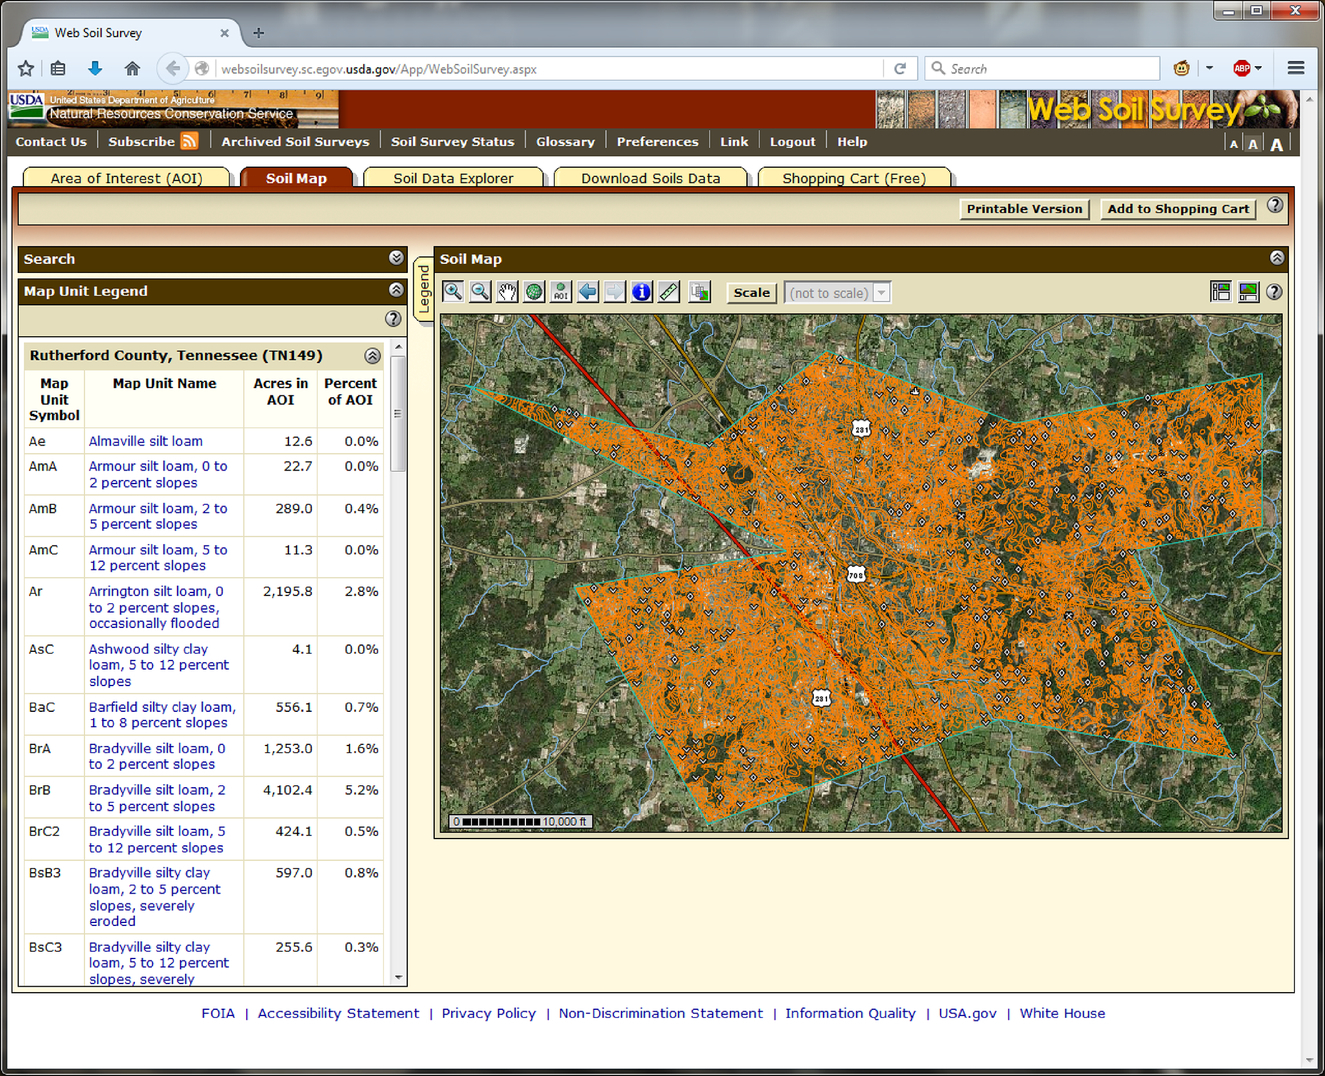
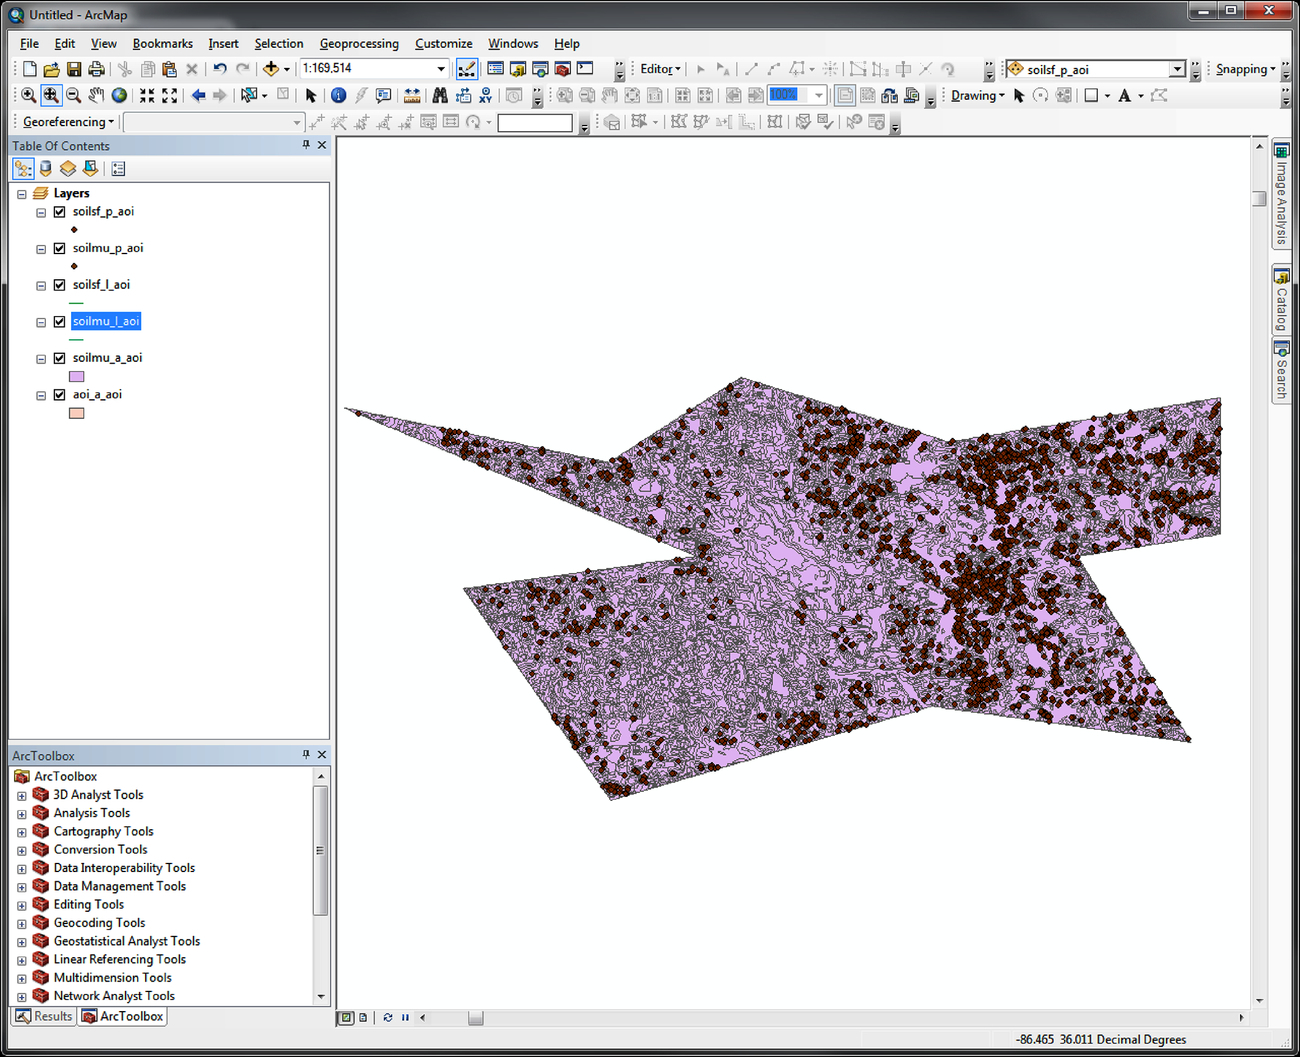
The WSS interface also includes an Intro to Soils section under the Soil Data Explorer tab which provides scientific information about soils and many other topics related to soils. Descriptions of terms used in relation to cropland, forested land, pasture and hay land, and other land-cover types are included in this section as well. For any user who might not already be a soil expert, this assistance provides valuable context to the information represented in the data.
Many options are available when it comes to geospatial resources, including software, data, and related information. Also, it is important to be familiar with any legal restrictions associated with geospatial content. While this chapter does not attempt to be an exhaustive source of information, some of the major providers of data and the means to explore it have been described. While the United States has many deep sources of geospatial information, including some global in scale, most other countries also collect and share data as well. Likewise, many agencies, institutions, and libraries at levels below national governments have resources of their own. These descriptions are a starting point for helping staff and patrons reach sources outside the library that may be necessary to fulfill research needs.
Information on how to satisfy client-to-librarian and librarian-to-librarian reference transactions is the focus of this chapter. Location factors that effectively hide collections and reference services from library users are noted. Core competencies and duties of reference librarianship are given, along with some typical reference question examples. Current reference guides are highlighted. When puzzled, the reference librarian has an organized group of professionals to ask for help and advice. This online map librarian-to-librarian support system is detailed to boost confidence levels for all reference desk librarians. Finally, map and geospatial data citations and reference styles are contrasted to provide clarity on issues of attribution and plagiarism.
Reference transactions; Core competencies; Resource guides; Professional organizations; Social media; Plagiarism; Citation; Referencing; GIS; Geospatial data services
“Where can I find…,” is a typical opening for clients approaching any reference-desk librarian. Whether the desk is physically located in the map library or an online, e-map reference desk makes no difference. However, when map-related questions are asked, many reference-desk librarians may have a higher confidence level locating an atlas or a journal than searching for maps, geospatial data, aerial photographs, and other nonbook formats. As stated earlier, it is unlikely that librarians had any more than one course related to science reference and resource services in their library degree program; it is likely that librarians have undergraduate backgrounds in the humanities or social sciences, not the natural sciences. Therefore, this chapter applies basic reference-desk knowledge, skills, and abilities to map and geospatial data resources.
A wise professor once started class with the adage: you never get a second chance to make the first impression. This may be true for locations of map collections and reference-desk librarians, in both physical and electronic environments. Librarians on the reference desk need to be approachable, interested listeners, who search and follow up with resource results when library users request help. Unfortunately, there are many ways to effectively hide map collections and reference librarians, physically and electronically. As one example, students in a map librarianship course were assigned to investigate regular and Federal Depository Map Library collections. Libraries that serve as depositories of federal publications including maps and spatial data must make collections accessible to the public, but student reports on reference librarian and map collection encounters had mixed first impressions. Their stories follow.
Some students had positive experiences and located prominent collections online, followed by physical visits where they found the circulation desk for maps, photocopiers, librarian offices, classrooms, study rooms, as well as workstations with access to many online databases and map indexes. One student found an impressive map collection, nicely illustrated and organized online with several contact methods to reach the reference librarian. This student decided to visit the same library in person to view Federal Depository maps. Upon arriving, the student quickly found the historic map collection he had viewed online. After browsing, he asked the reference librarian which of the cabinets housed the Federal Depository maps. He was directed to a quiet room, several floors down, in the basement. Given the weight of stacking maps in map storage cases, it is understandable that map collections are often placed in basements. Yet the large room filled with numerous storage cases had little heating, poor lighting, and no staff. He was amazed by celebrated and forgotten map resources, and the contrast in locations and services.
Another student visited a different library online to find there was a dedicated “map room.” Upon the physical visit she found the map room but was frustrated by the lack of librarians in the area. Eventually she found a helpful reference librarian, but suggested that if they would move the reference desk out of the corner of the room and into a prominent position, it would be easier for patrons to find.
One student chose a public library and described her visit looking for a specific map. While the reference librarian was easy to find, she summarized the overall experience that “…the maps are like rags that are flung to the far corners of this library.” This student asked to check-out a USGS California map showing the northern coastline. She was led down two long hallways, to a few map cabinets behind shelving carts. With no success, the librarian talked with a clerk and neither staff knew exactly where USGS maps were kept, nor if maps were available for check-out. They retraced steps to the opposite side of the library and noncirculating atlases and gazetteers. Finally, they stumbled upon the Federal Depository map collection and a California drawer of topographic maps; however, there was no state index map to be found, and maps were arranged in alphabetical order by title. The librarian went to the catalog, but not knowing appropriate map titles made a search difficult; the librarian finally determined the maps must not be in the catalog. The student could only speculate, but concluded the map collection was rarely, if ever used.
Some students found maps in the main library catalogs but found that specific resource searches could be unsuccessful because of terminology problems. This was demonstrated with an assignment where students were tasked with stepping into the boots of a geologist. They were asked to find a map showing where in the state of Colorado dikes could be found. Geologically, dikes are specific features formed by molten rock infilling cracks; on the surface, a dike forms a long narrow ridge. They often appear as red lines on geologic maps, but these features are not as easy to find on other types of maps. So students were provided with the feature name of a dike formation, one known locally as the Devil’s Stair Steps, all located in an area referred to by prominent mountains, the Spanish Peaks, see Fig. 8.1. This search involved geography resources from atlas to gazetteer.
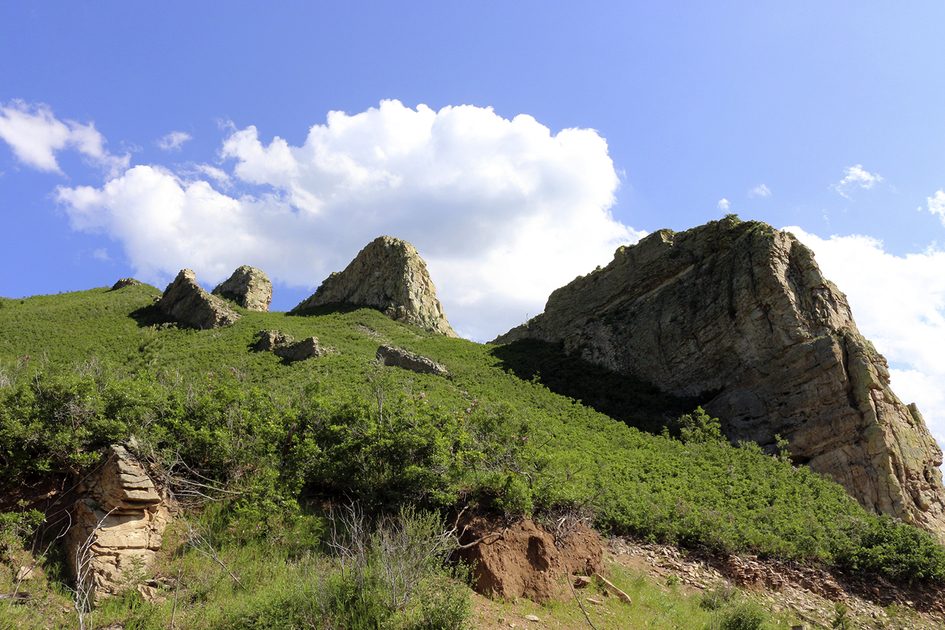
Students quickly found that a term a professional geologist uses may not be the term a nongeologist librarian knows. In the Getty Thesaurus of Geographic Names (TGN), a search could be made by a name and place type. In the Geographic Names Information System (GNIS), options were to search domestic name, where feature name and feature class could be chosen from a dropdown box. At an online commercial gazetteer website, the search category was “physical feature.” Students discovered that search results varied with using “Devil’s” or “devils” and “stair steps” or “stairsteps.” They found the term “dike” was not always an option in dropdown boxes and had to choose “ridge” or “sandstone spines” even though dikes are not sandstone. Once the feature was found, GNIS provided links to online map types varying from topographic to satellite images. The TGN produced a hierarchical description where the location was listed as World (facet), North and Central America (continent), the United States (nation), Colorado (state), Huerfano (county), and Devils Stairsteps (ridge). The online gazetteer did not give map links but did give a resource as the 1994 U.S. Department of the Interior, USGS, GNIS, Digital Gazetteer, Reston, VA.
Using TGN, another step in the search would be required to actually find the map. Some searching online using “devils stairsteps” produced links to great ground pictures, but no location maps. Some maps located Spanish Peaks but did not mention dikes. The implications for librarians are to have the client explain alternative words for a feature, and to know which types of gazetteers and maps might yield the best results for specific requests.
Finally, one student highlighted another location issue. According to the library catalog, there was a map library at the university; but upon arriving at the third floor map library location, she found books and no maps. It took two visits and a telephone call to find out where the maps had been moved. A special collection of water archives containing historic maps, spatial data, and aerial photos were located in the library, fourth floor, and reference books such as atlas, gazetteer, and almanac stayed in the reference area on the ground floor. The topographic maps from the Federal Depository collection had been moved to another building that housed the geoscience departments. If the reference librarian was handling a specific map request, then deciding where to send the client was a challenge. Also, the offsite maps in the geoscience department did not have an on-site librarian. It is easy to understand how map theft could occur in libraries and might be unnoticed for months or years (Dempsey, 2012; Map History, 2016).
Although these student activities were first assigned several years ago and catalog searching techniques have improved, map resources and reference librarians remain hidden in basements with poor signage and resource organization. Inadequate staffing, missing index maps, catalogs without map entries, terminology differences, and physically outsourced and divided collections among various buildings are challenges for patrons in public and academic libraries. While some student experiences were good, others came away with an overall negative first impression of map collections and reference librarians.
Larsgaard (1998) recognized that facilitating a reference exchange is easier if the librarian is familiar with spatial data and patterns of issuance as well as if the spatial data possessed by the main library is located in one place. It also helps greatly if the materials are classified and cataloged in the main library’s online catalog system (p. 272). Adding map collections into library catalogs has been a relatively recent occurrence that is due to larger institutions cataloging their collections. This allowed other institutions to benefit by copy cataloging. Larsgaard argued that “cataloging is the basis of all reference work, and, once done, substantially increases usage of the materials” because people know maps exist (p. 272).
Reference has several meanings, such as a word or phrase pointing to an original source that was used as a quote or paraphrase. This meaning is synonymous with citation. Also, reference may take the form of written or oral support for another person's qualifications for employment. In a sense, the reference librarian does both. They point clients to sources of information or data through a structured conversation and in doing so, support the qualifications of that resource. A reference-desk encounter is also known as the reference interview. However, in light of both physical and electronic encounters and the fact that clarifying the exact information need of a client is an iterative process, conducting the reference interview is more descriptively referred to as a transaction.
The reference transaction is defined as “information consultations in which library staff recommend, interpret, evaluate, and/or use information resources to help others to meet particular information needs” (Reference and User Services Association, 1996–2016). Specifically, reference work includes interactions with clients to satisfy inquiries; it involves resource creation, management, and assessment. Creation and management is defined as “the development and maintenance of research collections, research guides, catalogs, databases, web sites, search engines, etc., that patrons could use independently, in-house or remotely, to satisfy their information needs”; assessment is the “measurement and evaluation of reference work, resources, and services” (Reference and User Services Association, 1996–2016).
While the reference transaction does not include a formal instruction session, it may include point-of-use instruction. For example, if a topographic map quadrangle title is unknown, then the index map is needed to determine the map title, allowing the client to effectively search for the needed map sheet. Although reference transactions are separate from formal instruction, Bishop, Grubesic, and Prasertong (2013) made the point that “…most instruction in library and archives relates to teaching users the information literacy skills to answer their own future reference questions” (p. 307).
In determining how to provide reference services in her newly created Geospatial Data Services Librarian position, Dodsworth recognized that reference and instruction were inseparable. “The traditional map librarian doesn’t teach how to use a map to the same extent as the geographic information system (GIS) librarian teaches about GIS data and technology” (Dodsworth, 2007). For example, before providing reference services such as promoting the vast array of the library’s digital data, Dodsworth gave live demonstrations of datasets in interesting contexts such as plotting all coffee shops and 24-hour food services in proximity to the university campus. After demonstrating the visual display of information on the map, Dodsworth offered separate workshops on map creation using GIS software. Overall, the need for reference services increased greatly, using instruction to inform library users of the potential in reference materials and services.
Core competencies are a combination of knowledge, skills, and abilities that are expected to successfully accomplish map, geospatial, and catalog/metadata librarianship. An education committee within ALA’s Map and Geospatial Information Round Table (MAGIRT) defined a set of core competencies (Weimer, Andrew, & Hughes, 2008). One of the broad areas is reference and instruction. Some of the main core competencies include the ability to effectively communicate and creatively teach courses and design tutorials. Other competencies include skill in conducting an effective reference interview, navigating creation and distribution systems for geospatial print and digital data resources, and performing basic geo-processing activities. Finally, competencies involve knowledge for using and creating reference tools and finding aids, defining geographic and cartographic principles, and applying GIS. Bishop et al. (2013) further refined this list to apply to course work, see Appendix B.
Obviously one of the best ways to acquire knowledge and skills is by taking courses, and academic opportunities were introduced in Chapter 6. Two older, but classic, must-read books are by Larsgaard (1998) and Abresch, Hanson, Heron, and Reehling (2008) to provide the foundation for reference and other core competencies. Finally, professional development organizations and their journals, courses, support, and workshops also prepare librarians for reference competencies. These opportunities are discussed later, but types of questions and the creation of resource guides are detailed first.
A library user approaches, physically or electronically, and poses a need or question. An enthusiastic student related one of her first reference encounters where the patron asked for a map showing the Washington and Oregon areas. After quickly searching the library catalog for “pacific west coast,” a map came up with detailed ecological data, which she then retrieved for the patron. This was not what the person wanted, and several questions later, it was determined a simple atlas satisfied the need. She learned it is the task of the reference librarian to first never make assumptions, but rather guide the conversation to gather enough background to clarify the request. Once the nature of the question or request is established, then one may determine what type of map resource is needed, print or digital, historic or modern, atlas or gazetteer, thematic or topographic. To clarify needs, reference librarians must phrase questions that cannot be answered with yes or no, and remember if the person knew what type of map was needed and where it was located, the conversation would not be happening. Following through with a reference transaction is important and if the student on the reference desk had sent the patron for the map, she would likely never have known it was not what the patron wanted.
Adopting a user-centered focus is best for reference work, but be prepared as this means applying a proactive rather than reactive approach in assessing needs. In addition to logging the client’s need, each encounter is a spatial data opportunity for communicating information and sharing library resources. Larsgaard (1998) highlighted the main points leading up to a reference transaction as: (a) the client has a question or spatial data need that he or she cannot articulate; (b) the client is anxious and doubts the abilities of the map librarian to understand; (c) clients and coworkers do not want to admit ignorance, but if the inquiry is articulated, then the reference librarian must go through the basic skill-set: “approachability, interest, listening and inquiring, searching, and follow up” (p. 270). If the user’s request involves maps, then specific details must be gathered on geographic area, subject of interest, map type, map scale, and application. Finally, access the appropriate database or catalog, move to map drawers or a gazetteer/atlas to locate the resource; if the transaction is a remote reference, suggest a website data portal. Larsgaard reiterated that a reference transaction is an opportunity to not only answer the question, but to use this time to market the library’s other geospatial resource collections, so clients realize what is available to help them in the future (p. 270, 271).
Most geographic questions relate to location or theme because maps describe place and have purpose. Likewise, Musser (2006) wrote that geoscience questions are place-based or topical. Simple topical questions include earthquakes, volcanoes, and dinosaurs; these may be answered using government websites such as the USGS Earthquake Hazards Program (U.S. Geological Survey, 2016a), the USGS Volcano Hazards Program (U.S. Geological Survey, 2016b), and a Natural History Museum such as the Dino Dictionary from the London museum (Natural History Museum, n.d.).
As mentioned earlier, specific place-based features may be more challenging. Also, standard resources such as ProQuest and the online catalog would locate library-specific resources. Place-based questions need clarification such as describing location by the nearest geographic feature, or as is the case with topographic quadrangle maps, it is the title or name that appears on the map that is critical to know. Tools for determining place names include gazetteer databases such as GNIS with physical and cultural geographic features, GEOnet Names Server (GNS) with U.S. geographic feature names, and TGN with place names.
For remote reference questions, the greater online library catalog such as WorldCat.org is a good place to search for place-based geoscience information. Assigning a subject, a heading in the form of Geology—[place], may produce results; if needed, add keyword = maps. At WorldCat.org, when the client clicks on the source, a listing of nearby libraries is displayed where the map or data resource may be retrieved if the client is unable to visit your library. In the geosciences, older resources are often used for change-over-time studies, and Musser suggested that an edition of the Guide to USGS Geologic and Hydrologic Maps, last updated in 1994, is a potentially useful source to recommend because of the extensive historic map listings. Musser gave another example for earth science questions and knowing if the resource is in a series; The 1980 Eruptions of Mount St. Helens, Washington, is a USGS Professional Paper series, no.1250. In the past, catalogers might have added it as a monograph rather than series, which would be problematic for locating because it would appear as U.S. Geological Survey Professional Papers, no.1 and not result in finding the resource (Musser, 2006).
Below are some free bibliographic resources Musser also recommended to answer frequent types of questions:
• National Geologic Map Database (http://ngmdb.usgs.gov/)—the database is an index of U.S. geologic map locations with links to map catalog, stratigraphy, mapView, and topoView.
• Geolex (http://ngmdb.usgs.gov/Geolex/search/)—this search engine is specific for geologic unit names and descriptions in the U.S.
• Geologic Guidebooks of North America database (http://guide.georef.org/dbtw-wpd/qbeguide.htm)—geologic field trips are often not published by conventional publishing companies, but are sources of detailed local geology information.
• Bibliography on Cold Regions Science and Technology and Antarctic Bibliography (http://www.coldregions.org)—although not recently updated, they are good sources of historic geologic and engineering information for high altitude and latitude environments.
Less-geology-focused reference questions are sometimes more complicated and challenging such as: where can I go to illustrate the history of urban development? Documenting this history could be locating a progression of historic to modern maps showing changes in basic urban infrastructure. Also, urban development could be documented by purpose such as a selection of thematic maps showing natural landscape, cultural, and demographic change over time. The reference librarian could direct the library user to the local print map collection as well as any digital ones that exist. Today, reference librarians may enhance their own print and historic maps by sending the client on a journey through digital collections. With a digital route, layering the results using GIS would result in an interesting project as well. However, this is likely not the typical reference-desk question.
Some library clients prefer an alternative to asking a reference librarian for help via the perceived “more approachable” reference guide, whether print or online. The reference or resource guide may be specific enough to highlight a collection, both the unique and ordinary, and to inform viewers on the extent of resources available external to the library. The guide might link to tutorials and much more.
Map and geospatial librarians have been creating reference and resource guides online for more than a decade and in print, even longer. Reference guides have been known by many names such as bibliographies, pathfinders, information portals, webliographies, Tracer Bullets, as well as an array of “guides” prefaced with research, resource, study, subject, topic, and more recently wiki and LibGuides (Springshare, 2007–2013).
Whereas the bibliography is a list of books by a specific author or for subject, the webliography is somewhat the digital equivalent with URLs and hypertext links to connect the viewer directly to online resources. If interested in this design format, guidelines are available for creating subject- or topic-focused webliographies to submit to an online journal publication. These guidelines could be modeled whether or not the guide is submitted for publication (Issues in Science & Technology Librarianship, 2016). Several examples of notable subject-specific webliographies for maps (Zellmer, 2011) and geospatial data (Dietz, 2010) are online.
Pathfinders are defined as a subject bibliography that leads the user through a research process via primary and secondary sources; they are often created to be library-specific, printed or online (Reitz, 2004–2014). Over the years, some researchers and librarians studied the format for delivery, while others recommended how to create guides. Morris and Bosque (2010) provided a good review of changing formats for subject guides including pathfinders in print to guides using Web 2.0 technologies at large academic libraries.
Science Tracer-Bullets Online has a similar definition as research guides with brief introductions to the topic and lists of resources and strategies for helping the researcher stay on target (Library of Congress, 2016b). An interesting Science Tracer Bullet (05-1) is on remote sensing, and although hyperlinks are no longer actively updated, it does provide an extensive listing of print resources that still exist (Library of Congress, 2011).
There are several resources to create LibGuides. Dobbs, Sittler, and Cook (2013) provided tips and skills to use the LibGuide template to organize web pages and create the customized guide. These authors showcased 28 LibGuides with good design features. Dougherty (2013) also had an informative research article that identified important components for the homepage such as the school or agency, author, job title, guide title, latest information update, and statement of purpose as well as navigating instructions for using multiple organizing tabs. Dougherty’s findings showed that map and GIS resource guides created for small undergraduate universities featured more resources and links than larger universities with graduate programs in GIS. Convenience is a prime reason for the use of reference guides over reference encounters. Embedding library subject guides directly into online course learning content management systems shows promise for increasing the use of guides by students.
Finding digital and print geospatial data is a treasure hunt and involves a bit of detective work by librarians. For example, it is nearly impossible to record and catalog individual entries for each map included in each atlas or maps as folded inserts in books. However, after leaving the familiar catalog and local collection, a plethora of choices exist online at education, government agency, nongovernmental organization, and commercial websites, some of which are described in Chapter 7. Listed earlier in this chapter were a few gazetteer websites, but the Library of Congress (2016a) provides a thorough Reference Web Resources page. Another avenue is a commercial website, My Atlas and Maps at refdesk.com (2016). Both of these may help librarians find relevant data quickly. These websites are all helpful, but may seem overwhelming at first, so heed the warning from Larsgaard (1998) that “care must be taken not to swamp the user with far more information than was ever needed; the level of interest, two-page paper or 300-page dissertation should be pinned down during the initial reference interview” (p. 272).
An additional problem in finding spatial data is not finding spatial data. Although the search and recover operation may have paid off, Leeuwenburg (1982) provided several reasons why a resource needed may not be found: “item checked out; item stolen; item misfiled; item doesn’t exist; item never possessed by library; or librarian can’t find item” (p. 10, 11). While that was written some time ago, several of the possibilities remain current. Unfortunately, map theft is an ongoing concern with map collections, especially given the ease of selling maps online. Also, few libraries have ever included print maps for interlibrary loan due to the fragile status of paper maps, awkward sizes, and weight of some resources. However, this is less likely a problem today with the advent of map libraries scanning rare and historic map collections and placing digital versions online.
Landsat imagery datasets in the past were quite expensive, required appropriate software, larger computer server space (for that time) and were rarely, if ever, shared; again, these are minor or nonexistent problems today. Finally, Larsgaard (1998) provided some of the best advice when she stated that “the most powerful tool the librarian has to answer the tough question is the address (or if you prefer, the coordinates) of other map librarians” (p. 273).
What happens when the reference-desk librarian is puzzled by a request? Help from the physical or electronic location of the geospatial resource-reference-savvy colleagues may impact the length of time needed to answer questions and fill requests. Having nearby colleagues is ideal; yet, the next best solution is to belong to a strong electronic network of knowledgeable colleagues through map librarian-to-librarian professional support groups.
Just as the map may have simplified the layout of roads in Los Angeles at the turn of the 20th century, see Fig. 8.2, a network of supporting professionals should help to enhance and refine map reference librarianship knowledge, skills, and abilities. A map librarian-to-librarian network is facilitated by social media with both one-to-many communication such as listservs and Facebook or one-to-one including email, phone, or instant messaging-chat communications. Posing a question to the entire subscribing membership of a listserv creates a powerful reference advantage utilizing collective wisdom and locations for hard-to-find data or maps. Also, reviewing archives of listservs creates the potential for proactive solutions for future questions and concerns. Joining and contributing to professional organizations provide access to expert support through newsletters, journals, conferences, and more.
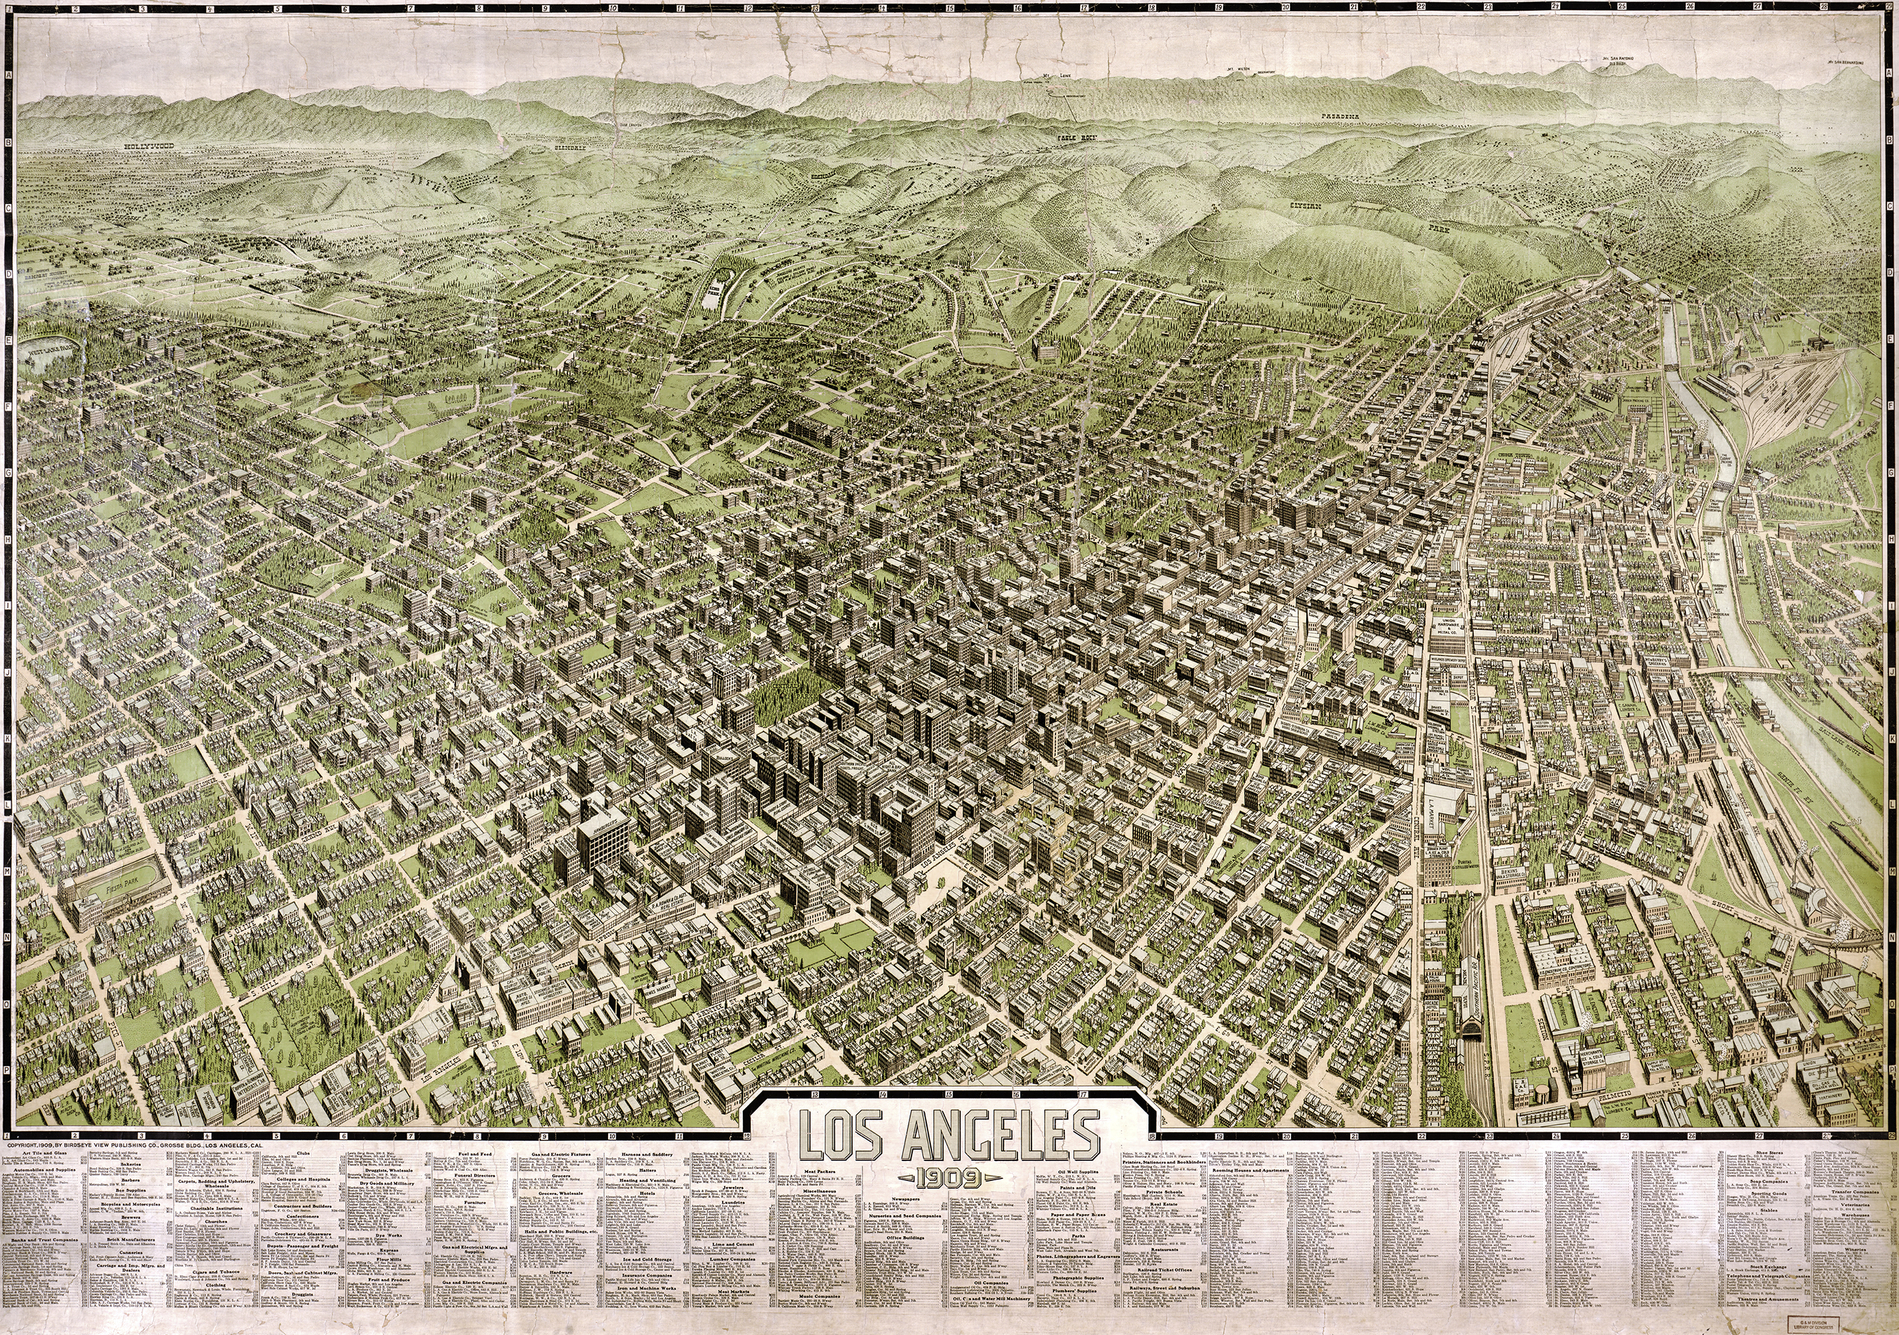
The purpose of professional organizations is to support member professionals and students with helpful services such as professional development, job announcements, scholarships, and conferences along with mentoring, networking, and communicating via social media. Students may benefit greatly by interacting with the professions in the field and could join most groups at an affordable level of dues.
What follows is not a complete listing of all networking opportunities among the many state and regional professional library support groups, but it highlights the larger national and regional organizations specific to maps and geospatial data sources. The first example is part of Special Libraries Association (SLA), a nonprofit group organized in 1909 by John Dana (Special Libraries Association, 2016). The first published article devoted to map librarianship, Training for Map Librarianship, was in the SLA journal, Special Libraries (Woods, 1952). In the same journal, Courses in Map Librarianship was published (Kiraldi, 1970).
Geography and Maps (G&M) has the longest history of any map library professional organization. G&M was a SLA Division from 1941 through 2003, at which time the G&M membership group became a part of the Social Sciences Division. Today, the G&M section “includes the professions of geography and map librarianship, as well as GISs, and the acquisition and utilization of geographic and cartographic materials” (Special Libraries Association, 2011). SLA had a listserv and wiki, which are archived but were replaced in Aug. 2016 with SLA Connect.
The organization’s journal Special Libraries was published from 1910 to 1996 with 87 volumes (San José State University, n.d.). The journal emphasized cataloging and indexing, organization activities, articles, and book reviews. G&M had a printed events newsletter, The Bulletin, from 1947 until 1997 and newer issues are online from 2003 to 2009. As an example of past continuing education, the 2006 Bulletin advertised a course for G&M members, “GIS for the special librarian: A hands-on introduction to mapping with ArcGIS.”
The Geoscience Information Society (GSIS) was formed Mar. 3, 1966 and represents all aspects of the geosciences, including maps, geospatial data, and software for remote-sensing interpretation and mapping. Specifically, GSIS “…facilitates the exchange of information in the geosciences through cooperation among scientists, librarians, editors, cartographers, educators, and information professionals” (Geoscience Information Society, n.d.a). GSIS is a member society of the American Geosciences Institute (AGI) and is an associated society of the Geological Society of America (GSA), the main professional organization for geoscientists.
Annual meetings are a time to interact with and hear the newest research from professionals. The GSIS annual meeting is held at the same time and venue as the GSA annual meeting. GSIS is given a dedicated session open to all attending the GSA meeting with technical papers, poster session, exhibits booth, business and social meetings, and a field trip. In addition, there is a workshop for library students and professionals divided into instruction, reference (Winkler-Hamalainen, 2015), collection development, and resources (Geoscience Information Society, n.d.b). GSIS communicates through publications and listserv. Publications include the member webpage, listserv, newsletter, conference proceedings with subject index (Geoscience Information Society, n.d.c).
The Western Association of Map Librarians (WAML) was formed in 1967 as an independent group of map librarians with a purpose “to encourage high standards in every phase of the organization and administration of map libraries” (Brendle-Moczuk, 2015). There is an annual meeting and online index of past meetings since 1970. The 2016 annual meeting was held in the David Rumsey Map Center, Stanford University Library.
The organization’s journal, Information Bulletin, has articles and resource reviews. Available online is a 45-volume index from 1969 to 2014. The webpage links to principal Western Region Map collections (Western Association of Map Librarians, 2015). There is a 20-year archive for News & Notes, noteworthy reports from 1994 to 2014 and many useful links to resources at the WAML Toolbox (Brendle-Moczuk & Zellmer, 2015).
The Association of Canadian Map Libraries and Archives (ACMLA) was founded in 1967 to represent map librarians and cartographic archivists through a “…vigorous publishing program, development of professional standards and international cataloguing rules, and efforts to increase national awareness of issues concerning spatial information and recognition of the contribution of map libraries and cartographic archives” (Association of Canadian Map Libraries and Archives, 2013). As in the United States, the ACMLA preceded academic course work as “…the first course in map librarianship was taught in the summer of 1970 by Joan Winearls at the School of Library Science, University of Toronto” (Association of Canadian Map Libraries and Archives, 2013).
A publication was first issued in 1968 and since 1988, the group maintains the scholarly journal, ACMLA Bulletin (ACMLA Bulletin, 2016). Online resources include free Canadian geospatial data and the ACMLA cartographic citation guide (Wood, 2012), a comprehensive guide to citing map and geospatial resources based on principles of the ACMLA Bibliographic Control Committee and Kollen, Shawa, and Larsgaard (2010). Links to information can be found at the ACMLA website including Historic Maps, Meeting Minutes, Monographs, and a section titled Useful Tools that has a variety of resources.
ALA came into existence in 1876 and MAGIRT in 1979, officially recognized as a group by ALA in 1980 (Weimer, 2011). MAGIRT has many informative open-access, full-text documents online. One of the earliest publications is the Meridian (1989–1999); it was a joint effort by MAGIRT and WAML and published articles on history of cartography, GIS, and map librarianship. All Meridian issues are online. Though short-lived, Coordinates (2005–2011) was an online serial with quality peer-reviewed articles and essays (Allen, 2005). MAGIRT has a regular newsletter, base line (1980–present), a venue for meeting minutes, liaison reports, map reviews, and Great Moments in Map Librarianship, which is a cartoon drawn by member Jim Combs.
Both the listerv discussion group and Twitter have archived postings available. Finally, members are on ALA Connect, a virtual, collaborative, workspace online, for communities of interest to interact via instant messaging, and there are extensive resource guides (MAGIRT, 2016). A detailed, comprehensive publication on how to reference maps, aerial photos, geospatial datasets, and more are in the Cartographic Citations: A Style Guide (Kollen et al., 2010).
The North American Cartographic Information Society (NACIS) was founded in 1980 for map librarians and geographers, academic and professional (North American Cartographic Information Society, n.d.a). The main objectives are to improve communication among producers to users and coordinate activities with other cartographic organizations. The society provides continuing education regarding acquisition, preservation, and retrieval efforts for cartographic resources.
There are student map competitions and awards as well as student or member travel grants. NACIS has a published journal, Cartographic Perspectives and an online archive (North American Cartographic Information Society, n.d.b). Cartotalk is an online discussion forum, and Natural Earth, a public-domain dataset at different scales, is available for download.
The International Federation of Library Associations and Institutions (IFLA) formed in Scotland, September 1927, and it provides the “global voice of the library and information profession” for some 140 countries and (IFLA, 2016). Within the IFLA, the Geography and Map Libraries started as a subsection of Special Libraries Division in 1969 and became a full working group by 1973. It was devoted to map librarianship with a focus on preparing guidelines and standard recommendations, organizing seminars, and training sessions such as one on map curatorship (Larsgaard, 1998, p. 299).
Although this was the second oldest professional society devoted to map librarianship, membership in the Geography and Map Libraries section of IFLA declined and the group disbanded by 2012 (Weimer, 2011). Several webpage portals from the 1990s are archived: Digital Map Librarianship, Copenhagen, 1997 (IFLA, 1997), and Digital Map Librarianship: A Working Syllabus (IFLA, 1998), Geography and Maps Library Section (IFLA, 1994–2009).
The Cartographic Users Advisory Council (CUAC) began in 1983, as a committee designed to act as collaborative network among two ALA round tables, MAGIRT and GODORT, and later with representation from GSIS, G&M of SLA, Northeast Map Organization (NEMO), and WAML. While CUAC was made up of representative members from professional groups, the mission was to work on behalf of all public, academic, and special library associations and map librarians in commercial employment.
CUAC formed to provide a “…unified effort to enhance the distribution and knowledge of the cartographic products of U.S. government agencies.... to improve public access to these materials… and to heighten agencies’ awareness of the value of their cartographic products to the public” (Newman, Koepp, & Zellmer, 2008). Each year, CUAC members hosted an annual meeting where invited government agency speakers presented updates on map and geospatial data projects and products. For example, some of the mapping agencies solicited included USGS, U.S. Department of Agriculture (USDA), National Oceanic and Atmospheric Administration (NOAA), and Environmental Protection Agency (EPA), among others. The Council encouraged speakers to include their published cartographic materials in the Federal Depository Library program, along with specific indexes and acquisition tools for ease of public use.
CUAC held its last annual meeting in 2013 and disbanded in 2014. The group’s archive was deposited in the University of Illinois, Urbana-Champaign Archives. Ironically, this is the same archive that curates documents of the first LIS map course taught at a university.
The Northeast Map Organization as founded in 1986 and dissolved in 2013, after 27 years of service. A webpage was maintained in 2016 with links to past NEMO journals (Bertuca, 2016) and extensive Map Catalogers Tool Box (Bertuca, 1999–2016).
In addition to connecting with resources and people in professional organizations, map librarianship journals and online discussion lists keep librarians up-to-date. The Journal of Map & Geography Libraries is a peer-reviewed publication, started in 2004, covering all aspects of traditional to e-map and e-geography librarianship. Research Gate (2008–2016) described the journal as publishing “international research and information on the production, procurement, processing, and utilization of geographic and cartographic materials.”
While map and geospatial professionals publish in a variety of LIS journals, another publication for GIS librarianship is Issues in Science & Technology Librarianship. This journal associated with the Science and Technology Section (STS) of the Association of College & Research Libraries (ACRL). A recent example of interest to reference librarians is Scarletto’s (2013) report on research involving GIS instruction; she found the most requested topical area for applying GIS was health, and a main concern for librarians was to identify which available datasets were georeferenced.
MAPS-L listserv is a discussion list for any librarian or professional who works with cartographic, geographic, and remote-sensing information (MAPS-L@LISTSERV.UGA.EDU, 2016). It is an avenue for offering discarded maps and posting job announcements as well as specific questions regarding a request for a rare map resource or RDA cataloging. It is one of the oldest listservs, popular among map and geospatial librarians and has open archives online from April 1993 to present (Archives of MAPS-L@LISTSERV.UGA.EDU, 2016). History of Cartography listserv existed from 1994 to 2012 at which time, no new members were accepted; the forum continued as MapHist News & Discussion until this was closed January 2015 (van der Krogt, 2011).
A final consideration for the reference librarian in this chapter is citing and referencing sources. Earlier, it was noted that in defining reference, one meaning was as a word or phrase pointing to an original source, which equates reference with citation. Therefore, a reference transaction is not complete until the librarian explains that visual information should be treated as textual information—it must be attributed, cited, and referenced. It is important for librarians to explain that the concepts of public domain and fair use simply mean formal permission to use the resource does not need to be requested from the author or cartographer in advance of using it. However, by not attributing or citing the source, the implication is that you created the work. Intentional or unintentional, taking credit for another person’s work is plagiarism.
A common reference-desk question is how to cite a source using a specific reference style. While librarians may not be experts on all styles, many libraries have subscriptions to citation tools such as RefWorks and copies of books of major citation styles at the reference desk (Lewis, 2008). Concepts such as fair use, copyright, public domain, and the Creative Commons were introduced in Chapter 7. Specifically, starting with Creative Commons 4.0 license agreements, the default setting makes attribution of source mandatory. Attribution is one way of recognizing the copyright holder of a work, but complete citing and referencing is also the best way to avoid plagiarism.
The common knowledge definition for plagiarism is using another person’s words or ideas without giving credit. This delineation infers plagiarism applies only to text-based publications and suggests it is an intentional act. Harris (2011) provided a better definition in that “plagiarism occurs when an information source is not properly credited” (p. 81). Harris (2011) suggested all external knowledge or information from outside your own head should be cited (p. 85). A list was provided for external knowledge source types: book, computer program code, data, drawing, graph, journal, photograph, survey, table of information, video, and website; in addition, a list of included formats were: print, digital, live, and audio-visual (Harris, 2011, p. 85). Maps, although not explicitly mentioned, are certainly included along with geospatial data as external knowledge sources.
The main reasons why one should cite external knowledge sources are to identify the original source of the citation, to honor the creator, and to avoid plagiarism (Harris, 2001, 2011). The main misconceptions to not citing sources are that the resource copyright has expired, or that the resource is fair use, in the public domain, or on the Web, where all information is common knowledge. To refute misconceptions, expired copyright, fair use, and public domain are not synonymous with common knowledge and the source needs to be cited. Again, fair-use status means written permission and royalty payments are no longer needed to use the resource (Harris, 2011, p. 88, 89). Finally, most information on the Web is not common knowledge. Some websites are misleading opinions, rather than fact, and regardless of content and format, the same fair-use, public-domain, and copyright rules apply and sources should be cited (p. 90).
Plagiarism is not new with the advent of the Web. Pliny the Elder wrote in his 1st century Historia Naturalis publication that “…in comparing various authors with one another, I have discovered that some of the gravest and latest writers have transcribed, word for word, from former works, without making acknowledgement” (as cited in Harris, 2001, p. 61). Librarians have little influence with human behavior and intentional plagiarism. However, one of the main, unintentional reasons why people do not cite and reference is ignorance (Harris, 2001, 2011). Ignorance of reference styles leads to mistaken, inconsistent, and incomplete citations and librarians excel at instruction on citing and referencing.
A written copyright policy should be available at every map library. The policy should clarify concisely: (a) what materials need permission to reproduce and use and what do not, (b) which forms are needed to request permission for use in commercial applications, and (c) how citations should appear. The University of Texas at Austin, Perry-Castañeda Library Map Collection, could be used as an example (The University of Texas at Austin, 2016b). A link for the Material Usage Statement is at the bottom of each webpage. The first paragraph in The University of Texas at Austin (2016a) Material Usage Statement affirms:
Materials that are in the public domain such as images from the Portrait Gallery or most of the maps in the PCL Map Collection are not copyrighted and no permission is needed to copy them. You may download them and use them as you wish. We appreciate you giving this site credit with the phrase: ‘Courtesy of the University of Texas Libraries, The University of Texas at Austin.’
The next section describes material where the University holds the copyright. Copyright material “may be quoted or reproduced for educational purposes without prior permission, provided appropriate credit is given” (The University of Texas at Austin, 2016a). The suggested credit after gaining permission is “Used by permission of the University of Texas Libraries, The University of Texas at Austin” (The University of Texas at Austin, 2016a). A link to a feedback form is provided, and the publisher permission form would be attached along with the request for permission to use. The last section is on materials where copyright is held by owners other than the university. It is suggested to visit the UT Austin policies for acceptable use and the Digital Millennium Copyright Act, for further explanation.
The Library of Congress (2015) provides legal information and states when possible “the Library of Congress provides factual information about copyright owners … as a publicly supported institution, we … do not own the rights to materials in our collections … and do not grant or deny permission to publish or otherwise distribute them.” Permission and fees could be required from the copyright holder, and this responsibility is placed on the user to determine.
Finally, for a public library perspective, review the information given at the New York Public Library (2013). The New York Public Library (NYPL) has a substantial Map Collection and as of 2013, had 17,000 digital images online (New York Public Library, 2016). As in the other map libraries, it states that the library does not hold the copyright to images. However, this does not mean the images are free to use. Also it states that when materials are used from their website, NYPL must be credited. Specifically, credit should be given with a link directly to the permalink provided and if there is no permalink, hyperlink via the URL for where the material is displayed. Suggested credit is “Courtesy of The New York Public Library. www.nypl.org” (New York Public Library, 2010).
Map and geospatial librarians could promote awareness of the fact that just as books and blogs need citation, maps and geospatial data resources need citation. Likewise, audio/visual and digital format types need citation as well. Furthermore, the first editions of most citation style manuals were published before the Internet and still do not adequately address electronic sources. The basic elements or types of information for all citations include who, when, what, and where. For some styles, format of the source such as print or digital as well as the date electronic information was accessed is also required. Regardless of which citation style is used, data likely needed about the source include: who—author(s); when—date; what—title by source type such as book, website, article, edition, volume, issue, pages; where—location of publisher, and publisher or producer name (e.g., government, commercial, database, etc.).
There are several hundred to several thousand citation styles (CiteThisForMe.com, 2014). Gill (2013) has long advocated for one standard system. On closer inspection, many citation styles are adaptations or interpretations of one of the well-known citation styles. The reason for another “new” reference style may be because discipline-specific resource types were not addressed by other styles (e.g., map and geospatial data resources). This plethora of reference styles leads to confusion and inconsistencies.
Four main citation styles were established by The University of Chicago Press (CMS) (2010), primarily adopted by the Humanities; the Council of Science Editors (CSE) (2014), adopted by some fields of study in the natural sciences (Pinantoan, 2013); the Modern Language Association (MLA) (2016), primarily adopted by English; and the American Psychological Association (APA) (2016), primarily adopted by Social Science. There are many other styles used in various academic disciplines, with no one single standard adopted by all. To contrast these four main styles, basic forms and examples for a book resource with one author follow:
CMS
Lastname, Firstname. Title of Book. Place of publication: Publisher, Year of publication.
Larsgaard, Mary L. Map Librarianship: An Introduction. 3rd ed. Westport, CT: Libraries Unlimited, 1998.
CSE
Author, A. A. Year of publication. Title of work: no capital letter for first word in subtitle. Edition. Place of publication: Publisher. Extent. Number of pages.
Larsgaard, M. L. 1998. Map librarianship: an introduction. 3rd ed. Westport, CT: Libraries Unlimited. 487 p.
MLA
Lastname, Firstname. Title of Book. Publisher, Year of Publication.
Larsgaard, Mary, L. Map Librarianship: An Introduction. 3rd ed., Libraries Unlimited, 1998.
APA
Author, A. A. (Year of publication). Title of work: Capital letter for first word in subtitle. Place of publication: Publisher.
Larsgaard, M. L. (1998). Map librarianship: An introduction (3rd ed.). Westport, CT: Libraries Unlimited.
Regardless of citation style, maps look different than books. There are citation elements in common such as author, date, title, location of publisher, and publisher name. The main differences between book and map are that map medium and scale follow the title. For maps, the author is the cartographer(s) or agency, publisher, or producer responsible for the map. Next is the date and following the date is the title. When a title is missing, a short description of the map is given instead; for example, “Population density of Harvey County” or “Regional geologic cross-section of the Badlands National Park.” After the title, a description in brackets is given, which is followed by the scale, location, and name of the publisher, if known. If the resource is in a repository include the name of collection, collection number, call number, box number, file name, in addition to the repository name and location. If the map was retrieved via an online source, the message “Retrieved from” followed by the URL goes at the end.
There may be many dates or no dates on maps, which causes confusion. The main date is the year the map was officially published for the first time, which is typically under the title along the bottom border, right side, or centered on the map. In Fig. 8.3, the original published date is 1950; however, this map was revised in 1983, which becomes the published date.
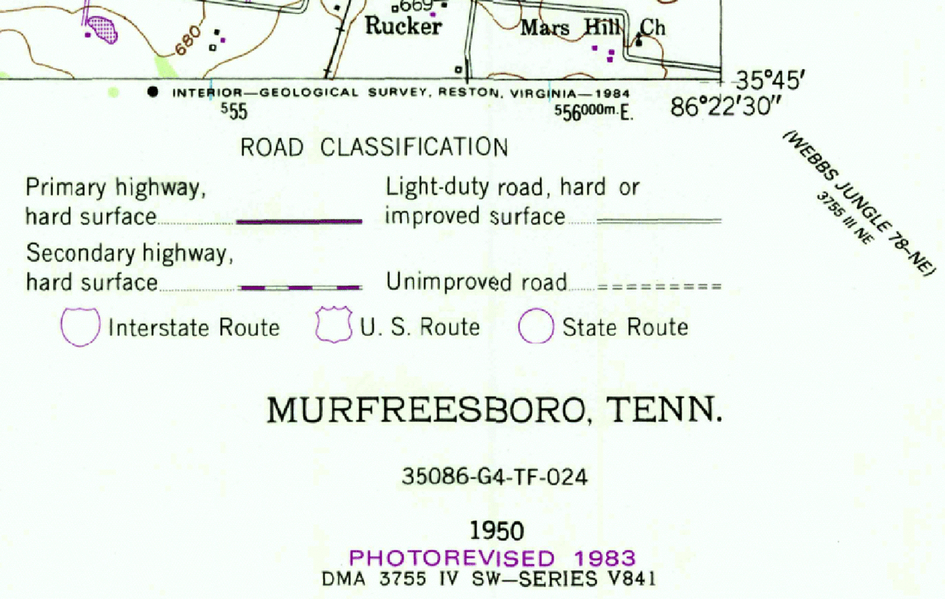
For print topographic maps prior to ~ 2010, the date of actual printing was listed, since the sheets could be reprinted many times after the initial release and first date of publication. Another date on maps may be for the information used to make the map, which could be added in the title of the citation entry if relevant. If another edition such as a photorevision is given, provide this after the title. A photorevision is when a map is updated using aerial photography, which is often found in the 7.5-minute topographic series first published before 2010. In 2009, this series of map production began the move to GIS. If no date is given, use the abbreviation, “n.d.” If the citation is for a real-time map, date and time are recorded in brackets along with the description. Several examples follow to summarize the main citation elements as applied to maps.
This is a generic template for a traditional print map citation in APA style with all potential elements included:
Author. (Year and date/time if necessary). Title in italics (Edition and revisions if necessary) [Type of medium]. Scale. Name of Collection and Collection number and location within the collection if the resource is a historic or special collection. Name of Repository, City, State Abbreviation. Retrieved from http://www.full.url/example
Here are two actual examples using this format for typical map resources, one with an individual author and one with an agency as the author.
Tweto, O. (1979). Geologic map of Colorado [Map]. 1:500,000. Reston, VA: USGS.
U.S. Geological Survey. (1957). Emporia quadrangle, Kansas [Map]. 1:24,000. 7.5-Minute Series. Reston, VA: U.S. Geological Survey.
Cartographic citation guides often originate at academic libraries and are based on the CMS style and the publication, Cartographic citations: A style guide (Kollen et al., 2010). Given that CMS and MLA are similar in style, what follows is a style guide for cartographic materials based on APA reference style and APA Style Blog (McAdoo, 2015). As we saw in Chapters 2 and 7, there are a variety of sources and types of map and geospatial information, and the APA style manual may not cover each specific possibility. This section is not exhaustive but describes proper citation for common geospatial resources.
Complete Atlas
Author. (Year). Title of map (edition) [Type of medium]. Scale. Place of publication: Publisher.
DeLorme. (2009). DeLorme Pennsylvania Atlas & Gazetteer (11th ed.) [Atlas-Gazetteer]. 1:150,163. Yarmouth, ME: DeLorme.
An Individual Map in an Atlas
Map author. Map or Plate title [Type of medium]. Scale. In A. A. Author of atlas, Atlas title (edition). Place of publication: Publisher. Year, page.
Rand McNally. Louisiana [Map]. 1 in = approximately 21 mi. In Rand McNally, The 2014 Large Scale Road Atlas (90th Anniversary ed.). Chicago, IL: Rand McNally. 2014, 90.
Bird’s Eye-View
Author. (Year). Title of map (ed.) [Type of medium]. Scale. Place of publication: Publisher.
Birdseye View Publishing Co. (1909). Los Angeles, 1909 [Map]. No scale. Los Angeles, CA: Birdseye View Publishing Co. Retrieved from https://www.loc.gov/item/2005632465/
A Map in a Series
Maps are often created as a part of a larger series, such as USGS topographic maps. Even though each sheet in the series is an independent map, the combination of maps could provide complete coverage of vast areas when positioned adjacent to one another. Other series may be focused on thematic content rather than spatial proximity. The USGS created topographic maps in a 15-minute series (~ 1890–1950) and a 7.5-minute series (~ 1947–1992). In addition, there is a 100k scale series and 250k-scale series, as well as more map series including county, state, and National Park maps, see Chapter 2 for more information.
Author. (Year). Title of map (ed.) [Type of medium]. Scale. Series, number. Place of publication: Publisher.
Marshall, R. B., Sutton, F., McBeth, J. G., Slaughter, T.F., & Wells, C. S. (1916, reprinted 1941). Tenn Murfreesboro (1916 ed.) [Map]. 1:62,500. 15-Minute Series. Washington, DC: U.S. Department of the Interior Geological Survey.
U.S. Geological Survey. (1983). Murfreesboro, TENN (1950 ed., photorevised 1983) [Map]. 1:24,000. 7.5-Minute Series. Reston, VA: USGS.
McElfresh Map Co. (1993). The battlefield of Shiloh, Tennessee, [Map]. 1:15,840. Civil War Watercolor Map Series. Olean, NY: McElfresh Map Co.
A Map in a Book
According to Perrin (2012), a map, graph, table, or chart in a book is treated like a text selection or chapter in an edited book (p. 103). Include the map’s author in addition to the authors of the book. The example below for a map included in a book was taken from Perrin (2012, p. 104):
Map author. (Year). Title of map (ed.) [Type of medium]. Scale. Place of publication: Publisher. In A. A. Author & B. B. Author, Title of book (pp. of map). Location: Publisher.
Munro, R. (1882). Plan of lake-dwellings in La de Bienne, Lac de Morat, Lac de Neuchatel, and Correction des Eaux du Jura [Map]. 1 cm = 5 miles. In B. Coles & J. Coles, People of the wetlands: Bogs, bodies and lake-dwellers (pp. 27). New York, NY: Thames and Hudson.
A Map or Aerial Photograph in a Periodical or Academic Journal Article
Author. (Year). Title of map (ed.) [Type of medium]. Scale. Title of article. Title of Periodical, volume number(issue number), page.
Duffy, J. P. (2016). Seagrass meadows in northern Greece [Aerial photograph]. No scale. A 21st-century renaissance of kites as platforms for proximal sensing. Progress in Physical Geography, 40(2), 357.
Relief Model
Author. (Year). Title (edition) [Type of medium]. Horizontal scale; Vertical scale. Place of publication: Publisher, Date.
Raven Maps & Images. (1993). Colorado (1st ed.) [Relief model]. 1:1,000,000; Elevation from 914 m to 3648 m. Fort Collins, CO: Hubbard Scientific.
A Static Map on the Web
The interactivity of the Internet can be confusing when defining what is considered as a static map. For clarification, static map refers to a noninteractive, nonanimated digital image such as a jpg, png, or gif. It is possible to have an html image map that defines hyperlinks in connection with a static map, although the use of image maps is largely discouraged today due to issues of accessibility. An html image map used on a static map does not meet the criteria for a map to be considered dynamic.
Author. (Year). Map title [Type of medium]. Scale. Title of the complete document or site. Retrieved from http://www.full.url/example
Kansas Energy Information Network. (2001–2014). Operating and proposed wind farms in Kansas February 2014 [Map]. 1 in = 60 mi. Retrieved from http://www.kansasenergy.org/wind_project_map_utility.htm
A Dynamically Generated Map or Geospatial Data
Dynamic maps in the context of the Internet describe maps that allow the user to change the map’s view and scale. This includes services such as Google Maps, Bing Maps, MapQuest, and many other sources. For maps that involve real-time data such as weather maps, an exact time of retrieval is necessary, as opposed to merely including the date. The APA manual recommends interactive maps and graphic spatial data give the name of the research organization, followed by the date, a brief explanation of the type of data, format, and retrieval date/time in brackets, the scale if it has one, then add the project name and retrieval information (Paiz et al., 2015).
Author/Research Organization. (Year). [Brief explanation of data type and format]. Scale. Project name. Retrieved from http://www.full.url/example
Kansas Biological Survey. (n.d.). [Dynamically generated map August 16, 2016]. Dynamic scale. Kansas natural resource planner. Retrieved from http://kars.ku.edu/maps/naturalresourceplanner/
Aerial Photograph
Author. (Date of collection, not date of reproduction). Title or frame number [Aerial photograph]. Scale. Flight title if part of flight series. Place of publication: Publisher.
Department of Agriculture, Farm Service Agency. (1957). Clay County Aerial Photography, 1957 [Photograph]. 1:20,000. CA-4T-6. Retrieved from http://digital.shsmo.org/cdm/ref/collection/aerial/id/621
Satellite Data
Author. (Year). Title or Scene ID [Type of Medium]. Satellite and sensor name if necessary. Place of publication: Publisher. Day month year of image collection.
NASA Landsat Program. (2014). Landsat 8 OLI/TIRS scene. LC80200352014165LGN00. Level 1T [Remote sensing data]. USGS, Sioux Falls, SD. 14 June 2014.
Profile Section or Geologic Cross section
See Figs. 8.4 and 8.5 below for illustrations of the difference between profile and cross sections for the references.
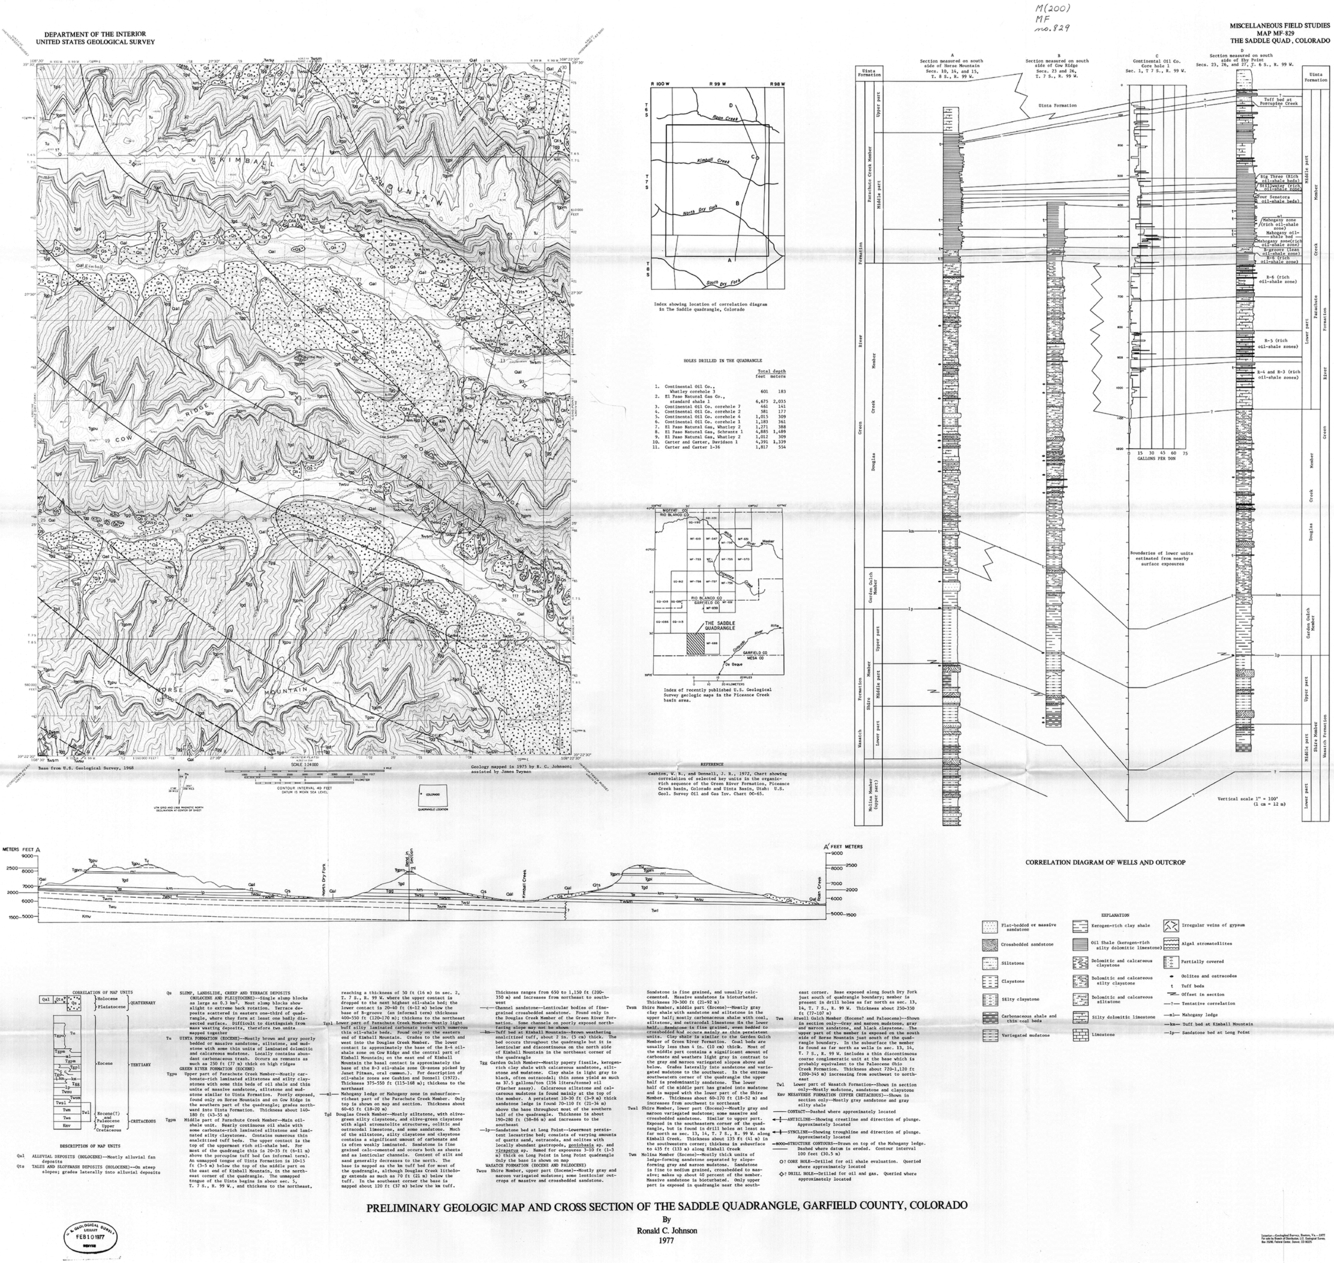
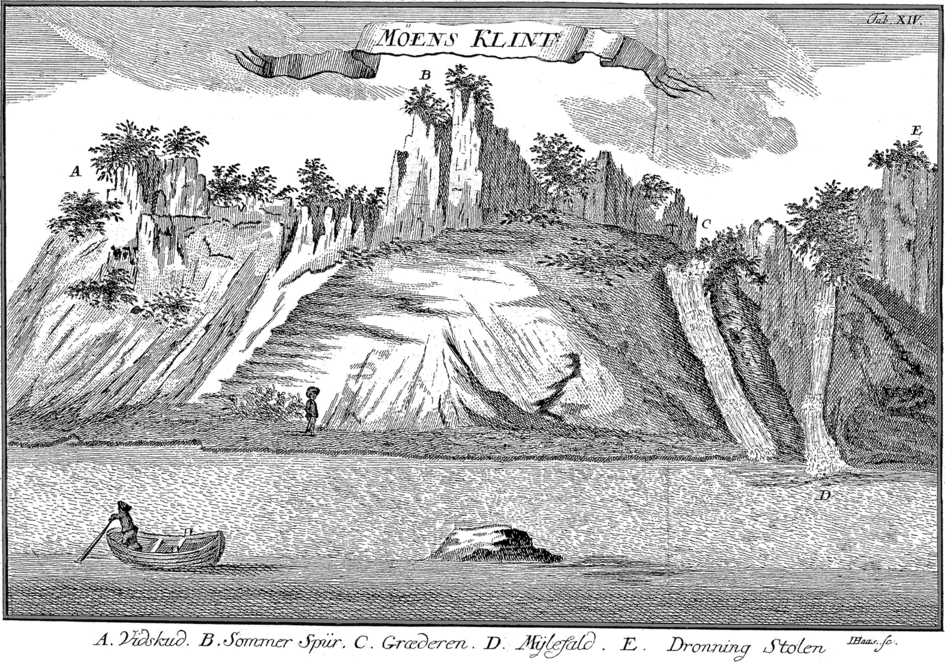
Author. (Year). Title of map (ed.) [Type of medium]. Horizontal scale; Vertical scale. Place of publication: Publisher.
Johnson, R. C. (1977). Preliminary geologic map and cross section of the Saddle quadrangle, Garfield County, Colorado [Geologic cross section]. 1:24,000; 40 ft contour interval. Reston, VA: U.S. Geological Survey.
GIS data
Author. (Year). Title of data [Type of medium]. File type format. Place of publication: Publisher.
U.S. Census Bureau TIGER. (2014). tl_2014_us_state [GIS data representing U.S. state boundaries in 2014, Esri Shapefile]. Washington DC: U.S. Census Bureau. Retrieved from ftp://ftp2.census.gov/geo/tiger/TIGER2014/STATE/
Map-related questions for the reference desk librarian involve nonbook format answers and resources. The same methods librarians use for locating books and journals apply to map and geospatial data, just differing databases and search terms. Typical reference questions should be anticipated with user profiles in mind, so appropriate resource guides can be recommended and used. Familiarity with map librarian support groups and resources ease the task.
In addition, reference encounters should be viewed as opportunities for communicating and sharing spatial information and resources, showcasing library resources, as well as refining detective skills and expanding perspectives beyond the familiar books and journals. Visualization is a natural way to convey information, and placing maps or satellite images near signage indicating the map collection area would allow people to know these resources exist in the library. Also, it is an effective means for marketing the map library and librarianship.
Proper citation of sources is always important, and geospatial resources are no different. The major citation styles largely ignore map and geospatial products, and this overview of how various sources could be cited in the APA style may provide some guidance on proper format.
A relevant and organized collection development plan is a prime consideration for neomap and traditional map librarians. Collection development refers to the policy that guides librarians in selection, acquisition, and management of maps and other geospatial data resources. Many factors and considerations are involved from funding sources to knowing the users and uses. Digital philanthropy helps to build collections and open private collections to the world.
Collection development; Management; Selection; Acquisition; Digital philanthropy
Collection development is the heart of any library. Map library collection development includes the plans and implementation for selection, acquisition, and management of maps and supporting cartographic resources needed to build a viable map and geospatial data collection. The traditional map library may contain print and globe resources, and the contemporary map library houses visual and geospatial data to complement existing physical collections.
Abresch, Hanson, Heron, and Reehling (2008) pointed out that new approaches and technologies are needed when identifying needs, acquiring resources, and managing the collections of geospatial information and GIS capabilities. Digital geospatial data require appropriate computer software and hardware systems as well as software company licensing agreements. This involves considerable expense associated with the equipment plus staff and knowledgeable map and geospatial librarians to set policy and manage resources.
These considerations highlight the importance of geoscience content knowledge for map librarians, and also a careful and thorough study of community information needs and potential shared resource opportunities (Abresch et al., 2008). An information needs study could lead to a well-crafted collection development policy that defines and guides a balanced, traditional, and contemporary map and geospatial data collection. The use of these resources crosses many fields of study, and formal recognition of the importance of maps by librarians demonstrates an understanding that people navigate life through the visualization of information.
There are many issues to be considered in collection development. In addition to understanding content areas, assessing current and potential clients is accomplished by adopting a user-centered focus. Larsgaard (1998) suggested that librarians observe users and use patterns to formulate profiles specific to their library setting. Tracking reference inquiries and assessing proactive reference services are two methods that help to acquire this information. However, special considerations may be needed in a map and geospatial data community analysis, because if current or potential library users are not aware of the map collection, they may not be making inquiries and are, thus, unable to be observed and tracked.
In contrast to waiting for them to come to the librarian, online resource guides are a great promotion tool for the collection. By adding contact information for the librarian on a resource guide webpage, constructive recommendations from potential clients to add or eliminate resources could be gathered. However, there are more effective ways of gathering library use and user information utilizing the resources of a map library.
The Institute of Museum and Library Services (IMLS) survey for 2013 revealed an overall increase in use of public library materials and services and participation in programs over the past decade. The survey covered 97% of U.S. public libraries, which include more than 9000 libraries with 16,500 branch facilities and bookmobiles (Schadt, 2016). While there is no one single factor to explain the increase in all U.S. libraries, a Kansas public library district engaged a consulting company to better target local library patrons through GIS analysis of common features with community profiles (Baumann, 2010). By identifying potential users, librarians were able to focus, develop, and market services effectively.
In this example, the library served a population base of 173,000, spread over more than 500 square miles. Librarians needed to know “…who is using the library, how they are using it, what they aren't using, what they might be interested in using, and who isn't using library services” (Millsap as cited in Baumann, 2010). The consultants correlated patron demographic data with circulation, materials, and program attendance. Data helped to classify neighborhoods into distinctive segments. This GIS analysis identified that 53% of the library district population used the main facility and the remaining 47% were fragmented across 24 distinct segments. Results showed inner city tenants were 1% of the population, but 77% of these library patrons had the fifth-highest average checkouts (Baumann, 2010). In other words, the library was providing exceptional service to inner city residents, who are often considered underserved. Furthermore, results showed that family-oriented segments where the potential to increase children and young adult patronage was high, only 39% were current library users (Baumann, 2010). The librarian's solution was to increase rural community visits using four bookmobiles and new store-front facilities as outreach services in underserved areas. This study and subsequent increase in library usage earned the Topeka and Shawnee County Public Library the highest honor in the U.S. and Canada, Library of the Year for 2016 (Berry, 2016; Hrenchir, 2016). Ironically, this GIS strategy worked to identify a means for increasing library circulation by utilizing some of the same powerful resources found in map and geospatial libraries.
Although listing all strategies for assessing and anticipating community needs are beyond the scope of this book, the GIS example above along with online assessments and survey instruments are effective ways to create library user statistics (Futterman, 2008; Library Research Service, 2016). Once needs are assessed, a plan for developing collections should be designed. One thorough, online guide to collection development training for librarians is at the Arizona State Library, Archives & Public Records. A continuing-education opportunity offered there, has “…self-guided modules providing practical training in how to perform collection development activities in public libraries” (Arizona State Library, Archives & Public Records, 2015a). The course introduces library selections with a list of typical resource books, periodicals, Internet resources, and government documents. The course continues with sections on defining special collections, acquisitions, gifts, and weeding, with the last task being the deselection of resources. Finally, the course covers preserving resources, assessing the collection, and writing an effective collection development policy.
Another way to get to know users and uses of maps and GIS is to gather first-hand information by directly talking with people. As an example, students in a map librarianship course were assigned to investigate use and users of map resources through informal survey, interview, and observation methods, using a purposive sampling technique. Students spoke with friends, relatives, acquaintances, and professionals, and collected data using a variety of situations such as face-to-face or via phone, text, chat, email, Facebook, Skype, and listserv postings. Some of their results follow.
Over the years of collecting data from hundreds of map users, fewer than five participants adamantly denied ever using a map. There were no demographic restrictions, yet participants in the student's studies have been mostly male and in the 30–60 year age range. Table 9.1 is a sample of participant's occupations.
Table 9.1
Sample of map and GIS users' occupations
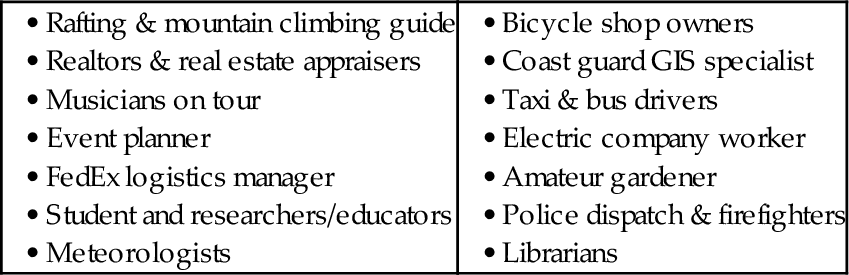
Some used maps in professional ways, while all used maps in personal lives. A surprising theme was the number of people who preferred print maps over digital in some situations. Some print map stories were nostalgic; for example, one participant recalled she loved looking at AAA maps on road trips so she could see where they were in relation to others and gauge distance to the next destination with the map scale. Others who used print maps for boating, hiking, biking, and climbing mentioned problems with digital display devices including batteries, sun glare on screens or polarized sunglasses obscuring the image, loss of connectivity signal, and not being able to see the bigger picture. Table 9.2 is a sample of preferred print and digital map types.
Table 9.2
Sample of preferred map type and format
| Print maps | Digital maps |
|
• U.S. Forest Service/National Park • Road Atlas/Gazetteer • Historic Maps • National/Global classroom maps • Nautical Charts • Puzzle maps of 50 states • Maps for recording field observations or pinpointing crime at police station • Board Games |
• Property Boundary/Surveyor • Weather/Storm Trackers • Real-time Traffic Delay • Vehicle Maps within GPS • Dora the Explorer & Maps • Political/Election Results • Irrigation Schematic map • USGS Soil Survey map • Video gaming/Online Monopoly |
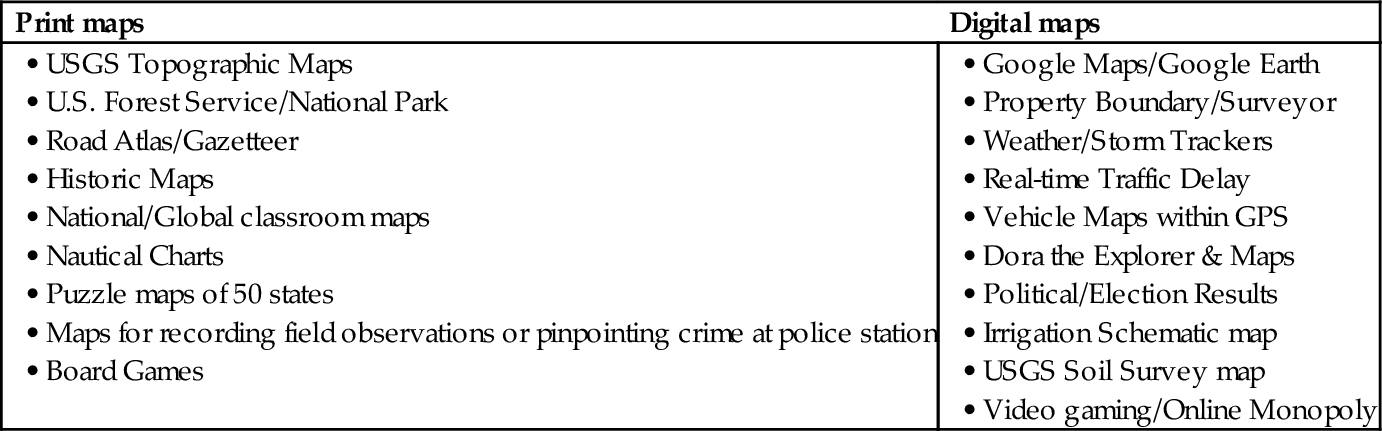
One student reported a genogram created by a Marriage and Family Therapist to map a family's history of mental disorders looking for genetic components related to depression, alcoholism, or eating disorders. Another student detailed the use of both print and digital maps and mapping by the U.S. Forest Service and Fire Engine Captain fighting an uncontrolled forest wildfire that had burned for weeks. GIS was used to coordinate information and data from satellite images and aerial photography, layering this with weather data, topography, hill shading, fire lines, and natural fire breaks from rocks to rivers. Maps were generated in the field twice a day, printed, and sent out with fire crews; other maps were given to police to warn residents in the path and news media for general regional updates to the public.
Many students and participants had misconceptions of both users and libraries. For students, one of the biggest misconceptions was that physical maps are no longer needed. For many users, paper maps remain better suited than their digital counterparts for applications such as outdoor use and travel planning. However, in contrast users spoke often of convenience in the digital map such as quickly identifying nearby restaurants, gas stations, or alternative routes when traffic delays occur. The common misconception held by many participants was that libraries had no maps or GIS capabilities. There was even an unlikely prediction by a participant that in 10 years there will be no map librarians.
The main objective of this activity was to discover what type and format of map or GIS-related resources were used in personal or professional life. This may be a less efficient way of knowing library users, current and potential, but the qualitative research approach served two purposes: (a) to dispel preconceived ideas by library students for uses of maps by potential patrons; and (b) to raise awareness of potential users that map resources and services are available in library collections.
Besides getting to know users and identifying demographic patterns, collection development is affected by other factors as well. Although the foundation for sound collection development policy involves a realistic and honest assessment of current and potential clients, other factors may impact collection development decisions.
If we think of collection development as a puzzle to assemble, main border pieces are library type, setting, and budget. The center pieces of the collection development are the existing and potential users, who come in many sizes and shapes. It is the border pieces that help to identify potential client and collection emphasis. Regardless of whether the collection is in a public, specialized, academic, or K-12 school library located in an urban or a rural setting, budget restrictions coupled with the high costs of spatial data resources effect collection development decisions. Defining priority levels for the selection of map and other spatial data resources is one way to address budget and location limitations.
Kollen, Linberger, Wassetzug, and Winkler (1998) identified user types or professions associated with different library settings. For example, in a K-12 school media setting users of the map library are both students and teachers, with potential topics in need of maps as varied as geography to history and government to biology. In this setting, budget plays a major factor along with the practical consideration that teachers must teach to benchmark standards using available technologies in classrooms and libraries. These factors drive collection development decisions for the school library more than merely satisfying teacher and student spatial data wishes.
The highest expenses in academic and special libraries may be the yearly GIS software licensing agreements as well as other concerns directly related to accessing digital collection components in library collections such as E-Rate and network bandwidth (American Library Association, 1996–2016a, 1996–2016b). Although rates vary by institution size, yearly GIS campus-wide commercial site licenses that include unlimited seats for large institutions costs tens of thousands of dollars per year. Broadband speeds and net neutrality concerns are related to libraries and noncommercial enterprises because they may be limited to the Internet's “slow lanes.” The broadband technologies and providers may give high-capacity connectivity preference to telephone, cable, and other commercial customers.
An option to ease funding concerns has been grant opportunities and donations, both grand and ordinary. Grants and donations are similar in that cash, services, and property are given to benefit people. Specifically, grants are a type of sponsored project or cooperative agreement where written proposals detail the project and if accepted, the award involves transferring money or property from a sponsor to an institution or individual. Grants may require research and subsequent budget, progress, and final reports. In contrast, donations are charitable gifts of goods or services, which the recipient accepts or rejects. Donations do not require specific work in return, but an application of solicitation is usually expected.
For example, grant opportunities on a grand scale include librarians who are talented and lucky enough to take advantage of funding through local, national, or international grants offered to libraries by, for example, the Bill & Melinda Gates Foundation (1999–2016a). U.S. libraries received Gates Foundation funding from 1997 to 2014, and a brief summary of these library initiatives was given in an Impatient Optimists blog post (Jacobs, 2014). The shift to a global library focus began around 2013 with funding to the University of Washington iSchool, a library and information science program, for its Global Libraries initiatives (Bill & Melinda Gates Foundation, 1999–2016b, 2013; Pacheco, 2013). More recently, the Gates Foundation solicited grants for organizations to work with geospatial data and is currently working together with Libraries without Borders (Bill & Melinda Gates Foundation, 2016; Novak, 2016).
In contrast, an ordinary map donation is when one library lists map resource discards to any library via social media (e.g., listservs). This exchange may involve Federal depository maps being discarded. Within the depository program, discarded materials must first be offered to the state's full depository library; if rejected, librarians are free to offer these resources to any library.
A different example of a grand donation is described by Sweetkind-Singer (2013) who introduced and defined the phrase “digital philanthropy” to encompass an exclusive gift of maps from private map collectors for digital display even though the library may or may not own the resource. Sweetkind-Singer (2011) explained that Stanford University Libraries describe digital philanthropy as “…an emerging partnership between the Libraries and collectors interested in donating access to their unique and interesting map collections in a scanned format for broader viewing.” Pledging a digital map collection is a way for donors who lack equipment and time to have the library perform the digitization of physical maps. The library may provide not only scanning facilities for the donation, but also cataloging and webpage display expertise. If the physical map is donated as well, then it is preserved and safely archived by library staff. The donor's legacy is shared in a digital format with scholars worldwide via the map library collection's webpages. One such donation to Stanford was from David Rumsey, who pledged his entire physical and digital map collection over time (Gorlick, 2009; Stanford University Libraries, 2016).
Whereas the Library of Congress and other libraries have digitized map donations, Stanford has detailed the complex, ongoing procedure of the Rumsey donation, which was finalized in a signed contract. The project and idea may indeed be unique in that it is a private collection moved to a private university. This digital philanthropy has become visible to the world via the generosity of donor and Stanford's University Libraries Digital Repository. Sweetkind-Singer (2011) identified some of the main challenges in this kind of process as negotiating the rights with the collector for access and reproduction as well as moving the rare and fragile physical maps which were sometimes a single map sheet and other times folded, framed, or inside an atlas. Finding the best way to scan large map sheets and track/retain the metadata for maps, were additional concerns. Catalog records were created in metadata object description schema (MODS), and loaded into Stanford's Digital Repository, known as Searchworks. Stored in a non-MARC, machine readable cataloging, metadata are directly sent to the library's open-public-access catalog (OPAC).
After assessing map and geospatial data community needs, budgets, and donation options, examining the current collection is the next consideration. This information is used to write and define goals by way of a map collection development policy (CDP). Articulating a CDP specific to maps and other spatial data provides a summary of what was, what is, and what could be for a map library. Arizona State Library, Archives & Public Records (2015b) provided a CDP definition as “a written statement of your library's intentions for building its collection.... it describes the collection's strengths and weaknesses and provides guidelines.” The policy must be written, approved, used, and revised; the main components of a general statement include an introduction to community and library, practical collection development elements, description of collection formats, goals, and adoption/revision information. A brief overview or summary to consider for crafting and drafting a map collection development policy follows.
A CDP document should have an introduction that may include a history of the collection as well as a brief account of the current status of the collection. This account defines the map library setting and the subsequent clients or map library users. Elaborating on the map library strengths and interests tailored to serve the tasks of clients may be defined by listing the factors that influence collection decisions and the anticipated trends for the future of the library. Once the purpose of the map collection has been stated, general guidelines on selection and acquisition processes may follow. Selection criteria are refined with priority areas defined and the individual subjects and formats listed. Finally, the policy may elaborate the plans for storing, culling, and maintaining.
Although Larsgaard wrote collection development policy considerations nearly two decades ago, some of her detailed advice is included as it remains relevant given that not all map libraries have discarded print collections, and some may not have extensive digital collections. Larsgaard (1998) suggested selection and acquisition policy be written and on file, not just an oral tradition. In addition, the policy should include: philosophy and goals, a clear statement of those sharing responsibility for implementing the collection's objectives, an enumeration of the geographical areas to be represented in the collection (in priority ranking, with limiting parameters of subject, scale, and date), a definition of the extent of support materials (such as gazetteers, journals, and cartobibliographies) to be acquired, and a list of materials that are out of scope for the collection.
Some of the standard map library formats and subjects to consider are: (a) reference and thematic maps of Earth as a whole; (b) continent and nation maps (i.e., U.S. CIA-produced maps on 8.5 × 11-inch paper); (c) topographic maps of various scales; (d) physical-political globe; (e) reputable world atlas, plus regional and local atlases; (f) aerial photographs; (g) large-scale topographic quadrangles; (h) road maps; (i) and thematic maps of various resources (e.g., mining, agriculture, census information) (Larsgaard, 1998). In addition, different outline or base maps on 8.5 × 11-inch paper, suitable for photocopy, may be useful in some library settings as well. While topographic maps may still comprise the bulk of any map collection, it is instructive to view other types of maps created from the topographic base map such as the color or black/white shaded-relief map or the thematic land-cover map (U.S. Geological Survey, 2012a, 2012b).
The exponential growth of spatial data and changing political boundaries make it impossible for one map library to be completely inclusive. The costs extend well beyond the purchase of map sheets and resources to include map-case storage cabinets, equipment and licensure, and staff handling time, especially considering the changing nature of digital data, hardware, and software (Larsgaard, 1998). Larsgaard encouraged librarians to foster collaborative collection development. This could be internal cooperation with faculty in academic settings for example or external agreements with other librarians in the same region or consortium to divide up territories and digital resources. In addition, Larsgaard wisely suggested map librarians conduct field trips, physically or electronically, to the Library of Congress and other map library collections to gain perspectives on other library CDPs.
At that time, Larsgaard urged a second CDP for spatial data in digital formats in which selections would be based on data supporting the curricula and research of the students and faculty. She jokingly suggested the title for digital spatial data, “Herding Cats: Options for Organizing Electronic Resources” (Larsgaard, 1998, p. 6). With the plethora of spatial data online, the burden has shifted somewhat from physical storage equipment to digital storage with infrastructure considerations needed to facilitate accessing and viewing. Consideration in policy must be given to network connections, wireless connections or cabling throughout the facility, in addition to computer workstations, speed of transmission, adequate memory and disk space, licensing agreements, and subsequent reference training for the library as a whole and for the map library in particular.
Finally, quality of physical and digital data must still be judged by the source's reputation and reviews. Collections should have both physical resources and digital. The demand for spatial information in physical hardcopy continues in part because computers are awkward in the field and large maps are best viewed by many people as a full scene, not paged up, down, or across in screen-sized segments. Regardless of format, a withdrawal policy should be articulated, and culling one collection benefits another when resources are offered and traded among map libraries. There is no single right way to build and maintain a collection, and looking at CDP examples is useful.
The written CDP for a map library is important and several online academic map library policy statements are recommended as models, not endorsements. Examples could be from some of the largest map and spatial dataset collections, but small- to medium-sized collections should have a written policy as well. Writing a CDP plan is easier with a guide in combination with knowledge of the collection. See Abresch et al. (2008) for solid advice directed at geospatial issues.
Dartmouth College librarians in Hanover, New Hampshire succinctly refined the definition of CDP for universities while accounting for practical considerations (Dartmouth, 2016a). Selection guidelines vary with subject and given the Internet-enabled, collaborative environment, Dartmouth noted that policy accounts for “collective collecting” with partner institutions. A second point was that selection relevance to academic department faculty and student, teaching and researching programs is paramount, but interdisciplinary areas must communicate to avoid redundancy. Selection depends on weighing quality, currency, cost, and policy statements. Also, a preservation commitment must be included in policy statements to retain and preserve content throughout the lifecycle including format migration as needed.
The Maps and Atlas Collections has a cartographic teaching and research purpose that is responsive to undergraduate and graduate programs in geography and Earth science, history, government, languages, environmental studies, and individual programs such as African & Afro-American studies (Dartmouth, 2016b). The policy boundaries include collection of atlases, maps, gazetteers, and selective cartography among main languages of English, French, German, Italian, Russian, and Spanish. Geographic areas are local to North America, Polar Regions, and “U.S.S.R.” The last designated geographic region suggests that policy updates may not be as current as the latest 2016 copyright date or that historic maps are requested for research. Reference materials are essential, but Braille and raised-relief maps might suit specific user populations as well.
The LOC Collections Policy Statement for Geography and Cartography has a scope defined as literature relating to the discipline (Library of Congress, 2008b). The research strengths are reviewed and specific Classes and Subclasses of LC Classifications identified. This is followed by a well-defined collecting policy, acquisition sources, and collecting levels, which range from comprehensive to research.
The LOC has a separate Collections Policy Statement for Cartographic and Geospatial Materials (Library of Congress, 2008a). The scope is defined as analog geospatial resources in the form of aerial photography, atlases, charts, globes, maps, remote-sensing images, and three-dimensional models; and digital geospatial data in the form of vector and raster representations, relational databases incorporating common geographic features as attributes, remotely sensed imagery, appropriate software for creation, retrieval, analysis, and display. Research strengths are reviewed, and much detail is given on collecting policy and acquisition sources for print and digital geospatial materials.
The University of Chicago map collection has a midwestern coverage emphasis, along with an extensive collection of foreign maps following the World Wars. The purpose is to support research and teaching in geology, geophysics, geography, history, economics, public policy, and genealogical studies. There is a substantial collection of geospatial data going back to the early 1990s (The University of Chicago Library, 2016). Policy dictates the collection's types of maps, formats, languages, geographical and chronological range, as well as the areas of distinction within the collection. While there is no cooperative arrangement with other Chicago area collections, the librarians refer patrons to complementary collections: the Newberry Library, with a distinguished collection of historic maps, and the Research Center at the Chicago History Museum, with a collection focused on Chicago materials.
The CDP introduction at Louisiana State University's Cartographic Information Center provided statements of purpose, mission, administrative structure, and selection responsibility; the CDP also defined main users, access policies, user confidentiality, and copyright considerations (Anderson, 2015). The purpose is to support instruction and public outreach in geography and anthropology; in addition, this is a regional Federal Map Library Depository. The selection and weeding or discard criteria are defined as well as collection review and gift policies. The third portion of the document defined the regional extent and format of maps and geospatial data in text and appropriately, using a world map color-coded from general to selective level collecting and research to comprehensive coverage. This document was approved in 2004.
The University of California Santa Barbara Map & Imagery Laboratory Collection of maps, aerial photography, satellite imagery, and geospatial data exceeded five million information objects and was ranked the number one collection among members of the Association of Research Libraries (Jablonski, 2015). This is an important research collection, but it also houses geology teaching slides from a former professor for future curriculum use. In spite of the collection size, the Collection Development Policy is relatively simple with a purpose statement, subject parameters, and scope, divided into subjects, geographic coverage, and types of material collected. There is reference to participation in the UC/Stanford Map Group and the statewide consortia acquisitions via the California Digital Library, which allows dataset collecting of cross-campus interest.
An organized collection development plan is a prime consideration for any neomap librarian. Articulating a collection development policy specific to maps and other spatial data provides a summary of what was, what is, and what could be for the map library. Many factors and considerations are involved with defining and assembling the collection development puzzle.
Libraries design collections around clients’ needs, which are in part defined by the library type and settings. Collection development plans are formulated based on financial outlooks and available facilities, equipment, and staff. Visual and spatial data complement the print and oral information contained within a library. Formal recognition of map and image collections demonstrates that librarians understand that one of the ways people navigate life is through the visualization of information and interpretation of spatial data. Putting all the pieces of the puzzle together by including maps and GIS resources among traditional books and journals for comprehensive collection development exemplifies great customer service and increased usage.
The purpose of cataloging and classifying is to organize information and data resources to make it easier to access and retrieve. Librarians devised various ways to classify and catalog text-based materials in the early 20th century, yet maps remained invisible in most library collections until cataloging systems went online. Cataloging has evolved over the years from an inventory of one library's holdings to a cooperative, global database of itemized collections in thousands of libraries. This chapter follows the progress and problems associated with classifying and cataloging maps, and it summarizes efforts that helped to make cataloging routine in the 21st century.
Library of Congress classification; LCC; Catalog; Classify; SuDoc; OCLC; WorldCat; Universal decimal classification; AGS; DDC; B&L; AACR2r; RDA; Interoperable; MARC; BIBFRAME; Dewey decimal; Federal Depository; Alphanumeric; Call number.
Physical maps have been in libraries for centuries but only recently have these resources appeared in library catalogs. Maps are essentially invisible if they are not in the online catalog given that the location for map cases is often in a basement or outsourced to a different building. Classifying and cataloging map resources helps patrons, librarians, and other libraries to realize that map collections and geospatial data resources are housed in a particular library. Having maps in the catalog would in turn increase map usage, help answer reference questions, ease circulation and inventory control, and aid in preservation and security concerns. A brief history of cataloging and classifying maps is followed by a summary of various classification schemes, encoding standards, and cataloging systems.
The catalog is an organized set of all bibliographic records that ideally represents the library's holdings (Andrew, 2003; Taylor, 2004). It is the primary way for the public to know and access what is contained in library collections. The cataloger is assigned this important, but time-consuming task of physically entering or copying the records. The word catalog used as a noun is defined as “a complete enumeration of items arranged systematically with descriptive details”; furthermore, when defined as a verb, catalog is a process “to classify (as books or information) descriptively” (Merriam-Webster, 2015). Given those definitions, the assumption of the public may be that the catalog refers to classification of books. This assumption is likely true among many librarians as well, as most maps and other geospatial data resource collections were only beginning to be added to library catalogs in the last decade of the 20th century due to advances in computers, databases, and online catalogs (Andrew, 2003).
Worldwide, cataloging of maps began in the late 1700s at the Kurfurstliche Library in Dresden, Germany, in 1831 at Harvard University, Cambridge in the United States, and in 1843 at the British Museum in the United Kingdom (Andrew, Moore, & Larsgaard, 2015). Maps in the Harvard catalog were even arranged by area and subject. However, there was a long absence of map collections added to catalogs for most libraries. Placing maps in catalogs coincided with the conversion of local card catalogs to machine-readable bibliographic records. In the 1970s, the Library of Congress added the electronic standard of “MARCMap,” and OCLC added the “007 Physical Description Fixed Field (Map) (R),” which simplified the copy cataloging process for maps.
Another reason for an absence of maps in library catalogs likely was due to a lack of catalog training beyond text-based materials. There are few courses in library school programs devoted to cartographic resources and even fewer continuing educational opportunities for original cataloging, see Chapter 6. Banush (2008) explained that monographic materials, maps, and electronic resources needed catalogers with a deep, narrow expertise for these format-based specializations. Banush went on to suggest not all libraries could employ these experts and that the role of catalogers often goes beyond entering records to include instruction and serving the institution as opposed to focusing only on their specific job description.
In the past, other reasons for the lack of map representation in library catalogs have been noted as economic and librarian misconceptions. Larsgaard (1998) wrote that librarians might not “justify taking the time (and therefore the money) to catalog what may seem just one measly sheet of paper … victims of the seemingly atavistic feeling that the intellectual content and worth of a printed work are best measured by size and weight” (p. 3).
In an online Library and Information Science dictionary, Reitz (2004–2014a) defined the library's catalog as a “…comprehensive list of the books, periodicals, maps, and other materials in a given collection, arranged in systematic order to facilitate retrieval.” This definition includes maps as equals with text resources, which could be due to the familiarity and ease of copy cataloging as well as increasing awareness of maps by the public and pressure from online companies such as Google and Amazon. Nevertheless, Troll (2002) made the point that even though students may realize the catalog points to resources in the library, they may not be able to physically find these resources because of unfamiliarity with the various library classification schemes. There is also a convenience factor with students and faculty wanting 24-hour access to digital library collections and services.
From the to librarian's perspective, Leysen and Boydston (2009) surveyed academic library catalogers and found 88% were very or somewhat satisfied with current jobs. However, this may be less true today since job techniques are being reinvented as familiar cataloging and encoding systems that are used change. A new content cataloging system, Resource Description and Access (RDA) has been tested, and since 2013 has been integrated into many libraries. Some libraries are testing the replacement of MARC, Bibliographic Framework, or BIBFRAME 2.0 (Library of Congress, n.d.e). According to Boydston and Leysen (2014), the responsibilities of the cataloger continues to be text-based material, but cataloging is expanding to include electronic resources such as e-books, native-digital, and digitized materials. The emphasis now is on adding non-MARC metadata to existing catalogs, accounting for the “local hidden collections,” which certainly includes maps.
Overall, a library cataloger generally organizes materials based on early 20th century information organization principles set by Charles C. Cutter in Rules for a Dictionary Catalog (Cutter, 1904). The catalog is the “what and where” of resources and the structural framework to join the collection and aid the librarian and client in awareness and access to the collection. Cutter's rules were later modified by Bohdan S. Wynar who continued to guide the process up through the 9th ed. of the Introduction to Cataloging and Classification; this book is now in the 11th ed. moving beyond Cutter by including format-neutral cataloging and RDA system instructions (Joudrey, Taylor, & Miller, 2015).
Again, one of the most important roles of cataloging is to offer users a variety of approaches or access points to the information contained in a collection. A century after Cutter laid the cataloging system foundation, a greater variety of cartographic resources are included as types of library materials. There is recognition that holdings may be in more than one library; for example, holdings are outsourced to nearby buildings or shared through consortiums and interlibrary loans, both of which are becoming more commonplace. Ideally, today's catalog must be flexible and up-to-date, constructed so entries are quickly and easily found, and economically prepared and maintained. Catalog entries are encoded so the prepared descriptive cataloging process is compatible with online systems. The two main cataloging systems in the U.S. are briefly contrasted later in this chapter along with other aspects of cataloging such as subject analysis and classification.
Although classification and cataloging are complex jobs, there is a professional support group in the American Library Association. The Association for Library Collections and Technical Services (ALCTS) is dedicated to work in collections and technical services, and specifically “acquisitions, cataloging, metadata, collection management, preservation, electronic, and continuing resources” (American Library Association, 1996–2016).
Libraries systematically classify materials by arranging subjects in a logical and hierarchical manner. The scheme divides knowledge disciplines into class and subclasses according to form, place, time, and topical subject for the purpose of easy access and retrieval by clients and librarians. Subdividing is from general to specific, and typically classification systems use numbers, captions, instructions, and notes.
Classification systems are subdivided into universal, specific, and national schemes. Universal examples are Dewey decimal classification (DDC), universal decimal classification (UDC, patterned after the DDC), and Library of Congress classification (LCC) (Library of Congress, 2014; OCLC, 2016b; UDC Consortium, 2016a). An example of a specific classification scheme is the National Library of Medicine (NLM) classification, patterned after the LCC (U.S. National Library of Medicine, 2016). An example of a national classification scheme is the superintendent of documents (SuDocs), which is exclusive to the U.S. (Federal Depository Library Program, 2015).
Most academic and research libraries in the United States adopted LCC; public libraries and smaller college libraries adopted DDC. The SuDocs classification system is used exclusively by federal governmental agencies and subsequently by libraries participating in the Federal Depository Library Program. Another method may be based on subject analysis and headings such as with the USGS Thesaurus and Science Topics Catalog (U.S. Geological Survey, 2016; Walter, Borgman, & Hirsh, 1996).
In terms of functionality, classification systems are often described as enumerative, hierarchical, or faceted. Enumerative systems have subject headings listed alphabetically, and an ordered listing of numbers are assigned to headings. Hierarchical systems represent the division of subjects from general to specific, and for faceted systems, subjects are divided into mutually exclusive features or a multidimensional taxonomy. Most classification systems blend the functions to include all three, but tend to favor one type over the others.
In terms of notation for filing, classification systems are alphabetic, numeric, and alphanumeric. Alphabetic classification systems use natural language. They are easily applied to collections by staff, and individual resources are easily located by clients. Numeric filing alone is often associated with computer coded logic in digitally stored systems. Alphanumeric schemes are a combination and grouped by area, subject, number, and subject/author codes.
In general for maps, alphabetic systems work best for small collections of maps, sections, plans, and diagrams, and these spatial materials may be filed by continent or region and subdivided alphabetically by political unit. Many Federal Depository Program topographic map collections in the 7.5-minute map series were organized in this manner. However, this classification scheme may not work as well for atlases, globes, and remotely sensed images, and the system may quickly become unwieldy for larger collections.
In relation to cartographic resources, numeric geographical classification schemes are the least common and alphanumeric the most common. Examples are geocoding, with two parts, an area division and coding logic such as the U.S. Postal Service's zip code system or the worldwide telephone system, which include global, regional, and local numeric codes. The best-known alphanumeric systems are LCC and DDC, but the Boggs and Lewis (B&L) and American geographical system (AGS) are cartographic-specific alphanumeric schemes.
Ultimately, the reason for classification schemes is to organize materials for easy location access. The classifications of books and cartographic materials differ. Books are typically classified by topic then place, and for maps the opposite is true. In general for maps and geospatial resources, subclasses are the where and what that is requested at the reference desk and should guide the choice of classification scheme. The where is the geographic area or place covered in the map, and the what is the topic or overall theme of the map. Once the classification system is known, the cataloger adds the symbols that make up the call number, or the resource's address or unique identifier for shelf or drawer within the library. Various classification systems or schemes used for cartographic resources are summarized and contrasted in this section.
These two classification systems, S.W. Boggs and D.C. Lewis (B&L), and the AGS, are quite specific to cartographic materials and not part of an overall classification system. “The Classification and Cataloging of Maps and Atlases,” more widely known as the B&L classification, was developed to satisfy needs of the U.S. State Department's Map Library and as such did not have a North American bias (Romero & Romero, 1999). B&L was the first system devoted to maps, atlases, relief maps, and globes to be formalized in a publication (Boggs & Lewis, 1945). The disadvantage of this classification was that in spite of re-printings, there were no updates after its creation in 1945.
B&L used the 1941 ALA cataloging rules and emphasized the importance of order for descriptive elements. First was a three-digit number representing area, second was a letter representing the subject and location symbols, third was the date of situation, and finally the type of map, author, and title (Abresch, Hanson, Heron, & Reehling, 2008). While not the oldest classification scheme, it was the first specific classification for maps and was popular in Canada and Australia (Larsgaard, 1998).
The American Geographical Society of New York was a 19th century professional group of geographers who devised the map classification for their collection. When the group disbanded, the 1.3 million items went to the University of Wisconsin at Milwaukee (University of Wisconsin Milwaukee Libraries, 2016b). The library began a digitization project in 2001, and the impressive Digital Collections can be viewed online (University of Wisconsin Milwaukee Libraries, n.d.).
The AGS classification was exclusive for maps, atlases, and reference materials. It used a three-digit numeric notation to represent geographic area and alphabetic notation for subject, followed by the date (University of Wisconsin Milwaukee Libraries, 2016a). The system's limitation was that it did not accommodate thematic maps (Romero & Romero, 1999). In both B&L and AGS, the date of situation was considered vital information. This date was not the date of publication or reprinting, but rather the date of the data represented. This was important because it qualified usefulness, which was likely related to the main users at the time (e.g., the Department of State). The call number begins with a three-digit number representing area or world regions. These systems progress from general to specific; brief examples of the classification are shown in Tables 10.1–10.3. In the tables, the B&G listing examples are from ANZMapsS (n.d.); the AGS listing examples are from University of Wisconsin Milwaukee Libraries (2016a).
Table 10.1
Area designation for Boggs and Lewis versus American Geographical Society classification system
| B&L brief example of class numbers add decimals and numbers for specifics | AGS brief example of add decimals and numbers for specifics area class |
| 000 Universe | 000 Universe |
| 010 Galaxy | 050 World |
| 020 The Solar System | 100 North America, excluding the United States |
| 021 Mercury | 200 Latin America |
| 022 Venus | 300 Africa |
| 023 The Earth and the Moon | 400 Asia |
| 023.1 The Moon, satellite of Earth | 500 Australasia |
| 023.11 Lighted Side | 600 Europe |
| 100 World | 700 Oceans |
| 200 Europe | 800 the United States |
Table 10.2
Subject designation for Boggs and Lewis versus American Geographical Society classification system
| B&L brief examples of subject of the map | AGS brief examples of subject of the map |
| a Special categories | A Physical |
| b Mathematical geography | B Historical-political |
| c Physical geography | C Population |
| d Biogeography | D Transportation, communication |
Table 10.3
Type of map designation for Boggs and Lewis versus American Geographical Society classification system
| B&L brief examples of symbols for type of map | AGS brief examples of symbols for type of map |
| w Wall maps | a Wall map |
| s Sets of maps, filed apart | b Set of maps |
| r Relief maps | c Region |
| g Globes | d Cities |
The DDC was created by Melvil Dewey in 1873 and is a proprietary system first published in 1876 as a four-page pamphlet (OCLC, 2015). The latest edition is from 2011, revised and expanded through 23 major editions in a four-volume set (OCLC, 2016c). It has an abridged version for smaller libraries and is currently maintained by the Online Computer Library Center (OCLC). OCLC licenses access to an online version called WebDewey (OCLC, 2016e), which may be downloaded for a 30-day free trial (OCLC, 2016c).
In general, the DDC allows concepts of relative location and relative index for new materials added to libraries in the appropriate location. There are main classes by subject and fractional decimals beyond the three-digit Arabic numerals. For example, the 900 class is history and geography; maps could be classed in 911 for historic geography or 912 for graphic representations of specific subjects. Map types could be expanded in linear fashion. The DDC is the oldest and most widely used in the U.S. and many other countries (Taylor, 2004). Specifically, the DDC is used in 200,000 libraries and in at least 135 countries (OCLC, 2016c).
In spite of this being a popular classification system, Davis and Chervinko (1999) found fewer than 6% of map-cataloging libraries used DDC. In DDC, most cartographic materials are classified under 912 and added to this base number is the more specific subject. Romero and Romero (1999) remarked that the main drawback for map librarians was classifying subject first and making the geographic location a secondary aspect, given that most reference questions requested a map of a given geographic area. DDC also has a U.S. bias, and cartographic resources are global. Larsgaard (1998) called the DDC an inappropriate classification for maps and cartographic resources.
In 1885, Paul Otlet and Henry LaFontaine were working on a classified index to published information. Otlet was aware of Melvil Dewey's work, and in 1895, Otlet gained permission to translate the DDC into French (UDC Consortium, 2016b). The DDC formed the basis for Otlet and Lafontaine's system, and an English language version was published in the 1930s. It was initially managed by the International Federation for Information and Documentation until 1992 when the UDC became affiliated with the UDC Consortium (UDC Consortium, 2016c).
The UDC is an indexing and information retrieval tool, made up of 10 classes, each divided into 10 divisions, each in turn having 10 sections. It uses Arabic number notation, three whole numbers representing the main classes, subclasses, and decimals for further divisions. The structure is hierarchical and 900 is the general class for history, maps, and geography. Unlike DDC, the UDC does not have a U.S. bias and cartographic materials may be classified first by area and then by subject; if deemed more important, materials are then classified by subject first (Romero & Romero, 1999).
The UDC is a system widely used by libraries and information services in more than 130 countries and translated into 50 languages (UDC Consortium, 2016a). The UDC Consortium is a nonprofit group, headquartered in The Hague, Netherlands, and made up of publishers with an editorial team and advisory board who maintain, develop, and distribute this classification system.
Larsgaard mentioned the importance of the UDC outside the United States, and while “the first one thousand classes (000/999) has been maintained, constant revision has produced increasingly serious deviation in details” (Larsgaard, 1998, p. 143). Again, maps are primarily in 912 and are designated by country, and parentheses enclosing place or country or place and form.
The UDC system is flexible in that if the subject of the map is more important than country, then the number of the place may appear at the end of the entry. This classification system is widely accepted outside the U.S., and fits the way clients conduct a search, which is often by geographic area first. For more detailed examples and explanation, the following references are recommended: UDC Consortium (n.d., 2016d) and Allington-Smith (2015, May 31).
The Superintendent of Documents (SuDocs) system for library classification was developed in the office of the Superintendent of Documents of the U.S. Government Publishing Office (GPO) between 1895 and 1903 (Federal Depository Library Program, 2015). The Superintendent of Documents was tasked with storing, cataloging, indexing, and distributing government publications, but the person who devised the classification scheme to organize government publications was Adelaide R. Hasse. She worked in the Los Angeles Public Library in the 1890s, but Hasse moved to the GPO Public Documents Library from 1895 to 1897 (GPO Access, 2004). This library no longer exists.
What distinguishes this scheme from other library classification systems is a reliance on the origin of the document or provenance, rather than an arbitrary subject. Provenance has proved to be a flexible, expansive, and descriptive system for collections. The origin or authorship is not usually a personal author, but the agency, bureau, or office where the document was created. This alphanumeric scheme is arranged alphabetically by the leading letter of the agency that originated the document. This is followed by a number, period, whole number, and colon; the colon is a break between the SuDoc stem and its suffix, which consists of a sorting hierarchy including dates, letters, numbers, words (Federal Depository Library Program, 2015). The documentation for SuDocs cataloging was last printed in 1993 and is available for download online (Federal Depository Library Program, 1993). An example for a topographic map follows.
The SuDocs map number for Kittitas, Washington, is I 19.81:46120-H 4-TF-024/978, each element is explained later. This SuDocs classification example is from a map in the Federal Depository. SuDocs is called a provenance system because it organizes publications by issuing agency, which in this case is “I” for the Interior Department (U.S. Department of the Interior, n.d.). The “I 19.81” is the class stem and the “19” is the designation for the USGS (U.S. Geological Survey, n.d.), one of the agencies under the umbrella of the Interior Department. The “81” is the designation for 7.5-minute topographic series quadrangles. Following the colon is “46” and “120” or the coordinates in degrees latitude and longitude. The “H 4” is a map reference number based on the north and west coordinate directions (latitude and longitude) and the North American Datum of 1927. For information on datum, see Chapter 3 and MapTools (2016). “TF” represents the type of map, topographic, and “024” is the scale, 1:24,000. Finally, the last three numbers “978” represent the edition date 1978; with dates, always drop the first number in a date prior to the 21st century, and if the map is from 2000 and beyond, the record would end in four numbers.
Davis and Chervinko (1999) found that of the map-cataloging libraries 16% reported using SuDocs classification. However, this is a bit misleading because many libraries used several systems for cartographic resources. Most government documents would be classified using SuDocs, yet the library would classify other cartographic resources using LCC. Interestingly, many libraries created their own local system, greater than 20%, yet nearly 30% reported a local system based on the LCC (Davis & Chervinko, 1999). While these statistics are dated, it is clear that LCC is the preferred classification system for cartographic resources.
This LCC scheme was devised by Herbert Putnam (Minneapolis Public Library, 1889). Putnam developed the system in 1897 at the Minneapolis Public Library and later became the 8th Librarian of Congress, serving from 1899 to 1939 (Library of Congress, n.d.c). The LCC was designed and developed specifically for the LOC collection, replacing Thomas Jefferson's fixed location system. When Putnam left the LOC in 1939, all the classes except K (Law) and B (Philosophy and Religion) were fully developed.
The LCC is used by most research and academic libraries in the U.S. and several other countries. The LCC system overall is organized according to 21 basic classes, which then follows a logical order based on a discipline's domain divisions with numbers that are assigned creating a detailed item call number (Library of Congress, 2014). The call number was used to locate or physically call for the resource during times of closed stacks in libraries, which may still exist today in the U.S. if the maps are outsourced to a storage-only location. LCC is a subject-oriented classification with specific numbers called cutter numbers, introduced by C. A. Cutter; they are a coded representation of the author, organization, map publisher, and the like.
Specifically, Davis and Chervinko (1999) report 83% of the map-cataloging libraries reported using the LCC. In a 2004 survey, Thiry and Cobb (2006) discovered this trend among unclassified to fully classified map collections and institutions that reported classification systems as well; for example, the University of Illinois at Chicago reported 99% of the maps were classified and the systems were LCC and SuDocs, whereas the University of Chicago had only 60% of the maps classified and it was using only LCC. Larsgaard (1998) affirmed this LCC endorsement when she stated, “Schedule G of the LC class system contains the best classification scheme for cartographic materials” (p. 120). The first edition of Schedule G was introduced in 1910, but this classification continued to develop and was completed for atlases in 1928 and maps by 1946. The basic atlas call number structure is area, subject, author cutter, and date of publication; map call number structure is area, subject, date of situation, and author cutter. Larsgaard noted this difference in the order of structures for atlases, and maps are also one of those unexplained anomalies. A brief, generalized introduction to LC call numbers follows and an easy to read general explanation is provided by University of Illinois at Urbana-Champaign (2015).
The LCC groups, divided by major classes of information, are signified by one or two letters that are not mnemonic. The geographic portion of the LCC happens to be indicated by a G—Geography, Anthropology, Recreation. Class G is divided into subclasses from G-GV; maps are primarily under G, geography atlases and maps; GA, mathematical geography and cartography; and GB, physical geography, and so on. Furthermore, the subclasses have subsets of those groups, which are numerals up to four digits. For specific examples, Schedule G atlases are classed at G1000.3-3122, globes G3160-3182, and maps G3190-9999. Beyond the four digits, alphanumeric codes follow for subjects after a decimal point. These are cutter numbers, and “each major cultural or political unit in the world or universe has been assigned a block of numbers” (Larsgaard, 1998, p. 123). The current version of geographic cutter numbers has over 100,000 categories in 2016. This file may be downloaded as a pdf, but it is 6.5 MB in size with more than 3000 pages.
Also, there is a more thematic classification accomplished by decimal and subject code system. It is alphanumeric from A to Z, except I, O, W, X, and Y; it is not mnemonic and letters are followed by numbers representing subtopics. Within the maps class, subject code categories include bird's-eye views, plans, cross sections, diagrams, remote-sensing images, relief models, digital maps, and more. For example, C is for Physical sciences and .C2 is physiography, .C22 is relief features, and .C225 is shaded relief. The A indicates special categories in maps and atlases. It should be noted though that these subject letter/number combinations are not cutters.
The entire classification is not reproduced here but is available for Class G, Tables G1–G16, and Geographic Cutter Numbers (Tables G1548–G9804), throughout the subclass G (Library of Congress, n.d.d). Online access is available for libraries by subscription to Classification Web (Library of Congress, n.d.a; Library of Congress, n.d.b).
In addition to classifying cartographic resources, libraries use descriptive standards to organize knowledge resources and enhance access and retrieval. This final section briefly summarizes and contrasts two cataloging content standards, which are still based on some form of Cutter's principles of organization used in classification. Also, for remote access, a structure framework was developed by the Library of Congress in the 1960s, known as MARC or MAchine-Readable Cataloging, which is still in use today (Library of Congress, 2016b). The historic progression in cataloging and its future follows.
At the end of the 19th century, librarianship was being formalized as a career. Librarians organized collections of materials on shelves and in storage cases within library facilities. To make these resources accessible, catalogs were created. Catalogs were essentially an inventory and listing of resources as well as providing locations for each resource. Making the catalog an effective retrieval tool meant identifying the most important access points in a bibliographic record, or today, using the relationship model in works, expression, manifestation, and item.
As noted at the beginning of the chapter, isolated cases for cataloging cartographic collections began in the 18th and 19th centuries. Geographic area and subject were the main entry or access points used to organize collections within catalogs. Unfortunately, the 1908 code book entitled, “Catalog Rules, Author and Title Entries,” worked effectively for books but did not extend these early cataloging lessons for maps (Hanson, 1908). The assumption was that including a description under the cartographer or publisher name would suffice for finding maps. However, recording the USGS as author on hundreds or even thousands of separate topographic map sheet entries and adding map titles such as World, Texas, or Blue Lake, Colorado would do little to help locate a specific map with the needed scale effectively. It took several decades to design a system that worked for both book and cartographic resource.
In 1947, the new code book, “Rules for Descriptive Cataloging in the Library of Congress” was widely accepted. There was a section devoted to maps, relief models, globes, and atlases, and two years later, a second edition had a new section on maps and atlases. Still, librarians were not adding cartographic collections to catalogs (Morsch, 1949).
In the second half of the 20th century, the first edition of the Anglo-American Cataloguing Rules (AACR) was issued in 1967. In the 1970s the AACR benefited greatly with the addition of MARC as the encoding standard. This moved the catalog into a digital format where records could be read by computers and easily shared among libraries. Cataloging was increasingly complex, more items were digital, and preserving metadata with the record was problematic. Descriptive and subject cataloging evolved along with classification systems such as the DDC and LCC.
Also in 1967, the Ohio College Library Center (OCLC) was founded and WorldCat was launched; the initial cataloging records were added in 1971 to the OCLC database, which was the first online cataloging done by any library (Bryant & Mason, 2016; OCLC, 2016a). The plan at that time was to merge Ohio library catalogs electronically with a computer network and database; the purpose was to increase library efficiency, better serve researchers, and lower complexity and cost.
Today, OCLC is a nonprofit computer library service and research organization still known by the same abbreviation, which now stands for Online Computer Library Center. WorldCat.org is a global library catalog, or a union catalog, that describes collections in many member libraries (OCLC, 2016a). Creating a crowdsourced catalog would not have been possible without forward thinking, a desire to create a cooperative regional and later global catalog for information and data, and digital encoding standards, namely MARC.
MARC is a digital format for describing bibliographic items developed in the 1960s to facilitate computerized cataloging from library to library in regional or international situations. In 1971, MARC format was the national standard for dissemination of bibliographic data, and by 1973 was also the international standard. Reitz (2004–2014b) defined the purpose of MARC standard format for libraries as a way to have predictable, reliable cataloging data and to act as a bridge between libraries and library automation systems; MARC assists libraries in sharing bibliographic resources, avoiding duplication of records, and ensuring bibliographic data is compatible when changing automation systems. The MARC record itself has three components: record structure, a content designation, and data content. The data content is defined by the external standards of AACR2, LC Subject Headings, and the like.
In the past, Cutter's principles of organization enabled patrons to find a book if author, title, or subject was known. The methods for doing this provided access points such as an author entry, title entry, subject headings, and cross references. Handwritten or typed cards were created and placed in a card catalog inside wooden cabinets. These cabinets and card catalogs were moving out of library reference areas, and by 1983 the content cataloging was updated and AACR2 adopted. Catalogers recognized that cartographic and monograph cataloging had much in common. A new field, MARC 255, was added along with other improvements for maps.
The MARC 21 family of standards was created in 1999 to herald the 21st century. It was a result of efforts to make the United States compatible with Canadian and European standards. MARC 21 has formats for five types of data including bibliographic data, holdings records, authority records, classification schedules, and community information. AACR2 continued to improve with some of the last revisions and updates in 2005 (AACR, 2006). It was at this time that many libraries were adding significant numbers of maps into catalogs.
A posting on the popular listserv, MAPS-L, documented the incredible amount of cartographic-materials records that have been added each year to OCLC from 2005 to 2015 (C. Winters, personal communication, July 17, 2016). Overall, these statistics were gathered for 18 of the biggest map library collections at private and public universities and agencies. One public library was represented along with 15 universities, the USGS, the LOC, and OCLC. Every group increased the number of records added to the OCLC catalog over the years; the one public library cataloged the fewest of all the yearly reports, at over 21,000 in 2005 and nearly 35,000 in 2015. Excluding OCLC and LC, one university had the highest number entered in 2005 at nearly 66,500, and a different university was the highest in 2015 at nearly 86,500 entries. In 2005, LOC and OCLC added nearly 243,000 and over 857,000, respectively; in 2015, they added over 312,500 and nearly 4,695,500. The pace of cartographic entries may slow as one librarian added that in his library “there are now only a few pockets of uncatalogued materials in the collection” (C. Winters, personal communication, July 17, 2016).
The Library of Congress (2016a) offers many Cataloger's Desktop services online for RDA, AACR2, and Web Dewey. In addition, many librarians benefit from participating in a shared catalog. Even though cataloging is “generally based on early 20th century information organization principles of Charles Ammi Cutter” and is an “aid for awareness and access to a local collection for librarian and client alike,” cataloging is “a common structural framework that bridges global collections” (B. Hanschu, personal communication, August, 2009). Cartographic resources vary in type, and there are two methods to add records to a catalog, original, or copy cataloging. Hanschu added sound advice from a cataloger's experience: when performing cataloging, verify everything, it is best to never assume anything, and never make anything up. The recommended tools include AACR2 manual, OCLC bibliographic formats and standards, OCLC Code list, and LC Free-Floating Subdivisions, and the Cartographic Materials (2nd ed.): A Manual of Interpretation for AACR2 (Mangan, 2003). Using AACR2 guidelines, Hanschu provided a quick tour of the process and procedure for copy cataloging maps with the map in hand, which can be seen in Appendix C.
The longevity of AACR2 combined with advantages of sharing catalog records with OCLC and WorldCat.org have taken librarians into the 21st century. However, updates over the nearly 40 years of this content cataloging standard were needed and formal discussions began regarding change in 1997.
In the late 1990s it was becoming obvious that the World Wide Web was the primary means to connect library users to the library catalog. However, Coyle and Hillmann (2007) criticized the continued use of MARC, developed in the 1960s, as the “middleware between the cataloging function and library systems development.” Questions without easy answers were asked. Is the library's signature service, the catalog, proving to be an equal to Amazon and Google in the search for information as perceived by the public? Are the rules and instructions for cataloging meeting goals or just remnants of a long departed technology, the card catalog?
Coyle and Hillmann (2007) answered both questions above with no and argued that a simple “rearrangement of the cataloging rules is not the right starting point for libraries.” Coyle and Hillmann suggested the question in 2007 was not whether Amazon and Google had created a generation that no longer needed the library, it was how to change a mind-set from catalogs as inventory of the holdings in one library to recognizing information and data users' needs may include resources in libraries and nonlibrary communities.
The main disadvantage of records created using AACR2 rules was these records are not interoperable with other data records and metadata schema. “Crosswalks” and related tools must be applied to enable search engines to operate across databases with dissimilar record formats. “Other interoperable issues deal with various problems such as different records not having exact field-level matches or fields of importance in one standard not necessarily having a related field even similar to them in another standard” (Andrew et al., 2015, pp. 106–107).
As such, the U.S. Federal Geographic Data Committee's Content Standard for Digital Geospatial Metadata and other committees increasingly identified cataloging concerns such as the complexity and plethora of scanned-digital and native-digital resources being generated.
AACR began in 1967, and now the question was should there be AACR3 or something new. “New” was the choice and RDA was presented as the cataloging standard, designed to replace AACR2. It was published in 2010 and implemented into the current cataloging workflow by LC and others in 2013 and beyond.
Although RDA was launched several years ago, it appears MARC is still the middleware of choice for many institutions. New changes to MARC 21 were announced in August, an OCLC-MARC Update 2016 (OCLC, 2016d). The changes are in Bibliographic and Holdings formats; while Authority Format changes were discussed but not implemented until they can be coordinated with the “Library of Congress and the Name Authority Cooperative (NACO) of the Program for Cooperative Cataloging (PCC)” (J. Weitz, personal communication, August 23, 2016). The discussion and how it relates to cartographic resources continues.
Coyle and Hillmann (2007) took part in the discussions and opposed RDA. In an opinion article they summarized the historical perspective on talks regarding the future of AACR2. They argued that RDA was just more complex than any cataloging schema in the past without providing any fundamental improvements. Coyle and Hillmann suggested that adopting RDA would move libraries back into the 19th or 20th century, not forward into the 21st.
For three decades, multiple generations of catalogers have perfected and been comfortable with the AACR2 content cataloging standard. With numerous revisions, the system was well documented, used, and known, according to Andrew et al. (2015). They suggested the main advantages were that AACR2 focused on the resource in hand and its complete description as a bibliographic record. The AACR2 had easy-to-follow organization and principles, and the third chapter provided a one- or two-step process to speed up cataloging cartographic resources. Rules were grouped into eight different formats. This design made it easy to comprehend, and there were separate sections for rules such as covering access points.
Andrew et al. (2015) pointed out the main changes for cartographic catalogers using RDA. The arrangement is completely different, and the instructions are applied to a work, expression, manifestation, or item. The advantage was that with RDA focused on relationships, and the Functional Requirements for Bibliographic Records (FRBR) model could make cataloging relationships better able to accommodate the multiplicity of standards to preserve metadata. The disadvantages are that learning the theoretical foundations of RDA-FRBR and how inherent relationships are expressed would be a steep learning curve, given that it is described in a 1000-page document. Other disadvantages are a lack of format-specific documentation for guidance and some more subtle differences. RDA allows no Latin terms or abbreviations, yet there are some exceptions, which is problematic.
The debate will continue on the merits and pitfalls of any new cataloging system. Some libraries have adopted RDA, and others will continue using AACR2. Coyle and Hillmann had advocated for a “unified vision allowing us to harness our collective strength as we go forward” but whether or not unification happens, change is inevitable.
This chapter summarizes concepts of classifying and cataloging, and the history and current state of cataloging cartographic resources. Libraries developed the catalog to create inventory and records that identified access points for resources with effective retrieval as the goal. It seemed to work for books, but it took decades for librarians to make maps and geospatial data fit into the one-size-does-not-fit-all cataloging system.
The Internet and World Wide Web have provided the platform for commercial search engines to develop and display maps and provide online mapping programs. Allowing information users to navigate the search has resulted in sometimes bypassing the library. This has been the case with maps in particular, as they were left out of the catalog and physically tucked away in basements. Although archived maps may have been protected this way, it effectively meant that these resources were invisible to the public. Since 2005, WorldCat.org has increased their holdings of cartographic resources by millions in the catalog. Now that the public's interest in maps and geospatial resources is strong, the time is right for the promotion of library map and geospatial data resources and services, which is the topic of the final chapter. Change is inevitable, and the demand for map librarians would increase if administrations are willing to support and advocate for neomap librarians and collections.
Map and geospatial resources and services have special considerations in library collections when compared to traditional library holdings. Issues of cataloging, physical accessibility, and patron awareness could all lead to these collections being underutilized. Some suggestions for making these collections more visible and providing training and support to patrons, including map displays, research and training sessions, and geocaching events for promotion, are described here.
Map storage; Map exhibits; Geography Awareness Week; GIS Day; Earth Science Week; Geocaching
Geospatial collections come with unique challenges. Physical maps have been considered to be of lesser importance to libraries than other holdings, and this has sometimes led to neglect. To start, the library may not even have a good understanding of what maps it owns, and if they do know, those maps may not be easily searchable along with the rest of the holdings. Due in part to both a lack of awareness and difficulty searching for them, it is common for map collections to be relegated to storage in basements, attics, or even offsite locations. In these kinds of situations, it is not uncommon for maps to have become damaged due to a lack of proper care. On the digital side, geospatial data may not want for storage space the same way printed maps do, but digital data encoded on physical media remain subject to potential degradation. Proper storage is an important factor regardless of media. Also, a lack of technical skills or computing resources may lead to both staff and patrons being unable to leverage digital information (Sweetkind-Singer, Larsgaard, & Erwin, 2006).
Of course, none of these problems are insurmountable. With a growing public awareness of the importance of geospatial thinking and information, and the existing goals of patron support, libraries are poised to be important stewards of maps and geospatial technologies. In many ways digital data may be easier to handle, as computers and Internet access are already established components of libraries. Unfortunately, commercial GIS and remote sensing software is expensive, requires powerful computer hardware to run, and comes with a steep learning curve. Free, open-source software mitigates the cost issue, but still requires powerful hardware and may be more limited in its technical abilities. It also lacks some of the support infrastructure that comes with commercial software. Archival policies for digital media likely exist in most institutions, but ensuring that they are followed and that concerns like metadata updates are taken seriously is crucial.
In regards to physical map collections, the challenges may relate more to issues of space and preservation within the library, see Chapter 6. All facilities, no matter how large and well-funded they may be, eventually run into issues of space. In the past, maps have been one of the resources that were deemed less valuable, which is why they ended up in storage, or more sadly, thrown out. Although the value of maps may be much more broadly understood by the public today, this does not mean that the library would have suddenly found a suitable empty space for map storage and reading. Finding the resources to house maps, support software, and teach geospatial skills in already-tight budgets requires justification, which may often be its own challenge. Public promotion of the library’s holdings and available geospatial services is therefore an important job.
Library facilities likely have map and geospatial data resources available to patrons, but promoting awareness of those resources may be a challenge. Many patrons may not realize that the library collection extends beyond books and periodicals to include geospatial information and research facilities with modern geospatial technologies. The good news is that people love maps, and awareness of the importance of geospatial knowledge among the public is quite high today.
For promotion of map collections and geospatial data resources, one good place to start is simply to ensure that the collection is visible to the public. This could be done by publishing a special write-up in the library newsletter, Facebook page, or announcements via Twitter, and creating a webpage that focuses on the collection. Having a dedicated webpage within the larger library page would be valuable to making patrons aware of the existence of geospatial resources. Another idea is to display maps in prominent locations in the facility. Historic maps of the local area are always crowd pleasers; remember that any given institution likely has local historic maps that do not exist in any other collection. Historic GIS data could also be used to create modern maps representing historic features, or change in the local landscape over time. These are excellent candidates for promoting both map collections and other historic resources held by the library.
In terms of visual displays, the natural beauty of the Earth’s surface is a draw for many. The U.S. Geological Survey (USGS) website hosts a variety of educational products that may be either purchased or downloaded for printing. In particular, the Earth-As-Art series showcases stunning imagery of the Earth collected by the Landsat 7 satellite platform (U.S. Geological Survey, 2012). These images show features of natural beauty, atmospheric phenomena, and evidence of human activity on the landscape in both true- and false-color compositions. Fig. 11.1 shows an example of one of these posters that focuses on patterns of human activity, namely center-pivot irrigation near Garden City, Kansas.
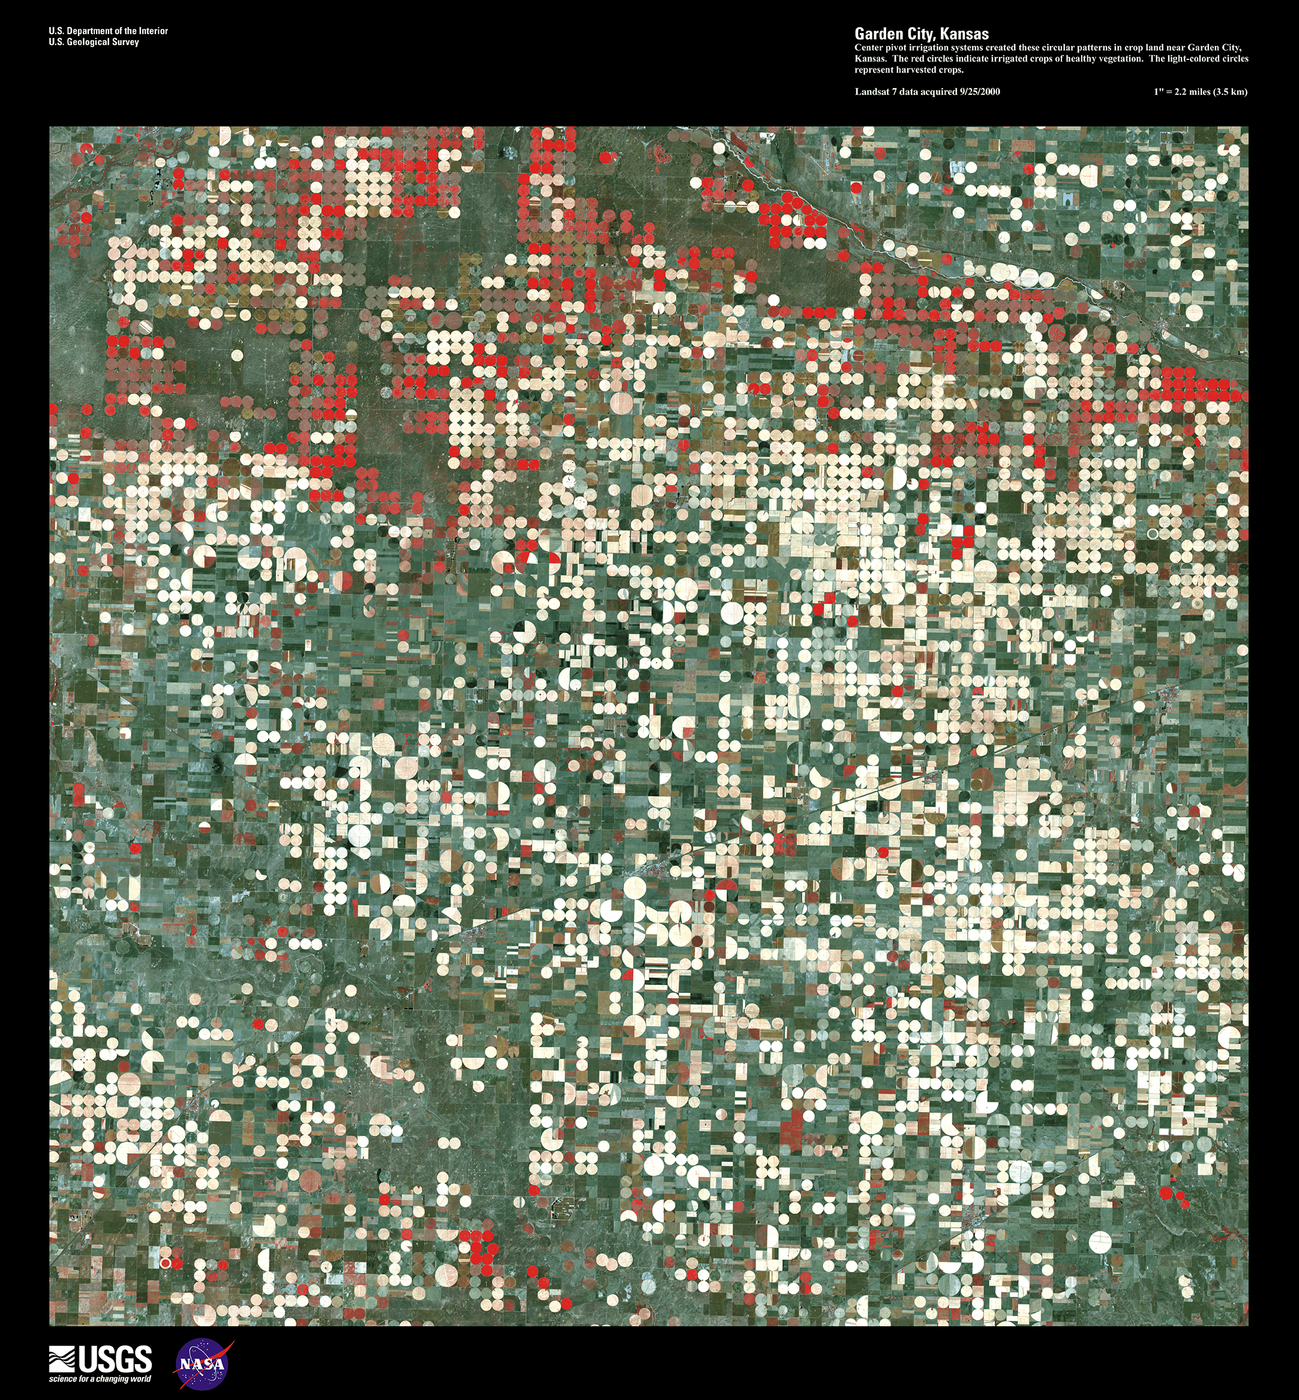
Another USGS product that might be useful to catch patrons’ attention is the Earthquake Summary Posters prepared as a part of the USGS Earthquake Hazards Program (U.S. Geological Survey, 2016). More than just maps, these posters provide summary information about specific earthquake events around the world, including information on the location, the magnitude, and the impact on the surrounding region. Whether earthquakes are regularly experienced locally or not, people often have a fascination with natural hazards and these posters could help to promote knowledge of the Earth Sciences and geospatial technologies. An example of one of these posters is shown in Fig. 11.2.
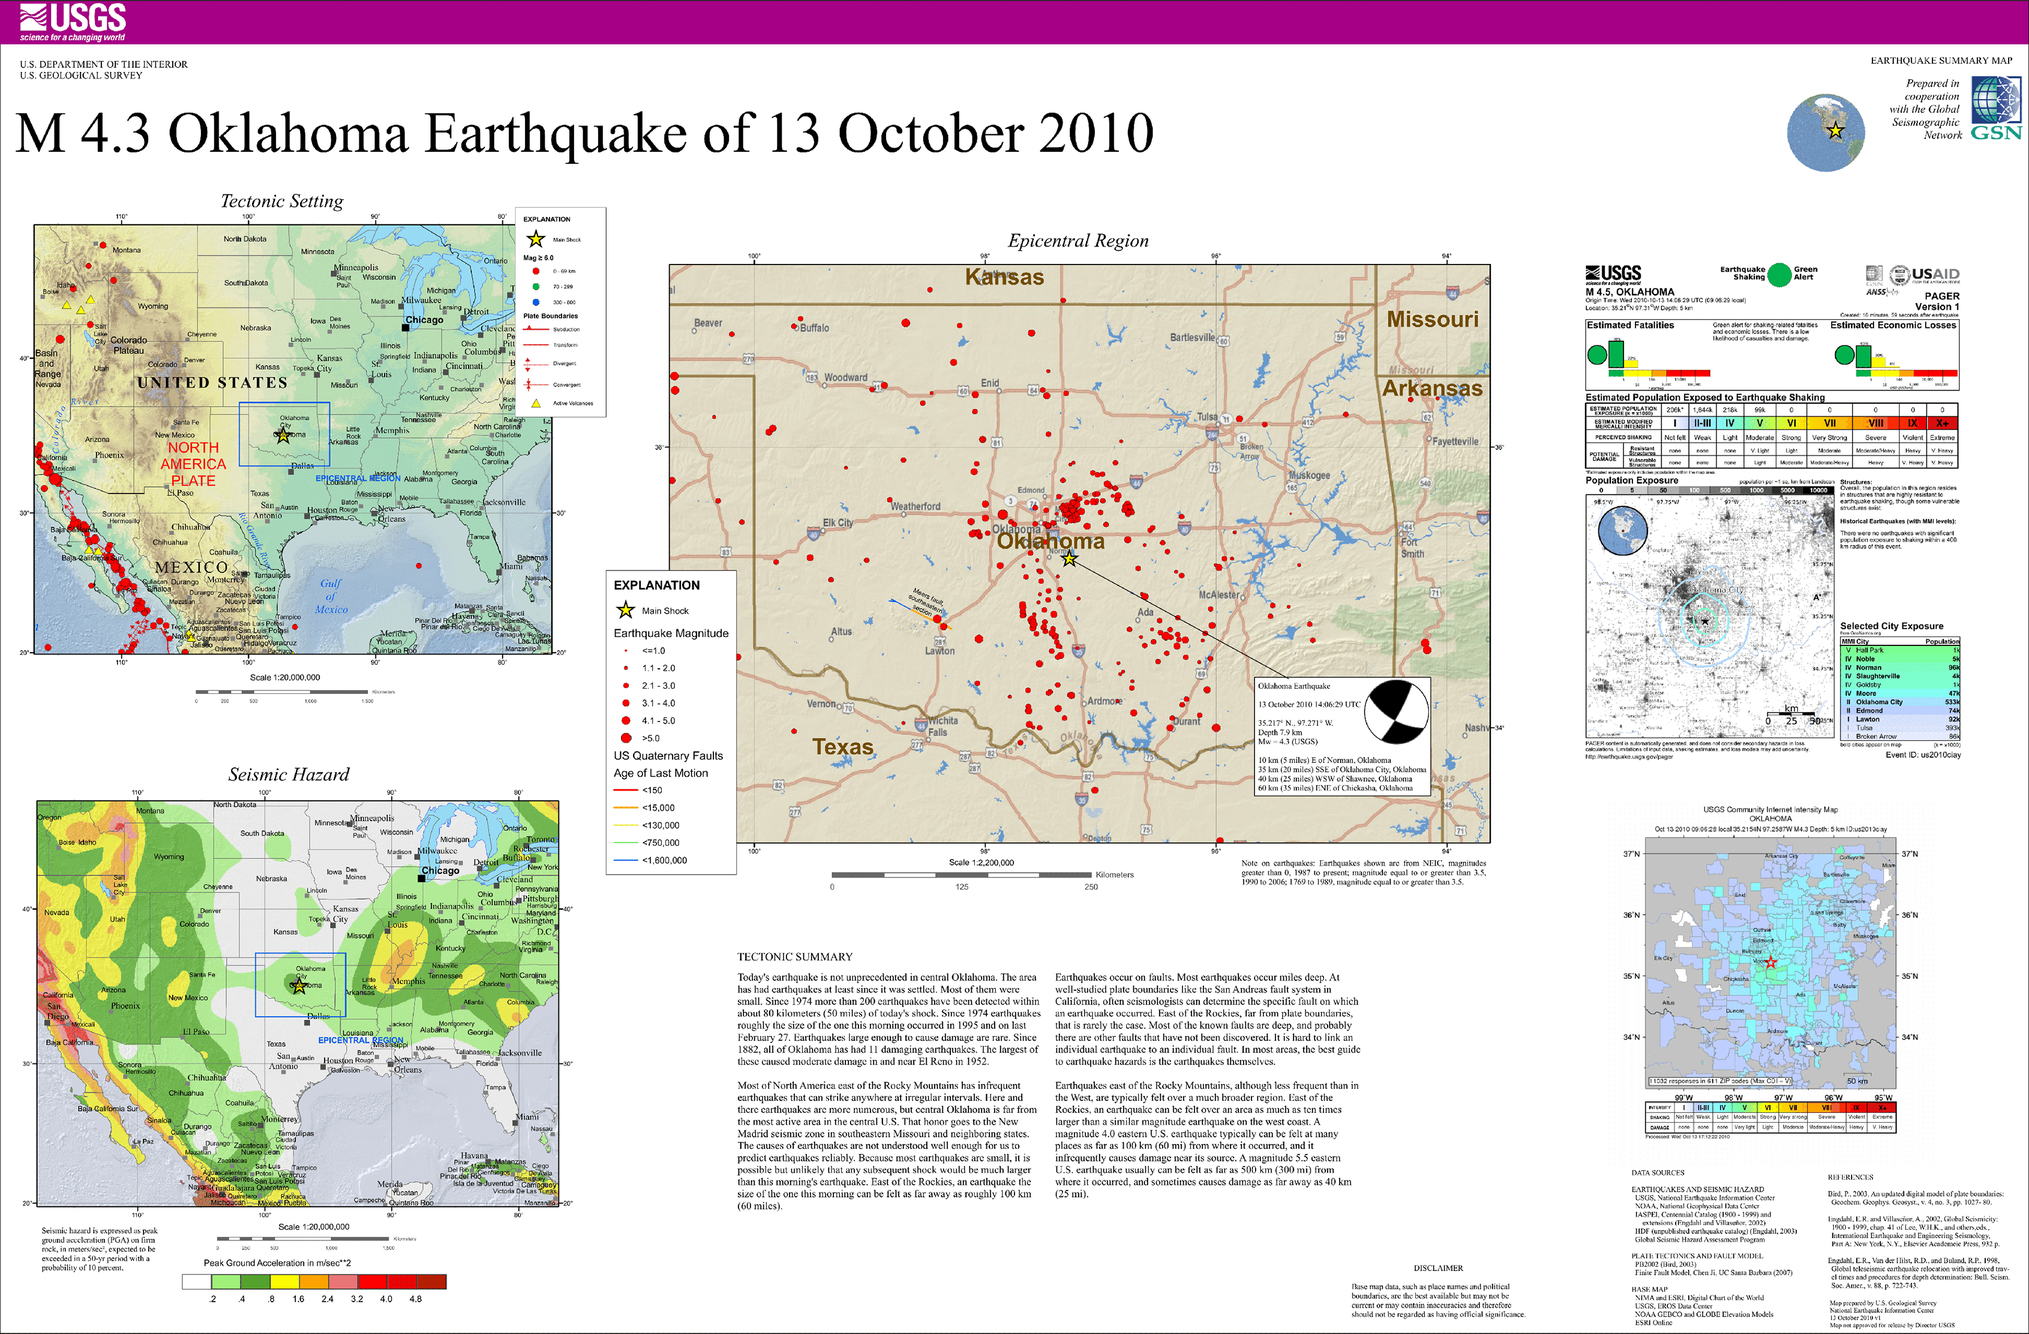
Maps that visualize off-beat topics may also be popular and help to demonstrate the power of modern geospatial technology. In particular, two paranormal topics, UFO and Bigfoot sightings have readily available online datasets that may be loaded into GIS software to create maps. Also, attractive maps representing these phenomena may be found online at various sources for purchase or download. There are several websites that collect and display UFO sightings, but the National UFO Reporting Center has an accessible online database of sightings that is searchable by the date of the sighting, the state where the sighting occurred, and the shape of the UFO observed (Davenport, n.d.). These data may be easily joined to other geospatial data layers to symbolize the locations of UFO sightings. On the Sasquatch side, the Bigfoot Field Researchers Organization’s Geographic Database of Bigfoot/Sasquatch Sightings & Reports has a similar database of sighting locations, albeit for terrestrial curiosities (BFRO.net, 2016). While both of these topics might seem silly, maps showing local paranormal activities would draw interest from patrons and may be used as icebreakers to introduce people to the geospatial technologies used to create them.
Promoting the availability of geospatial technologies may take a bit more effort than hanging posters. Not unlike more traditional library research resources, the tools used to find and work with geospatial data require some hands-on training for most patrons. Unfortunately, training on how to use GIS packages such as ArcGIS is too complex for a single afternoon’s session given the learning curve of the software. That being said, simpler software such as Google Earth and many of the online resources described in Chapter 7 would be good candidates for sessions focused on collecting and displaying specific geospatial data. This could take the form of a training session on how to search the U.S. Census Bureau for data on specific demographic topics, or it could be showing patrons how to use the National Geologic Map Database to find both current and historic geologic maps. For more GIS-literate audiences, sessions could be held promoting the various sources of publicly available data that may be found online. Naturally, any resources that are specific to a local institution would be excellent candidates for public promotion as well.
Beyond local resources, there are several national and international events that exist to promote the Geosciences and GIS technology. Geography Awareness Week (GAW) was created in the United States near the end of President Reagan’s second term in office, and is held on the third week of November each year (Reagan, 1988). The week is a way to promote geographic education and to raise awareness of the role that geographic knowledge and inquiry play in our lives. Past years have had specific themes such as rivers, Africa, or exploring public lands. Future GAWs will continue to have a slogan focused on one component of geography, but participants are encouraged to explore all aspects of geography (National Geographic Society, 1996–2016a).
Major planning for GAW is provided by National Geographic, but many other organizations assist and host their own events, including the American Association of Geographers, Esri, and the National Education Association (NEA). Local organizations and institutions are encouraged to take part in GAW by hosting their own events, and many of the major partners provide resources for doing so. For example, the NEA has educational lesson plans and activities tailored for grade school, middle school, and high school aged students (National Education Association, 2016). Likewise, National Geographic also provides material available for local hosts along with how-to instructions for gatherings, webinars, and other forms of public outreach (National Geographic Society, 1996–2016b).
As a complement to GAW, GIS Day was founded by Esri as an opportunity to promote the impact that GIS has on the world (Esri, n.d.). GIS Day happens yearly on the third Wednesday of November in the middle of GAW. The first official GIS Day was held in 1999, and Esri continues to support the event by providing free resources at http://www.gisday.com/ for local event hosts. These resources include templates, videos, and logos that hosts may include in their promotional materials, free eBooks on GIS and how it relates to global issues, and hands-on GIS activities. The activities are prepared such that they are appropriate for separate audiences like children, young adults, and adults. These activities provide ready-made GIS data and resources for demonstrations or to be used as exercises for students. Weimer, Olivares, and Bedenbaugh (2012) suggested that if libraries participate in GIS Day, a recommended marketing practice would be to have a dedicated webpage on these past and future outreach events.
Not to be outdone by the geographers, the American Geosciences Institute (AGI) has promoted Earth Science Week (ESW) on the second week of October each year since 1998 (American Geosciences Institute, 2016). Just like GAW or GIS Day, ESW is a way to promote geosciences education and public awareness. The AGI provides information on existing gatherings, as well as resources for hosting your own event. Available materials for educators include the Earth Science Week Toolkit with various posters and educational materials, and lesson plans and activities designed to function at different grade levels. As there is a good deal of content overlap between ESW, GAW, and GIS Day, all three are perfect opportunities to promote the geosciences, spatial literacy, and local geospatial resources.
Geocaching is another way a library could promote local resources and encourage patrons to participate in geospatial activities. For those who are not already familiar with geocaching, it is a GPS-enabled treasure hunt where participants are provided coordinates for hidden caches of items. Typically, participants are expected to record their participation in a physical cache log left in the cache, and if they take any items from the cache, they are expected to leave something of equal or greater value and to avoid leaving troublesome items such as weapons or drugs. Geocaching first took off in popular culture after the Selective Availability function of Navstar GPS satellites was turned off. Prior to this, GPS accuracy was too poor to effectively locate small hidden objects in the landscape. Additionally, in the early days of GPS functionality participants were required to have expensive dedicated units to locate caches. Today, the ubiquity of GPS-enabled smartphones, tablets, and wearable technology has opened up the activity to many more participants as multiple apps, both free and paid, are available on Android and iOS.
Anyone may set up their own caches, and posting the locations may be done through a variety of methods. For locally focused geocaching, such as an event promoting local library or community facilities, the location of caches may be published and distributed in any format, such as a printed flyer or library website. If a larger reach is desirable, there are multiple websites where cache locations may be submitted for hosting. Groundspeak’s https://www.geocaching.com/ is one of the largest, although it is a commercial operation with some features only available to paying customers (Groundspeak, 2016). The OpenCaching Network, not to be confused with http://opencaching.com, a now-defunct website sponsored by GPS manufacturer Garmin, is a free option that has websites covering North America and many of the major European countries (OpenGeoWiki, 2016).
While traditional geocaching has focused on open participation of placing and finding physical items, smartphones have enabled gamified activities that are similar to geocaching, but with commercial aims. Munzee uses QR codes as markers rather than physical caches. Instead of rewarding players with objects, they receive points for placing and finding these codes which allow them to gain levels within the Munzee system. In addition to the game component, the Munzee system also allows businesses to advertise and offer discounts to players who find their hidden QR codes. Another similar but more strongly gamified activity is the smartphone app Ingress. Available on both Android and iOS, Ingress takes an augmented-reality approach where players find portals in the physical world located at real-world landmarks via their smartphones. The control of these portals allows for a back-and-forth team-based exercise in territorial control. The company that created Ingress, Niantic, Inc., is also responsible for the Pokémon GO smartphone and tablet augmented reality game, and it shares some similarities with Ingress in terms of structure and how the GPS component is used. Of the three commercial apps described here, Pokémon GO is the closest to a traditional geocaching activity, as players must visit specific locations verified by their GPS coordinates in order to capture virtual Pokémon, not unlike opening a physical cache. As commercial endeavors, none of these apps are suited to open administration like traditional geocaching, which has no real centralized governing organization. Regardless, patrons may have used these apps, and they may provide an avenue to expose and educate people about geospatial technologies.
Effective use of geospatial resources may require convincing both patrons and administrators that they provide value. Many people today understand the value of these resources more so than in the past, but that does not mean that budget and space constraints would suddenly disappear. The public promotion of geospatial holdings and research resources may help to raise awareness that these resources are valuable and should be supported within the institution. As geospatial technologies become more and more prevalent and important, librarians would be smart to increase their participation in the promotion and education of geospatial topics.
In the beginning, this book introduced maps and librarians from the perspective that maps have served to orient lives and navigate landscapes, creating a sense of place throughout the years. Librarians began as caretakers of these resources, but map and geospatial librarianship does not have a sense of place in every library today.
With the advent of online mapping programs, the public has the potential to be geographers and cartographers, sharing in map-making experiences by crowdsourcing relevant information gathered via social media and sharing it online. Librarians have moved from individual card catalogs in each library building to contributing to a worldwide cataloging system, Worldcat. If library catalogs include map and geospatial data resource collections, then these resources could be shared wherever Internet access is available.
However, a report on community perceptions of libraries concluded that no one started an information search on a library website, and 75% of Americans surveyed associated libraries primarily with books (OCLC, 2011). The public’s perception is firm that the library brand is books, not maps, spatial data, or the multitude of resources a modern library holds. Nevertheless, librarians keep preserving the past, while organizing and providing access to current resources. Fig. 11.3 depicts the state of the world through the visual representation of a map. This document has existed for centuries. A challenge for librarians today is to ensure the same preservation status for natively digital maps produced today.
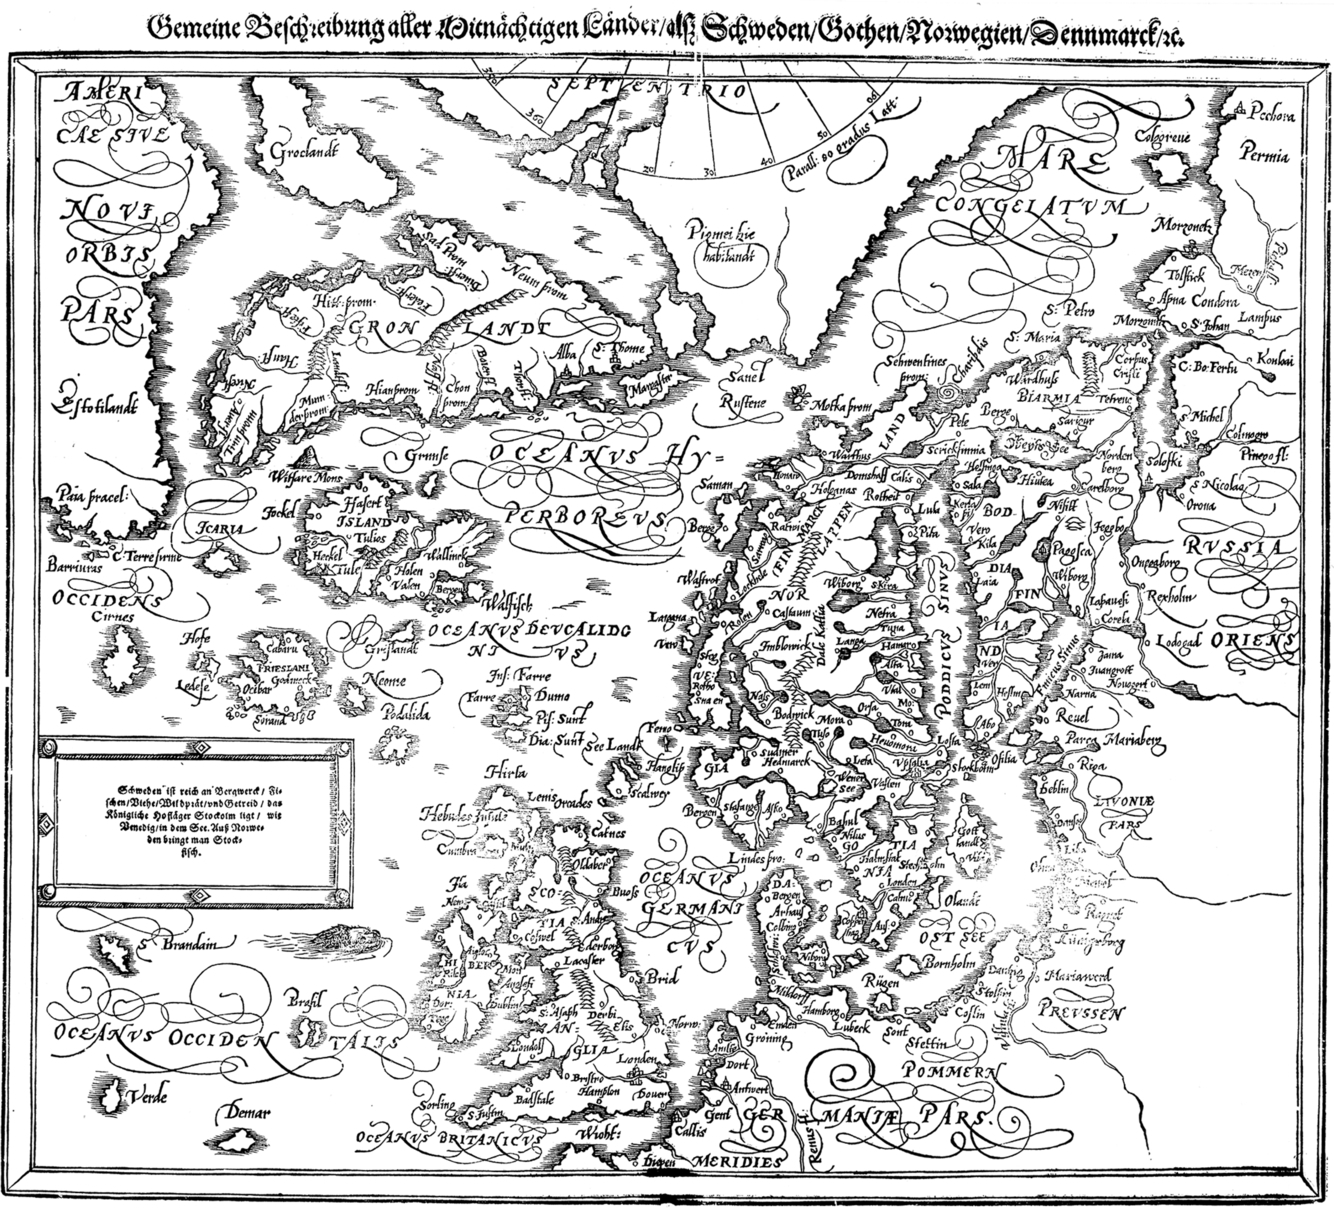
The evolution in map-making resources and techniques is entwined with neogeography that leverages technology for social change, as well as the digital platforms made possible by neocartography. In general, the evolution of map librarianship and GIS collections and services has not kept pace with the ubiquitous geospatial revolution. Map librarianship course work in academic library school programs began with the University of Illinois in the 1950s and now some courses are offered by a few LIS programs. In any case, map librarianship has extraordinary, geo-literate neomap librarians who are willing to share their expertise through professional group support networks.
This book is for librarians who “grew up” knowing the text-based book, but want to gain confidence as map librarians and enhance their geoliteracy. Each chapter provides pieces in the geoliteracy puzzle and creates a path to navigate the maze of resources and formats that map and GIS users need. The focus shifts from an emphasis on resources to services as well as the duties for map and geospatial librarians. In addition to knowing the subject, map librarians have the opportunity to handle aspects from research and reference resources to collection development and cataloging services. It is the responsibility of map librarians to preserve print and digital resources as well as promote map and spatial data collections to the public and to colleagues and library administration.
Maps and geospatial data have interdisciplinary applications for public policy-based research as well as research in geography and the geosciences, environmental sciences, health studies, history, sociology, bioscience, marketing, and many more fields. GIS has been in libraries since the 1990s and the Association of Research Libraries GIS Literacy Project of 1992 was the first coordinated effort to educate librarians in access and use of spatial data and GIS software. Maps and geospatial data are important in libraries, but in many ways, libraries are just now responding to the geospatial revolution. While challenges remain, librarians must promote these valuable resources to increase visibility and add geospatial resources and technologies to the public’s perception of the library.
Bill M. Woods taught the second course ever on map librarianship at the Library School, University of Illinois beginning in 1951. The course outline and reading list for LS306, Map and Cartobibliographical Aids, was filed in the University Archive on Feb. 6, 1951, University of Illinois at Urbana-Champaign Archives, Record Series 18/1/15, Box 46. The Archive's staff kindly provided the document to be viewed. Below is a derivative work, an updated summary of the contents. Unfortunately, the mid-20th century typewriter ambiance is missing, but all briefly listed readings are expanded to full citations.
Woods (1951) described the course as “an examination of the problems involved in cataloging, classification, and care of maps … the student will become acquainted with the major cartobibliographical and related aids in the field” (p. 1). The course was for two credit hours and required three oral and written reports as well as a final exam.
The first one-third of the course was an Introduction to Maps and Map Libraries with four subsections: (a) map nomenclature; (b) history of maps; (c) map activity; (d) map libraries. The reading list shown below was modified from Woods' original outline.
Boggs, S. W., Lewis, D. C., & Special Libraries Association. (1945). The classification and cataloging of maps and atlases. NY: Special Libraries Association.
Bagrow, L. (1935). Imago mundi: A periodical review of early cartography. London: H. Stevens & Stiles.
Brown, L. A., & Lessing J. Rosenwald Reference Collection (Library of Congress). (1949). The story of maps. Boston: Little, Brown.
Holman, L. A. (1926). Old maps and their makers considered from the historical & decorative standpoints: A survey of a huge subject in a small space. Boston: Charles E. Goodspeed & Co.
Jervis, W. W. (1938). The world in maps: A study in map evolution. NY: Oxford University Press.
Raisz, E. (1948). General cartography. NY: McGraw-Hill Book Co.
Tooley, R. V. (1949). Maps and map-makers. London: Batsford.
New York Public Library, Brown, K., Wright, W. E., & Rankin, R. B. (1941). A guide to the reference collections of the New York Public Library. NY: The New York Public Library.
“Platt, E. T., Map department of the American Geographical Society” (Woods, 1951). Although this resource was not located, Yonge (1955) seems the closest match.
The Library of Congress. (1946). Departmental & divisional manuals. No. 15 map division. Washington, DC.
United States. (1938). Map collections in the District of Columbia. Washington, DC.
Yonge, E. L. (March 01, 1955). The Map Department of the American Geographical Society. The Professional Geographer, 7(2), 2–5.
The second section of the course was on cartobibliographic aids with nine subsections: (a) works treating maps in general; (b) cartobibliographies proper; (c) catalogs of individual collections; (d) catalogs of governmental mapping agencies; (e) catalogs of commercial mapping agencies; (f) catalogs of societal mapping agencies; (g) periodicals; (h) atlases; (i) gazetteers and miscellaneous aids. Woods' reading list was modified from the outline and is shown below.
Birch, T. W. (1949). Maps, topographical and statistical. Oxford: Clarendon Press.
Greenhood, D., Graeter, R., & Eichenberg, F. (1944). Down to earth: Mapping for everybody. NY: Holiday House.
Hinks, A. R. (1944). Maps and survey. Cambridge, England: University Press.
Modern Cartography. (1949). Lake Success, NY: United Nations.
Raisz, E. (1948). General cartography. NY: McGraw-Hill Book Co.
United States. (1947). Manual of instructions for the survey of the public lands of the United States, 1947. Washington, DC: U.S. Government Printing Office.
American Geographical Society. (1930). A catalogue of maps of Hispanic America: Including maps in scientific periodicals. NY: American Geographical Society.
Chubb, T., Skells, J. W., & Beharrell, H. (1927). The printed maps in the atlases of Great Britain and Ireland: A bibliography, 1579–1870. London: The Homeland Association, Ltd.
Copyright Office. (1947). Catalog of copyright entries. Washington, DC: U.S. Government Printing Office. [“Vol. 4” is in the outline, but not sure this is the exact citation intended.]
Foncin, M., & Sommer, P. (1949). Bibliographie cartographique internationale, 1946–1947. Paris.
Karpinski, L. C., Jenks, W. L., & Michigan Historical Commission. (1931). Bibliography of the printed maps of Michigan, 1804–1880: With a series of over one hundred reproductions of maps constituting an historical atlas of the Great Lakes and Michigan. Lansing, MI: Michigan Historical Commission.
University of Chicago, & Kuhlman, A. F. (1936). Atlases in libraries of Chicago: A bibliography and union check list, the University of Chicago libraries, document section. Chicago.
Catalogue of the printed maps, plans, and charts in the British Museum. (1885). London: British Museum.
Edward E. Ayer Collection (Newberry Library), & Smith, C. A. (1927). List of manuscript maps in the Edward E. Ayer collection. Chicago.
Geographic Board of Canada. (1922). Catalogue of the maps in the collection of the Geographic Board. Ottawa: F. A. Acland.
Library of Congress, & Le Gear, C. E. (1950). United States atlases: A list of national, state, county, city, and regional atlases in the Library of Congress. Washington, DC.
Library of Congress, & Phillips, P. L. (1901). A list of maps of America in the Library of Congress: Preceded by a list of works relating to cartography. Washington, DC: Government Printing Office.
Library of Congress, Phillips, P. L., & Le Gear, C. E. (1909). A list of geographical atlases in the Library of Congress: With bibliographical notes. Washington, DC: s.n.
Lowery, W., Phillips, P. L., & Library of Congress. (1912). The Lowery collection: A descriptive list of maps of the Spanish possessions within the present limits of the United States, 1502–1820. Washington, DC: Government Printing Office.
Winsor, J. (1886). The Kohl collection of maps relating to America. Cambridge, MA: Issued by the Library of Harvard University.
Bowman, N. M. (1953). Publications, maps and charts sold by U.S. government agencies other than the superintendent of documents. Special Libraries, 44(2), 53–65.
Thiele, W., Kuhlman, A. F., & American Library Association. (1938). Official map publications: A historical sketch, and a bibliographical handbook of current maps and mapping services in the United States, Canada, Latin America, France, Great Britain, Germany, and certain other countries. Chicago: American Library Association.
U. S. Geological Survey. [This is as specific as Woods was in the course outline.]
United States. (1940). United States Government publications monthly catalog. Washington, DC: U.S. Government Printing Office.
Geographical Review. (1916). NY: American Geographical Society of New York.
Journal of Geography. (1917). Indiana: Ed. National Council for Geographic Education.
Library Journal. (1954). NY: Cahners Publishing Company.
Surveying and Mapping. (1949). Washington, DC: American Congress on Surveying and Mapping.
The Geographical Journal. (1939). Great Britain: Royal Geographical Society.
The Journal of Geology. (1942). Chicago: University of Chicago Press.
The Professional Geographer. (1949). Oxford: Blackwell Publishers.
Ristow, W. W. (1945). A survey of the world atlases. Library Journal, 70(2), 54–57, 100–103.
Wright, J. K., & Platt, E. T. (1947). Aids to geographical research: Bibliographies, periodicals, atlases, gazetteers and other reference books. NY: Published for the American Geographical Society by Columbia University Press.
Adams, J. T., & Coleman, R. V. (1943). Atlas of American history. NY: Charles Scribner's Sons.
Bartholomew, J. G. (1922). The Times survey atlas of the world. London: The Times.
Bartholomew, J., & John Bartholomew and Son. (1947). The citizen's atlas of the world. Edinburgh: John Bartholomew & Son, Ltd.
Bertarelli, L. V., & Touring Club Italiano. (1951). Atlante internazionale del Touring Club Italiano. Milano: Touring Club Italiano.
Clark, A. W., & W.W. Hixson & Co. (1943). Atlas of Champaign County, Illinois, 1943. Rockford, IL: W.W. Hixson & Co.
Goode, J. P. (1943). Goode's School atlas: Physical, political, and economic, for American schools and colleges. NY: Rand McNally.
Great Soviet world atlas. (1948). Ann Arbor, MI: Edwards Bros.
Hudson, G. D., & Encyclopaedia Britannica. (1942). Encyclopaedia Britannica world atlas: Unabridged. Chicago.
Illinois Post-War planning commission committee on resources.
Nielsen, N., & Kongelige Danske geografiske selskab. (1949). Atlas over Danmark: Atlas of Denmark. København: Det Kongelige Danske geografiske selskab.
Paullin, C. O., Wright, J. K., & American Geographical Society of New York. (1932). Atlas of the historical geography of the United States. Washington, DC.
Rand McNally and Company. (1800). Commercial atlas and marketing guide. Chicago.
Rand McNally and Company. (1951). Cosmopolitan world atlas. Chicago.
Rimli, E. T., & Visintin, L. (1949). Neuer Welt-Atlas: Land und Wirtschaft aller Staaten [in über 500 geographischen, politischen, wirtschaftlichen, klimatischen, geologischen und konfessionellen Karten und Stadtplänen]. Zürich: Franmünster.
Sanborn-Perris Map Co. (1897). Urbana, Campaign [sic] Co., Ill., Nov. 1897. NY: Sanborn-Perris Map Co.
Siborne, W. (1946). History of the war in France and Belgium in 1815 vol 1: Containing minute details of the battles of Quartre-Bras, Ligny, Wavre, and Waterloo. Place of publication not identified: T. and W. Boone. [Potential equivalent to: Comité National Fracasis de Géographie, Altas de France.]
Stieler, A., Haack, H., Carlberg, B., & Schleifer, R. (1934). Stieler's Atlas of modern geography: 263 maps on 114 sheets engraved on copper. Germany: Justus Perthes.
Irish, K. (1950). What about gazetteers? Library Journal 75, 447–448.
Educators Progress Service. (1940). Educators index of free materials. Randolph, WI: Educators Progress Service.
Great Britain. (1941). Syria: Index gazetteer showing place-names on 1:200,000 map series [Gazetteer]. 1:200,000. Cairo: Survey Directorate.
Heilprin, A., & Heilprin, L. (1906). Lippincott's new gazetteer: A complete pronouncing gazetteer or geographical dictionary of the world, containing the most recent and authentic information respecting the countries, cities, towns, resorts, islands, rivers, mountains, seas, lakes, etc., in every portion of the globe. Philadelphia: J.B. Lippincott.
National Geographic Society Cartographic Division. (1948). North Central United States. Washington, DC: The National Geographic Society.
Permanent Committee on Geographical Names for British Official Use. (1926). List of names in Romania. London: for the Permanent Committee on Geographical Names by the Royal Geographical Society.
Seely, P. A., & Sealock, R. B. (1955). Place name literature, United States and Canada, 1952–1954. Berkeley: University of California Press for the American Name Society.
U.S. Army Map Service. (1945). Gazetteer to maps of Formosa (Taiwan): Map series AMS L792, scale 1:50,000, January 1945 [Gazetteer]. 1:50,000. Washington, DC: War Department, Army Map Service, Corps of Engineers, U.S. Army.
United States Board on Geographical Names. (1935). Decisions of the United States Board on Geographical Names. Washington, DC: Board on Geographical Names.
United States Geographic Board. (1933). Sixth report of the United States Geographic Board, 1890 to 1932. Washington, DC: U.S. Government Printing Office.
United States. (1950). Supplement to Hydrographic Office publication no. 123a, sailing directions for Japan, volume I. Washington, DC: U.S. Government Printing Office.
U.S. Coast and Geodetic Survey. (1949). United States coast pilot. Gulf Coast, Key West to Rio Grande. Washington, DC: Government Printing Office.
Webster's geographical dictionary: A dictionary of names of places with geographical and historical information and pronunciations. (1949). Springfield, MA: Merriam.
Writers' Program of the Work Projects Administration in the State of Illinois. (1939). Illinois: A descriptive and historical guide. Chicago: A. C. McClurg & Co.
The final section of the course was on physical care and treatment, classification, cataloging, and rare maps. Physical care covered mounting and storage. An overall classification system suggested the record order was area, area-subject, and subject. An overall cataloging system was shown by author, title, imprint, technical notes, and subject headings. Several different classification and cataloging systems were presented that had printed manuals. Storage, cataloging, and classifying aspects of rare maps were discussed separately, and lastly, the use of maps was covered. Reading lists were modified from Woods' outline, shown below.
U.S. Library of Congress Division of Maps. (1949). Maps; Their care, repair and preservation in libraries. Washington, DC.
American Geographical Society of New York, Yonge, E. L., & Hartzell, M. E. (1952). Manual for the classification and cataloguing of maps in the society's collection. NY: American Geographical Society.
Boggs, S. W., Lewis, D. C., & Special Libraries Association. (1945). The classification and cataloging of maps and atlases. NY: Special Libraries Association.
Heaps, J. D. (1998). Tracking intelligence information: The office of strategic services. American Archivist, 61(2), 287–308. Available from https://babel.hathitrust.org/cgi/pt?id=mdp.39015071393899;view=1up;seq=803 Heaps details the process, explaining lost and destroyed OSS records as well as the Research and Analysis Branch (R&A) index cards with abstracts of OSS reports and Central Information Division (CID) Decimal Classification Filing system that are now located in the National Archives and Records Administration (NARA).
Parsons, E. J. S., & Great Britain. (1946). Manual of map classification and cataloguing: Prepared for use in the directorate of military survey, war office. London.
Library of Congress. (1954). Classification. Class G; geography, anthropology, folklore, manners and customs, recreation. Washington, DC.
United States. (1947). Guide to the Williams system map subject classification and cataloging in use at Map Library, the Army Map Service. Place of publication not identified.
U.S. Office of Strategic Services (OSS), Cataloger's manual – This document was not located, but an article may be of interest is Heaps (1998), as shown above.
Wilson, L. S. (1948). Library filing, classification and cataloging of maps: With special reference to wartime experience. Place of publication not identified: publisher not identified.
American Geographical Society of New York, Yonge, E. L., & Hartzell, M. E. (1952). Manual for the classification and cataloguing of maps in the society's collection. NY: American Geographical Society.
American Library Association. Division of Cataloging and Classification. (1949). A.L.A. cataloging rules for author and title entries (2nd ed.). Chicago: American Library Association.
Anderson, O. C. (1950). No best method to catalog maps. Library Journal, 75, 450–452.
Boggs, S. W., Lewis, D. C., & Special Libraries Association. (1945). The classification and cataloging of maps and atlases. NY: Special Libraries Association.
Library of Congress. (1949). Rules for descriptive cataloging in the Library of Congress. Washington, DC: Library of Congress, Descriptive Cataloging Division.
Murphey, M. (1945). The Army Map Service Library-map cataloging. Special Libraries, 36(5), 157–159.
Parsons, E. J. S., & Great Britain. (1946). Manual of map classification and cataloguing: Prepared for use in the directorate of military survey, war office. London.
Snider, F. E. (1945). Suggested map arrangement for the general library. Library Journal, 70, 471–474.
United Nations, & United Nations. (1949). Nomenclature of geographic areas for statistical purposes. Lake Success, NY: United Nations.
Wilson, L. S. (1948). Library filing, classification and cataloging of maps: With special reference to wartime experience. Place of publication not identified: publisher not identified.
Brown, L. A. (1941). Notes on the care & cataloguing of old maps. Windham, CT: Hawthorn House.
Student-learning outcomes (SLOs) identified by a two-year Geographic Information Librarianship (GIL) project by Drs. Wade Bishop and Tony Grubesic as described in Chapter 6 (Bishop, Cadle, & Grubesic, 2015). In order to design the GIL courses, researchers surveyed practicing GIS and map librarians to determine the most important MAGIRT competencies. Out of 75 core competencies, 23 were identified as most important, which led to these 13 SLOs. This appendix is modified from Bishop’s webinar (2014).
| Course section | SLO |
| 1. Geography and cartography | 1.1 Students will demonstrate principles such as scale, projection, grids, and coordinate systems |
| 2. Collection development/Records appraisal/Collection maintenance | 2.1 Students will demonstrate understanding of local to international mapping agencies and publishers as well as the Federal Depository Library Program; in addition, students will recognize gazetteers, data, and volunteered geographic information and aspects of the FDLP 2.2. Students will demonstrate ability to access maps, imagery, and additional geospatial data 2.3 Students will describe proper copyright principals and licensing agreements for geographic collections and databases 2.4 Students will explain how assessment and user needs inform collection development 2.5 Students will describe care and preservation methods for rare and fragile materials |
| 3. Reference and instruction | 3.1 Students will demonstrate how to locate geospatial data and subsequent software support 3.2 Students will locate GIS tutorials and training 3.3 Students will demonstrate knowledge for geographic information consultations |
| 4. Metadata/Cataloging | 4.1 Students will describe standards for metadata 4.2 Students will demonstrate knowledge of metadata in geospatial records 4.3 Students will define physical characteristics needed to create metadata for cartographic items 4.4 Students will explain cartographic scale |
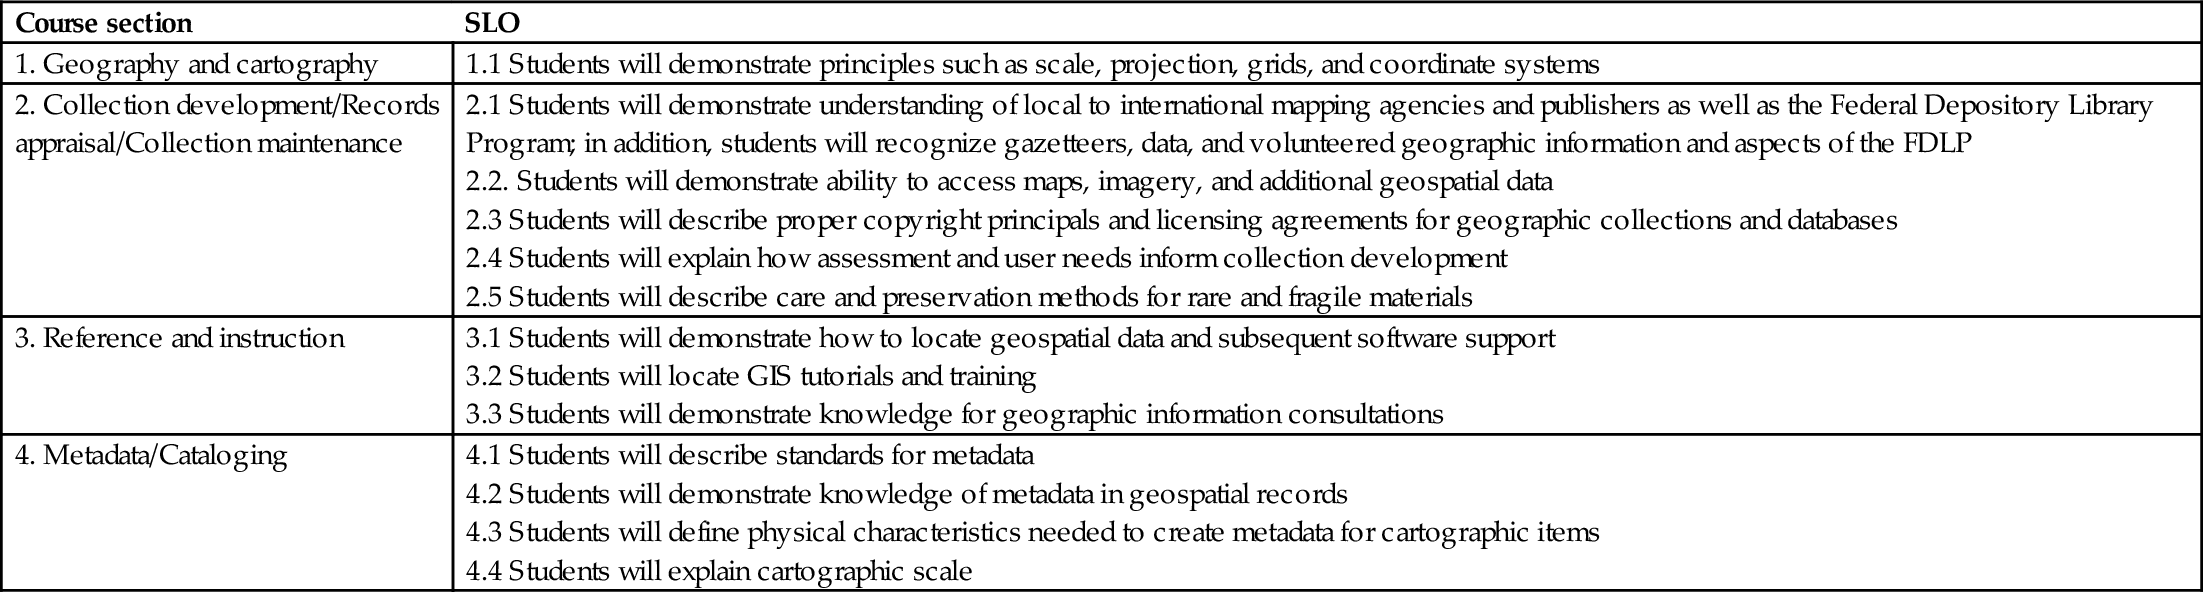
The following guidelines demonstrate the process and procedure for copy cataloging maps when there is a physical map in hand. One U.S. Geological Survey topographic map is used as an example.
• Check and verify that the map is not already in the local online catalog.
• Search the OCLC utility by title to verify the exact map is in the global system.
• After verifying that original cataloging is not needed, log on to OCLC and locate the exact map record.
• Import the record into the local online catalog, which will be similar to the workflow information shown below, see Fig. C.1.
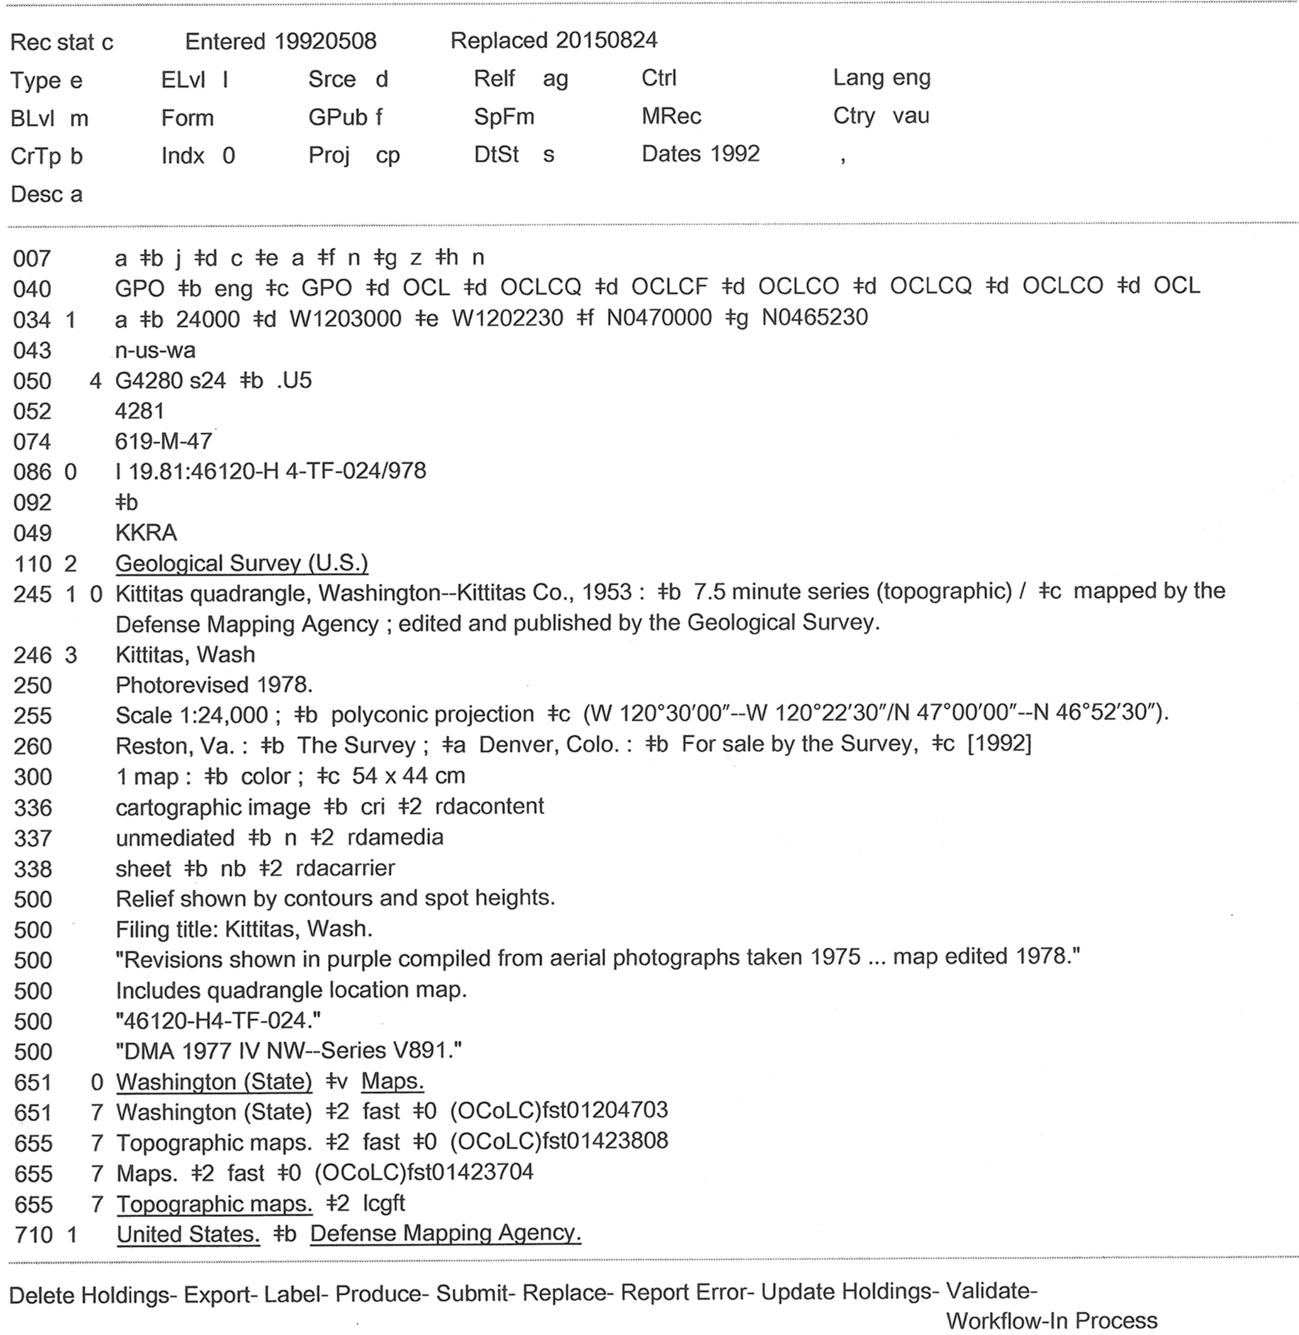
The field numbers shown on the workflow document, Fig. C.1, are briefly defined later. For a review, basic map cataloging information is given by Moore and Hall (2001). The primary encoding standards for cataloging with AACR2 are MARC and MARC 21, which are explained at Library of Congress (2009a, 2009b). RDA in MARC 21 is described at Library of Congress (2014). For more information on resources explaining RDA, the newest content cataloging system, see OCLC (2016a). Finally, the Library of Congress uses RDA in combination with BIBFORMAT, which is the newest encoding practices and input standards. Detailed explanations of the fields below are given using the tabs 0xx, 1xx, and so on (OCLC, 2016b). Although BIBFORMAT is currently in the 4th edition, it is being revised (OCLC, 2016e).
007 The category of material (Map); specific material (Two-dimensional, flat medium); color (multicolor); physical medium (paper); type of reproduction (not applicable, it is not a reproduction); production details (no code appropriate); positive/negative aspect (not applicable as it is not a photocopy)
040 Inputting library
034 Scale, latitude, and longitude
043 Subject headings (n is North America, us is Country, wa is U.S. state)
050 LCC number
074 Government document item number
086 SuDocs number designation
092 Local library number
049 Designation of local library
110 Corporate authors, see Fig. C.2: Geological Survey (U.S.)
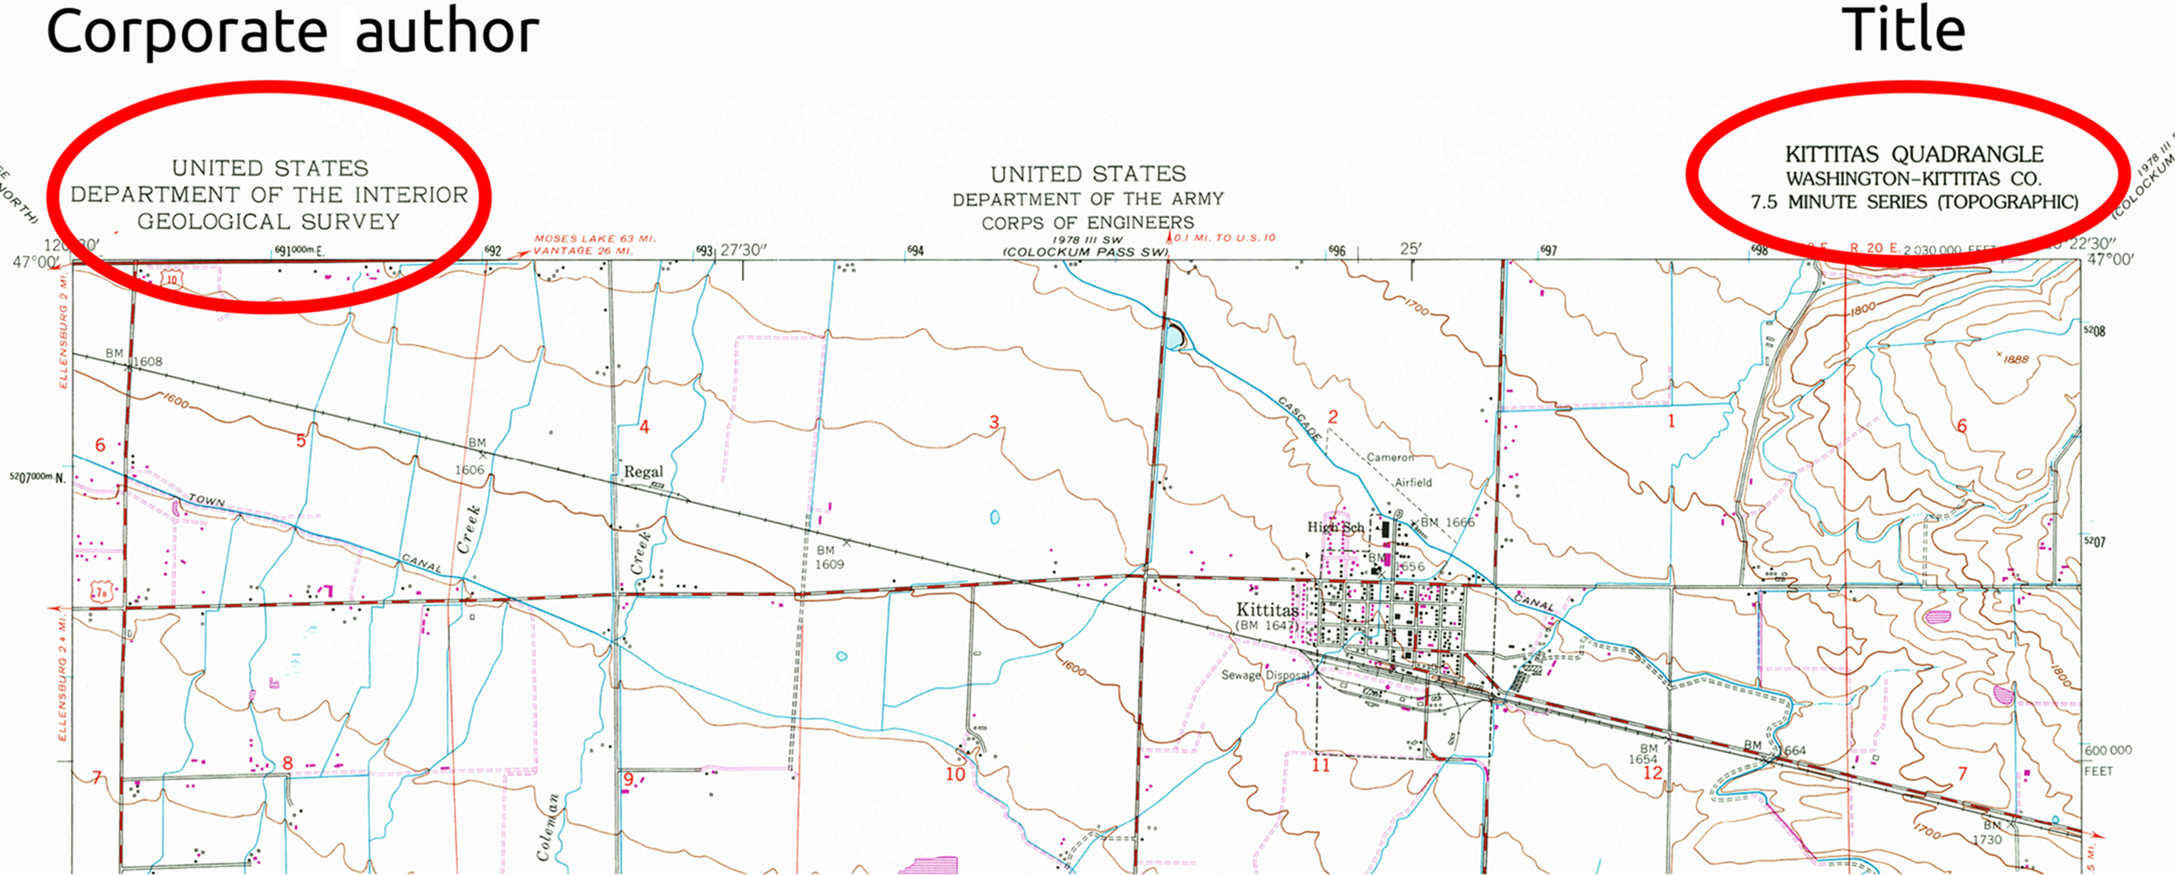
245 Title is shown in Fig. C.2: Kittitas quadrangle, Washington-Kittitas Co. 7.5-minute series (topographic). For filing date and statement of responsibility, see Fig. C.3: 1953, Mapped by the Defense Mapping Agency; edited and published by the Geological Survey
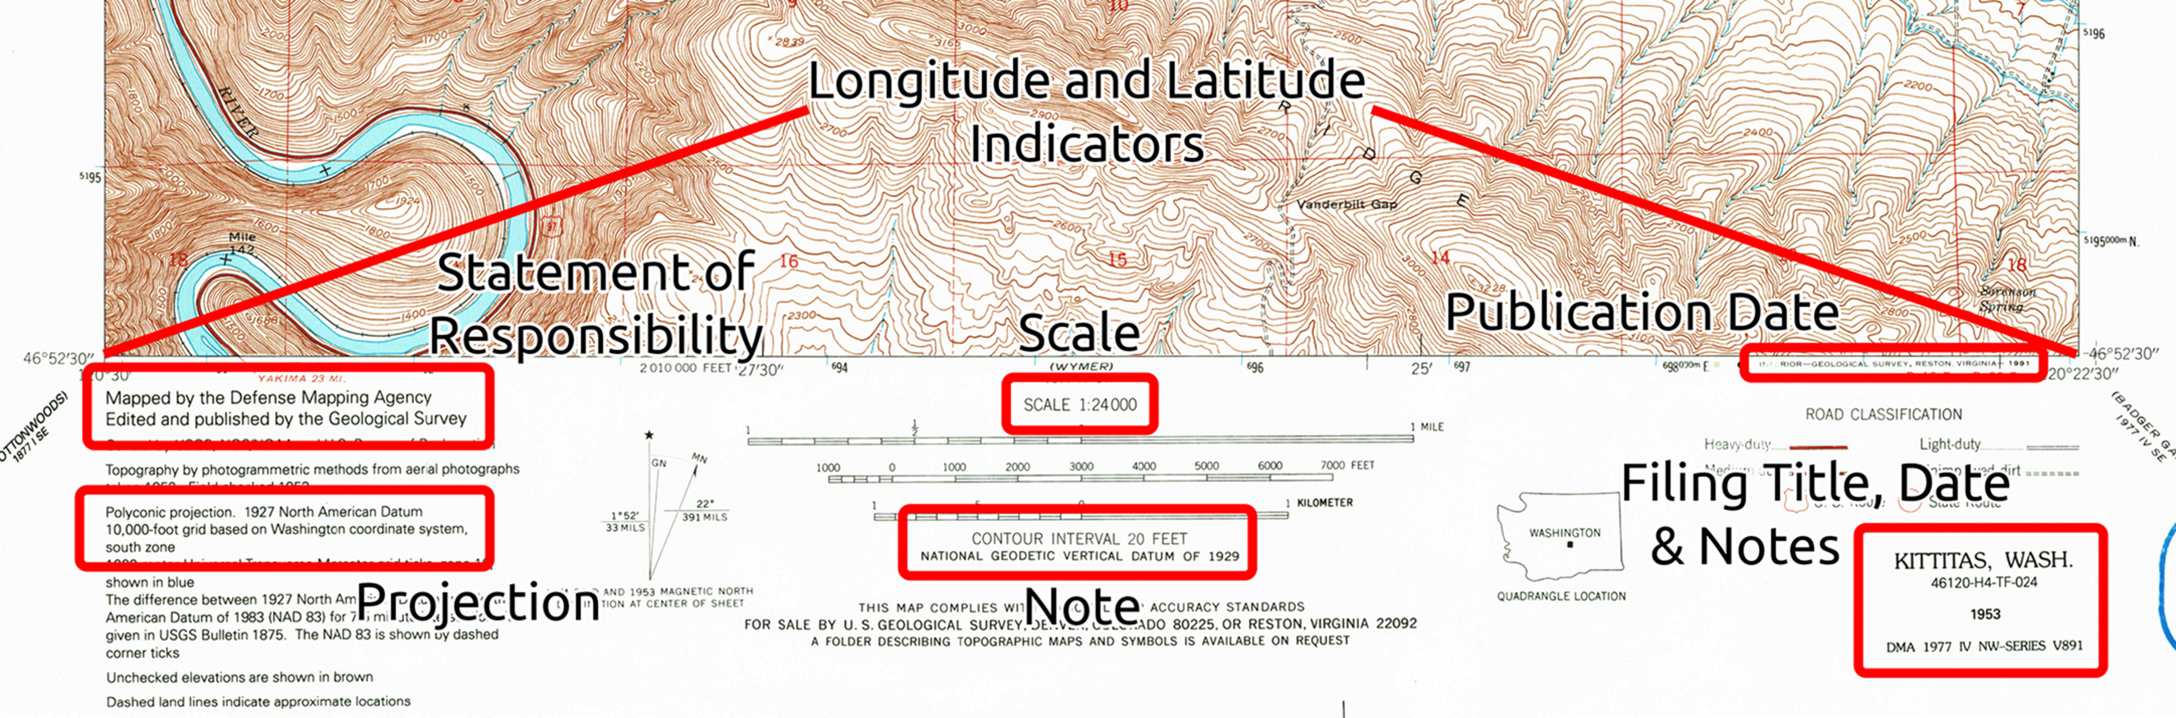
246 Alternative title
250 Edition statement or photorevised
255 Scale, projection, latitude, and longitude
260 Publication date
300 Description and size
336 RDA content type
337 RDA media type
338 RDA carrier type
500 Notes
651 Geographical subject headings such as Washington (state) Maps, Topographic, Kittitas County (WA) Maps, Topographic; Library of Congress Free floating subdivisions such as Maps, Topographic
655 Local subjects; examples are National forests, river, counties, cities, landmarks, etc.
710 Added entry for corporate author
Points to remember:
• All subject headings must be verified in the authority file before adding them to the record workform (OCLC, 2016c).
• It is wise to consider how the map is used with class assignments and add detailed subject headings in 655 to enhance search results to display relevant sources for the assignment.
• Verify the Public Catalog Copy Entry, see Fig. C.4.
Copy Catalog is now complete. For an original catalog example, the OCLC search must show the map is not in the global system. An example would be a map created for a local thesis or dissertation that was unique to the institution; if that were the case, original cataloging would be needed.
Note: Page numbers followed by f indicate figures and t indicate tables.
A
B
C
D
E
F
G
H
I
J
K
L
M
N
O
P
Q
R
S
T
U
V
W
First Edition
Why Map Librarianship and Geoliteracy?
Chapter 1: Introduction to Maps and Librarians
1.3 Historic Progression of Maps and Cartographers
1.4 What Are NeoGeography and NeoCartography?
1.5 Historic Progression of Map Librarianship
1.6 What Is NeoMap Librarianship?
Chapter 2: Spatial Thinking and Geo-Literacy
2.1 Geo-Literacy: Location-Based Spatial Thinking
2.3 Reference and Thematic Maps
2.4 Mapping Data—Map Symbology Techniques
2.7 The Proportional Symbol Map
2.14 Coal, Oil, and Natural Gas Investigation Maps
2.24 Globes and Raised-Relief Models
Chapter 3: Basic Map Concepts—The Science of Cartography
3.8 Universal Transverse Mercator Coordinate System
3.9 State Plane Coordinate System
3.10 Public Land Survey System
Chapter 4: Geographic Information Systems and Remote Sensing
4.1 What is a Geographic Information System?
4.4 The Difference Between Vector and Raster Data
4.6 Web GIS as a Component of NeoGeography
4.7 Volunteered Geographic Information
Chapter 5: Terrain Mapping Meets Digital Data
5.1 Digitally Representing Terrain
Chapter 6: Map and Geospatial Librarianship
6.2 Academic Preparation and Continuing Education
6.3 History and Transitions in Map and Geospatial Librarianship
6.4 GeoWeb and Geospatial Librarianship
6.5 Historical Beginnings—ALA and MAGIRT
6.6 Core Competencies: ALA and MAGIRT
6.7 History of Academic Curriculum to Support Map Librarianship
6.8 Transitions in Academic Curriculum to Support Map Librarianship
6.9 Job Opportunities and Challenges in Map and Geospatial Librarianship
6.10 Map Library Work Space and Equipment
Chapter 7: Geospatial Resources and Instruction Services
7.2 Navigating the Labyrinth—Legal Considerations
7.3 Navigating the Labyrinth—Where to Go to Get What?
7.4 Guide Through GIS and Remote Sensing Software
7.5 Guide to Finding Maps, Data, and Other Geospatial Resources
8.3 Reference Librarian Duties
8.5 Support Groups for Map Librarianship
8.6 Citing and Referencing Maps and Geospatial Data
Chapter 9: Collection Development
9.2 Knowing Users and Use of Map and GIS Resources
9.3 Collection Development Policy
Chapter 10: Cataloging and Classifying
10.2 A Brief History of Cataloging Maps
10.3 A Brief History of Classifying Maps
10.4 Classification Systems and Maps
10.5 Cataloging Cartographic Resources
Chapter 11: Promotion and Summary of Map and GIS Resources and Services
11.2 Promotion of Library Resources
11.3 Geography Awareness Week, GIS Day, and Earth Science Week
University of Illinois Library School 1951
LS 306 Readings: Introduction to Maps and Map Libraries
LS 306 Readings: Cartobibliographic Aids
LS 306 Readings: Physical Care, Classifying, Cataloging, and Rare Maps
Chandos Publishing is an imprint of Elsevier
50 Hampshire Street, 5th Floor, Cambridge, MA 02139, United States
The Boulevard, Langford Lane, Kidlington, OX5 1GB, United Kingdom
Copyright © 2017 Susan Elizabeth Ward Aber and Jeremy Ward Aber, Published by Elsevier Ltd. All rights reserved.
No part of this publication may be reproduced or transmitted in any form or by any means, electronic or mechanical, including photocopying, recording, or any information storage and retrieval system, without permission in writing from the publisher. Details on how to seek permission, further information about the Publisher’s permissions policies and our arrangements with organizations such as the Copyright Clearance Center and the Copyright Licensing Agency, can be found at our website: www.elsevier.com/permissions.
This book and the individual contributions contained in it are protected under copyright by the Publisher (other than as may be noted herein).
Library of Congress Cataloging-in-Publication Data
A catalog record for this book is available from the Library of Congress
British Library Cataloguing-in-Publication Data
A catalogue record for this book is available from the British Library
ISBN: 978-0-08-100021-2 (print)
ISBN: 978-0-08-100045-8 (online)
For information on all Chandos publications visit our website at https://www.elsevier.com/
Publisher: Glyn Jones
Acquisition Editor: Glyn Jones
Editorial Project Manager: Lindsay Lawrence
Production Project Manager: Omer Mukthar
Cover Designer: Victoria Pearson
Typeset by SPi Global, India
James S. Aber, a caring husband/father. He is the one who started us on the journey of using, collecting, and creating maps as we traveled the U.S. and beyond. Throughout the process of writing this book, we had the opportunity to learn from him and benefit greatly from his expert editorial guidance and steadfast encouragement.
Amy A. Harris-Aber, a loving wife/daughter-in-law. She was always there with constant support, help, and advice, and put up with the long hours of writing and editing.
Jay T., a one-of-a-kind son/brother, Lauren R. and Rose E. Aber, completing this amazing family. The travelers who keep us busy simply finding all the wonderful places they visit and explore by foot, bicycle, car, train, boat, and plane.
R. Kenneth Aber, the best father-in-law/granddad in the world. For continually orienting and inspiring us to travel both physically and intellectually.
In memory of parents/grandparents, Marian M. and Henry A. Ward, and Sarajane S. Aber. You gave us unconditional support, artistic direction, and so much more.
Finally, we hereby dedicate this book to all of the past and present map librarians, who perform their jobs quietly with efficiency and care, fighting to retain and catalog the map and geospatial data collections, which are often relegated to basements or outsourced beyond imagination.
This book was inspired by teaching an elective reference resources and services course focused on maps and Geographic Information Systems (GIS) offered in a large university library and information science (LIS) program. The syllabus stated that no prior knowledge of geography and geoscience or maps and GIS was needed or assumed. Furthermore, all students were welcomed whether they navigated the world with landmarks or maps, geography-bee winners or not. Through informal observations about one-fourth of all students had some geography course work or degree; of those degree holders, approximately half of the geography majors stated they never had a geography course that was specific to maps. This surprised us, yet we know geography programs in universities may be aligned with geoscience or social science departments.
Students were sent into the field to meet map/GIS users and librarians. The first assignment asked students to engage in a 5- to 10-minute informal conversation and get to know some people who used maps in personal or profession life. Participants described occupational duties and named the map and data resources used to accomplish tasks as well as identified where the resources were acquired. The latter resulted in the second surprising observation, an overwhelming majority of participants were unaware that libraries had any cartographic resources or services and that these maps and data might be useful to them.
For the second assignment, some students found that librarians assigned to maps were sometimes reluctant to speak and repeated that they were not real map librarians. In contrast, other students found map and geospatial librarians who were knowledgeable, confident, and encouraging as well as ready to show off the collection and give valued advice to students on their career direction. Unfortunately, the exemplary map librarian was a bit harder to find and this was another surprise to both teacher and student.
This is why we identified the need for this book in addition to the fact that there was no single source that focused on geoliteracy and map librarianship. We designed the book to be a practical guide for students and librarians, who may want to build confidence and enhance their geoliteracy knowledge so as to apply it to traditional librarian skills. As map librarians, they have to not only promote resources and services to clients, but also to library colleagues and administration. Yet, we were asked why maps and why us?
Maps are everywhere. We carry them digitally in our phones and vehicle dashboards. We have them physically on the book shelf, and folded or bound slipped into glove box of the car. Maps have scale and compass direction, and as such they provide the best hiking and biking paths. They can also show the movement of hurricanes in order to detour and direct traffic during evacuations. Anyone navigating land, air, and water depends upon the most accurate and current maps and charts. Do you know how to maximize success through reading your map? Map librarians provide instructional services. Although navigation is primary, it is only one purpose for maps.
Reading and following a map could lead to adventures and problem solving. Old and new maps help in visualizing patterns and documenting change over time. Old maps show former channels in the river, which help archeologists today find buried treasure among sunken paddle boats. Medical researchers may map particular genes among generations of families or follow disease outbreaks tracking infestations of insects. Maps have assisted astronomers, attorneys, business owners, climatologists, collectors, criminologists, doctors, drivers, engineers, entrepreneurs, firefighters, genealogists, geoscientists, historians, librarians, pilots, pirates, police, politicians, soldiers, teachers, and writers, to name a few.
Maps are created to define the extent of solar system and galaxies, observe election results, or depict contours in an agricultural field. Maps identify flood-prone areas or demonstrate underserved regions where city services such as parks and public libraries are needed. Interpreting maps is contingent upon data defined in the legend and once reviewed may clarify solutions. It follows then that maps may be thought of as works of art or tools of the trade, which originally were the exclusive domain of cartographers and geographers. The shift from a physical to digital world of maps happened at the end of the 20th century and a geospatial revolution took hold early in the 21st century.
Yet, both maps and librarians seem to be in the middle of the print and digital worlds. We have followed the explosive use of maps and applications for GIS and mapping programs, which have grown phenomenally in the last two decades. Librarians are perfectly situated with valuable collections in place. The library could play a huge role in the geospatial revolution, but instead seems to be content to let this opportunity pass by. LIS programs briefly recognized their chance in the 1980s, but with little recruiting effort for science majors the programs seemed easy to cut from the budget. This misstep has resulted in map users bypassing the library and allowing Internet searching and mapping to become the norm. Libraries are valued institutions, but need to recognize that the geospatial revolution includes maps, data resources, and services in their libraries.
Our lives are intertwined with maps and depend upon geoliteracy, whether we are aware of it or not. Like the fish that is ignorant of water or the bird the wind, people define boundaries, prove ownership, and navigate Earth using maps and depend on geoliteracy, whether by tacit knowledge or physical guidance of mapping programs. Maps scale to the size we need and vary in topic or subject to cover every imaginable situation. We have watched maps evolve as a combination of art and science over millennia.
Many people associate books and libraries. However, the global WorldCat library catalog added new information records for nearly 5 million unique maps held in libraries in 2015 alone. Libraries are more than a repository of books. In addition to adding maps into the collection, map librarians care and preserve for these physical and digital resources. One of the first cartographers to create a map of the world in the 3rd century AD was also one of the earliest map librarians at the great Library of Alexandria. Eratosthenes created maps and curated geographic information for future generations. Besides preserving maps, the Library of Congress now has about 17,000 maps available online from its collection of 5.5 million maps. Stanford University has been the recipient of major donations through digital philanthropy. There are 71,000 maps viewable online as well as 150,000 in donations overall.
The public's ignorance of map collections in libraries may come as no surprise, as not all map collections are included in library catalogs, essentially rendering maps invisible to electronic searching. In addition, map collections are physically hidden when outsourced to other buildings or stored in basements of main library building. Maps may be cared for by grumpy librarians who are quick to explain their position was inherited. This indifferent attitude toward a map collection is easily explained, as few library schools offer any course on maps and GIS resources and services. Finally, visual information presents another conundrum to librarians who are steeped in textual literacy; that is, the need for citing maps is misunderstood and the procedures for referencing maps, aerial imagery, and geospatial data are difficult to find among the numerous referencing styles. Hence, map collections remain as gems in the rough until user-driven demand for access and improved services prevail.
Jeremy is a geography/GIS teacher and researcher. Susie is a teacher and researcher with an insatiable curiosity and appreciation for maps and librarianship. We have a common bond and compass in that our entire family shares a passion for traveling to new and unfamiliar places, immersing in different cultures and peoples, for exploring landscapes and natural resources, and preserving a balance between natural and human constructions. We value maps and geospatial data and want to help turn map resources in libraries from problem children to treasured collections. We want to make a difference and give back to the professions showing geography students a new career direction and ensuring library students and librarians that a text resource exists. Our goal is to enhance geoliteracy as well as reference and instruction skills by providing details on finding, downloading, delivering, and assessing map, remotely sensed imagery, and other geospatial resources and services, primarily from trusted government sources.
The authors wish to thank many colleagues, librarians both map and generalists, and students, who over the years have contributed content, photographs, editorial help, and inspirational ideas in preparation and completion of this endeavor. Some of them are listed here: James Aber, Jay Aber, Amy Harris-Aber, Mary Larsgaard, Eva Dodsworth, Beth Hanschu, Zada Law, Wade Bishop, Cara Bertram, Julie Sweetkind-Singer, Cynthia Karpa McCarthy, Igor Drecki, Benjamin Jones, Joyce Monsees, Linda Koistinen, Kathleen Weessies, Pete Reehling, Patrice A. Day, Meagan Duever, Jennifer Ann Haegle, G. Salim Mohammed, Jon Jablonski, Angie Cope, Jennifer Davis, Katherine Weimer, Linda Main, Debbie Faires, Irene Owens, Chad Morgan, George Knott, Harriet Clayton, Julie Hallmark, Julie Williams, Linda Zellmer, Patrick McGlamery, Hallie Pritchett, Tassanee Chitcharoen, Suzanne Harter, Sandra Hirsh, Linda Lillard, Linda Musser, Paige Andrews, Marcy Bidney, Emily Prince, Susie Oh Quinn, Andrew Carlos, Jeffrey Franks, Trish Garcia, Mary Fran Griffin, and Earle McCartney.
Support was given during the writing of this book by the following institutions: Middle Tennessee State University (MTSU), North Carolina Central University (NCCU), San José State University (SJSU), and Emporia State University (ESU).
Maps serve to orient lives and navigate landscapes. The historic progression of map-making cultures and collectors may date back as far as 12 millennia. Map librarianship as a career track is a mid-20th century phenomenon. Librarians managing cartographic collections must be geo-literate and have adequate academic library school coursework to design effective map and geospatial services. 21st century cartographers and geographers have gained new importance in documenting natural disasters through the use of global social media channels, maps, and geographic information systems. For librarians to be essential liaisons they must assure maps and geospatial data are freely available. As NeoGeography and NeoCartography have become commonplace, it is time library school programs support NeoMap Librarianship and join the Geospatial Revolution.
Geography; NeoGeography; Cartographer; NeoCartography; Crisis mapping; Compass; Spatial; NeoMap Librarianship; Maps; Crowdsourcing; Participatory cartography; Geo-literacy; Geo-literate; Geospatial Revolution.
Maps are ubiquitous and can record a sense of place in life. Maps situate the reader to a location on Earth through cardinal points of a compass providing the direction in space. Stephen Hall (2004) assumed that we travel with maps “neatly folded and tucked away in the glove compartment of memory”; we orient ourselves back and forth between time and landscapes, emotion and geography, and it all happens in the span of a few moments (p. 15). In fact, three-dimensional compass cells have been identified in bats, used to perform complex flight without disorientation (Finkelstein et al., 2015, p. 159). Costandi (2014) summarized research that suggests all mammals, which likely include humans, have head-direction cells or an internal global positioning system used to create these mental maps of the environment. Aber (2012) found that with short exposures to a novel place, individuals can recall the spatial layout of an environment to some degree, with a few capable of creating an incredibly accurate mental map of the space. Consequently, maps play a role in the place in which we were raised and reside, serving as our internal spatial compass.
Maps are pervasive and people rely on numerous types of maps daily. Maps are produced in print or electronic formats, accessed in print books and single sheets or via mobile phone and computer devices. Planimetric or topographic maps may be used for navigation. Reading and interpreting maps help to create a route to travel from point A to B, whether driving unfamiliar roads or hiking over new trails. Likewise, interpreting digital data via electronic maps in real-time helps to anticipate traffic delays and predict changing weather conditions. Professional politicians might study past voting patterns on choropleth maps or cartograms while observing data on electronic maps showing present election results as polling stations report. Geologic maps are used to locate and interpret rock layers and tectonic structures when prospecting for valuable natural resources from coal to diamonds.
More recently, humans in the wake of natural disasters have benefited with quicker disaster response when participating volunteers come together to monitor social media channels and share information regarding infrastructure destruction and human-injury levels. These efforts result in maps, which provide emergency aid officials with valued current, yet ephemeral, information for a focused response. Subsequently, maps have become second nature. This is especially true when accessing and displaying mobile, electronic versions.
In Oct. 2013, American politicians disrupted our traditional spatial compass. The Legislature forced a Federal Government shutdown by refusing to pass a national budget for 16 days in order to stop implementation of legislation that created affordable health care insurance opportunities (The White House, Office of Management and Budget, 2013; Roberts, 2013). This political tactic cut off the world’s access to one of the primary sources for maps and geospatial data by closing nearly all of the United States Geological Survey (USGS), the National Oceanic and Atmospheric Administration (NOAA), National Aeronautics and Space Administration (NASA), National Geospatial-Intelligence Agency (NGA), and other federally funded science groups (Rosenberg, 2013). The only USGS web sites remaining online were those deemed necessary to protect lives including maps of disease, earthquakes, volcanoes, erosional hazards, landslide hazards, geomagnetism, and water, see Figure 1.1. Likewise, NOAA maintained some capability for weather forecasts and warnings, while NASA satellites currently in orbit were allowed to operate (Freedman, 2013).
These same legislators went even further and restricted access to information and data at the Library of Congress in Washington, D.C. However, in the nation’s capital, the mayor declared public libraries and librarians as essential, and the District of Columbia libraries defied the restrictions and remained open (Chant, 2013; DeBonis, 2013). In addition, some private companies, such as the Environmental Systems Research Institute (Esri), continued to provide access to existing federal government geospatial data resources through ArcGIS Online (Szukalski, 2013). Although our use of maps is so natural, the right to free access of maps, information, and data is in fact a privilege, which can be taken away.
Nevertheless, the value of mapping natural disasters by volunteers using social media has driven change in access and map making. In the past, printed or electronic maps were created using traditional geographic methods, where one map maker or professional cartographer created the finished map used by many. Now, maps may be produced with crowdsourced, shared data, and a new geographic method (Goodchild & Glennon, 2010). This participatory cartography, or NeoCartography, is where many come together to create one map.
These grassroots efforts and the need to bypass disruptions in the public’s access to maps and data have reinforced the value of libraries and the role librarians can play. Many libraries serve as Federal Depositories of print maps and may have created resource collections and services that included access to electronic maps and spatial data. However, not all librarians have map and geography educational backgrounds and may benefit by gaining a higher level of geo-literacy to be effective. If librarians have content knowledge, then they can adopt a collection development policy that promotes geography and cartography resources and creates effective instructional services.
Geography as a word has its origins in the Greek scholar Eratosthenes' writings (Roller, 2010). It combines "geo," meaning Earth and "graphy," which refers to art or science and the process or form of representing and describing, or in other words, writing about the Earth. While some assume that geography is a field concerned with memorizing political capitals, in reality it is a holistic approach to studying Earth and the people living there. Geography is considered to have four traditional areas of study: the spatial tradition, analyzing where things are; the area studies tradition, looking at what makes regions distinct; the earth science tradition, which covers many natural topics of geology, hydrology, atmospheric studies, etc.; and the man-land tradition, which looks at links between the natural and human-built environments (Pattison, 1990). This last tradition has become more and more important in recent decades as we increasingly come to understand the impact our actions have on the environment.
These four traditions together cover a great deal of human understanding of the world, which suits geography’s holistic approach to knowledge well. For example, a geographer would not look at the natural component of a mountain without considering how those elements are affected by those who live on the mountain; likewise, a geographic study of the people living on the mountain would be incomplete without considering the impact of the natural environment on their lives. These traditional geographic approaches are visible through the multitude of techniques and topics on display in maps.
Cartography is the study and tradition of map making. A cartographer makes maps by combining geographic data with scientific, technical, and artistic principles of that time period to model and communicate visual, spatial information. Although traditional map making is being superseded by digital technologies, crowd-sourcing methods, and cloud storage/retrieval, there is merit in reviewing the early tangible map-making techniques using formats from rock to paper. A brief historic summary follows. For more information, refer to: The History of Cartography Series, a definitive collection of articles with global coverage (Harley & Woodward, 1987, 1992, 1994; Woodward & Lewis, 1998; Woodward, 2007; Monmonier, 2015). Two additional volumes are forthcoming in The History of Cartography Series, Cartography in the European Enlightenment, volume 4, by Edney & Pedley (Eds.) and Cartography in the Nineteenth Century, volume 5, by Kain (Ed.). Other bibliographies include Ristow (1997) and Karrow (1997).
Discussions on the history of maps and cartography usually begin with ancient civilizations some 4 millennia in the past when maps were preserved on Babylonian clay tablets (Dilke, 1987). Yet, some consider the earliest map examples to be traced back 8–12 millennia and are those carved on rock or painted murals on walls (Barras, 2013; Choi & Brahic, 2009; Clarke, 2013; Meese, 2006; Siebold, n.d.; UNESCO, 1979; Utrilla, Mazo, Sopena, Martínez-Bea, & Domingo, 2009) (see Fig. 1.2). Regardless of the age, dissemination of the map was limited given fixed geographic locations of rock outcrops and buildings. As map making progressed from carvings on rocks to etchings on clay tablets, cartographers also advanced from hand-carved or hand-drawn maps to reusable map printing methods. Thus, printing techniques and lighter-weight formats increased dissemination as materials used for making maps went beyond a fixed stone or wall.
Woodblock printing was introduced in China as early as the 8th century, and the movable type printing press began in Europe by the 15th century; both of these are effective techniques for printing and reproducing text and images, see Figure 1.3 (Klooster, 2009; Temple, 2007). These improved methods for creating and printing maps were obvious advantages for dissemination, over rock and clay. Woodblock printing, common by the 13th century, gave way to copper-engraved sheets and plates by the 16th century, see Figure 1.4. This modification allowed maps to be more detailed and easier to reprint from the reusable metal sheets that could be hammered and re-engraved if changes were needed (Woodward, 1975, 2007). In fact, the copper-engraved plate for map printing was state-of-the-art for some 300 years until recently (Fitzgerald, 2002; Evans & Frye, 2009; Woodward, 2007).
The trend today is moving from print-based map making to film or digital-based cartographic methods. In fact, the main American mapping agency, USGS, discarded their historic copper and steel engraving sheets and plates in 2014, in favor of digital map making, storage, and printing (Newell & Domaratz, 2015; Morais, 2014).
As each method for map printing changed, the materials used evolved as well, from papyrus, parchment, silk, linen, hand-made or machine-made paper to synthetic film and on to digital data images (Brandt-Grau & Forde, 2000). Just as map-making methods and materials evolved, so did the role of cartographer, who was both the map-making professional as well as the printer, who engraved metal plates and combined ink with moveable metal type using a mechanical press.
According to the Occupational Outlook Handbook, the job of a cartographer today is primarily a profession in teaching and research (Bureau of Labor Statistics, U.S. Department of Labor, 2014a). The cartographer role as map maker works with surveyors and photogrammetrists (Bureau of Labor Statistics, U.S. Department of Labor, 2014b). The entry for printer is no longer a specialized profession, but as a print worker technician who can “operate laser plate-making equipment that converts electronic data to plates”; the worker is expected to “calibrate color settings on printers, identify and fix problems with printing equipment” (Bureau of Labor Statistics, U.S. Department of Labor, 2014c). Just as the cartography professional has changed focus, the printer usually refers to an electronic machine, not a person in a professional career.
The advent of digital map making and printing arrived in the latter half of the 20th century, with the last decade being the tipping point. In “early 1990s, nearly all maps were distributed on paper,” and by the end of the decade, more maps were transmitted through the Internet than printed on paper (Peterson, 2014, pp. 1, 12).
In the early 2000s, web development advances created the Geoweb Revolution (Dangermond, 2009; Haklay, Singleton, & Parker, 2008). The GeoWeb led Goodchild (2007) to propose the term Volunteered Geographic Information when describing nonexpert citizens who create, assemble, and disseminate geographic information using web services and digital sources without the use of Geographic Information Systems or GIS. By 2010, Penn State Public Broadcasting summarized the power of digital mapping with the online project, Geospatial Revolution (PennState, 2010). Penn State offered a free, online course, Maps and the Geospatial Revolution (PennState, 2016). These rapid changes herald a new perspective on map formats and map-making methods or a new geography and cartography that expanded the definition of geo-literacy.
NeoGeography is a recent term that describes the divisions between traditional geographic roles of subject, producer, communicator, and consumer blurring together (Goodchild, 2009). Where traditional geographic work involved a more regimented hierarchy between these factors, NeoGeography leverages technological and social changes since the turn of the century to allow consumers to be subjects, producers, and communicators all at once. This movement has been made possible largely by the power of the Internet, where most NeoGeographic activity takes place (Rana & Joliveau, 2009). The empowering of users through geospatially enabled technologies such as Global Positioning Systems (GPS), the Internet, and user-friendly cartography tools has allowed for those without formal training to become involved in a broad range of NeoGeographic activities (Clark, 2008). One factor that sets NeoGeography apart from traditional geography is that its practitioners are often not geographers by training; instead, they come from technology and engineering fields which are already deeply involved in online and mobile development. This has created a discrepancy or disconnect, as traditional geographers come from an academic world built on peer-review, whereas many NeoGeographers come from a more entrepreneurial technology background (Rana & Joliveau, 2009).
NeoCartography technologies are the flip side of the NeoGeography coin, providing a visual platform for individuals to present and analyze their work (Monmonier, 2013). Like NeoGeography, many individuals involved in Neocartography lack a background in cartographic work. Their efforts often involve open-source data and GIS/cartography technologies (Commission on Neocartography, 2011–2015). These include platforms such as OpenStreetMap, Google Maps and Earth, Mapbox, and more coding-centric web platforms like D3, jQuery, and Leaflet. Other data sources include social media content, such as public Twitter and Facebook feeds.
One example of this divide between traditional geography and cartography and their Neo- equivalents can be seen in Google’s Earth and Maps products. Traditionally, maps are treated as arbiters of truth and reality, serving as authoritative sources of knowledge about topics like borders and place names. With a global audience, Google’s products pragmatically deviate from this tradition by inviting users to participate in knowledge production and tailoring knowledge to local audiences rather than presenting one single vision of the world (McLaughlin, 2008). In practice this means that borders and place names may change on the map depending on where they are accessed. For example, the boundaries of the contested Kashmir region located between India, Pakistan, and China are drawn differently in Google Maps depending on the origin of a user’s IP address (Dominguez, Hurt, Wezerek, & Zhu, 2014). The Crimean peninsula is another contested territory whose borders change depending on whether you are viewing Maps from the United States, Russia, or Ukraine.
The existence of multiple truths for different audiences may be a pragmatic move on Google’s part in terms of not upsetting local populations, and therefore being allowed to continue to do business in nations such as China, but it deviates from geographic and cartographic convention. It also leads to tensions between nations and in some cases has inflamed existing international conflicts (Gravois, 2010). Naturally, this issue is larger than Google’s specific practices and speaks to the interconnected nature of human existence today, but it also highlights some of the modern challenges that NeoGeography, NeoCartography, and their practitioners face.
A good example of the positive influence of NeoGeography and NeoCartography is what is known as crisis mapping. In online crisis mapping, volunteers search and process data collected from individuals via mobile phone, e-mail, and social networks such as Facebook and Twitter; then place the information into an online mapping interface. The information presented as a map mashup of multiple data sources could be produced a continent away, yet still communicate what is most urgent for local responders. The immediate consumers of this geographic information are disaster-relief workers, provided with exact coordinates to direct them where to go and images to prepare them for what to expect. An example is the rapid response teams from the GIS Corps who mapped the human impact of a massive 2013 typhoon on islands in the Philippines (Joyce Monsees, personal communication, Nov. 11, 2013).
These practices have had a direct, positive impact on human lives through disaster response. Our past and present reliance on print and digital maps, as well as geospatial technology to navigate and communicate, extends locally to globally in both scope and purpose. This underscores the fact that we are immersed in a global geospatial revolution that is ubiquitous and invaluable. Crisis mapping efforts exemplify NeoGeography, the blending of communicator and consumer.
Given the long history of cartography, map caretakers likely existed for millennia. However, map librarianship as a professional Library and Information Science (LIS) career track is a 20th-century phenomenon. The demand for map library collections and librarians was evident with improved map making and printing techniques as well as greater interest in geography given two World Wars, ease of travel, and globalization of information and business. What really filled most library collections was the plethora of military maps created by 1945. This was followed by an enormous volume of print maps resulting from the USGS program to map the nation with large-scale maps at a 1:24,000 scale produced from 1947 to 1992 (Cooley, Davis, Fishburn, Lestinsky, & Moore, 2011). This U.S. topographic map series was distributed for free to all designated libraries participating in the Federal Depository Library program (Federal Depository Library Program, 2013). Knowledgeable map librarians were needed to classify and catalog these collections and help patrons, since public access to maps in depository libraries is required by the government (Federal Depository Library Program, 2014). Although there were exceptions of some academic libraries, these map collections were rarely classified and cataloged, which was primarily due to a scarcity of LIS map courses and librarians who were trained in map cataloging.
Without geo-literacy, librarians lack experience and have treated maps as the problem children of the collection. This was the belief of Walter Ristow who passed away in 2006 at age 97. He has been called the most influential figure in U.S. map librarianship. While Ristow was a prolific map librarian scholar and did much to advance the field, librarians were slow to provide needed technical, reference, and instructional services in the library. Historically, Larsgaard (1998) explained that "in the early 1900s, most spatial-data collections were administered by persons with varied academic and professional backgrounds, few of whom had any professional training in library science" (p. 297). Larsgaard believed that these librarians became caretakers who were expected to develop, describe, classify, and catalog map and geospatial collections that refused to conform to the traditional procedures in cataloging and filing for text-based books and journals, with the exception of an atlas.
Ristow (1980) suggested difficulties in processing and promoting did not lie with the maps but rather a lack of parental understanding. Larsgaard (1998) affirmed this when she described how librarians often gained the title of map librarian in the late 20th century, as “anyone who became ‘stuck with the maps’ (and it was often so expressed) either was lowest on the totem pole, or had made the mistake of not being at the meeting where the issue was decided" (p. 298). These fortuitous map librarians were tasked with caring for spatial-data collections, but likely had neither geoscience educational background nor a formal introductory course specific to map resources and services as library students.
Today, the demand is for the geo-literate librarian who would combine knowledge of basic map and spatial-data concepts with a solid background in instruction services, reference services, collection development, classification schemes, and cataloging systems. This is NeoMap Librarianship. It would include both traditional map and the new geospatial librarians who vary in the level of geo-literacy, but coexist in the 21st century. Librarians are living the global geospatial revolution as they interact with the world of geospatially enabled technologies, the Internet, and user-friendly cartography tools. As such, in spite of some librarians lacking formal background in geography and cartography, these NeoMap Librarians may be proficient using web-mapping tools, open-source data, and GIS technologies. Virtual globe, map, satellite imagery, and aerial photography are being heralded as poster children of Web 2.0 by Patrick McGlamery, a seasoned academic map librarian, who used Google Map and Google Earth as examples (as cited in Abresch, Hanson, Heron, & Reehling, 2008, p. ix). It is the NeoMap Librarian who may turn map resources from problem children to valued resource collections.
NeoMap Librarianship is defined in part through job advertisements. Job descriptions can be specific to map cataloging or acquisitions specialist for Sanborn Fire Insurance maps. However, other job announcements call for a geospatial librarian, listing qualifications such as a graduate degree in a geoscience-related discipline and academic background plus demonstrated abilities in GIS. These qualifications are in addition to or in lieu of the Master in Library Science (MLS) from an American Library Association or ALA-accredited LIS degree program.
Prior to 1945, approximately 30 libraries had full-time map librarians (Hanson & Heron, 2008, p. 96). Today, the Map and Geospatial Information Round Table (MAGIRT), a professional map librarian organization under the ALA has nearly 300 members as of Dec. 2014 (MAGIRT, 1996–2016; J. Clemons, personal communication, Feb. 26, 2015). In 2008, the first technical textbook devoted to integrating GIS into academic library services was written by Abresch et al. (2008), all of whom are librarians with geography and cataloging specialty backgrounds. Like-minded, Eva Dodsworth (2012) believed that library professionals should upgrade geo-literacy skills; she wrote the first book to teach GIS and mapping skills to non-GIS librarians. She described her book as a “training package for all library staff interested in gaining the most up-to-date and relevant mapping skills” (Dodsworth, 2012, p. xi).
This book strives to provide a pragmatic guide written for the community of LIS students and working librarians who want to reach a higher level of geo-literacy. This book may inform the community of geography and geospatial savvy graduates to better understand how their knowledge could be enhanced with library skills to meet the job description expectations for working in libraries. As NeoGeography and NeoCartography have become commonplace, it is time library school programs support NeoMap Librarianship and join the Geospatial Revolution.
Spatial thinking is a type of reasoning or literacy that can be used for navigating the world. In this context, it is referred to as geospatial thinking or geo-literacy. Maps are the graphical tools that convey this location-based information and geo-literacy, an essential concept for interpreting and using maps. Being geo-literate goes beyond traversing points A to B, and cartographers create many different map types that broadly fall into two categories of reference or thematic maps. Reference maps show where things are and thematic maps communicate a specific message about the world. Some of the mapping techniques and map types that librarians will encounter are defined and illustrated in this chapter.
Spatial thinking; Geo-literacy; Geospatial; Thematic maps; Reference maps; Choropleth; Cartogram; Terrain; Mapping data; Aeronautical charts; Cartogram; Raised relief model; Atlas; Gazetteer; Geologic maps; Historic maps; Physiographic maps; Topographic map; Planimetric; Globe.
What does it mean to think spatially? Our days are filled with thoughts in a variety of domains, some focused on using numbers, some with words, and others with music or the visual arts. But we also think spatially every day. The National Research Council (2006) describes spatial thinking as a way that “…uses representations to help us remember, understand, reason, and communicate about the properties of and relationships between objects represented in space, whether or not those objects themselves are inherently spatial.” [Emphasis preserved] (p. 27). These skills include “concepts of space, tools of representation, and processes of reasoning” (p. 12). Concepts of space are the components that separate spatial thinking from other domains such as mathematic or language-focused reasoning skills. Obviously, spatial thinking plays a role in our navigational activities, but in reality it goes much further as many of our other modes of thinking are influenced by spatial elements. For example, driving to work is clearly related to thinking spatially, but so is interpreting a spreadsheet on a computer. Working on mechanical problems, organizing your desk, and moving through the menu of a computer program are all tasks that require the ability to think spatially. It is an important skill in our lives, and one that directly concerns the field of geography.
What about geo-literacy then? We know what literacy is in the context of the written or spoken word, but what does it mean in the context of spatial thinking? Certainly there is an element of knowing where things are, but geography involves so much more than memorizing state capitals. The term geo-literacy is used by the National Geographic Society to “describe the level of geo-education that we believe all members of 21st-century society will need to live well and behave responsibly in our interconnected world” (Edelson, 2014). It is broken down into three separate components, starting with interaction or “how our world works.” This component relates to modern science’s descriptions of the functioning of natural and human systems. Secondly, implications or “how our world is connected” deals with the myriad links between these systems and how they affect one another. Finally, “how to make well-reasoned decisions” describes a process of decision-making that factors in these systems and their connections to make intelligent choices that benefit humanity while minimizing the potential negative impacts of the decision.
In today’s world, being geo-literate and having the ability to think geospatially has become more crucial than ever before. The level of understanding regarding our impact on the natural world is much greater than in decades past, and leveraging geo-literacy is essential to effective decision-making. This will help to improve the quality of lives around the world while reducing waste and protecting environmental conditions. Fortunately, geography is well-suited to help in this regard. With geography’s holistic approach to study, it projects a big-picture view of the interconnected nature of the world. Tools such as GIS, remote sensing, and maps are core components of how librarians can instruct and empower geo-literacy to these ends.
Maps are graphical tools for conveying spatial knowledge. They are a cartographer’s attempt to communicate information about the geographic milieu to an audience (Robinson & Petchenik, 1975). In this way maps provide consistency to our world view, attempting to unify our vision of the spatial configuration of features. A broad definition of the map is that they are graphical scale models of spatial concepts (Merriam, 1996). These concepts might represent physical or cultural features, or they might be abstractions that have no physical presence (Dent, Hodler, & Torguson, 2009). The format may be physical or virtual such as a paper road map vs. a digital GPS unit. Regardless, by connecting data to locations, we can communicate information about spatial patterns, track changes on the landscape, and even predict the outcomes of our decisions.
Colloquially, the term map can be used to describe many different objects, but traditional maps are required to include a few elements to differentiate them from figures, diagrams, or drawings. Different sources discussing cartography will disagree as to what specifically is required to make a complete map, but the most essential are a notation of scale, an indication of the direction of north, a legend, and citation information. If someone were to draw a map of their neighborhood, it would probably lack these elements, but it would still be acceptable to refer to it as a mental map, or just a map. Other map-like information lacking these essential components might be better described as figures or diagrams, but keep in mind that not all maps will fit the popular conception of what a map looks like.
Some maps, such as atlases or road maps, can be described as reference maps. These are general maps concerned with describing a broad overview of the location of features on Earth. While all maps are concerned with the spatial layout of phenomena, many maps fall into a different category, known as thematic maps. These maps explore specific topics or themes of data. Reference maps exist to tell us where things are, while thematic maps exist to communicate a specific message about the world. Thematic maps use general reference information to frame their messages, but only inasmuch as it is useful for putting thematic information in its appropriate context. For example, a map showing population density per county in the state of Tennessee will include county boundaries, but likely will not show every city, waterway, and road in the state. An overload of information can make things visually confusing, potentially to the point of obscuring the intended message. Therefore, on a thematic map, information not directly related to the message is generally not included.
One of the most famous examples of a thematic map is the cholera map based on John Snow’s research during an 1854 outbreak in London, see Fig. 2.1. Snow was convinced that contaminated water was the vector by which the disease was being spread, and his geographic analysis is credited with helping to end the outbreak, as well as giving rise to the field of epidemiology (Vinten-Johansen, 2003). While the map in Fig. 2.1 uses general reference information in the form of London streets, the primary purpose is to present medical data in support of the contaminated water theory. Many thematic maps follow this approach, and can be considered tools for answering questions about the nature of the world. A more modern example could be a thematic map exploring poverty rates at the county level in the United States. This map would not only answer questions such as “where does poverty exist?,” but would also act as a tool for confronting the issue. Just as Snow’s cholera map indicated a public well to be the source of the outbreak, analyzing patterns of poverty could help to better understand how spatial factors may play into poverty and how we might confront the issue in an effective manner.
Cartography has developed many approaches to visually representing spatial information over the past few thousand years. Both reference and thematic maps use various techniques for presenting spatial information, although thematic maps often use visualization techniques that deviate from a typical reference map. Some of the more commonly used thematic mapping techniques are described here. In order to explore these visualization approaches, the 2010 U.S. Census Bureau’s county population figures for the state of Kansas are employed. By using the same data in each map, the different symbology techniques can be more easily compared to one another. Fig. 2.2 shows a reference presentation of the state, with counties and major cities represented, but without any population data included. While visualization techniques are discussed here, a more detailed look at cartography and map conventions can be found in Chapter 3.
The name “choropleth” may sound intimidating, but it is a commonly used approach to representing spatial data that is intuitive for map readers. Other names for choropleth include shaded maps or enumeration maps. A choropleth symbology is a two-dimensional (2D) representation of a three-dimensional (3D) histogram, or statistical surface, of data. Imagine that our county boundaries are represented in two dimensions, while the height of each feature represents the number of people found in each county. Fig. 2.3 shows an example of this 3D data visualization. Note that while this may be a visually interesting image, it is somewhat difficult to interpret, as county boundaries are not always visible and high value counties obscure information behind them.
Fig. 2.4 shows a traditional choropleth symbology, with county populations broken down into five classes. In this case, a natural breaks approach has been used to generate the class breaks. While the classes still obscure some variability in the data, the patterns in population distribution are easier to read in this view. Choropleth symbology is popular for many thematic maps, as it is easy to interpret, can quickly expose spatial patterns in data, and is visually appealing. One word of note regarding choropleth symbology though, the data represented must always be a derived value, such as the people per square mile ratio in Fig. 2.4. Using an absolute values approach can give outlier values much more influence on the visual result and therefore a faulty impression of the actual data. For a longer description of the many ways in which data and map symbology can be manipulated, accidentally or intentionally, see Mark Monmonier’s excellent How to lie with maps (1996).
Another common map symbology approach is the dot density map. Instead of using colors to represent different classes of data, the dot density map simply puts a dot on the page for each unit of value. This has the benefit of not obscuring data points quite as much as the classes in a choropleth symbology, but it can also be misleading. The visual size of the dots is a major concern, as overlapping dots can coalesce into unreadable blobs. This is oftentimes unavoidable, but does decrease the map’s readability. Dot placement is also important. In an ideal dot density map, each dot would be positioned directly over the location of the feature represented, but this is typically not possible. In the example found in Fig. 2.5, U.S. Census blocks were used to give a relatively accurate approximate dot location, but the dots may not accurately represent the location of populations, especially in some of the more sparsely populated counties.
The proportional symbol map takes our population data and instead of changing colors, creates symbols with sizes that vary based on their values. These maps are relatively simple to interpret, but symbol overlap can be confusing at times. Fig. 2.6 shows an example of a proportional symbol map.
The cartogram is unique as a symbology approach, as it actually distorts the geometry of the underlying features in its representation of data. Cartograms can be visually dramatic, but they can also be difficult to interpret. For example, in Fig. 2.7 some of the smallest Kansas counties also have the largest population densities, so they dominate the layout. Other counties in the west with smaller populations become so tiny that they are difficult to read. Obviously, this approach to visualizing data renders the map useless as a source of navigational information, but at the same time it can also be a powerful method of presenting information. This technique is particularly good at showing disparities in values between areas.
Many maps represent geographic surfaces, often the physical elevation above sea level. This can also be a virtual elevation representing data values. Map surface information can be quite valuable, from topographic maps representing physical elevation to weather maps showing the distribution of barometric pressure in the atmosphere. Since maps are two-dimensional and elevation is three-dimensional by nature, multiple approaches to symbolizing elevation have been created over the years. Perhaps the most common is the use of isolines, referred to as contour lines in the context of surface elevation. Each line represents an elevation that is consistent across every point on the line. It is common to only label some of the contour lines and to have a declaration of the contour interval described in the legend; elevation can be found by counting the contours. Actual surface elevation at any point on the map exists somewhere within a range defined by the values of the two surrounding contour lines. The closer contour lines are to each other on the page, the steeper the slope of the terrain represented; anyone who has used a topographic map for hiking can attest to this valuable map information. An example of contour lines can be seen in Fig. 2.8A.
The use of color can also be applied in what is called a hypsometric tint. The elevation of the surface is broken down into ranges, and a unique color is applied to each range, as seen in Fig. 2.8B. A shaded-relief approach can be used to generate a sense of dimensionality to a flat surface. For this technique, a virtual light source is used to generate shadows based on the elevation of the surface, an example of which can be seen in Fig. 2.8C. Finally, multiple approaches are often combined to give a better sense of the terrain. This can be quite effective, as the reader will get the specificity of the contour line technique in addition to the more visually appealing and “three dimensional” approaches of the hypsometric tint and the shaded relief. An example of this combined approach can be seen in Fig. 2.8D.
While most maps inherently have a location-based component, there are many different types of maps to serve specific industries and messages or themes. Snow’s cholera map was both a location-based reference and thematic map that served a specific public health message and purpose. Some explorations within a particular field employ thematic maps combined with change over time; for example, comparing topographic maps over the decades could show the growth of an urban area. These maps may also use various symbology techniques to further emphasize their message. In any case, different map type examples are discussed below. While this is in no way an exhaustive list, it will describe some of the more common map applications in the natural, political, and social sciences. Knowing about these types of maps will help in managing collections and pointing patrons to resources that fulfill their needs.
An aeronautical chart focuses on the information necessary for the navigation of aircraft. In the United States, the Federal Aviation Administration (FAA) produces multiple maps showing information such as terminal procedures and airport diagrams. These charts are used for flying both under Instrument Flight Rules (IFR) and Visual Flight Rules (VFR), an example of which can be seen in Fig. 2.9. FAA charts can be freely downloaded in a digital format from their website (Federal Aviation Administration, 2016a).
An atlas is a collection of maps, and countless atlases have been produced over the years. Library collections are likely to have an atlas or two on hand, and in the United States, that atlas may well be one or more of the editions of the National Atlas of the United States. This atlas series was first published as a print edition in 1874 covering the 1870 census (Internet Archive, 2014; U.S. Geological Survey, 2015a). Later editions covered the census through 1920. After a fifty year gap, it was again printed in 1970, this time as a 400 page edition with maps covering all manner of topics. In 1997, the National Atlas was re-envisioned as a digital edition overseen by the U.S. Geological Survey (USGS), with all maps available through a web interface. This version was retired in 2014, but digital maps from this collection are still available on The National Map Small-Scale Collection website (U.S. Geological Survey, 2015b). At this time, the National Atlas has merged with The National Map (Newell, Donnelly, & Burke, 2014). As such, The National Atlas data can be accessed and downloaded from The National Map (U.S. Geological Survey, 2015c) and Earth Explorer (U.S. Geological Survey, 2016a).
The gazetteer is the counterpart to the atlas, providing an index to the features included in an atlas, cross-referenced so that the reader can find which map contains a specific feature. Gazetteers often include information regarding features such as location and relevant demographic information. An essential service in a print era, the gazetteer has become less prominent in today’s paradigm of digital searching. With a printed atlas, finding a geographic feature was often impossible without prior knowledge or the use of a gazetteer; now locations are a quick Google search away. Despite this, the gazetteer survives in multiple forms, both print and digital. Modern printed atlases still contain gazetteer information, and online versions exist as a source of authoritative place names. Examples of online gazetteers include digital files describing features in the United States available for download via websites at the U.S. Census Bureau (2015) and the U.S. Board of Geographic Names (U.S. Geological Survey, 2015d). One worldwide gazetteer is the U. S. National Geospatial-Intelligence Agency’s GEOnet Names Server (GNS), which provides both text and map search options (National Geospatial-Intelligence Agency, 2016). Other national gazetteers include the Canadian Geographical Names (Natural Resources Canada, 2014), Gazetteer of British Place Names (The Association of British Counties, n.d.), the Gazetteer for Scotland (University of Edinburgh & Royal Scottish Geographical Society, 2016), The National Gazetteer of Wales (2001), Gazetteer of Ireland (Haug, 2007), as well as an Antarctic gazetteer (U.S. Geological Survey, 2013).
A bird’s-eye view map represents the land as if viewed from the panoramic vantage point of a bird mid-flight. This map style was quite common in the United States and Canada during the 1800s for representing cities of all sizes (Short, 2003). Traditionally, these maps were produced by an artist working from street plans. Road layouts would be drawn in perspective then filled in with details of the buildings and features found in the city. Because this map style was so popular, many of these maps exist today as records of what cities and towns were like at the time. Fig. 2.10 shows an example of this style of bird’s-eye view map of Chicago, circa 1857. Today, the bird’s-eye view survives in digital form. Platforms such as Google Earth, Google Maps, Bing Maps, and others provide perspectives similar to the traditional bird’s-eye view map, albeit interactive ones. These services typically combine aerial imagery and three-dimensional models of buildings and other structures to allow users to explore urban areas from the bird’s-eye perspective.
The USGS has long mapped fossil fuel resources and reserves in the U.S., with oil and gas map series beginning in the 1940s, and coal maps in 1950 (U.S. Geological Survey, 2016b). Today the USGS Energy Resources Program is responsible for tracking the state of energy resources in the U.S., including coal, oil, and natural gas quantities and quality. Current information can be downloaded in report or digital GIS formats via the USGS Energy Data Finder (U.S. Geological Survey, 2016c). However, older paper map data can still be found digitally online and in some collections as hard copy including a folder and supplementary information (U.S. Geological Survey, 2016b). An example of one of these older paper maps showing a coal investigation in Colorado can be seen in Fig. 2.11.
Geologic maps show the distribution of different types of rock and surface materials. They often include the structural relationships between the different materials in the ground such as strata, faults, and folds. The first modern geologic map was created by William Smith in 1815, which can be seen in Fig. 2.12 (Winchester, 2001). Today’s geologic maps are not much different from Smith’s work. Many kinds of geologic maps exist including surficial bedrock and sediment, subsurface rocks, fluids, and structures, and geophysical phenomena such as magnetism, heat flow, and gravity. In most environments vegetation, soils, water bodies, and human structures cover the surface, so that underlying rocks and sediments are not directly visible or exposed. Typically for geologic mapping purposes, the materials directly beneath the soil are depicted. This means the rocks or sediments that exist at shallow depth, usually 1 m in Europe or 5 ft in North America. An example of a generalized geologic map showing the state of Colorado can be seen in Fig. 2.13.
The USGS has standardized colors and geologic time symbols for maps of surficial geology according to age of strata so that a given geologic layer will have the same color and pattern across the map, keeping interpretation consistent. However, this scheme is not always followed at state and local levels for various reasons. The geologic maps available through USGS mapView are a patchwork of quadrangles, counties, and larger regions, with some portions missing (U.S. Geological Survey, 2016d). Maps of different vintages are juxtaposed, which leads to visual clutter and confusion, see Fig. 2.14. Component maps were created by various geologists using different working methods; in some cases they use different stratigraphic classification and terminology, which have changed through time. Cartographic style and graphic design also display conspicuous differences.
Coverage in mapView includes all western and central states, as well as Hawaii, but not Alaska. A few east-coast states, such as Florida and Virginia are included, but many other eastern states remain to be added. It is apparent that standardization of geologic mapping at the national level is a long-term goal that will take considerable additional effort to accomplish. Nonetheless, the current version is invaluable for public access to and display of surficial geology for many states using mapView from The National Geologic Map Database (NGMD) portal (U.S. Geological Survey, 2016e).
In the past, mining was largely unregulated and little attention was paid to long-term hazards or environmental consequences. Among the most highly polluted places in the United States is the Tri-State lead-and-zinc mining district, including Kansas, Missouri, and Oklahoma, which began operating in the 1850s, see Fig. 2.15. The last mines closed in 1970, leaving a legacy of serious soil and water pollution, poor economic conditions, and scarred landscapes (Manders & Aber, 2014). Such contamination led to the establishment of Environmental Protection Agency (EPA) Superfund sites, and many federal and state agencies along with several universities and private foundations have cooperated for environmental investigations and remediation efforts.
Public interest in such sites is extremely high in many cases. As there is no one single repository of mining-related map information, map librarians should be prepared to conduct considerable research among diverse public, commercial, and private sources to locate relevant GIS databases and historical maps. A good example of this approach is the Tri-State Mining Map Collection at Missouri Southern State University, which is available in digital format at the Missouri Digital Heritage (2007–2014). The collection includes more than 5000 maps of all types related to past mining activities in the region, such as the mineral resource map shown in Fig. 2.15.
The phrase “historic map” brings to mind ancient maps of the world, or perhaps European maps describing explorations into unknown regions of the Americas. Despite this conception, we can consider any map that is not current to be an historic map. While they may or may not be old chronologically speaking, if they are not the most currently available version of the map information, they can be considered historic. This is a broad definition, but it avoids the subjectivity of individuals’ conceptions of the word historic. For example, USGS topographic maps were produced until 2006, but these maps are now considered to be a part of the Historic Topographic Map Collection. Even though these topographic maps are not particularly old when compared to the larger history of cartography, they do not reflect the most current knowledge, which is available today in the digitally updated US Topo Quadrangle series.
This is not to say that historic maps’ dated information makes them valueless. Given that maps typically represent knowledge of place at a specific time, historic maps can be an incredible record of the world. Library collections often include historic maps produced over many decades or even centuries. Whether they are months or centuries old, historic maps may contain knowledge not found in any other format, and are a valuable part of a collection. This is especially true of maps produced locally to describe the region or city where the collection resides. Unfortunately, maps that may not be considered old enough to be historic by the colloquial definition of the word are often discarded to free up space, destroying information that is quite possibly unique and found in no other collection.
Maps representing U.S. National Park Service (NPS) lands exist in multiple formats, but the most prominent is the topographic map created by the USGS. These maps are similar to the standard USGS topographic maps, but they have a special focus on the features related to national parks. Since there are large size differences from one park to the next park, the corresponding maps range in scale from large to small, 1:960–1:250,000. The largest scale map represents the Franklin D. Roosevelt National Historic Site in New York and the smallest, Denali National Park in Alaska (U.S. Geological Survey, 2005). Fig. 2.16 shows an example of one of these maps representing Rocky Mountain National Park in Colorado. USGS topo maps of National Parks can be purchased or downloaded through the USGS online store (U.S. Geological Survey, 2012a).
The NPS also produces service maps for each park, monument, and trail in the system. Rather than terrain, these maps are designed primarily to aid in navigation and general reference for visitors. The NPS recommends using USGS topo maps for outdoor activities such as hiking and mountaineering. Service maps are produced using a variety of data sources and cartographic techniques, although more recent maps are produced using GIS data sources and digital cartography techniques (National Park Service, 2016a). Since each park has different attractions, these maps cater to site-specific needs, including features such as parking and visitor’s center locations. An example of one of these service maps showing Great Sand Dunes National Park and Preserve in Colorado can be seen in Fig. 2.17. Service maps for individual National Parks, National Historic Sites, and the National Trails system can be found at the NPS’s website (National Park Service, 2016b).
Nautical charts have been used for centuries to assist sailors in maritime navigation. Modern charts often include water depth, local magnetic declination, paths for entering and exiting harbors, and structures such as piers and relevant buildings. In the United States, the National Oceanic and Atmospheric Administration (NOAA) produces both digital charts as free downloads or paper editions for purchase (National Oceanic and Atmospheric Administration, n.d.). The agency has its origins in the United States Survey of the Coast, founded in 1807, and although today’s NOAA has changed quite a bit, the Coast Survey continues to produce weekly updated nautical charts for maritime use (National Oceanic and Atmospheric Administration, 2012). Types of maps produced include sailing charts for navigation in open coastal water, general charts for visual and radar navigation by landmarks, coastal charts for nearshore navigation, harbor charts, and other specialized chart types for various sailing uses (Thompson, 1988). An example of a modern nautical harbor chart showing the Los Angeles and Long Beach harbors can be seen in Fig. 2.18.
Physiographic maps show generalized regions based on shared land forms rather than vegetation or other factors. Many physiographic boundaries are therefore based largely on the underlying geology of a region. The general system in use today for classifying these regions was laid out in “Physiographic Subdivision of the United States” and has three orders referred to as major divisions, provinces, and sections (Fenneman, 1916). A modern example of a physiographic map showing generalized regions of Kansas can be seen in Fig. 2.19.
Planimetric maps are any maps that show the horizontal positioning of ground features without representing elevation information. These maps are used for a variety of purposes, including base or outline maps, cadastral maps, and line-route maps (Thompson, 1988). Base maps include features such as roads, waterways, or political boundaries that are used as a base, or background, for the presentation of other data. Outline maps are similar, but are generally limited to features such as political or physical boundaries. For example, many thematic maps include base map information, such as county boundaries or highways in addition to their thematic map content. See Fig. 2.4 for an example of a thematic map that involves county boundaries as a base. Cadastral maps represent the division of land for the purposes of ownership. These maps, including plats, are commonly used for legal descriptions of land ownership, as well as taxation purposes. Line-route maps are similar to base maps, but they are specific to utilities, representing the locations of all manner of pipes and cables, along with the facilities that support these vectors of transmission. A good example that can be used to map anything to do with energy, from electric transmission lines to hydrocarbon gas liquids pipelines, is the U.S. Energy Mapping System (U.S. Energy Information Administration, n.d.).
Political maps focus on the administrative boundaries defining nation-states and other political regions, internal political divisions, and the locations of cities. They may contain other information, such as natural features like rivers and mountains, but the primary focus is on political borders. An example of a simple political map showing national borders can be seen in Fig. 2.20. Political maps often act as base maps, giving context to natural and cultural phenomena that overlay the political information. In an educational context, they may take the form of traditional classroom pull-down wall maps.
Soil maps are one component of a general soil survey, and they show the location and nature of different types of sediments on the ground. Soil surveys began in 1899 under the title of the National Cooperative Soil Survey; today the Soil Survey is under the USDA’s Natural Resources Conservation Service division. Paper maps included soil regions marked on top of aerial photographs, an example of which can be seen in Fig. 2.21. These maps were just one component of a regions’ soil survey, which could be more than 100 pages of detailed information about the soil, its composition, and what this meant for various agricultural practices. Today, these historic documents can still be accessed through the NRCS website, but more up to date information is downloaded through the Online Web Soil Survey (Natural Resources Conservation Service, 2013). This interactive map interface allows users to generate custom soil maps for their specific needs.
A topographic map is any map that represents horizontal planimetric data in combination with a representation of vertical elevation data. There are multiple approaches to representing elevation in maps, but contours are the most commonly used technique today. See Fig. 2.8 for examples. Topographic maps are generally considered reference maps, as opposed to thematic maps, and are distinct from planimetric maps, which do not include relief information (Jones et al., 1942). These maps are used for many purposes related to the natural world, including recreation activities such as hiking, hunting, and fishing, but they are also used for activities like highway and utility development, construction planning, and flood management.
While many nations have mapping programs that create topographic maps, the most well-known series in the United States are produced by the USGS in a program stretching back to 1884 (Usery, Varanka, & Finn, 2013). While the technologies used to produce and distribute the maps have changed over the years, the basic map content remains more or less the same as it was in the late 1800s. After decades of labor, the original series of 7.5-minute topographic maps was declared complete in 1992 (Moore, 2011). Following the 1992 completion of the series, digital GIS approaches to mapping have been the focus of the program. Topo maps were produced with print as the target medium until 2006, and today these older paper maps are now referred to as the Historic Topographic Map Collection (HTMC). Since 2006, all new maps have been produced in a native digital form in what is known as the US Topo Quadrangle series (U.S. Geological Survey, 2016f). Hardcopy prints of this newer series can still be purchased through the USGS store, but the emphasis rests on distributing the maps digitally. Both digitized copies of the HTMC and US Topo Quadrangles are freely available for download through the Map Products at the USGS Store (U.S. Geological Survey, 2012b), The National Map Viewer (U.S. Geological Survey, n.d.), and The USGS topoView interface for current and historic maps (U.S. Geological Survey, 2016g).
There are differences between the two USGS topo series beyond their medium of distribution. Maps in the newer Topo Quadrangle series lack some of the information that was routinely presented in the HTMC maps, including features such as “recreational trails, pipelines, power lines, survey markers, many types of boundaries, and many types of buildings” (U.S. Geological Survey, 2015e). The reasoning behind these omissions is that USGS no longer verifies these features in the field, and as of 2016 no other current GIS data source exists to fill the gap. As data for these types of features becomes included in The National Map, it will be added to the Topo Quads. Two topo maps can be seen in Fig. 2.22, one showing an older HTMC version of the information, the other the modern Topo Quad version.
Globes have been made for thousands of years, as evidenced by the fact that the ancient Greek geographer Strabo discussed the use of globes some 2000 years ago in his Geographica (Strabo, 1903). Most globes have not survived the years in physical form though, and our oldest surviving globe was created by Martin Behaim in 1492 (Menna, Rizzi, Nocerino, Remondino, & Gruen, 2012). Early globes were used for aiding calculations and astronomy, while later the lack of conformal distortion in shapes was appealing for its accurate representation of land masses (Dahl & Gauvin, 2000). Globes have acted as status symbols, with a globe bestowing an air of wisdom and wealth to the owner. Early globes were one-offs, made of engraved metal or wood, and were expensive, but later printing technology allowed for globes to be mass produced through the use of paper globe gores. These gores were a flat print of the world that could be cut out and glued to the globe surface in order to cover the whole earth, an example of which can be seen in Fig. 2.23.
Unlike two-dimensional projected maps, globes do not suffer from geometric distortions; however, their lack of portability makes them poor candidates for replacing maps. Nevertheless, the globe lives on today in the digital realm, with free software packages such as Google Earth (n.d.), Esri ArcGlobe (Esri, 2003), and NASA World Wind (National Aeronautics and Space Administration, 2011) all allowing for visualization and manipulation of spatial data on a digital globe.
Raised-relief models are somewhat of a hybrid of flat maps and three-dimensional globes. They are based on flat, projected maps, but are extruded to show elevation in the third dimension. These maps are typically pressed or vacuum formed into shape on a mold in a rubber or plastic medium. There is no one single source of these relief maps, but they are usually based on USGS geospatial data and topographic maps. Today these models are generally intended for public display, but in the past relief models served a more functional purpose.
Before easy access to accurate maps and detailed aerial photography, creating a scale-relief model of landscapes with major geographic landmarks and transportation infrastructure helped in civil engineering plans and in some cases, war efforts (Kelly, 2013). In the Second World War, military leaders used relief models in strategic, defense preparation and troop training for unfamiliar terrains (University of Edinburgh & Royal Scottish Geographical Society, 2016). After Germany invaded and annexed Poland, the Polish military continued to fight as they moved west. Some reconvened in Scotland where they were tasked with creating a defense for the east Scottish coast, which was aided by creating a large terrain map (Mapa Scotland, 2013a).
Thirty years later, the Great Polish Map of Scotland, a large cartographic sculpture, was built on the same grounds of Barony Castle, now hotel, to commemorate Polish peoples’ contributions to the war effort and can be seen in Fig. 2.24 (Barony Castle LLP, 2015). The concrete terrain model is an accurate raised relief map of Scotland, designed by Polish cartographer Dr. Kazimierz Trafas and created by Jan Tomasik in the mid-1970s at the Hotel Barony, near Pebbles, Scotland (Mapa Scotland, 2013a). The 1979 map model measures approximately 50 × 40 m (160 ft × 130 ft) (University of Edinburgh & Royal Scottish Geographical Society, 2015). Funding was obtained and most of the needed restoration was completed from 2013 to 2015 (Mapa Scotland, 2013b). When finished, rivers will flow into the ocean and concrete will be tinted to mimic rock to vegetation cover (Little, 2014).
While aerial images are described in more detail in the remote sensing discussion in Chapter 4, it is worth mentioning aerial photos and images in this section as well. Given that aerial photographs have been collected regularly for more than a hundred years, physical paper copies of local imagery are likely to be found in library collections. In some cases, this is a necessity, as images like stereo pairs used for image interpretation may be more effective as paper copies than digital versions. Historical imagery has been collected over the years by multiple public agencies at the city, county, and state government levels. Because of the volume of these images, it is likely that some of them may not have been digitized yet, and only exist as paper copies. Local imagery such as this can be quite valuable as an historic record of land cover. Additionally, the federal government has an enormous collection of aerial imagery covering the U.S. that is available for digital download. An example of one of these images can be seen in Fig. 2.25.
It should be clear by now that maps can take many different forms and serve a wide variety of purposes. Library collections are quite likely to have many different maps serving disparate populations. This chapter should provide a sense of how maps function, and how they can be used in many different ways. Chapter 7 will look more specifically at map and data resources, but the map examples here should give some idea of the types of map data that are available to serve library patrons’ needs.
Maps are a valuable component of our day-to-day lives, helping us navigate and understand the world that we live in. They are a combination of art and science, using visual approaches to describe measurements of location and place. They are also central to the work of map librarians, both in physical and digital forms. Regardless of the context of use, it is important to have a broad understanding of how they are constructed and how they function. Maps do not all serve the same needs, and therefore may not all employ the same techniques, but they all share basic map concepts or the common underlying ideas about how we measure and represent the world. Some of the main components behind the science of cartography include map scale, resolution, grid and coordinate systems, projections, symbols, and legends. The most important of these is the concept of scale.
Scale; Resolution; Datum; Geodesy; Grid; Ellipsoid; Projection; Large-scale; Small-scale; Azimuthal; Cylindrical; Conic; Conformal; Mercator projection; Magnetic declination; Coordinate system; Public land survey system.
The concept of scale underlies all maps. As we know from the discussion of maps in Chapter 2, most maps are graphical representations of the environment that show the world in a smaller format than the reality. The environments and objects that we map are almost always never the same size as the pieces of paper or computer screens that represent them, and scale refers to “the amount of reduction that takes place in going from real-world dimensions to the new mapped area on the map plane” (Dent, Torguson, & Hodler, 2009). This reduction is referred to as map scale, which can be defined as Map Distance/Earth Distance. This equation is generally presented on maps in a ratio format, so the representative fraction 1/24,000 becomes 1:24,000. In this case, the ratio 1:24,000 can be interpreted as one unit of measure on the map representing 24,000 units on the ground.
Maps are often referred to as large-scale or small-scale based on the size of this ratio. The usage of these terms can be confusing. A 1/24,000 scale map shows a smaller surface area with more detail than the 1/1,000,000 scale map, but since the fraction itself is a larger number, it is considered a large-scale map (Foote, 2000). Fig. 3.1 shows an example of how a map of the same area will appear different at different scales.
Scale is central to understanding and interpreting maps. Often map readers are familiar with the area being mapped, and some feature on the map gives context to the scale being represented. In the absence of familiar places or features, the scale declaration on a map is essential to correct interpretation. Fig. 3.2 gives an example of how this functions. Both maps appear visually identical, yet the change in scale leads to a completely different understanding of the pattern that we see.
A concept related to scale is resolution, which comes into play most often in a digital context. Resolution can refer to a few different things, but in a geospatial context it commonly refers to the size in ground units of the pixels found in a raster image.1 Aerial photography and satellite imagery are commonly described by their spatial resolution, with a higher resolution indicating that each pixel represents a smaller piece of the Earth’s surface.2 For example, NASA’s Landsat 8 imaging satellite has multiple sensors that record the Earth’s surface at different resolutions (Garner, 2013). One sensor, the Operational Land Imager, records portions of the electromagnetic radiation spectrum, discussed in Chapter 4, that include visible light at a spatial resolution of 30 m or roughly 100 ft, meaning that each pixel in a Landsat image recorded by this sensor represents 900 m2 of surface area. The Thermal Infrared Sensor, a different sensor on the Landsat 8 satellite, has a spatial resolution of 100 m or roughly 330 ft, meaning that each pixel in these images will represent 10,000 m2 on the ground. Generally speaking, higher resolutions, meaning smaller pixels, are preferable when it comes to imagery, but it depends on the scale of the features being represented. For example, land cover at the global scale could be represented with 1 km2 pixels, while imagery with a resolution of 30 m might be better suited to observing land cover for an individual state. Knowing the resolution of raster imagery is an essential component to correct interpretation.
Resolution can also refer to the precision at which a paper map has been scanned into a digital format. A map that is scanned at 100 dots per inch (dpi) will have a lower resolution than one scanned at 600 dpi. A map scanned at a low resolution will have less detail, much like how a small-scale map will contain less detail than a large-scale map. Fig. 3.3 shows how scanning at different resolutions can affect the quality of the final product.
Geodesy refers to the study of the size and shape of the Earth (Robinson, Morrison, Muehrcke, Kimerling, & Guptill, 1995, p. 116). Calculating an accurate measurement of the circumference of the Earth has been a challenge to scholars for millennia. The ancient Greek scholar Eratosthenes, who around 240 B.C. used seasonal changes in the sun’s angle to estimate the size of the Earth, came within 15% of today’s precise modern measurements (Brown & Kumar, 2011). Eratosthenes’ circumference assumed that the Earth was spherical, but today we know this is not the case. Rotation along the Earth’s axis causes the poles to be flattened and the Equator to be stretched outward, leading to an ellipsoidal shape. Beyond that, we know today that the surface contains depressions and bumps, which creates a shape described as a geoid. The difference between the three reference shapes can be seen in Fig. 3.4. The differences in these three shapes do not generally affect maps at small scales. Yet, for large-scale maps that require high levels of precision and accuracy, the way the shape of the Earth is defined can be essential.
A datum combines a reference shape, typically an ellipsoid, with a tie point that fixes the reference shape to a position on the Earth. As an example, the North American Datum of 1927 (NAD27) uses the Clarke 1866 ellipsoid and puts its tie point at Meades Ranch, Kansas, Untied States, 39°13′26.68″N, 98°32′30.51″W, see Fig. 3.5. This provides the map creator with a surface to work with and a point of reference from which to start. The updated North American Datum of 1983 (NAD83) uses the Geodetic Reference System 1980 (GRS80) ellipsoid, and uses the center of the Earth as its tie point. In a digital GIS context, it is important to select the correct datum for the data used, as an incorrect datum can lead to reduced locational accuracy in the data, particularly on large-scale maps. This can lead to misalignment when multiple datasets are viewed simultaneously and errors in analysis output.
Maps are two-dimensional representations of three-dimensional space. Typically, they show a portion of the Earth’s surface, and as we have seen, the surface is rarely, if ever, flat. Projections are the tools that cartographers use to take the curved surface of the Earth and transform it to a two-dimensional map representation. Much like peeling an orange, the curved surface of the Earth cannot be made flat without distorting it in one way or another. Different projections have different approaches to how they mathematically transform earth-surface geometry to map geometry, but all projections create distortion in one or more geometric measures.
Projections begin with a datum, which is the combination of reference surface and tie point; then, an appropriate geometric developable surface is chosen. Developable surfaces are the “flat” surfaces that maps are projected onto, and can be planes, cylinders, or cones. These surfaces also have the option of being either tangent or secant to the surface of the earth. On a tangent surface, the developable plane touches the Earth once, at either a standard point or standard line. In the secant case, the developable surface cuts through the Earth and creates either one or two standard lines. These standard points and lines are important, as they represent the portions of the map with the least amount of distortion. The further away on the map from a standard point or lines one gets, the more geometric distortion exists. A visual example of the three types of geometric developable surfaces and their standard points/lines can be seen in Fig. 3.6.
Purely mathematical projections not based on a geometric developable surface are also possible. Some resemble the geometric forms and are referred to as pseudocylindrical, pseudoconic, and pseudoazimuthal. The Mollweide projection is a pseudocylindrical projection, which can be seen in Fig. 3.7.
Next, the geometric properties of a projection must be considered. Equal-area projections, also known as equivalent projections, ensure that surface area is correctly preserved following transformation, but often at the expense of preserving correct shapes. The Hammer-Aitoff projection is an example of an equal-area projection, seen in Fig. 3.8A.
Conformal projections, known as orthomorphic projections, preserve the shapes of small areas around standard points or lines, while larger shapes such as continents may be highly distorted. The Mercator projection is an example of a conformal projection. Shapes are preserved close to a standard line on the Equator, but become more distorted farther away as seen in Fig. 3.8B.
Equidistant projections preserve distances of great circles, which are lines that converge at the poles. Distances in these projections are true from one or a few standard points to all other points, but they are not true between all points to all other points. Azimuthal projections can be equidistant and show true directions from a central point to all other points. Directions from noncentral points will not be accurate. Azimuthal approaches are not exclusive and can coexist with equivalent, conformal, and equidistant on the same map, although not all at once. An example of the South Pole Lambert Azimuthal Equal Area projection can be seen in Fig. 3.8C.
An attempt to find a good balance between the approaches can be found in minimum error or compromise projections that attempt to minimize error in all geometric factors. Error will exist in terms of shape, area, distance, and directions, but they are made to be as small as possible. These projections can be useful when a map does not need to have any one specific property preserved and does not wish to have the large distortions that can occur with other approaches. A compromise example can be seen in the Robinson projection in Fig. 3.8D.
The choice of a “correct” projection depends entirely on the goals of the map. If visual appearance is important, a compromise approach may be desirable, as it does not distort the map much in any measure. However, if a map is to be used for a specific purpose, the correct projection makes all the difference. For navigation, the preserved angles and compass bearings of the Mercator projection would be quite useful. Likewise, if measuring surface area was the purpose of a map, an equivalent projection would be called for. Many projections are used beyond this brief introduction, but it is important to remember that there is no one “correct” projection, only a toolbox of different projections that are appropriate for different circumstances.
One convention of mapmaking is that the top edge of the map points northward, although this is not always true particularly for older maps. This makes map interpretation easier, as readers are not required to reorient their mental orientation. North arrows are an essential component of maps, especially for maps where north is not at the top of the page. To assume the north arrow will always point up is an over-simplification though. For one, on small-scale maps, north may not be a consistent direction on the page. A single north arrow may point toward the top of the page, but this is not always accurate, as can be seen in Fig. 3.9.
Also, differences exist between the locations of geographic north and magnetic north. Geographic north represents the place where the Earth’s axis of rotation exists. Magnetic north represents the location near geographic north where the Earth’s magnetic field points vertically downward. The difference between the two is called magnetic declination, and the difference changes depending on both the location of a map and when the map is set, as the Earth’s magnetic field is constantly shifting. USGS topographic maps will include the magnetic declination for each quadrangle. Knowing the magnetic declination of a place is essential to navigation via compass, particularly as one travels longer distances via compass bearing.
Fig. 3.10 shows an example of a statement of magnetic declination on a USGS topographic map. An excellent online resource shows past and present magnetic declination for any place in the world, displayed on the National Geophysical Data Center’s, Historical Declination Viewer (National Oceanic and Atmospheric Administration, 2015).
Cartographers use visual symbols to represent features on a map, and legends exist as a way to decode these markers. Some symbols may be labeled or otherwise self-evident on the page, but a mapmaker cannot assume that all readers will be familiar with the visual shorthand employed, and legends exist to explain what all the symbols on the page mean.3 For general reference maps, these might be dots, squares, triangles, or stars that might represent different human-built features on the landscape. For thematic maps that display a distribution of a variable, or the results of an analysis, the legend allows the reader to interpret the different colors, shading, or size of symbols on the page. Legends may also include ancillary information regarding data distributions or methods for maps that involve statistical analyses. One common way that information in a legend can be useful is describing how maps symbolize terrain, as described in Chapter 2.
In order to keep track of the location of places and objects on the Earth, grids are often employed. These grids, or coordinate systems, are at their most basic no more complicated than simple Cartesian planes, with a starting origin and X, Y measurements to represent a location within the grid. The grid will have uniformly spaced lines with intersections having right angles without regard to the curvature of Earth (Larsgaard, 1998, p. 261).
Some coordinate systems use +/− notation to indicate locations in relation to the origin. Other coordinate systems apply a false origin, arbitrary numbers added to the coordinates, to ensure that no coordinate numbers will ever be negative within the system. It is coordinate systems, along with a datum that gives reference to the surface, that allow us to make the geometric transformations necessary for projections.
Although similar in appearance, the graticule is not equivalent to a coordinate system. Rather, graticules are spherical indicators of the imaginary network of parallels and meridians representing latitude and longitude on a map. While useful as a reference to location, a graticule cannot be used for computational purposes in the same way that coordinate systems can (Iliffe, 2000). Examples of graticules can be seen in Figs. 3.8 and 3.9.
As an example of grids and graticules, many map librarians may be familiar with historic USGS large-scale topographic quadrangles that show one graticule and two grids. Again, the graticule is the latitude/longitude system; whereas, grids are Universal Transverse Mercator (UTM) and U.S. Public Land Survey System.
One of the most commonly used methods of referencing locations on the Earth is the latitude and longitude system. Latitude is the angular measure of a location north or south of the Equator. It can be easily measured using the angle above the horizon of either the Sun or a Pole Star. In the northern hemisphere and near the Equator, Polaris, known as the North Star, is the pole star. In the southern hemisphere, the pole star is the faint South Star or Sigma Octantis, but navigators have long relied upon two stars in the Southern Cross constellation that point in the direction of the South Pole. The fact that we are measuring in angles is a hint that latitude and longitude are measures of a spherical Earth, whereas the coordinate systems described later in this chapter are two-dimensional representations. While the measurement of latitude has a straightforward physical basis in the Equator, longitude is based on an arbitrary starting point known as the Prime Meridian located in Greenwich, England. Historically several prime meridians were in use by different countries, but the current accepted Prime Meridian is the one in Greenwich, see Fig. 3.11.
Longitude was a more challenging measurement in historic times, with a reliable solution not appearing until John Harrison’s Marine Chronometer was invented in the 18th century. Harrison’s sea-worthy timepiece was an answer to the British Board of Longitude’s challenge, for which he received the Longitude Prize, a considerable cash sum of more than £15,000 (Brown, 1949). Today, latitude and longitude are most commonly measured using global positioning systems (GPS) such as the U.S.’s NAVSTAR system or Russia’s GLONASS system.
Lines of latitude are referred to as parallels, as the surface distance of one degree is always a consistent 111 km. Lines of longitude are referred to as meridians, and the distances from one to the next are 111 km at the Equator, but become shorter as they approach the poles where the meridians converge. Measures of latitude/longitude can be notated as either degrees-minutes-seconds (DMS) or decimal degrees (DD) and can use either a cardinal direction or +/− symbols to indicate direction from the Equator or Prime Meridian, as seen in Table 3.1.
The Universal Transverse Mercator (UTM) system was created by several allied nations following World War II (Dracup, 2006a). This system was an attempt to have a unified, projected two-dimensional coordinate system as opposed to sharing information between nations in multiple disparate formats. The system covers from 80°S to 84°N, and divides the Earth into 60 six-degree sections east-west. It uses a secant Transverse Mercator projection with a base unit of the meter, and is accurate to one part in 2500. UTM is commonly used in a GIS context, as it covers, and is consistent, across most of the Earth’s surface. The Polar Regions not covered by the UTM system are covered by the Universal Polar Stereographic System.
The State Plane Coordinate System (SPCS or SPC) was created in the 1930s in the United States as a way to allow engineers and others to work within a system of two-dimensional plane geometry as opposed to having to use more complex spherical calculations (Dracup, 2006b). Accuracies are one part in 10,000, as the different SPC zones are small enough that they can reduce geometric distortion more so than the larger zones found in the UTM system.
The original SPC system relied on the NAD27 datum and the foot as a unit of measure, but today SPC uses the NAD83 datum, and the meter as the unit of measure. Some states have only one SPC zone, but many have two or more zones of coverage. SPC zones that are elongated east-west use a secant Lambert Conformal Conic projection, while north-south elongated zones use a secant Transverse Mercator projection. A secant Oblique Mercator projection is used for one section in Alaska. Zones use a false origin to ensure that all coordinates within the zone will be positive values, the exact specifics depending on the zone in question.
In the United States, the Public Land Survey System (PLSS) is one the of the most important grid systems in use for managing land ownership and infrastructure. It differs from UTM and SPC in that its basic unit is the acre, and it is defined from the ground, not from a virtual grid (Robinson et al., 1995). It establishes a series of origins, known as principal meridians and base lines, from which further measurements are based. These origins are visible in Fig. 3.12.
In the PLSS, land is partitioned into six-mile squares, identified by a township number N/S of the base line, and a range number E/W of the principal meridian. These six-mile squares are further divided into 36 sq mi sections. Each of these 36 sections may be subdivided into quarters, which can be further subdivided into quarter-quarters. A subsection’s location might be described as the northeast quarter of the northwest quarter of section 4, township 18 south, range 9 east, Sixth meridian, Kansas. The layout of township and range can be seen in Fig. 3.13.
While the PLSS dominates the landscape of most states west of the Appalachian Mountains in the United States, an older system of land surveying can be found in the metes and bounds system. The system is interpreted as measure of the limits of a boundary. This system describes land parcels by beginning with a landmark as an origin and giving a verbal description of the boundaries “walking” around the edges. This survey system does not adhere to any grid, and therefore tends to describe more irregular shapes than the neat, rectilinear layout of the PLSS.
There are 19 Eastern states settled before the Land Ordinance of 1785 and Northwest Ordinance of 1787, which were the beginnings of the PLSS (U.S. Geological Survey, 2016). The survey system used in Hawaii is Kingdom of Hawaii native system and in the others, the British system of metes and bounds or some combination of PLSS with the British system or Spanish and French Land Grants. Legal land descriptions regardless of the system are used for identifying ownership and taxation. It can be confusing integrating the methods used in different states and countries and adjusting for the three-dimensional Earth, represented in a two-dimensional plane of a map.
Cartography is a complex subject, marrying the visual graphic arts and the sciences of data visualization and Earth measurement in equal parts to create coherent, informative maps. Today, our digital culture is adding factors of location tracking and navigation through global positioning systems, real-time map modification, and interactive maps to the toolbox. Despite these changes in the field of cartography, the underlying structure of maps remains similar to that of the maps created in antiquity. Understanding some of the basic concepts used to create maps will allow librarians and library users to better interpret and use them, as well as find maps that serve their specific needs.
As Chapter 2 illustrated, maps describe a wide variety of themes and employ many different visualization techniques to display them. While they have historically been drawn by hand, maps are often created today using a modern geographic contribution, geographic information systems (GIS). This field of study includes a broad collection of tools, techniques, and ways of thinking about spatial data and how it can be analyzed and displayed. Technicians collect field data with a GPS unit, analysts use desktop computers to make sense of spatial data, cartographers use GIS technology to visualize information, and policy-makers base decisions on map service providers engaged in the practice of GIS. With GIS, we can not only visualize spatial data, we can also analyze it for patterns to gain a better understanding of the natural and human world. Remote sensing (RS) is an overlapping field that centers on the use of raster imagery for monitoring and analyzing the world. Remotely sensed data are often used as a component of a GIS analysis. It is imperative that librarians be familiar with geospatial analysis and RS to assist clients in finding geospatial resources and creating instructional services for online mapping programs. This chapter defines and describes GIS and RS and how they can be used to study, monitor, and manage both natural and cultural factors in the world.
Geographic information system; Geospatial data; Remote sensing; Vector; Raster; Aerial photography; Orthophoto; Georectification; Landsat; Multispectral; Resolution; Electromagnetic radiation; False color
A geographic information system (GIS) is generally described as a collection of various tools and practices that work together to analyze spatial data. At its root, the power of GIS comes from the fact that it combines both spatial and attribute data allowing us to not only see where things are, but also describe what they are in great detail. This spatial database approach helps to expose patterns and links that might otherwise not be visible in a nonspatial context. Esri, the creators of the industry-standard ArcGIS software, describes a GIS as:
An integrated collection of computer software and data used to view and manage information about geographic places, analyze spatial relationships, and model spatial processes. A GIS provides a framework for gathering and organizing spatial data and related information so that it can be displayed and analyzed.
(Law & Collins, 2015, p. 770)
You may have noticed that we have described GIS as a geographic information system in the singular, as opposed to describing the field as geographic information systems in the plural. This distinction comes in part from the early days of GIS in the 1960s and 1970s, when computer-aided spatial analysis necessarily relied on mainframe computer hardware and often proprietary command-line software for analyzing data (Coppock & Rhind, 1991). An individual setup could be referred to as a geographic information system. Most spatial analysis carried out today does not rely on the mainframe model, although a specific collection of hardware, software, and data can still be referred to as a geographic information system. Goodchild (1992) described a growing disconnect between the practice of using a GIS and the science that drives GIS technology. He coined the term geographic information science (GISci) as both a way of making a distinction between the two and pointing a spotlight on some of the major theoretical hurdles facing the GIS world.
Today a GIS is most often a combination of a desktop or notebook computer using GIS software with a graphical user interface, while accessing data stored locally, on a centralized server, or in the cloud. The GIS software is often Esri’s ArcGIS, although other commercial and open-source packages such as QGIS are in use, see Chapter 7 for a discussion of available software packages. Data are frequently combined with locally hosted information collected in the field via Global Positioning System (GPS) units for analysis. If all the talk of definitions and distinctions is confusing, do not panic! Colloquially, the software is simply referred to as GIS software, while the practice of working with a GIS is commonly known as doing GIS. While GISci is an important component to the field, many users never come into contact with this element of GIS in their day-to-day activities.
GIS is powerful because it can tie spatial vector data to nonspatial database information, allowing us to visualize this information. Spatial vector data are the locational infrastructure; nonspatial database information, or attribute data, refers to features in a table such as schools or types of crime within a particular city. Each database feature corresponds with a coordinate-based vector feature and is mapped within a geographic coordinate space. This results in separate maps or layers of information. While looking at one layer of information can expose spatial patterns not visible from the ground, one of the ways that GIS lets us explore more complex questions is by layering multiple sources of information. By taking multiple layers of data representing natural and human-built features, GIS can create a model of portions of the Earth’s surface, see Fig. 4.1.
These models can be incredibly powerful, allowing us to see previously unknown connections between disparate systems and predict how changes in human behavior may affect the natural environment. Some models only require a few layers of information while others can be quite complex, factoring in many layers of information. One model might show the location of schools in a city relative to crime events. Another example could layer data describing elevation, soil, surface cover, and precipitation information to explore urban flooding. By modifying the data in the surface cover layer we could then determine what impact a proposed parking lot for a new shopping center might have on flash flooding in a city.
Another example of how layering data can be used to answer complex questions is a site suitability scenario. Imagine that you have been tasked with finding areas where an endangered species lives in order to better protect it. This species has certain requirements for life, including the presence of particular plant types for food, a specific type of soil, average temperature range, and amount of annual rainfall. Finding the possible habitat would involve four different layers of information, each describing the requirements above. When the four layers are overlaid, some areas will meet only some of this species’ habitat needs, but other locations will meet all four. In this way, you have discovered the suitable sites for this species to live, see Fig. 4.2. A similar example based in the human world would be choosing a site to build a new factory. The factory would need to be close to major transportation routes, large enough population centers to gather employees, and have suitable terrain for the building. By layering information about the natural and human environments, suitable locations for the factory could be discovered.
These examples describe relatively simple GIS operations, but by layering GIS data, we can discover a great deal of information. Combining this layering approach with more advanced techniques, such as spatial statistical analyses, the power of GIS has made exploring and understanding the world more accessible and manageable.
“Remote sensing describes the collection of data about an object, area, or phenomenon from a distance with a device that is not in contact with the object” (U.S. Army Corps of Engineers, 2003, p. 2-1). This is a broad description, but it generally refers to the use of aerial platforms such as planes, drones, kites, blimps, and satellites for gathering raster imagery. Raster data define space with a continuous series of rows and columns of cells or pixels each with its own attribute value. While remote sensing (RS) is its own field, it often acts as a complement to GIS analyses, adding unique information and analysis techniques to the GIS toolbox. For example, most GIS software packages contain common RS tools for working with raster imagery.
There are two types of RS, active and passive, and they are generally used for different applications. Active RS involves sending out a signal and waiting for its return to the sensor. RADAR and LIDAR are examples of active RS, as they send out energy, microwave and laser pulses respectively, and record the signals as they bounce back (Derr & Little, 1970). Since this effectively measures the distance between the sensor and the target, one of the major uses of active RS is to generate three-dimensional models of surfaces and elevation. RADAR RS also has the advantage that it passes through cloud cover, allowing for imaging even in cloudy atmospheric conditions (ESA Earthnet Online, 2014).
Passive RS does not send out a signal to be returned; rather, it records information using energy already present in the environment. This means that passive imagery is generally collected during the day, when the sun provides plenty of incoming radiation to reflect off the Earth’s surface. This type of RS can be in the form of aerial photographs, but like the active approaches, it can go beyond what we think of as pictures. One of the most powerful elements of remotely sensed imagery is that it lets us see information outside the visible spectrum. Human eyes can see only a narrow portion of the electromagnetic radiation (EMR) spectrum, see Fig. 4.3, but wavelengths that fall outside our range of vision can tell us a great deal about the natural world.
Using information from multiple bands of the EMR spectrum, remotely sensed imagery can help us to identify objects and materials on the surface of the Earth. Every material will respond uniquely to incoming solar radiation, absorbing, transmitting, and reflecting EMR in differing amounts depending on the physical properties of that material and the incoming radiation’s wavelength (Natural Resources Canada, 2015). Using this knowledge, we can look at an image showing the volume of different wavelengths reflected back from a surface, known as the spectral response, and know that one portion of the surface is covered in asphalt while another is a field of grass. That example may sound a bit obvious to the point of not needing a satellite, but RS can also help us to distinguish between much subtler features, differences that oftentimes cannot be determined using our eyes.
One classic example is the use of the infrared portion of the EMR spectrum to monitor vegetation. Not only will different species of plants have different spectral responses at a given time in their lifecycle, the health of a particular species can also be determined based on its spectral response (Tucker, 1979). Because vegetation monitoring often uses a nonvisible portion of the spectrum, it is displayed using false color imagery. This shifts the primary colors of the visible spectrum into the nonvisible portion, allowing us to see how intense the infrared response is in the case of vegetation. An example of false color imagery can be seen in Fig. 4.4; in this example, the colors pink and red indicate healthy green vegetation. This kind of information has a variety of practical uses, from monitoring for drought conditions, tracking responses to climate change, and following the health of individual fields for precision agriculture.
Digital geospatial data are generally stored in two different forms: raster or vector. The two formats are fundamentally different from one another in their structures, and each one has strengths and weaknesses regarding their ability to represent the world. Vector data are good at representing discrete objects and features with high levels of precision. A vector file is made of a series of points, lines, and polygons existing on a Cartesian coordinate system, typically a coordinate system tied to the Earth’s grid, as discussed in Chapter 3. Points are quite simple, consisting of a set of X/Y coordinates defining the location, while lines are made up of a series of points that are connected. Polygons are a series of lines that form an enclosed feature; examples of vector data can be seen in Fig. 4.5.
Individual vector features are tied to tabular attribute data representing information about the feature, and each vector feature can be connected to any amount of tabular data. For example, a single point in a vector file might represent a city; querying the point would show a table with fields representing the city name, the population, the demographic breakdown, economic information, or any number of pieces of information tied to that particular point object. In this way, vector data allow us to take advantage of the spatial database structure of GIS. However, because of the discrete nature of vector geometry it is not particularly good at representing continuous features such as elevation. Additionally, the math involved in vector spatial analysis tends to be more complex than that employed in raster analyses.
The structure of raster data is one that most people are likely familiar with, as it is the basis for most of the electronic displays that we use today. Rasters operate in the same way that a cell phone, computer, or television screen does: they are a continuous grid of cells (or pixels), each with its own single attribute value. In the case of a digital photograph, these values represent the colors that form the overall image. Rasters can be photographs, but they can also display nonphotographic information. Fig. 4.6 shows an example of a nonphotographic raster conception of the world where the Earth’s surface has been classified into land-cover categories. Each cell has a single value representing what is on the ground in that grid space and no empty cells exist in the grid. Because of this continuous nature rasters are good for representing data such as elevation or surface temperature.
The single variable per cell is an obvious limitation of the raster format, as natural features are rarely if ever laid out in neat, evenly distributed square cells of material. In reality, nature is not grid-friendly, with uneven distributions of materials and fuzzy boundaries between land-cover types. Related to the issue of the artificially imposed grid is the question of resolution. As illustrated in Chapter 3, the resolution of a raster image indicates how much surface area is described by an individual cell. The lower the resolution, the more generalization is being made about the surface. Higher resolutions are generally preferable, as an image with 1-m resolution will show much greater detail in the scene than one with 1-km-sized cells. Unfortunately, as the resolution increases, so too do storage requirements, and large, high-resolution raster datasets can be slow to display and analyze, not to mention how quickly they can fill computer storage.
A great deal of raster data comes from the remote sensing field, in the form of aerial photographs and satellite imagery. Aerial photographs have been taken nearly as long as the photographic process has existed. Today air photos can be found in black and white, color, and color infrared, see Fig. 4.4. Although it might seem simple, aerial photography is not as straightforward as taking a picture from a plane or kite. The surface of the Earth is not flat, and all camera lenses introduce distortion to the images they collect. Orthophotos are aerial images that have been corrected to remove these distortions from the photo, thus representing ground features in their accurate locations from a vertical perspective (Southard, 1958). The process of this transformation is known as image rectification or georectification. By taking photos and digitally georectifying them to remove distortion and apply geographic coordinates, it allows a RS or GIS user to make accurate measurements from the photo, making them suitable for advanced spatial analysis techniques.
Satellite imagery comes from a variety of sources, some public, others private. The topic of choosing appropriate satellite imagery involves many factors; chiefly, these revolve around cost and resolution. Some satellite data are freely available, such as that generated by the Landsat program, while other sources charge for access to imagery. Ideally, freely available data can be used, but sometimes it may not meet all the needs of a particular project, necessitating a purchase of data. As previously mentioned, resolution refers to the scale at which data are collected, and in the context of satellites, it could be in reference to cell size, scene size, return time, or spectral coverage. The cell size is the ground area covered by an individual cell in the image. For example, imagery in the red/green/blue visible spectrum collected by the GeoEye-1 sensor has a resolution of 1.84 m meaning each cell in the raster covers 3.4 m2, while Landsat 8’s imagery in the visible spectrum has a resolution of 30 m, covering 900 m2 (e-geòs, n.d.; Garner, 2013). If a project needs high levels of detail, the GeoEye imagery would likely be better suited to the task.
Related to resolution is the scene size, or how much surface area is covered in a single image. Generally speaking, satellites with higher cell resolution will cover less surface area in a single scene than those with lower spatial resolutions. Looking at GeoEye and Landsat 8 again, the swath widths of their imaging sensors are 15.2 km and 185 km, respectively. Satellites with smaller scenes will require more images to be combined to cover larger areas, whereas lower resolution imagery can cover the same ground in a single image. Regarding return time, imaging satellites orbit the Earth in such a way that they will be able to return to the same piece of ground every few days or weeks. GeoEye’s return time is less than 3 days, while Landsat 8’s is 16 days. Some projects may require frequent data updates, while others may have no problem waiting a few weeks or months between images for comparison. Keep in mind that cloud cover can render a satellite pass useless if it is heavy enough, so not every return pass will generate usable imagery.
While those factors are important to consider, one of the most crucial elements to understand is the spectral range and resolution of a satellite. The imagery collected by satellites is a record of the EMR that was reflected from the Earth’s surface at the time of the satellite’s pass. Satellite sensors classify specific wavelengths of reflected EMR energy, see Fig. 4.3, into segments and measure their intensity, generating multispectral data. For example, band 2 of Landsat 8’s Operational Land Imager sensor collects information between 436 and 528 nm, corresponding to blue visible light (Taylor, 2016). Multiband imagery is created using this multispectral data by combining different bands to create a composite image. As an example, if one were to display bands 2, 3, and 4 from a Landsat 8 image and display them as blue, green, and red respectively, they can be combined to create a so-called true color image. We can also generate false color images, as bands outside the visible spectrum may also be displayed. Fig. 4.7 shows both true color and false color images of the Murfreesboro, Tennessee (TN) region derived from Landsat 8 OLR data side-by-side. The left image shows true color data (bands 2, 3, and 4) while the image on the right displays a false color near-infrared image (bands 3, 4, and 5). Much like Fig. 4.4, the near-infrared portion of the EMR spectrum is displayed in red in the false color image, indicating healthy green vegetation.
Multispectral imagery has allowed us to learn a great deal about the Earth and its natural processes, but the spectral resolution of satellite sensors can be increased to create what is known as hyperspectral data. Instead of breaking down the EMR spectrum into a dozen bands, hyperspectral data take the same total range of the spectrum and divide it into as many as hundreds of bands (Landgrebe, 2003). This higher spectral resolution allows for a much more precise knowledge of the surface, to the point of being able to distinguish between different mineral content in exposed rock material based on spectral response. Just like the consideration of spatial resolution, spectral resolution is important to consider when choosing a source of RS imagery. Hyperspectral imagery may be needed, but it often provides far more precision than is actually necessary to answer research questions.
The Internet has changed many aspects of our daily lives, and GIS has not been immune to its influence. At its simplest, Web GIS is similar to any other web application: it involves a server hosting content and an end user who accesses the content via hypertext transfer protocol (HTTP) (Fu & Sun, 2010). What distinguishes Web GIS from other websites or Internet-enabled applications is that the content served is geospatial in nature. Web GIS does not necessarily look like desktop GIS software, in part because it tends to operate either through a web browser or a mobile application format (e.g., Android, iOS, etc.). In general, Web GIS is more limited in capabilities when compared to a desktop GIS software package, but this is by design. Most Web GIS users need a fairly small range of tools, most commonly the ability to query locations, create navigation routes, and take simple measurements of distance. All the major commercial mapping applications provide these tools, including Google Maps, Microsoft’s Bing Maps, Yahoo Maps, and MapQuest.
While these services may be invaluable to many, they generally do not provide any specialized GIS tools to end users, particularly analysis-related functions. Many businesses, government agencies, and research organizations have a need for more advanced GIS capabilities in their Web GIS applications, and these are provided by software such as Esri’s ArcGIS for Server. ArcGIS for Server can host interactive map services resembling the interfaces of the large commercial map outfits while also providing some GIS analysis capabilities. For example, a map server may be hosting a raster layer representing elevation. Using one of these advanced tools, an end user can click on a location and the server will analyze the elevation layer, then draw the boundaries of the watershed in which the point resides. While still limited when compared to the capabilities of desktop GIS, this is a step beyond the analysis capabilities of most online mapping applications. Many organizations have Web GIS applications built including tools related to the needs of their field. These services are often for internal use rather than public facing, but some organizations use specialized applications to display data to the public, such as the U.S. Geological Survey’s Earthquake Hazards Program, which displays the locations of detected seismic activity (U.S. Geological Survey, 2016). These web platforms are one component of NeoGeography, discussed in Chapter 1.
While today’s Web GIS applications may not have the same level of analysis capability as a desktop GIS package, they do have one major feature that desktop GIS lacks: the ease of participation for the public. Desktop GIS can be quite daunting to the novice user, and a good deal of training is generally required to gain the level of knowledge necessary to successfully carry out GIS analyses. Not only are they more user friendly, platforms such as Google Maps, OpenStreetMap, and Wikimapia invite users to assist with data collection and quality control, by adding points of interest, photos, and reporting errors in data throughout the world. Many geospatially enabled mobile apps rely on this user participation as a core component to their operation, such as Yelp, Foursquare, and countless other GPS-enabled services. This kind of interactivity is called volunteered geographic information or VGI (Goodchild, 2007). VGI is not limited to restaurant reviews and vacation photos; it can involve natural hazard warnings and response, scientific data collection, and up-to-the-minute reporting of global events. For example, geotagged Twitter content is commonly mined for event-tracking purposes, both commercial and scientific, although data from these sources are typically analyzed in a more traditional desktop GIS environment. Just as the web enables NeoGeography, VGI is an essential social component to the mix providing a source of data.
Not only are Web GIS applications designed with user friendliness and interactivity in mind, they often take advantage of open-source technologies and focus on software extensibility and data interoperability. By allowing users to freely modify and embed Web GIS technology and spatial data into websites and apps, these services have expanded far beyond their original functionality. Google Maps and Google Earth are good examples of this. The application program interfaces, or APIs, provided for both Maps and Earth have allowed countless users to take advantage of interactive spatial data who would otherwise not be involved in Web GIS. Other open-source technologies like the JavaScript-based D3 library (Bostock, 2013) and the GeoJSON format (Butler et al., 2008) have empowered users to explore and embed geospatial data on the web with an ease unthinkable at the turn of the century.
One of the factors that has enabled this high level of public participation is the broad reach of GPS technology. Today, anyone with a smartphone can get highly accurate location information about the world around them, enabling the use of geospatial applications. It is difficult to stress just how transformative GPS technology has been for the human experience, but it has changed virtually every aspect of our lives from the supply chain of food we consume to our day-to-day navigational behavior. Although some individuals still consult paper maps for navigation today, the ubiquity of handheld navigation units and GPS-enabled cell phones has changed our entire mode of transport. While there is an argument that reading a paper map is becoming a sadly lost activity, the benefits that GPS has provided to our lives are undeniable, and many would be lost without GPS navigation and restaurant reviews, both literally and figuratively. Between the explosion of GPS usage and the open-source, extensibility-focused software movement, user involvement in Web GIS and VGI has never been greater than today.
For all the benefits that Web GIS, VGI, and NeoGeography have given us, the field still faces some challenges. On the VGI side of things, volunteered information circumvents traditional Old Media quality barriers. Using Wikipedia as an example, it is clear that user-generated content can be incredibly useful but must be approached with a skeptical eye. Both innocent mistakes and outright vandalism occur in VGI, and because this is a spatial context, the added factor of positional accuracy of data can become a serious issue. The idea of a gatekeeper to knowledge also comes into play in regards to GIS and GISci education. NeoGeography practitioners may have little or no background in geography or GIS, and mistakes can unintentionally render data misleading or even dangerous. For example, issues related to coordinate systems and projections can distort spatial data, such as misregistration of aerial imagery in Google Earth, as described by Goodchild (2007). Poorly applied data generalization or classification approaches can lead, intentionally or otherwise, to faulty conclusions about data (Monmonier, 1996). Remember that much like Wikipedia, users often look to Web GIS applications as a source of authority, and errors can quickly propagate thanks to the ease of sharing that the Internet enables.
Additionally, VGI can become embroiled in issues of privacy and power imbalances. Google has a procedure for removing or obscuring personal information in their street view application, but many may not be aware of this ability, or even that their personal information may be publicly available in this format (Google Maps, n.d.). On a broader level, NeoGeography remains largely in the realm of those with access to technology and education. While technology access and VGI participation is often strong, albeit uneven, in developed parts of the world, other regions may be lacking in access, participation, and educational opportunities. This can lead to the misrepresentation and skewed perspectives of events and places provided through VGI. In many ways, NeoGeography has increased the number of voices involved in GIS activities to previously unimaginable levels and helped to level social and political powers, but uneven access to technology and spatial education remains a serious concern of GIScience and Web GIS (Elwood, 2006). Given that public participation in GIS can help alter major public policy decisions, these issues of access and education are quite concerning.
Over the past half-century, GISs and RS have completely changed the way we track, manage, and make decisions about spatial information. These technologies assist us in countless ways, yet knowledge of them remains somewhat limited amongst the general public. In part, this is due to the complexity of the systems and their operation. Library patrons have often heard of these technologies and are interested, but may not have much understanding of what terms like GIS actually describe. It is imperative that librarians be familiar with geospatial technologies in order to assist clients in finding resources and creating instructional services for online mapping programs. While learning to use GIS may be daunting, the broad overview of geospatial technology described in this chapter should help provide a context for their uses.
While cartography, GIS, and remote sensing typically operate in a two-dimensional environment, the data they represent are usually three-dimensional in nature. This chapter describes some of the ways that the third dimension can be stored and displayed in a digital context, particularly, in regards to the topographic map. Some of these methods are simply digital recreations of traditional cartographic techniques, but others are fully digital affairs that could not be easily represented without the use of computers.
Terrain; Topographic maps; TIN; NED; RADAR; LIDAR; Digital raster graphics (DRGs); GIS tools; Digital line graphs; DEM
Representing the Earth’s terrain is an important role that many maps have played throughout history. Chapter 2 discussed some of the visual techniques used to represent a three-dimensional surface on a two-dimensional page, including the use of isolines, shaded relief, and hypsometric tinting. Maps have used these approaches for a long time, but with computers taking over the bulk of map production, new techniques have been developed to present three-dimensional surfaces, and old maps have been adapted to function in a digital context. This chapter begins with a description of how old map data have been moved into the digital age, and then talks about recent technologies that have improved and enhanced our ability to model the Earth’s surface for use in analysis and mapmaking.
Digital raster graphics, or DRGs, are scanned USGS standard series topological maps, including all information in the map collar (the space “outside” the map). See Fig. 5.1 for an example of a DRG. Since all the information that would be present on a typical USGS topo map is visible in the DRG, it looks visually identical, albeit on a computer screen rather than a sheet of paper. The USGS began a program of scanning topo maps in 1995 as a way of digitizing their paper resources (U.S. Geological Survey, 2013a). Standard topo maps were scanned at 250 dpi and the resulting raster images were georeferenced with the UTM coordinate system.
Georeferencing is a process that takes known ground control points and connects them to the raster in order to apply a coordinate system and projection to the image. Without a projection, GIS software has no way to know where a raster should exist on the globe, and because of that, it cannot analyze it correctly. By giving a coordinate system and projection to the raster, a great number of quantitative GIS tools can be applied to analyze the raster data. Essentially, the georeferencing process takes what was a picture and turns it into geospatial data that can be scientifically analyzed.
In 2001, the standards for DRGs were updated and all scans from then on were captured at 500 dpi (U.S. Geological Survey, 2013b). Under the old standards, colors were limited to 13 different hues to reflect the conventions present in printed topographic maps; the updated standards allow for up to 256 colors to be stored in a DRG to account for more colorful maps added later to the program. Given the long history of the USGS topographic mapping program, these DRGs can be quite valuable as they put historical information into a digital context that can then be included as part of a GIS analysis. DRGs can be downloaded through the USGS EarthExplorer website, and historic topographic maps can be downloaded as GeoPDF files through The National Map’s Historic Topographic Map Collection (U.S. Geological Survey, 2014a, 2016).
As you may have suspected, scanning historical maps is not limited to USGS topologic sources. As humans have been making maps for some time, we have many centuries worth of cartographic sources to work from, and converting them to a digital format has allowed us to apply our GIS analysis abilities to the past. In the subfield of Historical GIS, large-format scanners are often used, or in the case of maps too fragile to be scanned, more traditional photography techniques. Once these maps have been converted to a raster format, the georeferencing process prepares them for GIS analysis. This unlocks an enormous volume of historical data that can be analyzed to study topics as diverse as land cover change, demographics, economies, or any topic that has been previously mapped.
Digital line graphs, or DLGs, are also derived from USGS sources of data but are stored in a vector format as opposed to raster. An example of a DLG can be seen in Fig. 5.2. They are generated using both automated and manual techniques, pulling information from both aerial photos and map sources. DLG data are provided at three scales: large, intermediate, and small scale (U.S. Geological Survey, 1996). The large-scale DLGs are derived from USGS 7.5 minute topographic maps (1:20,000, 1:24,000, or 1:25,000 scale depending on the specific map) and primarily use the UTM coordinate system, although some use SPC. Intermediate-scale data exist at the 1:100,000 scale in UTM and is derived primarily from 30 × 60 minute USGS quadrangles. If a USGS quadrangle does not exist, Bureau of Land Management planimetric maps are used as sources. The data in small-scale DLGs come from USGS 1:2,000,000-scale sectional maps from the National Atlas of the United States. Not all layers of data are available in all scales, but DLGs include a variety of thematic content. Table 5.1 shows the available layers with descriptions used by the USGS’s DLG resources website (U.S. Geological Survey, 2012).
Table 5.1
List of layers available in digital line graphics format
| Layer | Feature type |
| Public Land Survey System (PLSS) | Township, range, and section lines |
| Boundaries (BD) | State, county, city, and other national and state lands such as forests and parks |
| Transportation (TR) | Roads and trails, railroads, pipelines, and transmission lines |
| Hydrography (HY) | Flowing water, standing water, and wetlands |
| Hypsography (HP) | Contours and supplementary spot elevations |
| Non-vegetative features (NV) | Glacial moraine, lava, sand, and gravel |
| Survey control and markers (SM) | Horizontal and vertical monuments (third order or better) |
| Man-made features (MS) | Cultural features, such as buildings, not collected in other data categories |
| Vegetative surface cover (SC) | Woods, scrub, orchards, and vineyards |
Digital elevation models are a more recent, purely digital source of elevation data. The term “Digital Elevation Model” does not refer to a specific data source or file format, but is rather an umbrella term that describes multiple approaches to collecting and representing elevation data on a computer. Some related terms are digital surface model, which represents the heights of all features including man-made structures, and digital terrain model, which only represents the bare surface of the Earth (See Fig. 5.3). DEMs are stored and displayed in two formats: as raster images where cell value represents elevation, or as a vector-based triangulated irregular network (TIN). Raster-based DEMs have similar advantages to rasters in general in that the mathematics involved in analyses tends to be simpler and faster to calculate than the vector-based TINs. However, TINs are much smaller in file size, and known benchmarks and breaklines (known features such as roads or streams) can be easily added to increase the overall accuracy of the surface. As with any analysis, which format is best depends on the needs of the project, see Fig. 5.4. Raster DEMs do have a distinct advantage in that generally speaking they have more support in GIS software packages.
DEMs are used in a variety of applications, including, but not limited to, viewshed analyses, erosion and flood modeling, precision agriculture, and archaeology. It is also common for aerial or satellite imagery to be draped over DEMs, producing realistic three-dimensional visualizations of the landscape. The source of DEM data most often comes from remotely sensed platforms, including satellite- and plane-based RADAR and aerial LIDAR. An example of LIDAR data representing surface elevation can be seen in Fig. 5.5. These technologies are examples of active remote sensing, as both RADAR and LIDAR send out pulses of energy and measure the amount of time it takes for the energy to return.
Conceptually this is similar to the Microsoft Kinect sensor, the video game peripheral that works with the Microsoft Xbox 360 and Xbox One. In fact, the Kinect device has been used in some research circumstances as a low-cost stand-in for more expensive professional LIDAR setups (Mann, 2011). The Kinect was designed for use in living rooms and only works in small environments, but the process remains similar.
While planes and satellites are commonly used to cover large amounts of ground quickly, the use of unmanned aerial vehicles has grown dramatically in recent years. The availability of these relatively inexpensive platforms has allowed both aerial imagery and elevation data to be collected more easily and affordably than ever before. Small-format aerial platforms such as UAVs, blimps, and kites also typically offer a higher spatial resolution than data collected from satellite sources, making them useful for monitoring specific locations with a high level of precision.
Currently, the most complete global source of DEM data comes from the Advanced Spaceborne Thermal Emission and Reflection Radiometer (aka ASTER) satellite platform. The ASTER Global Digital Elevation Model (GDEM) version two was released in October of 2011, and covers 99% of all land surface on Earth, with data from 83°N to 83°S (ASTER GDEM Validation Team, 2011). This dataset can be downloaded freely for use at the Global Data Explorer or Reverb | ECHO websites (Mitchell, n.d.; U.S. Geological Survey, 2015a). For the United States, a widely used source of DEM data is the National Elevation Dataset (NED) provided by the USGS. The NED dataset is a seamless layer of raster elevation data, although not all data resolutions are available for the entire coverage area. Data within the NED are derived from a variety of sources and can be found in 1/9 arc-second (approximately 3 m), 1/3 arc-second (approximately 10 m), 1 arc-second (approximately 30 m), and 2 arc-second (approximately 60 m) spatial resolutions (U.S. Geological Survey, 2014b). The three-meter resolution data are only available for approximately one-third of the United States at this time. NED data are available through The National Map website (U.S. Geological Survey, 2016). More precise elevation data provided by LIDAR sensors are discussed at greater length in Chapter 7.
Mapping the terrain of the Earth has long been an important component of our cartographic history. Modern technology has allowed us to unlock the analysis potential of older map resources as well as provided more accurate measurements for a larger land coverage than ever before. Thanks to the Internet, many of these resources are freely available for anyone to use. This access has provided us with more information than ever before, enhancing our ability to study the world and plan for future developments.
This chapter focuses on the roles and duties for map librarianship. Introduction to the history of map librarianship is followed by transitions in expectations, resources, and skill sets for geospatial librarianship, also known as the neomap librarian. Librarianship preceded formal academic programs, and the evolution of map librarian course work and degree opportunities are described. Job announcements highlight required qualifications and expected duties. Formal academic preparation for map and geospatial librarianship remains problematic, but cartographic and geospatial data resource agencies and map librarian professional organizations have created guidelines to assist students and professionals. Special considerations will be presented such as work space and map storage equipment that is unique to map and geospatial resources.
GEOWEB; Geospatial consultant; Curator; Librarianship; Digital preservation; Storage; Special librarianship; Map librarian; Geospatial librarianship; Cartography; Jobs
The importance of map librarianship is obvious. There is an incredible history of maps and map-making in addition to the changing nature of cartography as seen through the geospatial revolution today. Neogeography has accelerated the widespread need for and use of maps. Neocartographers are using the plethora of online map-making programs and specialty geographic information software systems. For the library to play a significant role, relevant geospatial and cartographic resources and services must be offered.
Map and geospatial librarianship has preceded both formal academic preparation in library schools and support from professional map librarian organizations. This chapter begins with a historic perspective to demonstrate the 19th century foundations for academic map librarian course work, which finally appeared in the mid-20th century. Core competencies provided the formal acknowledgement of map librarian duties, which were adopted in the early 21st century. Research literature and map librarian job announcements are reviewed to help define the profession today and demonstrate the need for trained map and geospatial librarianship.
Past and present academic course offerings are considered in this chapter. If accredited library school programs provide a balance of content information with librarian skills, then librarians could be a relevant part in the explosive demand for maps today. Creating or reestablishing dual degree pathways and encouraging internship opportunities would help to gain geoliteracy skills and confidence among students. A robust research agenda focused on map and geospatial librarianship could then inform and inspire new professionals in the field. In addition to map and geospatial data collection management, reference and research work using maps requires adequate work space with large map-case and computer-server storage. This practical side of equipment needs must be considered in order to welcome people into the physical and digital world of maps and remotely sensed images in the library.
The historic progression of academic preparation for map librarians is reviewed, and a summary of an early map librarian course outline is included, see Appendix A. The purpose and significance of course work today is highlighted. Librarians need the tools and skills to preserve and curate cartographic products from the past and understand how to navigate the present maze of digital options.
Cartographic accomplishments of Eratosthenes, a 3rd century Greek scholar, were presented in Chapter 3. In addition to his many accomplishments, he created the first map of the world as known at that time to include parallels and meridians (Roller, 2010). Of equal or more importance was that Eratosthenes curated geographic information for future generations through his job as chief librarian at the Library of Alexandria. Maps were primarily commissioned by governments and collected by wealthy private individuals before the 20th century. It was only when maps were donated to libraries and museums that others knew of their existence. A transition occurred with the ease of map creation and reproduction in the 20th and 21st centuries, which provided greater recognition, affordability, and demand for maps. Maps in print and as digital images continue to be valued by these original stakeholders. In addition, new uses of maps have expanded the demand by professionals who need quick response times for informing disaster-relief workers, tracking pandemic illness, and many other applications. Others who rely on maps include teachers, historians, genealogists, attorneys, engineers, bioscientists, geoscientists, military strategists, and more.
Greater demand created the need to organize, store, preserve, and make accessible maps in both print and digital collections. This is the hallmark and legacy of libraries and librarians. These collections and demand for accessible geospatial data and information define the role and expectations of librarians, which have expanded to stewards and clearinghouses for map and spatial data collections.
While some map collections continue to be privately owned, other collections are publicly available, archived, and curated for viewing and lending at museums, libraries, and government agency websites, see Fig. 6.1. In addition to traditional map collection development, today libraries build collections through donations. Recent efforts in digital philanthropy allow for private collections to be publicly available in a library by a donor’s gift of digital surrogates; one example is the case of the David Rumsey collection gifted to Stanford University (Cartographic Associates, 2009, 2016; Gorlick, 2009; Stanford University Libraries, 2016).
It is clear that the historic progression of maps and cartography has shifted from print to digital, yet this does not mean print maps are obsolete. A change in format and delivery did not change the need for interpreting this visual information and making it accessible. Peterson (2014), a geography professor, called maps mirrors on civilization; he summed up the importance of having map collections freely available in libraries and the value in training map and geospatial librarians with the following salient points (p. 11, 12, 44, 76). First, while it is impossible to know when the oldest map was made, maps do predate writing, and as such are valuable, visual information. Second, digital map products are often distributed freely, except for costs associated with computers, phones, and Internet connections. Third, it is estimated that more than half of the population lack basic map reading skills when given print maps. Fourth, many people have trouble using Internet maps, computer mapping, and maps on mobile phones. Finally, online maps could be thought of as a large, disorganized atlas where search engines may be tedious and unproductive. As Peterson suggested, map libraries and librarians are liaisons between maps and people, offering solutions through resources and services.
Libraries must house cartographic resources and protect, promote, and circulate maps in a manner equal to any text-based resources. Trained librarians preserve the past and provide free access to computers or print maps, offer instructional services, and create subject guides. Shared cartobibliographies provide location information for unique, historic digital and print collections. However, this is best accomplished with strong support from library administration in hiring qualified map and geospatial librarians, as well as with accredited Library and Information Science (LIS) degree-granting programs that offer map and geospatial resource curriculum opportunities.
Bishop, Grubesic, and Prasertong (2013) explained GeoWeb as the junction of Web 2.0 with geospatial technologies and geographic information (p. 296). This digital platform enhances online opportunities for users to interact, collaborate, and generate geospatial content via location-based tools and data (p. 297).
Therefore, GeoWeb is the thoughtware and technological platform, which taken together are the reason neogeography and neocartography are evolving in the 21st century. Today, print maps and atlases physically reside in individual libraries, but their digital versions are shared among a global library community. This is equivalent to e-books coexisting with their print ancestors. However, the significance of the GeoWeb is the opportunity for the creation of natively digital cartographic resources. These maps do not coexist with a single tangible product and as such present the greatest challenge in organization and preservation for libraries and librarians.
Access and preservation of data needed to display maps depend upon trained geospatial map librarians and specialized technicians. The critical detail is to retain metadata and all necessary files for natively digital data to successfully transfer to new media in order to display it through the most recent, compatible technologies (Erway, 2010). In an interview, Sweetkind-Singer identified this critical concern for librarians and described the goal for long-term digital data preservation and access as threat mitigation or the act of lowering the threat to information loss in as many ways as possible (Library of Congress, 2009). Bishop et al. (2013) reiterated this data curation challenge as the main duty for geospatial librarians, to “… maintain and add value to geospatial data over its lifecycle—well beyond their original purpose” (p. 298).
The growth of the GeoWeb necessitated geospatial data services in libraries. In the past, librarians merely amassed cartographic material in the physical media, stored, cataloged, circulated, and preserved. Digital data storage, retrieval, and preservation have depended upon functional hardware and software, which means obsolescence of either could make the resource inaccessible. Thus, digital resource migration is critical to ensure preservation and access to the original media when it becomes defunct technology (OCLC Research, 2014).
The field of map librarianship is in transition, evolving and blending duties to account for existing print and natively digital geospatial resources. For example, cataloging print maps may use Anglo-American Cataloging Rules (AACR) standards, but cataloging geospatial resources becomes “metaloging” as the metadata are vital to create a record for geospatial data that supports searching and accessing data created through remote sensing, image processing, and using geographic information systems (GIS) software (Bishop et al., 2013, p. 300). Mandel and Weimer summed the problems for librarians that “not surprisingly, library and information science education did not react with curriculum additions or changes covering these skills as quickly as the emergence of the large-scale projects” (as cited in Bishop et al., 2013, p. 300). New academic course work must add to traditional librarian skills to prepare the geospatial librarian.
Professional map organizations and on-the-job training exist to support geospatial librarians. The formation of the American Library Association (ALA) preceded the world’s first academic library school. The Map & Geospatial Information Round Table (MAGIRT) followed map librarianship, yet it still provides constructive guidance and continuing educational opportunities for both map and geospatial librarians. A brief review follows.
The ALA is a nonprofit organization founded in 1876 to promote libraries and general librarian education (Thomison, 1978; Weimer, 2011). Formal education for librarians began in 1887 when the world’s first library school was established by one of the founding members of ALA, Melvil Dewey. Some consider Dewey the “Father of Modern Librarianship” in the U.S. (Library of Congress, n.d.; White, 1961; Wiegand, 1996). The need for specialized librarianship training was recognized by 1909, and the Special Libraries Association (SLA) was created (Dana, 1914; Weimer, 2011). Customized training workshops in libraries began in 1919 and by the 1940s, some Library and Information Studies schools offered courses in reference resources and services specific to fields of study such as law, business, medicine, and music (Woods, 1952).
In 1941, the first organized professional map librarian group was founded, the Geography and Map Division (G&M), a subgroup of SLA. In 1950, map librarianship courses began in one LIS degree-granting university program. Regional map professional groups formed, and finally the Map & Geography Round Table (MAGERT) was formed in 1979. This group had many members in common with the SLA G&M. A name change, substituting an “I” for “E” and geospatial for geography, occurred Jun. 28, 2011. With these changes, Map & Geospatial Information Round Table organization (MAGIRT) was founded (Weimer, 2011). The changes were initiated as symbolic to better articulate the goals of the group to include the increasing demand for digital geoliteracy.
ALA is the oldest and largest library association in the world with a mission to provide leadership for developing, improving, and promoting library services and the overall profession of librarianship (American Library Association, 1996–2016a). As of 2016, ALA had a membership of more than 60,000, which can be seen in an online global membership map (American Library Association, 1996–2016c; MAGIRT, 2016). The ALA is responsible for accrediting academic master’s degree programs in library and information studies; in 2016, “ALA accredited 63 programs at 58 institutions in the United States, Canada, and Puerto Rico” (American Library Association, 1996–2016b). A complete listing is available online at a Searchable Database (American Library Association, 1996–2016e).
Accreditation is a process and condition for the profession to assess academic quality and integrity, and is based on self-evaluation coupled with peer-assessment. Complete accreditation is granted to library programs for seven years or three-year conditional status. In the latter case, a degree program must change to meet Standards for Accreditation of Master’s Programs in Library and Information Studies (American Library Association, 1996–2016f). In addition to monitoring degree programs, the ALA organization has a policy manual with position statements in regard to special skills needed for quality librarianship. Professional Core Competencies of Librarianship define “… the basic knowledge to be possessed by all persons graduating from an ALA-accredited master’s program in library and information studies” and apply to librarians working in public, educational, special, and government libraries (American Library Association, 1996–2016d).
ALA is governed by an elected Council which makes policy and an Executive Board that administers established policy and programs. There are 11 membership divisions devoted to a library type or function; for example, divisions include American Association of School Librarians (AASL), Public Library Association (PLA), Association of College & Research Libraries (ACRL), Association for Library Collections &Technical Services (ALCTS), and Reference & User Services Association (RUSA). Map librarians would likely join their library type association as well as ALCTS and RUSA, to stay current on cataloging and reference services. Additional ALA subdivisions are based on specialties and called “Round Tables,” with two examples being Government Documents (GODRT) and Map & Geospatial Information (MAGIRT). Before the formation of MAGIRT, many map librarians joined GODRT, as maps are an abundant resource among Government Documents. However, it is MAGIRT that supports map and geospatial librarians with the group’s purpose and specific Core Competencies summarized as follows.
There is a growing demand for skilled professionals equipped with specialized knowledge of maps, geographic information systems (GIS) and all other cartographic resources, whether in hardcopy or digital form, and the cataloging of, or metadata creation for these same resources. These Core Competencies outline and articulate the special skills needed to provide high quality professional support to users of cartographic and geospatial materials.
American Library Association (1996-2016d)
The full core competencies document is available online (Weimer, Andrew, & Hughes, 2008). These competencies are divided into three sections specific to map librarianship, GIS librarianship, and map cataloging and metadata creation to accommodate the different jobs needed. These jobs are sometimes accomplished by one or multiple librarians, depending on the size of the library and collection. Common competency areas include managerial and marketing, collections and facility equipment, reference and instruction services, and technology. Within these, content knowledge and librarian skills are ranked in three levels from beginner to expert.
Professional groups support librarians, but it is LIS programs that create career pathways and the curriculum to prepare students. Authors of the two comprehensive and pivotal books on map and geospatial librarianship, Larsgaard (1998) and Abresch, Hanson, Heron, and Reehling (2008) emphasized the importance of library school preparation and continued educational opportunities to meet current standards. The next section provides the historic progression of curriculum specific to map librarianship and identifies the ALA-accredited universities in the United States and Canada with coursework today.
In the early 1900s, most map collections were administered by map caretakers or curators who learned map library skills via personal experience, observation, and investigation (Larsgaard, 1998, p. 297). In January 1950, the Library School at the University of Illinois, Urbana-Champaign added a map librarian specialization course, LS 306: Maps and Cartobibliographic Aids, for advanced undergraduates or graduates (C. Bertram, personal communication, September 11, 2014). The course was first taught by James Ranz, a university map librarian. Ranz had several positions at the University Library, starting as Map Librarian, and then adding Bibliographer and Cataloger titles, all in 1949; by 1953, he worked in Library Administration (C. Bertram, personal communication, August 11, 2014). Ranz held the title of Instructor, yet only taught the map course once (Woods, 1952, p. 88). Woods (1971) stated that in 1950, this was the only “accredited course in map librarianship available anywhere in the world.” Larsgaard (1998) remarked that at least one LIS school had finally recognized that “training persons for map librarianship before, not after, they became map librarians” was a good idea (p. 298).
After Ranz, Bill M. Woods took over teaching LS 306 from 1951 until 1958 (C. Bertram, personal communication, August 11, 2014). Woods had an undergraduate degree (1947) and Master’s degree (1953) in library science from the same university where he worked from 1949 to 1958 as a map librarian, an instructor, and later, an assistant professor (C. Bertram, personal communication, September 4, 2014). The original LS 306 course covered the unique concerns for map librarians in cataloging, classification, and care of map resources. Woods (1952) built on this foundation by adding and reorganizing the map course into three units: introductions to maps and libraries; describing map resources, the cartobibliography; processing maps including classifying, cataloging, care, and preservation (p. 88, 102). Woods’ course outline is summarized in Appendix A. The course was promoted for geography and library students alike, and his basic outline is still viable for a map librarianship course today with the addition of geospatial collections in electronic formats, data, and software (Woods, 1954, 1956). While there were brief gaps in the catalog listing after 1958, a map course was offered again in 1961 through 1980 at the same university. Woods (1959, 1970, 1971) continued to promote all aspects of education for map librarianship through his writings.
From 1969 until 1980, a total of four library schools offered map librarianship courses. Three were in the United States and one in Canada: Columbia University, Western Michigan University, Catholic University, and University of Toronto (Larsgaard, 1998, p. 299). In the past, Kollen, Linberger, Wassetzug, and Winkler (1998) provided results of a 1996 ALA survey of U.S. library schools and found that five programs offered courses on map librarianship: University of Arizona; University of Maryland, College Park; University of Wisconsin, Madison; University of Wisconsin, Milwaukee (UWM); and Catholic University of America (p. 5). Other schools in 1996 that included concepts of map librarianship in other coursework were: University of Southern Florida; University of Illinois, Urbana-Champaign; Wayne State University; University of Hawaii; and University of Michigan (p. 5). Two library schools offered a course in GIS in 1996: University of Pittsburgh and University of California, Berkeley (p. 5).
Over the years, several schools had courses that included sections on maps and cartography; for more modern examples, map or cartography is mentioned in the course listings at University of Missouri, Columbia, and again, at University of Illinois, Urbana-Champaign. According to online catalog course listings and personal communications, in the 2014–15 academic year, 10 out of 59 accredited LIS schools in Canada and the United States offered specialized coursework specific to map librarianship, resources, and services (see Table 6.1).
Table 6.1
Universities and course titles
| University, Location | Map and GIS courses offered |
| 1. University of Toronto, Toronto, Ontario Canada | INF2102 Geographic Information Systems in Libraries |
| 2. University of Western Ontario, London, Ontario Canada | LIS 9767 Geospatial Data |
| 3. University of Wisconsin, Milwaukee, Wisconsin | L&I Sci 683 Cartographic Resources in Libraries |
| 4. University of Tennessee, Knoxville, Tennessee | INSC 516 Geospatial Technologies; INSC 543 Geographic Information in Information Sciences; INSC 522 Cataloging of Nonprint Materials |
| 5. Drexel University, Philadelphia, Pennsylvania | INFO 555 Introduction to Geographic Information Systems |
| 6. University of Pittsburgh, Pittsburgh, Pennsylvania | INFSCI 2801 Geospatial Information Systems (GIS); INFSCI 2802 Mobile GIS and Location-Based Services; INFSCI 2809 Spatial Data Analytics; LIS 2695 Geographic Information Systems for Librarians |
| 7. University of Michigan, Ann Arbor, Michigan | SI 513-COM 840 The Geospatial Web: Participatory maps, location-based services and citizen science—2014 |
| 8. University of Hawaii, Honolulu, Hawaii | LIS 693 Cartographic and Geographic Issues for Librarians |
| 9. San José State University, San José, California | INFO 220 Resources and Information Services for Professionals and Disciplines-Maps and GIS |
| 10. Pratt Institute, Manhattan, Brooklyn, New York | LIS 688 Institute on Map Collections |
Beginning in 1980, the UWM offered a novel map librarianship graduate Coordinated Degree Program with a dual M.A. in geography and MLIS (School of Information Studies, 2016). A similar dual-graduate-degree program, Geography/Library & Information Systems (GELS), existed at the University of Maryland-College Park from 2005 until 2014 when no more applications were accepted for this career direction (University of Maryland, n.d.).
Interestingly in 2016, of the 59 ALA-accredited LIS programs in the United States and Canada, 38 offered dual/joint/double degree programs. These are combinations of LIS with history (42%), law (39%), business (16%), health-related (16%), English (8%), music (8%), and anthropology (6%), as well as 26 other fields of study. However, only one of the ALA LIS programs today offered the dual-graduate-degree program between geography and LIS for Map & Geospatial Librarianship, the UWM (School of Information Studies, 2016).
One of the newest library programs is a Master of Management in LIS from the University of Southern California. This graduate degree has GIS Librarian as a specialty, which “… entails the acquisition and maintenance of map collections, GIS databases and other geospatial resources” (USC Marshall, 2016). This MMLIS degree was announced in May 2013 and is the first library program in the United States to be associated with a business school (Blumenthal, 2013; Marshall News, 2013). The school is currently in the final phase of accreditation with ALA, and a decision is expected in 2017 (USC Marshall, 2016). The GIS librarian concentration may become a model for other programs.
Considering the few map librarianship educational opportunities for library students, it is not surprising that Larsgaard’s advice mimicked that of Woods from some 30 years earlier. In addition to the MLIS, Larsgaard (1998) suggested that students wanting to be map librarians should have a strong geography or geology background with many courses in cartography, map and aerial photography interpretation, management, and computer programming, as well as a reading knowledge of foreign languages for cataloging and reference purposes such as English, French, German, Italian, Japanese, Portuguese, Russian, and Spanish (p. 301).
Early map librarians dealt exclusively with print maps and black-and-white aerial photography. The USGS began producing maps in 1879, and in 1884, the U.S. Congress authorized the funds to begin systematic topographic mapping of the nation (U.S. Geological Survey, 2013; U.S. Geological Survey, n.d.). While other countries use metric units and map at 1:25,000 scale (i.e., 1 cm equals 250 m), the United States did not adopt metric and instead produced maps at 1:24,000 scale (i.e., 1 in. equals 2000 ft). Using this scale, the best known maps were the print 7.5-minute quadrangles or 1:24 k topographic map series, a mainstay of U.S. map libraries. More than 55,000 were produced from 1945 to 1992, covering the 48 conterminous states; they are the only uniform map series to cover the entire United States in detail (U.S. Geological Survey, 2016). Topographic maps are abundant, familiar cartographic products that are trustworthy, used for a variety of purposes, and define the national socially constructed landscape (Kent, 2009, p. 132).
In the 1990s, libraries began to adopt GIS software and geospatial data sets as well as digitize existing map collections (Deckelbaum, 1999; Stone, 1999). The early adopter GIS librarians spent time instructing patrons on how to use the software, whereas some years later, more time was devoted to collection development; managing geospatial portals; building unique collections of geospatial data; and helping patrons to find, open, and manipulate the data (Hindmarch, 2011).
Pivotal years with rapid changes for map librarians were in the first decade of the 21st century. In 2000, the USGS announced that the 7.5-minute national map series that was completed in 1992 would no longer be revised because of budget constraints; the series would be replaced with a digital quadrangle map series named US Topo (Moore, 2000). In 2009, the USGS stopped sending print versions of these maps to depository libraries, and while paper maps remain available for sale at the USGS, the map series was placed online for free download and replaced by The National Map (Moore, 2011, 2013; U.S. Geological Survey, 2012). Some libraries responded by discarding print map collections since they were available online and reassigning duties for map librarians. Few LIS programs recognized the potential for this transition either.
Since 1950, only a few LIS degree-granting universities have offered any course curriculum related to map and geospatial librarianship as noted earlier. This slow growing LIS career track is a conundrum given that we are in the midst of a map and geospatial revolution (PennState Public Broadcasting, 2010). Popular online courses with enrollments as large as 48,000 and geospatial webinars exist for professionals and the public to learn about spatial information with various widely accessible mapping technologies including military and consumer Global Positioning System (GPS) devices, interactive web maps, and map-application enabled smart mobile phones and tablets (Directions Magazine, 2014; PennState, 2016; Robinson et al., 2015).
The demand for knowledgeable librarians and robust map and geospatial collections in libraries should be at an all-time high, yet library school faculty and library administrators have not seized this opportunity. Weimer and Reehling (2006) proposed a Geographic Information Librarianship specialization, considering the significance for this expertise in the LIS profession and outlined curriculum. Furthermore, Weimer and Reehling suggested that student recruitment would succeed best in an academic interdisciplinary setting with strong geography-GIS and LIS programs. Likewise, Abresch, Hanson, and Reehling (2008) stressed the demand for trained geospatial librarians would only be met if LIS schools would provide the necessary training. Researchers from two different LIS programs are working to implement needed changes.
In 2012, a two-year Geographic Information Librarianship (GIL) project by Drs. Wade Bishop and Tony Grubesic was funded through a Laura Bush 21st Century Librarian Program grant via the Institute of Museum and Library Services. The research collaboration was between the University of Tennessee, Knoxville and Drexel University, Philadelphia, PA. The overall purpose was to introduce GIL education into LIS curricula and, in turn, increase GIS-related research in LIS (University of Tennessee Knoxville, n.d.). Bishop presented the study at a webinar sponsored by MAGIRT (Clemons, 2014). In order to design the GIL courses, researchers surveyed practicing GIS and map librarians to determine the most important MAGIRT competencies (Bishop, 2014). Bishop explained that out of 75 core competencies, 23 were identified as most important, which led the researchers to devise 13 student-learning outcomes (SLO) for curriculum, see Appendix B. After courses were created, students were recruited for participation; classes were given SLO pre- and post-test questions falling in four major categories: (a) geography/cartography, (b) collection development/maintenance, (c) reference/instruction, and (d) metadata/cataloging. The Geographic Information (GI) classes demonstrated on average, 13% student improvement (Bishop, 2014). Specifically, test score improvement for SLO categories given above was (a) 15%, (b) 8%, (c) 12.6%, and (d) 18% (Bishop, 2014).
Bishop, Cadle, and Grubesic (2015) expanded on the grant findings by doing a validation survey. Interestingly, the survey revealed only 45% of the map and geospatial librarians had a master’s degree in LIS; the 55% without the MLIS had graduate degrees in geography, geology, and urban planning, among others (p. 72). The results of the survey identified the most important knowledge, skills, and abilities within the extensive core competencies listing. As this was generated by current practicing map and geospatial librarians, it informs future LIS curricula on which courses best prepare students for map and geospatial librarianship jobs in the 21st century (Bishop et al., 2015). After identifying the map and geospatial data courses and programs offered at ALA-accredited LIS programs and considering the results from the research by Bishop et al., it is appropriate to review recent job postings and research to identify challenges students and practitioners may still encounter.
In 2005, the Association of Research Libraries (ARL) Spatial Data and Collections report documented transitions and progress for libraries that offered GIS resources and services since digital mapping first appeared in their libraries 15 years earlier (Salem & Association of Research Libraries, 2005, p. 11). This was a follow-up survey from a 1999 report from the ARL regarding the 1992 GIS Literacy project (Association of Research Libraries, 1999). As an example of what the 2005 report revealed, librarians were asked to indicate the level of GIS use and the disciplines involved among students, faculty, or researchers. The overall demand for spatial data support had grown, but disciplines using GIS most frequently were geography, architecture, and geology. It was somewhat surprising to Salem and Association of Research Libraries (2005) that social and health sciences had emerged as medium to heavy GIS users, and other disciplines utilizing GIS library data and services were city/regional/urban planning, agriculture, forestry, and ecology/environmental studies (p. 13, 14).
This report contained library job descriptions in the form of job postings. Job titles for librarians working with GIS varied from Map Librarian to Geology Library Head, and other titles included Public Service Librarian, Data Service Librarian, Assistant Head of the Map & Imagery Laboratory, Map/GIS Librarian, etc. The librarian’s job expectations were often in management, but otherwise followed the traditional library divisions of collection development, acquisition, reference, and instruction. In addition, some map librarians may have been assigned classifying, cataloging, and indexing. Another primary duty was to coordinate with the map copy cataloger in technical services. One way for promoting collections was the expectation for developing map library webpages, and one director was tasked with creating a map gift acceptance policy (p. 74, 75).
What follows are some of the transitions and challenges for library students and librarians more than 30 years after digital geospatial resources and services were first added to map library collections. Research findings and selected job postings are used to highlight duties and expectations today, which can be negative and positive factors for pursuing map and geospatial librarianship.
Larsgaard (1981) described map librarianship as “an intense and isolated occupation” in an edition of Library Trends journal that was devoted to articles of good and bad news involving the profession (p. 371). She argued that the lack of interest in developing a map librarian career track at universities was no surprise given the ludicrously low librarian salaries in the 1980s. Decades later, Brown (2006) noted the discrepancy in salaries between science librarians and scientists in industry. This negative recruitment point was reiterated when Forbes magazine ranked the master’s degree in LIS as the number-one worst degree based on mid-career median pay and projected employment growth (Smith, 2012). A Library Journal editorial rebuttal suggested “librarians aren’t in it for the money,” which is sentiment that could apply to others on Forbes worst graduate degrees for jobs list including education and history (Annoyed Librarian, 2012).
Low salary for high job expectations may be a negative factor in recruiting for map and geospatial librarianship positions. According to Occupational Outlook 2015 median pay for a librarian was $56,880 U.S. per year; the expected entry-level education for librarians is a graduate degree in LIS as well as a secondary graduate degree in a content or teaching area (U.S. Bureau of Labor Statistics, 2015). Excerpts from an actual job description follow with a salary range from $43,000 to $60,000 U.S., depending upon experience and qualifications. As an example, this library opportunity was posted in 2014 for a large university in the Midwest.
Job Title: Geospatial Information Systems Specialist
1. Master’s degree in LIS with advanced coursework in GIS; or an advanced degree in geography or geographic information science; or a geoinformatics certificate in combination with an informatics degree.
2. A high degree of computer literacy, experience using ArcGIS, teaching GIS, and building GIS web services; knowledge of programming and the script languages of Python or PHP, Federal Geographic Data Committee (FGDC)-endorsed metadata standard as well as map and geospatial resources.
3. Demonstrated excellent communication skills, ability to work independently and collaboratively.
Responsibilities
1. Managing the geospatial library collection and curating geospatial datasets.
2. Design and delivery of a geographic-based portal for downloading data owned, licensed, produced, and curated by the Libraries; enhance access to digitized collections of historic maps and atlases.
3. Provide geoliteracy through instruction, research assistance, subject liaison, and campus-wide educational outreach.
Similar jobs posted in 2007 listed a salary of $40,000 U.S. and in 2009, a salary of $52,731–$65,361 Canadian. These locations were also mid-continent with job titles of Map and Data Services Librarian, Assistant Professor level, and GIS Librarian, respectively.
As early as 1948, the debate began on whether it is better to hire a geography-cartography subject specialist with an interest in libraries or a library specialist with an interest in geography-cartography (Woods, 1952, p. 88). Faculty and administrators might argue that the lack of courses for map librarianship in library school curriculum is a result of low student demand. In contrast, Hallmark and Lembo (2003) suggested that library schools simply fail to recruit students from the sciences and engineering in general and geography or other geosciences in particular. Mount (1985) noted in a 1983 survey of academic science librarians that 32% had undergraduate degrees in the sciences or engineering. Winston (2001) surveyed to find that 35.5% of science and engineering librarians had undergraduate degrees in the areas of biology, physics, chemistry, or engineering.
Doctoral candidates in library schools may have history and foreign languages educational backgrounds, but few LIS schools provide any course work specific to cartographic collections and preservation. Excerpts from an actual job description follow that involve cartographic resources with an interest in history and curation. This large academic library is on the east coast, and the job posting was in 2016.
Job Title: Curator of Maps and Prints
1. Ph.D. or extensive curatorial or scholarly experience in history of cartography.
2. Demonstrated ability for teaching, public speaking, and grant writing; experience in special collection libraries and a strong aptitude for foreign languages.
3. Interest in “linking” study of historic maps and atlases with emerging technologies; ability to manage projects effectively and independently.
Responsibilities
1. Promote the use of map and print collections, physically and digitally through engagement, outreach, and collection management.
2. Conduct individual and collaborative research.
3. Acquisitions and collection development, assisting the director.
While it appears that library schools may not be offering courses or recruiting students for map librarianship, academic libraries may be adding to the problem by not hiring qualified personnel. For example, here is an anonymous anecdote about an applicant with a geology undergraduate degree and LIS doctorate degree from an accredited library school. This person applied for a nationally advertised geoscience librarianship position at a large academic library and was not granted an interview. After a casual inquiry about the success of the search, the unsuccessful applicant was told that the job was filled by a person who had no geoscience background but had worked in the library for the previous year and was liked by other staff members. Ironically, when Hallmark (1998) interviewed geoscience library managers from government, academic institutions, and the corporate world on their views of ideal education for practitioners, these library managers stated that “they would prefer to hire a geologist and train that person in library and information science than vice versa” (p. 84). This finding is valid today as Bishop et al. (2015) noted 55% of the practicing map and geospatial librarians did not have the MLIS degree.
Library job descriptions requesting high school educational background and specialized cartographic and cataloging knowledge is a negative factor in recruiting students to map librarianship. Excerpts from an actual job description follow. This library job was posted in 2014 at a large university in the south. The salary was $41,000.
Job Title: Senior Library Specialist—Cartographic Resources Coordinator
1. High school and 4 years of library experience; ability to learn rapidly, to read complex visual information, and to use PC-based office applications proficiently.
2. Theoretical knowledge of cataloging, following Resource Description and Access (RDA), AACR2, Machine Readable Catalog (MARC) Bibliographic, Holdings, and Authorities formats.
3. Demonstrated ability to recognize, define, and analyze problems; high level of comfort in digital environments; strong interpersonal skills with effective oral and written communication skills.
Responsibilities
1. Develop and maintain map cataloging/metadata policy and practices in Cataloging and Metadata Services.
2. Provide descriptive metadata for maps and atlases in MARC and/or non-MARC in all languages; serves as a cartographic metadata liaison and assess/prioritize/coordinate map metadata projects among three major collections.
3. Work collaboratively with the Coordinator of Digital and Monographic Resources Unit to develop and train staff in cataloging.
A similar cataloging position at a large, private university on the west coast did require a university degree, the MLIS or a related Bachelor’s Degree. Additional responsibilities were for grant writing and reference work, plus creating “crosswalks for metadata transformations” and a willingness to work directly with the public in a personable, friendly manner.
Requiring a high school diploma and library experience to conduct cataloging, may or may not be typical. That being said, the scenario for hiring outside LIS closely aligned with the recommendations of Kollen et al. (1998) and Larsgaard (1998), who seemed to suggest that the best candidate to enhance map reference services, better publicize map collections, and knowledgeably communicate with clients would be one with a strong background in both geography or some other aspect of geoscience. They also recommended library studies.
Kuruppu (2006) summarized the literature on the pros and cons of hiring a science subject specialist librarian versus a generalist librarian who gains subject specialty on the job. She concluded that while subject specialization is expected and ideal, candidates with adequate backgrounds were not always available in an applicant pool. Although this is no substitute for a subject specialist, Brown (2006) found 60% of ALA-accredited schools did offer a course in general scientific reference service (p. 46). This does not make up for the point that fewer than 20% of ALA-accredited LIS universities offered a specific map and geospatial reference course in 2014. Although the answer for preparing librarians to work with map and geospatial resources is in part adding and improving LIS coursework, some suggested effective recruiting of students with the content background would suffice (Jeong, 2006; Smith, 2006). Beck and Callison (2006) argued that successful science librarians who initially did not have the subject background knowledge could not be called accidental science librarians; instead, serendipity and sagacity play a part in success when combined with sound training in LIS principles and core competencies (p. 73).
Just as Hallmark and Lembo (2003) had found, other researchers (Kellsey, Alexander, Ascher, & Brower, 2010; Roland, 2000) concluded that fellowships and internships where students work directly with mentoring librarians demonstrated great promise as a viable way to recruit students to science and engineering librarianship. Martindale (2004), a Map/GIS Librarian, suggested if students were interested in “rewarding career of GIS librarianship,” they must pursue independent study, fieldwork, and internships because the likelihood of gaining exposure to GIS or the concept of GIS librarianship in graduate LIS programs was low (p. 67). Martindale based her comments on survey results from 56 ALA-accredited LIS masters programs. Martindale concluded that most LIS curricula did not address GIS or digital geospatial data management issues and that academic library literature regarding maps and GIS had declined since the 1990s. This was a conundrum, given that cartographic professionals and academic geography faculty were realizing the potential of neogeography and neocartography.
This example was for a paid internship offered in 2015 from a company located on the west coast of the United States. Finding suitable internships is one way to influence a student wanting to have a GIS career track for librarians.
Job Title: Summer Internship Opportunity: GIS company library
1. Currently enrolled in MLIS program and completed at least one graduate cataloging/bibliographic skills course.
2. Demonstrated excellent spelling and typing, desire to work in a team, and familiarity with concepts of GIS.
3. Knowledge of digital asset management, digital rights management, and digital copyright expertise.
Responsibilities
1. Organize and catalog library archival material; enter citations and abstracts into a GIS bibliographic database with original key wording; and identify copyright for significant papers.
2. Conduct library operations including reference, circulation, and shelf management; continue ongoing controlled vocabulary project.
3. Learn about GIS and the importance of GIS in map librarianship.
Somewhat surprising is that the idea of incorporating GIS services in academic libraries is not new. Envisioning the need for geospatial librarianship led the ARL to create a GIS Literacy Project in 1992. ARL partnered with Esri and invited ARL member libraries to send librarians for free training on Esri’s ArcGIS software. By 1999, ARL measured the impact of the project and found that of those responding to the survey, the majority of librarians offered GIS services through map libraries and government documents sections; 81% of the GIS librarians had MLS degrees, 51% were trained in the ARL GIS Literacy program, and 39% had some academic GIS course work (Abresch, Hanson, & Reehling, 2008, pp. 245–246).
A decade ago, Weimer and Reehling (2006) noted GIS librarianship differed from a traditional map librarian’s job in that the information format was “digital geodata” (p. 295). They urged LIS faculty to offer course work and proposed curricula in part by examining library job posting requirements. Job titles then ranged from map to spatial data collections and services librarians and requirements common among the postings were to deliver spatial and numeric data resources and services, while also providing GIS- and map-related reference.
Below is a 2016 job announcement from a university library on the east coast. Note the position posting did not require the MLIS degree. Being qualified as GIS consultant and librarian is not common; it is a factor in for students considering map librarianship.
Job Title: Geospatial Consultant
1. Master’s degree in geospatial discipline; experience in public service, university setting.
2. Experience in supporting academic uses of GIS and in administering ArcGIS Server.
3. Excellent communication skills and effective teaching of complex technical knowledge.
Responsibilities
1. Develop research and information services that support use of geospatial data on a university-wide scale and that guide faculty and student in using geospatial data for research and scholarship.
2. Develop spatial delivery environment, specifically using ArcGIS server, Portal, Online and offer training with other GIS and data experts.
Contrasting job postings over the past several years demonstrate that in spite of the high demand for digital resources and services, print cartographic formats remain relevant. Additionally, the consequence for not preparing students for map and geospatial librarianship is that employers are hiring the best qualified applicants, with or without the MLS degree.
As described earlier, map and geospatial librarians have numerous responsibilities. Adding to that list is designing and managing the physical space and appropriate equipment. Just as print resources have transitioned to digital, map storage cases have shifted to computing servers and the cloud.
Map and geospatial resource collections present a challenge in that these resources are oversized in paper or electronic file formats, which necessitates adequate work space, specialized equipment, software licensing, and large dedicated computer-server space. Flat, folded, and rolled print maps need care and preservation, while digital collections must be migrated without loss of metadata to the newest storage mediums and current hardware specifications (Sweetkind-Singer, 2009). Digital collections require computer-server storage, but print collections depend on proper storage cases and solid floors.
In 1998, by the way of an introduction to map libraries and librarian duties, Kollen et al. provided an outline of map library work space and equipment. At that time, print maps were common, and to accommodate large map sheets, sizeable work tables were important adjacent to stacked map storage cases and hanging files all in an open room appropriate to the size of collection. Besides a variety of maps, it was suggested that oversized atlases and globes should be displayed on top of the map cases or in book shelves and folded or small maps were in book shelves or filing cabinets.
Hardcopy print map storage could be straight up in vertical case or sideways in horizontal map cases. Vertical cases hold maps in racks or troughs hung from hooks or suspended folders that slide on rails fixed to the side of the cabinet. These cases vary in size, but open on top and pull out from the front. Advantages to vertical files are they hold more maps in about half the space of filing flat, and individual vertical cases have wheels. Disadvantages are that nothing can be placed on top meaning units cannot be stacked, and they cost more than horizontal cases. Horizontal storage cases may be stacked and fixed in place or placed inside compact shelving, which are rolling, movable units. See Pritchett (2014) for a short video that shows compact shelving units in operation.
Map cases in the past and today are available in wood or steel, see Fig. 6.2. Steel is stronger, lighter in weight, and less expensive, making it the choice more often than wood. Assuming the drawer size is 50 × 38 × 3 in., this would hold two separate stacks of the 7.5-minute topographic map or most thematic maps, unfolded. Units may be various sizes though, containing three to five drawers, with the ability to stack each individual unit. The best recommendation is to go no higher than about 50 in. This allows maps to be laid on top of the case and most filing could be accomplished without the need for ladders. The size and height of the storage case are dependent upon limitation of the strength of the floor. Fully loaded, five-drawer map cases stacked three units high could weigh more than 1700 pounds (Larsgaard, 1998, p. 219; Lage, 2007). This is often the argument for placing map library space in the lowest level of the building. While compact shelving saves space, it is much heavier and the load-bearing recommendation for flooring must be investigated. March (2009) cautioned against assuming floor stability is uniform as channels exist under flooring to accommodate electrical wiring and other infrastructure.
If horizontal map cases are fixed in rows, the width of a double-facing aisle is an important consideration. According to ADAAG-United States Access Board (2002), the minimum space in library stacks is a width of 42 in. However in map libraries, aisle spacing must allow for a person to move back with the open drawer, as well as for accessing maps and completely removing a drawer without being restricted by the opposite case. Space is nearly always a problem with map collections, but ideally, spacing might be determined by figuring 1.5 times the depth of the deepest storage case (e.g., for a 38 in. deep case, ideal aisle spacing would be 54 in.). March (2009) made a strong case for utilizing AutoCAD software to create a blueprint plan for map-room equipment. The purpose was a new configuration to fit the room after moving the collection, but no mention was made for how to determine aisle spacing. In the 1980s, SLA G&M developed standards for university map collections that may be useful to review to review for print map collections (Selmer, 1988; Special Libraries Association, 1985; Special Libraries Association, Geography and Map Division Committee on Standards, 1986, 1987). In addition to map storage, light tables, overhead and slide projectors, microfilm and microfiche reader printers, and photocopy machines were suggested. Some libraries might have a desktop electronic magnifier designed for people with low vision. An assortment of small equipment that was available included calculators, rulers, drafting compasses, magnifying glass, stereoscope, and paper cutter.
While much of the equipment and tools listed earlier may not be in the map library today, a stereoscope might still be available. Stereoscopes were used since the 1930s as a fundamental tool of topographers; mirror stereoscopes reduced distortion and are preferred for aerial photo interpretation (Haren, n.d.). Although stereoscopes seem more of a historic relic, modern technology is now being employed to reinvestigate older stereo photos, see Fig. 6.3. At the University of Auckland’s map library, two cartographic and geospatial librarians have been experimenting to replicate the 3D effect in a digital format in order to showcase the potential of using older aerial photographs in a different way (Jones & Drecki, 2015).
A modern map library work space room may or may not contain print maps in storage cases. Instead, the room might have large tables with equipment such as color scanners and color photocopier as well as workstations with GIS and graphics software. Individual carrel desks or tables would be configured with electrical power outlets and available extension cords. GPS units may be available for checkout with an orientation session. While print maps in cases may still be available, many print collections have been moved off-site or weeded in favor of digital map collections.
Map librarianship is a profession that has arisen out of necessity. The large-scale map production and collection that occurred during the 20th century created a need for specialized librarians with one foot in the library and one in the world of geography. However, formal training is a relatively recent phenomenon and today remains less common than more traditional LIS career paths. Preparing for and finding jobs in this field may be more difficult than other career paths due to the small number of educational programs to prepare students. The map and geospatial or neomap librarian must also have skillsets beyond those needed for traditional librarian positions, as specialized equipment and technology knowledge is necessary to properly handle geospatial information, in both analog and digital forms. The next chapters go into some detail with the expectations for the neolibrarian in resource and instruction services, reference, collection development, cataloging, and classifying.
Cartographic materials are important components of library collections, but the volume of data that exists can be overwhelming. Copyright laws put restrictions on reproduction of original materials, including maps, and assign the right to copy to copyright holders. Copyright, fair use, and the relatively new Creative Commons licenses are discussed. Hardcopy geospatial resources can be found in most library collections, but the trend today is toward digital distribution and the use of specialized software to display and interpret these materials. A discussion of available software packages lists the most popular commercial and open-source software, both for the desktop and mobile platforms. An enormous volume of digital data is available, much of it considered a part of the public domain; a list of some of these resources, what they provide, and how they can be used are included in this chapter.
Copyright; Fair use; Creative Commons; Geospatial data resources; Maps; Software
Libraries and librarians are needed more than ever in today's information landscape. Informed map librarians can create reference services that identify authoritative, credible cartographic sources and note whether the resource is free or fee-based. Map librarians can design instruction services related to maps and geospatial data that describe copyright law and elaborate on what fair use is and is not, with examples for citation and attribution. One major advantage today is the ever-increasing number of cartographic resources and mapping software shared online that may complement existing print map library collections. The challenges are navigating the labyrinth of available cartographic resources and knowing how software, maps, and data can be found and used in a legal manner.
In the past, obtaining cartographic resources meant physically walking through the doors of library, government, and commercial buildings. Today, these resources are more often obtained electronically. As noted in Chapter 1, both the physical and electronic doors can slam shut on governmental agencies and libraries at the whim of politicians, including the closure of the Library of Congress, see Fig. 7.1.
Closing the Library of Congress (LOC) had far-reaching consequences for librarians, publishers, and citizens. For example, Fister (2013), a librarian, had to turn patrons away when access to and use of the LOC resources were denied and The American FactFinder was shut down. Fister commented on the Congress-initiated closure as, “this is what happens when people who do not believe in government are elected to government… they took an oath to defend the constitution…but they don't believe in the system for which the constitution is a blueprint.” Publishing companies experienced delays when it was not possible to obtain Library of Congress Classification Numbers (LCCN) before going to press (G. Knott, personal communication, November 1, 2013). Moreover, tens of thousands of citizens were delayed in applying for and recording copyright claims of authorship, trademarks, and patents to the U.S. Copyright Office, a department within the LOC (U.S. Copyright Office, n.d.g). Copyright is the legal foundation of libraries, and librarians must provide instructional services to inform the public on copyright protection, fair use, public domain, and citation of sources (Association of Research Libraries, n.d.).
Copyright is a legal means to protect original works of authorship created in a tangible medium, whether published or unpublished; this includes cartographic, pictorial, and graphic creations, but excludes ideas, procedures, process, and systems (U.S. Copyright Office, n.d.d). Thus, maps and geospatial data fall under copyright protection; yet, the process of mapping such as using geographic information systems to produce maps is not covered under the laws of copyright. This is in part why open-source GIS, such as QGIS or GRASS, may be used without permission or fees.
In a literal sense, copyright means the right to copy. In a legal sense, copyright becomes the exclusive right to copy, which belongs only to the author or copyright holder. According to the U.S. Copyright Office (n.d.b), copyright law identifies the author as not only the “…creator of the original expression in a work” but also “…the owner of copyright unless there is a written agreement by which the author assigns the copyright to another person or entity, such as a publisher.” If the author creates the works for hire, authorship belongs to the employer or commissioning agent.
Copyright laws assigning rights of ownership were created to prevent piracy. Piracy or copyright infringement “…occurs when a copyrighted work is reproduced, distributed, performed, publicly displayed, or made into a derivative work without the permission of the copyright owner” (U.S. Copyright Office, n.d.b). According to U.S. Copyright Office (2010), they serve as an office of record and do not provide legal advice, but the website has a complete how-to account of defining infringement, explaining enforcement options, and accessing litigation resources. In the past, it was easy to know whether a work was protected by copyright, because a copyright notice was evident. Copyright notice consists of the symbol © followed by the date of first publication and the copyright owner's name (U.S. Copyright Office, n.d.b). However, copyright exists automatically in the United States today whether or not the author included the copyright notice. A brief history of copyright law follows.
Writers of the Constitution addressed copyright for scientists, artists, and authors in order to promote creativity and innovation in the United States. A Federal Copyright Law was passed in May 1790, 2 years after the U.S. Constitution was ratified with a provision submitted by James Madison, “to secure to literary authors their copyrights for a limited time” (U.S. Copyright Office, n.d.c). The resulting law protected books and maps for a period of 14 years, with one renewable 14-year time period. Less than 3 weeks after the Federal Copyright Law was enacted, the first cartographic resource was registered to John Churchman for his Magnetic Atlas and Variations Chart (U.S. Copyright Office, n.d.c). Given the resource's age, the fact that the cartographer is deceased, and LOC inclusion in the online catalog, use of this resource is now considered in the public domain and has fair-use status, see Fig. 7.2.
The original 1790 federal law only applied to U.S. domestic copyright protection. This isolated position in the world meant there was no legal recourse for global intellectual piracy; for example, foreign publishers could translate and reprint U.S. citizens' works, from books to maps, without requesting permission or providing payments. This was a worldwide problem that many countries recognized could be solved by crafting and agreeing to international copyright provisions. A convention was held in Berne, Switzerland in 1886 to address the protection of works and rights of authors. If countries signed the Berne Convention, all contracting parties or signatory countries would recognize copyrights held by citizens of other signatory countries. Subsequent conventions expanded the scope of the Berne Convention. Links are online to a Berne Convention summary, including the complete treaty from September 9, 1886 through numerous revisions and amendments ending on September 28, 1979 as well as a list of contracting parties (World Intellectual Property Organization, n.d.a). While this treaty for international protection of literary, scientific, and artistic works became effective in 1887, the United States did not initially participate in the Berne Union of member states. Instead, the U.S. Congress passed the International Copyright Act of 1891, which empowered the President to extend copyright protection to works of foreign nationals of select countries that reciprocated the arrangement for U.S. citizens (U.S. Copyright Office, n.d.c).
When the copyright law was enacted in 1790, district courts were the first to handle copyright registration (U.S. Copyright Office, n.d.e). Congress removed the process from the courts and created the U.S. Copyright Office and Administrator, Register of Copyrights, as a separate department within the Library of Congress in 1897 (U.S. Copyright Office, n.d.e). While the Copyright Office provides expert, impartial assistance to the three branches of the federal government on law and policy, it serves primarily as a place where claims to copyright are registered and documents related to copyright are recorded. The copyright catalog has records back to 1891 and today the catalog can be searched online (U.S. Copyright Office, n.d.f).
On March 1, 1989, the United States signed on as a member state of the Berne Convention, adhering to the 1971 Paris Act (U.S. Copyright Office, n.d.c). A quick summary of this treaty is that copyright protection is equally recognized among all signatory states and is independent of copyright law in the country of origin of the author's work. One of the significant changes for the United States was accepting the concept that a copyright does not require registration application and approval in each country, but rather it is an automatic right that exists the moment a work is written, drafted, or recorded (World Intellectual Property Organization, n.d.b). Even though registering works for copyright protection has no longer been mandatory since March 1989, the Copyright Office still processed more than 700,000 registration claims in the fiscal year 2011 (U.S. Copyright Office, n.d.e). In addition, the registration and records systems together form the largest database of copyright works and ownership information in the world (U.S. Copyright Office, n.d.e).
In the 18th century, federal law granted a copyright holder's exclusive rights lasting a maximum of 28 years; today, the duration of protection is longer but more complex because of the Copyright Act of 1976 and subsequent to joining the Berne Convention. Despite this, copyright has never precluded the use of a creative work; if permission for use was granted by the copyright holder or if protection had expired, then the work may be considered fair use. Fair use is the legal right to use copyright material without requesting permission, if all restrictions are understood and adhered to by the public. Nevertheless, the 21st century has seen a shift whereby the creator, or copyright holder, can assign the work to a Creative Commons license, which helps further define its fair use and delineate its copyright status.
When images, maps, or other original creative works display the Creative Commons notice, the author has chosen to retain some of the restrictions granted with copyright, see Fig. 7.3. Creative Commons is a U.S. nonprofit organization with global affiliates who help individuals to legally share personal works of creativity using free copyright licenses. The CC empowers creators by allowing them to more deeply participate in the sharing-friendly nature of the Internet, while staying aware of the need to protect creative works from abuse, particularly unauthorized commercial use. There are different levels or conditions to choose from when applying a CC license to a work, and the CC website has an interactive page that helps users to determine what license is right for them (Creative Commons, n.d.a). It is important to understand that a work licensed with the CC is not the same as a work being in the public domain; most CC licenses have use restrictions, the most common being the need for attribution. A CC license may allow users to share adaptations of a work freely, stipulate that adaptations are acceptable as long as the end product is released under the same or equivalent CC license, or allow free reproduction while prohibiting adaptations of the work. The CC also allows a user to grant or prohibit the ability to use their work in a commercial endeavor. While most CC licenses seen online are not the equivalent to public domain, the CC does have a version, CC0, that is “…a public domain dedication for rights holders who wish to put their work into the public domain before the expiration of copyright” (Creative Commons, n.d.b).
Unsurprisingly given the complexity of copyright laws, the breadth of potentially copyrightable materials, and international legal considerations, the CC has gone through several revisions. According to the Creative Commons (n.d.c), “…in November 2013, Creative Commons published the version 4.0 license suite… the most up-to-date licenses offered by CC, and are recommended over all prior versions.” Materials that continue to use an older version of the CC license are still protected, although in some cases the 4.0 license can add clarity, particularly in regard to sui generis database rights (Creative Commons, n.d.d).
Fair use has a simple definition, but unfortunately a complex determination as to whether the concept applies in any given situation. This is an especially relevant topic to be familiar with given the ease of access the Internet provides to text, images, maps, code, software, and other resources. Fair use refers to transforming, reproducing, and/or distributing copyrighted material for purposes of personal, educational, and commercial use and “…a defense against a claim of copyright infringement” (Stanford University Libraries, 2005–2016c). The Copyright Statute includes four factors that judges consider to determine fair use, mainly “…the purpose and character of your use, nature of the copyrighted work, amount and substantiality of the portion taken, and the effect of the used upon the potential market” (Stanford University Libraries, 2005–2016a). Since it is difficult to predict how a judge might rule, being familiar with past rulings may help; this information can be accessed through the U.S. Copyright Office website. This website offers a Fair Use Index that tracks “…judicial decisions to help both lawyers and non-lawyers better understand the types of uses courts have previously determined to be fair—or not fair” (U.S. Copyright Office, n.d.a). For each indexed decision, a summary of the facts, relevant questions, and court decisions are given.
Two U.S. university libraries at Stanford and Columbia have excellent copyright and fair-use resources and serve as examples for other libraries. At Stanford, the overview webpage provides links to all materials on the copyright and fair-use website (Stanford University Libraries, 2005–2016b). The source for much of the online information and blog at Copyright & Fair Use are from the book Getting Permission by Stim (2010). The Copyright Advisory Office was founded by Columbia University Libraries to support faculty and students as well as to provide awareness and education about copyright as it applies to teaching, researching, and publishing (Columbia University Libraries, n.d.a).
If fair use is contested by the copyright holder, the courts will weigh circumstances to determine the outcome. The following scenarios are paraphrased from two copyright advisory offices' webpages at Columbia University Libraries (n.d.b) and Stanford University Libraries (2005–2016a). Courts favor nonprofit educational use where the work is transformed into something new vs. commercial use and a direct reproduction of the copyright work. Courts are more protective of fiction and creative works including art, music, and films vs. nonfiction; courts do not accept correspondence or unpublished work as fair use, because copyright owners should have rights to first publication. Although quantity limits are not set, the more of a work used, the less often it is considered fair use. This has implications for commercial maps and aerial photography since the user would likely need the entire image, which is less likely to be fair use; however, cropping out a portion of the map or reusing low-resolution or thumbnail images for educational and research purposes may be fair use. It is not fair use if the works in question can be purchased or licensed; this directly affects mapping software and videos.
Resources that fall under public domain are fair use. With regard to copyright, public domain is a designation whereby works can be freely used without permission from the author. Among the reasons work is considered public domain status include the expiration of copyright protection or public property works that are produced by the U.S. government and as such do not meet requirements for copyright (U.S. Copyright Office, n.d.b). Lastly, an author may voluntarily give up copyright to dedicate the work in the public domain or release it under a Creative Commons license.
New print maps are becoming increasingly rare. Many agencies that used to print maps have either switched to a print-on-demand model, gone purely digital, or have quit entirely. This trend follows user demand, as many of today's map users expect digital maps or raw GIS data to create their own maps. Some agencies and private companies still produce paper maps, but the shift to a digital cartographic paradigm has opened up maps to a larger audience. This has allowed for much more participation in the creation and production of map information, see the discussions of NeoGeography and NeoCartography in Chapters 1 and 4. While this is generally positive, it changes the nature of the librarian's role in regard to map resources, as knowledge of the software used to create and analyze maps and geospatial data becomes more important. Patrons will likely have heard of the analytical abilities of GIS and remote sensing and want to tap in. It may not be possible for all facilities to have on-demand GIS technicians, although many universities may have a GIS lab that does consulting work, but knowledge of how to use the technology and where to find data remains an important skill to have. The remainder of this chapter serves as a guide to geospatial software and sources of data and maps that are available.
The desktop GIS and remote sensing fields are dominated by a few large players, although many smaller specialized and open-source software packages exist. In terms of cost, they range from free to fairly expensive. Generally speaking, these software packages demand powerful computer hardware and require relatively new Windows PCs to operate. Some software is available for the Mac and Linux platforms, but Windows is the home of the biggest players in GIS. This list is certainly not exhaustive, but rather focuses on the most prominent packages in use today. Other programs exist in the GIS market and may be good alternatives or helpful supplemental programs to have available. This section is not designed to make recommendations on which packages are the best; any of the programs described here would be useful and offer a good amount of support for users.
Let's start with an important free program that is widely used, Google Earth. It has played a large role in increasing spatial awareness and spatial thinking in the popular culture. Google Earth is used in education at all grade levels, as a leisure activity by individuals, and by professionals creating visualizations of the world. Despite this, Google Earth is not a true GIS software package. It is an excellent tool for visualizing data, but lacks database and analysis capabilities beyond measuring distances and surface area. This is not to downplay the quality or usefulness of the program, but rather to counter popular misconceptions of what GIS is. It is likely that well-intentioned patrons will have used Google Earth. That personal experience combined with fictional media representations of GIS, similar to the “science” employed in popular television crime procedurals, might lead them to expect that the technology could accomplish impossible things quickly and with little effort.
Google Earth is currently available in a few versions, the standard package and Google Earth Pro. The Pro version was formerly a paid product, but is now free for anyone to use. It adds more advanced capabilities such as the ability to print at high resolutions and export movies at full 1080p HD resolution. It also includes more advanced measurement tools, extra data layers, the ability to import Esri shapefiles, MapInfo .tab files, and more addresses in a spreadsheet simultaneously. A commercial version still exists, Google Maps for Work, although it is primarily oriented to developers in businesses. An image showing the main Google Earth Pro window can be seen in Fig. 7.4.
ArcGIS from Esri, an acronym for Earth Systems Research Institute, dominates the market and is considered the industry standard for GIS software. Esri began as a consulting firm, and first made its software commercially available as ARC/INFO in 1980. It has evolved over the decades, beginning in a mainframe context with work occurring exclusively at the command line. In 1992, ArcView was released adding a mouse-driven graphical user interface (GUI); this is not to be confused with the current ArcView, which is the name given to the entry-level version of ArcGIS for Desktop. The older ArcView version 3 is still in use in some places, especially internationally, in part due to the high cost of current ArcGIS offerings. Since ArcGIS 8 was released in 1999, Esri's flagship desktop GIS software has remained more-or-less the same, although new capabilities and improvements continue to be added. The largest change has come with ArcGIS Pro, released in January of 2015, which adds a new ribbon-style interface, similar to that introduced to the Microsoft Office suite in the 2007 edition. ArcGIS Pro also adds some modern updates, including 64-bit, hyperthreaded, multicore processor support, the ability to have multiple 2D and 3D views displayed simultaneously, and many other updates. Currently it does not support all of the functionality of ArcMap, but more tools and features continue to be added.
The primary program in the ArcGIS suite is ArcMap, where much of the analysis and map making occurs. Other components of the ArcGIS suite include ArcCatalog for managing data, ArcScene for 3D visualization of data, and ArcServer for hosting maps and GIS services online. While it is not official, it is quite likely that ArcGIS Pro will replace ArcMap as the primary Esri GIS application in a few years in a transition not unlike that between ArcView and ArcGIS. A screenshot of ArcMap 10.3 can be seen in Fig. 7.5.
Despite being the industry standard for GIS software, ArcGIS is generally considered to be frustrating to work with at times. The software includes a great number of tools and options, and can be quite daunting to a novice user. While the program has improved greatly in speed and reliability over the years, it also retains a reputation for crashing regularly, and some tools require conditions that seem strange by current standards. These conditions include things such as having short character limits for file names or crashing due to spaces in file paths. Even with these issues, the fact that the software has been used commercially for more than 35 years means that an enormous amount of support exists, both via the extensive official documentation and through online support forums. Esri also hosts large annual conferences including the User Conference every summer in San Diego, California, and the Developer Summit every March in Palm Springs, California. Esri also hosts many smaller conferences all over the world on a variety of topics. These conferences offer a mix of training, product announcements, and networking opportunities.
MapInfo is another commercial GIS product that has been around for many decades. It beat Esri to the punch by releasing the first desktop GIS package then known as the Mapping Display and Analysis System (MIDAS) in 1986. For some time, the 3D toolset that MapInfo offered was considered superior to those offered by Esri, and MapInfo found a home with geologists doing subsurface work. Today owned by Pitney Bowes Software, it is a fully functional GIS package offering tools comparable to other large GIS packages. While it does not enjoy the same size market share as ArcGIS, it is still commonly used by GIS professionals. Fig. 7.6 shows a view of the software.
Open-source GIS software packages are often used as an alternative to ArcGIS. Since 2006, the nonprofit Open Source Geospatial Foundation has existed to support open-source developers creating geospatial free and open-source software (FOSS) (OSGeo, 2015). They have helped to support several widely used desktop platforms, in addition to server and client web mapping packages. Open-source software has some distinct advantages over Esri's ArcGIS: it is free, often available not just on Windows, but also on Mac and Linux platforms, and the code can be freely and legally modified to create custom analyses or tools. The major downsides are that they are often not quite as polished as commercial software, tend not to offer the same breadth of functionality, and may not have as much support available to end users. That being said, many open-source packages are quite impressive, and can be used as everyday GIS tools.
QGIS began life as Quantum GIS in 2002 led by developer Gary Sherman. As of 2016, it is a mature, powerful desktop package with an extensible design, meaning that it is easy to add plugins and connect to other toolsets. Since QGIS is open-source, a number of free tools exist to meet specific needs whether they be analysis or visualization related. A view of the QGIS environment can be seen in Fig. 7.7.
GRASS GIS is an older project, with its development beginning in 1982. As such, the interface is somewhat less friendly to today's typical computer user, see Fig. 7.8, and it still uses a command-line functionality for some operations. The software can be used on its own, or it may act as a backend for packages like QGIS or the statistical package R. Primary development was overseen by the U.S. Army Corps of Engineers' Construction Engineering Research Laboratory, although since then many different partners have assisted in development, including other federal agencies, private companies, and universities (GRASS Development Team, 2014). Due to the long relationship with academic institutions, GRASS has frequently been used in research contexts.
While many mature desktop GIS applications exist in the open-source community, there are fewer options for free GIS software used for other purposes (Steiniger & Hunter, 2012). This makes sense, as the desktop is the primary location where GIS work occurs. A couple of other notable open-source GIS packages include PostGIS, which provides spatial components to the PostgreSQL database software for online GIS, and GeoDa, which allows users to explore spatial datasets through different data visualizations, see Fig. 7.9. More open-source GIS software, including software libraries for development and web-mapping packages can be found through http://www.freegis.org, http://www.opensourcegis.org, and the Open Source Geospatial Foundation at http://www.osgeo.org (Steiniger & Hunter, 2012).
While there may not be as much open-source activity for remote sensing software as there is for GIS, there are several commercial remote sensing packages that are commonly used. ERDAS IMAGINE from Hexagon Geospatial is the largest of them, occupying a spot in the remote sensing world much like that of ArcGIS in the GIS world. The software also has a history similar to ArcGIS, beginning in 1979 with the desire to create a user-friendly system that could integrate Landsat and SPOT imagery with other sources of GIS data (Finlay, Brantley, & Skelton, 1984). Over the years the software evolved along with changing hardware and interface contexts. The first version, ERDAS 4, supported 8-bit Z80 processors and command-line functionality. Beginning in the mid-90s, IMAGINE has operated in a Windows PC environment (Beaty, 2009). Since the 2010 version, it has used a ribbon-style interface. Fig. 7.10 shows the main IMAGINE window displaying a Landsat 8 scene in false-color.
Exelis Visual Information Solutions' ENVI (ENvironment for Visualizing Images) is another commercial remote-sensing package. It evolved from the Interactive Data Language (IDL) originally created by David Stern in 1977 to work with data from the Mariner Mars 7 & 9 space probes (Exelis, 2015). The ENVI program as it is known today was first released in 1994 as a hyperspectral image-processing package. While it does not hold as large a market share as IMAGINE, ENVI is a complete remote-sensing package, and is popular in research environments. Fig. 7.11 shows the main program window displaying a Landsat 8 scene in false-color.
TerrSet is a commercial geospatial software package produced by Clark Labs. The software was originally created by J. Ronald Eastman in 1987 as a raster-based remote-sensing package, then known as IDRISI. The latest release integrates the IDRISI GIS Analysis and IDRISI Image Processing tools into a larger framework for geospatial modeling and analysis (Clark Labs, 2015a). Despite being a fully featured raster analysis package with vector capabilities, TerrSet's market share is miniscule when compared to IMAGINE and ENVI. However, due to low cost and an easy-to-use interface, it has been popular in educational environments. Fig. 7.12 shows the main TerrSet program displaying a Landsat scene.
The world of mobile GIS is changing quickly. This area may have lagged a bit when compared to desktop and online GIS, but has been growing rapidly due to the explosion of GPS-enabled mobile devices in the market. Much of the use of mobile devices revolves around viewing maps and the collection of data in the field rather than analysis, largely thanks to GPS integration in most mobile devices. Anyone with a GPS-enabled mobile device may collect spatial data, and many apps exist on all the major platforms to accomplish this. Unsurprisingly, Esri is a large player in this area with their ArcPad program. ArcPad only runs on the Windows Mobile platform versions 5 through 6.5 which are lacking by today's standards, and Windows 8 tablets. However, a great number of devices today use either Apple's iOS or Google's Android platforms and cannot run ArcPad. Esri used to offer a single ArcGIS app for these platforms, but it has been retired from the iOS App Store and Android Google Play store as of August 2015. Replacing it are multiple apps designed to focus on specific functionality rather than one single app covering everything. Explorer for ArcGIS is designed to view cloud-shared map content; crowdsourcing functionality can be handled by a few different apps including Crowdsource Reporter; and field data collection and editing are handled primarily by Collector for ArcGIS, seen in Fig. 7.13.
There are other applications for Android and iOS that offer GIS functionality on mobile platforms beyond Esri's offerings. Although it is still early in development, the QGIS project's QField is freely available for Android devices and can open and edit QGIS project files. On the iOS side, GIS Kit and GIS Pro are commercial apps that have field data collection capabilities. Unfortunately, they come with hefty price tags of $99.99 for Kit and $299.99 for Pro.
There are far too many other apps that offer some amount of GIS functionality to discuss here, but keep in mind that many are not full GIS solutions. No mobile app is going to replace the capabilities of a desktop GIS program entirely. In fact, quite a few apps that advertise themselves as GIS offer no more than the ability to stream preexisting map content via Google Maps, ArcGIS Online maps, or another map service, locate the user via GPS, and make some simple measurements of distance and area. When looking for mobile solutions be aware of these limitations: read the feature list carefully and try any available demos before committing to a paid mobile app. That being said, the speed with which the overall mobile space has grown and changed in the past few years means that it is likely that mobile GIS apps will continue to improve in the future, with more options and greater capabilities found in both commercial and FOSS packages.
The remainder of this chapter deals with sources for maps and data and how to use them. Almost everything is now accessed through a web interface, which makes finding and downloading data and maps a largely straightforward process. Some sources are broad in terms of the content they provide, while others are explicitly designed to serve the needs of specialized topics. One thing that should become apparent is the volume of information provided by U.S. federal agencies. The U.S. federal government is one of the largest and best sources of information about the natural and cultural world; while some of those data are global in scope, their focus tends to be on the United States. Many other nations provide data for users beyond the United States, although there may be some barriers to the data in these cases such as language and rights issues when browsing the European Union's INSPIRE Geoportal.
For cultural and demographic information about the United States, the U.S. Census Bureau is the largest and best source of information. Mandated in the Constitution in Article I, section II, the decennial census records the population of the nation, and over the past 22 censuses a great number of other demographic factors have been added to the count. Data from the 1790 through 1940 censuses are available through the U.S. National Archives and Records Administration; 1950 to present data are hosted by the U.S. Census Bureau.
The Census Bureau also runs continuous surveys in addition to the decennial census, including the American Community Survey (ACS), the American Housing Survey, the Current Population Survey, and many others. These provide data updates between the decennial censuses and address additional facets of American life. For example, the ACS provides a constantly updated source of information about the U.S. population used by policy makers, planners, members of the business community, and many other organizations to direct federal funds and prepare for changing demographics (U.S. Census Bureau, 2015b).
All of the post-1940 information is available via the Census Bureau's website, specifically using the American FactFinder. The FactFinder interface allows users to specify locations and programs from which to pull data, making it possible to find specific tables representing places, the term used to describe cities or towns, counties, states, regions, or the entire nation for individual or multiple datasets such as the decennial census, ACS, etc. However, this interface may be daunting and confusing for new users to access.
For the newest data releases, one website that can help users more easily browse census data is CensusReporter.org. The site is not officially associated with the Census Bureau, but rather it is a Knight News Challenge-funded project that acts as a third party front-end to make decennial and ACS data more accessible (Census Reporter, n.d.a). Not only does the site allow users to easily search for data by location or by topic, it also provides interactive charts and maps that may be embedded in webpages, as well as GIS versions of the data. Any available census table can be downloaded through Census Reporter in the tabular formats CSV or Excel, or as spatial data formats GeoJSON, Google Keyhole Markup Language (KML), or Esri Shapefile.
The interface is straightforward, and the options for downloading or embedding the data online are impressive and easy to use. Fig. 7.14 shows an example of the visual profile for a location, in this case, the city of Murfreesboro, Tennessee. The only downside is that while the data comes straight from the Census Bureau, it only shows the most recent information, from either ACS estimates or the decennial census. Accessing older data can still be done through the American FactFinder, or for pre-1940 information, the Historical Census Browser via the University of Virginia Geospatial and Statistical Data Center or the National Historical Geographic Information System hosted by the Minnesota Population Center at the University of Minnesota (Regents of the University of Minnesota, 2010; University of Virginia, 2004). The 1940 decennial census is available online through the 1940 Census website hosted by the U.S. National Archives and Records Administration (2015).
With the Census Bureau's need for storage and tabulation of data, the bureau has been at the cutting edge of computing and spatial methods since the early days. The 1890 census utilized a mechanical system invented by Herman Hollerith that relied on punch cards for data entry and storage (Pretzold, 2000). Hollerith's machine allowed the volume of information collected to be doubled while reducing processing time by about a third compared to the 1880 census. The company Hollerith set up to produce and sell the machine was known as the Tabulating Machine Company and still exists to this day, although it has gone through a few changes since, not least of which includes a 1924 name change to International Business Machines, or IBM.
With that legacy in mind, the Census Bureau has been a heavy user and driver of GIS technology, and some of the major products they provide are GIS datasets. While the bureau hosts multiple types and sources of data, the Topologically Integrated Geographic Encoding and Referencing, or TIGER, program is one of the most prominent. It began in the 1970s and was officially first used in the 1990 census as a way of modernizing data collection and storage (U.S. Census Bureau, 2015a). TIGER files provide a backbone to the modern census as well as countless GIS professionals by officially defining geographic areas and providing a spatial component to census data. This allows census data to be mapped, visualized, and analyzed using modern GIS techniques. These data are updated regularly and much like tabular census data, are used by a variety of agencies and individuals to help monitor and analyze trends in the United States. Datasets can be downloaded in multiple formats, including Esri shapefiles and geodatabases, Google KML files, and via an online GIS server for streaming data to GIS software. An example of TIGER data is the U.S. states shapefile shown in Figs. 7.5–7.7.
CIESIN is a research unit within the Columbia University Earth Institute focused on providing data on a broad variety of interdisciplinary topics (The Trustees of Columbia University, 1997–2016a). CIESIN's homepage can be seen in Fig. 7.15. The Information Network is the hub of many international research collaborations including projects like hosting the socio-economic data and scenarios used for Intergovernmental Panel on Climate Change (IPCC) assessments and the Africa Soil Information Service, which works with African scientists to create detailed digital soil data for sub-Saharan Africa. The CIESIN website is also a portal to data available on a large number of topics, including agriculture, biodiversity and ecosystems, climate change, data preservation and access, economic activity, environmental assessment and modeling, environmental health, environmental treaties, indicators, land use/land-cover change, natural hazards and vulnerability, population, poverty, and remote sensing for human dimensions research (The Trustees of Columbia University, 1997–2016b). The Information Network also places an emphasis on education and outreach to decision makers, the educational sector, and the general public. It has resources for GIS training and a number of undergraduate and graduate courses that are regularly offered at Columbia University in New York City on various Earth Science topics.
Realizing the need for intelligence about the world during World War II ultimately led to the creation of the Central Intelligence Agency (CIA) in 1947 (Central Intelligence Agency, n.d.a). The World Factbook is a product of the CIA, including “information on the history, people, government, economy, energy, geography, communications, transportation, military, and transnational issues for 267 world entities.” (Central Intelligence Agency, n.d.b). This publication was first released in 1962 as a classified document, and has been published in an unclassified format since 1971. Today it is published online and is updated weekly as new information is gathered, see Fig. 7.16. It may also be purchased in an annual hardcopy edition via the Government Printing Office. It is intended to be used by U.S. policymakers, but as a federal product is freely accessible for anyone to utilize. The CIA also publishes the Chiefs of State and Cabinet Members of Foreign Governments on a weekly basis.
In addition to these sources, the CIA digitally distributes maps showing world physiographic features and political boundaries. Some countries are available as stand-alone maps showing administrative boundaries, physiography, and transportation, but not every world country gets this treatment. An example of one of these maps can be seen in Fig. 7.17. Regional and world maps are also available showing political and physical features. The CIA previously sold paper versions of these maps, but publishing of paper maps has ceased and they are now available in digital form only.
The European Environment Agency, consisting of 33 member states, is tasked with providing environmental information to be used by policy makers and the general public in the European Union, as well as coordination of the European environment information and observation network (European Environment Agency, 2015). The EEA's website hosts a variety of products on different environmental topics, including maps and data. Reports, articles, and video content are available on topics such as air pollution, soil, agriculture, and others. Published content is generally written at a level that is accessible to a lay audience. Geospatial data are also available to download for some topics and are provided in a few different file formats. In other cases, data are available in a nonspatial tabular form. Premade maps can also be found on the website to view or download.
The Infrastructure for Spatial Information in Europe is an ambitious effort dictated by the INSPIRE Directive 2007/2/EC put in place by the Council of the European Union and the European Parliament (INSPIRE, n.d.b). It is designed to create a standardized infrastructure for the geospatial data resources of the 28 participating EU member states. This helps to address inconsistencies in spatial data collection, fill gaps in spatial data documentation, address compatibility issues between datasets and local spatial data infrastructures, and remove barriers of all kinds that may be preventing or delaying the sharing of geospatial data (Craglia, 2010). Not surprisingly, this is an ongoing challenge since variation exists in geospatial data and available data services from one EU member state to the next. Beyond that, practical challenges are also presented by factors such as language barriers and funding disparities. The INSPIRE Directive lays out 34 themes including administrative boundaries, geology, hydrography, land use, soil, and others. These themes were chosen to cover the information required for environmental applications (INSPIRE, n.d.a). Ultimately, INSPIRE will host data related to all of these themes for each member state in formats that are interoperable, providing scientists and policy makers access to information that is not truncated by national borders. Given the relatively small physical size of many member states, this will provide a much more holistic perspective on some of the environmental challenges the EU faces.
For those seeking geospatial data, the INSPIRE Geoportal is an important resource. The Discovery/Viewer tool allows users to search for data based on thematic content or location via an interactive map interface, as seen in Fig. 7.18. Individual search results can be expanded to show the metadata and formats available for download, and the footprint of the data layer is simultaneously displayed on the map viewer. For data that are stored in a language foreign to the user, an embedded Microsoft Translator is available to assist. Unfortunately, like most automated translators this solution is not perfect, and the language may be confusing. Technical terms in particular may cause problems and remain untranslated. Some layers that are returned in a search may also have usage restrictions, depending on the country of origin and the nature of the data represented. That being said, this is still a valuable resource for searching data across national and language barriers within Europe.
The INSPIRE Geoportal also provides metadata tools that help users meet the INSPIRE standards. A validator exists that will scan existing metadata and report back any omissions or mistakes in the metadata. An editor also exists that allows users to input information and generate metadata that is up to the required standards.
The Gateway to Astronaut Photography of Earth website collects all of NASA's manned photos taken from space, beginning in 1961 with Mercury 3, the first manned mission (Stefanov, n.d.). These primarily focus on photographs of the Earth's surface, but other astronomical features and images of astronauts are included in the collection as well. The collection is distinct from the imagery generated by NASA's satellites, probes, and rovers; photos here are all taken by astronauts in space rather than unmanned or remotely controlled platforms. They can be easily searched using a few different methods, including the ability to use a Google Maps-based interface to find photos of specific areas of interest (AOI) on the surface. Fig. 7.19 shows an example of a photo housed in this collection.
Gazetteers record the names and some demographic or contextual information about places. They come in different styles, with some including not much more than location and place names, and others having longer, encyclopedia-style descriptions of the locations recorded. Some gazetteers will have an accompanying map series, and list the specific page and location on the map where the place can be found. Many library collections have physical copies of gazetteers with local, regional, and global scopes, some quite old, others more recent in their publication. Governments often use gazetteers as a way of recording and standardizing place names in an official capacity. For example, the U.S. Census Bureau makes a yearly updated digital gazetteer available as a record of officially recognized places and names (U.S. Census Bureau, 2015c).
Online, a large number of gazetteers are accessible as well, and a quick search will uncover dozens that are available for browsing for information. Some of the larger ones include the aforementioned U.S. Census Bureau Gazetteer Files, the U.S. Board on Geographic Names Information System (GNIS), and the National Geospatial-Intelligence Agency's GEOnet Names Server (National Geospatial-Intelligence Agency, 2016; U.S. Census Bureau, 2015c; U.S. Geological Survey, 2015e). Naturally, other countries also host gazetteer information online as well, such as the Geographic Names Board of Canada's online Geographical Names Search (Natural Resources Canada, 2014). While these represent current names, historic gazetteers can also be found online. The American Association of Geographers hosts one list of online historic gazetteers on their website (American Association of Geographers, n.d.).
Given that geospatial data are often updated regularly, older versions of data may be at risk of being overwritten in the update process if an archival plan is not in place. In the world of purely paper-based documents, this was less of an issue, as the creation of a newer version of a map did not hinge on the destruction of the older versions of the data. In a digital context however, it is entirely possible that updates to a dataset over time could effectively erase the original data.
To help raise awareness and combat this, the GeoMAPP project focused on the topic of preserving data considered at-risk and temporally significant (North Carolina Office of Archives and History, 2011). It ran from 2007 to 2011 and partnered with archives departments in North Carolina, Kentucky, Montana, Utah, and the Library of Congress' National Digital Information Infrastructure and Preservation Program (NDIIPP). One of the outcomes of the project was the creation of guidelines for how best to identify and preserve historic geospatial data of value. The GeoMAPP website does not host any geospatial data. Instead, it provides valuable information on how to assess the state of an institution's geospatial data, and how to build and implement a plan for the archival of geospatial data. This information can be found in the GeoMAPP Geoarchiving Business Planning Toolkit, a zip file containing documents and a spreadsheet for calculating costs. Based on these documents, an institution can more effectively determine how to meet its needs for data archiving.
GloVis and EarthExplorer are two platforms hosted by the U.S. Geological Survey (USGS) for downloading satellite imagery and many other types of geospatial data. Originally, the USGS’s Earth Resources Observation Systems (EROS) provided online data through a system called the Global Land Information System (GLIS). This system was released in 1991 and remained in service until September 2003. Both the GloVis and EarthExplorer platforms that have replaced GLIS have some overlap in their functionality, as they provide some of the same data, but their interfaces are built on different technology and have different methods of searching for data. GloVis focuses mostly on satellite imagery, with products from the Landsat, ASTER, EO-1, MODIS, and TerraLook platforms, recent aerial photography, and other data (U.S. Geological Survey, 2015a). It was developed at USGS and went live in April of 2001. GloVis has a custom Java-based front-end that runs in a web browser seen in Fig. 7.20, although a major update to the system is planned (B. Van Keulen, personal communication, February 18, 2016).
EarthExplorer first began operations in 1999 to support Landsat 7 data, and used software provided by the Canadian company Compusult (B. Van Keulen, personal communication, February 18, 2016). In 2011, the EarthExplorer platform was updated to use a Google Maps-powered interface that uses both Oracle and Postgres databases for managing data, see Fig. 7.21. EarthExplorer has a larger breadth of data available to download from over 180 collections. These include the satellite platforms that GloVis provides, along with other products such as USGS aerial photography both recent and historic, elevation, land cover, Digital Line Graphs (DLGs), Digital Orthophoto Quadrangles (DOQs), and other layers. It also has some commercial satellite imagery, such as data from the French SPOT program, IKONOS-2, and ORBVIEW 3. Other data include declassified satellite imagery from early U.S. programs like CORONA, ARGON, and LANYARD. The search capabilities also provide more advanced options than those of GloVis, allowing users to search by address, place names, satellite path and row, a user-defined polygon, shapefiles or KML files, and by date range. Both the EarthExplorer and GloVis platforms may be used to download or order data in bulk, and the same user account can be used to login to either as well.
The HDDS is a USGS-hosted service that provides data related to areas that have suffered natural hazards (U.S. Geological Survey, 2015b). The data come from other sources, such as Landsat satellite images, and are organized by event. Using the same interface and user login account as the USGS EarthExplorer website, users can search by year and hazard event to find and download data that cover affected regions. The HDDS also provides GIS servers that can be accessed by ArcGIS and other GIS software to load pre- and post-event imagery and data layers directly into a desktop GIS environment. The HDDS is not limited to U.S.-based events, as some international hazard events are listed along with domestic ones. See Fig. 7.22 for a view of the HDDS interface.
The Library of Congress is the national library for the United States, but has foreign-language materials in more than 460 languages (Library of Congress, 2008). It was established by an act of Congress in 1800 and while open to the public, the LOC continues to serve the U.S. Congress in a research capacity (Library of Congress, n.d.). Among the first items acquired were cartographic resources, and by 1897 the collection had 47,000 maps and 1200 atlases (Library of Congress, 2011). Today, the Geography and Map (G&M) Division of the LOC has the largest cartographic library collection in the world, with over 5.5 million maps, 80,000 atlases, 38,000 CDs/DVDs, 6000 reference works, 3000 raised relief models, 500 globes, and more (Library of Congress, 2016). The majority of these resources are located in closed library stacks, but examples of the map collection are illustrated online if copyright has expired or the resources were in the public domain such as the atlas displayed in Fig. 7.23.
Some library staff and patrons may remember using map data provided by the National Atlas in the past. The Atlas integrated data from multiple federal agencies, but it has been retired as of September 2014 (U.S. Geological Survey, 2015d). The 1997–2014 edition can be downloaded via Data.gov. Current small-scale map data and web services can still be accessed via The National Map. These data include both raster and vector GIS layers in multiple formats. For more information, see the section detailing The National Map, later in the chapter.
In 1992, the National Geologic Mapping Act was passed in the United States, which mandated the National Cooperative Geologic Mapping Program, or NCGMP (U.S. Geological Survey, 2016c). This program is still active today and involves partnerships between the USGS and the Association of American State Geologists, with the aim of creating standardized digital geologic maps for the United States (U.S. Geological Survey, n.d.b). One important part of the NCGMP is the creation of guidelines for standardized geologic map symbology. As discussed in Chapter 2, current geologic maps employ a variety of colors and symbologies to represent geologic features. While geologic features do not end at administrative boundaries, the way they are symbolized may vary from one state to the next, or even from county to county on currently existing maps. These standards will eventually lead to a consistent symbology for the entire United States, making it easier to work with geologic maps. The primary portal for accessing and downloading U.S. geologic maps is the USGS-hosted mapView. This tool, seen in Fig. 7.24, uses an intuitive, interactive map interface to find more than 90,000 geologic maps from the past 200 years (Data.gov, 2015). This system is relatively new, with mapView going live in late 2012 and undergoing upgrades since then, improving the interface and technology to be more accessible for users (U.S. Geological Survey, 2012). Once a user has selected a desired map, extra information pops up in a new browser tab or window, including an interactive preview and options for download. Maps can be downloaded in multiple formats depending on the user's needs, see Fig. 7.25.
Much like the GeoMAPP program, the NGDA was a project focused on preserving and archiving geospatial data partnered with the Library of Congress' National Digital Information Infrastructure and Preservation Program (University of California, Santa Barbara, 2009). The project also involved groups at Stanford University, University of California Santa Barbara, University of Tennessee Knoxville, and Vanderbilt University. Unlike the GeoMAPP program, which focused on generating plans for preservation of historic geospatial data, the NGDA project created a tool for accessing said data. The Globetrotter geospatial data search tool provides access to data based on spatial location, the date of publication, and the digital format of the data. Globetrotter is housed and accessible via the UCSB's Alexandria Digital Library, specifically the Map & Imagery Laboratory (University of California, Santa Barbara Library, 2010). At the time of writing, Globetrotter is undergoing a move and is not currently available, but should return.
The National Map (TNM) is the primary U.S. resource for geographic information that describes the United States (U.S. Geological Survey, 2013). TNM products and geospatial data are used in a number of industries, research, and recreational capacities. TNM is responsible for the creation of the current US Topo series of maps and data, as well as providing the Historic Topographic Map Collection, but it also houses quite a few other products as well, all freely available in multiple formats (U.S. Geological Survey, 2016d). The National Land Cover Database (NLCD) is a Landsat-based land-cover dataset that covers the entire nation. These data are used for a variety of environmental and planning applications across the country. Elevation data are provided in raster format through the National Elevation Dataset (NED), including layers at multiple resolutions, and the 3D Elevation Program (3DEP) is currently improving and updating the nature of the elevation data that are available. The 3DEP is a USGS partnership with multiple federal, state, and tribal agencies concerned with generating a high-resolution LIDAR (LIght Detection And Ranging) dataset for the country. LIDAR elevation data are significantly of higher resolution than the older data in the NED, to the point that now objects as small as individual trees and automobiles can often be distinguished in the data. This level of resolution can provide a significant advantage in terms of modeling and analysis. Currently, the 3DEP program is ongoing, collecting data one segment of the United States at a time.
The National Map also houses water-related data: The National Hydrography Dataset (NHD) and the Watershed Boundary Dataset (WBD). Both datasets store information as vector data. The NHD includes streams and lakes at the 1:24,000 and 1:100,000 scales. Some areas even have supplemental data at a scale larger than 1:24,000 (U.S. Geological Survey, 2014). The WBD represents watersheds in the United States at multiple scales with the country being divided and subdivided by Hydrologic Unit Codes (HUC). The number of digits in a HUC defines the scale of the hydrologic unit, with two-digit codes representing the largest watersheds, and twelve-digit codes the smallest. It is common to refer to this watershed data as HUC two or HUC eight as a way of describing the spatial scale involved. Fig. 7.26 shows how these different scales of watershed data are nested within each other.
The National Map also houses orthoimagery. This is aerial photography that has been orthorectified to remove the distortions inherent to camera angle and lens distortion, see Chapter 4 for more discussion on this type of imagery. All the imagery for the United States has at least a 1-m spatial resolution, but many urban areas have a higher resolution of two feet or less. Data may also be found through TNM on transportation features like roads, airports, railroads, etc.; structures such as human-built facilities, inclusion largely based on the needs of disaster planning; and boundaries including administrative units such as states, counties, Native American lands, etc. All of the various thematic data mentioned is available to download through The National Map Viewer. Both map products and GIS data are available to browse using the viewer's interactive map interface. Fig. 7.27 shows an example of 2011 NLCD data being previewed for the Kansas City region. The viewer allows users to preview the data on the right and easily select from the various datasets with the menus on the left.
The first true GIS implementation was created in Canada in the 1960s by Roger Tomlinson, who is credited as the father of GIS (University Consortium for Geographic Information Science, 2015). It is only natural then that the Canadian government would have publicly available geospatial data hosted online. The current collection combines what used to be three separate data sources, GeoPub, Mirage, and GeoGratis (Natural Resources Canada, 2015). Together, these data include satellite imagery, scanned topographic maps, Geologic Survey of Canada (GSC) maps, vector files representing a variety of thematic content, and written publications from the GSC and the Canada Centre for Remote Sensing. The search functionality is straightforward, allowing users to search via text by spatial location, subject keywords, and product types. The advanced search also allows users to define a spatial bounding box in lat/long, and use an embedded map to define the location of interest, see Fig. 7.28. Geospatial data are available for download in multiple formats, and can be freely used under the Open Government License for Canada (Government of Canada, 2015).
Within the boundaries of the former Soviet Union, cartography was a sensitive subject. Access to accurate maps was a tightly controlled commodity limited largely to the military and Soviet planners. The maps available to the general public were of a low spatial accuracy with inconsistencies and mistakes intentionally added as both a method of information control and a way to prevent accurate spatial data from falling into enemy hands (Miller, 2015). However, the maps produced by the state for military and planning uses were highly accurate and covered virtually the entire globe, a larger reach than any other national mapping initiative at the time or since. The quality was so high that maps they produced are often still the best available source of spatial information in some parts of the world (East View Geospatial, 2015).
After the Soviet Union collapsed into its constituent nation-states, many of these maps found their way onto the market and are available for purchase from resellers. While these maps have not been updated since the late 1980s at best, they remain highly accurate views of the world at that time. They may be desirable as historical documents, present-day references for some areas, particularly developing nations, or as curios of the Cold War. Some library collections house physical copies of Soviet maps, such as the University of Georgia Libraries' Map and Government Information Library, which holds Soviet maps covering most of Africa, Asia, the Middle East, and the former Soviet Union (University of Georgia Libraries, 2015). Companies may be found online that sell Soviet topographic maps as paper copies or in digital format as raster or vector files. A good list of sources for Soviet topo maps, including websites where digital copies can be downloaded freely, is available at the website of John Davies, who has studied the Soviet mapping program and the map products they created for more than two decades (Davies, n.d.).
While we have seen that the USGS hosts an enormous amount of geoscience data for the U.S. federal government, it is not the only federal agency that serves important geospatial information. The U.S. Department of Agriculture's Natural Resources Conservation Service (USDA NRCS) hosts data as well, perhaps most importantly their soil data collections. The SSURGO and STATSGO2 soil databases provide generalized soil information for the United States along with territories, islands, and commonwealths associated with the NRCS (USDA Natural Resources Conservation Service, n.d.a). STATSGO2 maps soils at a smaller scale, with the continental United States being represented at 1:250,000 scale, and is designed primarily for broader-planning use (USDA Natural Resources Conservation Service, n.d.b). SSURGO works at a larger scale, with data presented at 1:12,000 to 1:63,360 scales and is better suited for detailed local soil information (USDA Natural Resources Conservation Service, n.d.a).
The two ways in which data can be downloaded from the NRCS are the Geospatial Data Gateway and the Web Soil Survey (USDA Natural Resources Conservation Service, n.d.c; USDA Natural Resources Conservation Service, n.d.d). The Geospatial Data Gateway has a broader range of data, including layers that are available from other sources, like Census TIGER data. The interface lets users search data by region through a few different methods. The default search type is to select a state, then select any or all of the counties within the state. Other search methods involve selecting entire states at once, individual places, setting a lat/long bounding box, or using an interactive map interface to choose a location. Once the place selection has been made, a list of data sources can be checked on or off to indicate which layers the user wants. These layers include TIGER data, precipitation data in both vector and raster formats, air temperature data, NRCS conservation easement information, NED elevation rasters, geographic place names, surface geology, administrative boundaries, NHD hydrography data, hydrologic units, NLCD land-cover data, topo map indices, orthographic imagery from the National Agricultural Imagery Program, soil data, digital raster graphics (DRGs) of topo maps, and TIGER transportation data (USDA Natural Resources Conservation Service, n.d.c). After selecting the desired data layers, any existing options regarding data formats are presented to the user, then a choice of delivery format. Data can be provided in physical form on CD-ROM or DVD-ROM at a price, or the data can be downloaded for free. Regardless of the delivery format selected, the user must then enter contact info; for digital deliveries, an FTP link is sent to the email address provided by the user.
The Web Soil Survey (WSS) has a narrower focus on soil information and it uses a different search interface. In some ways the WSS search is more powerful, as it allows the user to specify more precise AOI. Rather than providing premade layers that overlap with that AOI, the data provided match the exact boundaries of the user-defined AOI, even if the boundary is an irregular polygon, see Figs. 7.29 and 7.30. This allows users to specify precise AOIs without having to deal with extraneous data that they might not find useful. GIS data for SSURGO information can be downloaded based on the defined AOI, and comes in Esri shapefile format, see Fig. 7.30. Since STATSGO2 data is recorded at a smaller scale, it is not defined by user AOI, but can be downloaded for individual U.S. states.
The WSS interface also includes an Intro to Soils section under the Soil Data Explorer tab which provides scientific information about soils and many other topics related to soils. Descriptions of terms used in relation to cropland, forested land, pasture and hay land, and other land-cover types are included in this section as well. For any user who might not already be a soil expert, this assistance provides valuable context to the information represented in the data.
Many options are available when it comes to geospatial resources, including software, data, and related information. Also, it is important to be familiar with any legal restrictions associated with geospatial content. While this chapter does not attempt to be an exhaustive source of information, some of the major providers of data and the means to explore it have been described. While the United States has many deep sources of geospatial information, including some global in scale, most other countries also collect and share data as well. Likewise, many agencies, institutions, and libraries at levels below national governments have resources of their own. These descriptions are a starting point for helping staff and patrons reach sources outside the library that may be necessary to fulfill research needs.
Information on how to satisfy client-to-librarian and librarian-to-librarian reference transactions is the focus of this chapter. Location factors that effectively hide collections and reference services from library users are noted. Core competencies and duties of reference librarianship are given, along with some typical reference question examples. Current reference guides are highlighted. When puzzled, the reference librarian has an organized group of professionals to ask for help and advice. This online map librarian-to-librarian support system is detailed to boost confidence levels for all reference desk librarians. Finally, map and geospatial data citations and reference styles are contrasted to provide clarity on issues of attribution and plagiarism.
Reference transactions; Core competencies; Resource guides; Professional organizations; Social media; Plagiarism; Citation; Referencing; GIS; Geospatial data services
“Where can I find…,” is a typical opening for clients approaching any reference-desk librarian. Whether the desk is physically located in the map library or an online, e-map reference desk makes no difference. However, when map-related questions are asked, many reference-desk librarians may have a higher confidence level locating an atlas or a journal than searching for maps, geospatial data, aerial photographs, and other nonbook formats. As stated earlier, it is unlikely that librarians had any more than one course related to science reference and resource services in their library degree program; it is likely that librarians have undergraduate backgrounds in the humanities or social sciences, not the natural sciences. Therefore, this chapter applies basic reference-desk knowledge, skills, and abilities to map and geospatial data resources.
A wise professor once started class with the adage: you never get a second chance to make the first impression. This may be true for locations of map collections and reference-desk librarians, in both physical and electronic environments. Librarians on the reference desk need to be approachable, interested listeners, who search and follow up with resource results when library users request help. Unfortunately, there are many ways to effectively hide map collections and reference librarians, physically and electronically. As one example, students in a map librarianship course were assigned to investigate regular and Federal Depository Map Library collections. Libraries that serve as depositories of federal publications including maps and spatial data must make collections accessible to the public, but student reports on reference librarian and map collection encounters had mixed first impressions. Their stories follow.
Some students had positive experiences and located prominent collections online, followed by physical visits where they found the circulation desk for maps, photocopiers, librarian offices, classrooms, study rooms, as well as workstations with access to many online databases and map indexes. One student found an impressive map collection, nicely illustrated and organized online with several contact methods to reach the reference librarian. This student decided to visit the same library in person to view Federal Depository maps. Upon arriving, the student quickly found the historic map collection he had viewed online. After browsing, he asked the reference librarian which of the cabinets housed the Federal Depository maps. He was directed to a quiet room, several floors down, in the basement. Given the weight of stacking maps in map storage cases, it is understandable that map collections are often placed in basements. Yet the large room filled with numerous storage cases had little heating, poor lighting, and no staff. He was amazed by celebrated and forgotten map resources, and the contrast in locations and services.
Another student visited a different library online to find there was a dedicated “map room.” Upon the physical visit she found the map room but was frustrated by the lack of librarians in the area. Eventually she found a helpful reference librarian, but suggested that if they would move the reference desk out of the corner of the room and into a prominent position, it would be easier for patrons to find.
One student chose a public library and described her visit looking for a specific map. While the reference librarian was easy to find, she summarized the overall experience that “…the maps are like rags that are flung to the far corners of this library.” This student asked to check-out a USGS California map showing the northern coastline. She was led down two long hallways, to a few map cabinets behind shelving carts. With no success, the librarian talked with a clerk and neither staff knew exactly where USGS maps were kept, nor if maps were available for check-out. They retraced steps to the opposite side of the library and noncirculating atlases and gazetteers. Finally, they stumbled upon the Federal Depository map collection and a California drawer of topographic maps; however, there was no state index map to be found, and maps were arranged in alphabetical order by title. The librarian went to the catalog, but not knowing appropriate map titles made a search difficult; the librarian finally determined the maps must not be in the catalog. The student could only speculate, but concluded the map collection was rarely, if ever used.
Some students found maps in the main library catalogs but found that specific resource searches could be unsuccessful because of terminology problems. This was demonstrated with an assignment where students were tasked with stepping into the boots of a geologist. They were asked to find a map showing where in the state of Colorado dikes could be found. Geologically, dikes are specific features formed by molten rock infilling cracks; on the surface, a dike forms a long narrow ridge. They often appear as red lines on geologic maps, but these features are not as easy to find on other types of maps. So students were provided with the feature name of a dike formation, one known locally as the Devil’s Stair Steps, all located in an area referred to by prominent mountains, the Spanish Peaks, see Fig. 8.1. This search involved geography resources from atlas to gazetteer.
Students quickly found that a term a professional geologist uses may not be the term a nongeologist librarian knows. In the Getty Thesaurus of Geographic Names (TGN), a search could be made by a name and place type. In the Geographic Names Information System (GNIS), options were to search domestic name, where feature name and feature class could be chosen from a dropdown box. At an online commercial gazetteer website, the search category was “physical feature.” Students discovered that search results varied with using “Devil’s” or “devils” and “stair steps” or “stairsteps.” They found the term “dike” was not always an option in dropdown boxes and had to choose “ridge” or “sandstone spines” even though dikes are not sandstone. Once the feature was found, GNIS provided links to online map types varying from topographic to satellite images. The TGN produced a hierarchical description where the location was listed as World (facet), North and Central America (continent), the United States (nation), Colorado (state), Huerfano (county), and Devils Stairsteps (ridge). The online gazetteer did not give map links but did give a resource as the 1994 U.S. Department of the Interior, USGS, GNIS, Digital Gazetteer, Reston, VA.
Using TGN, another step in the search would be required to actually find the map. Some searching online using “devils stairsteps” produced links to great ground pictures, but no location maps. Some maps located Spanish Peaks but did not mention dikes. The implications for librarians are to have the client explain alternative words for a feature, and to know which types of gazetteers and maps might yield the best results for specific requests.
Finally, one student highlighted another location issue. According to the library catalog, there was a map library at the university; but upon arriving at the third floor map library location, she found books and no maps. It took two visits and a telephone call to find out where the maps had been moved. A special collection of water archives containing historic maps, spatial data, and aerial photos were located in the library, fourth floor, and reference books such as atlas, gazetteer, and almanac stayed in the reference area on the ground floor. The topographic maps from the Federal Depository collection had been moved to another building that housed the geoscience departments. If the reference librarian was handling a specific map request, then deciding where to send the client was a challenge. Also, the offsite maps in the geoscience department did not have an on-site librarian. It is easy to understand how map theft could occur in libraries and might be unnoticed for months or years (Dempsey, 2012; Map History, 2016).
Although these student activities were first assigned several years ago and catalog searching techniques have improved, map resources and reference librarians remain hidden in basements with poor signage and resource organization. Inadequate staffing, missing index maps, catalogs without map entries, terminology differences, and physically outsourced and divided collections among various buildings are challenges for patrons in public and academic libraries. While some student experiences were good, others came away with an overall negative first impression of map collections and reference librarians.
Larsgaard (1998) recognized that facilitating a reference exchange is easier if the librarian is familiar with spatial data and patterns of issuance as well as if the spatial data possessed by the main library is located in one place. It also helps greatly if the materials are classified and cataloged in the main library’s online catalog system (p. 272). Adding map collections into library catalogs has been a relatively recent occurrence that is due to larger institutions cataloging their collections. This allowed other institutions to benefit by copy cataloging. Larsgaard argued that “cataloging is the basis of all reference work, and, once done, substantially increases usage of the materials” because people know maps exist (p. 272).
Reference has several meanings, such as a word or phrase pointing to an original source that was used as a quote or paraphrase. This meaning is synonymous with citation. Also, reference may take the form of written or oral support for another person's qualifications for employment. In a sense, the reference librarian does both. They point clients to sources of information or data through a structured conversation and in doing so, support the qualifications of that resource. A reference-desk encounter is also known as the reference interview. However, in light of both physical and electronic encounters and the fact that clarifying the exact information need of a client is an iterative process, conducting the reference interview is more descriptively referred to as a transaction.
The reference transaction is defined as “information consultations in which library staff recommend, interpret, evaluate, and/or use information resources to help others to meet particular information needs” (Reference and User Services Association, 1996–2016). Specifically, reference work includes interactions with clients to satisfy inquiries; it involves resource creation, management, and assessment. Creation and management is defined as “the development and maintenance of research collections, research guides, catalogs, databases, web sites, search engines, etc., that patrons could use independently, in-house or remotely, to satisfy their information needs”; assessment is the “measurement and evaluation of reference work, resources, and services” (Reference and User Services Association, 1996–2016).
While the reference transaction does not include a formal instruction session, it may include point-of-use instruction. For example, if a topographic map quadrangle title is unknown, then the index map is needed to determine the map title, allowing the client to effectively search for the needed map sheet. Although reference transactions are separate from formal instruction, Bishop, Grubesic, and Prasertong (2013) made the point that “…most instruction in library and archives relates to teaching users the information literacy skills to answer their own future reference questions” (p. 307).
In determining how to provide reference services in her newly created Geospatial Data Services Librarian position, Dodsworth recognized that reference and instruction were inseparable. “The traditional map librarian doesn’t teach how to use a map to the same extent as the geographic information system (GIS) librarian teaches about GIS data and technology” (Dodsworth, 2007). For example, before providing reference services such as promoting the vast array of the library’s digital data, Dodsworth gave live demonstrations of datasets in interesting contexts such as plotting all coffee shops and 24-hour food services in proximity to the university campus. After demonstrating the visual display of information on the map, Dodsworth offered separate workshops on map creation using GIS software. Overall, the need for reference services increased greatly, using instruction to inform library users of the potential in reference materials and services.
Core competencies are a combination of knowledge, skills, and abilities that are expected to successfully accomplish map, geospatial, and catalog/metadata librarianship. An education committee within ALA’s Map and Geospatial Information Round Table (MAGIRT) defined a set of core competencies (Weimer, Andrew, & Hughes, 2008). One of the broad areas is reference and instruction. Some of the main core competencies include the ability to effectively communicate and creatively teach courses and design tutorials. Other competencies include skill in conducting an effective reference interview, navigating creation and distribution systems for geospatial print and digital data resources, and performing basic geo-processing activities. Finally, competencies involve knowledge for using and creating reference tools and finding aids, defining geographic and cartographic principles, and applying GIS. Bishop et al. (2013) further refined this list to apply to course work, see Appendix B.
Obviously one of the best ways to acquire knowledge and skills is by taking courses, and academic opportunities were introduced in Chapter 6. Two older, but classic, must-read books are by Larsgaard (1998) and Abresch, Hanson, Heron, and Reehling (2008) to provide the foundation for reference and other core competencies. Finally, professional development organizations and their journals, courses, support, and workshops also prepare librarians for reference competencies. These opportunities are discussed later, but types of questions and the creation of resource guides are detailed first.
A library user approaches, physically or electronically, and poses a need or question. An enthusiastic student related one of her first reference encounters where the patron asked for a map showing the Washington and Oregon areas. After quickly searching the library catalog for “pacific west coast,” a map came up with detailed ecological data, which she then retrieved for the patron. This was not what the person wanted, and several questions later, it was determined a simple atlas satisfied the need. She learned it is the task of the reference librarian to first never make assumptions, but rather guide the conversation to gather enough background to clarify the request. Once the nature of the question or request is established, then one may determine what type of map resource is needed, print or digital, historic or modern, atlas or gazetteer, thematic or topographic. To clarify needs, reference librarians must phrase questions that cannot be answered with yes or no, and remember if the person knew what type of map was needed and where it was located, the conversation would not be happening. Following through with a reference transaction is important and if the student on the reference desk had sent the patron for the map, she would likely never have known it was not what the patron wanted.
Adopting a user-centered focus is best for reference work, but be prepared as this means applying a proactive rather than reactive approach in assessing needs. In addition to logging the client’s need, each encounter is a spatial data opportunity for communicating information and sharing library resources. Larsgaard (1998) highlighted the main points leading up to a reference transaction as: (a) the client has a question or spatial data need that he or she cannot articulate; (b) the client is anxious and doubts the abilities of the map librarian to understand; (c) clients and coworkers do not want to admit ignorance, but if the inquiry is articulated, then the reference librarian must go through the basic skill-set: “approachability, interest, listening and inquiring, searching, and follow up” (p. 270). If the user’s request involves maps, then specific details must be gathered on geographic area, subject of interest, map type, map scale, and application. Finally, access the appropriate database or catalog, move to map drawers or a gazetteer/atlas to locate the resource; if the transaction is a remote reference, suggest a website data portal. Larsgaard reiterated that a reference transaction is an opportunity to not only answer the question, but to use this time to market the library’s other geospatial resource collections, so clients realize what is available to help them in the future (p. 270, 271).
Most geographic questions relate to location or theme because maps describe place and have purpose. Likewise, Musser (2006) wrote that geoscience questions are place-based or topical. Simple topical questions include earthquakes, volcanoes, and dinosaurs; these may be answered using government websites such as the USGS Earthquake Hazards Program (U.S. Geological Survey, 2016a), the USGS Volcano Hazards Program (U.S. Geological Survey, 2016b), and a Natural History Museum such as the Dino Dictionary from the London museum (Natural History Museum, n.d.).
As mentioned earlier, specific place-based features may be more challenging. Also, standard resources such as ProQuest and the online catalog would locate library-specific resources. Place-based questions need clarification such as describing location by the nearest geographic feature, or as is the case with topographic quadrangle maps, it is the title or name that appears on the map that is critical to know. Tools for determining place names include gazetteer databases such as GNIS with physical and cultural geographic features, GEOnet Names Server (GNS) with U.S. geographic feature names, and TGN with place names.
For remote reference questions, the greater online library catalog such as WorldCat.org is a good place to search for place-based geoscience information. Assigning a subject, a heading in the form of Geology—[place], may produce results; if needed, add keyword = maps. At WorldCat.org, when the client clicks on the source, a listing of nearby libraries is displayed where the map or data resource may be retrieved if the client is unable to visit your library. In the geosciences, older resources are often used for change-over-time studies, and Musser suggested that an edition of the Guide to USGS Geologic and Hydrologic Maps, last updated in 1994, is a potentially useful source to recommend because of the extensive historic map listings. Musser gave another example for earth science questions and knowing if the resource is in a series; The 1980 Eruptions of Mount St. Helens, Washington, is a USGS Professional Paper series, no.1250. In the past, catalogers might have added it as a monograph rather than series, which would be problematic for locating because it would appear as U.S. Geological Survey Professional Papers, no.1 and not result in finding the resource (Musser, 2006).
Below are some free bibliographic resources Musser also recommended to answer frequent types of questions:
• National Geologic Map Database (http://ngmdb.usgs.gov/)—the database is an index of U.S. geologic map locations with links to map catalog, stratigraphy, mapView, and topoView.
• Geolex (http://ngmdb.usgs.gov/Geolex/search/)—this search engine is specific for geologic unit names and descriptions in the U.S.
• Geologic Guidebooks of North America database (http://guide.georef.org/dbtw-wpd/qbeguide.htm)—geologic field trips are often not published by conventional publishing companies, but are sources of detailed local geology information.
• Bibliography on Cold Regions Science and Technology and Antarctic Bibliography (http://www.coldregions.org)—although not recently updated, they are good sources of historic geologic and engineering information for high altitude and latitude environments.
Less-geology-focused reference questions are sometimes more complicated and challenging such as: where can I go to illustrate the history of urban development? Documenting this history could be locating a progression of historic to modern maps showing changes in basic urban infrastructure. Also, urban development could be documented by purpose such as a selection of thematic maps showing natural landscape, cultural, and demographic change over time. The reference librarian could direct the library user to the local print map collection as well as any digital ones that exist. Today, reference librarians may enhance their own print and historic maps by sending the client on a journey through digital collections. With a digital route, layering the results using GIS would result in an interesting project as well. However, this is likely not the typical reference-desk question.
Some library clients prefer an alternative to asking a reference librarian for help via the perceived “more approachable” reference guide, whether print or online. The reference or resource guide may be specific enough to highlight a collection, both the unique and ordinary, and to inform viewers on the extent of resources available external to the library. The guide might link to tutorials and much more.
Map and geospatial librarians have been creating reference and resource guides online for more than a decade and in print, even longer. Reference guides have been known by many names such as bibliographies, pathfinders, information portals, webliographies, Tracer Bullets, as well as an array of “guides” prefaced with research, resource, study, subject, topic, and more recently wiki and LibGuides (Springshare, 2007–2013).
Whereas the bibliography is a list of books by a specific author or for subject, the webliography is somewhat the digital equivalent with URLs and hypertext links to connect the viewer directly to online resources. If interested in this design format, guidelines are available for creating subject- or topic-focused webliographies to submit to an online journal publication. These guidelines could be modeled whether or not the guide is submitted for publication (Issues in Science & Technology Librarianship, 2016). Several examples of notable subject-specific webliographies for maps (Zellmer, 2011) and geospatial data (Dietz, 2010) are online.
Pathfinders are defined as a subject bibliography that leads the user through a research process via primary and secondary sources; they are often created to be library-specific, printed or online (Reitz, 2004–2014). Over the years, some researchers and librarians studied the format for delivery, while others recommended how to create guides. Morris and Bosque (2010) provided a good review of changing formats for subject guides including pathfinders in print to guides using Web 2.0 technologies at large academic libraries.
Science Tracer-Bullets Online has a similar definition as research guides with brief introductions to the topic and lists of resources and strategies for helping the researcher stay on target (Library of Congress, 2016b). An interesting Science Tracer Bullet (05-1) is on remote sensing, and although hyperlinks are no longer actively updated, it does provide an extensive listing of print resources that still exist (Library of Congress, 2011).
There are several resources to create LibGuides. Dobbs, Sittler, and Cook (2013) provided tips and skills to use the LibGuide template to organize web pages and create the customized guide. These authors showcased 28 LibGuides with good design features. Dougherty (2013) also had an informative research article that identified important components for the homepage such as the school or agency, author, job title, guide title, latest information update, and statement of purpose as well as navigating instructions for using multiple organizing tabs. Dougherty’s findings showed that map and GIS resource guides created for small undergraduate universities featured more resources and links than larger universities with graduate programs in GIS. Convenience is a prime reason for the use of reference guides over reference encounters. Embedding library subject guides directly into online course learning content management systems shows promise for increasing the use of guides by students.
Finding digital and print geospatial data is a treasure hunt and involves a bit of detective work by librarians. For example, it is nearly impossible to record and catalog individual entries for each map included in each atlas or maps as folded inserts in books. However, after leaving the familiar catalog and local collection, a plethora of choices exist online at education, government agency, nongovernmental organization, and commercial websites, some of which are described in Chapter 7. Listed earlier in this chapter were a few gazetteer websites, but the Library of Congress (2016a) provides a thorough Reference Web Resources page. Another avenue is a commercial website, My Atlas and Maps at refdesk.com (2016). Both of these may help librarians find relevant data quickly. These websites are all helpful, but may seem overwhelming at first, so heed the warning from Larsgaard (1998) that “care must be taken not to swamp the user with far more information than was ever needed; the level of interest, two-page paper or 300-page dissertation should be pinned down during the initial reference interview” (p. 272).
An additional problem in finding spatial data is not finding spatial data. Although the search and recover operation may have paid off, Leeuwenburg (1982) provided several reasons why a resource needed may not be found: “item checked out; item stolen; item misfiled; item doesn’t exist; item never possessed by library; or librarian can’t find item” (p. 10, 11). While that was written some time ago, several of the possibilities remain current. Unfortunately, map theft is an ongoing concern with map collections, especially given the ease of selling maps online. Also, few libraries have ever included print maps for interlibrary loan due to the fragile status of paper maps, awkward sizes, and weight of some resources. However, this is less likely a problem today with the advent of map libraries scanning rare and historic map collections and placing digital versions online.
Landsat imagery datasets in the past were quite expensive, required appropriate software, larger computer server space (for that time) and were rarely, if ever, shared; again, these are minor or nonexistent problems today. Finally, Larsgaard (1998) provided some of the best advice when she stated that “the most powerful tool the librarian has to answer the tough question is the address (or if you prefer, the coordinates) of other map librarians” (p. 273).
What happens when the reference-desk librarian is puzzled by a request? Help from the physical or electronic location of the geospatial resource-reference-savvy colleagues may impact the length of time needed to answer questions and fill requests. Having nearby colleagues is ideal; yet, the next best solution is to belong to a strong electronic network of knowledgeable colleagues through map librarian-to-librarian professional support groups.
Just as the map may have simplified the layout of roads in Los Angeles at the turn of the 20th century, see Fig. 8.2, a network of supporting professionals should help to enhance and refine map reference librarianship knowledge, skills, and abilities. A map librarian-to-librarian network is facilitated by social media with both one-to-many communication such as listservs and Facebook or one-to-one including email, phone, or instant messaging-chat communications. Posing a question to the entire subscribing membership of a listserv creates a powerful reference advantage utilizing collective wisdom and locations for hard-to-find data or maps. Also, reviewing archives of listservs creates the potential for proactive solutions for future questions and concerns. Joining and contributing to professional organizations provide access to expert support through newsletters, journals, conferences, and more.
The purpose of professional organizations is to support member professionals and students with helpful services such as professional development, job announcements, scholarships, and conferences along with mentoring, networking, and communicating via social media. Students may benefit greatly by interacting with the professions in the field and could join most groups at an affordable level of dues.
What follows is not a complete listing of all networking opportunities among the many state and regional professional library support groups, but it highlights the larger national and regional organizations specific to maps and geospatial data sources. The first example is part of Special Libraries Association (SLA), a nonprofit group organized in 1909 by John Dana (Special Libraries Association, 2016). The first published article devoted to map librarianship, Training for Map Librarianship, was in the SLA journal, Special Libraries (Woods, 1952). In the same journal, Courses in Map Librarianship was published (Kiraldi, 1970).
Geography and Maps (G&M) has the longest history of any map library professional organization. G&M was a SLA Division from 1941 through 2003, at which time the G&M membership group became a part of the Social Sciences Division. Today, the G&M section “includes the professions of geography and map librarianship, as well as GISs, and the acquisition and utilization of geographic and cartographic materials” (Special Libraries Association, 2011). SLA had a listserv and wiki, which are archived but were replaced in Aug. 2016 with SLA Connect.
The organization’s journal Special Libraries was published from 1910 to 1996 with 87 volumes (San José State University, n.d.). The journal emphasized cataloging and indexing, organization activities, articles, and book reviews. G&M had a printed events newsletter, The Bulletin, from 1947 until 1997 and newer issues are online from 2003 to 2009. As an example of past continuing education, the 2006 Bulletin advertised a course for G&M members, “GIS for the special librarian: A hands-on introduction to mapping with ArcGIS.”
The Geoscience Information Society (GSIS) was formed Mar. 3, 1966 and represents all aspects of the geosciences, including maps, geospatial data, and software for remote-sensing interpretation and mapping. Specifically, GSIS “…facilitates the exchange of information in the geosciences through cooperation among scientists, librarians, editors, cartographers, educators, and information professionals” (Geoscience Information Society, n.d.a). GSIS is a member society of the American Geosciences Institute (AGI) and is an associated society of the Geological Society of America (GSA), the main professional organization for geoscientists.
Annual meetings are a time to interact with and hear the newest research from professionals. The GSIS annual meeting is held at the same time and venue as the GSA annual meeting. GSIS is given a dedicated session open to all attending the GSA meeting with technical papers, poster session, exhibits booth, business and social meetings, and a field trip. In addition, there is a workshop for library students and professionals divided into instruction, reference (Winkler-Hamalainen, 2015), collection development, and resources (Geoscience Information Society, n.d.b). GSIS communicates through publications and listserv. Publications include the member webpage, listserv, newsletter, conference proceedings with subject index (Geoscience Information Society, n.d.c).
The Western Association of Map Librarians (WAML) was formed in 1967 as an independent group of map librarians with a purpose “to encourage high standards in every phase of the organization and administration of map libraries” (Brendle-Moczuk, 2015). There is an annual meeting and online index of past meetings since 1970. The 2016 annual meeting was held in the David Rumsey Map Center, Stanford University Library.
The organization’s journal, Information Bulletin, has articles and resource reviews. Available online is a 45-volume index from 1969 to 2014. The webpage links to principal Western Region Map collections (Western Association of Map Librarians, 2015). There is a 20-year archive for News & Notes, noteworthy reports from 1994 to 2014 and many useful links to resources at the WAML Toolbox (Brendle-Moczuk & Zellmer, 2015).
The Association of Canadian Map Libraries and Archives (ACMLA) was founded in 1967 to represent map librarians and cartographic archivists through a “…vigorous publishing program, development of professional standards and international cataloguing rules, and efforts to increase national awareness of issues concerning spatial information and recognition of the contribution of map libraries and cartographic archives” (Association of Canadian Map Libraries and Archives, 2013). As in the United States, the ACMLA preceded academic course work as “…the first course in map librarianship was taught in the summer of 1970 by Joan Winearls at the School of Library Science, University of Toronto” (Association of Canadian Map Libraries and Archives, 2013).
A publication was first issued in 1968 and since 1988, the group maintains the scholarly journal, ACMLA Bulletin (ACMLA Bulletin, 2016). Online resources include free Canadian geospatial data and the ACMLA cartographic citation guide (Wood, 2012), a comprehensive guide to citing map and geospatial resources based on principles of the ACMLA Bibliographic Control Committee and Kollen, Shawa, and Larsgaard (2010). Links to information can be found at the ACMLA website including Historic Maps, Meeting Minutes, Monographs, and a section titled Useful Tools that has a variety of resources.
ALA came into existence in 1876 and MAGIRT in 1979, officially recognized as a group by ALA in 1980 (Weimer, 2011). MAGIRT has many informative open-access, full-text documents online. One of the earliest publications is the Meridian (1989–1999); it was a joint effort by MAGIRT and WAML and published articles on history of cartography, GIS, and map librarianship. All Meridian issues are online. Though short-lived, Coordinates (2005–2011) was an online serial with quality peer-reviewed articles and essays (Allen, 2005). MAGIRT has a regular newsletter, base line (1980–present), a venue for meeting minutes, liaison reports, map reviews, and Great Moments in Map Librarianship, which is a cartoon drawn by member Jim Combs.
Both the listerv discussion group and Twitter have archived postings available. Finally, members are on ALA Connect, a virtual, collaborative, workspace online, for communities of interest to interact via instant messaging, and there are extensive resource guides (MAGIRT, 2016). A detailed, comprehensive publication on how to reference maps, aerial photos, geospatial datasets, and more are in the Cartographic Citations: A Style Guide (Kollen et al., 2010).
The North American Cartographic Information Society (NACIS) was founded in 1980 for map librarians and geographers, academic and professional (North American Cartographic Information Society, n.d.a). The main objectives are to improve communication among producers to users and coordinate activities with other cartographic organizations. The society provides continuing education regarding acquisition, preservation, and retrieval efforts for cartographic resources.
There are student map competitions and awards as well as student or member travel grants. NACIS has a published journal, Cartographic Perspectives and an online archive (North American Cartographic Information Society, n.d.b). Cartotalk is an online discussion forum, and Natural Earth, a public-domain dataset at different scales, is available for download.
The International Federation of Library Associations and Institutions (IFLA) formed in Scotland, September 1927, and it provides the “global voice of the library and information profession” for some 140 countries and (IFLA, 2016). Within the IFLA, the Geography and Map Libraries started as a subsection of Special Libraries Division in 1969 and became a full working group by 1973. It was devoted to map librarianship with a focus on preparing guidelines and standard recommendations, organizing seminars, and training sessions such as one on map curatorship (Larsgaard, 1998, p. 299).
Although this was the second oldest professional society devoted to map librarianship, membership in the Geography and Map Libraries section of IFLA declined and the group disbanded by 2012 (Weimer, 2011). Several webpage portals from the 1990s are archived: Digital Map Librarianship, Copenhagen, 1997 (IFLA, 1997), and Digital Map Librarianship: A Working Syllabus (IFLA, 1998), Geography and Maps Library Section (IFLA, 1994–2009).
The Cartographic Users Advisory Council (CUAC) began in 1983, as a committee designed to act as collaborative network among two ALA round tables, MAGIRT and GODORT, and later with representation from GSIS, G&M of SLA, Northeast Map Organization (NEMO), and WAML. While CUAC was made up of representative members from professional groups, the mission was to work on behalf of all public, academic, and special library associations and map librarians in commercial employment.
CUAC formed to provide a “…unified effort to enhance the distribution and knowledge of the cartographic products of U.S. government agencies.... to improve public access to these materials… and to heighten agencies’ awareness of the value of their cartographic products to the public” (Newman, Koepp, & Zellmer, 2008). Each year, CUAC members hosted an annual meeting where invited government agency speakers presented updates on map and geospatial data projects and products. For example, some of the mapping agencies solicited included USGS, U.S. Department of Agriculture (USDA), National Oceanic and Atmospheric Administration (NOAA), and Environmental Protection Agency (EPA), among others. The Council encouraged speakers to include their published cartographic materials in the Federal Depository Library program, along with specific indexes and acquisition tools for ease of public use.
CUAC held its last annual meeting in 2013 and disbanded in 2014. The group’s archive was deposited in the University of Illinois, Urbana-Champaign Archives. Ironically, this is the same archive that curates documents of the first LIS map course taught at a university.
The Northeast Map Organization as founded in 1986 and dissolved in 2013, after 27 years of service. A webpage was maintained in 2016 with links to past NEMO journals (Bertuca, 2016) and extensive Map Catalogers Tool Box (Bertuca, 1999–2016).
In addition to connecting with resources and people in professional organizations, map librarianship journals and online discussion lists keep librarians up-to-date. The Journal of Map & Geography Libraries is a peer-reviewed publication, started in 2004, covering all aspects of traditional to e-map and e-geography librarianship. Research Gate (2008–2016) described the journal as publishing “international research and information on the production, procurement, processing, and utilization of geographic and cartographic materials.”
While map and geospatial professionals publish in a variety of LIS journals, another publication for GIS librarianship is Issues in Science & Technology Librarianship. This journal associated with the Science and Technology Section (STS) of the Association of College & Research Libraries (ACRL). A recent example of interest to reference librarians is Scarletto’s (2013) report on research involving GIS instruction; she found the most requested topical area for applying GIS was health, and a main concern for librarians was to identify which available datasets were georeferenced.
MAPS-L listserv is a discussion list for any librarian or professional who works with cartographic, geographic, and remote-sensing information (MAPS-L@LISTSERV.UGA.EDU, 2016). It is an avenue for offering discarded maps and posting job announcements as well as specific questions regarding a request for a rare map resource or RDA cataloging. It is one of the oldest listservs, popular among map and geospatial librarians and has open archives online from April 1993 to present (Archives of MAPS-L@LISTSERV.UGA.EDU, 2016). History of Cartography listserv existed from 1994 to 2012 at which time, no new members were accepted; the forum continued as MapHist News & Discussion until this was closed January 2015 (van der Krogt, 2011).
A final consideration for the reference librarian in this chapter is citing and referencing sources. Earlier, it was noted that in defining reference, one meaning was as a word or phrase pointing to an original source, which equates reference with citation. Therefore, a reference transaction is not complete until the librarian explains that visual information should be treated as textual information—it must be attributed, cited, and referenced. It is important for librarians to explain that the concepts of public domain and fair use simply mean formal permission to use the resource does not need to be requested from the author or cartographer in advance of using it. However, by not attributing or citing the source, the implication is that you created the work. Intentional or unintentional, taking credit for another person’s work is plagiarism.
A common reference-desk question is how to cite a source using a specific reference style. While librarians may not be experts on all styles, many libraries have subscriptions to citation tools such as RefWorks and copies of books of major citation styles at the reference desk (Lewis, 2008). Concepts such as fair use, copyright, public domain, and the Creative Commons were introduced in Chapter 7. Specifically, starting with Creative Commons 4.0 license agreements, the default setting makes attribution of source mandatory. Attribution is one way of recognizing the copyright holder of a work, but complete citing and referencing is also the best way to avoid plagiarism.
The common knowledge definition for plagiarism is using another person’s words or ideas without giving credit. This delineation infers plagiarism applies only to text-based publications and suggests it is an intentional act. Harris (2011) provided a better definition in that “plagiarism occurs when an information source is not properly credited” (p. 81). Harris (2011) suggested all external knowledge or information from outside your own head should be cited (p. 85). A list was provided for external knowledge source types: book, computer program code, data, drawing, graph, journal, photograph, survey, table of information, video, and website; in addition, a list of included formats were: print, digital, live, and audio-visual (Harris, 2011, p. 85). Maps, although not explicitly mentioned, are certainly included along with geospatial data as external knowledge sources.
The main reasons why one should cite external knowledge sources are to identify the original source of the citation, to honor the creator, and to avoid plagiarism (Harris, 2001, 2011). The main misconceptions to not citing sources are that the resource copyright has expired, or that the resource is fair use, in the public domain, or on the Web, where all information is common knowledge. To refute misconceptions, expired copyright, fair use, and public domain are not synonymous with common knowledge and the source needs to be cited. Again, fair-use status means written permission and royalty payments are no longer needed to use the resource (Harris, 2011, p. 88, 89). Finally, most information on the Web is not common knowledge. Some websites are misleading opinions, rather than fact, and regardless of content and format, the same fair-use, public-domain, and copyright rules apply and sources should be cited (p. 90).
Plagiarism is not new with the advent of the Web. Pliny the Elder wrote in his 1st century Historia Naturalis publication that “…in comparing various authors with one another, I have discovered that some of the gravest and latest writers have transcribed, word for word, from former works, without making acknowledgement” (as cited in Harris, 2001, p. 61). Librarians have little influence with human behavior and intentional plagiarism. However, one of the main, unintentional reasons why people do not cite and reference is ignorance (Harris, 2001, 2011). Ignorance of reference styles leads to mistaken, inconsistent, and incomplete citations and librarians excel at instruction on citing and referencing.
A written copyright policy should be available at every map library. The policy should clarify concisely: (a) what materials need permission to reproduce and use and what do not, (b) which forms are needed to request permission for use in commercial applications, and (c) how citations should appear. The University of Texas at Austin, Perry-Castañeda Library Map Collection, could be used as an example (The University of Texas at Austin, 2016b). A link for the Material Usage Statement is at the bottom of each webpage. The first paragraph in The University of Texas at Austin (2016a) Material Usage Statement affirms:
Materials that are in the public domain such as images from the Portrait Gallery or most of the maps in the PCL Map Collection are not copyrighted and no permission is needed to copy them. You may download them and use them as you wish. We appreciate you giving this site credit with the phrase: ‘Courtesy of the University of Texas Libraries, The University of Texas at Austin.’
The next section describes material where the University holds the copyright. Copyright material “may be quoted or reproduced for educational purposes without prior permission, provided appropriate credit is given” (The University of Texas at Austin, 2016a). The suggested credit after gaining permission is “Used by permission of the University of Texas Libraries, The University of Texas at Austin” (The University of Texas at Austin, 2016a). A link to a feedback form is provided, and the publisher permission form would be attached along with the request for permission to use. The last section is on materials where copyright is held by owners other than the university. It is suggested to visit the UT Austin policies for acceptable use and the Digital Millennium Copyright Act, for further explanation.
The Library of Congress (2015) provides legal information and states when possible “the Library of Congress provides factual information about copyright owners … as a publicly supported institution, we … do not own the rights to materials in our collections … and do not grant or deny permission to publish or otherwise distribute them.” Permission and fees could be required from the copyright holder, and this responsibility is placed on the user to determine.
Finally, for a public library perspective, review the information given at the New York Public Library (2013). The New York Public Library (NYPL) has a substantial Map Collection and as of 2013, had 17,000 digital images online (New York Public Library, 2016). As in the other map libraries, it states that the library does not hold the copyright to images. However, this does not mean the images are free to use. Also it states that when materials are used from their website, NYPL must be credited. Specifically, credit should be given with a link directly to the permalink provided and if there is no permalink, hyperlink via the URL for where the material is displayed. Suggested credit is “Courtesy of The New York Public Library. www.nypl.org” (New York Public Library, 2010).
Map and geospatial librarians could promote awareness of the fact that just as books and blogs need citation, maps and geospatial data resources need citation. Likewise, audio/visual and digital format types need citation as well. Furthermore, the first editions of most citation style manuals were published before the Internet and still do not adequately address electronic sources. The basic elements or types of information for all citations include who, when, what, and where. For some styles, format of the source such as print or digital as well as the date electronic information was accessed is also required. Regardless of which citation style is used, data likely needed about the source include: who—author(s); when—date; what—title by source type such as book, website, article, edition, volume, issue, pages; where—location of publisher, and publisher or producer name (e.g., government, commercial, database, etc.).
There are several hundred to several thousand citation styles (CiteThisForMe.com, 2014). Gill (2013) has long advocated for one standard system. On closer inspection, many citation styles are adaptations or interpretations of one of the well-known citation styles. The reason for another “new” reference style may be because discipline-specific resource types were not addressed by other styles (e.g., map and geospatial data resources). This plethora of reference styles leads to confusion and inconsistencies.
Four main citation styles were established by The University of Chicago Press (CMS) (2010), primarily adopted by the Humanities; the Council of Science Editors (CSE) (2014), adopted by some fields of study in the natural sciences (Pinantoan, 2013); the Modern Language Association (MLA) (2016), primarily adopted by English; and the American Psychological Association (APA) (2016), primarily adopted by Social Science. There are many other styles used in various academic disciplines, with no one single standard adopted by all. To contrast these four main styles, basic forms and examples for a book resource with one author follow:
CMS
Lastname, Firstname. Title of Book. Place of publication: Publisher, Year of publication.
Larsgaard, Mary L. Map Librarianship: An Introduction. 3rd ed. Westport, CT: Libraries Unlimited, 1998.
CSE
Author, A. A. Year of publication. Title of work: no capital letter for first word in subtitle. Edition. Place of publication: Publisher. Extent. Number of pages.
Larsgaard, M. L. 1998. Map librarianship: an introduction. 3rd ed. Westport, CT: Libraries Unlimited. 487 p.
MLA
Lastname, Firstname. Title of Book. Publisher, Year of Publication.
Larsgaard, Mary, L. Map Librarianship: An Introduction. 3rd ed., Libraries Unlimited, 1998.
APA
Author, A. A. (Year of publication). Title of work: Capital letter for first word in subtitle. Place of publication: Publisher.
Larsgaard, M. L. (1998). Map librarianship: An introduction (3rd ed.). Westport, CT: Libraries Unlimited.
Regardless of citation style, maps look different than books. There are citation elements in common such as author, date, title, location of publisher, and publisher name. The main differences between book and map are that map medium and scale follow the title. For maps, the author is the cartographer(s) or agency, publisher, or producer responsible for the map. Next is the date and following the date is the title. When a title is missing, a short description of the map is given instead; for example, “Population density of Harvey County” or “Regional geologic cross-section of the Badlands National Park.” After the title, a description in brackets is given, which is followed by the scale, location, and name of the publisher, if known. If the resource is in a repository include the name of collection, collection number, call number, box number, file name, in addition to the repository name and location. If the map was retrieved via an online source, the message “Retrieved from” followed by the URL goes at the end.
There may be many dates or no dates on maps, which causes confusion. The main date is the year the map was officially published for the first time, which is typically under the title along the bottom border, right side, or centered on the map. In Fig. 8.3, the original published date is 1950; however, this map was revised in 1983, which becomes the published date.
For print topographic maps prior to ~ 2010, the date of actual printing was listed, since the sheets could be reprinted many times after the initial release and first date of publication. Another date on maps may be for the information used to make the map, which could be added in the title of the citation entry if relevant. If another edition such as a photorevision is given, provide this after the title. A photorevision is when a map is updated using aerial photography, which is often found in the 7.5-minute topographic series first published before 2010. In 2009, this series of map production began the move to GIS. If no date is given, use the abbreviation, “n.d.” If the citation is for a real-time map, date and time are recorded in brackets along with the description. Several examples follow to summarize the main citation elements as applied to maps.
This is a generic template for a traditional print map citation in APA style with all potential elements included:
Author. (Year and date/time if necessary). Title in italics (Edition and revisions if necessary) [Type of medium]. Scale. Name of Collection and Collection number and location within the collection if the resource is a historic or special collection. Name of Repository, City, State Abbreviation. Retrieved from http://www.full.url/example
Here are two actual examples using this format for typical map resources, one with an individual author and one with an agency as the author.
Tweto, O. (1979). Geologic map of Colorado [Map]. 1:500,000. Reston, VA: USGS.
U.S. Geological Survey. (1957). Emporia quadrangle, Kansas [Map]. 1:24,000. 7.5-Minute Series. Reston, VA: U.S. Geological Survey.
Cartographic citation guides often originate at academic libraries and are based on the CMS style and the publication, Cartographic citations: A style guide (Kollen et al., 2010). Given that CMS and MLA are similar in style, what follows is a style guide for cartographic materials based on APA reference style and APA Style Blog (McAdoo, 2015). As we saw in Chapters 2 and 7, there are a variety of sources and types of map and geospatial information, and the APA style manual may not cover each specific possibility. This section is not exhaustive but describes proper citation for common geospatial resources.
Complete Atlas
Author. (Year). Title of map (edition) [Type of medium]. Scale. Place of publication: Publisher.
DeLorme. (2009). DeLorme Pennsylvania Atlas & Gazetteer (11th ed.) [Atlas-Gazetteer]. 1:150,163. Yarmouth, ME: DeLorme.
An Individual Map in an Atlas
Map author. Map or Plate title [Type of medium]. Scale. In A. A. Author of atlas, Atlas title (edition). Place of publication: Publisher. Year, page.
Rand McNally. Louisiana [Map]. 1 in = approximately 21 mi. In Rand McNally, The 2014 Large Scale Road Atlas (90th Anniversary ed.). Chicago, IL: Rand McNally. 2014, 90.
Bird’s Eye-View
Author. (Year). Title of map (ed.) [Type of medium]. Scale. Place of publication: Publisher.
Birdseye View Publishing Co. (1909). Los Angeles, 1909 [Map]. No scale. Los Angeles, CA: Birdseye View Publishing Co. Retrieved from https://www.loc.gov/item/2005632465/
A Map in a Series
Maps are often created as a part of a larger series, such as USGS topographic maps. Even though each sheet in the series is an independent map, the combination of maps could provide complete coverage of vast areas when positioned adjacent to one another. Other series may be focused on thematic content rather than spatial proximity. The USGS created topographic maps in a 15-minute series (~ 1890–1950) and a 7.5-minute series (~ 1947–1992). In addition, there is a 100k scale series and 250k-scale series, as well as more map series including county, state, and National Park maps, see Chapter 2 for more information.
Author. (Year). Title of map (ed.) [Type of medium]. Scale. Series, number. Place of publication: Publisher.
Marshall, R. B., Sutton, F., McBeth, J. G., Slaughter, T.F., & Wells, C. S. (1916, reprinted 1941). Tenn Murfreesboro (1916 ed.) [Map]. 1:62,500. 15-Minute Series. Washington, DC: U.S. Department of the Interior Geological Survey.
U.S. Geological Survey. (1983). Murfreesboro, TENN (1950 ed., photorevised 1983) [Map]. 1:24,000. 7.5-Minute Series. Reston, VA: USGS.
McElfresh Map Co. (1993). The battlefield of Shiloh, Tennessee, [Map]. 1:15,840. Civil War Watercolor Map Series. Olean, NY: McElfresh Map Co.
A Map in a Book
According to Perrin (2012), a map, graph, table, or chart in a book is treated like a text selection or chapter in an edited book (p. 103). Include the map’s author in addition to the authors of the book. The example below for a map included in a book was taken from Perrin (2012, p. 104):
Map author. (Year). Title of map (ed.) [Type of medium]. Scale. Place of publication: Publisher. In A. A. Author & B. B. Author, Title of book (pp. of map). Location: Publisher.
Munro, R. (1882). Plan of lake-dwellings in La de Bienne, Lac de Morat, Lac de Neuchatel, and Correction des Eaux du Jura [Map]. 1 cm = 5 miles. In B. Coles & J. Coles, People of the wetlands: Bogs, bodies and lake-dwellers (pp. 27). New York, NY: Thames and Hudson.
A Map or Aerial Photograph in a Periodical or Academic Journal Article
Author. (Year). Title of map (ed.) [Type of medium]. Scale. Title of article. Title of Periodical, volume number(issue number), page.
Duffy, J. P. (2016). Seagrass meadows in northern Greece [Aerial photograph]. No scale. A 21st-century renaissance of kites as platforms for proximal sensing. Progress in Physical Geography, 40(2), 357.
Relief Model
Author. (Year). Title (edition) [Type of medium]. Horizontal scale; Vertical scale. Place of publication: Publisher, Date.
Raven Maps & Images. (1993). Colorado (1st ed.) [Relief model]. 1:1,000,000; Elevation from 914 m to 3648 m. Fort Collins, CO: Hubbard Scientific.
A Static Map on the Web
The interactivity of the Internet can be confusing when defining what is considered as a static map. For clarification, static map refers to a noninteractive, nonanimated digital image such as a jpg, png, or gif. It is possible to have an html image map that defines hyperlinks in connection with a static map, although the use of image maps is largely discouraged today due to issues of accessibility. An html image map used on a static map does not meet the criteria for a map to be considered dynamic.
Author. (Year). Map title [Type of medium]. Scale. Title of the complete document or site. Retrieved from http://www.full.url/example
Kansas Energy Information Network. (2001–2014). Operating and proposed wind farms in Kansas February 2014 [Map]. 1 in = 60 mi. Retrieved from http://www.kansasenergy.org/wind_project_map_utility.htm
A Dynamically Generated Map or Geospatial Data
Dynamic maps in the context of the Internet describe maps that allow the user to change the map’s view and scale. This includes services such as Google Maps, Bing Maps, MapQuest, and many other sources. For maps that involve real-time data such as weather maps, an exact time of retrieval is necessary, as opposed to merely including the date. The APA manual recommends interactive maps and graphic spatial data give the name of the research organization, followed by the date, a brief explanation of the type of data, format, and retrieval date/time in brackets, the scale if it has one, then add the project name and retrieval information (Paiz et al., 2015).
Author/Research Organization. (Year). [Brief explanation of data type and format]. Scale. Project name. Retrieved from http://www.full.url/example
Kansas Biological Survey. (n.d.). [Dynamically generated map August 16, 2016]. Dynamic scale. Kansas natural resource planner. Retrieved from http://kars.ku.edu/maps/naturalresourceplanner/
Aerial Photograph
Author. (Date of collection, not date of reproduction). Title or frame number [Aerial photograph]. Scale. Flight title if part of flight series. Place of publication: Publisher.
Department of Agriculture, Farm Service Agency. (1957). Clay County Aerial Photography, 1957 [Photograph]. 1:20,000. CA-4T-6. Retrieved from http://digital.shsmo.org/cdm/ref/collection/aerial/id/621
Satellite Data
Author. (Year). Title or Scene ID [Type of Medium]. Satellite and sensor name if necessary. Place of publication: Publisher. Day month year of image collection.
NASA Landsat Program. (2014). Landsat 8 OLI/TIRS scene. LC80200352014165LGN00. Level 1T [Remote sensing data]. USGS, Sioux Falls, SD. 14 June 2014.
Profile Section or Geologic Cross section
See Figs. 8.4 and 8.5 below for illustrations of the difference between profile and cross sections for the references.
Author. (Year). Title of map (ed.) [Type of medium]. Horizontal scale; Vertical scale. Place of publication: Publisher.
Johnson, R. C. (1977). Preliminary geologic map and cross section of the Saddle quadrangle, Garfield County, Colorado [Geologic cross section]. 1:24,000; 40 ft contour interval. Reston, VA: U.S. Geological Survey.
GIS data
Author. (Year). Title of data [Type of medium]. File type format. Place of publication: Publisher.
U.S. Census Bureau TIGER. (2014). tl_2014_us_state [GIS data representing U.S. state boundaries in 2014, Esri Shapefile]. Washington DC: U.S. Census Bureau. Retrieved from ftp://ftp2.census.gov/geo/tiger/TIGER2014/STATE/
Map-related questions for the reference desk librarian involve nonbook format answers and resources. The same methods librarians use for locating books and journals apply to map and geospatial data, just differing databases and search terms. Typical reference questions should be anticipated with user profiles in mind, so appropriate resource guides can be recommended and used. Familiarity with map librarian support groups and resources ease the task.
In addition, reference encounters should be viewed as opportunities for communicating and sharing spatial information and resources, showcasing library resources, as well as refining detective skills and expanding perspectives beyond the familiar books and journals. Visualization is a natural way to convey information, and placing maps or satellite images near signage indicating the map collection area would allow people to know these resources exist in the library. Also, it is an effective means for marketing the map library and librarianship.
Proper citation of sources is always important, and geospatial resources are no different. The major citation styles largely ignore map and geospatial products, and this overview of how various sources could be cited in the APA style may provide some guidance on proper format.
A relevant and organized collection development plan is a prime consideration for neomap and traditional map librarians. Collection development refers to the policy that guides librarians in selection, acquisition, and management of maps and other geospatial data resources. Many factors and considerations are involved from funding sources to knowing the users and uses. Digital philanthropy helps to build collections and open private collections to the world.
Collection development; Management; Selection; Acquisition; Digital philanthropy
Collection development is the heart of any library. Map library collection development includes the plans and implementation for selection, acquisition, and management of maps and supporting cartographic resources needed to build a viable map and geospatial data collection. The traditional map library may contain print and globe resources, and the contemporary map library houses visual and geospatial data to complement existing physical collections.
Abresch, Hanson, Heron, and Reehling (2008) pointed out that new approaches and technologies are needed when identifying needs, acquiring resources, and managing the collections of geospatial information and GIS capabilities. Digital geospatial data require appropriate computer software and hardware systems as well as software company licensing agreements. This involves considerable expense associated with the equipment plus staff and knowledgeable map and geospatial librarians to set policy and manage resources.
These considerations highlight the importance of geoscience content knowledge for map librarians, and also a careful and thorough study of community information needs and potential shared resource opportunities (Abresch et al., 2008). An information needs study could lead to a well-crafted collection development policy that defines and guides a balanced, traditional, and contemporary map and geospatial data collection. The use of these resources crosses many fields of study, and formal recognition of the importance of maps by librarians demonstrates an understanding that people navigate life through the visualization of information.
There are many issues to be considered in collection development. In addition to understanding content areas, assessing current and potential clients is accomplished by adopting a user-centered focus. Larsgaard (1998) suggested that librarians observe users and use patterns to formulate profiles specific to their library setting. Tracking reference inquiries and assessing proactive reference services are two methods that help to acquire this information. However, special considerations may be needed in a map and geospatial data community analysis, because if current or potential library users are not aware of the map collection, they may not be making inquiries and are, thus, unable to be observed and tracked.
In contrast to waiting for them to come to the librarian, online resource guides are a great promotion tool for the collection. By adding contact information for the librarian on a resource guide webpage, constructive recommendations from potential clients to add or eliminate resources could be gathered. However, there are more effective ways of gathering library use and user information utilizing the resources of a map library.
The Institute of Museum and Library Services (IMLS) survey for 2013 revealed an overall increase in use of public library materials and services and participation in programs over the past decade. The survey covered 97% of U.S. public libraries, which include more than 9000 libraries with 16,500 branch facilities and bookmobiles (Schadt, 2016). While there is no one single factor to explain the increase in all U.S. libraries, a Kansas public library district engaged a consulting company to better target local library patrons through GIS analysis of common features with community profiles (Baumann, 2010). By identifying potential users, librarians were able to focus, develop, and market services effectively.
In this example, the library served a population base of 173,000, spread over more than 500 square miles. Librarians needed to know “…who is using the library, how they are using it, what they aren't using, what they might be interested in using, and who isn't using library services” (Millsap as cited in Baumann, 2010). The consultants correlated patron demographic data with circulation, materials, and program attendance. Data helped to classify neighborhoods into distinctive segments. This GIS analysis identified that 53% of the library district population used the main facility and the remaining 47% were fragmented across 24 distinct segments. Results showed inner city tenants were 1% of the population, but 77% of these library patrons had the fifth-highest average checkouts (Baumann, 2010). In other words, the library was providing exceptional service to inner city residents, who are often considered underserved. Furthermore, results showed that family-oriented segments where the potential to increase children and young adult patronage was high, only 39% were current library users (Baumann, 2010). The librarian's solution was to increase rural community visits using four bookmobiles and new store-front facilities as outreach services in underserved areas. This study and subsequent increase in library usage earned the Topeka and Shawnee County Public Library the highest honor in the U.S. and Canada, Library of the Year for 2016 (Berry, 2016; Hrenchir, 2016). Ironically, this GIS strategy worked to identify a means for increasing library circulation by utilizing some of the same powerful resources found in map and geospatial libraries.
Although listing all strategies for assessing and anticipating community needs are beyond the scope of this book, the GIS example above along with online assessments and survey instruments are effective ways to create library user statistics (Futterman, 2008; Library Research Service, 2016). Once needs are assessed, a plan for developing collections should be designed. One thorough, online guide to collection development training for librarians is at the Arizona State Library, Archives & Public Records. A continuing-education opportunity offered there, has “…self-guided modules providing practical training in how to perform collection development activities in public libraries” (Arizona State Library, Archives & Public Records, 2015a). The course introduces library selections with a list of typical resource books, periodicals, Internet resources, and government documents. The course continues with sections on defining special collections, acquisitions, gifts, and weeding, with the last task being the deselection of resources. Finally, the course covers preserving resources, assessing the collection, and writing an effective collection development policy.
Another way to get to know users and uses of maps and GIS is to gather first-hand information by directly talking with people. As an example, students in a map librarianship course were assigned to investigate use and users of map resources through informal survey, interview, and observation methods, using a purposive sampling technique. Students spoke with friends, relatives, acquaintances, and professionals, and collected data using a variety of situations such as face-to-face or via phone, text, chat, email, Facebook, Skype, and listserv postings. Some of their results follow.
Over the years of collecting data from hundreds of map users, fewer than five participants adamantly denied ever using a map. There were no demographic restrictions, yet participants in the student's studies have been mostly male and in the 30–60 year age range. Table 9.1 is a sample of participant's occupations.
Table 9.1
Sample of map and GIS users' occupations
Some used maps in professional ways, while all used maps in personal lives. A surprising theme was the number of people who preferred print maps over digital in some situations. Some print map stories were nostalgic; for example, one participant recalled she loved looking at AAA maps on road trips so she could see where they were in relation to others and gauge distance to the next destination with the map scale. Others who used print maps for boating, hiking, biking, and climbing mentioned problems with digital display devices including batteries, sun glare on screens or polarized sunglasses obscuring the image, loss of connectivity signal, and not being able to see the bigger picture. Table 9.2 is a sample of preferred print and digital map types.
Table 9.2
Sample of preferred map type and format
| Print maps | Digital maps |
|
• U.S. Forest Service/National Park • Road Atlas/Gazetteer • Historic Maps • National/Global classroom maps • Nautical Charts • Puzzle maps of 50 states • Maps for recording field observations or pinpointing crime at police station • Board Games |
• Property Boundary/Surveyor • Weather/Storm Trackers • Real-time Traffic Delay • Vehicle Maps within GPS • Dora the Explorer & Maps • Political/Election Results • Irrigation Schematic map • USGS Soil Survey map • Video gaming/Online Monopoly |
One student reported a genogram created by a Marriage and Family Therapist to map a family's history of mental disorders looking for genetic components related to depression, alcoholism, or eating disorders. Another student detailed the use of both print and digital maps and mapping by the U.S. Forest Service and Fire Engine Captain fighting an uncontrolled forest wildfire that had burned for weeks. GIS was used to coordinate information and data from satellite images and aerial photography, layering this with weather data, topography, hill shading, fire lines, and natural fire breaks from rocks to rivers. Maps were generated in the field twice a day, printed, and sent out with fire crews; other maps were given to police to warn residents in the path and news media for general regional updates to the public.
Many students and participants had misconceptions of both users and libraries. For students, one of the biggest misconceptions was that physical maps are no longer needed. For many users, paper maps remain better suited than their digital counterparts for applications such as outdoor use and travel planning. However, in contrast users spoke often of convenience in the digital map such as quickly identifying nearby restaurants, gas stations, or alternative routes when traffic delays occur. The common misconception held by many participants was that libraries had no maps or GIS capabilities. There was even an unlikely prediction by a participant that in 10 years there will be no map librarians.
The main objective of this activity was to discover what type and format of map or GIS-related resources were used in personal or professional life. This may be a less efficient way of knowing library users, current and potential, but the qualitative research approach served two purposes: (a) to dispel preconceived ideas by library students for uses of maps by potential patrons; and (b) to raise awareness of potential users that map resources and services are available in library collections.
Besides getting to know users and identifying demographic patterns, collection development is affected by other factors as well. Although the foundation for sound collection development policy involves a realistic and honest assessment of current and potential clients, other factors may impact collection development decisions.
If we think of collection development as a puzzle to assemble, main border pieces are library type, setting, and budget. The center pieces of the collection development are the existing and potential users, who come in many sizes and shapes. It is the border pieces that help to identify potential client and collection emphasis. Regardless of whether the collection is in a public, specialized, academic, or K-12 school library located in an urban or a rural setting, budget restrictions coupled with the high costs of spatial data resources effect collection development decisions. Defining priority levels for the selection of map and other spatial data resources is one way to address budget and location limitations.
Kollen, Linberger, Wassetzug, and Winkler (1998) identified user types or professions associated with different library settings. For example, in a K-12 school media setting users of the map library are both students and teachers, with potential topics in need of maps as varied as geography to history and government to biology. In this setting, budget plays a major factor along with the practical consideration that teachers must teach to benchmark standards using available technologies in classrooms and libraries. These factors drive collection development decisions for the school library more than merely satisfying teacher and student spatial data wishes.
The highest expenses in academic and special libraries may be the yearly GIS software licensing agreements as well as other concerns directly related to accessing digital collection components in library collections such as E-Rate and network bandwidth (American Library Association, 1996–2016a, 1996–2016b). Although rates vary by institution size, yearly GIS campus-wide commercial site licenses that include unlimited seats for large institutions costs tens of thousands of dollars per year. Broadband speeds and net neutrality concerns are related to libraries and noncommercial enterprises because they may be limited to the Internet's “slow lanes.” The broadband technologies and providers may give high-capacity connectivity preference to telephone, cable, and other commercial customers.
An option to ease funding concerns has been grant opportunities and donations, both grand and ordinary. Grants and donations are similar in that cash, services, and property are given to benefit people. Specifically, grants are a type of sponsored project or cooperative agreement where written proposals detail the project and if accepted, the award involves transferring money or property from a sponsor to an institution or individual. Grants may require research and subsequent budget, progress, and final reports. In contrast, donations are charitable gifts of goods or services, which the recipient accepts or rejects. Donations do not require specific work in return, but an application of solicitation is usually expected.
For example, grant opportunities on a grand scale include librarians who are talented and lucky enough to take advantage of funding through local, national, or international grants offered to libraries by, for example, the Bill & Melinda Gates Foundation (1999–2016a). U.S. libraries received Gates Foundation funding from 1997 to 2014, and a brief summary of these library initiatives was given in an Impatient Optimists blog post (Jacobs, 2014). The shift to a global library focus began around 2013 with funding to the University of Washington iSchool, a library and information science program, for its Global Libraries initiatives (Bill & Melinda Gates Foundation, 1999–2016b, 2013; Pacheco, 2013). More recently, the Gates Foundation solicited grants for organizations to work with geospatial data and is currently working together with Libraries without Borders (Bill & Melinda Gates Foundation, 2016; Novak, 2016).
In contrast, an ordinary map donation is when one library lists map resource discards to any library via social media (e.g., listservs). This exchange may involve Federal depository maps being discarded. Within the depository program, discarded materials must first be offered to the state's full depository library; if rejected, librarians are free to offer these resources to any library.
A different example of a grand donation is described by Sweetkind-Singer (2013) who introduced and defined the phrase “digital philanthropy” to encompass an exclusive gift of maps from private map collectors for digital display even though the library may or may not own the resource. Sweetkind-Singer (2011) explained that Stanford University Libraries describe digital philanthropy as “…an emerging partnership between the Libraries and collectors interested in donating access to their unique and interesting map collections in a scanned format for broader viewing.” Pledging a digital map collection is a way for donors who lack equipment and time to have the library perform the digitization of physical maps. The library may provide not only scanning facilities for the donation, but also cataloging and webpage display expertise. If the physical map is donated as well, then it is preserved and safely archived by library staff. The donor's legacy is shared in a digital format with scholars worldwide via the map library collection's webpages. One such donation to Stanford was from David Rumsey, who pledged his entire physical and digital map collection over time (Gorlick, 2009; Stanford University Libraries, 2016).
Whereas the Library of Congress and other libraries have digitized map donations, Stanford has detailed the complex, ongoing procedure of the Rumsey donation, which was finalized in a signed contract. The project and idea may indeed be unique in that it is a private collection moved to a private university. This digital philanthropy has become visible to the world via the generosity of donor and Stanford's University Libraries Digital Repository. Sweetkind-Singer (2011) identified some of the main challenges in this kind of process as negotiating the rights with the collector for access and reproduction as well as moving the rare and fragile physical maps which were sometimes a single map sheet and other times folded, framed, or inside an atlas. Finding the best way to scan large map sheets and track/retain the metadata for maps, were additional concerns. Catalog records were created in metadata object description schema (MODS), and loaded into Stanford's Digital Repository, known as Searchworks. Stored in a non-MARC, machine readable cataloging, metadata are directly sent to the library's open-public-access catalog (OPAC).
After assessing map and geospatial data community needs, budgets, and donation options, examining the current collection is the next consideration. This information is used to write and define goals by way of a map collection development policy (CDP). Articulating a CDP specific to maps and other spatial data provides a summary of what was, what is, and what could be for a map library. Arizona State Library, Archives & Public Records (2015b) provided a CDP definition as “a written statement of your library's intentions for building its collection.... it describes the collection's strengths and weaknesses and provides guidelines.” The policy must be written, approved, used, and revised; the main components of a general statement include an introduction to community and library, practical collection development elements, description of collection formats, goals, and adoption/revision information. A brief overview or summary to consider for crafting and drafting a map collection development policy follows.
A CDP document should have an introduction that may include a history of the collection as well as a brief account of the current status of the collection. This account defines the map library setting and the subsequent clients or map library users. Elaborating on the map library strengths and interests tailored to serve the tasks of clients may be defined by listing the factors that influence collection decisions and the anticipated trends for the future of the library. Once the purpose of the map collection has been stated, general guidelines on selection and acquisition processes may follow. Selection criteria are refined with priority areas defined and the individual subjects and formats listed. Finally, the policy may elaborate the plans for storing, culling, and maintaining.
Although Larsgaard wrote collection development policy considerations nearly two decades ago, some of her detailed advice is included as it remains relevant given that not all map libraries have discarded print collections, and some may not have extensive digital collections. Larsgaard (1998) suggested selection and acquisition policy be written and on file, not just an oral tradition. In addition, the policy should include: philosophy and goals, a clear statement of those sharing responsibility for implementing the collection's objectives, an enumeration of the geographical areas to be represented in the collection (in priority ranking, with limiting parameters of subject, scale, and date), a definition of the extent of support materials (such as gazetteers, journals, and cartobibliographies) to be acquired, and a list of materials that are out of scope for the collection.
Some of the standard map library formats and subjects to consider are: (a) reference and thematic maps of Earth as a whole; (b) continent and nation maps (i.e., U.S. CIA-produced maps on 8.5 × 11-inch paper); (c) topographic maps of various scales; (d) physical-political globe; (e) reputable world atlas, plus regional and local atlases; (f) aerial photographs; (g) large-scale topographic quadrangles; (h) road maps; (i) and thematic maps of various resources (e.g., mining, agriculture, census information) (Larsgaard, 1998). In addition, different outline or base maps on 8.5 × 11-inch paper, suitable for photocopy, may be useful in some library settings as well. While topographic maps may still comprise the bulk of any map collection, it is instructive to view other types of maps created from the topographic base map such as the color or black/white shaded-relief map or the thematic land-cover map (U.S. Geological Survey, 2012a, 2012b).
The exponential growth of spatial data and changing political boundaries make it impossible for one map library to be completely inclusive. The costs extend well beyond the purchase of map sheets and resources to include map-case storage cabinets, equipment and licensure, and staff handling time, especially considering the changing nature of digital data, hardware, and software (Larsgaard, 1998). Larsgaard encouraged librarians to foster collaborative collection development. This could be internal cooperation with faculty in academic settings for example or external agreements with other librarians in the same region or consortium to divide up territories and digital resources. In addition, Larsgaard wisely suggested map librarians conduct field trips, physically or electronically, to the Library of Congress and other map library collections to gain perspectives on other library CDPs.
At that time, Larsgaard urged a second CDP for spatial data in digital formats in which selections would be based on data supporting the curricula and research of the students and faculty. She jokingly suggested the title for digital spatial data, “Herding Cats: Options for Organizing Electronic Resources” (Larsgaard, 1998, p. 6). With the plethora of spatial data online, the burden has shifted somewhat from physical storage equipment to digital storage with infrastructure considerations needed to facilitate accessing and viewing. Consideration in policy must be given to network connections, wireless connections or cabling throughout the facility, in addition to computer workstations, speed of transmission, adequate memory and disk space, licensing agreements, and subsequent reference training for the library as a whole and for the map library in particular.
Finally, quality of physical and digital data must still be judged by the source's reputation and reviews. Collections should have both physical resources and digital. The demand for spatial information in physical hardcopy continues in part because computers are awkward in the field and large maps are best viewed by many people as a full scene, not paged up, down, or across in screen-sized segments. Regardless of format, a withdrawal policy should be articulated, and culling one collection benefits another when resources are offered and traded among map libraries. There is no single right way to build and maintain a collection, and looking at CDP examples is useful.
The written CDP for a map library is important and several online academic map library policy statements are recommended as models, not endorsements. Examples could be from some of the largest map and spatial dataset collections, but small- to medium-sized collections should have a written policy as well. Writing a CDP plan is easier with a guide in combination with knowledge of the collection. See Abresch et al. (2008) for solid advice directed at geospatial issues.
Dartmouth College librarians in Hanover, New Hampshire succinctly refined the definition of CDP for universities while accounting for practical considerations (Dartmouth, 2016a). Selection guidelines vary with subject and given the Internet-enabled, collaborative environment, Dartmouth noted that policy accounts for “collective collecting” with partner institutions. A second point was that selection relevance to academic department faculty and student, teaching and researching programs is paramount, but interdisciplinary areas must communicate to avoid redundancy. Selection depends on weighing quality, currency, cost, and policy statements. Also, a preservation commitment must be included in policy statements to retain and preserve content throughout the lifecycle including format migration as needed.
The Maps and Atlas Collections has a cartographic teaching and research purpose that is responsive to undergraduate and graduate programs in geography and Earth science, history, government, languages, environmental studies, and individual programs such as African & Afro-American studies (Dartmouth, 2016b). The policy boundaries include collection of atlases, maps, gazetteers, and selective cartography among main languages of English, French, German, Italian, Russian, and Spanish. Geographic areas are local to North America, Polar Regions, and “U.S.S.R.” The last designated geographic region suggests that policy updates may not be as current as the latest 2016 copyright date or that historic maps are requested for research. Reference materials are essential, but Braille and raised-relief maps might suit specific user populations as well.
The LOC Collections Policy Statement for Geography and Cartography has a scope defined as literature relating to the discipline (Library of Congress, 2008b). The research strengths are reviewed and specific Classes and Subclasses of LC Classifications identified. This is followed by a well-defined collecting policy, acquisition sources, and collecting levels, which range from comprehensive to research.
The LOC has a separate Collections Policy Statement for Cartographic and Geospatial Materials (Library of Congress, 2008a). The scope is defined as analog geospatial resources in the form of aerial photography, atlases, charts, globes, maps, remote-sensing images, and three-dimensional models; and digital geospatial data in the form of vector and raster representations, relational databases incorporating common geographic features as attributes, remotely sensed imagery, appropriate software for creation, retrieval, analysis, and display. Research strengths are reviewed, and much detail is given on collecting policy and acquisition sources for print and digital geospatial materials.
The University of Chicago map collection has a midwestern coverage emphasis, along with an extensive collection of foreign maps following the World Wars. The purpose is to support research and teaching in geology, geophysics, geography, history, economics, public policy, and genealogical studies. There is a substantial collection of geospatial data going back to the early 1990s (The University of Chicago Library, 2016). Policy dictates the collection's types of maps, formats, languages, geographical and chronological range, as well as the areas of distinction within the collection. While there is no cooperative arrangement with other Chicago area collections, the librarians refer patrons to complementary collections: the Newberry Library, with a distinguished collection of historic maps, and the Research Center at the Chicago History Museum, with a collection focused on Chicago materials.
The CDP introduction at Louisiana State University's Cartographic Information Center provided statements of purpose, mission, administrative structure, and selection responsibility; the CDP also defined main users, access policies, user confidentiality, and copyright considerations (Anderson, 2015). The purpose is to support instruction and public outreach in geography and anthropology; in addition, this is a regional Federal Map Library Depository. The selection and weeding or discard criteria are defined as well as collection review and gift policies. The third portion of the document defined the regional extent and format of maps and geospatial data in text and appropriately, using a world map color-coded from general to selective level collecting and research to comprehensive coverage. This document was approved in 2004.
The University of California Santa Barbara Map & Imagery Laboratory Collection of maps, aerial photography, satellite imagery, and geospatial data exceeded five million information objects and was ranked the number one collection among members of the Association of Research Libraries (Jablonski, 2015). This is an important research collection, but it also houses geology teaching slides from a former professor for future curriculum use. In spite of the collection size, the Collection Development Policy is relatively simple with a purpose statement, subject parameters, and scope, divided into subjects, geographic coverage, and types of material collected. There is reference to participation in the UC/Stanford Map Group and the statewide consortia acquisitions via the California Digital Library, which allows dataset collecting of cross-campus interest.
An organized collection development plan is a prime consideration for any neomap librarian. Articulating a collection development policy specific to maps and other spatial data provides a summary of what was, what is, and what could be for the map library. Many factors and considerations are involved with defining and assembling the collection development puzzle.
Libraries design collections around clients’ needs, which are in part defined by the library type and settings. Collection development plans are formulated based on financial outlooks and available facilities, equipment, and staff. Visual and spatial data complement the print and oral information contained within a library. Formal recognition of map and image collections demonstrates that librarians understand that one of the ways people navigate life is through the visualization of information and interpretation of spatial data. Putting all the pieces of the puzzle together by including maps and GIS resources among traditional books and journals for comprehensive collection development exemplifies great customer service and increased usage.
The purpose of cataloging and classifying is to organize information and data resources to make it easier to access and retrieve. Librarians devised various ways to classify and catalog text-based materials in the early 20th century, yet maps remained invisible in most library collections until cataloging systems went online. Cataloging has evolved over the years from an inventory of one library's holdings to a cooperative, global database of itemized collections in thousands of libraries. This chapter follows the progress and problems associated with classifying and cataloging maps, and it summarizes efforts that helped to make cataloging routine in the 21st century.
Library of Congress classification; LCC; Catalog; Classify; SuDoc; OCLC; WorldCat; Universal decimal classification; AGS; DDC; B&L; AACR2r; RDA; Interoperable; MARC; BIBFRAME; Dewey decimal; Federal Depository; Alphanumeric; Call number.
Physical maps have been in libraries for centuries but only recently have these resources appeared in library catalogs. Maps are essentially invisible if they are not in the online catalog given that the location for map cases is often in a basement or outsourced to a different building. Classifying and cataloging map resources helps patrons, librarians, and other libraries to realize that map collections and geospatial data resources are housed in a particular library. Having maps in the catalog would in turn increase map usage, help answer reference questions, ease circulation and inventory control, and aid in preservation and security concerns. A brief history of cataloging and classifying maps is followed by a summary of various classification schemes, encoding standards, and cataloging systems.
The catalog is an organized set of all bibliographic records that ideally represents the library's holdings (Andrew, 2003; Taylor, 2004). It is the primary way for the public to know and access what is contained in library collections. The cataloger is assigned this important, but time-consuming task of physically entering or copying the records. The word catalog used as a noun is defined as “a complete enumeration of items arranged systematically with descriptive details”; furthermore, when defined as a verb, catalog is a process “to classify (as books or information) descriptively” (Merriam-Webster, 2015). Given those definitions, the assumption of the public may be that the catalog refers to classification of books. This assumption is likely true among many librarians as well, as most maps and other geospatial data resource collections were only beginning to be added to library catalogs in the last decade of the 20th century due to advances in computers, databases, and online catalogs (Andrew, 2003).
Worldwide, cataloging of maps began in the late 1700s at the Kurfurstliche Library in Dresden, Germany, in 1831 at Harvard University, Cambridge in the United States, and in 1843 at the British Museum in the United Kingdom (Andrew, Moore, & Larsgaard, 2015). Maps in the Harvard catalog were even arranged by area and subject. However, there was a long absence of map collections added to catalogs for most libraries. Placing maps in catalogs coincided with the conversion of local card catalogs to machine-readable bibliographic records. In the 1970s, the Library of Congress added the electronic standard of “MARCMap,” and OCLC added the “007 Physical Description Fixed Field (Map) (R),” which simplified the copy cataloging process for maps.
Another reason for an absence of maps in library catalogs likely was due to a lack of catalog training beyond text-based materials. There are few courses in library school programs devoted to cartographic resources and even fewer continuing educational opportunities for original cataloging, see Chapter 6. Banush (2008) explained that monographic materials, maps, and electronic resources needed catalogers with a deep, narrow expertise for these format-based specializations. Banush went on to suggest not all libraries could employ these experts and that the role of catalogers often goes beyond entering records to include instruction and serving the institution as opposed to focusing only on their specific job description.
In the past, other reasons for the lack of map representation in library catalogs have been noted as economic and librarian misconceptions. Larsgaard (1998) wrote that librarians might not “justify taking the time (and therefore the money) to catalog what may seem just one measly sheet of paper … victims of the seemingly atavistic feeling that the intellectual content and worth of a printed work are best measured by size and weight” (p. 3).
In an online Library and Information Science dictionary, Reitz (2004–2014a) defined the library's catalog as a “…comprehensive list of the books, periodicals, maps, and other materials in a given collection, arranged in systematic order to facilitate retrieval.” This definition includes maps as equals with text resources, which could be due to the familiarity and ease of copy cataloging as well as increasing awareness of maps by the public and pressure from online companies such as Google and Amazon. Nevertheless, Troll (2002) made the point that even though students may realize the catalog points to resources in the library, they may not be able to physically find these resources because of unfamiliarity with the various library classification schemes. There is also a convenience factor with students and faculty wanting 24-hour access to digital library collections and services.
From the to librarian's perspective, Leysen and Boydston (2009) surveyed academic library catalogers and found 88% were very or somewhat satisfied with current jobs. However, this may be less true today since job techniques are being reinvented as familiar cataloging and encoding systems that are used change. A new content cataloging system, Resource Description and Access (RDA) has been tested, and since 2013 has been integrated into many libraries. Some libraries are testing the replacement of MARC, Bibliographic Framework, or BIBFRAME 2.0 (Library of Congress, n.d.e). According to Boydston and Leysen (2014), the responsibilities of the cataloger continues to be text-based material, but cataloging is expanding to include electronic resources such as e-books, native-digital, and digitized materials. The emphasis now is on adding non-MARC metadata to existing catalogs, accounting for the “local hidden collections,” which certainly includes maps.
Overall, a library cataloger generally organizes materials based on early 20th century information organization principles set by Charles C. Cutter in Rules for a Dictionary Catalog (Cutter, 1904). The catalog is the “what and where” of resources and the structural framework to join the collection and aid the librarian and client in awareness and access to the collection. Cutter's rules were later modified by Bohdan S. Wynar who continued to guide the process up through the 9th ed. of the Introduction to Cataloging and Classification; this book is now in the 11th ed. moving beyond Cutter by including format-neutral cataloging and RDA system instructions (Joudrey, Taylor, & Miller, 2015).
Again, one of the most important roles of cataloging is to offer users a variety of approaches or access points to the information contained in a collection. A century after Cutter laid the cataloging system foundation, a greater variety of cartographic resources are included as types of library materials. There is recognition that holdings may be in more than one library; for example, holdings are outsourced to nearby buildings or shared through consortiums and interlibrary loans, both of which are becoming more commonplace. Ideally, today's catalog must be flexible and up-to-date, constructed so entries are quickly and easily found, and economically prepared and maintained. Catalog entries are encoded so the prepared descriptive cataloging process is compatible with online systems. The two main cataloging systems in the U.S. are briefly contrasted later in this chapter along with other aspects of cataloging such as subject analysis and classification.
Although classification and cataloging are complex jobs, there is a professional support group in the American Library Association. The Association for Library Collections and Technical Services (ALCTS) is dedicated to work in collections and technical services, and specifically “acquisitions, cataloging, metadata, collection management, preservation, electronic, and continuing resources” (American Library Association, 1996–2016).
Libraries systematically classify materials by arranging subjects in a logical and hierarchical manner. The scheme divides knowledge disciplines into class and subclasses according to form, place, time, and topical subject for the purpose of easy access and retrieval by clients and librarians. Subdividing is from general to specific, and typically classification systems use numbers, captions, instructions, and notes.
Classification systems are subdivided into universal, specific, and national schemes. Universal examples are Dewey decimal classification (DDC), universal decimal classification (UDC, patterned after the DDC), and Library of Congress classification (LCC) (Library of Congress, 2014; OCLC, 2016b; UDC Consortium, 2016a). An example of a specific classification scheme is the National Library of Medicine (NLM) classification, patterned after the LCC (U.S. National Library of Medicine, 2016). An example of a national classification scheme is the superintendent of documents (SuDocs), which is exclusive to the U.S. (Federal Depository Library Program, 2015).
Most academic and research libraries in the United States adopted LCC; public libraries and smaller college libraries adopted DDC. The SuDocs classification system is used exclusively by federal governmental agencies and subsequently by libraries participating in the Federal Depository Library Program. Another method may be based on subject analysis and headings such as with the USGS Thesaurus and Science Topics Catalog (U.S. Geological Survey, 2016; Walter, Borgman, & Hirsh, 1996).
In terms of functionality, classification systems are often described as enumerative, hierarchical, or faceted. Enumerative systems have subject headings listed alphabetically, and an ordered listing of numbers are assigned to headings. Hierarchical systems represent the division of subjects from general to specific, and for faceted systems, subjects are divided into mutually exclusive features or a multidimensional taxonomy. Most classification systems blend the functions to include all three, but tend to favor one type over the others.
In terms of notation for filing, classification systems are alphabetic, numeric, and alphanumeric. Alphabetic classification systems use natural language. They are easily applied to collections by staff, and individual resources are easily located by clients. Numeric filing alone is often associated with computer coded logic in digitally stored systems. Alphanumeric schemes are a combination and grouped by area, subject, number, and subject/author codes.
In general for maps, alphabetic systems work best for small collections of maps, sections, plans, and diagrams, and these spatial materials may be filed by continent or region and subdivided alphabetically by political unit. Many Federal Depository Program topographic map collections in the 7.5-minute map series were organized in this manner. However, this classification scheme may not work as well for atlases, globes, and remotely sensed images, and the system may quickly become unwieldy for larger collections.
In relation to cartographic resources, numeric geographical classification schemes are the least common and alphanumeric the most common. Examples are geocoding, with two parts, an area division and coding logic such as the U.S. Postal Service's zip code system or the worldwide telephone system, which include global, regional, and local numeric codes. The best-known alphanumeric systems are LCC and DDC, but the Boggs and Lewis (B&L) and American geographical system (AGS) are cartographic-specific alphanumeric schemes.
Ultimately, the reason for classification schemes is to organize materials for easy location access. The classifications of books and cartographic materials differ. Books are typically classified by topic then place, and for maps the opposite is true. In general for maps and geospatial resources, subclasses are the where and what that is requested at the reference desk and should guide the choice of classification scheme. The where is the geographic area or place covered in the map, and the what is the topic or overall theme of the map. Once the classification system is known, the cataloger adds the symbols that make up the call number, or the resource's address or unique identifier for shelf or drawer within the library. Various classification systems or schemes used for cartographic resources are summarized and contrasted in this section.
These two classification systems, S.W. Boggs and D.C. Lewis (B&L), and the AGS, are quite specific to cartographic materials and not part of an overall classification system. “The Classification and Cataloging of Maps and Atlases,” more widely known as the B&L classification, was developed to satisfy needs of the U.S. State Department's Map Library and as such did not have a North American bias (Romero & Romero, 1999). B&L was the first system devoted to maps, atlases, relief maps, and globes to be formalized in a publication (Boggs & Lewis, 1945). The disadvantage of this classification was that in spite of re-printings, there were no updates after its creation in 1945.
B&L used the 1941 ALA cataloging rules and emphasized the importance of order for descriptive elements. First was a three-digit number representing area, second was a letter representing the subject and location symbols, third was the date of situation, and finally the type of map, author, and title (Abresch, Hanson, Heron, & Reehling, 2008). While not the oldest classification scheme, it was the first specific classification for maps and was popular in Canada and Australia (Larsgaard, 1998).
The American Geographical Society of New York was a 19th century professional group of geographers who devised the map classification for their collection. When the group disbanded, the 1.3 million items went to the University of Wisconsin at Milwaukee (University of Wisconsin Milwaukee Libraries, 2016b). The library began a digitization project in 2001, and the impressive Digital Collections can be viewed online (University of Wisconsin Milwaukee Libraries, n.d.).
The AGS classification was exclusive for maps, atlases, and reference materials. It used a three-digit numeric notation to represent geographic area and alphabetic notation for subject, followed by the date (University of Wisconsin Milwaukee Libraries, 2016a). The system's limitation was that it did not accommodate thematic maps (Romero & Romero, 1999). In both B&L and AGS, the date of situation was considered vital information. This date was not the date of publication or reprinting, but rather the date of the data represented. This was important because it qualified usefulness, which was likely related to the main users at the time (e.g., the Department of State). The call number begins with a three-digit number representing area or world regions. These systems progress from general to specific; brief examples of the classification are shown in Tables 10.1–10.3. In the tables, the B&G listing examples are from ANZMapsS (n.d.); the AGS listing examples are from University of Wisconsin Milwaukee Libraries (2016a).
Table 10.1
Area designation for Boggs and Lewis versus American Geographical Society classification system
| B&L brief example of class numbers add decimals and numbers for specifics | AGS brief example of add decimals and numbers for specifics area class |
| 000 Universe | 000 Universe |
| 010 Galaxy | 050 World |
| 020 The Solar System | 100 North America, excluding the United States |
| 021 Mercury | 200 Latin America |
| 022 Venus | 300 Africa |
| 023 The Earth and the Moon | 400 Asia |
| 023.1 The Moon, satellite of Earth | 500 Australasia |
| 023.11 Lighted Side | 600 Europe |
| 100 World | 700 Oceans |
| 200 Europe | 800 the United States |
Table 10.2
Subject designation for Boggs and Lewis versus American Geographical Society classification system
| B&L brief examples of subject of the map | AGS brief examples of subject of the map |
| a Special categories | A Physical |
| b Mathematical geography | B Historical-political |
| c Physical geography | C Population |
| d Biogeography | D Transportation, communication |
Table 10.3
Type of map designation for Boggs and Lewis versus American Geographical Society classification system
| B&L brief examples of symbols for type of map | AGS brief examples of symbols for type of map |
| w Wall maps | a Wall map |
| s Sets of maps, filed apart | b Set of maps |
| r Relief maps | c Region |
| g Globes | d Cities |
The DDC was created by Melvil Dewey in 1873 and is a proprietary system first published in 1876 as a four-page pamphlet (OCLC, 2015). The latest edition is from 2011, revised and expanded through 23 major editions in a four-volume set (OCLC, 2016c). It has an abridged version for smaller libraries and is currently maintained by the Online Computer Library Center (OCLC). OCLC licenses access to an online version called WebDewey (OCLC, 2016e), which may be downloaded for a 30-day free trial (OCLC, 2016c).
In general, the DDC allows concepts of relative location and relative index for new materials added to libraries in the appropriate location. There are main classes by subject and fractional decimals beyond the three-digit Arabic numerals. For example, the 900 class is history and geography; maps could be classed in 911 for historic geography or 912 for graphic representations of specific subjects. Map types could be expanded in linear fashion. The DDC is the oldest and most widely used in the U.S. and many other countries (Taylor, 2004). Specifically, the DDC is used in 200,000 libraries and in at least 135 countries (OCLC, 2016c).
In spite of this being a popular classification system, Davis and Chervinko (1999) found fewer than 6% of map-cataloging libraries used DDC. In DDC, most cartographic materials are classified under 912 and added to this base number is the more specific subject. Romero and Romero (1999) remarked that the main drawback for map librarians was classifying subject first and making the geographic location a secondary aspect, given that most reference questions requested a map of a given geographic area. DDC also has a U.S. bias, and cartographic resources are global. Larsgaard (1998) called the DDC an inappropriate classification for maps and cartographic resources.
In 1885, Paul Otlet and Henry LaFontaine were working on a classified index to published information. Otlet was aware of Melvil Dewey's work, and in 1895, Otlet gained permission to translate the DDC into French (UDC Consortium, 2016b). The DDC formed the basis for Otlet and Lafontaine's system, and an English language version was published in the 1930s. It was initially managed by the International Federation for Information and Documentation until 1992 when the UDC became affiliated with the UDC Consortium (UDC Consortium, 2016c).
The UDC is an indexing and information retrieval tool, made up of 10 classes, each divided into 10 divisions, each in turn having 10 sections. It uses Arabic number notation, three whole numbers representing the main classes, subclasses, and decimals for further divisions. The structure is hierarchical and 900 is the general class for history, maps, and geography. Unlike DDC, the UDC does not have a U.S. bias and cartographic materials may be classified first by area and then by subject; if deemed more important, materials are then classified by subject first (Romero & Romero, 1999).
The UDC is a system widely used by libraries and information services in more than 130 countries and translated into 50 languages (UDC Consortium, 2016a). The UDC Consortium is a nonprofit group, headquartered in The Hague, Netherlands, and made up of publishers with an editorial team and advisory board who maintain, develop, and distribute this classification system.
Larsgaard mentioned the importance of the UDC outside the United States, and while “the first one thousand classes (000/999) has been maintained, constant revision has produced increasingly serious deviation in details” (Larsgaard, 1998, p. 143). Again, maps are primarily in 912 and are designated by country, and parentheses enclosing place or country or place and form.
The UDC system is flexible in that if the subject of the map is more important than country, then the number of the place may appear at the end of the entry. This classification system is widely accepted outside the U.S., and fits the way clients conduct a search, which is often by geographic area first. For more detailed examples and explanation, the following references are recommended: UDC Consortium (n.d., 2016d) and Allington-Smith (2015, May 31).
The Superintendent of Documents (SuDocs) system for library classification was developed in the office of the Superintendent of Documents of the U.S. Government Publishing Office (GPO) between 1895 and 1903 (Federal Depository Library Program, 2015). The Superintendent of Documents was tasked with storing, cataloging, indexing, and distributing government publications, but the person who devised the classification scheme to organize government publications was Adelaide R. Hasse. She worked in the Los Angeles Public Library in the 1890s, but Hasse moved to the GPO Public Documents Library from 1895 to 1897 (GPO Access, 2004). This library no longer exists.
What distinguishes this scheme from other library classification systems is a reliance on the origin of the document or provenance, rather than an arbitrary subject. Provenance has proved to be a flexible, expansive, and descriptive system for collections. The origin or authorship is not usually a personal author, but the agency, bureau, or office where the document was created. This alphanumeric scheme is arranged alphabetically by the leading letter of the agency that originated the document. This is followed by a number, period, whole number, and colon; the colon is a break between the SuDoc stem and its suffix, which consists of a sorting hierarchy including dates, letters, numbers, words (Federal Depository Library Program, 2015). The documentation for SuDocs cataloging was last printed in 1993 and is available for download online (Federal Depository Library Program, 1993). An example for a topographic map follows.
The SuDocs map number for Kittitas, Washington, is I 19.81:46120-H 4-TF-024/978, each element is explained later. This SuDocs classification example is from a map in the Federal Depository. SuDocs is called a provenance system because it organizes publications by issuing agency, which in this case is “I” for the Interior Department (U.S. Department of the Interior, n.d.). The “I 19.81” is the class stem and the “19” is the designation for the USGS (U.S. Geological Survey, n.d.), one of the agencies under the umbrella of the Interior Department. The “81” is the designation for 7.5-minute topographic series quadrangles. Following the colon is “46” and “120” or the coordinates in degrees latitude and longitude. The “H 4” is a map reference number based on the north and west coordinate directions (latitude and longitude) and the North American Datum of 1927. For information on datum, see Chapter 3 and MapTools (2016). “TF” represents the type of map, topographic, and “024” is the scale, 1:24,000. Finally, the last three numbers “978” represent the edition date 1978; with dates, always drop the first number in a date prior to the 21st century, and if the map is from 2000 and beyond, the record would end in four numbers.
Davis and Chervinko (1999) found that of the map-cataloging libraries 16% reported using SuDocs classification. However, this is a bit misleading because many libraries used several systems for cartographic resources. Most government documents would be classified using SuDocs, yet the library would classify other cartographic resources using LCC. Interestingly, many libraries created their own local system, greater than 20%, yet nearly 30% reported a local system based on the LCC (Davis & Chervinko, 1999). While these statistics are dated, it is clear that LCC is the preferred classification system for cartographic resources.
This LCC scheme was devised by Herbert Putnam (Minneapolis Public Library, 1889). Putnam developed the system in 1897 at the Minneapolis Public Library and later became the 8th Librarian of Congress, serving from 1899 to 1939 (Library of Congress, n.d.c). The LCC was designed and developed specifically for the LOC collection, replacing Thomas Jefferson's fixed location system. When Putnam left the LOC in 1939, all the classes except K (Law) and B (Philosophy and Religion) were fully developed.
The LCC is used by most research and academic libraries in the U.S. and several other countries. The LCC system overall is organized according to 21 basic classes, which then follows a logical order based on a discipline's domain divisions with numbers that are assigned creating a detailed item call number (Library of Congress, 2014). The call number was used to locate or physically call for the resource during times of closed stacks in libraries, which may still exist today in the U.S. if the maps are outsourced to a storage-only location. LCC is a subject-oriented classification with specific numbers called cutter numbers, introduced by C. A. Cutter; they are a coded representation of the author, organization, map publisher, and the like.
Specifically, Davis and Chervinko (1999) report 83% of the map-cataloging libraries reported using the LCC. In a 2004 survey, Thiry and Cobb (2006) discovered this trend among unclassified to fully classified map collections and institutions that reported classification systems as well; for example, the University of Illinois at Chicago reported 99% of the maps were classified and the systems were LCC and SuDocs, whereas the University of Chicago had only 60% of the maps classified and it was using only LCC. Larsgaard (1998) affirmed this LCC endorsement when she stated, “Schedule G of the LC class system contains the best classification scheme for cartographic materials” (p. 120). The first edition of Schedule G was introduced in 1910, but this classification continued to develop and was completed for atlases in 1928 and maps by 1946. The basic atlas call number structure is area, subject, author cutter, and date of publication; map call number structure is area, subject, date of situation, and author cutter. Larsgaard noted this difference in the order of structures for atlases, and maps are also one of those unexplained anomalies. A brief, generalized introduction to LC call numbers follows and an easy to read general explanation is provided by University of Illinois at Urbana-Champaign (2015).
The LCC groups, divided by major classes of information, are signified by one or two letters that are not mnemonic. The geographic portion of the LCC happens to be indicated by a G—Geography, Anthropology, Recreation. Class G is divided into subclasses from G-GV; maps are primarily under G, geography atlases and maps; GA, mathematical geography and cartography; and GB, physical geography, and so on. Furthermore, the subclasses have subsets of those groups, which are numerals up to four digits. For specific examples, Schedule G atlases are classed at G1000.3-3122, globes G3160-3182, and maps G3190-9999. Beyond the four digits, alphanumeric codes follow for subjects after a decimal point. These are cutter numbers, and “each major cultural or political unit in the world or universe has been assigned a block of numbers” (Larsgaard, 1998, p. 123). The current version of geographic cutter numbers has over 100,000 categories in 2016. This file may be downloaded as a pdf, but it is 6.5 MB in size with more than 3000 pages.
Also, there is a more thematic classification accomplished by decimal and subject code system. It is alphanumeric from A to Z, except I, O, W, X, and Y; it is not mnemonic and letters are followed by numbers representing subtopics. Within the maps class, subject code categories include bird's-eye views, plans, cross sections, diagrams, remote-sensing images, relief models, digital maps, and more. For example, C is for Physical sciences and .C2 is physiography, .C22 is relief features, and .C225 is shaded relief. The A indicates special categories in maps and atlases. It should be noted though that these subject letter/number combinations are not cutters.
The entire classification is not reproduced here but is available for Class G, Tables G1–G16, and Geographic Cutter Numbers (Tables G1548–G9804), throughout the subclass G (Library of Congress, n.d.d). Online access is available for libraries by subscription to Classification Web (Library of Congress, n.d.a; Library of Congress, n.d.b).
In addition to classifying cartographic resources, libraries use descriptive standards to organize knowledge resources and enhance access and retrieval. This final section briefly summarizes and contrasts two cataloging content standards, which are still based on some form of Cutter's principles of organization used in classification. Also, for remote access, a structure framework was developed by the Library of Congress in the 1960s, known as MARC or MAchine-Readable Cataloging, which is still in use today (Library of Congress, 2016b). The historic progression in cataloging and its future follows.
At the end of the 19th century, librarianship was being formalized as a career. Librarians organized collections of materials on shelves and in storage cases within library facilities. To make these resources accessible, catalogs were created. Catalogs were essentially an inventory and listing of resources as well as providing locations for each resource. Making the catalog an effective retrieval tool meant identifying the most important access points in a bibliographic record, or today, using the relationship model in works, expression, manifestation, and item.
As noted at the beginning of the chapter, isolated cases for cataloging cartographic collections began in the 18th and 19th centuries. Geographic area and subject were the main entry or access points used to organize collections within catalogs. Unfortunately, the 1908 code book entitled, “Catalog Rules, Author and Title Entries,” worked effectively for books but did not extend these early cataloging lessons for maps (Hanson, 1908). The assumption was that including a description under the cartographer or publisher name would suffice for finding maps. However, recording the USGS as author on hundreds or even thousands of separate topographic map sheet entries and adding map titles such as World, Texas, or Blue Lake, Colorado would do little to help locate a specific map with the needed scale effectively. It took several decades to design a system that worked for both book and cartographic resource.
In 1947, the new code book, “Rules for Descriptive Cataloging in the Library of Congress” was widely accepted. There was a section devoted to maps, relief models, globes, and atlases, and two years later, a second edition had a new section on maps and atlases. Still, librarians were not adding cartographic collections to catalogs (Morsch, 1949).
In the second half of the 20th century, the first edition of the Anglo-American Cataloguing Rules (AACR) was issued in 1967. In the 1970s the AACR benefited greatly with the addition of MARC as the encoding standard. This moved the catalog into a digital format where records could be read by computers and easily shared among libraries. Cataloging was increasingly complex, more items were digital, and preserving metadata with the record was problematic. Descriptive and subject cataloging evolved along with classification systems such as the DDC and LCC.
Also in 1967, the Ohio College Library Center (OCLC) was founded and WorldCat was launched; the initial cataloging records were added in 1971 to the OCLC database, which was the first online cataloging done by any library (Bryant & Mason, 2016; OCLC, 2016a). The plan at that time was to merge Ohio library catalogs electronically with a computer network and database; the purpose was to increase library efficiency, better serve researchers, and lower complexity and cost.
Today, OCLC is a nonprofit computer library service and research organization still known by the same abbreviation, which now stands for Online Computer Library Center. WorldCat.org is a global library catalog, or a union catalog, that describes collections in many member libraries (OCLC, 2016a). Creating a crowdsourced catalog would not have been possible without forward thinking, a desire to create a cooperative regional and later global catalog for information and data, and digital encoding standards, namely MARC.
MARC is a digital format for describing bibliographic items developed in the 1960s to facilitate computerized cataloging from library to library in regional or international situations. In 1971, MARC format was the national standard for dissemination of bibliographic data, and by 1973 was also the international standard. Reitz (2004–2014b) defined the purpose of MARC standard format for libraries as a way to have predictable, reliable cataloging data and to act as a bridge between libraries and library automation systems; MARC assists libraries in sharing bibliographic resources, avoiding duplication of records, and ensuring bibliographic data is compatible when changing automation systems. The MARC record itself has three components: record structure, a content designation, and data content. The data content is defined by the external standards of AACR2, LC Subject Headings, and the like.
In the past, Cutter's principles of organization enabled patrons to find a book if author, title, or subject was known. The methods for doing this provided access points such as an author entry, title entry, subject headings, and cross references. Handwritten or typed cards were created and placed in a card catalog inside wooden cabinets. These cabinets and card catalogs were moving out of library reference areas, and by 1983 the content cataloging was updated and AACR2 adopted. Catalogers recognized that cartographic and monograph cataloging had much in common. A new field, MARC 255, was added along with other improvements for maps.
The MARC 21 family of standards was created in 1999 to herald the 21st century. It was a result of efforts to make the United States compatible with Canadian and European standards. MARC 21 has formats for five types of data including bibliographic data, holdings records, authority records, classification schedules, and community information. AACR2 continued to improve with some of the last revisions and updates in 2005 (AACR, 2006). It was at this time that many libraries were adding significant numbers of maps into catalogs.
A posting on the popular listserv, MAPS-L, documented the incredible amount of cartographic-materials records that have been added each year to OCLC from 2005 to 2015 (C. Winters, personal communication, July 17, 2016). Overall, these statistics were gathered for 18 of the biggest map library collections at private and public universities and agencies. One public library was represented along with 15 universities, the USGS, the LOC, and OCLC. Every group increased the number of records added to the OCLC catalog over the years; the one public library cataloged the fewest of all the yearly reports, at over 21,000 in 2005 and nearly 35,000 in 2015. Excluding OCLC and LC, one university had the highest number entered in 2005 at nearly 66,500, and a different university was the highest in 2015 at nearly 86,500 entries. In 2005, LOC and OCLC added nearly 243,000 and over 857,000, respectively; in 2015, they added over 312,500 and nearly 4,695,500. The pace of cartographic entries may slow as one librarian added that in his library “there are now only a few pockets of uncatalogued materials in the collection” (C. Winters, personal communication, July 17, 2016).
The Library of Congress (2016a) offers many Cataloger's Desktop services online for RDA, AACR2, and Web Dewey. In addition, many librarians benefit from participating in a shared catalog. Even though cataloging is “generally based on early 20th century information organization principles of Charles Ammi Cutter” and is an “aid for awareness and access to a local collection for librarian and client alike,” cataloging is “a common structural framework that bridges global collections” (B. Hanschu, personal communication, August, 2009). Cartographic resources vary in type, and there are two methods to add records to a catalog, original, or copy cataloging. Hanschu added sound advice from a cataloger's experience: when performing cataloging, verify everything, it is best to never assume anything, and never make anything up. The recommended tools include AACR2 manual, OCLC bibliographic formats and standards, OCLC Code list, and LC Free-Floating Subdivisions, and the Cartographic Materials (2nd ed.): A Manual of Interpretation for AACR2 (Mangan, 2003). Using AACR2 guidelines, Hanschu provided a quick tour of the process and procedure for copy cataloging maps with the map in hand, which can be seen in Appendix C.
The longevity of AACR2 combined with advantages of sharing catalog records with OCLC and WorldCat.org have taken librarians into the 21st century. However, updates over the nearly 40 years of this content cataloging standard were needed and formal discussions began regarding change in 1997.
In the late 1990s it was becoming obvious that the World Wide Web was the primary means to connect library users to the library catalog. However, Coyle and Hillmann (2007) criticized the continued use of MARC, developed in the 1960s, as the “middleware between the cataloging function and library systems development.” Questions without easy answers were asked. Is the library's signature service, the catalog, proving to be an equal to Amazon and Google in the search for information as perceived by the public? Are the rules and instructions for cataloging meeting goals or just remnants of a long departed technology, the card catalog?
Coyle and Hillmann (2007) answered both questions above with no and argued that a simple “rearrangement of the cataloging rules is not the right starting point for libraries.” Coyle and Hillmann suggested the question in 2007 was not whether Amazon and Google had created a generation that no longer needed the library, it was how to change a mind-set from catalogs as inventory of the holdings in one library to recognizing information and data users' needs may include resources in libraries and nonlibrary communities.
The main disadvantage of records created using AACR2 rules was these records are not interoperable with other data records and metadata schema. “Crosswalks” and related tools must be applied to enable search engines to operate across databases with dissimilar record formats. “Other interoperable issues deal with various problems such as different records not having exact field-level matches or fields of importance in one standard not necessarily having a related field even similar to them in another standard” (Andrew et al., 2015, pp. 106–107).
As such, the U.S. Federal Geographic Data Committee's Content Standard for Digital Geospatial Metadata and other committees increasingly identified cataloging concerns such as the complexity and plethora of scanned-digital and native-digital resources being generated.
AACR began in 1967, and now the question was should there be AACR3 or something new. “New” was the choice and RDA was presented as the cataloging standard, designed to replace AACR2. It was published in 2010 and implemented into the current cataloging workflow by LC and others in 2013 and beyond.
Although RDA was launched several years ago, it appears MARC is still the middleware of choice for many institutions. New changes to MARC 21 were announced in August, an OCLC-MARC Update 2016 (OCLC, 2016d). The changes are in Bibliographic and Holdings formats; while Authority Format changes were discussed but not implemented until they can be coordinated with the “Library of Congress and the Name Authority Cooperative (NACO) of the Program for Cooperative Cataloging (PCC)” (J. Weitz, personal communication, August 23, 2016). The discussion and how it relates to cartographic resources continues.
Coyle and Hillmann (2007) took part in the discussions and opposed RDA. In an opinion article they summarized the historical perspective on talks regarding the future of AACR2. They argued that RDA was just more complex than any cataloging schema in the past without providing any fundamental improvements. Coyle and Hillmann suggested that adopting RDA would move libraries back into the 19th or 20th century, not forward into the 21st.
For three decades, multiple generations of catalogers have perfected and been comfortable with the AACR2 content cataloging standard. With numerous revisions, the system was well documented, used, and known, according to Andrew et al. (2015). They suggested the main advantages were that AACR2 focused on the resource in hand and its complete description as a bibliographic record. The AACR2 had easy-to-follow organization and principles, and the third chapter provided a one- or two-step process to speed up cataloging cartographic resources. Rules were grouped into eight different formats. This design made it easy to comprehend, and there were separate sections for rules such as covering access points.
Andrew et al. (2015) pointed out the main changes for cartographic catalogers using RDA. The arrangement is completely different, and the instructions are applied to a work, expression, manifestation, or item. The advantage was that with RDA focused on relationships, and the Functional Requirements for Bibliographic Records (FRBR) model could make cataloging relationships better able to accommodate the multiplicity of standards to preserve metadata. The disadvantages are that learning the theoretical foundations of RDA-FRBR and how inherent relationships are expressed would be a steep learning curve, given that it is described in a 1000-page document. Other disadvantages are a lack of format-specific documentation for guidance and some more subtle differences. RDA allows no Latin terms or abbreviations, yet there are some exceptions, which is problematic.
The debate will continue on the merits and pitfalls of any new cataloging system. Some libraries have adopted RDA, and others will continue using AACR2. Coyle and Hillmann had advocated for a “unified vision allowing us to harness our collective strength as we go forward” but whether or not unification happens, change is inevitable.
This chapter summarizes concepts of classifying and cataloging, and the history and current state of cataloging cartographic resources. Libraries developed the catalog to create inventory and records that identified access points for resources with effective retrieval as the goal. It seemed to work for books, but it took decades for librarians to make maps and geospatial data fit into the one-size-does-not-fit-all cataloging system.
The Internet and World Wide Web have provided the platform for commercial search engines to develop and display maps and provide online mapping programs. Allowing information users to navigate the search has resulted in sometimes bypassing the library. This has been the case with maps in particular, as they were left out of the catalog and physically tucked away in basements. Although archived maps may have been protected this way, it effectively meant that these resources were invisible to the public. Since 2005, WorldCat.org has increased their holdings of cartographic resources by millions in the catalog. Now that the public's interest in maps and geospatial resources is strong, the time is right for the promotion of library map and geospatial data resources and services, which is the topic of the final chapter. Change is inevitable, and the demand for map librarians would increase if administrations are willing to support and advocate for neomap librarians and collections.
Map and geospatial resources and services have special considerations in library collections when compared to traditional library holdings. Issues of cataloging, physical accessibility, and patron awareness could all lead to these collections being underutilized. Some suggestions for making these collections more visible and providing training and support to patrons, including map displays, research and training sessions, and geocaching events for promotion, are described here.
Map storage; Map exhibits; Geography Awareness Week; GIS Day; Earth Science Week; Geocaching
Geospatial collections come with unique challenges. Physical maps have been considered to be of lesser importance to libraries than other holdings, and this has sometimes led to neglect. To start, the library may not even have a good understanding of what maps it owns, and if they do know, those maps may not be easily searchable along with the rest of the holdings. Due in part to both a lack of awareness and difficulty searching for them, it is common for map collections to be relegated to storage in basements, attics, or even offsite locations. In these kinds of situations, it is not uncommon for maps to have become damaged due to a lack of proper care. On the digital side, geospatial data may not want for storage space the same way printed maps do, but digital data encoded on physical media remain subject to potential degradation. Proper storage is an important factor regardless of media. Also, a lack of technical skills or computing resources may lead to both staff and patrons being unable to leverage digital information (Sweetkind-Singer, Larsgaard, & Erwin, 2006).
Of course, none of these problems are insurmountable. With a growing public awareness of the importance of geospatial thinking and information, and the existing goals of patron support, libraries are poised to be important stewards of maps and geospatial technologies. In many ways digital data may be easier to handle, as computers and Internet access are already established components of libraries. Unfortunately, commercial GIS and remote sensing software is expensive, requires powerful computer hardware to run, and comes with a steep learning curve. Free, open-source software mitigates the cost issue, but still requires powerful hardware and may be more limited in its technical abilities. It also lacks some of the support infrastructure that comes with commercial software. Archival policies for digital media likely exist in most institutions, but ensuring that they are followed and that concerns like metadata updates are taken seriously is crucial.
In regards to physical map collections, the challenges may relate more to issues of space and preservation within the library, see Chapter 6. All facilities, no matter how large and well-funded they may be, eventually run into issues of space. In the past, maps have been one of the resources that were deemed less valuable, which is why they ended up in storage, or more sadly, thrown out. Although the value of maps may be much more broadly understood by the public today, this does not mean that the library would have suddenly found a suitable empty space for map storage and reading. Finding the resources to house maps, support software, and teach geospatial skills in already-tight budgets requires justification, which may often be its own challenge. Public promotion of the library’s holdings and available geospatial services is therefore an important job.
Library facilities likely have map and geospatial data resources available to patrons, but promoting awareness of those resources may be a challenge. Many patrons may not realize that the library collection extends beyond books and periodicals to include geospatial information and research facilities with modern geospatial technologies. The good news is that people love maps, and awareness of the importance of geospatial knowledge among the public is quite high today.
For promotion of map collections and geospatial data resources, one good place to start is simply to ensure that the collection is visible to the public. This could be done by publishing a special write-up in the library newsletter, Facebook page, or announcements via Twitter, and creating a webpage that focuses on the collection. Having a dedicated webpage within the larger library page would be valuable to making patrons aware of the existence of geospatial resources. Another idea is to display maps in prominent locations in the facility. Historic maps of the local area are always crowd pleasers; remember that any given institution likely has local historic maps that do not exist in any other collection. Historic GIS data could also be used to create modern maps representing historic features, or change in the local landscape over time. These are excellent candidates for promoting both map collections and other historic resources held by the library.
In terms of visual displays, the natural beauty of the Earth’s surface is a draw for many. The U.S. Geological Survey (USGS) website hosts a variety of educational products that may be either purchased or downloaded for printing. In particular, the Earth-As-Art series showcases stunning imagery of the Earth collected by the Landsat 7 satellite platform (U.S. Geological Survey, 2012). These images show features of natural beauty, atmospheric phenomena, and evidence of human activity on the landscape in both true- and false-color compositions. Fig. 11.1 shows an example of one of these posters that focuses on patterns of human activity, namely center-pivot irrigation near Garden City, Kansas.
Another USGS product that might be useful to catch patrons’ attention is the Earthquake Summary Posters prepared as a part of the USGS Earthquake Hazards Program (U.S. Geological Survey, 2016). More than just maps, these posters provide summary information about specific earthquake events around the world, including information on the location, the magnitude, and the impact on the surrounding region. Whether earthquakes are regularly experienced locally or not, people often have a fascination with natural hazards and these posters could help to promote knowledge of the Earth Sciences and geospatial technologies. An example of one of these posters is shown in Fig. 11.2.
Maps that visualize off-beat topics may also be popular and help to demonstrate the power of modern geospatial technology. In particular, two paranormal topics, UFO and Bigfoot sightings have readily available online datasets that may be loaded into GIS software to create maps. Also, attractive maps representing these phenomena may be found online at various sources for purchase or download. There are several websites that collect and display UFO sightings, but the National UFO Reporting Center has an accessible online database of sightings that is searchable by the date of the sighting, the state where the sighting occurred, and the shape of the UFO observed (Davenport, n.d.). These data may be easily joined to other geospatial data layers to symbolize the locations of UFO sightings. On the Sasquatch side, the Bigfoot Field Researchers Organization’s Geographic Database of Bigfoot/Sasquatch Sightings & Reports has a similar database of sighting locations, albeit for terrestrial curiosities (BFRO.net, 2016). While both of these topics might seem silly, maps showing local paranormal activities would draw interest from patrons and may be used as icebreakers to introduce people to the geospatial technologies used to create them.
Promoting the availability of geospatial technologies may take a bit more effort than hanging posters. Not unlike more traditional library research resources, the tools used to find and work with geospatial data require some hands-on training for most patrons. Unfortunately, training on how to use GIS packages such as ArcGIS is too complex for a single afternoon’s session given the learning curve of the software. That being said, simpler software such as Google Earth and many of the online resources described in Chapter 7 would be good candidates for sessions focused on collecting and displaying specific geospatial data. This could take the form of a training session on how to search the U.S. Census Bureau for data on specific demographic topics, or it could be showing patrons how to use the National Geologic Map Database to find both current and historic geologic maps. For more GIS-literate audiences, sessions could be held promoting the various sources of publicly available data that may be found online. Naturally, any resources that are specific to a local institution would be excellent candidates for public promotion as well.
Beyond local resources, there are several national and international events that exist to promote the Geosciences and GIS technology. Geography Awareness Week (GAW) was created in the United States near the end of President Reagan’s second term in office, and is held on the third week of November each year (Reagan, 1988). The week is a way to promote geographic education and to raise awareness of the role that geographic knowledge and inquiry play in our lives. Past years have had specific themes such as rivers, Africa, or exploring public lands. Future GAWs will continue to have a slogan focused on one component of geography, but participants are encouraged to explore all aspects of geography (National Geographic Society, 1996–2016a).
Major planning for GAW is provided by National Geographic, but many other organizations assist and host their own events, including the American Association of Geographers, Esri, and the National Education Association (NEA). Local organizations and institutions are encouraged to take part in GAW by hosting their own events, and many of the major partners provide resources for doing so. For example, the NEA has educational lesson plans and activities tailored for grade school, middle school, and high school aged students (National Education Association, 2016). Likewise, National Geographic also provides material available for local hosts along with how-to instructions for gatherings, webinars, and other forms of public outreach (National Geographic Society, 1996–2016b).
As a complement to GAW, GIS Day was founded by Esri as an opportunity to promote the impact that GIS has on the world (Esri, n.d.). GIS Day happens yearly on the third Wednesday of November in the middle of GAW. The first official GIS Day was held in 1999, and Esri continues to support the event by providing free resources at http://www.gisday.com/ for local event hosts. These resources include templates, videos, and logos that hosts may include in their promotional materials, free eBooks on GIS and how it relates to global issues, and hands-on GIS activities. The activities are prepared such that they are appropriate for separate audiences like children, young adults, and adults. These activities provide ready-made GIS data and resources for demonstrations or to be used as exercises for students. Weimer, Olivares, and Bedenbaugh (2012) suggested that if libraries participate in GIS Day, a recommended marketing practice would be to have a dedicated webpage on these past and future outreach events.
Not to be outdone by the geographers, the American Geosciences Institute (AGI) has promoted Earth Science Week (ESW) on the second week of October each year since 1998 (American Geosciences Institute, 2016). Just like GAW or GIS Day, ESW is a way to promote geosciences education and public awareness. The AGI provides information on existing gatherings, as well as resources for hosting your own event. Available materials for educators include the Earth Science Week Toolkit with various posters and educational materials, and lesson plans and activities designed to function at different grade levels. As there is a good deal of content overlap between ESW, GAW, and GIS Day, all three are perfect opportunities to promote the geosciences, spatial literacy, and local geospatial resources.
Geocaching is another way a library could promote local resources and encourage patrons to participate in geospatial activities. For those who are not already familiar with geocaching, it is a GPS-enabled treasure hunt where participants are provided coordinates for hidden caches of items. Typically, participants are expected to record their participation in a physical cache log left in the cache, and if they take any items from the cache, they are expected to leave something of equal or greater value and to avoid leaving troublesome items such as weapons or drugs. Geocaching first took off in popular culture after the Selective Availability function of Navstar GPS satellites was turned off. Prior to this, GPS accuracy was too poor to effectively locate small hidden objects in the landscape. Additionally, in the early days of GPS functionality participants were required to have expensive dedicated units to locate caches. Today, the ubiquity of GPS-enabled smartphones, tablets, and wearable technology has opened up the activity to many more participants as multiple apps, both free and paid, are available on Android and iOS.
Anyone may set up their own caches, and posting the locations may be done through a variety of methods. For locally focused geocaching, such as an event promoting local library or community facilities, the location of caches may be published and distributed in any format, such as a printed flyer or library website. If a larger reach is desirable, there are multiple websites where cache locations may be submitted for hosting. Groundspeak’s https://www.geocaching.com/ is one of the largest, although it is a commercial operation with some features only available to paying customers (Groundspeak, 2016). The OpenCaching Network, not to be confused with http://opencaching.com, a now-defunct website sponsored by GPS manufacturer Garmin, is a free option that has websites covering North America and many of the major European countries (OpenGeoWiki, 2016).
While traditional geocaching has focused on open participation of placing and finding physical items, smartphones have enabled gamified activities that are similar to geocaching, but with commercial aims. Munzee uses QR codes as markers rather than physical caches. Instead of rewarding players with objects, they receive points for placing and finding these codes which allow them to gain levels within the Munzee system. In addition to the game component, the Munzee system also allows businesses to advertise and offer discounts to players who find their hidden QR codes. Another similar but more strongly gamified activity is the smartphone app Ingress. Available on both Android and iOS, Ingress takes an augmented-reality approach where players find portals in the physical world located at real-world landmarks via their smartphones. The control of these portals allows for a back-and-forth team-based exercise in territorial control. The company that created Ingress, Niantic, Inc., is also responsible for the Pokémon GO smartphone and tablet augmented reality game, and it shares some similarities with Ingress in terms of structure and how the GPS component is used. Of the three commercial apps described here, Pokémon GO is the closest to a traditional geocaching activity, as players must visit specific locations verified by their GPS coordinates in order to capture virtual Pokémon, not unlike opening a physical cache. As commercial endeavors, none of these apps are suited to open administration like traditional geocaching, which has no real centralized governing organization. Regardless, patrons may have used these apps, and they may provide an avenue to expose and educate people about geospatial technologies.
Effective use of geospatial resources may require convincing both patrons and administrators that they provide value. Many people today understand the value of these resources more so than in the past, but that does not mean that budget and space constraints would suddenly disappear. The public promotion of geospatial holdings and research resources may help to raise awareness that these resources are valuable and should be supported within the institution. As geospatial technologies become more and more prevalent and important, librarians would be smart to increase their participation in the promotion and education of geospatial topics.
In the beginning, this book introduced maps and librarians from the perspective that maps have served to orient lives and navigate landscapes, creating a sense of place throughout the years. Librarians began as caretakers of these resources, but map and geospatial librarianship does not have a sense of place in every library today.
With the advent of online mapping programs, the public has the potential to be geographers and cartographers, sharing in map-making experiences by crowdsourcing relevant information gathered via social media and sharing it online. Librarians have moved from individual card catalogs in each library building to contributing to a worldwide cataloging system, Worldcat. If library catalogs include map and geospatial data resource collections, then these resources could be shared wherever Internet access is available.
However, a report on community perceptions of libraries concluded that no one started an information search on a library website, and 75% of Americans surveyed associated libraries primarily with books (OCLC, 2011). The public’s perception is firm that the library brand is books, not maps, spatial data, or the multitude of resources a modern library holds. Nevertheless, librarians keep preserving the past, while organizing and providing access to current resources. Fig. 11.3 depicts the state of the world through the visual representation of a map. This document has existed for centuries. A challenge for librarians today is to ensure the same preservation status for natively digital maps produced today.
The evolution in map-making resources and techniques is entwined with neogeography that leverages technology for social change, as well as the digital platforms made possible by neocartography. In general, the evolution of map librarianship and GIS collections and services has not kept pace with the ubiquitous geospatial revolution. Map librarianship course work in academic library school programs began with the University of Illinois in the 1950s and now some courses are offered by a few LIS programs. In any case, map librarianship has extraordinary, geo-literate neomap librarians who are willing to share their expertise through professional group support networks.
This book is for librarians who “grew up” knowing the text-based book, but want to gain confidence as map librarians and enhance their geoliteracy. Each chapter provides pieces in the geoliteracy puzzle and creates a path to navigate the maze of resources and formats that map and GIS users need. The focus shifts from an emphasis on resources to services as well as the duties for map and geospatial librarians. In addition to knowing the subject, map librarians have the opportunity to handle aspects from research and reference resources to collection development and cataloging services. It is the responsibility of map librarians to preserve print and digital resources as well as promote map and spatial data collections to the public and to colleagues and library administration.
Maps and geospatial data have interdisciplinary applications for public policy-based research as well as research in geography and the geosciences, environmental sciences, health studies, history, sociology, bioscience, marketing, and many more fields. GIS has been in libraries since the 1990s and the Association of Research Libraries GIS Literacy Project of 1992 was the first coordinated effort to educate librarians in access and use of spatial data and GIS software. Maps and geospatial data are important in libraries, but in many ways, libraries are just now responding to the geospatial revolution. While challenges remain, librarians must promote these valuable resources to increase visibility and add geospatial resources and technologies to the public’s perception of the library.
Bill M. Woods taught the second course ever on map librarianship at the Library School, University of Illinois beginning in 1951. The course outline and reading list for LS306, Map and Cartobibliographical Aids, was filed in the University Archive on Feb. 6, 1951, University of Illinois at Urbana-Champaign Archives, Record Series 18/1/15, Box 46. The Archive's staff kindly provided the document to be viewed. Below is a derivative work, an updated summary of the contents. Unfortunately, the mid-20th century typewriter ambiance is missing, but all briefly listed readings are expanded to full citations.
Woods (1951) described the course as “an examination of the problems involved in cataloging, classification, and care of maps … the student will become acquainted with the major cartobibliographical and related aids in the field” (p. 1). The course was for two credit hours and required three oral and written reports as well as a final exam.
The first one-third of the course was an Introduction to Maps and Map Libraries with four subsections: (a) map nomenclature; (b) history of maps; (c) map activity; (d) map libraries. The reading list shown below was modified from Woods' original outline.
Boggs, S. W., Lewis, D. C., & Special Libraries Association. (1945). The classification and cataloging of maps and atlases. NY: Special Libraries Association.
Bagrow, L. (1935). Imago mundi: A periodical review of early cartography. London: H. Stevens & Stiles.
Brown, L. A., & Lessing J. Rosenwald Reference Collection (Library of Congress). (1949). The story of maps. Boston: Little, Brown.
Holman, L. A. (1926). Old maps and their makers considered from the historical & decorative standpoints: A survey of a huge subject in a small space. Boston: Charles E. Goodspeed & Co.
Jervis, W. W. (1938). The world in maps: A study in map evolution. NY: Oxford University Press.
Raisz, E. (1948). General cartography. NY: McGraw-Hill Book Co.
Tooley, R. V. (1949). Maps and map-makers. London: Batsford.
New York Public Library, Brown, K., Wright, W. E., & Rankin, R. B. (1941). A guide to the reference collections of the New York Public Library. NY: The New York Public Library.
“Platt, E. T., Map department of the American Geographical Society” (Woods, 1951). Although this resource was not located, Yonge (1955) seems the closest match.
The Library of Congress. (1946). Departmental & divisional manuals. No. 15 map division. Washington, DC.
United States. (1938). Map collections in the District of Columbia. Washington, DC.
Yonge, E. L. (March 01, 1955). The Map Department of the American Geographical Society. The Professional Geographer, 7(2), 2–5.
The second section of the course was on cartobibliographic aids with nine subsections: (a) works treating maps in general; (b) cartobibliographies proper; (c) catalogs of individual collections; (d) catalogs of governmental mapping agencies; (e) catalogs of commercial mapping agencies; (f) catalogs of societal mapping agencies; (g) periodicals; (h) atlases; (i) gazetteers and miscellaneous aids. Woods' reading list was modified from the outline and is shown below.
Birch, T. W. (1949). Maps, topographical and statistical. Oxford: Clarendon Press.
Greenhood, D., Graeter, R., & Eichenberg, F. (1944). Down to earth: Mapping for everybody. NY: Holiday House.
Hinks, A. R. (1944). Maps and survey. Cambridge, England: University Press.
Modern Cartography. (1949). Lake Success, NY: United Nations.
Raisz, E. (1948). General cartography. NY: McGraw-Hill Book Co.
United States. (1947). Manual of instructions for the survey of the public lands of the United States, 1947. Washington, DC: U.S. Government Printing Office.
American Geographical Society. (1930). A catalogue of maps of Hispanic America: Including maps in scientific periodicals. NY: American Geographical Society.
Chubb, T., Skells, J. W., & Beharrell, H. (1927). The printed maps in the atlases of Great Britain and Ireland: A bibliography, 1579–1870. London: The Homeland Association, Ltd.
Copyright Office. (1947). Catalog of copyright entries. Washington, DC: U.S. Government Printing Office. [“Vol. 4” is in the outline, but not sure this is the exact citation intended.]
Foncin, M., & Sommer, P. (1949). Bibliographie cartographique internationale, 1946–1947. Paris.
Karpinski, L. C., Jenks, W. L., & Michigan Historical Commission. (1931). Bibliography of the printed maps of Michigan, 1804–1880: With a series of over one hundred reproductions of maps constituting an historical atlas of the Great Lakes and Michigan. Lansing, MI: Michigan Historical Commission.
University of Chicago, & Kuhlman, A. F. (1936). Atlases in libraries of Chicago: A bibliography and union check list, the University of Chicago libraries, document section. Chicago.
Catalogue of the printed maps, plans, and charts in the British Museum. (1885). London: British Museum.
Edward E. Ayer Collection (Newberry Library), & Smith, C. A. (1927). List of manuscript maps in the Edward E. Ayer collection. Chicago.
Geographic Board of Canada. (1922). Catalogue of the maps in the collection of the Geographic Board. Ottawa: F. A. Acland.
Library of Congress, & Le Gear, C. E. (1950). United States atlases: A list of national, state, county, city, and regional atlases in the Library of Congress. Washington, DC.
Library of Congress, & Phillips, P. L. (1901). A list of maps of America in the Library of Congress: Preceded by a list of works relating to cartography. Washington, DC: Government Printing Office.
Library of Congress, Phillips, P. L., & Le Gear, C. E. (1909). A list of geographical atlases in the Library of Congress: With bibliographical notes. Washington, DC: s.n.
Lowery, W., Phillips, P. L., & Library of Congress. (1912). The Lowery collection: A descriptive list of maps of the Spanish possessions within the present limits of the United States, 1502–1820. Washington, DC: Government Printing Office.
Winsor, J. (1886). The Kohl collection of maps relating to America. Cambridge, MA: Issued by the Library of Harvard University.
Bowman, N. M. (1953). Publications, maps and charts sold by U.S. government agencies other than the superintendent of documents. Special Libraries, 44(2), 53–65.
Thiele, W., Kuhlman, A. F., & American Library Association. (1938). Official map publications: A historical sketch, and a bibliographical handbook of current maps and mapping services in the United States, Canada, Latin America, France, Great Britain, Germany, and certain other countries. Chicago: American Library Association.
U. S. Geological Survey. [This is as specific as Woods was in the course outline.]
United States. (1940). United States Government publications monthly catalog. Washington, DC: U.S. Government Printing Office.
Geographical Review. (1916). NY: American Geographical Society of New York.
Journal of Geography. (1917). Indiana: Ed. National Council for Geographic Education.
Library Journal. (1954). NY: Cahners Publishing Company.
Surveying and Mapping. (1949). Washington, DC: American Congress on Surveying and Mapping.
The Geographical Journal. (1939). Great Britain: Royal Geographical Society.
The Journal of Geology. (1942). Chicago: University of Chicago Press.
The Professional Geographer. (1949). Oxford: Blackwell Publishers.
Ristow, W. W. (1945). A survey of the world atlases. Library Journal, 70(2), 54–57, 100–103.
Wright, J. K., & Platt, E. T. (1947). Aids to geographical research: Bibliographies, periodicals, atlases, gazetteers and other reference books. NY: Published for the American Geographical Society by Columbia University Press.
Adams, J. T., & Coleman, R. V. (1943). Atlas of American history. NY: Charles Scribner's Sons.
Bartholomew, J. G. (1922). The Times survey atlas of the world. London: The Times.
Bartholomew, J., & John Bartholomew and Son. (1947). The citizen's atlas of the world. Edinburgh: John Bartholomew & Son, Ltd.
Bertarelli, L. V., & Touring Club Italiano. (1951). Atlante internazionale del Touring Club Italiano. Milano: Touring Club Italiano.
Clark, A. W., & W.W. Hixson & Co. (1943). Atlas of Champaign County, Illinois, 1943. Rockford, IL: W.W. Hixson & Co.
Goode, J. P. (1943). Goode's School atlas: Physical, political, and economic, for American schools and colleges. NY: Rand McNally.
Great Soviet world atlas. (1948). Ann Arbor, MI: Edwards Bros.
Hudson, G. D., & Encyclopaedia Britannica. (1942). Encyclopaedia Britannica world atlas: Unabridged. Chicago.
Illinois Post-War planning commission committee on resources.
Nielsen, N., & Kongelige Danske geografiske selskab. (1949). Atlas over Danmark: Atlas of Denmark. København: Det Kongelige Danske geografiske selskab.
Paullin, C. O., Wright, J. K., & American Geographical Society of New York. (1932). Atlas of the historical geography of the United States. Washington, DC.
Rand McNally and Company. (1800). Commercial atlas and marketing guide. Chicago.
Rand McNally and Company. (1951). Cosmopolitan world atlas. Chicago.
Rimli, E. T., & Visintin, L. (1949). Neuer Welt-Atlas: Land und Wirtschaft aller Staaten [in über 500 geographischen, politischen, wirtschaftlichen, klimatischen, geologischen und konfessionellen Karten und Stadtplänen]. Zürich: Franmünster.
Sanborn-Perris Map Co. (1897). Urbana, Campaign [sic] Co., Ill., Nov. 1897. NY: Sanborn-Perris Map Co.
Siborne, W. (1946). History of the war in France and Belgium in 1815 vol 1: Containing minute details of the battles of Quartre-Bras, Ligny, Wavre, and Waterloo. Place of publication not identified: T. and W. Boone. [Potential equivalent to: Comité National Fracasis de Géographie, Altas de France.]
Stieler, A., Haack, H., Carlberg, B., & Schleifer, R. (1934). Stieler's Atlas of modern geography: 263 maps on 114 sheets engraved on copper. Germany: Justus Perthes.
Irish, K. (1950). What about gazetteers? Library Journal 75, 447–448.
Educators Progress Service. (1940). Educators index of free materials. Randolph, WI: Educators Progress Service.
Great Britain. (1941). Syria: Index gazetteer showing place-names on 1:200,000 map series [Gazetteer]. 1:200,000. Cairo: Survey Directorate.
Heilprin, A., & Heilprin, L. (1906). Lippincott's new gazetteer: A complete pronouncing gazetteer or geographical dictionary of the world, containing the most recent and authentic information respecting the countries, cities, towns, resorts, islands, rivers, mountains, seas, lakes, etc., in every portion of the globe. Philadelphia: J.B. Lippincott.
National Geographic Society Cartographic Division. (1948). North Central United States. Washington, DC: The National Geographic Society.
Permanent Committee on Geographical Names for British Official Use. (1926). List of names in Romania. London: for the Permanent Committee on Geographical Names by the Royal Geographical Society.
Seely, P. A., & Sealock, R. B. (1955). Place name literature, United States and Canada, 1952–1954. Berkeley: University of California Press for the American Name Society.
U.S. Army Map Service. (1945). Gazetteer to maps of Formosa (Taiwan): Map series AMS L792, scale 1:50,000, January 1945 [Gazetteer]. 1:50,000. Washington, DC: War Department, Army Map Service, Corps of Engineers, U.S. Army.
United States Board on Geographical Names. (1935). Decisions of the United States Board on Geographical Names. Washington, DC: Board on Geographical Names.
United States Geographic Board. (1933). Sixth report of the United States Geographic Board, 1890 to 1932. Washington, DC: U.S. Government Printing Office.
United States. (1950). Supplement to Hydrographic Office publication no. 123a, sailing directions for Japan, volume I. Washington, DC: U.S. Government Printing Office.
U.S. Coast and Geodetic Survey. (1949). United States coast pilot. Gulf Coast, Key West to Rio Grande. Washington, DC: Government Printing Office.
Webster's geographical dictionary: A dictionary of names of places with geographical and historical information and pronunciations. (1949). Springfield, MA: Merriam.
Writers' Program of the Work Projects Administration in the State of Illinois. (1939). Illinois: A descriptive and historical guide. Chicago: A. C. McClurg & Co.
The final section of the course was on physical care and treatment, classification, cataloging, and rare maps. Physical care covered mounting and storage. An overall classification system suggested the record order was area, area-subject, and subject. An overall cataloging system was shown by author, title, imprint, technical notes, and subject headings. Several different classification and cataloging systems were presented that had printed manuals. Storage, cataloging, and classifying aspects of rare maps were discussed separately, and lastly, the use of maps was covered. Reading lists were modified from Woods' outline, shown below.
U.S. Library of Congress Division of Maps. (1949). Maps; Their care, repair and preservation in libraries. Washington, DC.
American Geographical Society of New York, Yonge, E. L., & Hartzell, M. E. (1952). Manual for the classification and cataloguing of maps in the society's collection. NY: American Geographical Society.
Boggs, S. W., Lewis, D. C., & Special Libraries Association. (1945). The classification and cataloging of maps and atlases. NY: Special Libraries Association.
Heaps, J. D. (1998). Tracking intelligence information: The office of strategic services. American Archivist, 61(2), 287–308. Available from https://babel.hathitrust.org/cgi/pt?id=mdp.39015071393899;view=1up;seq=803 Heaps details the process, explaining lost and destroyed OSS records as well as the Research and Analysis Branch (R&A) index cards with abstracts of OSS reports and Central Information Division (CID) Decimal Classification Filing system that are now located in the National Archives and Records Administration (NARA).
Parsons, E. J. S., & Great Britain. (1946). Manual of map classification and cataloguing: Prepared for use in the directorate of military survey, war office. London.
Library of Congress. (1954). Classification. Class G; geography, anthropology, folklore, manners and customs, recreation. Washington, DC.
United States. (1947). Guide to the Williams system map subject classification and cataloging in use at Map Library, the Army Map Service. Place of publication not identified.
U.S. Office of Strategic Services (OSS), Cataloger's manual – This document was not located, but an article may be of interest is Heaps (1998), as shown above.
Wilson, L. S. (1948). Library filing, classification and cataloging of maps: With special reference to wartime experience. Place of publication not identified: publisher not identified.
American Geographical Society of New York, Yonge, E. L., & Hartzell, M. E. (1952). Manual for the classification and cataloguing of maps in the society's collection. NY: American Geographical Society.
American Library Association. Division of Cataloging and Classification. (1949). A.L.A. cataloging rules for author and title entries (2nd ed.). Chicago: American Library Association.
Anderson, O. C. (1950). No best method to catalog maps. Library Journal, 75, 450–452.
Boggs, S. W., Lewis, D. C., & Special Libraries Association. (1945). The classification and cataloging of maps and atlases. NY: Special Libraries Association.
Library of Congress. (1949). Rules for descriptive cataloging in the Library of Congress. Washington, DC: Library of Congress, Descriptive Cataloging Division.
Murphey, M. (1945). The Army Map Service Library-map cataloging. Special Libraries, 36(5), 157–159.
Parsons, E. J. S., & Great Britain. (1946). Manual of map classification and cataloguing: Prepared for use in the directorate of military survey, war office. London.
Snider, F. E. (1945). Suggested map arrangement for the general library. Library Journal, 70, 471–474.
United Nations, & United Nations. (1949). Nomenclature of geographic areas for statistical purposes. Lake Success, NY: United Nations.
Wilson, L. S. (1948). Library filing, classification and cataloging of maps: With special reference to wartime experience. Place of publication not identified: publisher not identified.
Brown, L. A. (1941). Notes on the care & cataloguing of old maps. Windham, CT: Hawthorn House.
Student-learning outcomes (SLOs) identified by a two-year Geographic Information Librarianship (GIL) project by Drs. Wade Bishop and Tony Grubesic as described in Chapter 6 (Bishop, Cadle, & Grubesic, 2015). In order to design the GIL courses, researchers surveyed practicing GIS and map librarians to determine the most important MAGIRT competencies. Out of 75 core competencies, 23 were identified as most important, which led to these 13 SLOs. This appendix is modified from Bishop’s webinar (2014).
| Course section | SLO |
| 1. Geography and cartography | 1.1 Students will demonstrate principles such as scale, projection, grids, and coordinate systems |
| 2. Collection development/Records appraisal/Collection maintenance | 2.1 Students will demonstrate understanding of local to international mapping agencies and publishers as well as the Federal Depository Library Program; in addition, students will recognize gazetteers, data, and volunteered geographic information and aspects of the FDLP 2.2. Students will demonstrate ability to access maps, imagery, and additional geospatial data 2.3 Students will describe proper copyright principals and licensing agreements for geographic collections and databases 2.4 Students will explain how assessment and user needs inform collection development 2.5 Students will describe care and preservation methods for rare and fragile materials |
| 3. Reference and instruction | 3.1 Students will demonstrate how to locate geospatial data and subsequent software support 3.2 Students will locate GIS tutorials and training 3.3 Students will demonstrate knowledge for geographic information consultations |
| 4. Metadata/Cataloging | 4.1 Students will describe standards for metadata 4.2 Students will demonstrate knowledge of metadata in geospatial records 4.3 Students will define physical characteristics needed to create metadata for cartographic items 4.4 Students will explain cartographic scale |
The following guidelines demonstrate the process and procedure for copy cataloging maps when there is a physical map in hand. One U.S. Geological Survey topographic map is used as an example.
• Check and verify that the map is not already in the local online catalog.
• Search the OCLC utility by title to verify the exact map is in the global system.
• After verifying that original cataloging is not needed, log on to OCLC and locate the exact map record.
• Import the record into the local online catalog, which will be similar to the workflow information shown below, see Fig. C.1.
The field numbers shown on the workflow document, Fig. C.1, are briefly defined later. For a review, basic map cataloging information is given by Moore and Hall (2001). The primary encoding standards for cataloging with AACR2 are MARC and MARC 21, which are explained at Library of Congress (2009a, 2009b). RDA in MARC 21 is described at Library of Congress (2014). For more information on resources explaining RDA, the newest content cataloging system, see OCLC (2016a). Finally, the Library of Congress uses RDA in combination with BIBFORMAT, which is the newest encoding practices and input standards. Detailed explanations of the fields below are given using the tabs 0xx, 1xx, and so on (OCLC, 2016b). Although BIBFORMAT is currently in the 4th edition, it is being revised (OCLC, 2016e).
007 The category of material (Map); specific material (Two-dimensional, flat medium); color (multicolor); physical medium (paper); type of reproduction (not applicable, it is not a reproduction); production details (no code appropriate); positive/negative aspect (not applicable as it is not a photocopy)
040 Inputting library
034 Scale, latitude, and longitude
043 Subject headings (n is North America, us is Country, wa is U.S. state)
050 LCC number
074 Government document item number
086 SuDocs number designation
092 Local library number
049 Designation of local library
110 Corporate authors, see Fig. C.2: Geological Survey (U.S.)
245 Title is shown in Fig. C.2: Kittitas quadrangle, Washington-Kittitas Co. 7.5-minute series (topographic). For filing date and statement of responsibility, see Fig. C.3: 1953, Mapped by the Defense Mapping Agency; edited and published by the Geological Survey
246 Alternative title
250 Edition statement or photorevised
255 Scale, projection, latitude, and longitude
260 Publication date
300 Description and size
336 RDA content type
337 RDA media type
338 RDA carrier type
500 Notes
651 Geographical subject headings such as Washington (state) Maps, Topographic, Kittitas County (WA) Maps, Topographic; Library of Congress Free floating subdivisions such as Maps, Topographic
655 Local subjects; examples are National forests, river, counties, cities, landmarks, etc.
710 Added entry for corporate author
Points to remember:
• All subject headings must be verified in the authority file before adding them to the record workform (OCLC, 2016c).
• It is wise to consider how the map is used with class assignments and add detailed subject headings in 655 to enhance search results to display relevant sources for the assignment.
• Verify the Public Catalog Copy Entry, see Fig. C.4.
Copy Catalog is now complete. For an original catalog example, the OCLC search must show the map is not in the global system. An example would be a map created for a local thesis or dissertation that was unique to the institution; if that were the case, original cataloging would be needed.
Note: Page numbers followed by f indicate figures and t indicate tables.
A
B
C
D
E
F
G
H
I
J
K
L
M
N
O
P
Q
R
S
T
U
V
W